


Abstract
The amorphous alloy transformer has a smaller coercive force and lower specific iron loss. It precedes the conventional silicon steel sheet transformer from the perspective of energy conservation. However, amorphous alloy material has a more significant magnetostriction coefficient, resulting in stronger vibration and acoustic noise. This paper investigates the measurement, analysis, and improvement of vibroacoustic characteristics of one three-phase, four-frame amorphous alloy distribution transformer to reduce environment noise pollution. This study adopts a coupling analysis method of magnetic–force–acoustic multi-physical fields to analyze the vibroacoustic characteristics. It then introduces a novel combination method of magnetic field analysis and an electric circuit to improve the efficiency of magnetic field analysis. This new combination method can greatly reduce the solution time of multiple physical fields through comparison with the traditional field-circuit coupling method. Different from other studies, this paper studies the acoustic and vibration characteristics of an amorphous alloy transformer under both no-load and load conditions. It is found that the load vibration noise of an amorphous transformer is more severe than that of a traditional silicon steel transformer. Accordingly, the study measures the vibroacoustic characteristic with different excitations and load levels under different working conditions to verify the numerical analysis method. Furthermore, according to the analysis results, this paper suggests a few vibration and noise control strategies. In conclusion, the paper deduces an essential basis for exploring strategies of vibration reduction and noise control for amorphous alloy distribution transformers.
1. Introduction
The smart grid has become one new development trend in the electric power industry. One of the most critical objectives in smart grid construction is reducing energy consumption and improving efficiency. A power transformer is one piece of key equipment in the power system that aids the improvement of energy efficiency grades and significantly impacts the energy efficiency of the whole power system.
An amorphous alloy material is characterized by its thin thickness, low iron loss and low manufacturing costs [1]. Therefore, compared with a conventional silicon steel transformer, applying an amorphous alloy transformer is an effective way of reducing energy loss for a distribution power grid [2]. For the same rated capacity, research has indicated that the no-load loss of an amorphous alloy transformer is almost 35.4% of a traditional S11-type transformer [3]. Presently, an iron-based amorphous alloy material has been applied in premium distribution transformers, where transformer cores are made of a wound amorphous alloy material formed to rectangular shapes forming the legs and yokes. On the one hand, the core structure and winding shape of an amorphous alloy transformer are different from traditional ones. On the other hand, an amorphous alloy is characterized by a larger magnetostriction coefficient and is sensitive to stress [4,5]. Therefore, amorphous alloy transformer acoustic noise mainly results from the iron core, winding, and other ancillary structural components, among which transformer winding contributes more noise [6,7].
Previous studies have paid more attention to the no-load vibroacoustic characteristics analysis of conventional silicon steel sheet transformers [8,9,10,11,12] and amorphous alloy transformers [13,14,15]. Such studies found that the vibration and noise of a transformer mainly result from the magnetostrictive effect of the iron core. Accordingly, the vibroacoustic characteristics under different no-load excitation conditions are usually analyzed by the magnetic–structural force–acoustic multi-physical field coupling simulation method. During magnetic field analysis, the no-load current is often presumed to be sinusoidal [16,17] or obtained by the direct field-circuit coupling method [18]. However, the waveform of the no-load current is usually a vertex sharp waveform because of the nonlinearity of the magnetic properties of the core. At the same time, even though the direct field-circuit coupling method can obtain the stable waveform of no-load current accurately, the computing burden is heavy due to the long transient process in the power transformer.
Under load conditions, the interaction between load current and magnetic leakage field causes winding vibration. Moreover, the corresponding acoustic noise by increasing load current is more obvious. However, studies on the vibroacoustic characteristics of winding have mainly focused on condition monitoring and fault diagnosis [19,20,21,22,23]. Seldom are researchers interested in the vibroacoustic characteristics of transformer winding under normal working conditions. In a conventional electrical steel sheet transformer, the load noise is not dominant compared with no-load. Still, due to the special core structure and winding shape, the vibroacoustic characteristics of amorphous alloy transformers are opposite to conventional transformers.
For a distribution transformer installed close to a residential area, the acoustic noise emission standard at different frequencies is more serious [24]. For a transformer in operation, when the noise exceeds the standard and residents complain about it, the substation must be retrofitted with sound insulation and vibration isolation treatment [25,26]. However, to meet more stringent noise emission standards for new transformer products, it is necessary to put forward improvement measures in the design stage [27]. Thus, to reduce the manufacturing cost and supply guidance of low-noise transformer design, it is essential to accurately analyze vibration and noise at different frequencies of an amorphous alloy transformer under different working conditions [28,29]. Meanwhile, it is crucial to investigate the noise and vibration influencing factors for better control.
The current study analyzed a 1000 kVA amorphous alloy distribution transformer as an application with vibroacoustic characteristics under no-load and load working conditions. It is suggested that one novel combination method of magnetic field and electrical circuit improves the numerical efficiency of electromagnetic field analysis. Accordingly, this study considered the different voltage and short-circuit current levels in no-load and load analysis, respectively. The study conducted corresponding vibration and noise experiments to verify the numerical analysis method. Finally, it also proposed the numerical analysis method to verify the improvement schemes of core and winding structures.
2. Numerical Analysis Method for Vibroacoustic Characteristics of Amorphous Alloy Transformer
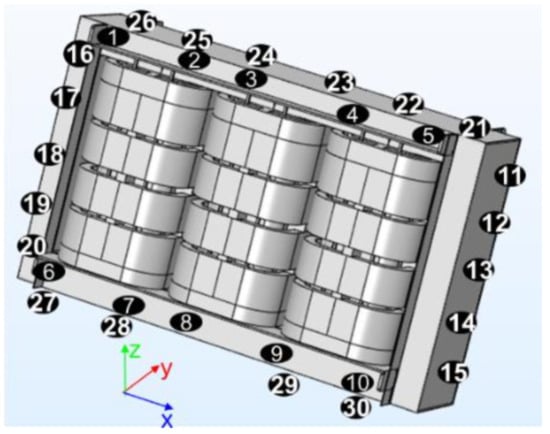
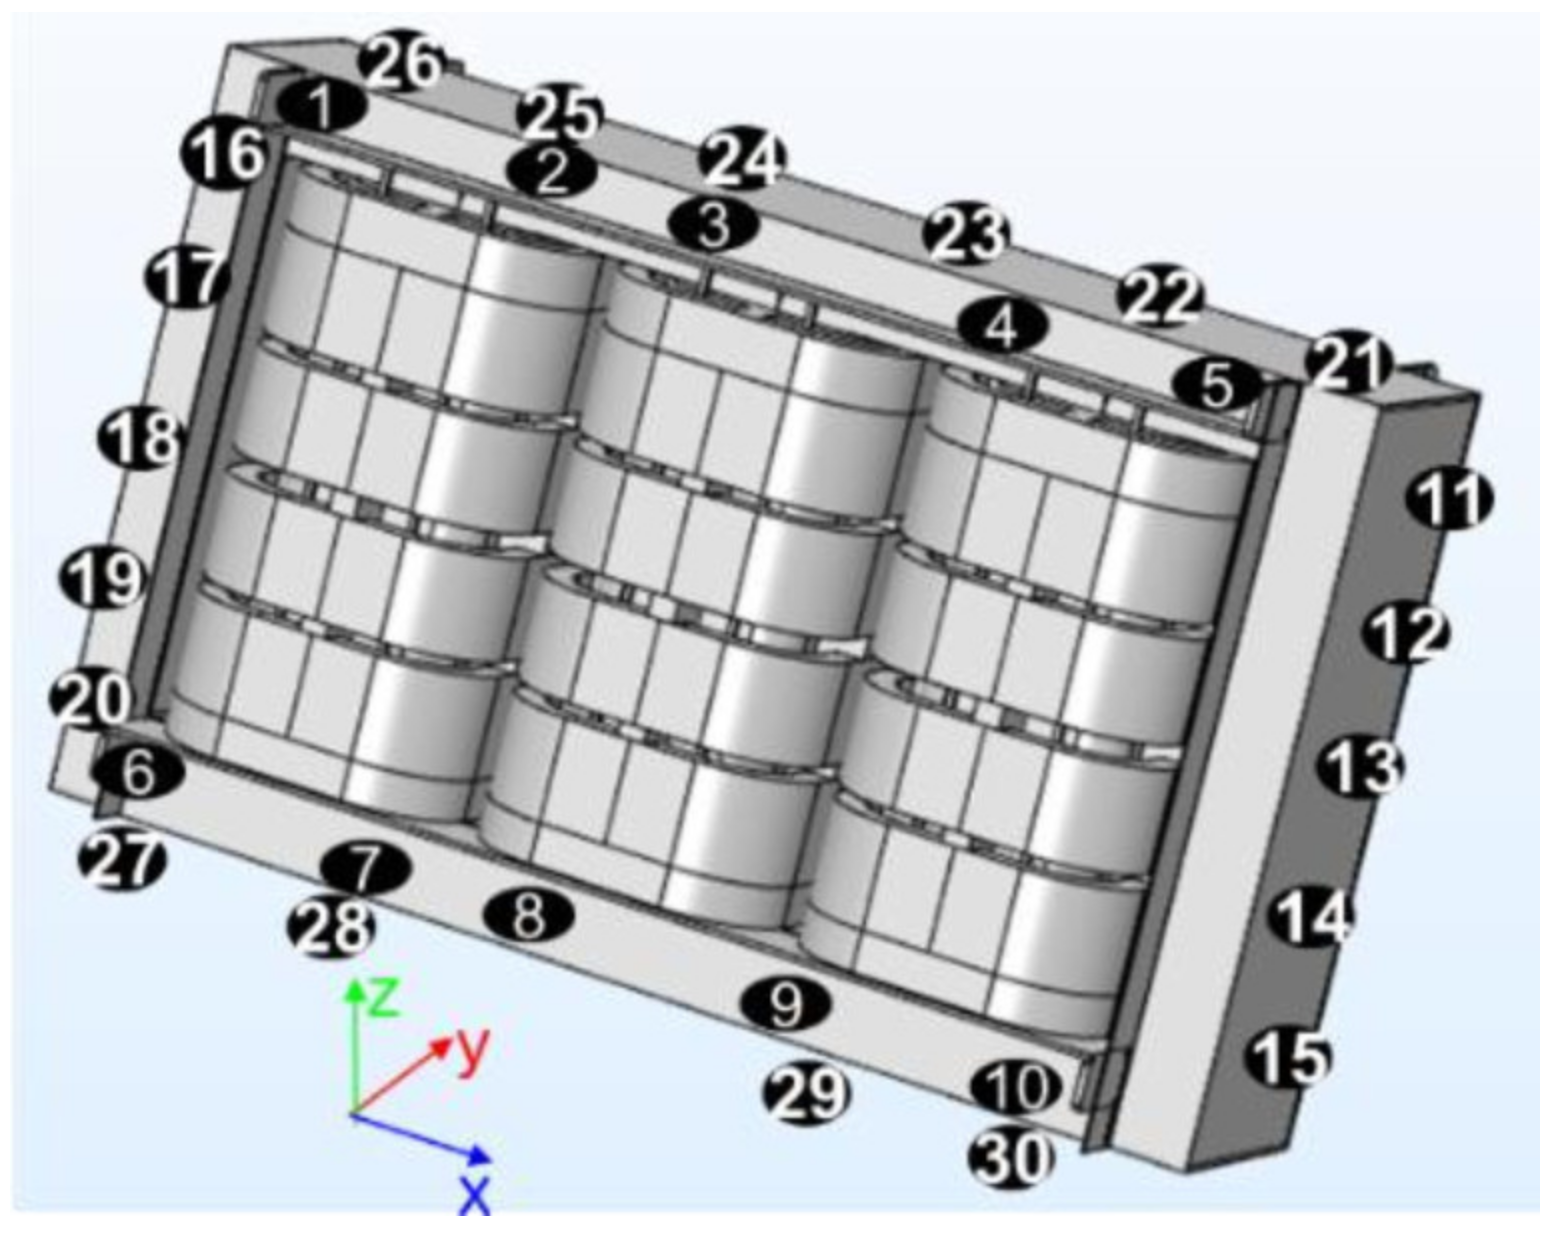
The transformer studied in this paper is a 10 kV/400 V, 1000 kVA dry-type distribution amorphous transformer. The transformer core that was analyzed is suspended on three-phase windings to reduce stress on magnetic properties. At the same time, the windings are clamped and supported by clamps to ascertain a complete transmission path of vibration. Meanwhile, all the struts, pads, and clamps are included in the simulation model, as illustrated in Figure 1. The whole transformer core is composed of two main columns and two side columns. Each phase winding consists of four-segment high-voltage windings and two layers of low-voltage foil windings, constituting three phases.
Figure 1.
Amorphous alloy transformer model.
2.1. Vibroacoustic Characteristic Analysis under No-Load Condition
The transformer vibroacoustic characteristic analysis is a multi-physical field problem. It includes magnetic field and electric circuit, structural force field, and acoustic field.
In a transformer, the no-load current establishes the main magnetic field of the core. Accordingly, the traditional magnetic field analysis adopts the direct coupling method of field and electric circuit. In large-scale power transformers, the electromagnetic time constant (L/R) is relatively larger than in small ones; thus, it results in expensive computing time for no-load magnetic field analysis.
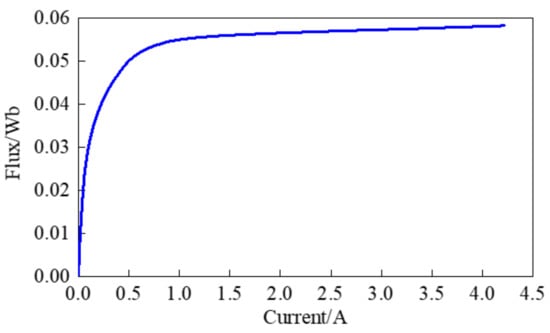
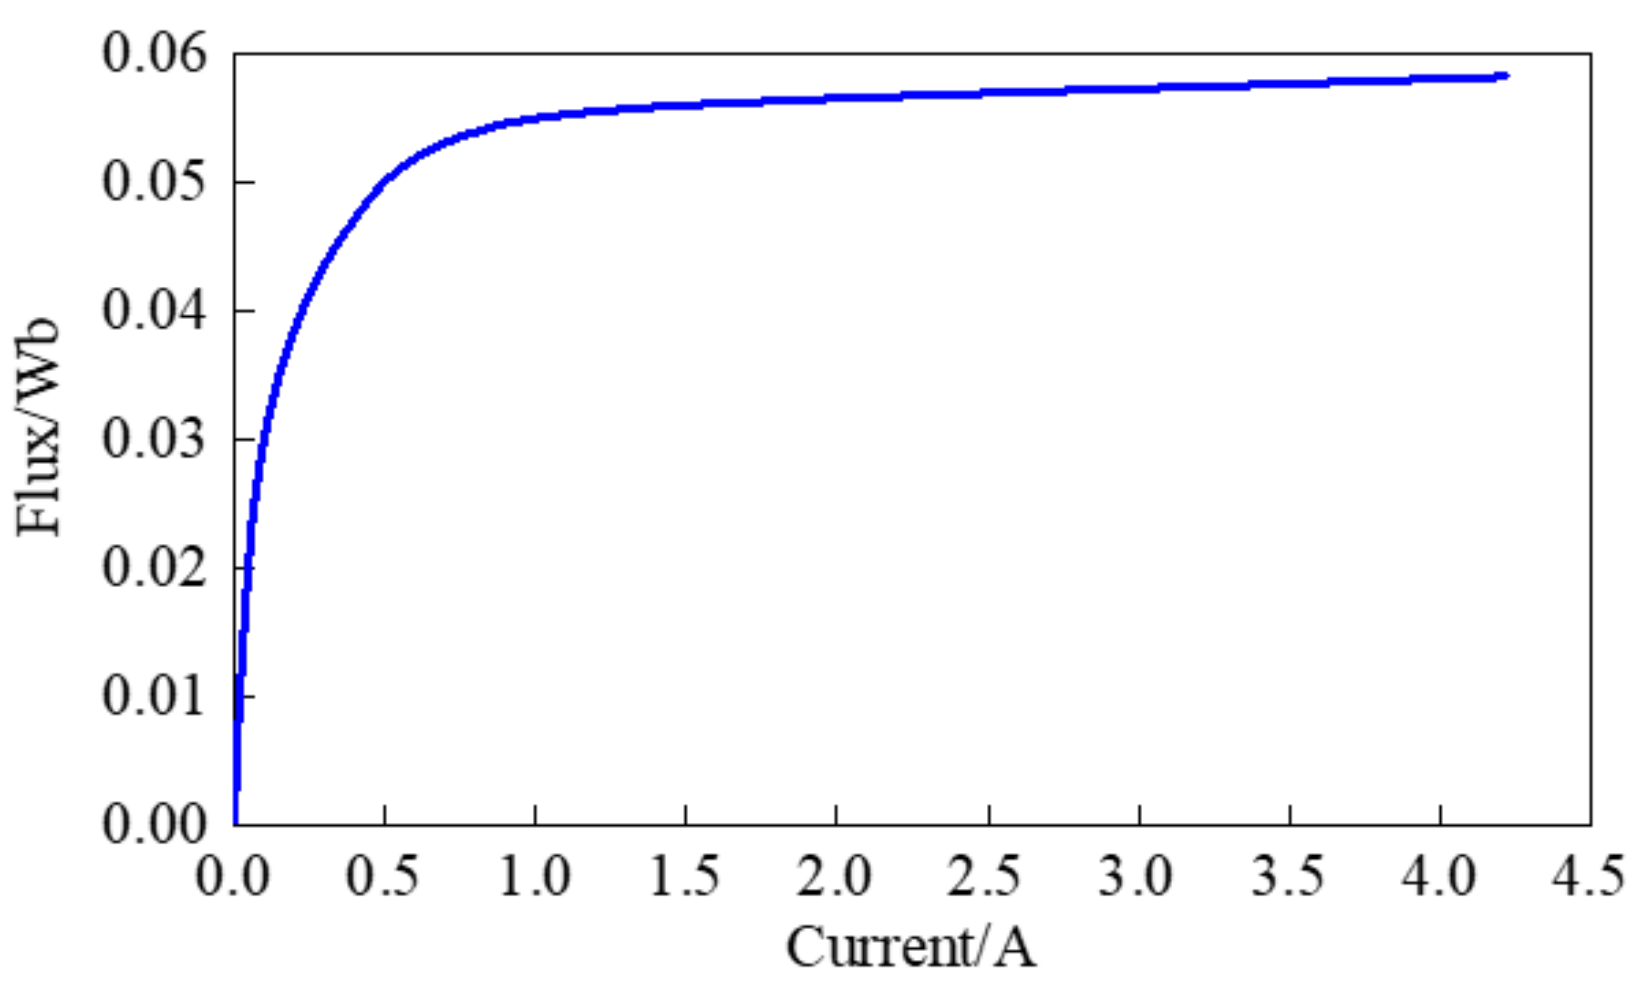
This paper suggests a time-efficient circuit-field combination method, in which there is a decoupling of the magnetic field analysis and circuit analysis. It also entails solving a series of magnetostatic field problems under different current levels to consider the nonlinearity of core magnetic properties. After that, it deduces the Φ–I curve of the transformer from the above analysis results, as shown in Figure 2. This process can avoid time-consuming analysis of the transient process in traditional field-circuit coupling.
Figure 2.
The Φ–I curve of transformer under no-load condition.
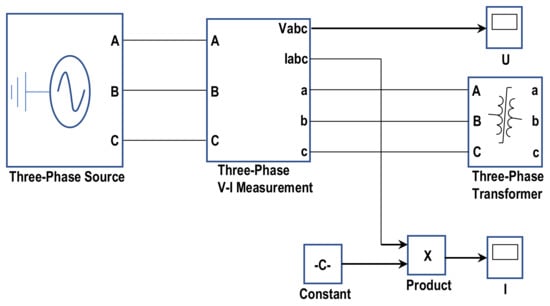
The excitation circuit is constructed as shown in Figure 3 to calculate the no-load current, where the above Φ–I curve describes the nonlinearity of the transformer core. Solving this circuit makes it possible to obtain the no-load current immediately. In addition, the current-driven transient field problem is solved so that the space–time distribution of magnetic flux density can be obtained.
Figure 3.
Excitation circuit of transformer under no-load condition.
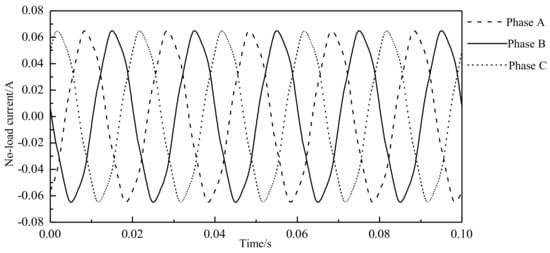
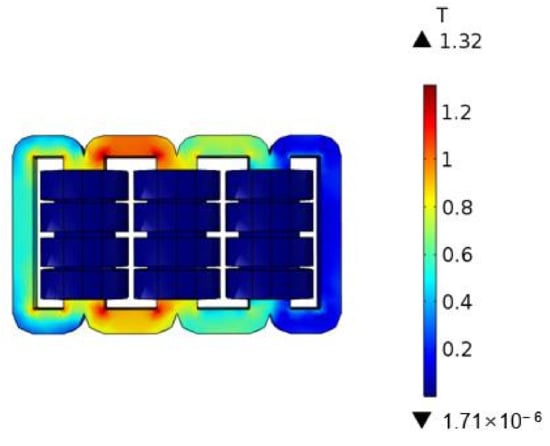
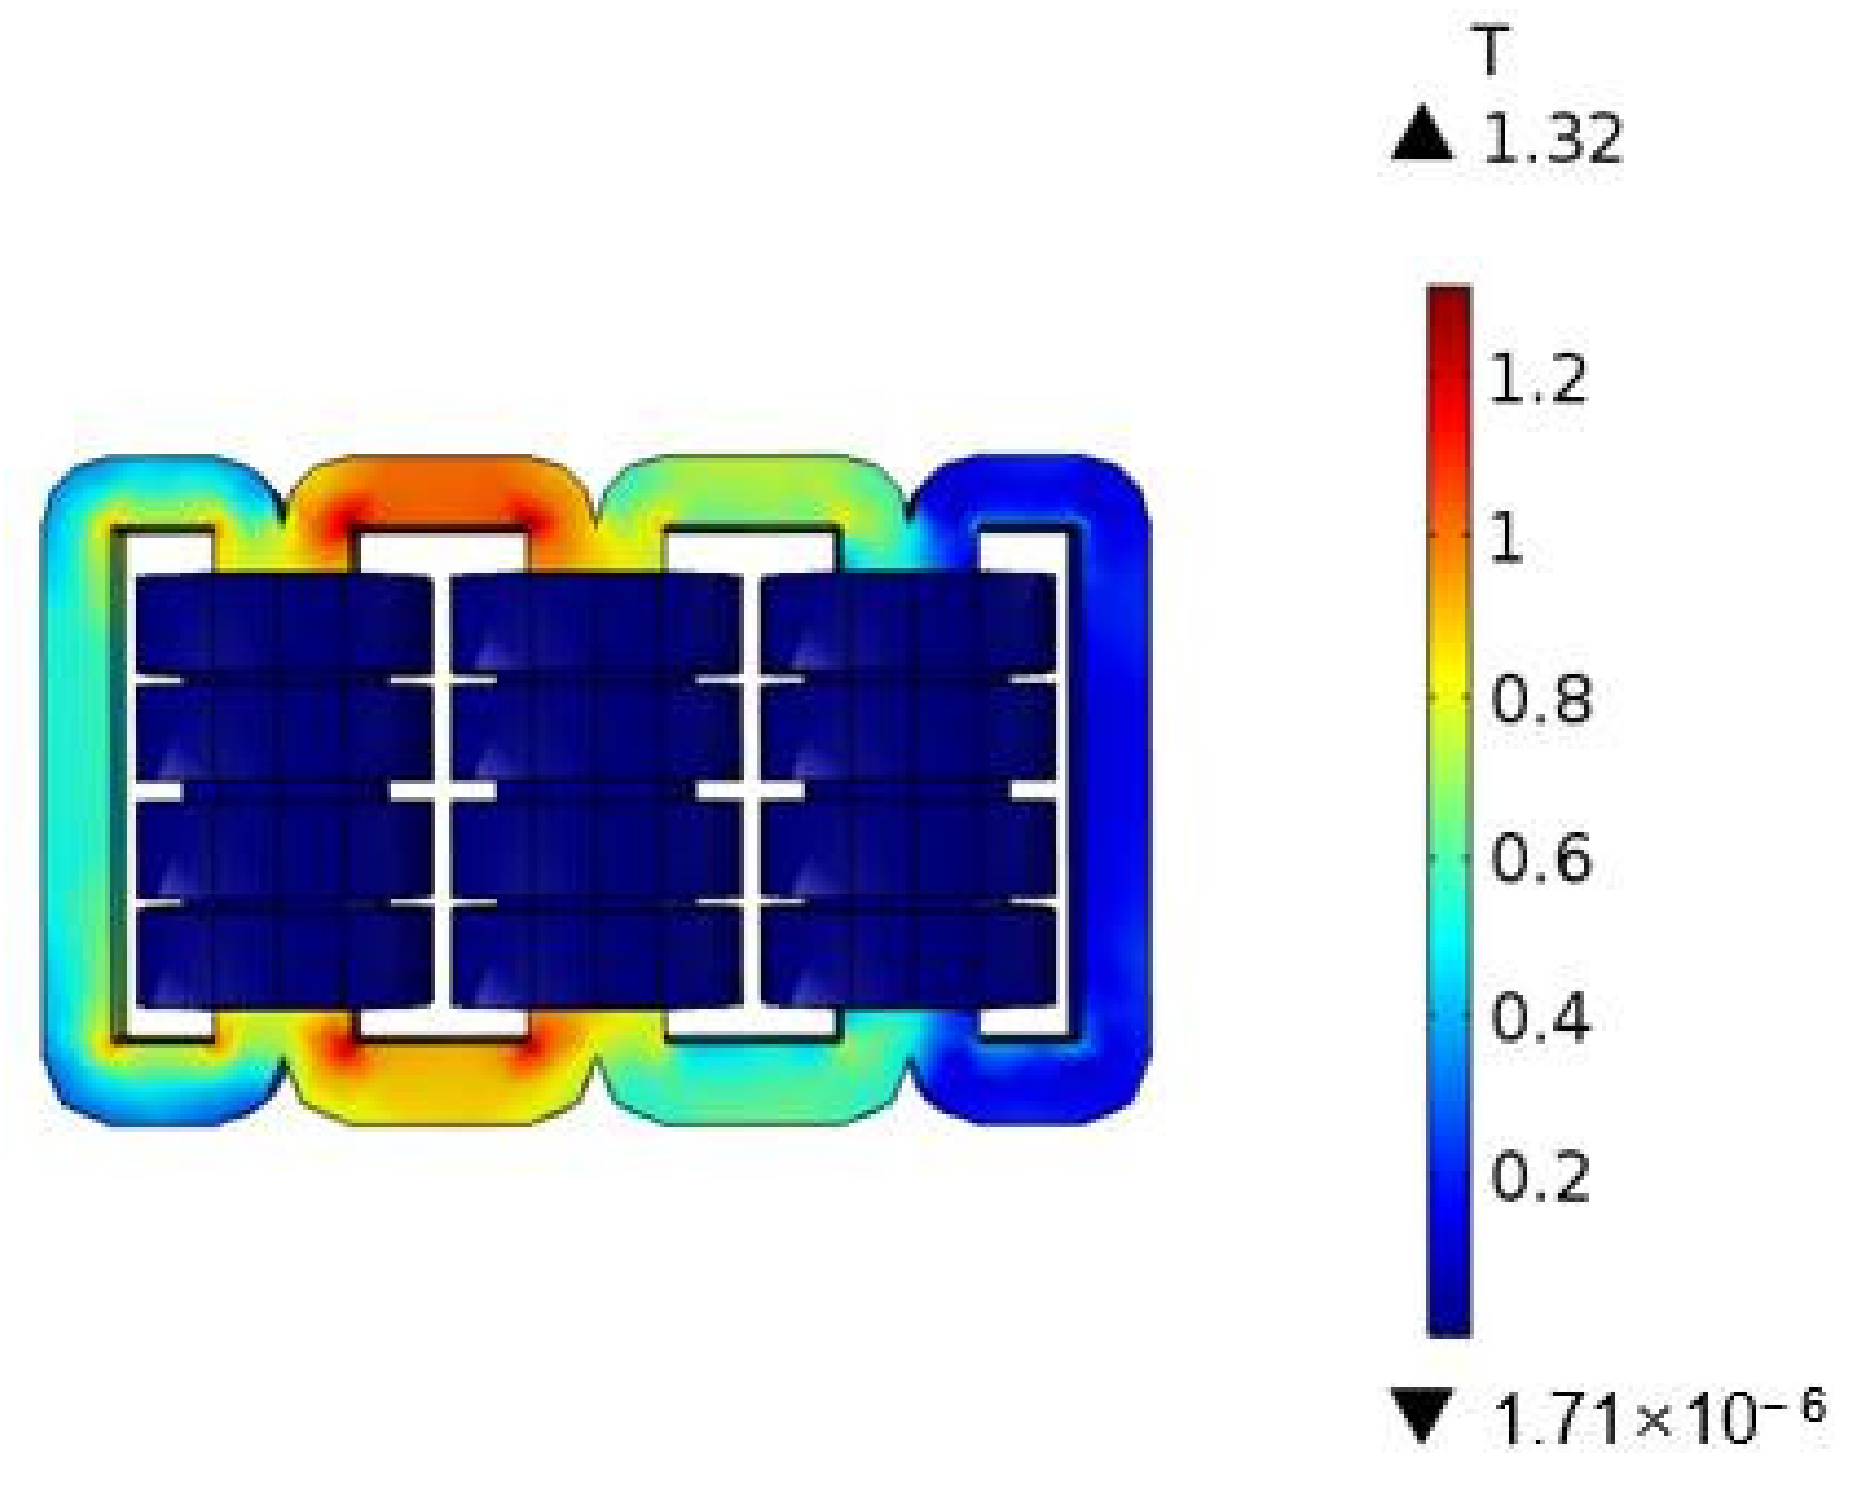
Using the above method enables an analysis of the various excitation conditions of the transformer under different rated voltages. Accordingly, this method is suitable for magnetic field analysis under DC bias and harmonic excitation conditions. Figure 4 shows the calculated no-load current waveform under rated voltage. From the waveform, it is apparent that there is a little distortion. Figure 5 illustrates that the maximum magnetic flux density is around 1.2 T, which is around the knee point of the B–H curve of the amorphous alloy. This is because the electromagnetic design of the transformer is conservative to meet loss and noise emission standards.
Figure 4.
No-load current waveform at rated voltage.
Figure 5.
Distribution of core magnetic flux density at 100% rated voltage.
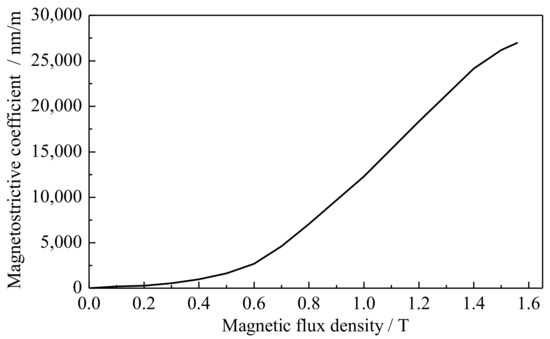
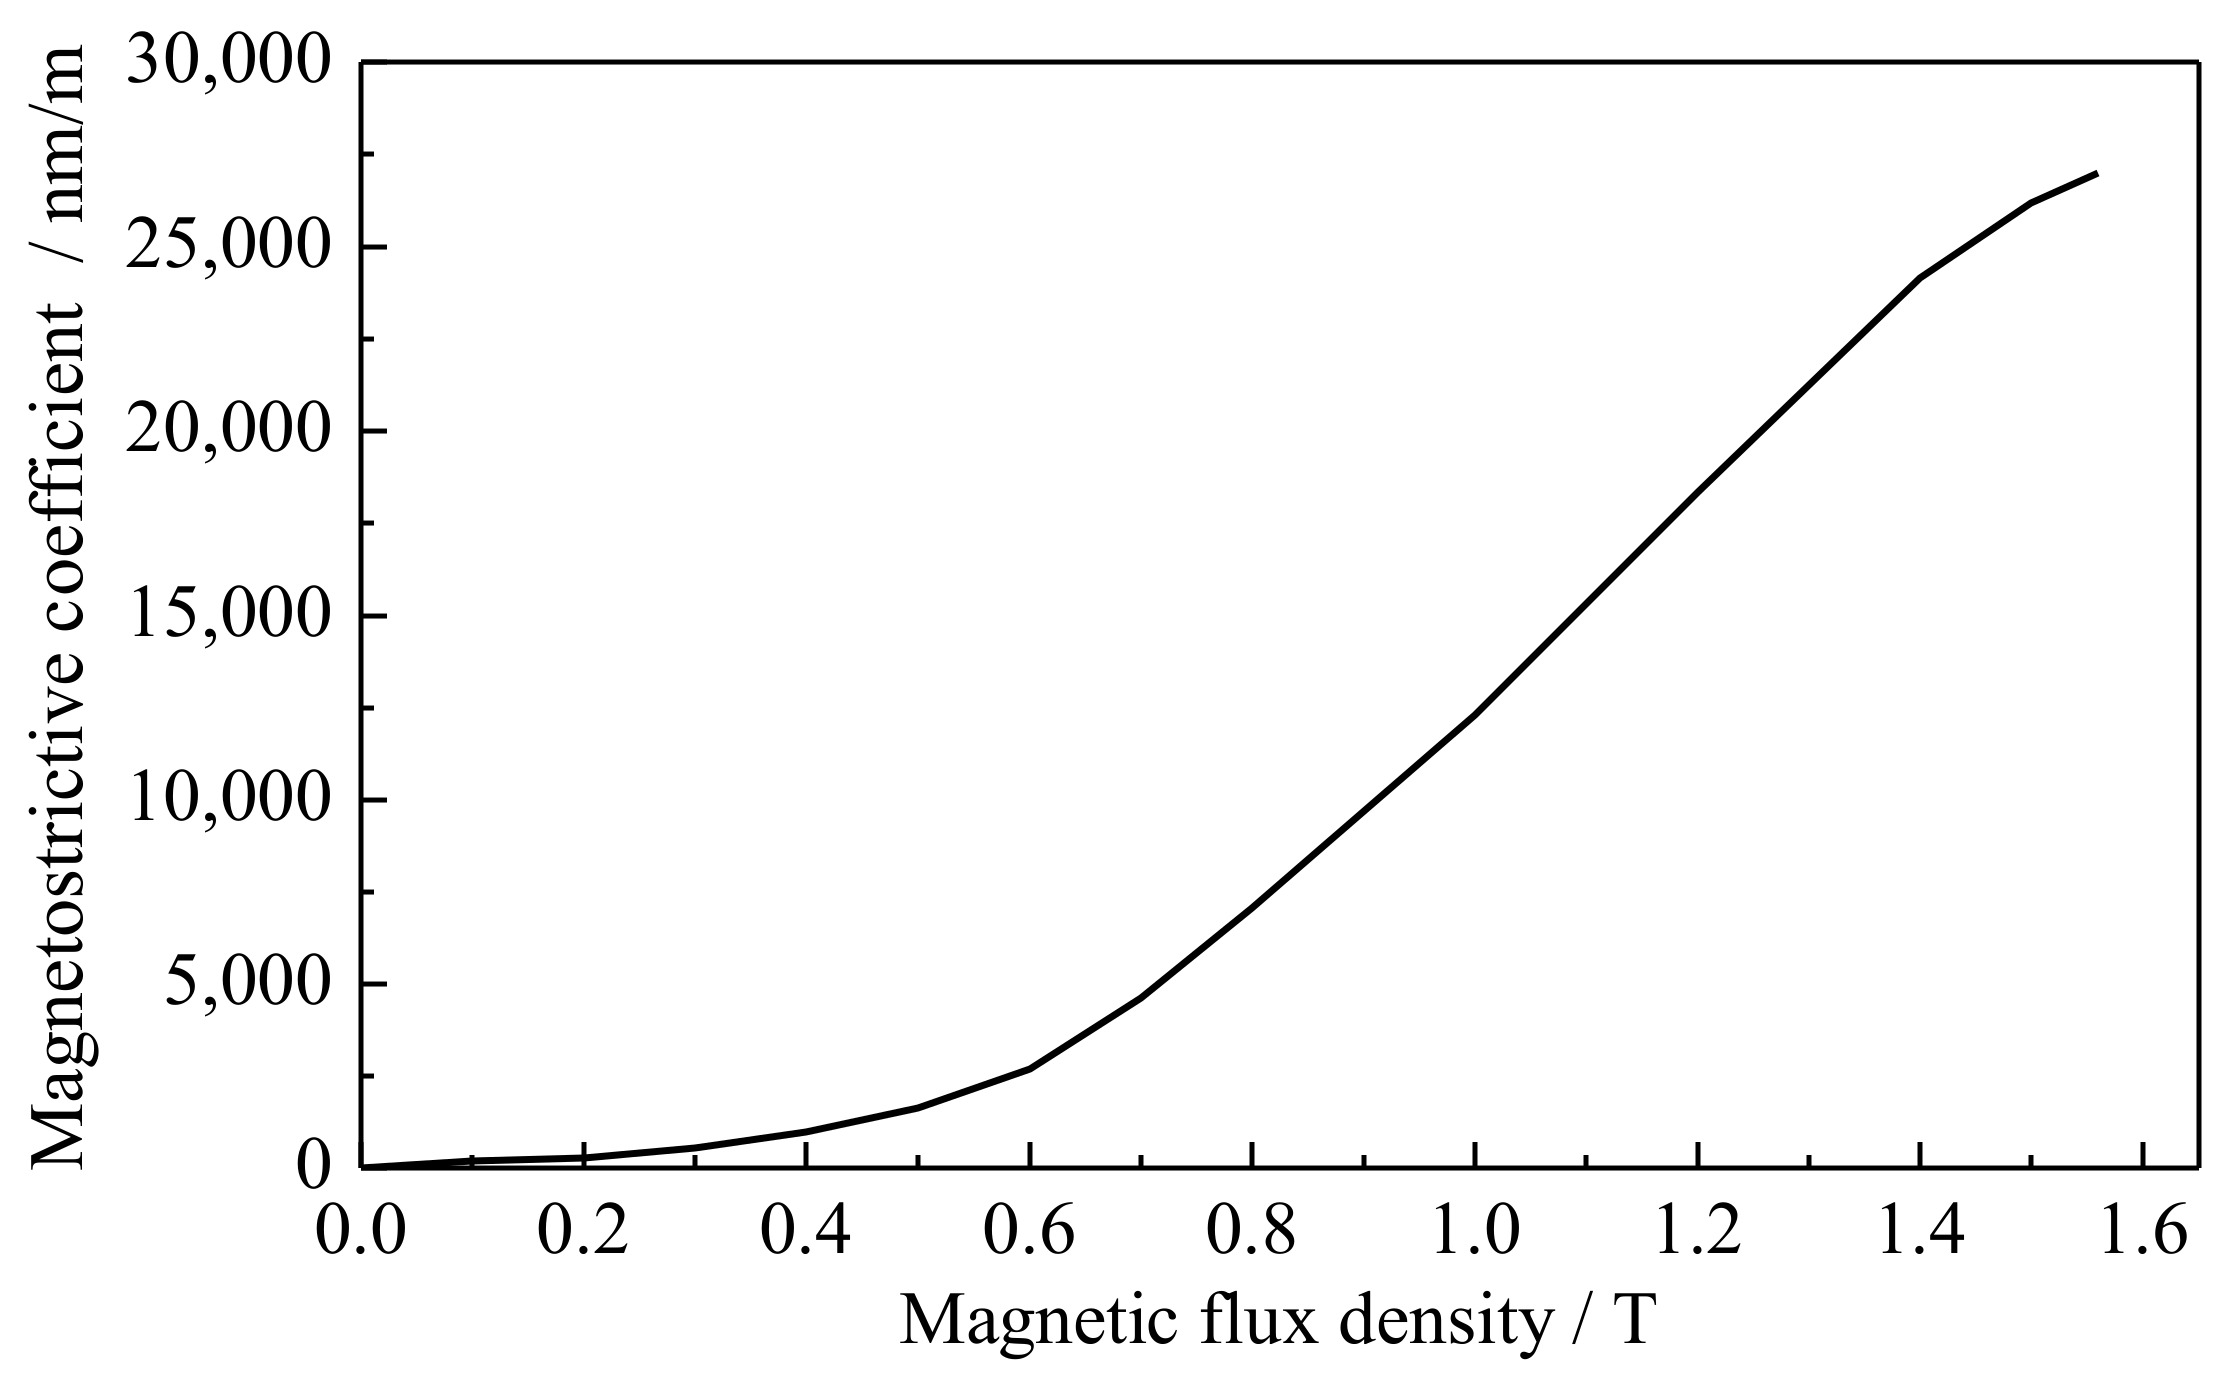
The main contribution of core vibration comes from the magnetostriction effect. Thus, the magnetostriction force can be estimated based on the B–λ curve, as demonstrated in Figure 6. In practical operation, the amorphous alloy core is in a suspension state. Due to the faint strain of the core, the analysis only considers the effect of the magnetic field on the stress. Therefore, the interpolation function of the magnetostrictive curve considers the core strains in different directions. For the no-load condition, the influence of winding Lorentz force is negligible. The structural force field analysis can obtain displacement and acceleration by solving the mechanical equation.
Figure 6.
B–λ curve of amorphous alloy.
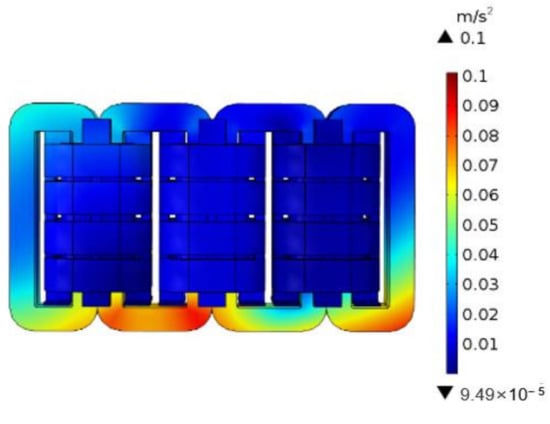
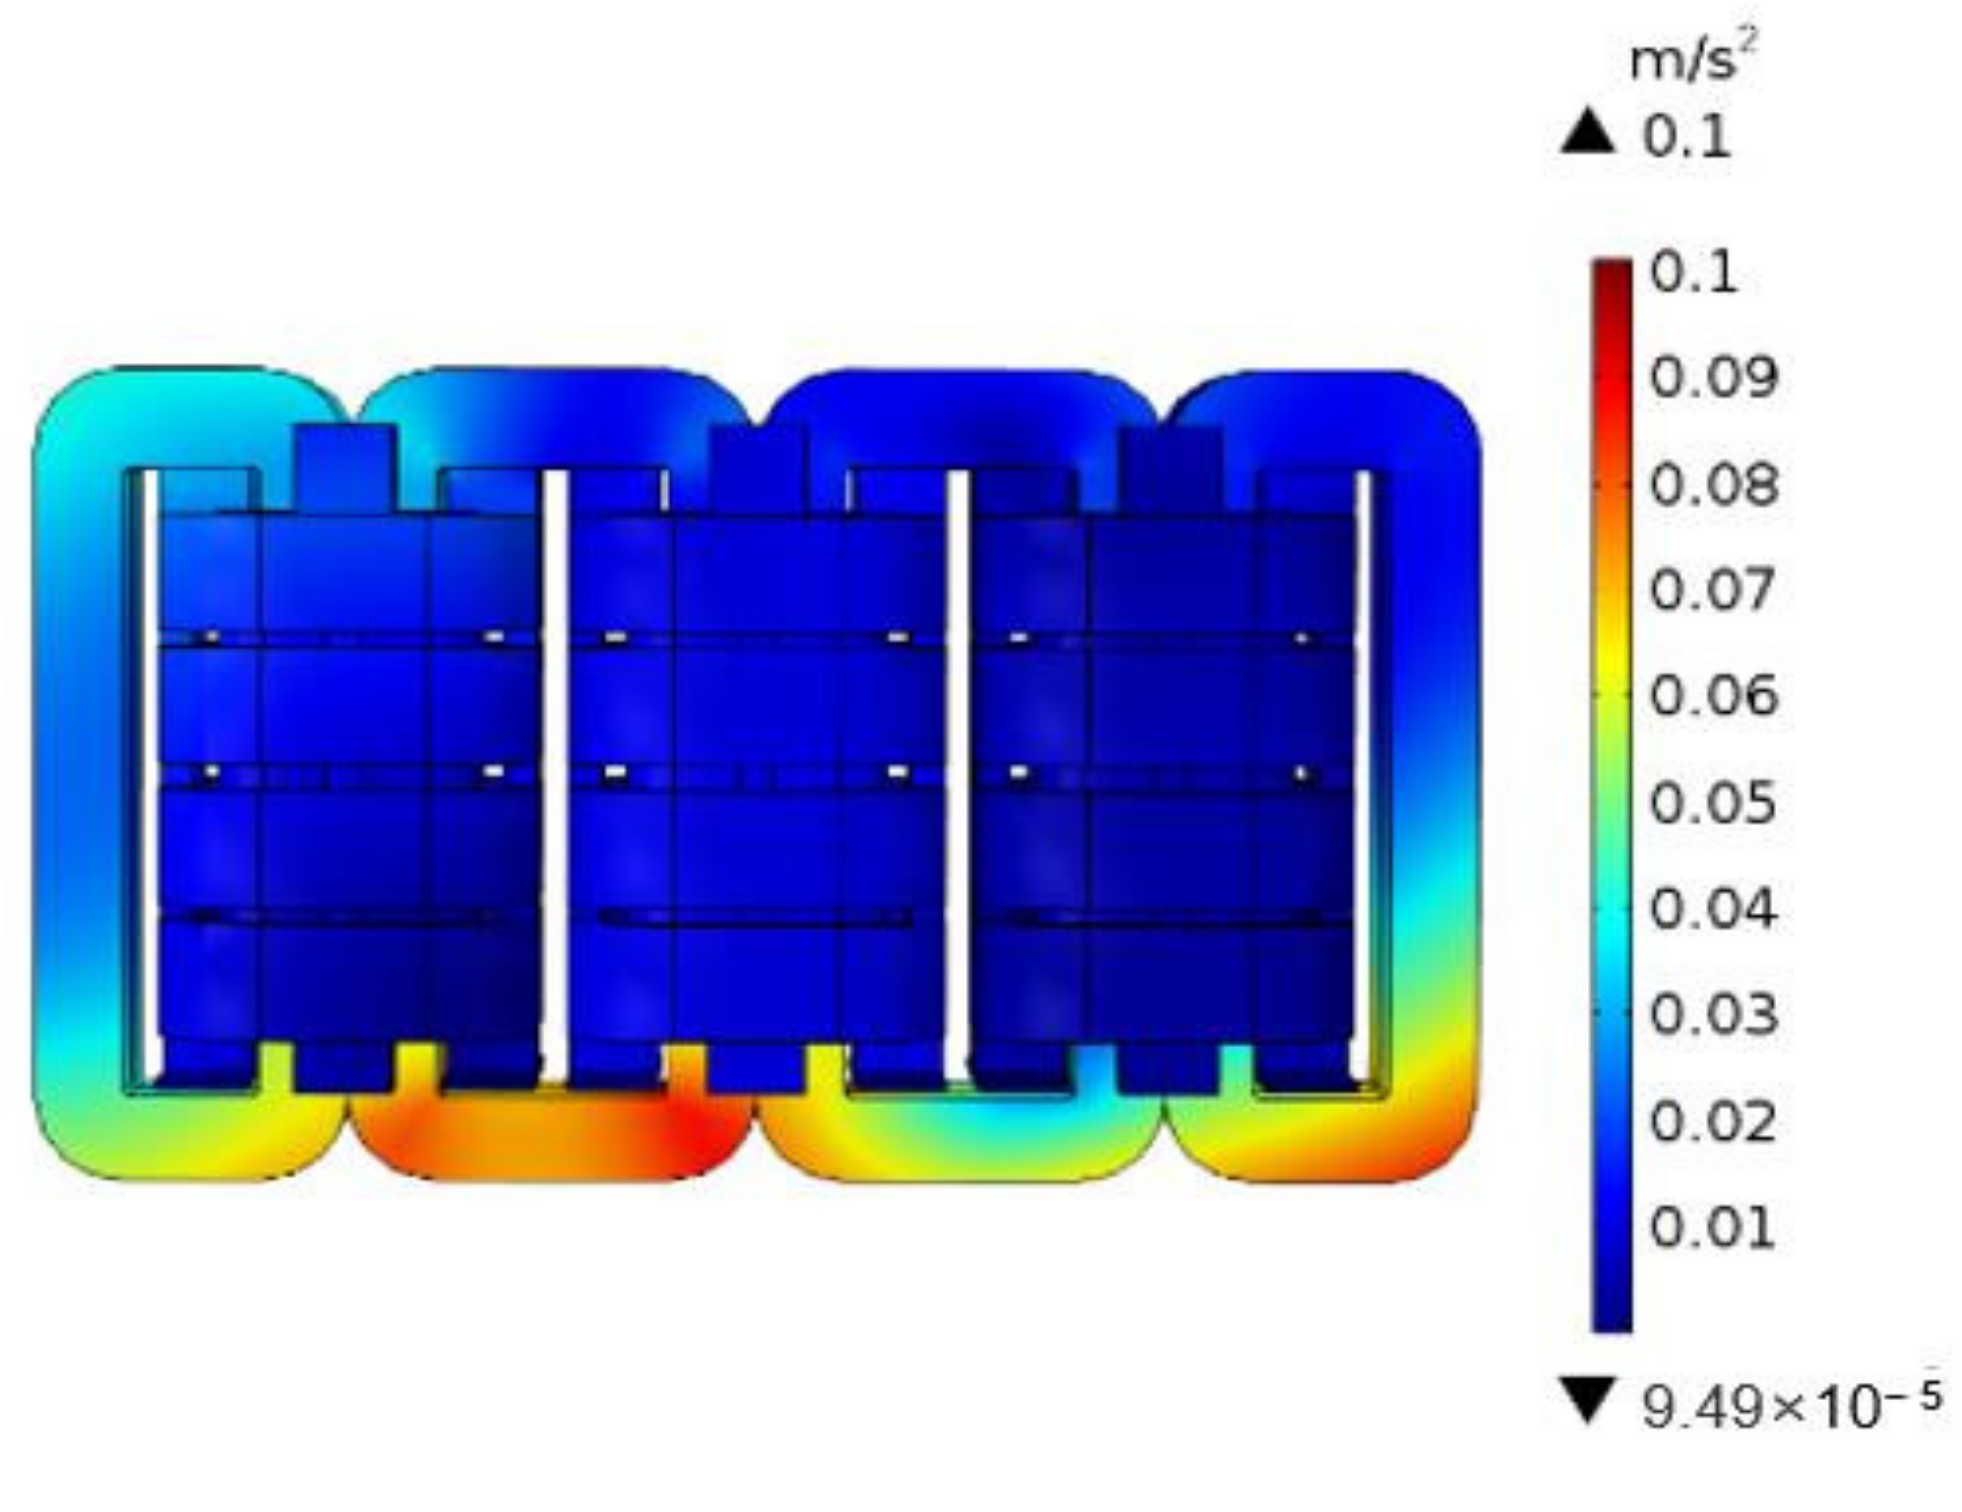
Table 1 shows the material mechanical properties of various parts. Figure 7 illustrates how the vibration acceleration distribution on the transformer outer surface can be solved. It also demonstrates that the bottom part of the core gives bigger vibration with acceleration in the range of 0.05 m/s2–0.1 m/s2.
Table 1.
Material parameters.
Figure 7.
Vibration acceleration of core under rated no-load condition.
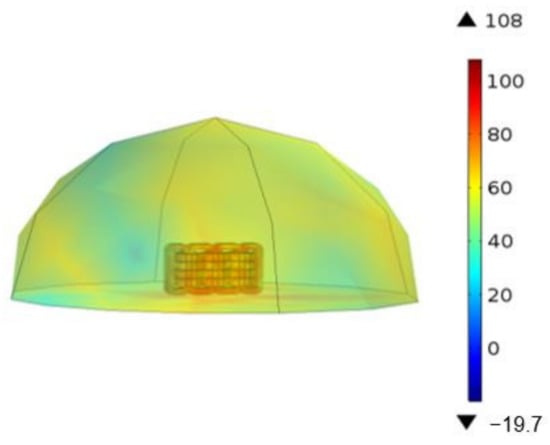
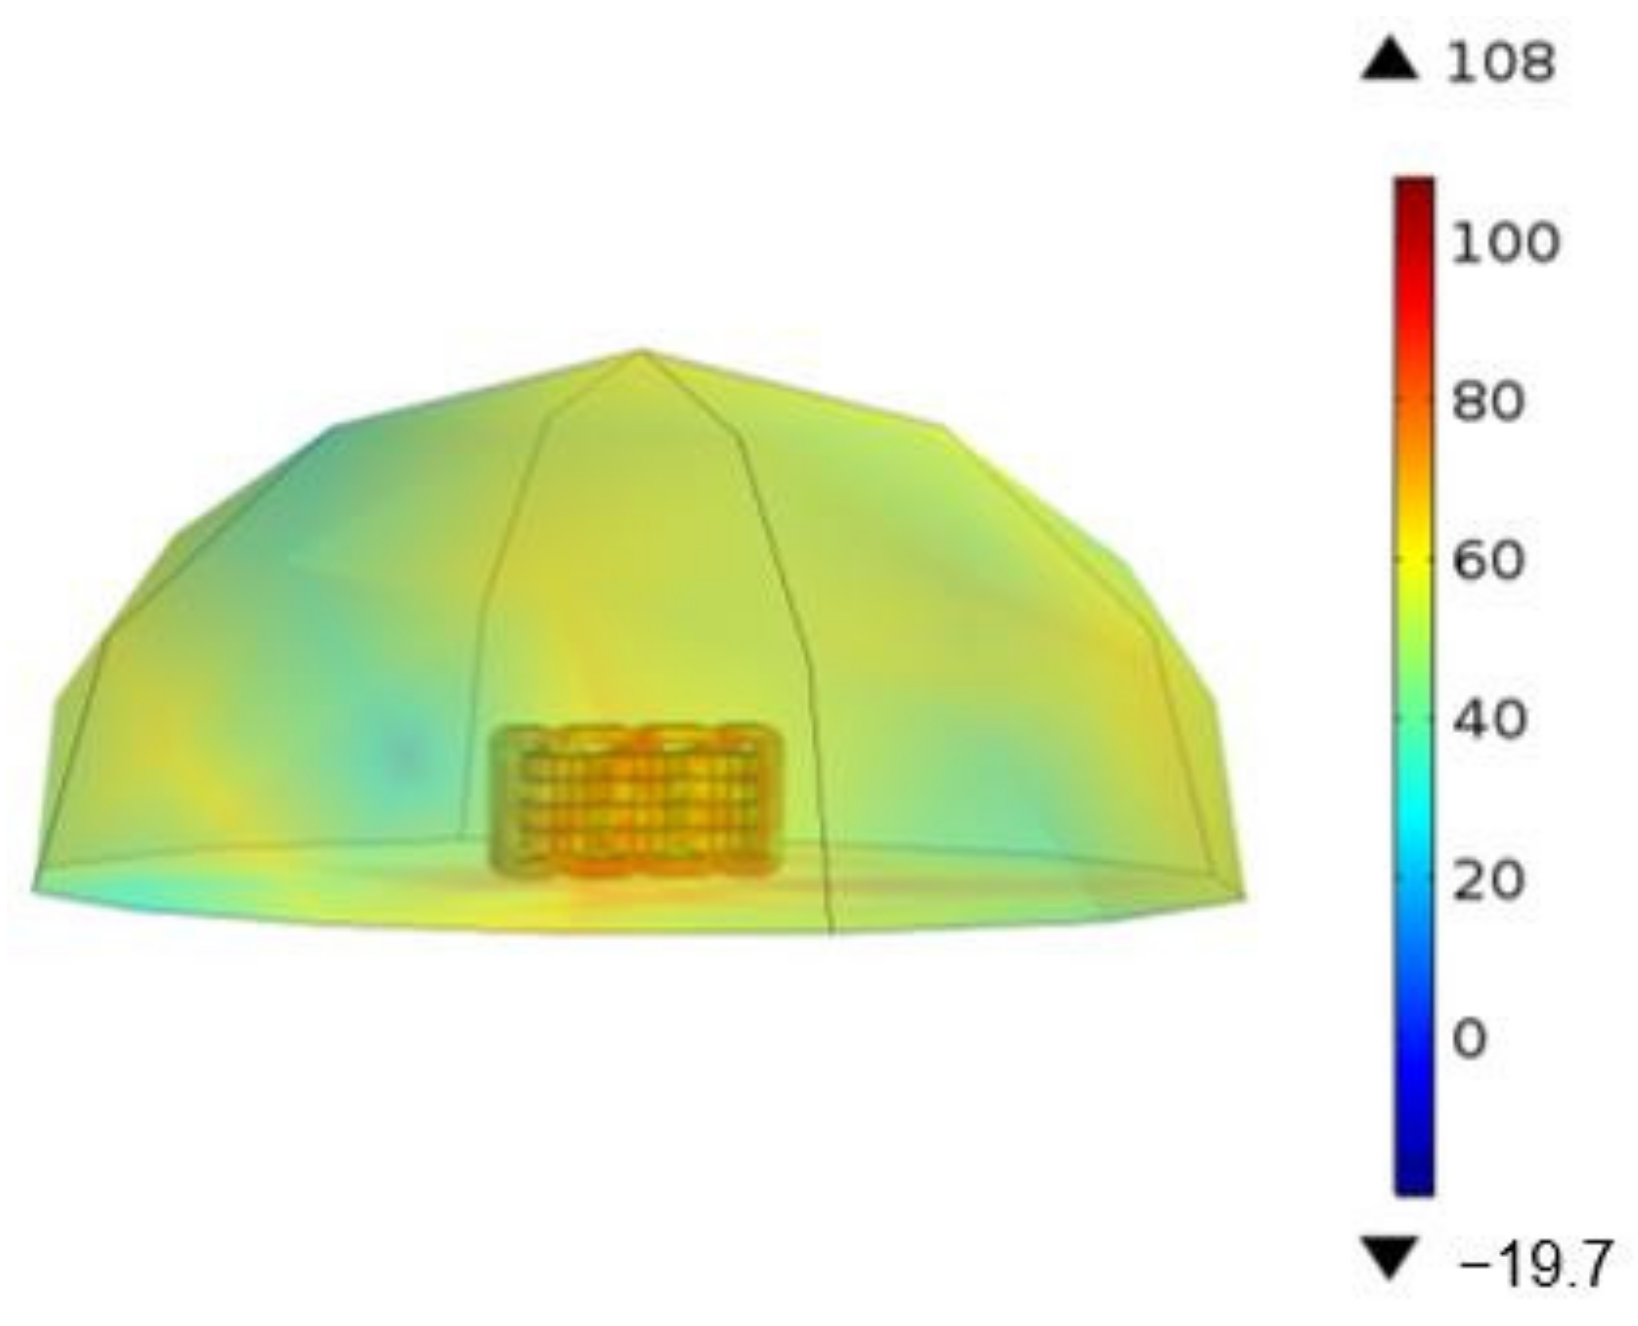
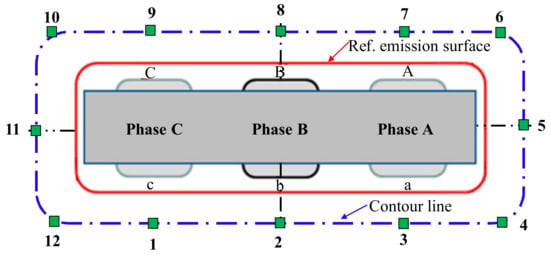
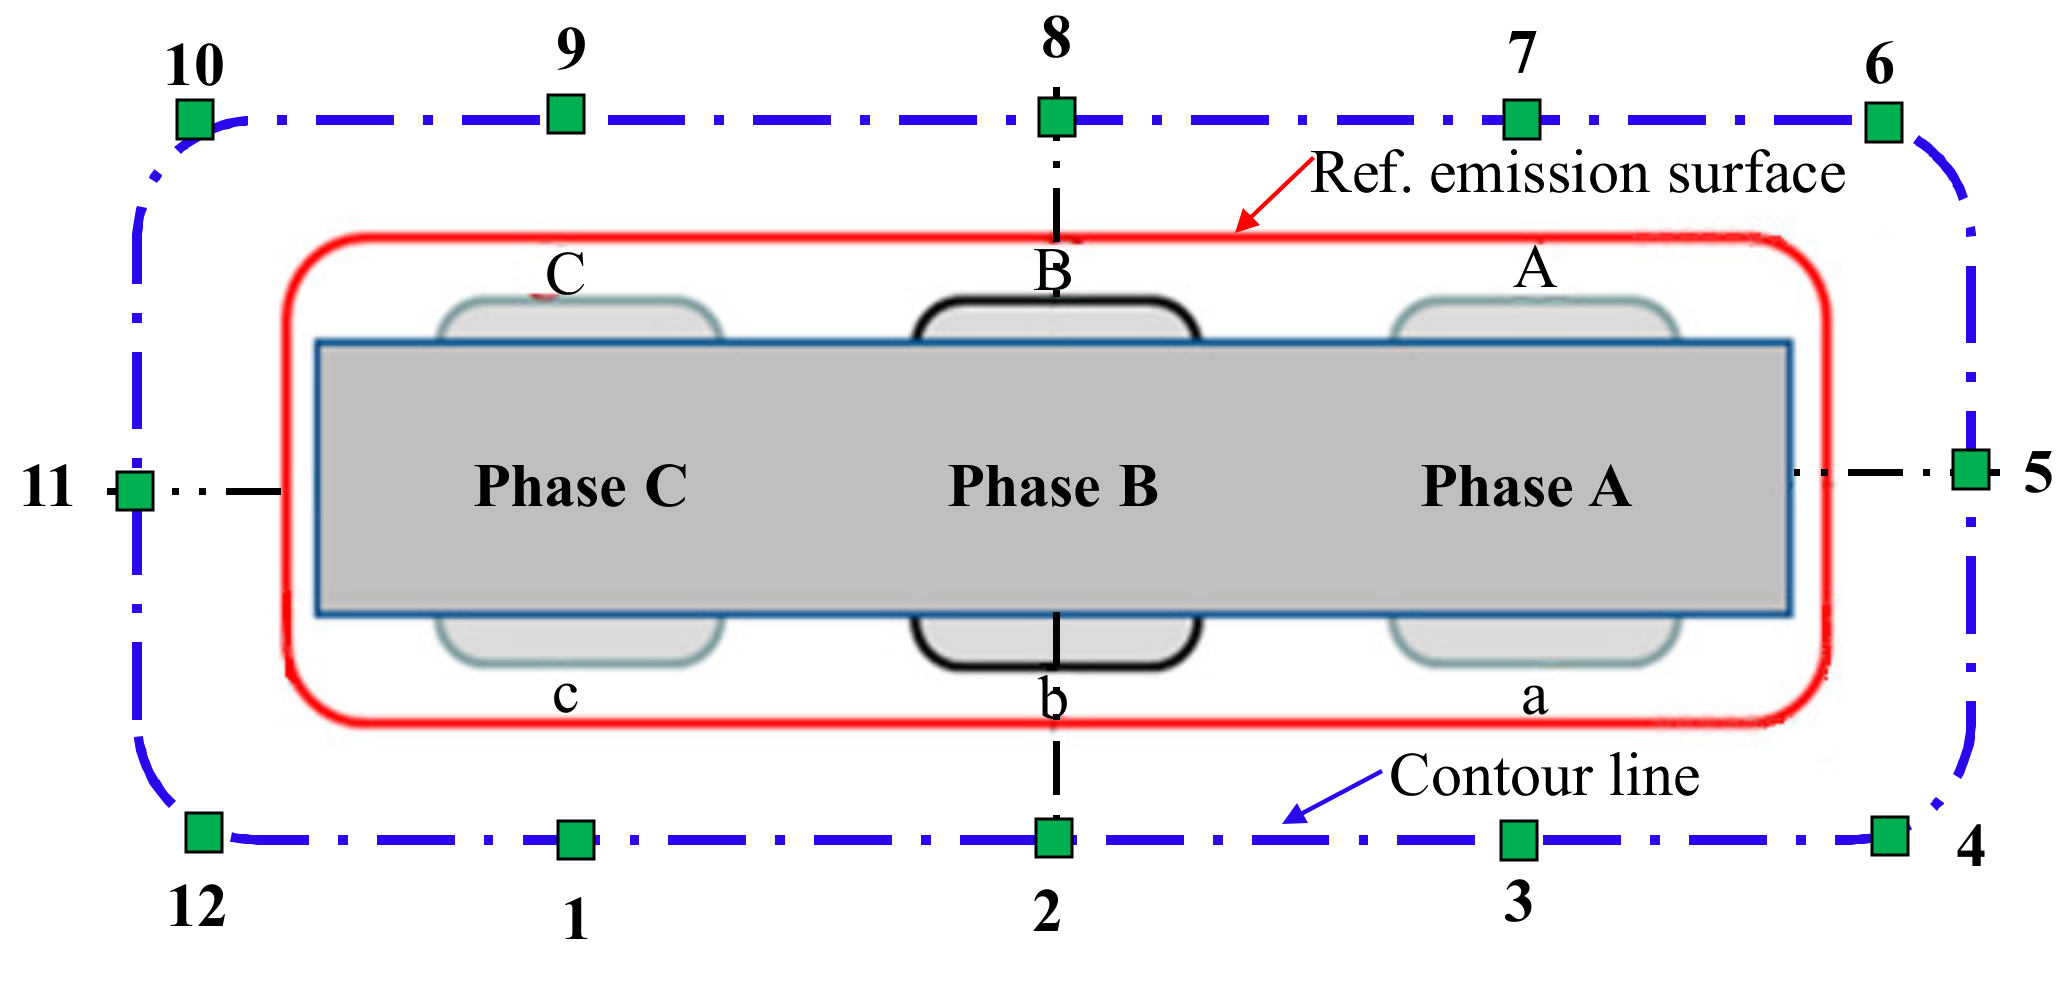
The normal components of surface accelerations of core and windings are selected as the excitation of acoustic field analysis. Solving the acoustic governing equation can obtain the sound pressure distribution and sound pressure level in the air domain. The solving region of the acoustic field is one hemisphere by applying the boundary condition of spherical wave radiation. The distribution of sound pressure level (SPL) in the space can be obtained by a coupling solution, as shown in Figure 8. Figure 9 shows how the measurement points are arranged to evaluate acoustic pressure.
Figure 8.
Distribution of SPL around transformer (dB).
Figure 9.
Location of measurement points.
The average equivalent sound pressure level (ASPL) LP is calculated by:
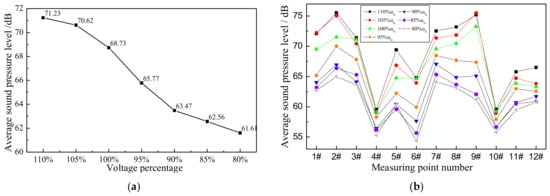
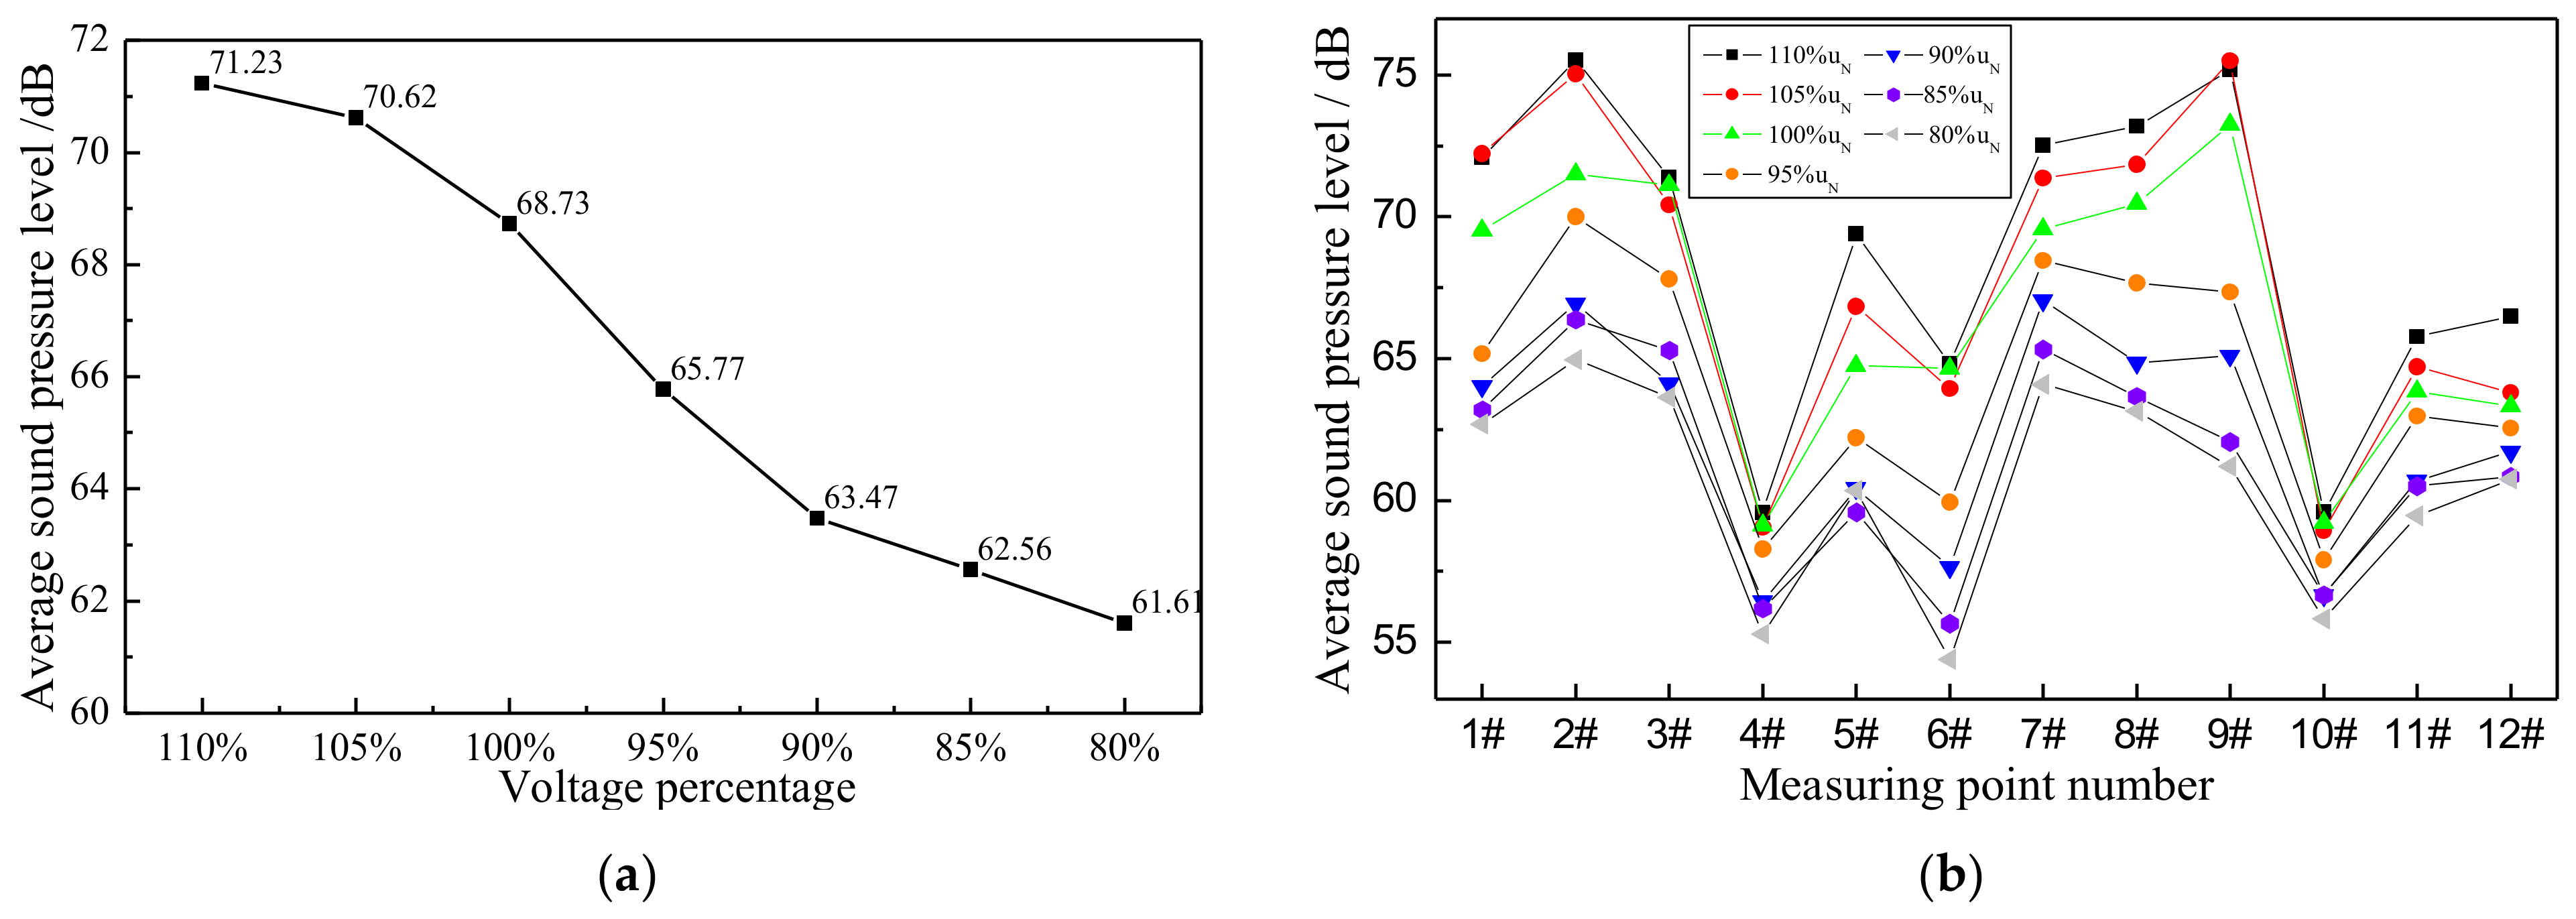
where N is the number of measured points and LPi is the sound pressure at ith point. Figure 10 illustrates the ASPLs and SPLs of each point at different no-load voltages. The noise of each point increases as the no-load voltage becomes bigger. Points #1–#3 and #7–#9 are located in front of and behind the transformer. Their noises are higher than the bilateral points. Meanwhile, corner positions #4, #6, and #10 show lower noise, while the measuring point at the center of the side clamp is bigger.
Figure 10.
Sound pressure levels around the transformer. (a) ASPLs at different UN levels; (b) SPL of each measurement point.
2.2. Analysis of Vibroacoustic Characteristics under Load Condition
The vibration of the coil can be analyzed using a short-circuit experiment. First, it is important to calculate the leakage magnetic field around the coil generated by a short-circuit current. Then, vibration resulted from the electromagnetic force is obtained. Under the short-circuit condition, the increase in electromagnetic force leads to the severe deformation of winding. During coupling analysis of the magnetic field and structure force field, the electromagnetic force density on the coil can be calculated by the cross-product of current density and magnetic flux density.
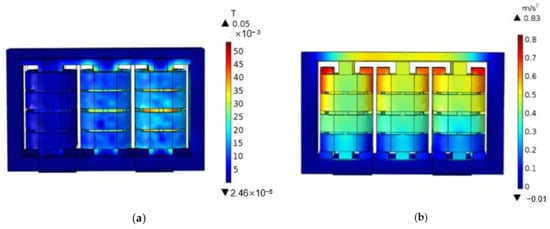
The leakage flux is solved based on principle of Ampere-turn balance. The time-harmonic field solver is selected as the leakage magnetic field solver to reduce the computing time. The primary winding is excited by different current levels at 80%, 85%, 90%, 95%, 100%, 105%, and 110% of the rated current. Meanwhile, the current applied to secondary winding follows the Ampere-turn balance. Figure 11 shows the analysis results of leakage magnetic field and accelerations at the rated current. The upper clamp’s vibration is more severe than that of the lower clamp, whereas the accelerations of coils are gradually smaller from upper parts to lower parts.
Figure 11.
Analysis results of magnetic field and acceleration at rated current. (a) Leakage magnetic field distribution; (b) Acceleration distribution of winding and clamp.
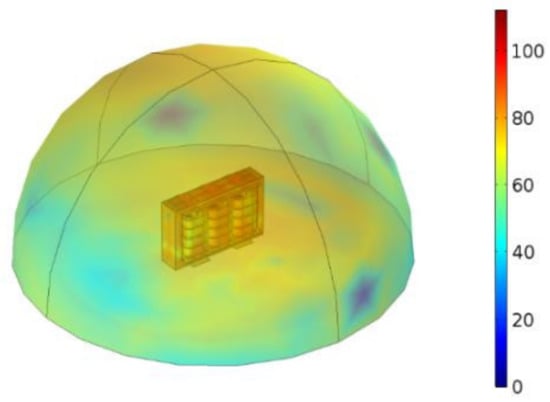
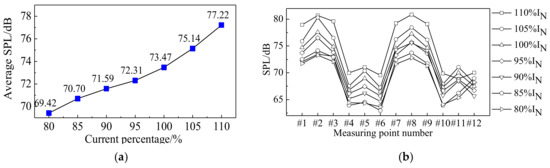
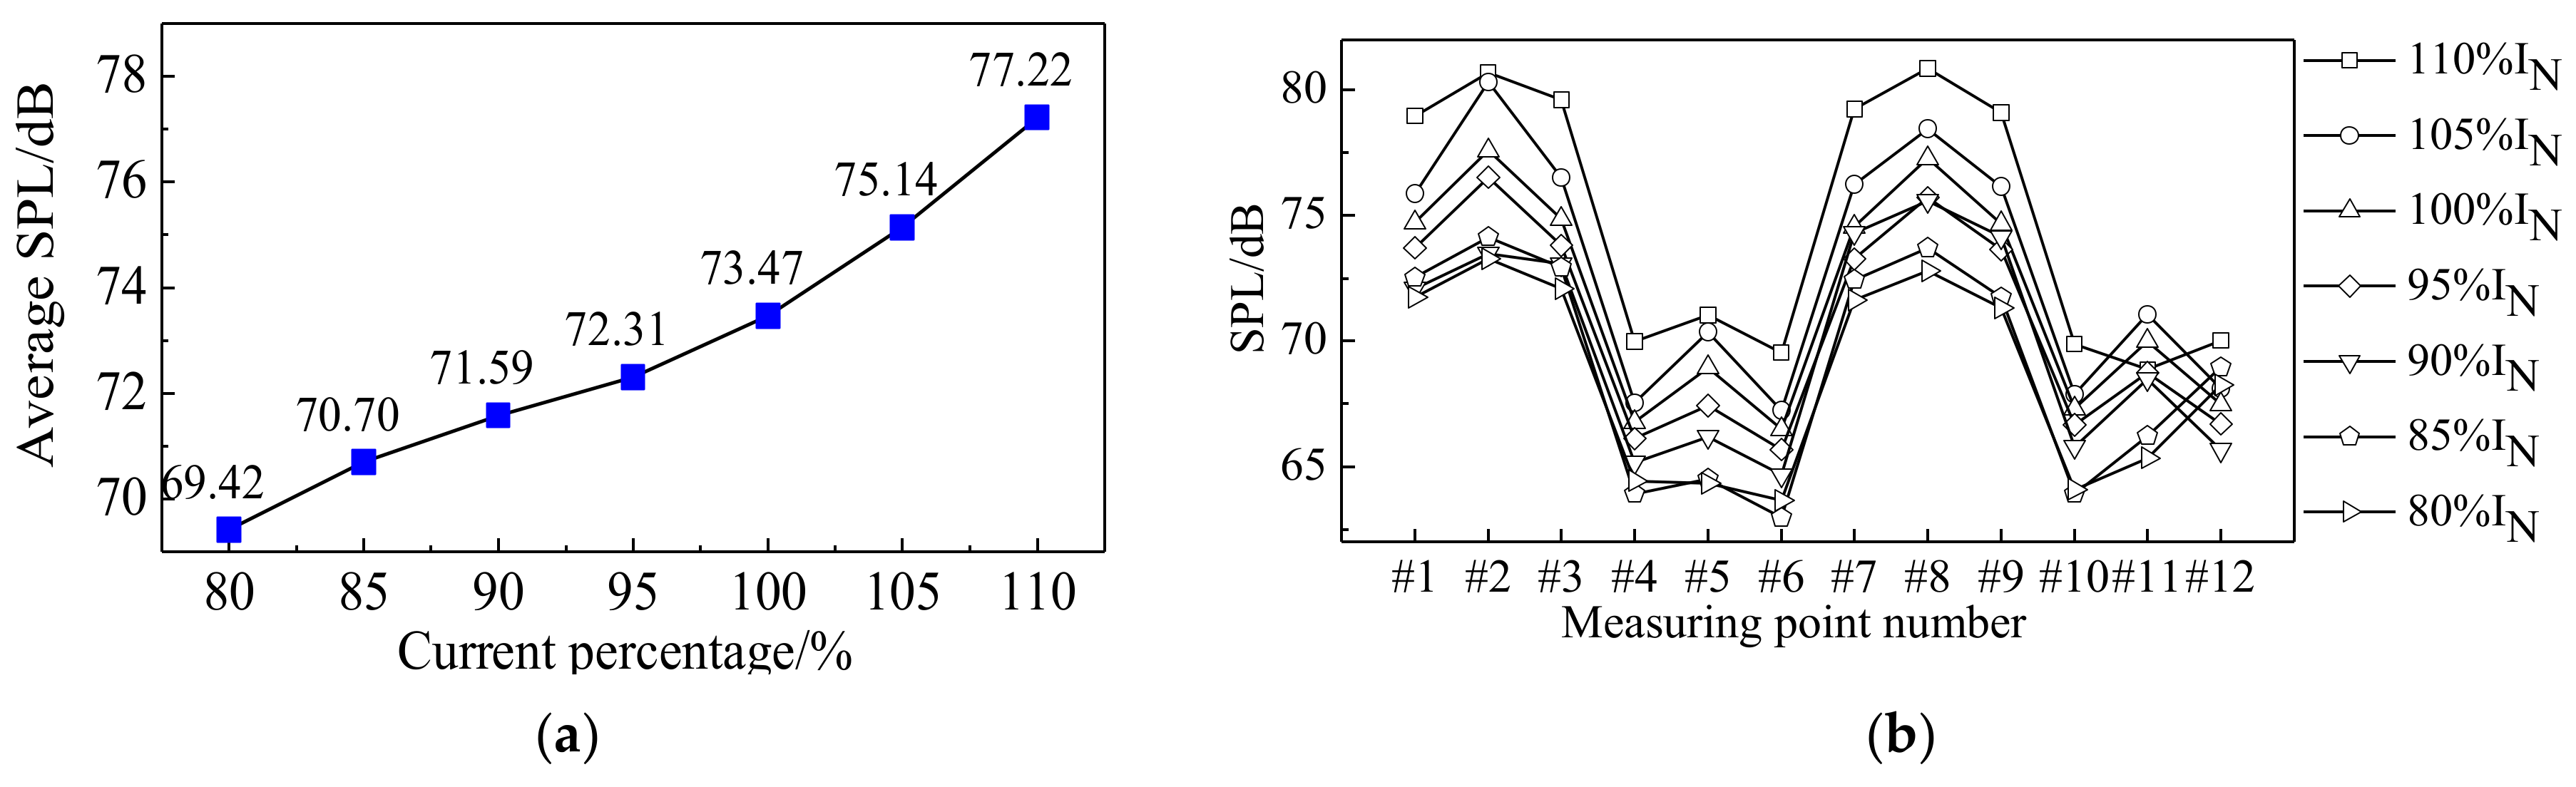
The sound pressure under the rated, short-circuit condition is around 60~70 dB, as shown in Figure 12. As the short-circuit current increases, the ASPL almost linearly increases (see Figure 13a). Under different short-circuit currents, the SPLs of each measured point in Figure 9 are compared in Figure 13b. The measured points in front of the coils including #2 and #8 demonstrate drastic vibration, revealing that clamps around the transformer can insulate the acoustics of lateral points.
Figure 12.
Sound pressure distribution at rated, short-circuit condition (dB).
Figure 13.
Average sound pressure levels around the transformer. (a) ASPLs at different IN levels; (b) SPLs of each point.
3. Measurement of Vibroacoustic Characteristics of Transformer
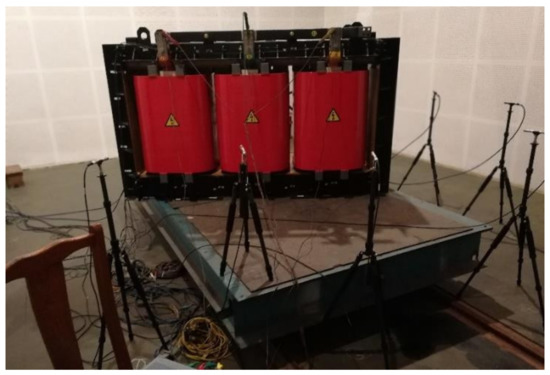
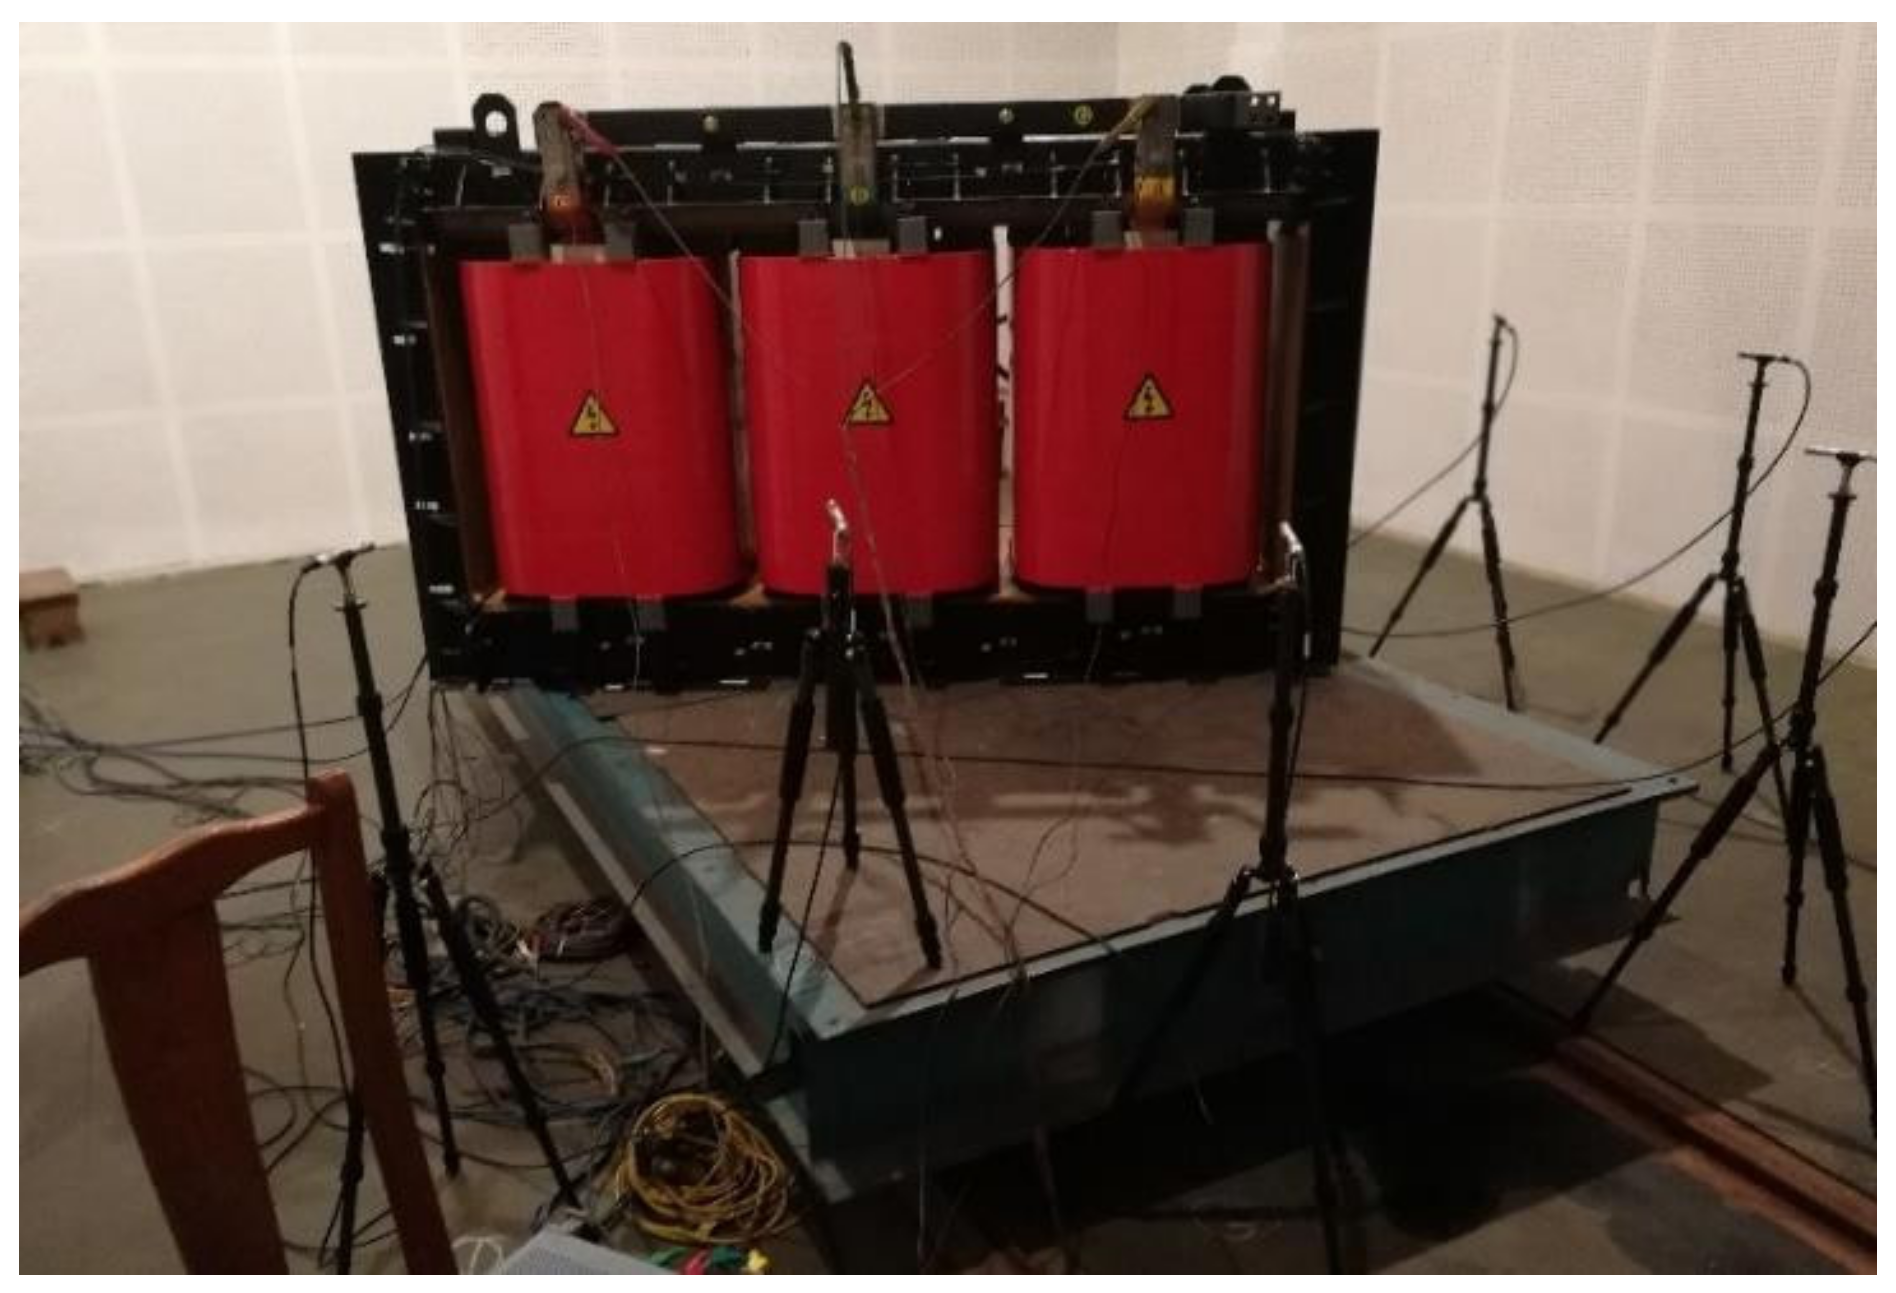
This section investigates the vibroacoustic characteristics of amorphous alloy transformers under no-load and load conditions through physical experiments. The experiment is conducted in a semi-anechoic chamber to avoid the influence of wall reflection. The test bench is shown in Figure 14. For the data acquisition system, there are four channels of each Quantum MX410B module, which can implement a collection of 36 samples simultaneously by utilizing nine modules. The vibration acceleration signal is picked up through the 4528B vibration sensor, and the sound pressure signal is picked up using microphone 4189-A-021.
Figure 14.
The test bench of vibroacoustic characteristic experiment of the transformer.
3.1. No-Load Experiment
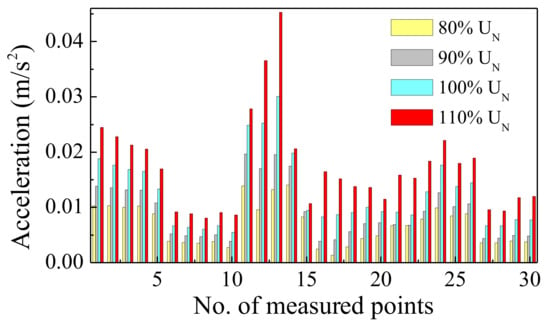
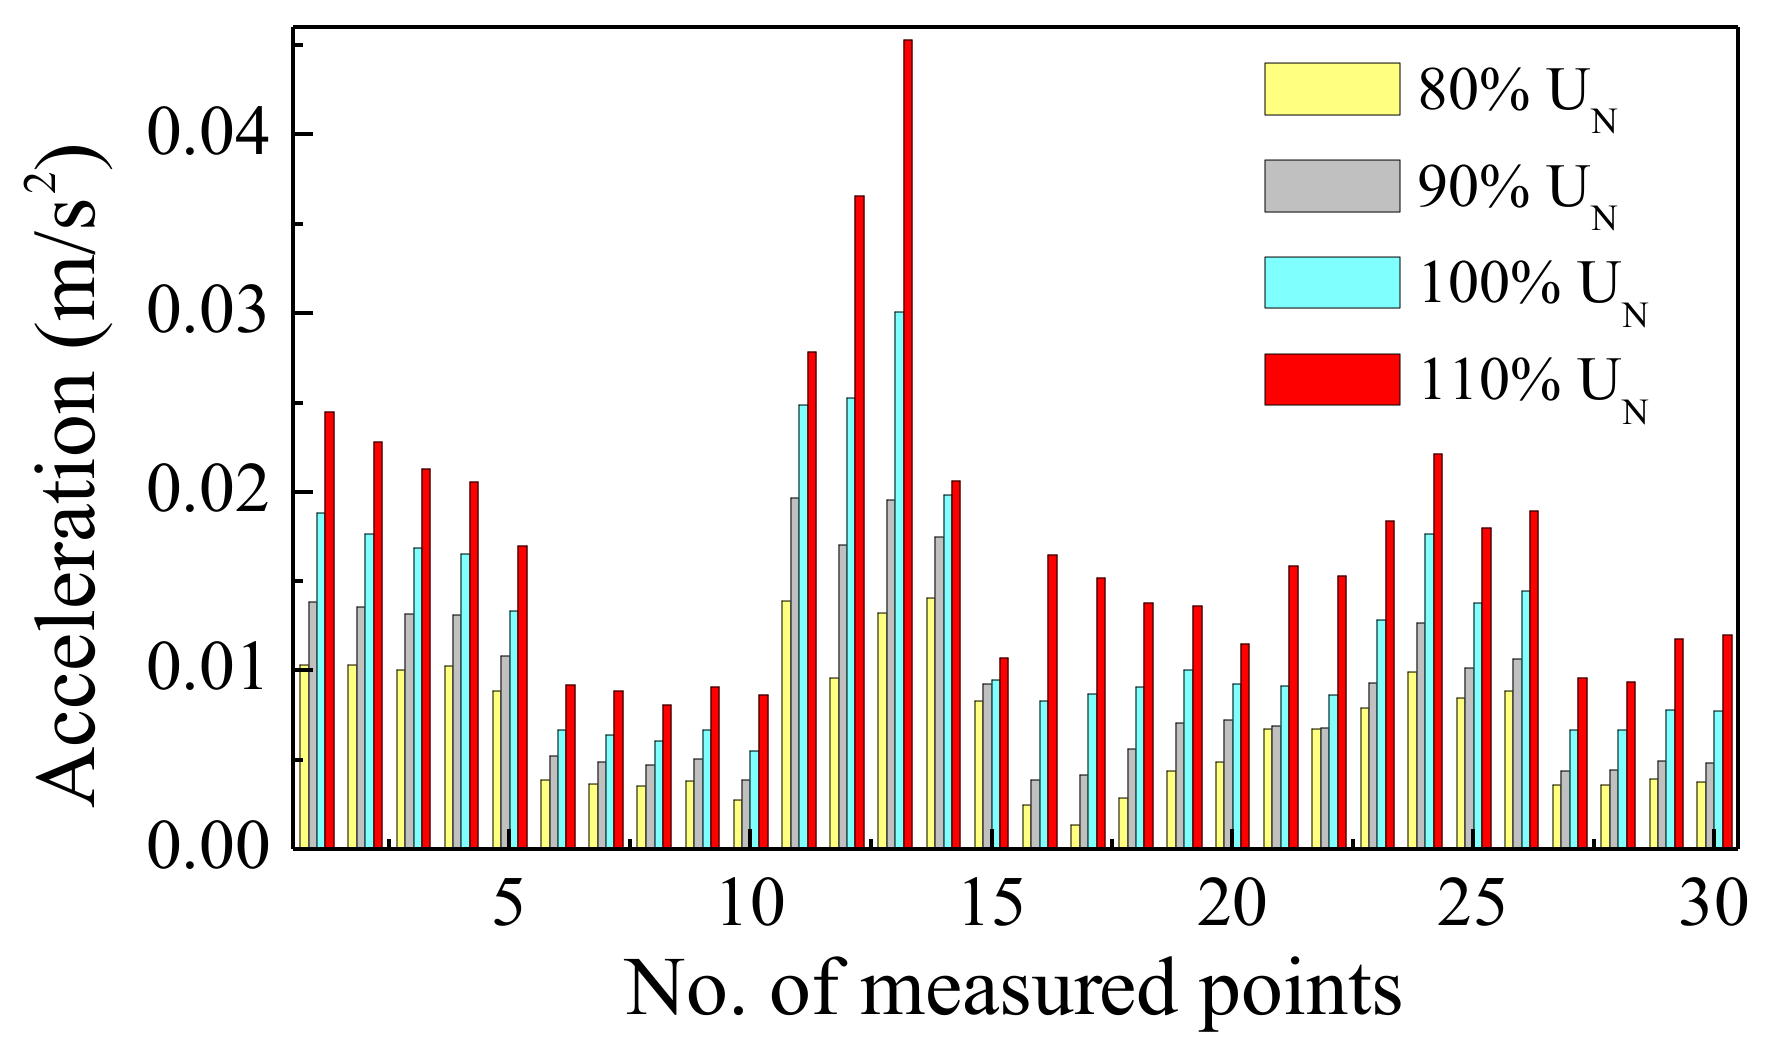
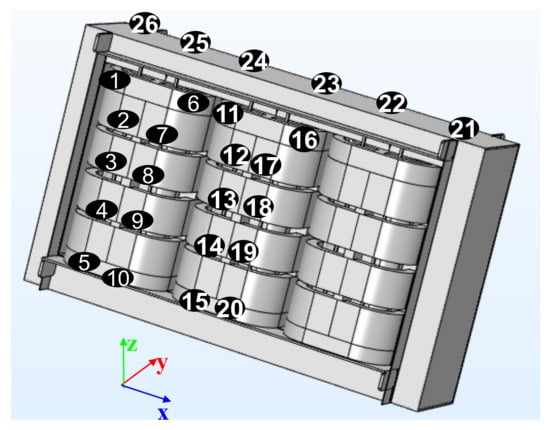
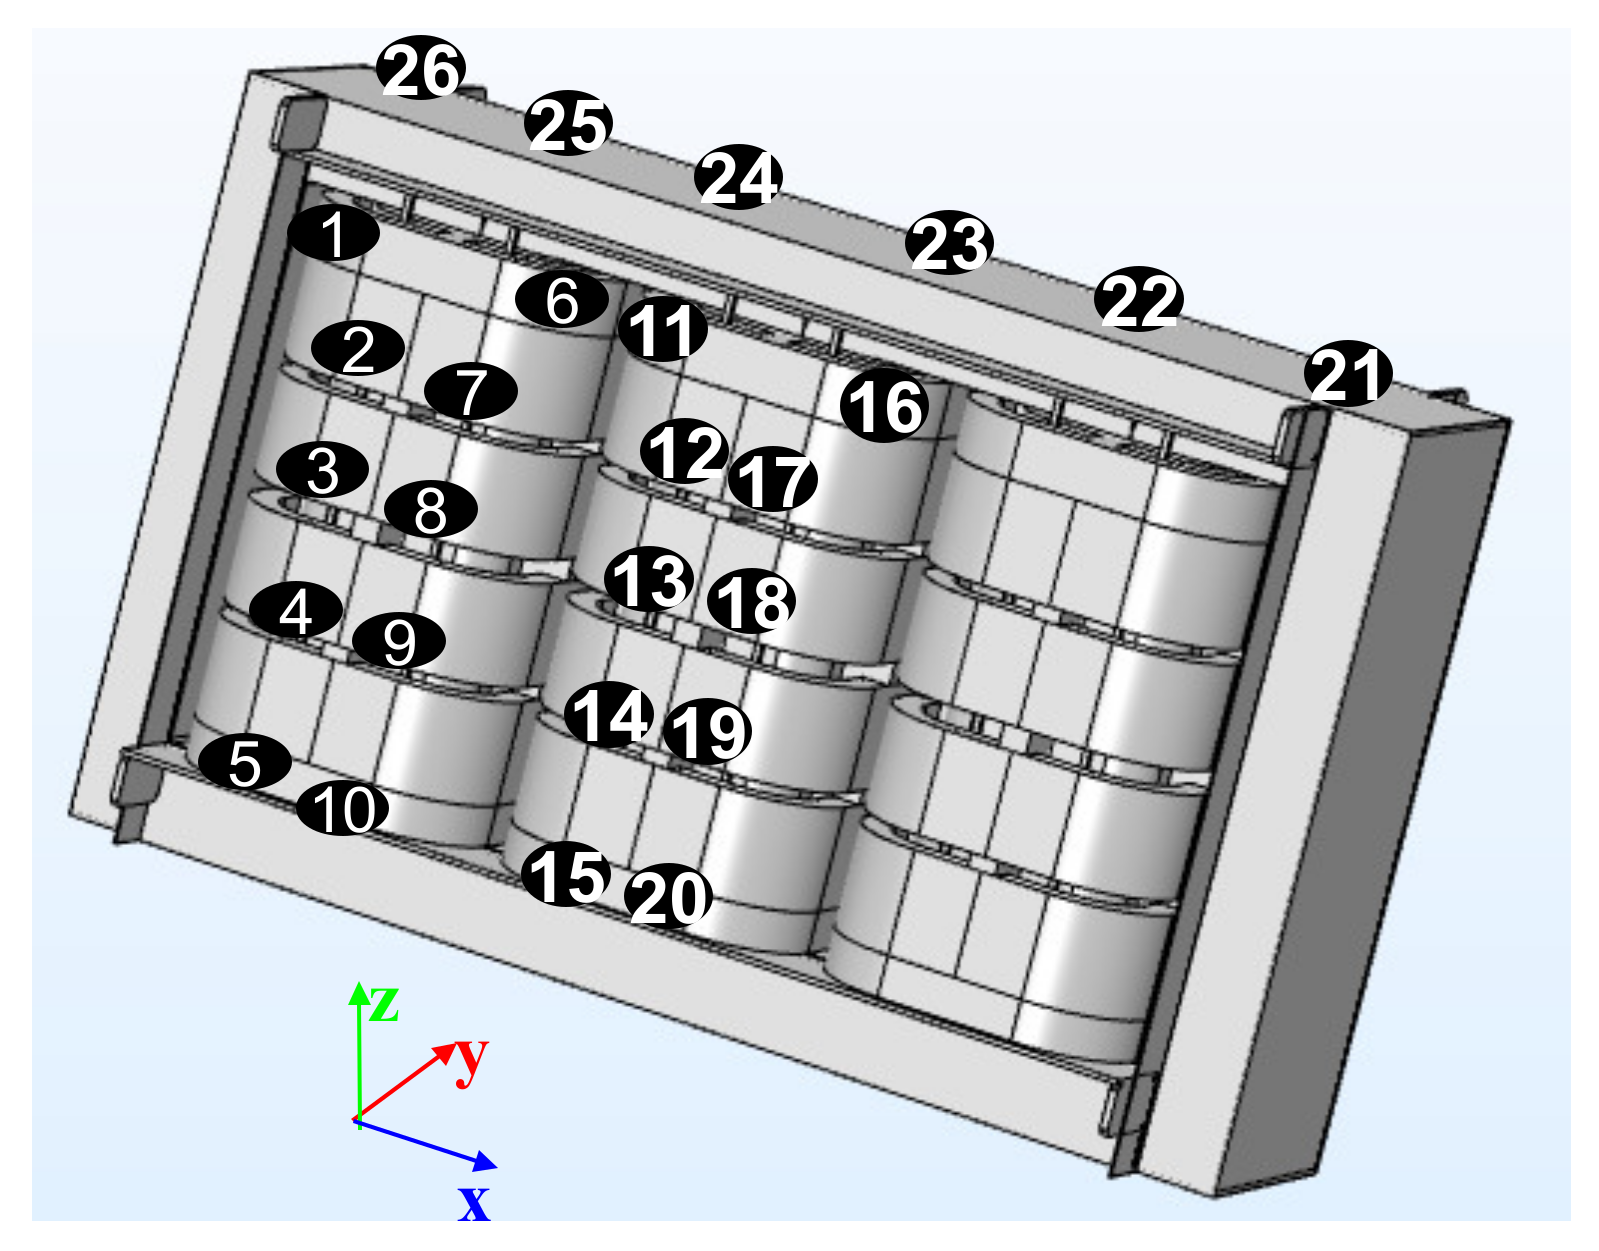
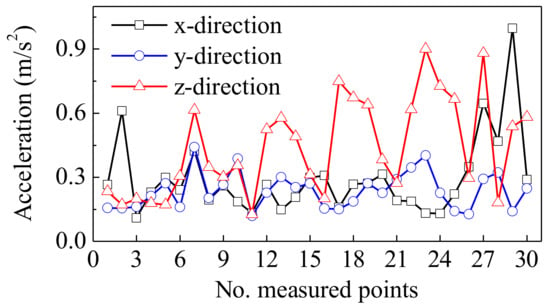
Figure 9 illustrates the location layout of the reference emission surface, contour line, and measured points. Meanwhile, the distribution of 30 points for vibration acceleration measurement is shown in Figure 1, and the results are compared in Figure 15. For each point, the vibration acceleration increases with an increase in the no-load voltage. If the core is under over-excitation, such as 110%UN, the acceleration amplitude will increase significantly because of deep saturation. The figure shows that the maximum vibration occurs at measured point #13, which is located around the center of clamps. In addition, there is no restriction part, which results in larger vibration values.
Figure 15.
Comparison of acceleration under different no-load voltages.
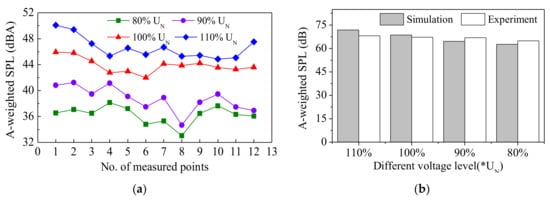
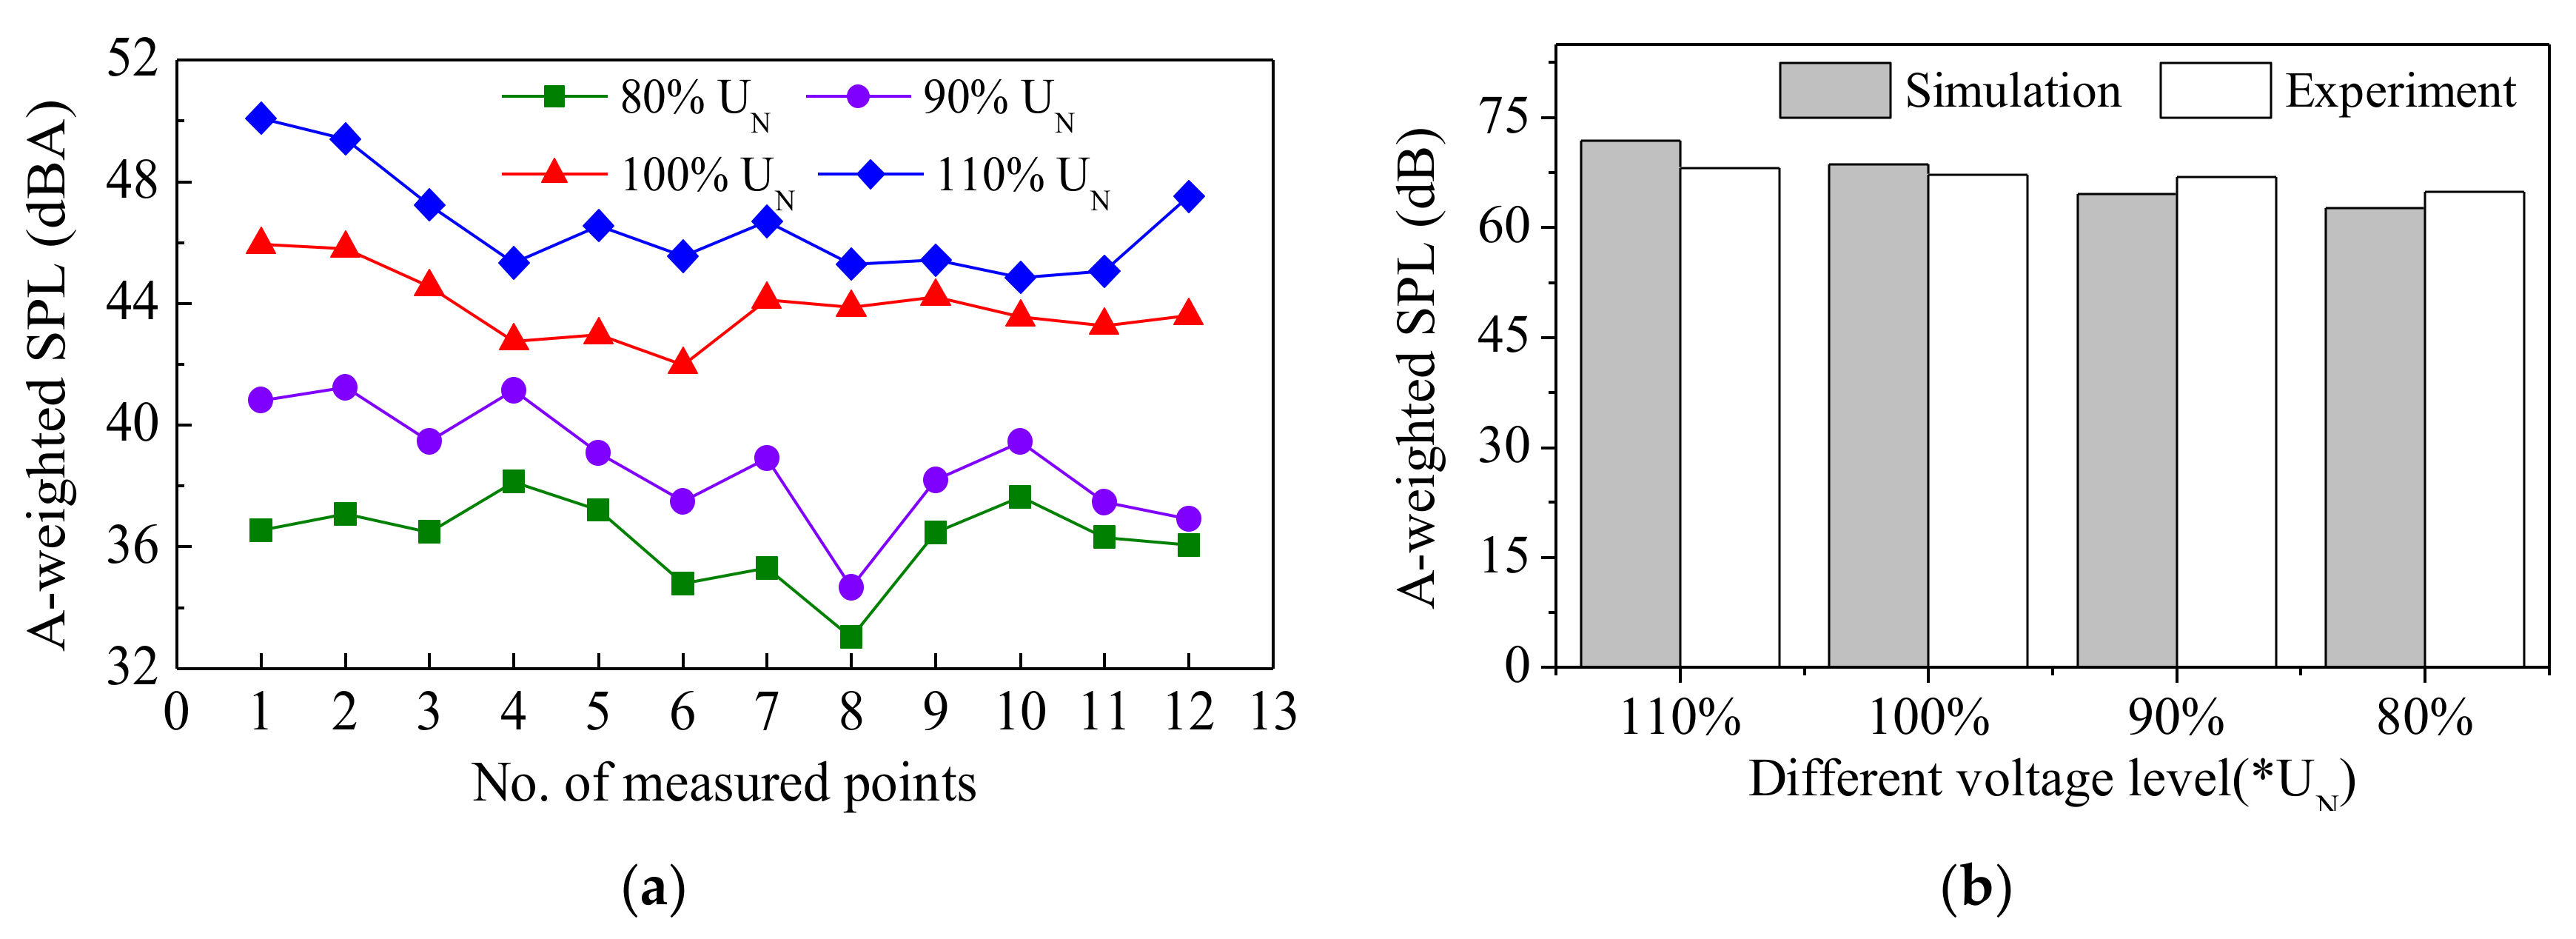
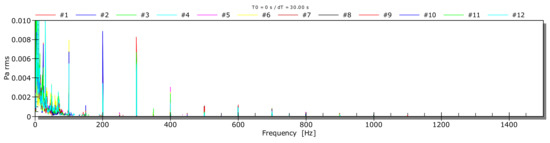
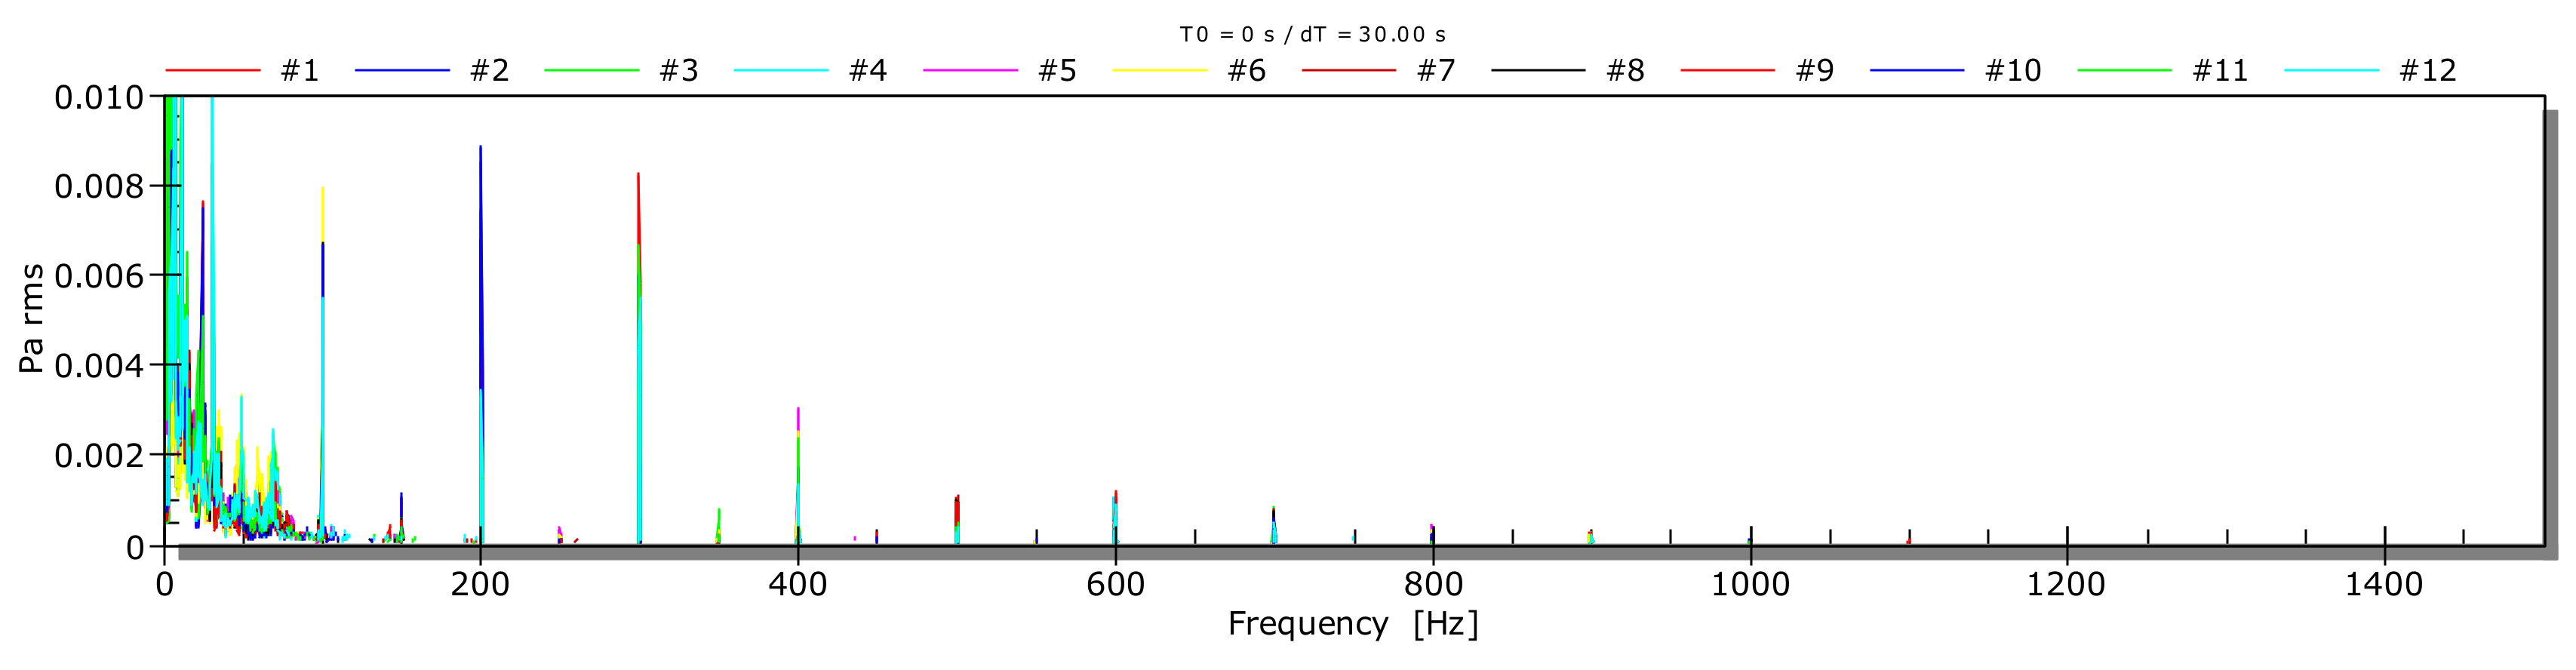
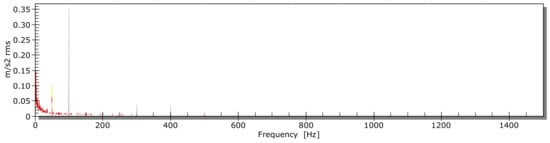
Figure 16 shows the results of the measured A-weighted SPL, where UN is the rated voltage of high-voltage side. In Figure 16b, the digits of lateral axis represent times of rated voltage UN. Figure 16b indicates that the simulation and experiment results demonstrate good agreement, where the maximum absolute error is 3.8 dB. Figure 17 shows the acoustic frequency spectrum analysis of 100%UN, which reveals that the no-load noise is concentrated from 100 Hz to 600 Hz.
Figure 16.
Comparison of A-weighted SPL under different no-load voltages. (a) A-weighted SPL at each point; (b) Average equivalent A-weighted SPL.
Figure 17.
Frequency spectrum of acoustic noise under rated voltage.
3.2. Experiment under Load Condition
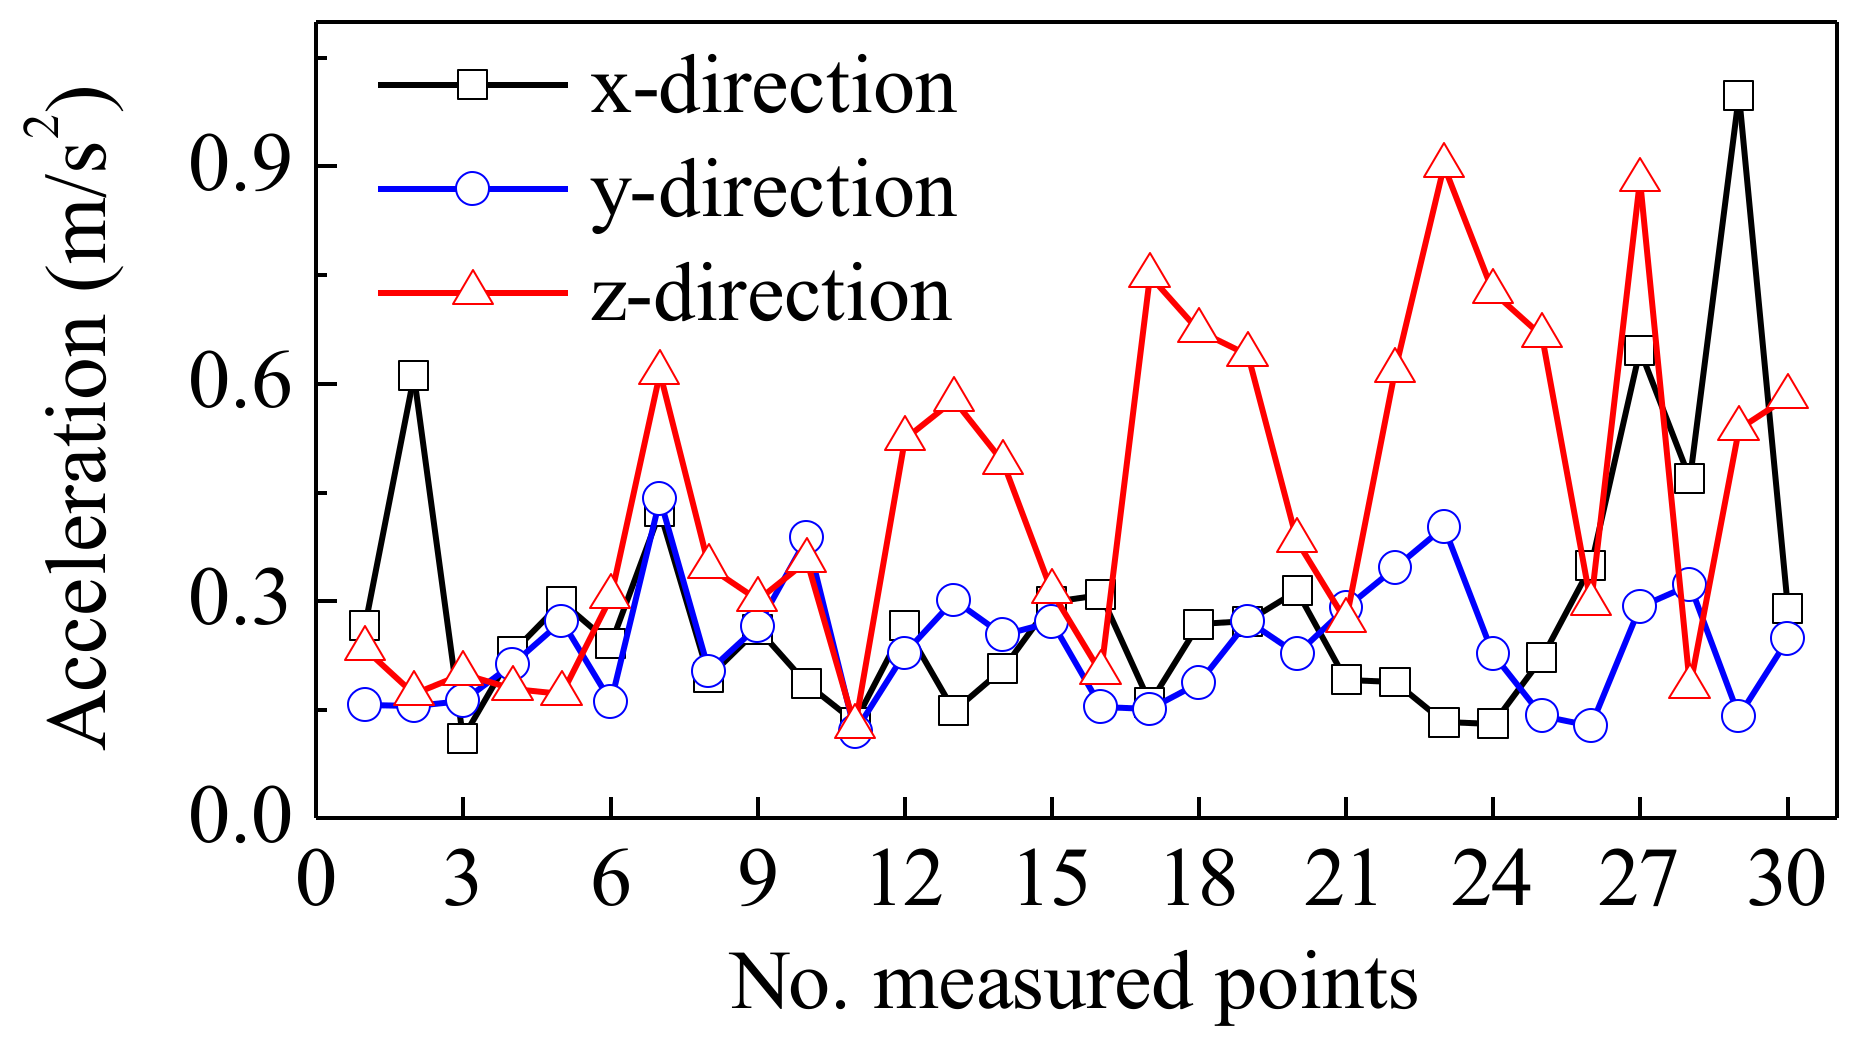
With the help of a voltage regulator, the current of a high-voltage side is applied as 80%, 90%, 100%, and 110% of the rated current. Figure 18 shows the location of measured points, in which #27 and #28 are located on the top surfaces of the lower-voltage side and higher-voltage side for winding phase A, while #29 and #30 are located on the corresponding positions of winding phase B. Meanwhile, Figure 19 compares accelerations of the measured points in each direction. Coil phase C includes points #1–#10, and #2 and #7 are located on the upper parts. They show maximum vibration. For coil phase B, including points #11–#20, the z-direction vibration is higher than in the other two directions. Meanwhile, vibrations (#12–#15 and #17–#20) decrease from top to bottom, matching well with the simulation results. The cushion blocks (#1, #6, #11, and #16) show smaller vibration values. Because of the layered rectangular structure of the low-voltage coil, it (#27 and #29) shows larger vibration values than the higher-voltage coil (#28 and #30). For the top surface of clamps with points #21–#26, the z-direction vibrations are more serious and bigger than the coil vibrations. Meanwhile, the x-direction vibration is smaller than the coil, while the y-direction vibration is close to the coil. It is also shown that the core vibration under the short-circuit condition is much smaller than that in the no-load condition, whereas the coil vibration under the short-circuit condition is bigger than that of the no-load condition.
Figure 18.
Measured point distributions of short-circuit vibration.
Figure 19.
Acceleration distribution under rated current.
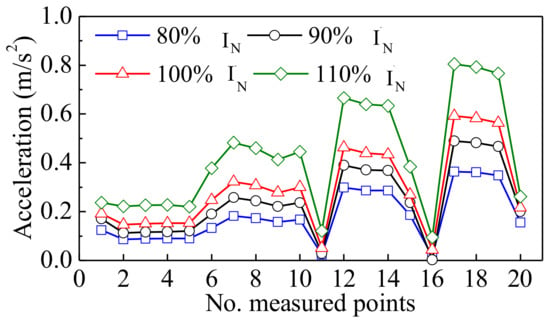
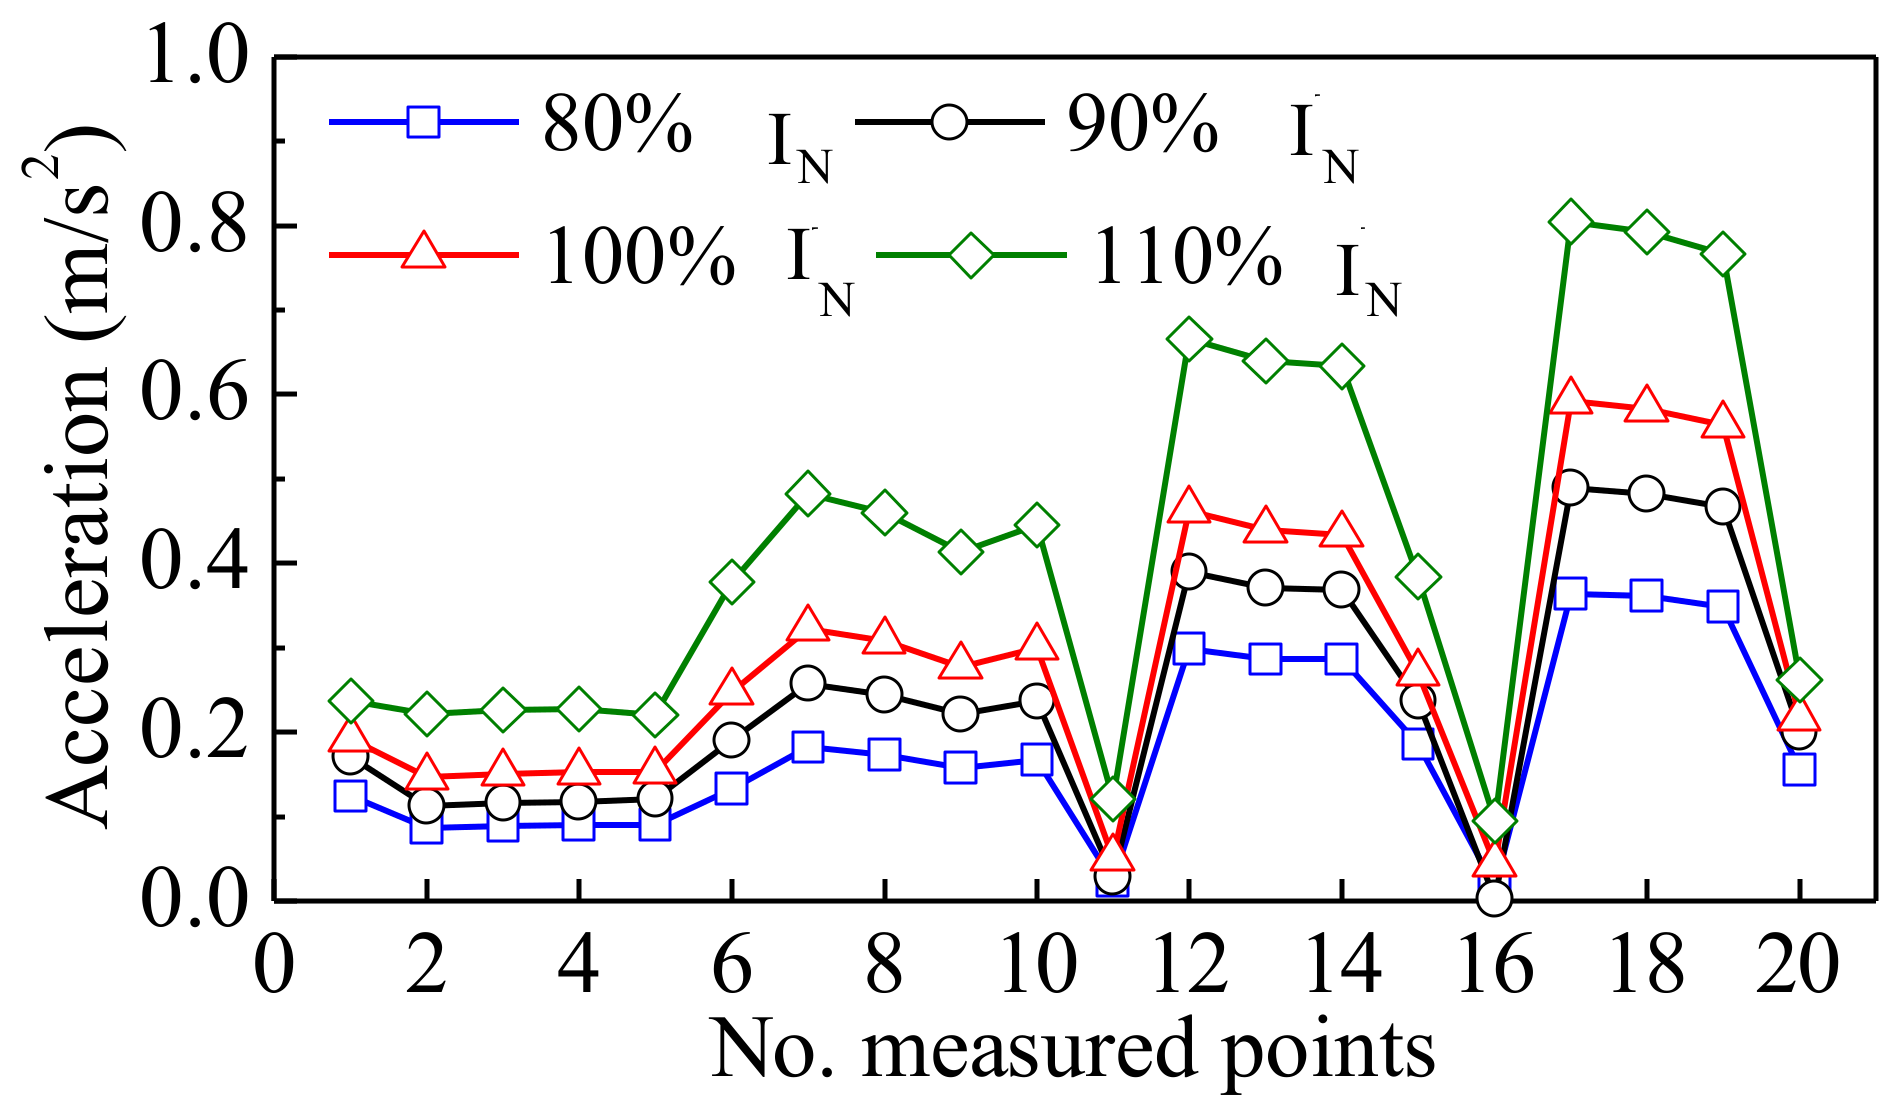
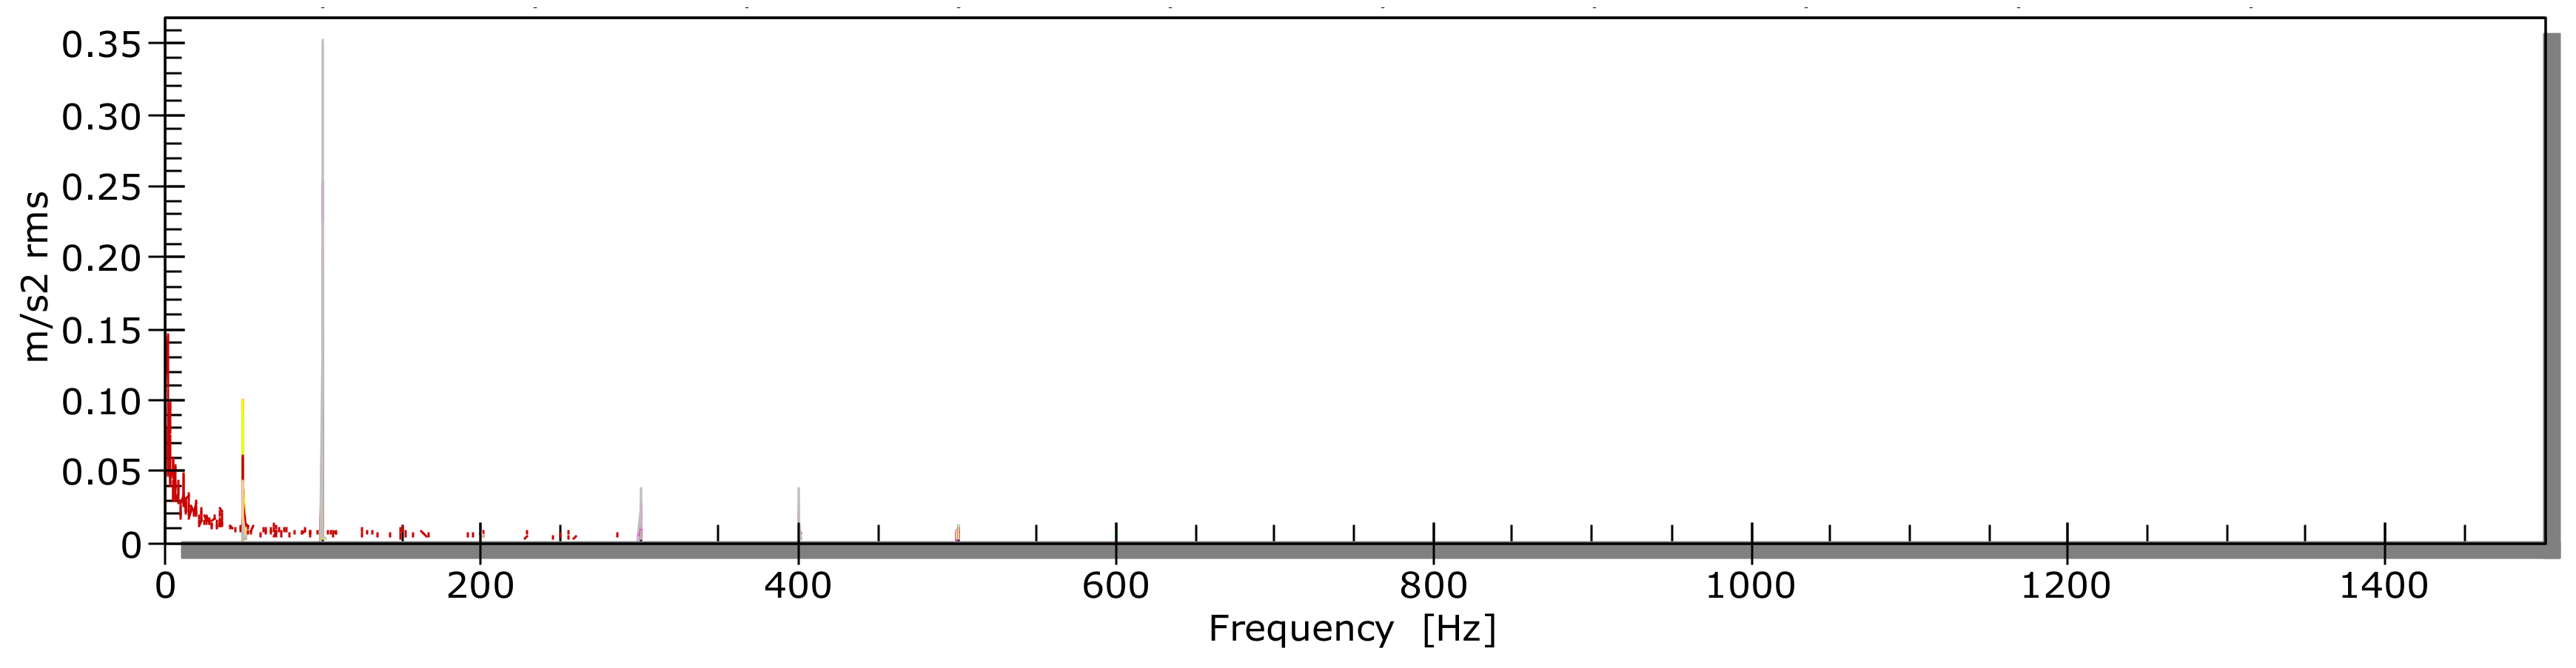
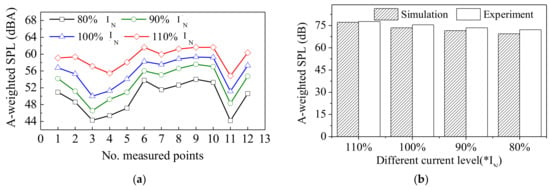
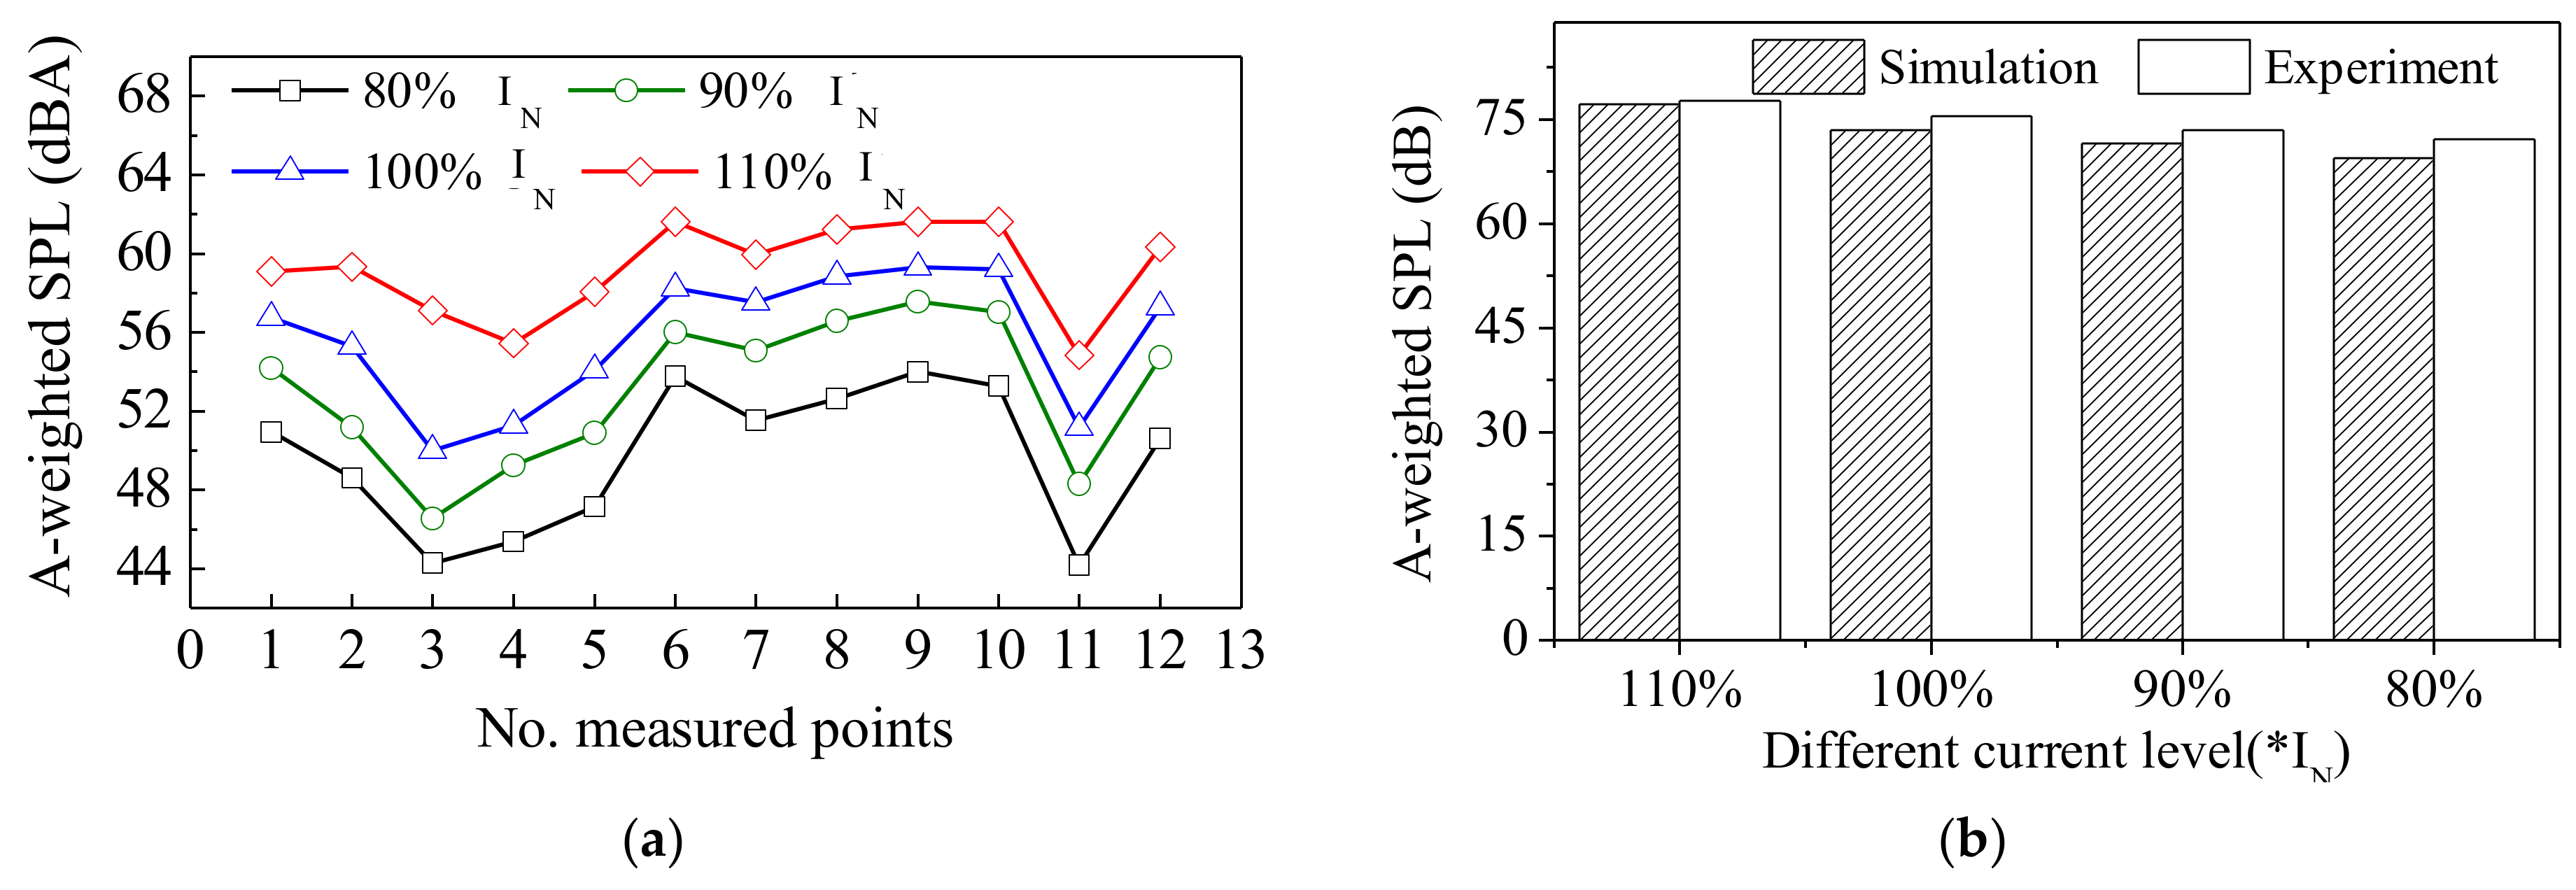
The spectrum analysis is applied to coil vibration. Figure 20 shows the vibration at the fundamental frequency. The results illustrate that the fundamental component of vibration acceleration increases with the rise in current, and the cushion block (#11, #16 and #20) can reduce the vibration. The vibration frequency spectrum in Figure 21 shows that coil vibration mainly concentrates at 50 Hz, 100 Hz, and 400 Hz. Accordingly, Figure 22a demonstrates that the noise of each measured point is proportional to the load current. In Figure 22b, the digits of lateral axis represent times of rated current IN. It also shows that the corresponding absolute errors of average equivalent A-weighted SPL between simulation and experiment are 0.45 dB, 2.01 dB, 1.94 dB, and 2.71 dB, respectively.
Figure 20.
Vibration acceleration at fundamental frequency.
Figure 21.
Spectrum analysis of z-direction vibration for coil (phase C).
Figure 22.
Comparison of A-weighted SPL under different load conditions. (a) ASPL at each point; (b) Average equivalent SPL.
4. Vibracoustic Characteristics Improvement of Transformer
4.1. Vibration Reduction of Core
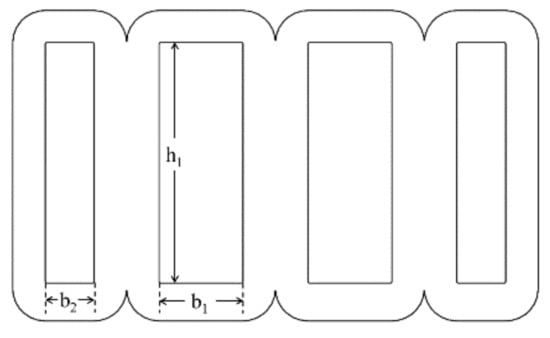
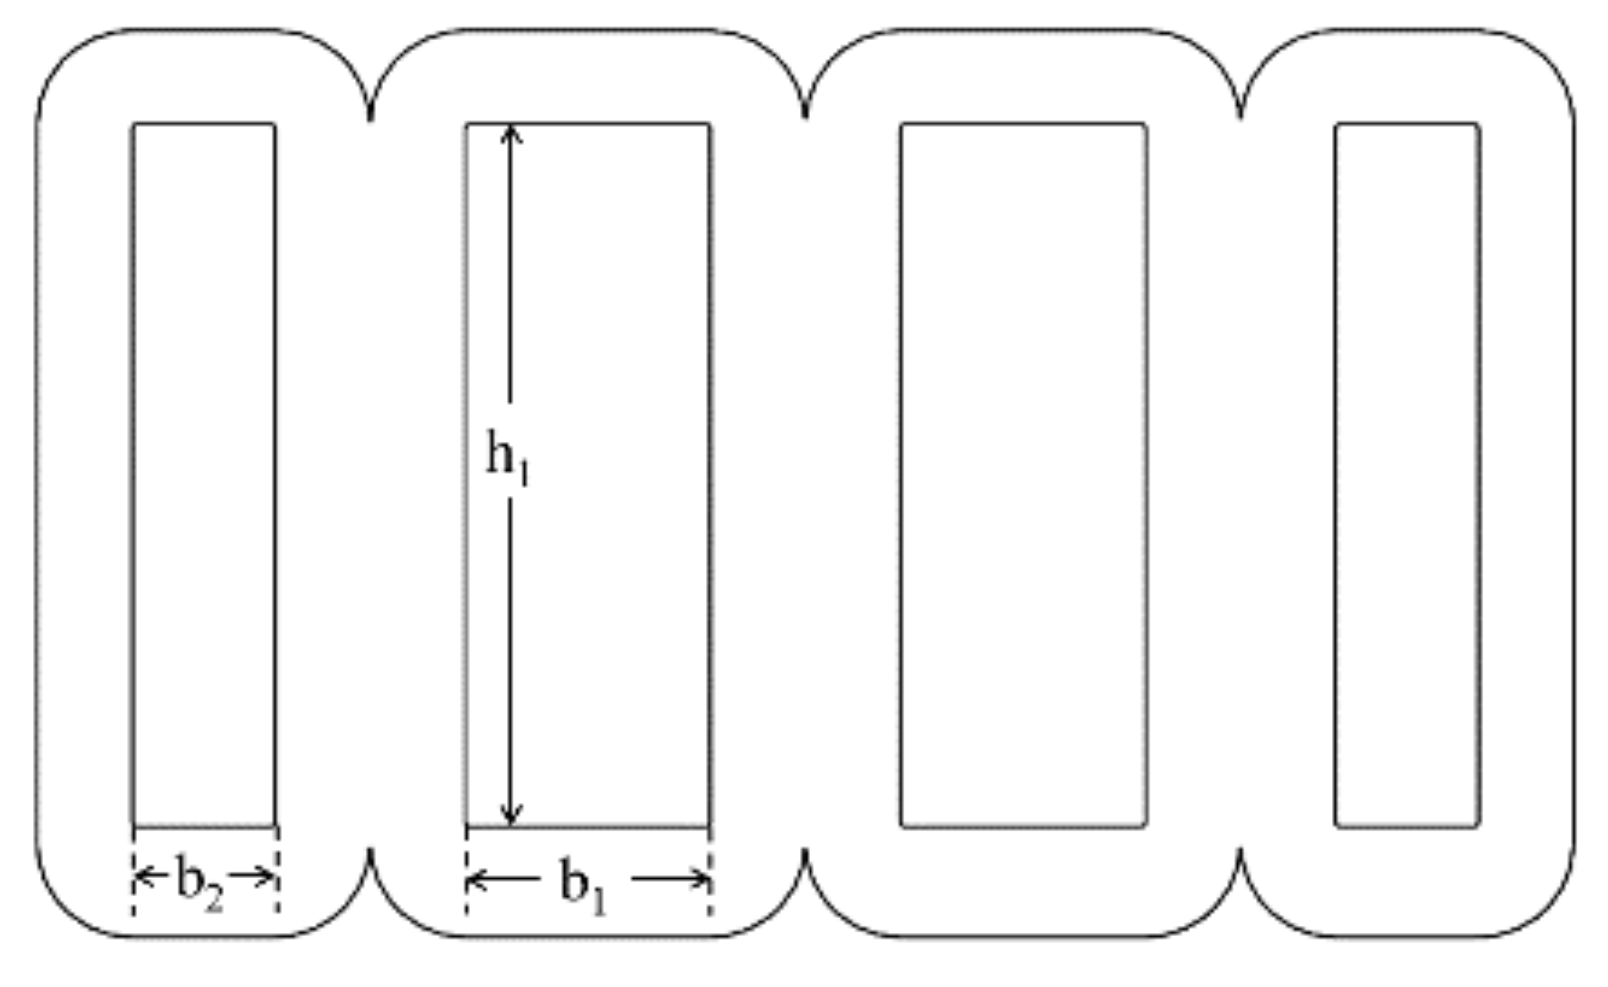
The analysis considers the height of core window h1 and the width ratio of core window k1 = b2/b1 as variables defined in Figure 23 to analyze the noise under the range of 0.85 ≤ h1 ≤ 0.87 and 0.58 ≤ k1 ≤ 0.80. Table 2 shows that the core noise can be reduced by increasing core parameters h1 and k1. At the same time, the whole variation of ASPL is around 2 dB–3 dB.
Figure 23.
Variable definition of core.
Table 2.
Result of ASPL (dB) under different cases.
4.2. Vibration Reduction of Winding
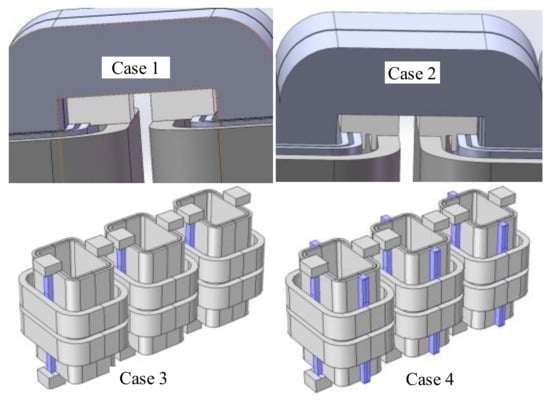
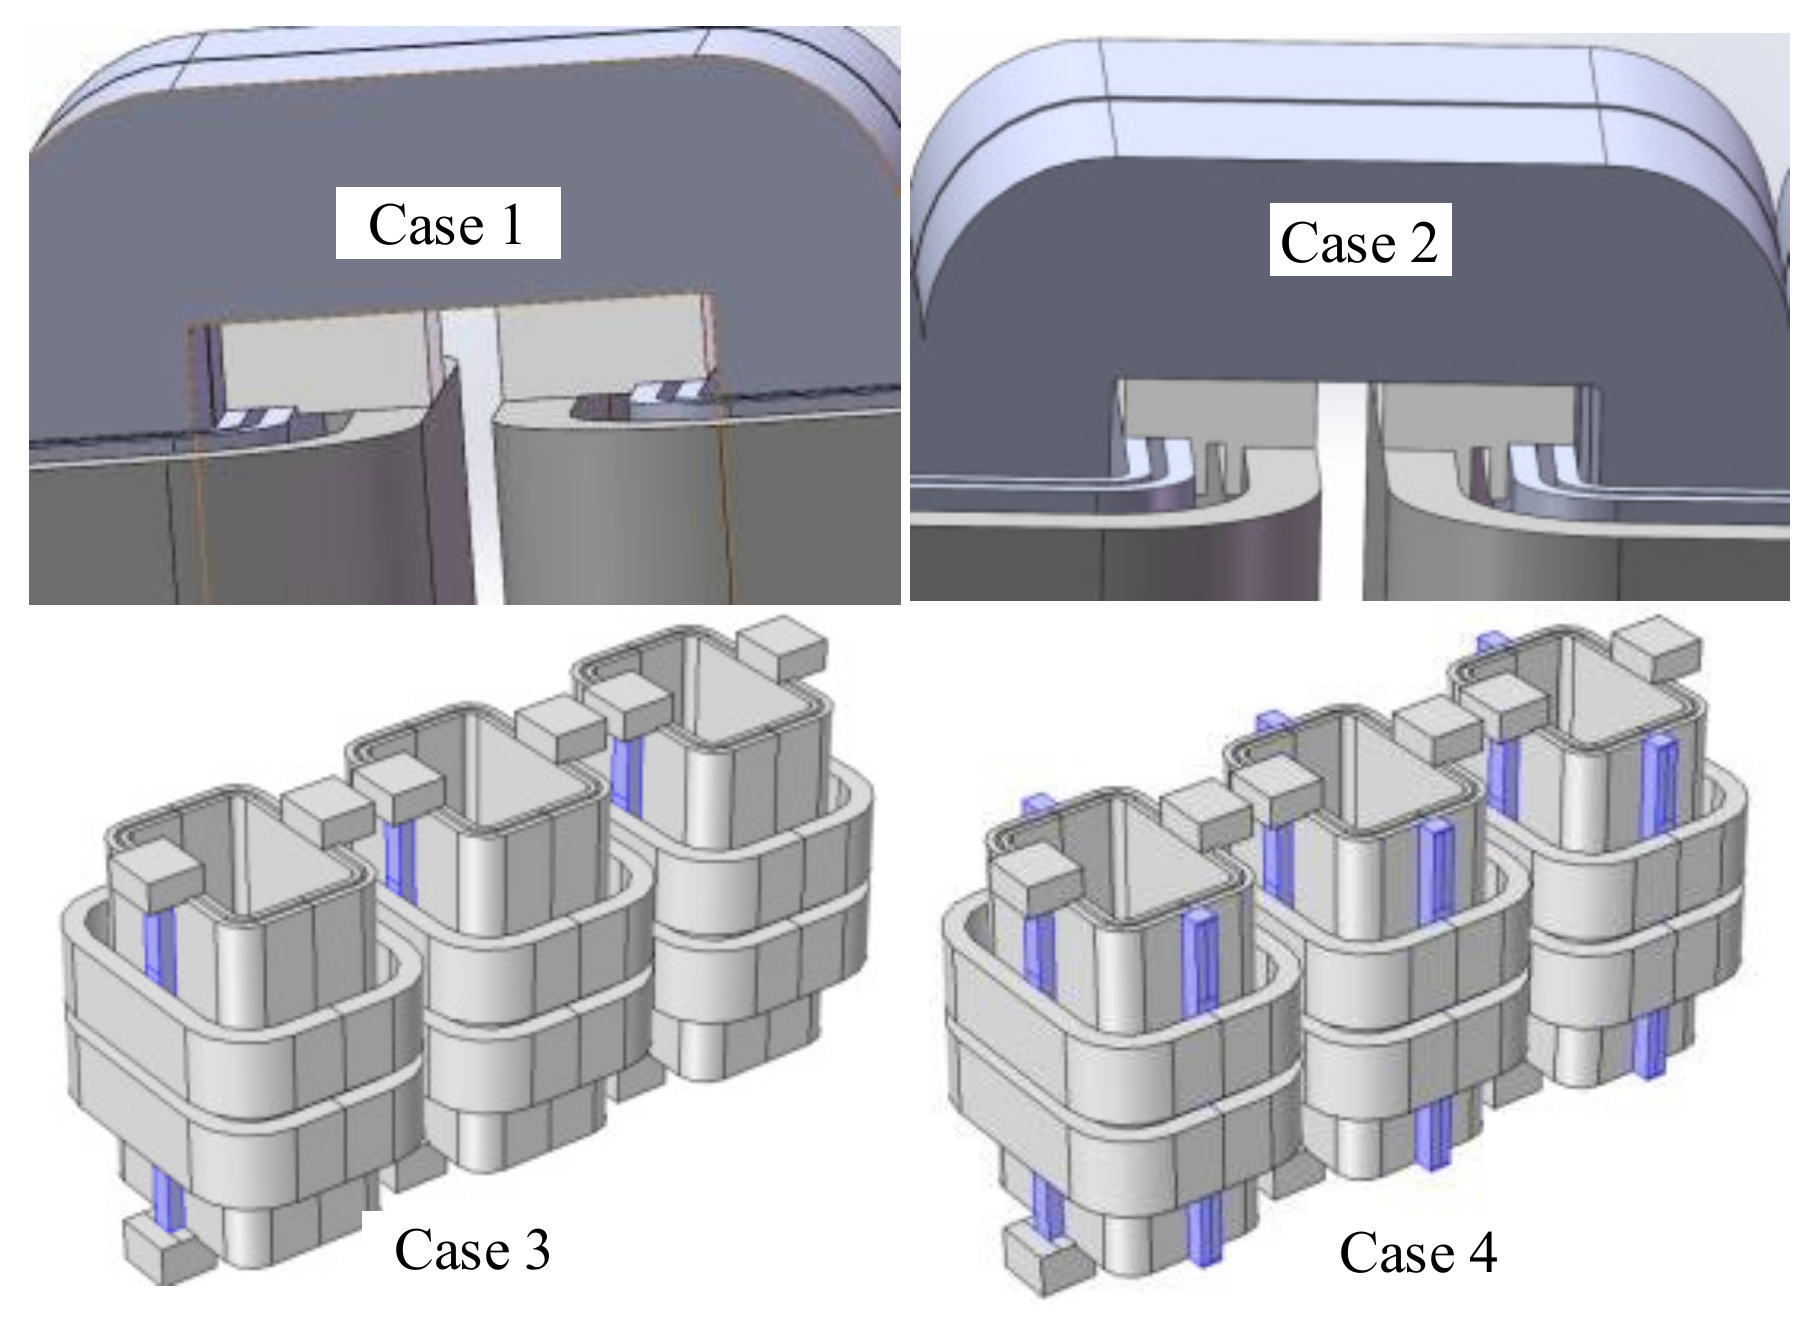
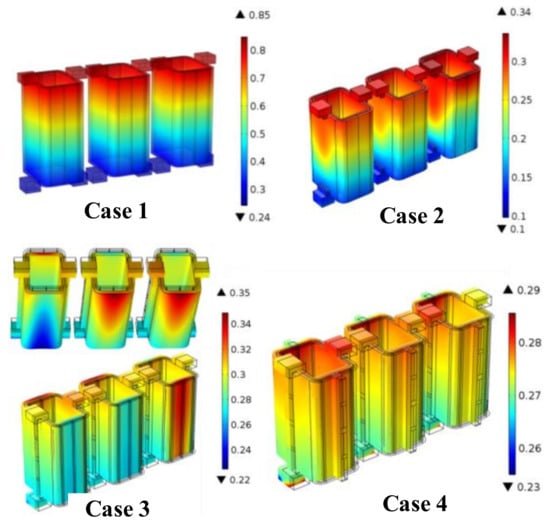
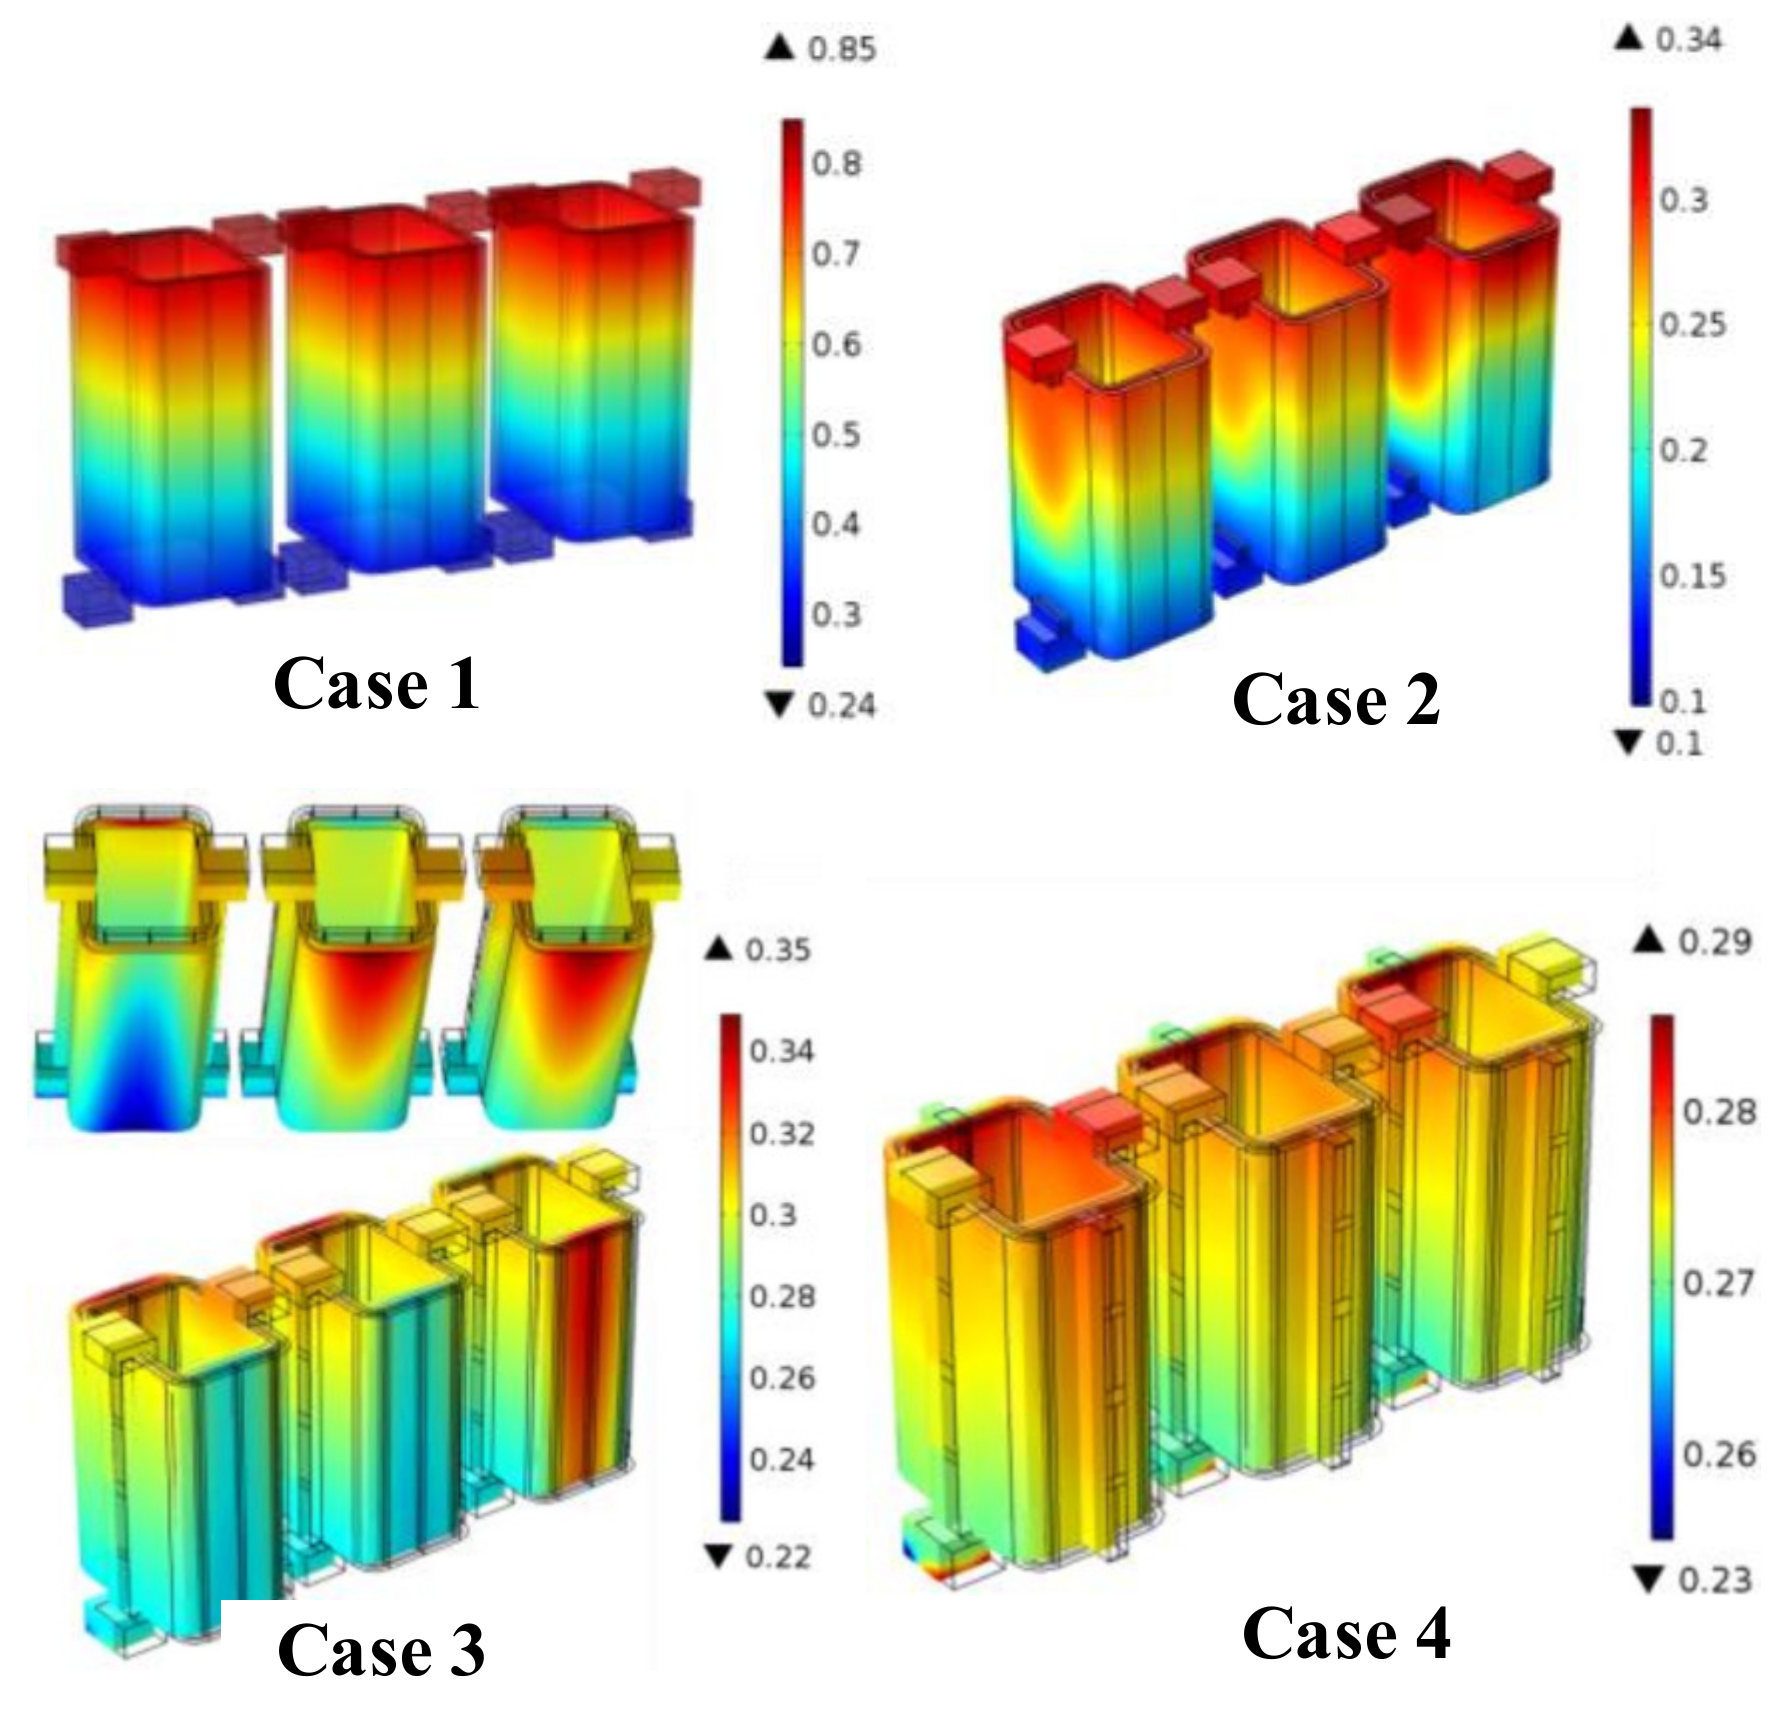
The aforementioned simulation and experiment demonstrate that the coil vibration results from the electromagnetic force. Meanwhile, they also show that the current density and the leakage magnetic field influence electromagnetic force. The rectangular coil of an amorphous alloy transformer can aggravate vibration. Figure 24 suggests three methods of adding brackets between high-voltage and low-voltage coils to fixture the low-voltage coil and reduce vibration. Case 1 adds a normal cushion block, which is taken as a reference for comparison. Meanwhile, Case 2 applies a special cushion block, whereas Case 3 adds supporters to the long side of the rectangular coil. Lastly, Case 4 adds supporters all around the coil.
Figure 24.
Different methods of vibration reduction in coil.
After simulation, Figure 25 and Table 3 compare the vibration acceleration distribution. The comparison finds that Case 4 can result in uniform acceleration distribution with lower amplitude by 0.29 m/s2. Therefore, supporters can enable a more uniform distribution of coil electromagnetic force than the other methods.
Figure 25.
Acceleration comparison of different methods.
Table 3.
Comparison of maximum acceleration.
5. Conclusions
In summary, this paper investigated the vibroacoustic characteristics of a 10 kV/400 V, 1000 kVA amorphous alloy distribution transformer under no-load and load conditions through simulations and experiments. Overall, the conclusions are obtained as follows:
- (1)
- Compared with the traditional field-circuit coupling method, the new field-circuit combination method can effectively improve the solution efficiency of an electromagnetic field.
- (2)
- Under the no-load condition, the X- and Z-directions of the amorphous alloy transformer show serious vibration compared to the Y-direction. The results demonstrate that the core vibration frequencies mainly concentrate on 100 Hz, 200 Hz, 300 Hz, and 400 Hz.
- (3)
- When the transformer works at the rated load condition, the vibration of the low-voltage coil is higher than the high-voltage coil. At the same time, the Z-direction of coil B demonstrates higher vibration values which gradually reduce from the upper to the lower part. Meanwhile, the cushion block functions as a vibration suppressor. Accordingly, the load core vibration is much smaller than the no-load core vibration, while the load coil vibration is much bigger than the no-load coil vibration. This acoustic vibration characteristic is very different from the traditional silicon steel transformer.
- (4)
- In the rated, no-load condition, the noise is around 67.3 dB, and the spectrum focuses on 50 Hz–600 Hz. Meanwhile, for the rated load condition, noise is 75.55 dB, and its spectrum focuses on 100 Hz, 200 Hz, and 300 Hz.
Overall, this paper provides an essential basis and direction to explore the method of vibration reduction and noise reduction. It also proves that the multi-physical field coupling analysis method can provide reliable noise prediction for the optimal design stage of a transformer.
Author Contributions
Conceptualization, Z.L. and D.Z.; methodology, Z.L.; software, Z.L.; experiment design, D.Z. and D.C.; validation, L.Z., B.W., M.J. and D.Y.; writing—original draft preparation, Z.L.; writing—review and editing, D.Z. All authors have read and agreed to the published version of the manuscript.
Funding
This research was funded by the Science and Technology Project of State Grid Corporation of China under grant number SGXJDK00PJJS2100096.
Conflicts of Interest
The authors declare no conflict of interest.
References
- Krings, A.; Boglietti, A.; Cavagnio, A.; Sprague, S. Soft magnetic material status and trends in electric machines. IEEE Trans. Ind. Electron. 2017, 64, 2405–2414. [Google Scholar] [CrossRef] [Scilit]
- Yabu, N.; Sugimura, K.; Sonehara, M.; Sato, T. Fabrication and evaluation of composite magnetic core using iron-based amorphous alloy powder with different size distributions. IEEE Trans. Magn. 2018, 54, 2801605. [Google Scholar] [CrossRef] [Scilit]
- Zhang, Z.; Liu, L.; Li, Z.; Pan, J. Analysis of the economic benefits to new energy-saving distribution transformer. In Proceedings of the 2008 China International Conference on Electricity Distribution (CICED), Guangzhou, China, 10–13 December 2008. [Google Scholar] [CrossRef] [Scilit]
- Mizuta, T.; Tani, Y.; Fujiwara, K. Magnetic property of amorphous magnetic thin ribbon and its laminated bulk under tensile and compressive stresses. IEEE Trans. Magn. 2018, 54, 6001005. [Google Scholar] [CrossRef] [Scilit]
- Lu, Y.C.; Li, W.; Wu, P.; Wei, C. Comprehensive evaluation of energy-saving amorphous alloy transformer in distribution grid. Adv. Mat. Res. 2014, 953, 900–906. [Google Scholar] [CrossRef] [Scilit]
- Zhang, F.; Ji, S.; Shi, Y.; Zhan, C.; Zhu, L. Investigation on vibration source and transmission characteristics in power transformers. Appl. Acoust. 2019, 151, 99–112. [Google Scholar] [CrossRef] [Scilit]
- Zhang, Y.; Guo, J.; Fang, S. Research of the amorphous alloy transformer with runway shape winding based on the magnetic-vibration-noise coupling calculation method. In Proceedings of the 20th International Conference on Electrical Machines and Systems (ICEMS), Sydney, NSW, Australia, 11–14 August 2017. [Google Scholar] [CrossRef] [Scilit]
- Zhang, P.; Li, L.; Cheng, Z.; Tian, C.; Han, Y. Study on vibration of iron core of transformer and reactor based on maxwell stress and anisotropic magnetostriction. IEEE Trans. Magn. 2019, 55, 9400205. [Google Scholar] [CrossRef] [Scilit]
- Tanzer, T.; Pregartner, H.; Riedenbauer, M.; Labinsky, R.; Witlatschil, M.; Muetze, A.; Krischan, K. Magnetostriction of electrical steel and its relation to the no-load noise of power transformer. IEEE Trans. Ind. Appl. 2018, 54, 4306–4314. [Google Scholar] [CrossRef] [Scilit]
- He, J.; Yu, Z.; Zeng, R.; Zhang, B. Vibration and audible noise characteristics of AC transformer caused by HVDC system under monopole operation. IEEE Trans. Power Deliv. 2012, 27, 1835–1842. [Google Scholar] [CrossRef] [Scilit]
- Wang, Z.; Zhang, Y.; Zhang, D.; Xie, D.; Koh, C.-S.; Mohammed, O.A. Modeling of magnetostrictive property of electrical steel sheet under vectorial excitation. IEEE Trans. Magn. 2019, 55, 7300304. [Google Scholar] [CrossRef] [Scilit]
- Krupinski, R.; Kornatowski, E. The use of generalized Gaussian distribution in vibroacoustic detection of power transformer core damage. Energies 2020, 13, 2525. [Google Scholar] [CrossRef] [Scilit]
- Du, B.; Liu, D. Dynamic behavior of magnetostriction-induced vibration and noise of amorphous alloy cores. IEEE Trans. Magn. 2015, 51, 7208708. [Google Scholar] [CrossRef] [Scilit]
- Takahashi, K.; Azuma, D.; Hasegawa, R. Acoustic and soft magnetic properties in amorphous alloy-based distribution transformer cores. IEEE Trans. Magn. 2013, 49, 4001–4004. [Google Scholar] [CrossRef] [Scilit]
- Chang, Y.; Hsu, C.; Tseng, C. Magnetic properties improvement of amorphous cores using newly developed step-lap joints. IEEE Trans. Magn. 2010, 46, 1791–1794. [Google Scholar] [CrossRef] [Scilit]
- Bouayed, K.; Mebarek, L.; Lanfranchi, V.; Chazot, J.-D.; Marechal, R.; Hamdi, M.-A. Noise and vibration of a power transformer under an electrical excitation. Appl. Acoust. 2017, 128, 64–70. [Google Scholar] [CrossRef] [Scilit]
- Chang, W.; Kuo, C. A novel excitation approach for power transformer simulation based on finite element analysis. Energies 2021, 11, 10334. [Google Scholar] [CrossRef] [Scilit]
- Chen, D.; Hou, B.; Feng, Z.; Bai, B. Study of magnetostriction influence of electrical sheet steel under different DC biases. IEEE Trans. Magn. 2019, 55, 2001305. [Google Scholar] [CrossRef] [Scilit]
- Hong, K.; Jin, M.; Huang, H. Transformer winding fault diagnosis using vibration image and deep learning. IEEE Trans. Power Deliv. 2021, 36, 676–685. [Google Scholar] [CrossRef] [Scilit]
- Cao, C.; Xu, B.; Li, X. Monitoring method on loosened state and deformational fault of transformer winding based on vibration and reactance information. IEEE Access 2020, 8, 215479–215492. [Google Scholar] [CrossRef] [Scilit]
- Zhou, H.; Hong, K.; Huang, H.; Zhou, J. Transformer winding fault detection by vibration analysis methods. Appl. Acoust. 2016, 114, 136–146. [Google Scholar] [CrossRef] [Scilit]
- Zhang, Z.; Wu, Y.; Zhang, R.; Jiang, P.; Liu, G.; Ahmed, S.; Dong, Z. Novel transformer fault identification optimization method based on mathematical statistics. Energies 2019, 7, 288. [Google Scholar] [CrossRef] [Scilit]
- Zou, L.; Guo, Y.; Liu, H.; Zhang, L.; Zhao, T. A method of abnormal states detection based on adaptive extraction of transformer vibro-acoustic signals. Energies 2017, 10, 2076. [Google Scholar] [CrossRef] [Scilit]
- Emission Standard for Community Noise: GB 22337-2008; China Environmental Standards Press: Beijing, China, 2008. (In Chinese)
- Girgis, R.; Bernesjo, M. Contributions to differences between on-site and factory-measured noise levels of power transformers. IEEE Trans. Power Deliv. 2015, 30, 82–88. [Google Scholar] [CrossRef] [Scilit]
- Fan, X.; Li, L.; He, H.; Zhang, D.; Ren, Z.; Zhang, Y. Environmental noise pollution control of substation by passive vibration and acoustic reduction strategies. Appl. Acoust. 2020, 165, 107305. [Google Scholar] [CrossRef] [Scilit]
- Girgis, R.S.; Bernesjo, M.S.; Thomas, S.; Anger, J.; Chu, D.; Moore, H.R. Development of ultra-low-noise transformer technology. IEEE Trans. Power Deliv. 2011, 26, 228–234. [Google Scholar] [CrossRef] [Scilit]
- Peng, S.; Juergen, B. Influence of material properties and geometric shape of magnetic cores on acoustic noise emission of medium-frequency transformers. IEEE Trans. Power Electron. 2017, 32, 7916–7931. [Google Scholar] [CrossRef] [Scilit]
- Shao, J.; Xu, C.; Cheng, K.W.E. Core stress analysis of amorphous alloy transformer for rail transit under different working conditions. Energies 2021, 14, 164. [Google Scholar] [CrossRef] [Scilit]

Publisher’s Note: MDPI stays neutral with regard to jurisdictional claims in published maps and institutional affiliations. |
© 2022 by the authors. Licensee MDPI, Basel, Switzerland. This article is an open access article distributed under the terms and conditions of the Creative Commons Attribution (CC BY) license (https://creativecommons.org/licenses/by/4.0/).