


Abstract
Pressure platforms offer the potential to measure and record electronic footprints rapidly; however, the accuracy of geometric indexes derived from these prints has not been investigated. A comparison of conventional ink footprints with simultaneously acquired electronic prints revealed significant differences in several geometric indexes. The contact area was consistently underestimated by the electronic prints and resulted in a significant change in the arch index. The long plantar angle was poorly correlated between techniques. This study demonstrated that electronic footprints, derived from a pressure platform, are not representative of the equivalent ink footprints and, consequently, should not be interpreted with reference to literature on conventional footprints.
A variety of measures have been used as the basis for the classification of foot types. The diversity of methods and classification systems that have been reported is in itself an indication that a single, simple, objective, and quantitative measure remains elusive. Footprinting techniques [1-4] are among the most common of these methods. Footprints are simple to obtain, are inexpensive, have a strong visual impact, and can be retained as a permanent record for future comparisons. Each print can be geometrically charted to determine a variety of parameters such as the arch index, [5] the Chippaux-Smirak index, [6] and the footprint angle. [6] These indexes have been developed on the premise that the footprint reflects the medial longitudinal arch height and that there is some relationship between this and foot function.
Recent opinions regarding the usefulness of footprint charting differ. Hawes et al [7] were unable to predict arch height from footprints obtained during stance and concluded that the indexes were indicators of footprint shape only. McPoil and Cornwall [8] drew similar conclusions using dynamically obtained footprints. In contrast, methodologically similar studies [9,10] have suggested that the arch index is useful as an indirect measurement of arch height. However, the populations sampled for these studies were clearly different, and this could partially account for the contrary findings. Clinical studies that use large samples may be one approach to resolving this controversy. A disadvantage is that such studies would be labor-intensive, since the traditional method of acquiring ink footprints can be both messy and time-consuming. However, pressure platforms overcome these disadvantages, enabling electronic prints to be collected cleanly and quickly. [11] Since digital imaging offers the potential for automatic analysis, this approach gives footprinting the appeal of other medical imaging techniques, such as radiography.
In a recent study, using footprints acquired from a pressure platform, Mathieson et al [12] reported that the intrarater reliability of the geometric analysis of electronic footprints was excellent when the same print was evaluated on two occasions. In addition, when different prints of the same foot were evaluated, most parameters, with the exception of the footprint angle, were acceptably consistent. Although the methods used to derive the footprint indexes were found to be reliable, no reports have compared measurements made from ink and electronic footprints to determine the relative accuracy of the area and angular measurements of the electronic print. Chu et al [11] raised the issue of the accuracy of electronic footprints and speculated that the boundary of an electronic footprint may be poorly delineated and irregular and that this might be a source of error. Some pressure platforms, such as the one used by Mathieson et al, [12] produce images that have coarse, tessellated borders, and the linear, angular, and area measurements obtained from them may differ from an ink print of the same foot.
This study compared simultaneously obtained electronic and ink footprints to determine the relative accuracy of the area and angular measurements of the electronic print. It was hypothesized that geometric indexes, such as contact area, arch index, and long plantar angle, derived from ink footprints would differ from those obtained from their electronic equivalents.
Subjects and Methods
Subjects
A convenience sample of 16 asymptomatic adults was recruited from a university student population. The sample was composed of eight females and eight males with a mean (±SD) age of 22.1 ± 2.6 years, a mean body weight of 62.5 ± 5.4 kg, and a mean height of 1.64 ± 0.08 m. Subjects were screened for a history of neuromuscular disease and lower-limb injury and demonstrated no clinical signs of foot pathology. Informed consent was obtained from all subjects following both a verbal and a written explanation of the project.
Equipment
A Musgrave Footprint (Musgrave Systems Ltd, Wrexham, North Wales) foot pressure platform mounted flush with the surrounding surface was used to collect electronic footprint data. The pressure platform incorporated 2,048 sensor elements arranged in a 64 × 32 array. Each element had an area of 0.3 cm2, resulting in an active surface of 38.5 × 16 cm. Data were sampled for 3 seconds at a rate of 50 Hz. The surface of the platform was covered with a 30 × 42-cm sheet of white paper, allowing ink and electronic footprints to be obtained simultaneously.
Area measurements derived from ink footprints were measured to the nearest 0.1 cm2 by means of a calibrated, cartographic planimeter. The precision of the planimeter was evaluated with a series of circular outlines, which indicated that the planimeter had an error of less than 1%.
Footprint Acquisition
Footprints were obtained by means of a modification of the static footprint method outlined by Hawes et al. [7] Briefly, subjects were required to step from a foam rubber pad impregnated with water-soluble ink onto a sheet of paper overlying the pressure platform. Simultaneous ink and electronic footprints were recorded from the right foot of each subject while the left foot was slightly elevated above the supporting surface. Foot contact on the pressure platform automatically triggered data collection. Once scanning was complete, subjects placed their left foot back on the floor and stepped forward. The ink footprint was retrieved, and the border of the image was immediately outlined in pencil to ensure that any future distortion or spread of the ink could be easily identified. This method facilitated the simultaneous acquisition of an electronic and ink footprint. If during any trial the subject was observed to sway excessively, or if the ink footprint was smeared, then that trial was discarded. [11] Three trials were obtained for each subject.
In total, 96 (16 subjects × 3 trials × 2 conditions) footprints were analyzed. Three geometric parameters were determined for each footprint: the foot contact area, the arch index, and the long plantar angle. A single investigator (S.R.U.) assessed all geometric parameters.
Assessment of Foot Contact Area
In accordance with Cavanagh and Rodgers, [5] the area associated with the toes of both ink and electronic footprints was excluded from further analysis. The areas of the heel, midfoot, and metatarsal regions were subsequently grouped to form a single area referred to as the foot contact area (Fig. 1A).
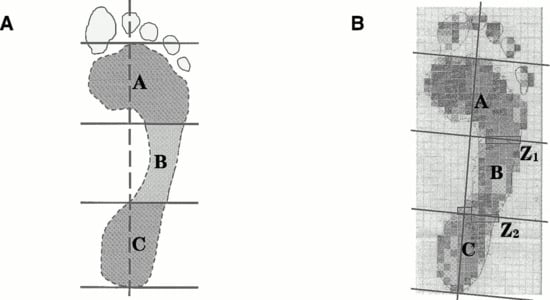
Figure 1.
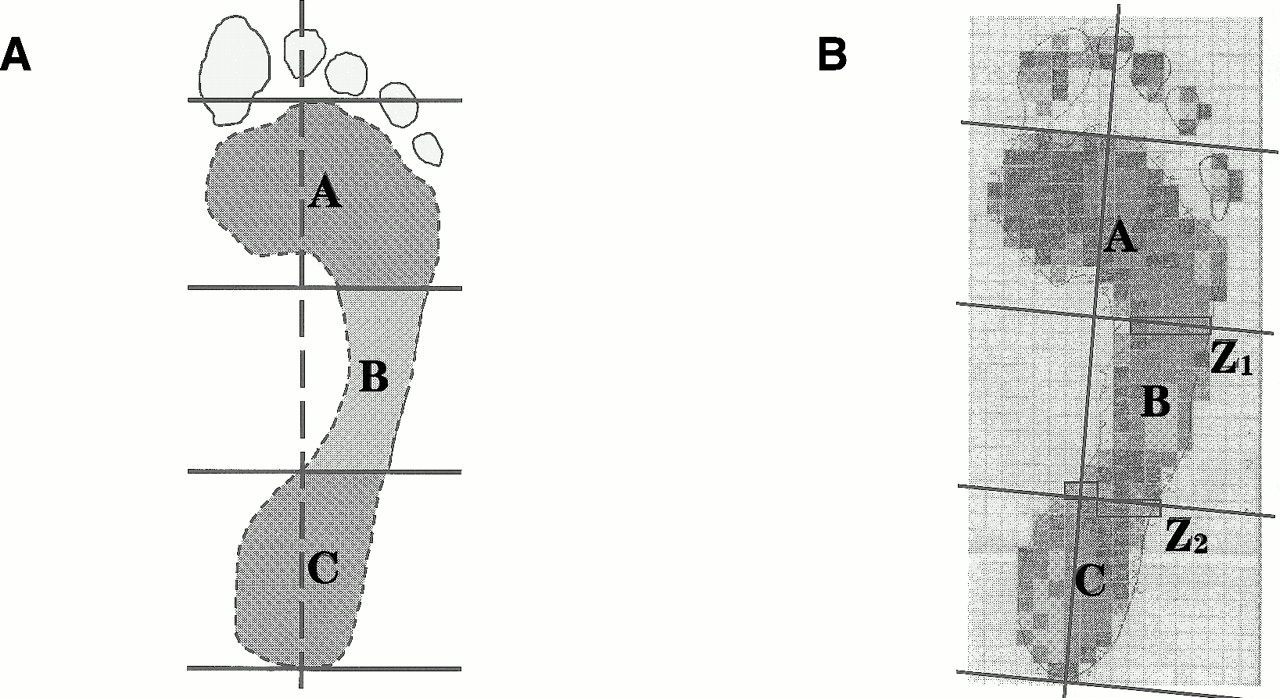
Footprint charting methods for the ink (panel A) and electronic (panel B) images. The foot contact area excludes the toes and is indicated by the hashed line in panel A. The ink (AII) and electronic (AIE) arch indexes were calculated as AI = B/(A + B + C), and the toes were excluded in each case. In the electronic print, the sensor elements (rectangular boxes) that cross the boundaries at Z1 and Z2 influence the determination of the magnitude of areas A, B, and C, but have no effect on the total area (A + B + C).
Two procedures were used to obtain estimates of foot contact area: planimetric and electronic. The planimeter was used to determine the foot contact area of the ink footprints by tracing the precise outline of the print, excluding the toe region. In contrast, the electronic estimate of the foot contact area had to be determined by counting the appropriate sensor elements observed in the maximum pressure print. The contact area was then calculated by multiplying the area of a single sensor (0.3 cm2) by the number of activated sensors. The software did not allow the appropriate automatic calculation of area and could not be used to determine the electronic estimate of the foot contact area.
Arch Index Techniques
The arch index was charted from ink footprints by means of the method described by Cavanagh and Rodgers. [5] Essentially, the long axis of the foot contact area was determined and subdivided into equal thirds. The planimeter was used to measure the central third of the foot contact area as well as the entire foot contact area (Fig. 1A, areas B and A + B + C, respectively). The arch index from the inked print (AII) was calculated as AII = B/(A + B + C).
Similarly, the electronic footprint was subdivided into three zones to facilitate calculation of the arch index obtained electronically. Again, software limitations prevented automatic partitioning, and a manual method was used. In the electronic prints, the border between two adjacent zones usually crossed a number of grid elements (Fig. 1B, at Z1 and Z2). Only a portion (50%) of the area of these transected elements was considered to contribute to the central region. The area of the central region was therefore estimated from the total of the respective whole elements summed with half of the border elements. The overall electronic foot contact area was estimated from the sum of all of the elements in the image excluding the toes. The electronic arch index was defined in the same way as the arch index from the ink print.
Long Plantar Angle
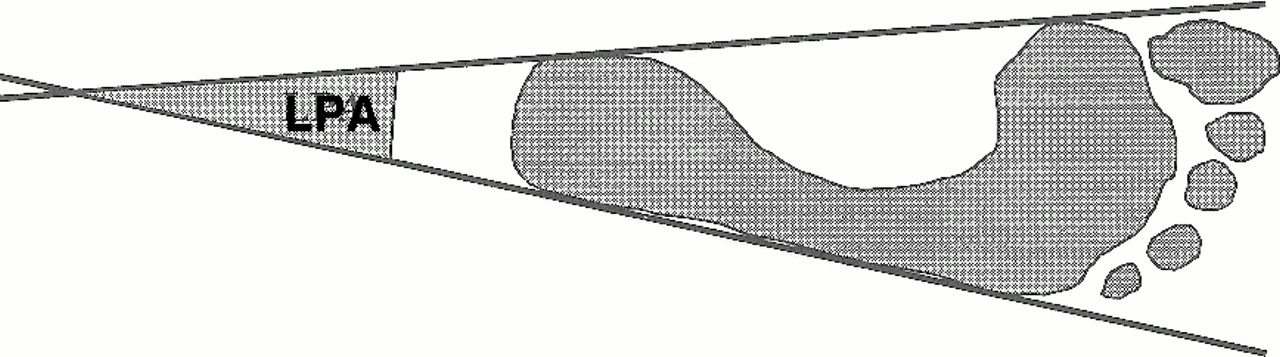
The long plantar angle was defined as the angle formed by extending tangents to the medial and lateral borders of the foot contact area posteriorly to their point of intersection (Fig. 2). Although the long plantar angle is not frequently reported in the literature, it is of interest because its bisection produces a central reference line for footprint analysis [13] and has been incorporated into the software of some pressure platform systems (EMED-SF, Novel GmbH, Munich, Germany). A protractor was used to measure the angle, to the nearest degree, for both the ink and electronic footprints.
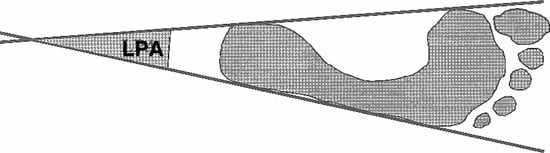
Figure 2.
The long plantar angle (LPA) formed at the point of intersection of the tangents to the medial and lateral borders of the foot contact area.
Statistical Analysis
Descriptive statistics were computed for the foot contact area, arch index, and long plantar angle derived from both electronic and ink footprints. Paired t-tests were used to identify differences between electronic and ink footprints with respect to each geometric parameter. Where appropriate, assumptions of normality were assessed through Kolmogorov-Smirnov goodness-of-fit tests.
Discrepancy scores, which indicate the difference in magnitude between two values, were calculated for the foot contact area by subtracting the electronically derived value from its ink equivalent. Similarly, discrepancy scores were calculated for the arch index and long plantar angle. Pearson product moment correlations were subsequently used to investigate relationships both within geometric parameters and between parameters and their discrepancy scores. Agreement between ink and electronic footprint indexes was assessed by means of the approach outlined by Bland and Altman. [14]
Results
Table 1 presents the descriptive statistics for the foot contact area, arch index, and long plantar angle as derived from both ink and electronic footprints. As Figure 3 demonstrates, the pressure platform significantly underestimated the foot contact area (79.3 ± 8.9 cm2) when compared with the ink footprints (92.4 ± 10.0 cm2) (t = 11.094, P < .001). Similarly, in Figure 4, the arch index derived from the pressure platform (0.220 ± 0.001) was significantly smaller (t = 7.01, P < .001) than that obtained from the ink prints (0.231 ± 0.002). There was, however, no significant difference (t = –0.144, P = .887) between the mean long plantar angle obtained from electronic (18.3° ± 1.1°) and ink footprints (18.3° ± 1.9°).

Table 1.
Descriptive Statistics for the Foot Contact Area, Arch Index, and Long Plantar Angle

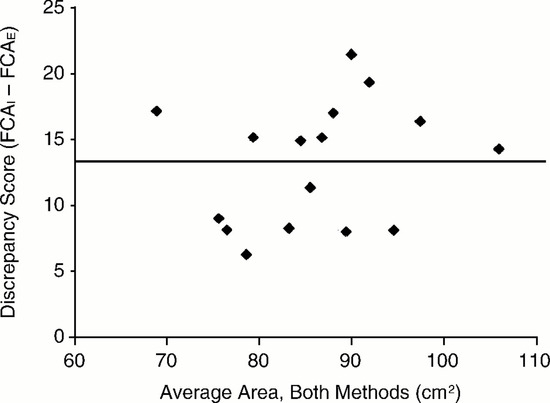
Figure 3.
The differences (discrepancy scores) between the foot contact area (FCA) calculated from ink and electronic footprints. The solid line indicates the average decrease in the foot contact area derived from electronic prints.
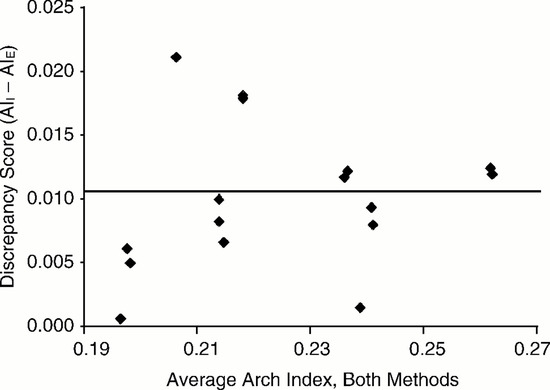
Figure 4.
The differences (discrepancy scores) between the arch indexes calculated from ink (AII) and electronic (AIE) footprints. The solid line indicates the average decrease in arch index derived from electronic prints.
Table 2 demonstrates the correlation matrix for each geometric parameter derived from ink footprints. A significant correlation was observed between the arch index and the long plantar angle (r = 0.74, P < .05). The same geometric parameters derived from electronic footprints, however, were not significantly correlated (Table 3).
Table 2.
Correlation Matrix for Geometric Indexes Derived from Ink Footprints
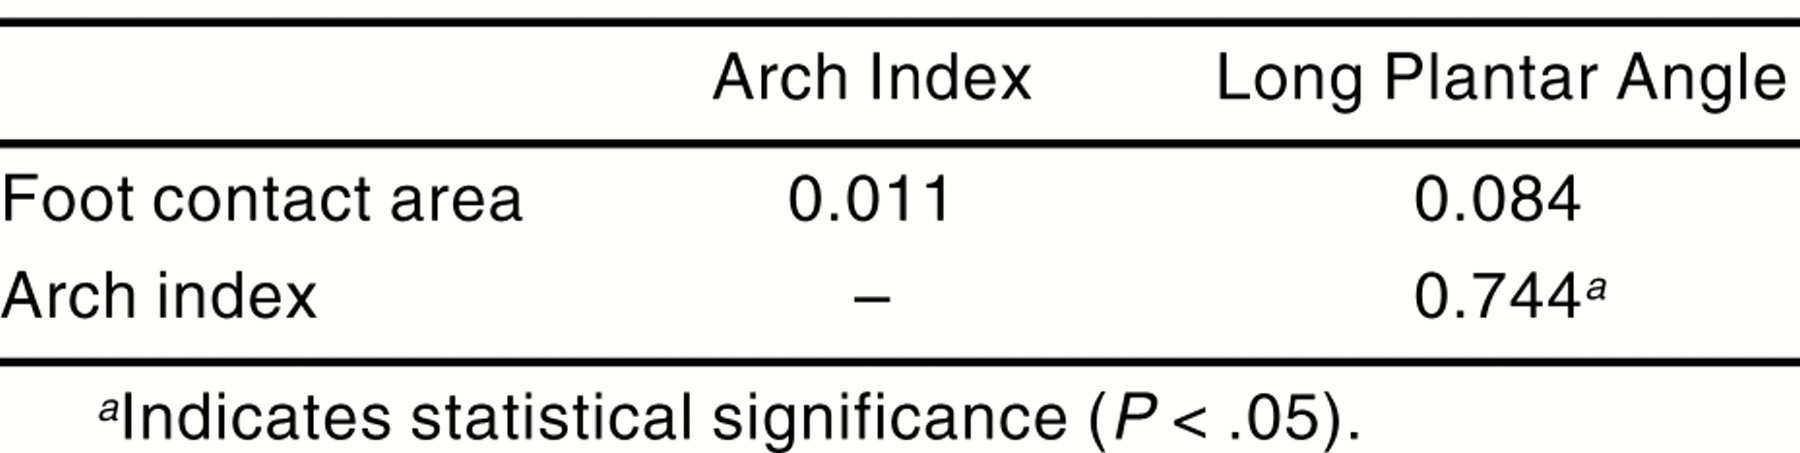
Table 3.
Correlation Matrix for Geometric Indexes Derived from Electronic Footprints

Table 4 demonstrates the correlation matrix for geometric parameters derived from ink and electronic footprints and their respective discrepancy scores. Significant positive correlations were noted between ink and electronic footprints with respect to both foot contact area (r = 0.88, P < .05) and arch index (r = .965, P < .05). The long plantar angle derived from ink footprints, however, was poorly correlated to its electronic equivalent (r = 0.432, P = .95).
Table 4.
Correlation Matrix for Geometric Indexes and Their Discrepancy Scores Derived from Both Ink and Electronic Footprints
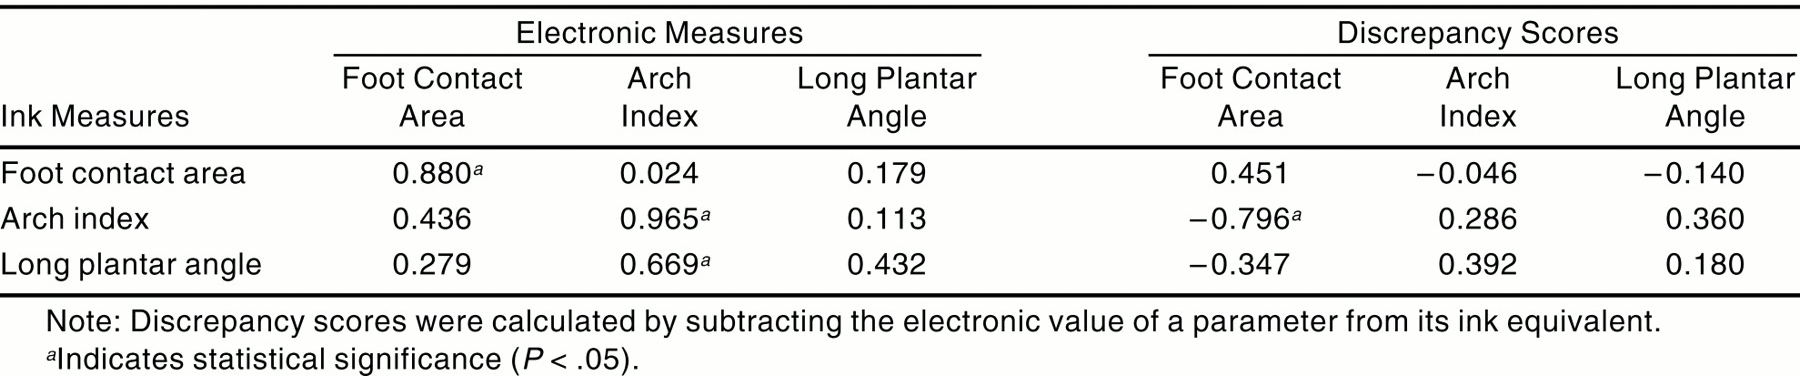
The ink arch index was also negatively correlated to the discrepancy in foot contact area between ink and electronic footprints (r = –0.796, P < .05). Discrepancy scores, however, were not significantly correlated to any other geometric parameter (Table 4).
Discussion
This investigation was undertaken to determine the relative accuracy of the measurements obtained from electronic footprints when compared with simultaneously acquired ink prints. The study revealed that the pressure platform consistently underestimated the contact area of the foot (the electronic was less than the ink foot contact area). An average difference in area of 13.2 cm2, or 14% of the ink print, was found between ink and electronic footprints. While the foot contact areas derived from both techniques were highly correlated, this should not be interpreted as meaning that the measurements are the same (or in agreement). Plotting the results in the manner advocated by Bland and Altman [14] (Fig. 3) makes the differences between the two readily apparent. Moreover, the negative correlation between foot contact area discrepancy scores and the arch index as measured in ink prints suggests that the difference in area between the two techniques is dependent on foot shape, with low arch indexes yielding greater errors in electronic prints. Consequently, the electronic prints could not be regarded as accurate facsimiles of ink prints.
Similarly, electronic prints produced a small but statistically significant reduction (≈5%) in the arch index. A uniform reduction in size of the electronic footprint, reflecting a magnification error, would have had no effect on a ratio parameter, such as the arch index. Consequently, the electronic footprints seem to be distorted by a preferential loss of area from the middle third of the print. Although the electronic arch index may reflect some measurement error, owing to the averaging of grid elements at borders Z1 and Z2 (Fig. 1B), this would be unlikely to account for the bias observed in the distribution of the discrepancy scores (Fig. 4). Since the preferential loss of information from the middle part of the print occurred in a region of relatively low pressure, [15] it may be speculated that sensor threshold sensitivity is an important factor in determining electronic footprint fidelity. [16] If so, then sensors with a low pressure threshold may reproduce an ink footprint with greater accuracy.
Although electronic footprints were found to consistently underestimate both the foot contact area and the arch index compared with ink prints, the mean long plantar angle values did not differ in the two techniques. The long plantar angle derived from electronic footprints, however, did not correlate with the long plantar angle obtained from ink footprints, suggesting that the long plantar angle values are not interchangeable between techniques. Further, the relationship found between the arch index and the long plantar angle for the ink prints (Table 2) does not hold for the electronic prints (Table 3). Therefore, the geometric relationship, within the footprint, between the arch index and the long plantar angle was altered as a result of shape change in the electronic prints.
Since the electronic footprints were distorted, the geometric indexes derived from them were not interchangeable with those from ink footprints, and values for electronic parameters should not be interpreted with respect to reference values derived from ink prints. Classifying feet according to the electronic arch index might lead to a distribution different from that defined by Cavanagh and Rodgers, [5] and a foot considered to be low arched with the use of one technique might be placed in the normal category with the second. To circumvent this, it would be necessary to establish the appropriate distribution of arch indexes for a large population sample by using a pressure platform and repeating the methodology of Cavanagh and Rodgers.
Further, the development of electronic footprint indexes is likely to confound the current controversy over the validity of ink footprint parameters as indicators of arch height. [7,9] Chu et al [11] suggested yet another approach by defining a modified arch index. The modified arch index is different from both Cavanagh and Rodgers’s index and the electronic method used in this study because it uses the pressure values for the arch index calculation whereas the latter two are derived from area measurements only. Since one purpose of the arch index is to enable the classification of feet in studies investigating foot function, the modified arch index, which incorporates kinetic data, may prove to be more appropriate. Like the electronic arch index of this study, the modified arch index was found to be different from the conventional arch index.
Although the size of the sensor used for this study complied with the current recommendations for the measurement of peak pressure, [17,18] smaller sensors, with a low pressure threshold, may be necessary for the assessment of geometric indexes. Furthermore, small footprints, such as children’s, with a greater periphery in proportion to their contact area, could be liable to larger error. This error may be further compounded by the lower foot pressures typically noted with children. [19,20] Therefore, the findings of the current study are applicable only to adult footprints measured on pressure platforms that perform similarly to the one used. Platforms with greater spatial resolution or that incorporate transducers with improved response characteristics may produce more accurate representations of footprint parameters.
Conclusion
Recent footprinting studies have employed electronic footprints obtained from pressure platforms as a substitute for ink prints because of the relative ease of data collection and analysis. The accuracy of geometric indexes derived from such electronic prints, however, is questionable. This study demonstrated that electronic prints obtained from a pressure platform are not representative of those derived from ink footprints and consequently should not be interpreted with reference to conventional footprint literature.
References
- Didia BC, Omu ET, Obuoforibo AA: The use of the footprint contact index II for classification of flat feet in a Nigerian population. Foot Ankle 7: 285, 1987.
- Volpon JB: Footprint analysis during the growth period. J Pediatr Orthop 14: 83, 1994.
- Welton EA: The Harris and Beath footprint: interpretation and clinical value. Foot Ankle 13: 462, 1992.
- Rose GK, Welton EA, Marshall T: The diagnosis of flat foot in the child. J Bone Joint Surg Br 67: 71, 1985.
- Cavanagh PR, Rodgers MM: The arch index: a useful measure from footprints. J Biomech 20: 547, 1987.
- Forriol F, Pascual J: Footprint analysis between three and seventeen years of age. Foot Ankle 11: 101, 1990.
- Hawes MR, Nachbauer W, Sovak D, et al: Footprint parameters as a measure of arch height. Foot Ankle 13: 22, 1992.
- McPoil TG, Cornwall MW: Use of medial longitudinal arch height to predict plantar surface contact area during walking [abstract]. J Orthop Sports Phys Ther 30::A29, 2000.
- McCrory JL, Young MJ, Boulton AJM, et al: Arch index as a predictor of arch height. Foot 7: 79, 1997.
- Shiang TY, Lee SH, Lee SJ, et al: Evaluating different parameters as a predictor of arch height. IEEE Eng Med Biol Mag 17: 62, 1998.
- Chu WC, Lee SH, Chu W, et al: The use of the arch index to characterize arch height: a digital image processing approach. IEEE Trans Biomed Eng 42: 1088, 1995.
- Mathieson I, Upton D, Birchenough A: Comparison of footprint parameters calculated from static and dynamic footprints. Foot 9: 145, 1999.
- Rossi WA: Podometrics: a new methodology for foot typing. Contemp Podiatr Physician Nov: 28, 1992. (cited in “Podometry,” in Scientific Foot Analysis Software Manual, Version 08.7, p 10, Novel GmbH, Munich)..
- Bland MJ, Altman DG: Statistical methods for assessing agreement between two methods of clinical measurement. Lancet 1: 307, 1986.
- Wearing SC, Urry S, Smeathers JE, et al: A comparison of gait initiation and termination methods for obtaining plantar foot pressures. Gait Posture 10: 255, 1999.
- Urry S: Plantar pressure-measurement sensors. Meas Sci Technol 10: 16, 1999.
- Davis BL, Cothren RM, Quesada P, et al: Frequency content of the normal and diabetic plantar pressure profiles: implications for the selection of transducer sizes. J Biomech 29: 979, 1996.
- Lord M: Spatial resolution in plantar pressure measurement. Med Eng Phys 19: 140, 1997.
- Hennig EM, Rosenbaum D: Pressure distribution patterns under the feet of children in comparison with adults. Foot Ankle 11: 306, 1991.
- Betts RP, Franks CI, Duckworth T, et al: Static and dynamic foot pressure measurements in clinical orthopaedics. Med Biol Eng Comput 18: 674, 1980.
© 2001 American Podiatric Medical Association