


Abstract
This study examined the effects of two designs of rigid foot orthoses on plantar pressure measurements and identified differences between the devices. While wearing modified Rootand Blake-style orthoses, 27 subjects were examined with the Electrodynogram (EDG) in-shoe pressure measurement system. Reliability testing was performed on the EDG data. Significant changes were observed in the temporal parameters of gait when subjects wore the orthoses. When the devices were used, the duration of some of the components of stance phase was altered, and the initiation of loading beneath the medial forefoot was delayed. A reduction in the total duration of loading at discrete sites beneath the heel and forefoot was also observed. The effects of the two orthoses were similar, with only small differences observed between the devices.
Foot orthoses are widely used to treat foot and lower-limb pathology [1]. The functional foot orthosis, as defined by Levitz et al, is a device that “realigns the foot in relation to the supporting surface, re-establishing a normal propulsive sequence” [2]. It has been suggested that functional foot orthoses control motion of the subtalar and midtarsal joints during the stance phase of gait and that rigid materials are most appropriate for these devices [3-5]. It has also been suggested that Blake or inverted-style orthoses are more effective than Root orthoses in achieving this control of excessive subtalar joint pronation [3,6,7]. Baitch et al [7] used high-speed video analysis to compare the effects of Root and Blake orthoses on calcaneal eversion in seven runners. While they concluded that the inverted orthoses generally were more effective at controlling calcaneal eversion, they acknowledged that the response to the orthoses was variable. Two of their subjects exhibited a greater reduction in calcaneal eversion with Root-style devices, and one subject had less eversion when wearing no orthoses at all.
Exactly how orthoses affect foot function is still not fully understood [8], and the scientific basis for their preferential use in the treatment of lower-extremity complaints has been questioned [9]. This uncertainty may be attributed to several factors, including different methodologies and study designs selected, eg, the choice between symptomatic and asymptomatic subjects, between footwear belonging to the subjects and standardized footwear, and between rigid and soft foot orthoses.
Plantar pressure measurement systems have become increasingly popular for investigating foot function and the effects of orthoses because of the quantitative data they provide. The effects of orthoses on the center of pressure, peak pressure, and temporal parameters have been investigated and were discussed in a review article by Landorf and Keenan [10]. Several studies have concluded that functional orthoses effectively reduce plantar pressures [11-13]. Bennett et al [14] used the Electrodynogram (EDG) (Langer Biomechanics Corp, Deer Park, New York) to evaluate the effects of rigid Root-style foot orthoses on plantar foot pressures. The authors examined 22 symptomatic subjects and observed that orthoses, made to a generic prescription, caused the pressure beneath the fifth metatarsal head to peak earlier. They interpreted this as representing a lateral shift of load beneath the foot. On the basis of discrepancies between their pretest and post-test results, Bennett et al also concluded that measuring peak pressure with the EDG system can be unreliable. Van Gheluwe et al [15] also suggested that temporal measurements are more reliable than peak pressures when the EDG is used.
The purposes of this study were to use the EDG plantar pressure measurement system to evaluate the effects of two types of rigid foot orthoses and identify differences between the devices, and test the reliability of EDG data. The following hypotheses were tested:
- 1)
- EDG measurements of peak pressure and total pressure per second would be significantly different between pretest and post-test trials.
- 2)
- Foot orthoses would cause the fifth metatarsal to reach its peak pressure earlier and experience load for a longer duration.
- 3)
- Foot orthoses would alter both plantar pressures and temporal parameters of gait as measured by the EDG.
- 4)
- Blake orthoses, due to their relatively inverted heel cup, would cause the medial heel and fifth metatarsal head to reach their peak pressures earlier and to bear load longer than Root devices.
Method
Subjects
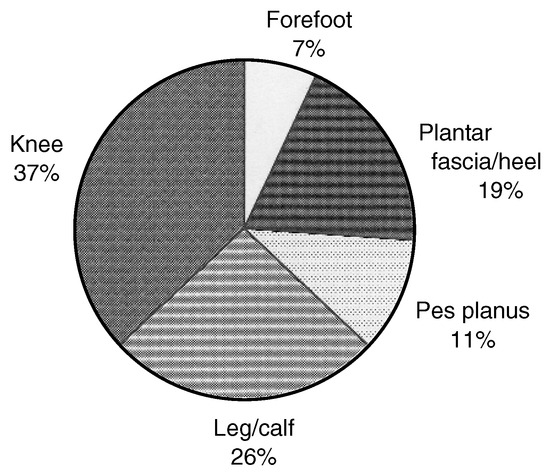
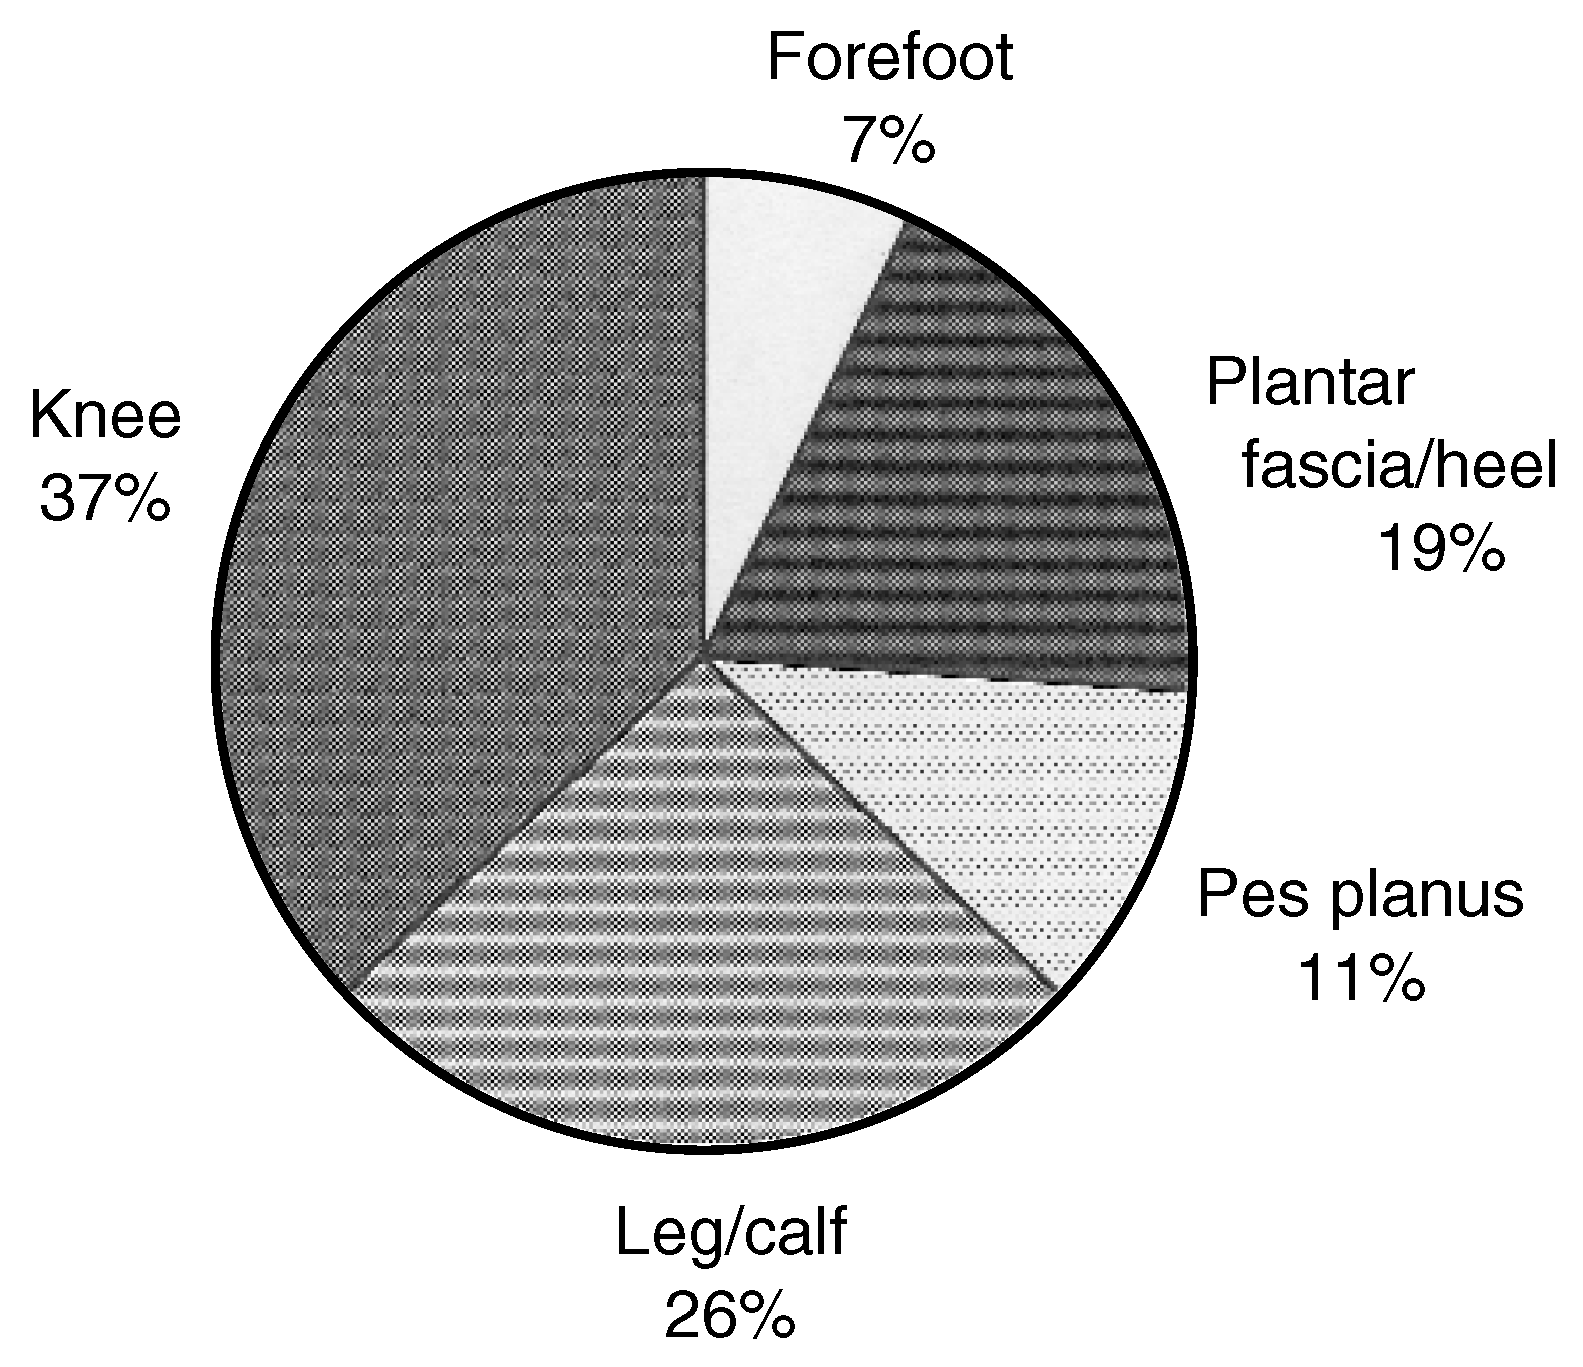
The study enrolled 27 subjects, 18 males and 9 females, between 18 and 46 years old (median, 25 years). The average weight was 72.1 kg (SD ±18.9 kg; range, 44.2 to 118.5 kg). While the subjects had no history of lower-limb surgery or previous functional orthotic therapy, they were about to receive orthotic therapy from podiatric physicians for musculoskeletal complaints affecting various lower-limb sites (Fig. 1). Interestingly, 17 subjects (63%) were receiving orthotic therapy for conditions extrinsic to the foot.
Figure 1.
The anatomical locations of the musculoskeletal complaints for which the subjects were receiving treatment from their podiatric physician.
Study Design
A repeated-measures, within-subject design was used for this study. Subjects were tested under four treatment conditions. The study received ethical clearance from the Queensland University of Technology Ethics Committee.
Fabrication of Orthoses
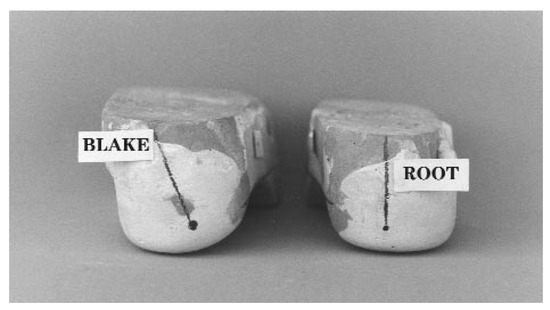
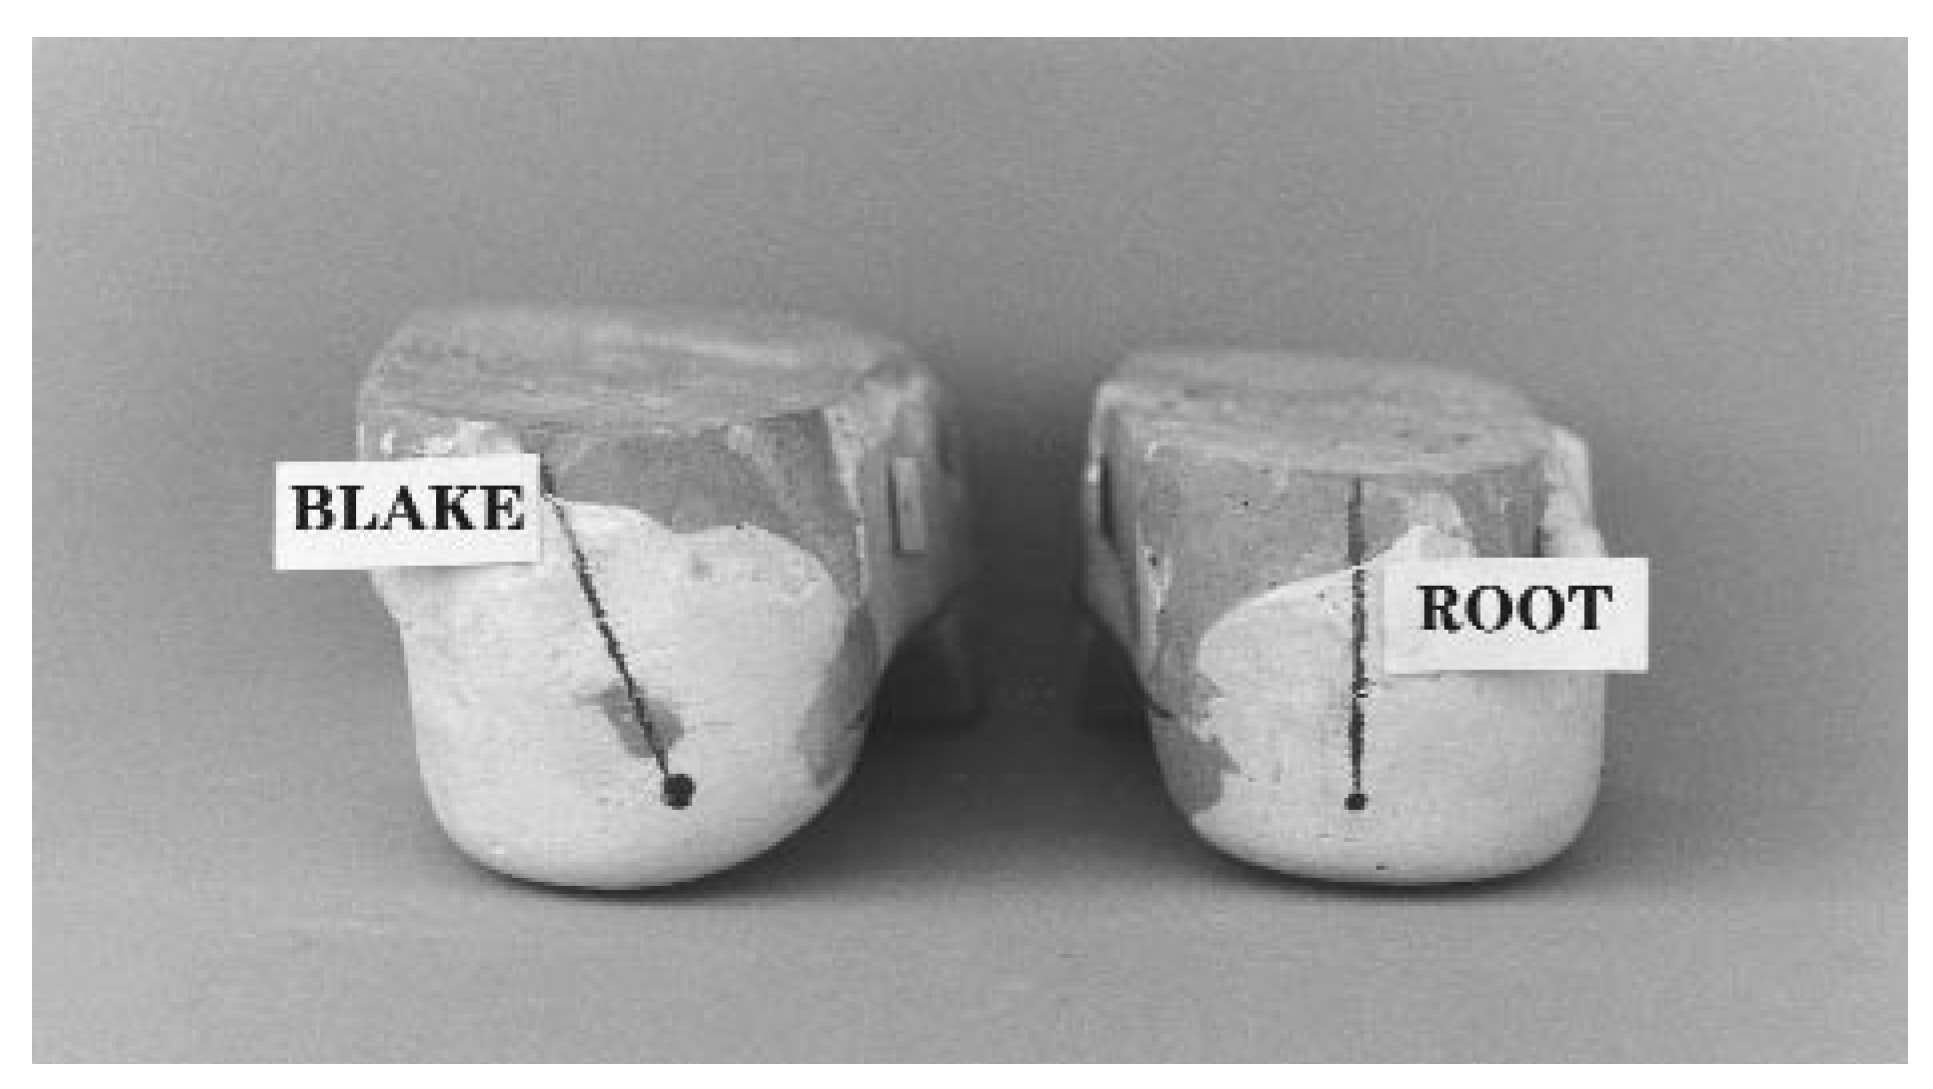
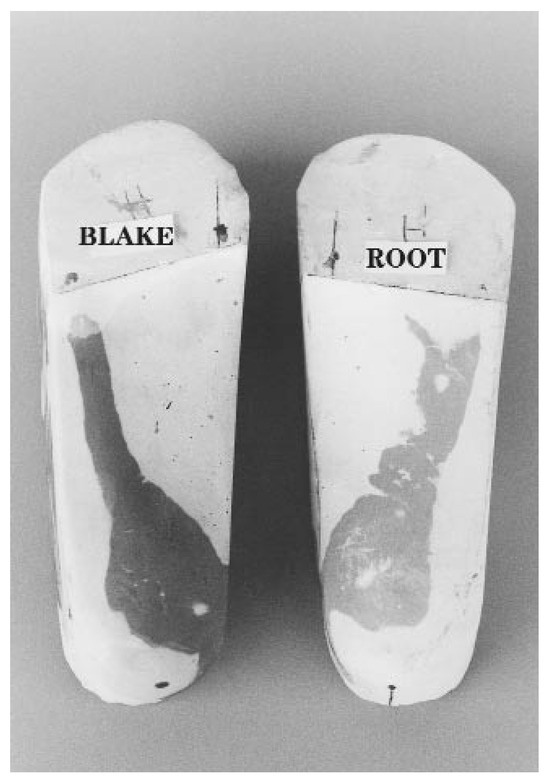
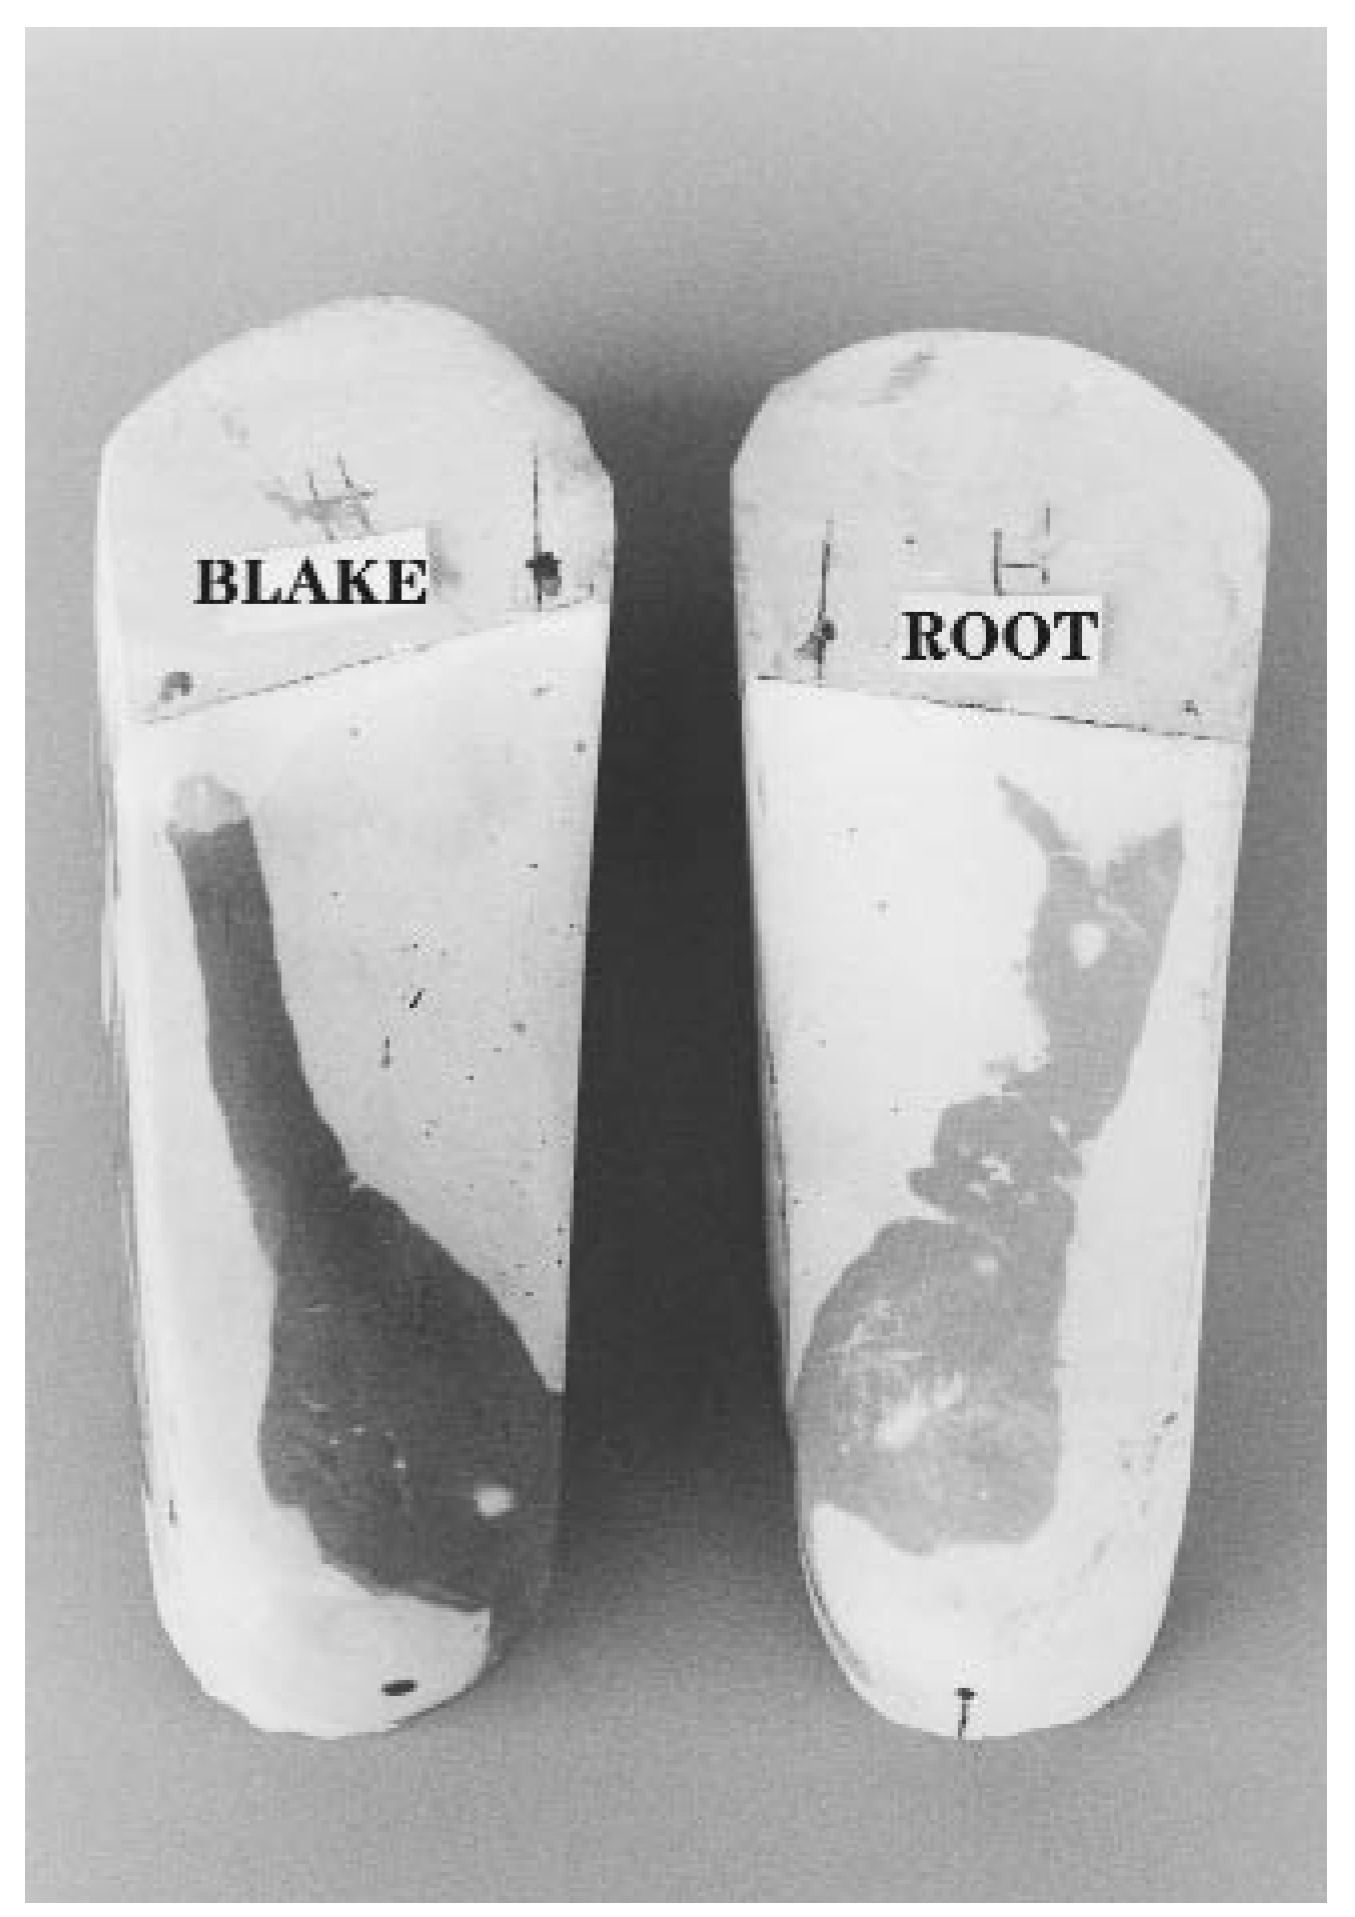
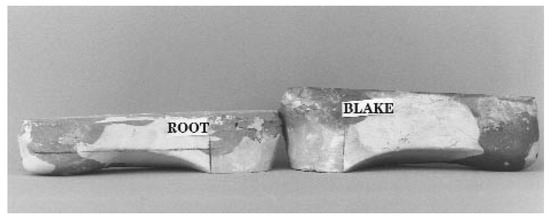
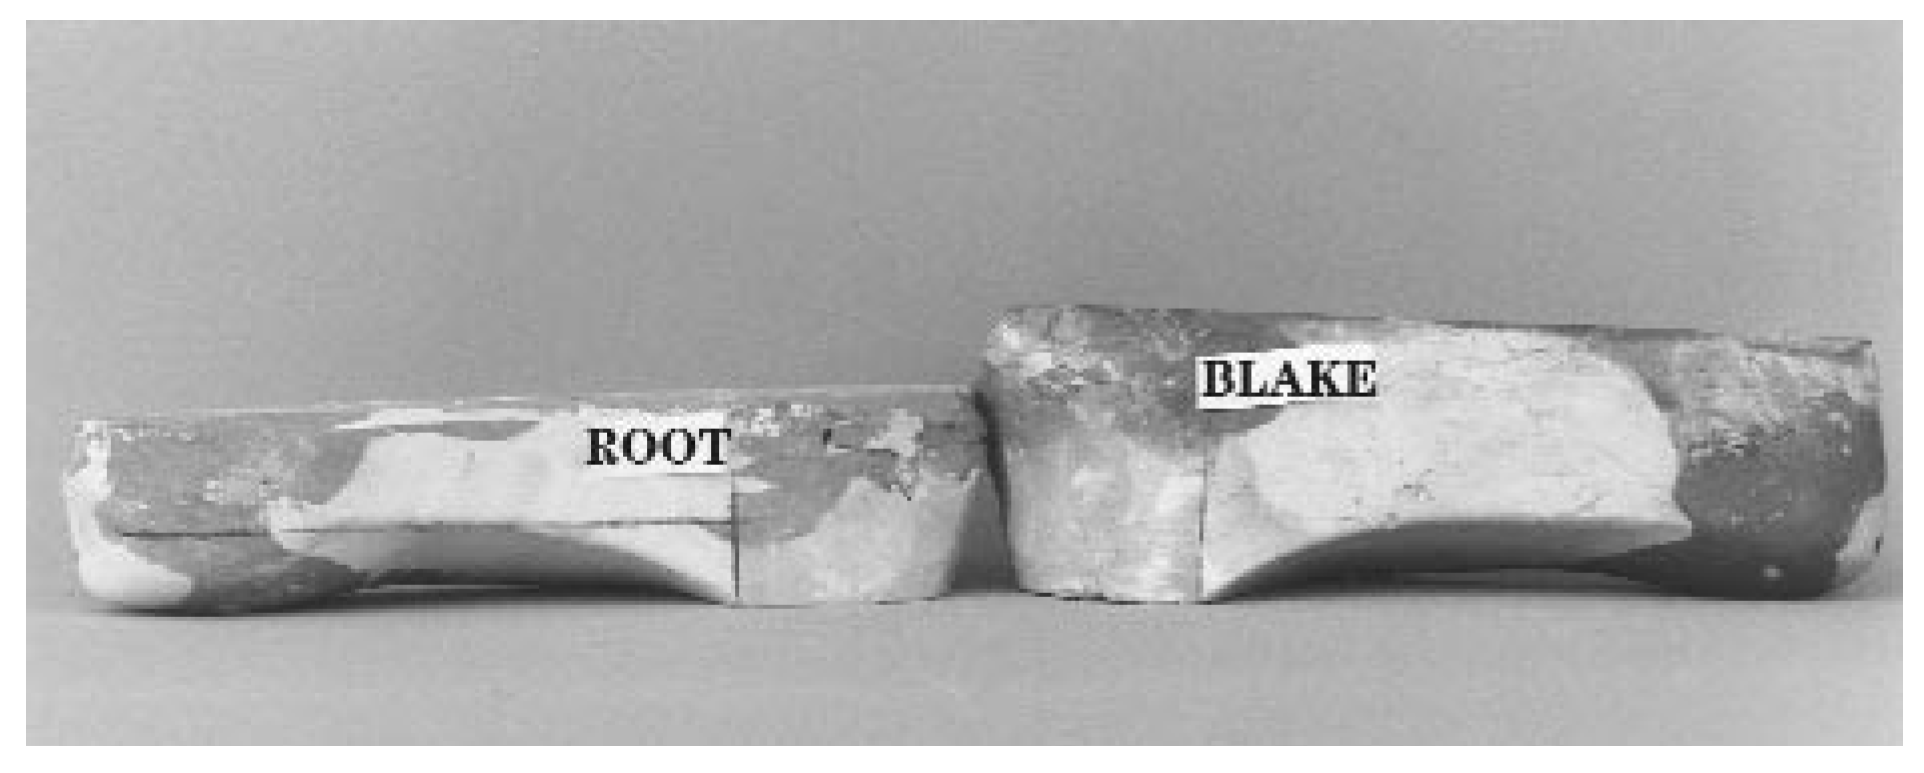
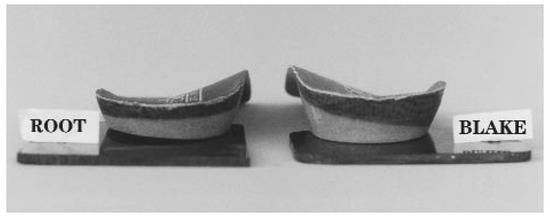
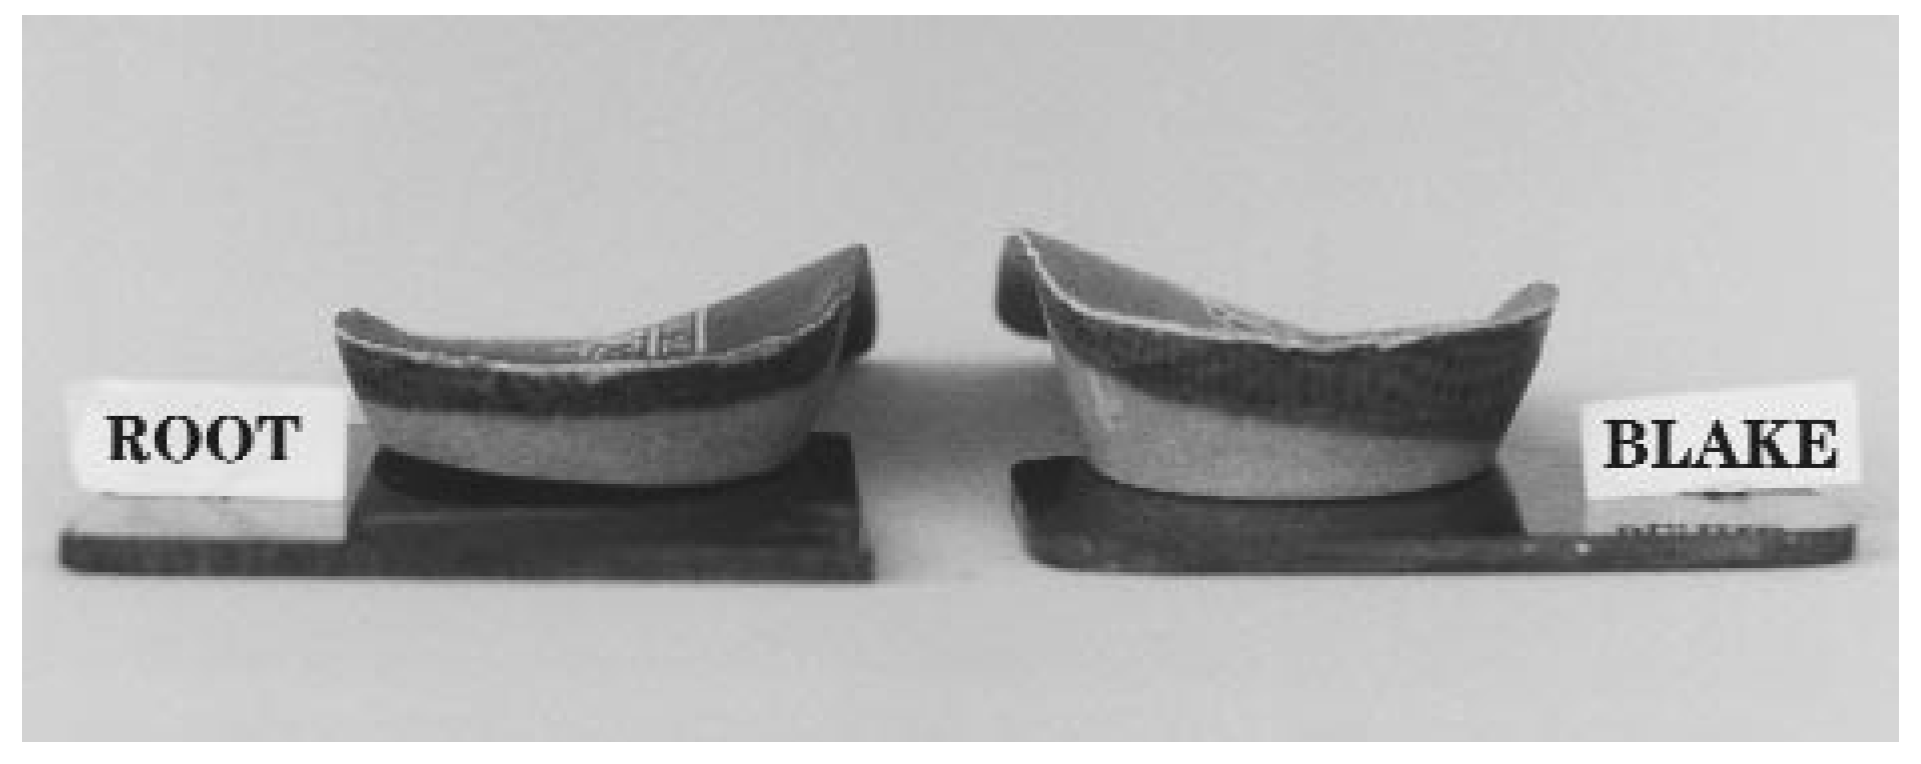
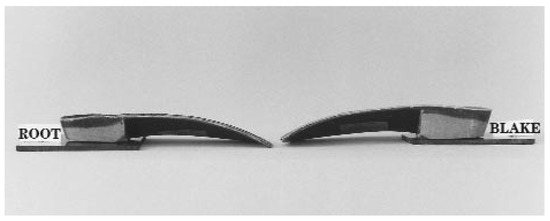
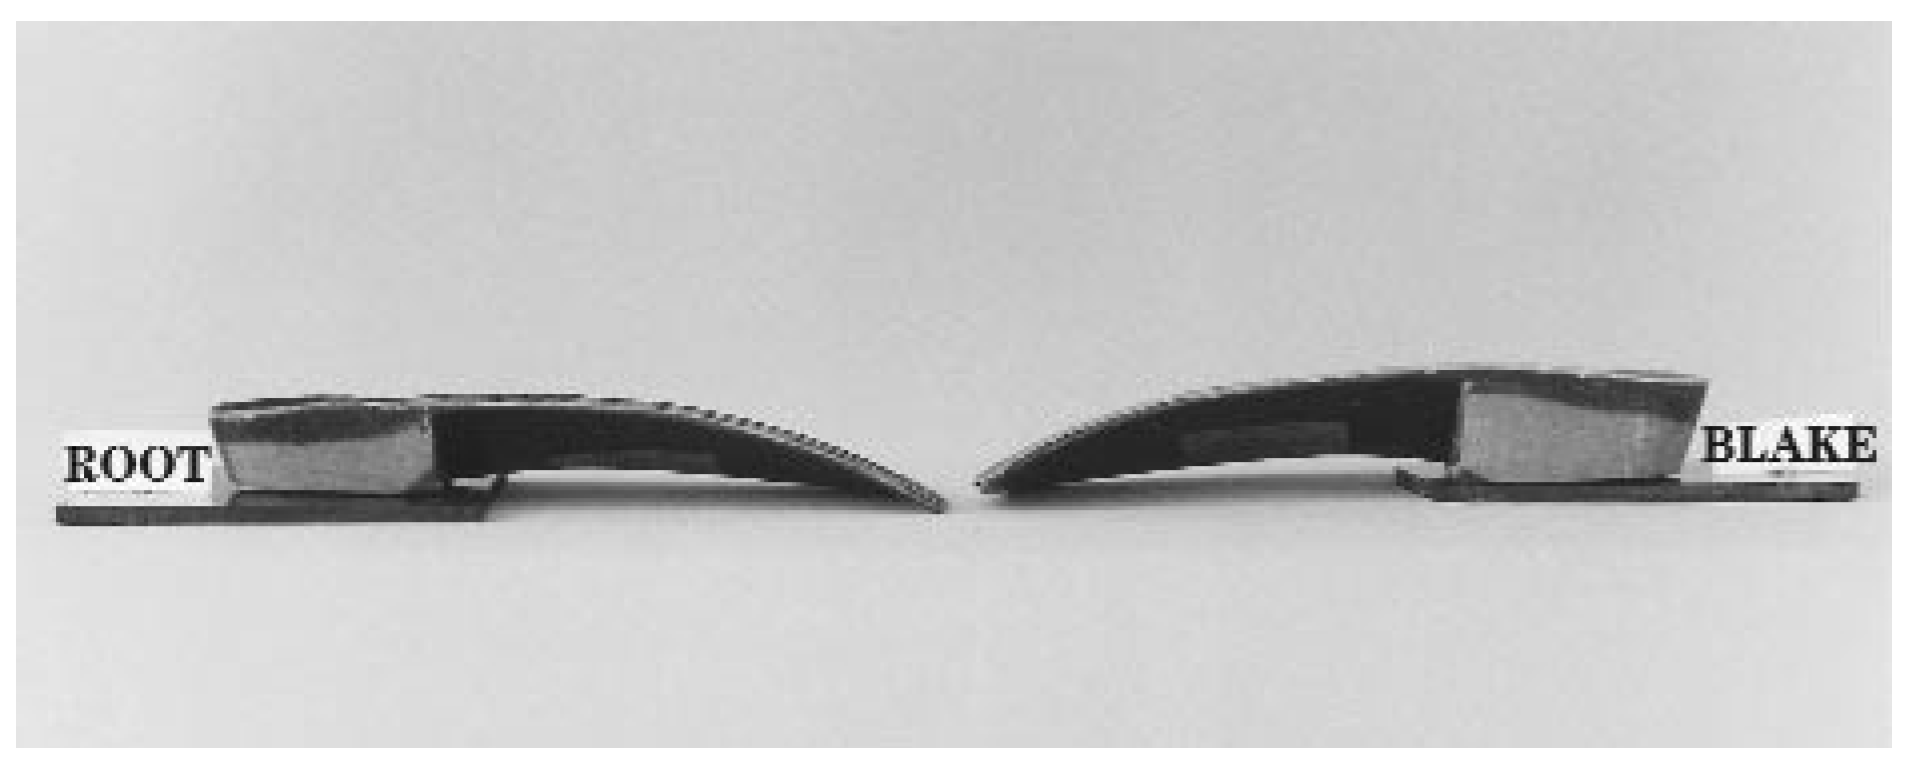
The podiatric physicians used the neutral-position casting technique for the study, as described by Root et al. [16] Negative casts were forwarded to a commercial orthotic laboratory for fabrication. The construction of the orthoses was standardized with the following protocol: An experienced technician fabricated all orthoses; Root orthoses were fabricated from the modified positive casts as outlined by Anthony [17] and plaster modifications were subsequently removed, and the same casts were remodified using the Blake technique, eliminating discrepancies associated with recasting the patient. Cast modifications are illustrated in Figure 2, Figure 3 and Figure 4. All of the orthoses were constructed from a carbon-fiber composite material, with intrinsic forefoot posting incorporated into the positive casts. Root orthoses had a heel cup depth of 16 mm and an extrinsic acrylic rearfoot post (4° inverted with 4° biplanar motion grind, 4-mm posting elevation). Blake orthoses were fabricated from 25° inverted casts with a 21-mm heel cup depth and an extrinsic acrylic rearfoot post (0° with no biplanar motion grind, 4-mm posting elevation). These design parameters were considered generic prescriptions for the two techniques [3,4,7]. Examples of the foot orthoses are depicted in Figure 5 and Figure 6.
Figure 2.
Posterior view of positive plaster casts with plaster additions. Note the higher medial heel contour with the Blake cast, which has been inverted 25°.
Figure 3.
Plantar aspect of the positive plaster casts showing the plaster additions used for the modified Root technique and the inverted orthotic or Blake technique.
Figure 4.
Medial view of the positive plaster casts and plaster additions.
Figure 5.
Posterior view of the Root and Blake-style orthoses. Note the higher heel cup on the Blake orthosis.
Figure 6.
Medial view of the Root and Blake-style orthoses.
The consulting podiatric physician provided the orthoses to the subjects. Subjects were given 1 week to acclimate to the devices and were asked to wear the devices on alternate days during this period and then return for testing.
Data Collection
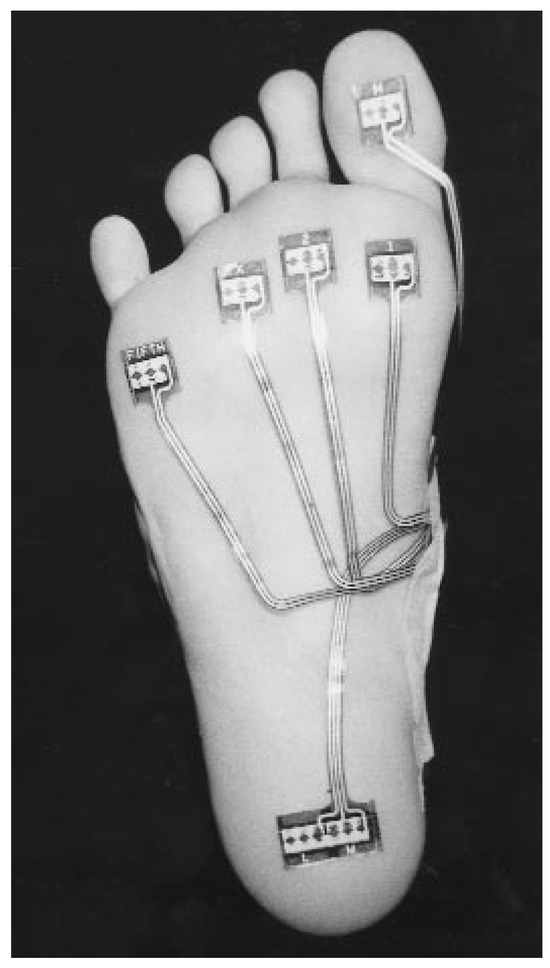
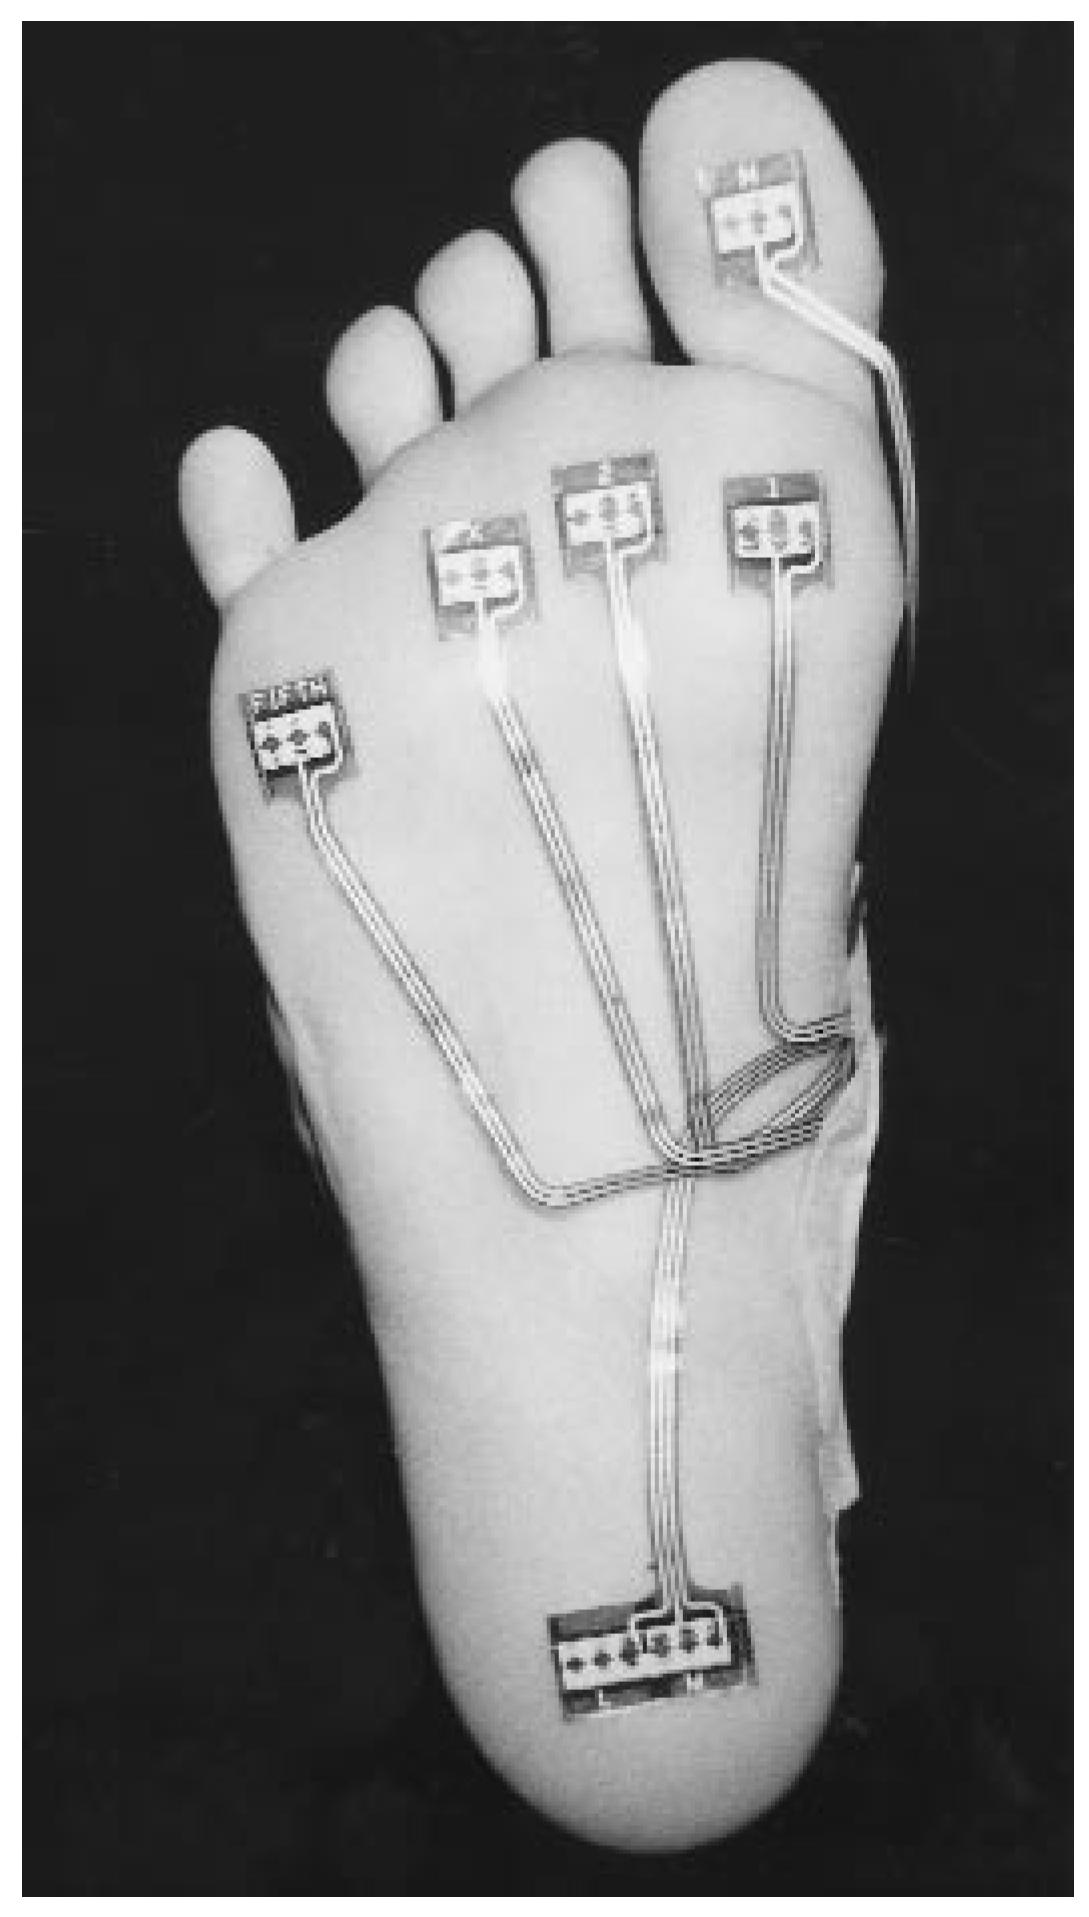
Plantar pressure measurements were taken with the EDG system. The subjects’ feet were cleaned with alcohol swabs, and metatarsal head bisections were determined through a direct palpation technique. EDG sensors were positioned beneath the medial and lateral heel as well as beneath metatarsal heads 1, 2, 3, and 5, and the hallux. Sensors were secured by paper dressing tape and an ankle-high nylon stocking. Placement of the EDG sensors is shown in Figure 7. The waist pack holding the EDG force data collector was secured, and subjects were then provided with standardized sports footwear in their appropriate size (Oregon Ultra Tech, Adidas-Salomon, Herzogenaurach, Germany) for the gait trials.
Figure 7.
EDG sensor placement.
Trials were conducted along a 20-m concrete walkway to ensure unhindered, uninterrupted gait. A pedometer was used to approximate a consistent walking velocity during the trials [18,19]. The EDG force data collector was activated by remote control, after the subject had taken at least five steps. Data were collected with a sampling frequency of 100 Hz, over a 5sec period, allowing for the evaluation of several strides. Data collection was completed before the end of the walkway was reached. Subjects completed one gait trial under each of four test conditions: 1) pretest shoes only, 2) shoes and Root devices, 3) shoes and Blake devices, and 4) post-test shoes only. The testing order was randomized between Root and Blake orthoses to avoid potential order effects. After testing, the patients were asked to return to their podiatric physician for continuation of their treatment.
Data Analysis
EDG system software was used to determine the cadence (steps per minute), and stance phase duration (milliseconds) for each subject. Next, the software was used to examine temporal and pressure parameters of gait. The peak pressure (kg/cm2), time to peak pressure (percentage of stance phase), pressure duration/duration of load (percentage of stance phase), and total pressure per second (kg/cm2 per second) were determined for each of the seven sensor locations on the foot.
The EDG system software divides the stance phase into three subphases: contact, midstance, and propulsive phases. It also records the time between heel contact and forefoot loading (foot-flat phase), which can be equated with the initiation of loading of the first and second metatarsal heads in subjects who load the forefoot from lateral to medial. These parameters are expressed as a percentage of the total gait cycle and as a percentage of the stance phase of gait. Later versions of the EDG system software, including Revision 12 [20], define and calculate these components of stance phase differently from the earlier versions used in previously reported EDG studies [15,21]. For clarity, this study adopted terminology that differs from that of earlier studies to describe the components of stance phase (Table 1).
Table 1.
Definitions of Stance Phase, Stance Phase Components, and Time to Contact of the Medial Forefoot (EDG FootFlat Phase).
EDG data were entered into the SPSS for Windows statistical analysis program (Version 9.01) (SPSS Inc, Chicago IL). The descriptives option was used to obtain the means, standard deviations, and standard error of the means for each variable. Three subjects were excluded from further analysis because of asymmetry in stance phase duration or cadence in excess of 120 steps/min, leaving a sample of 24 subjects for further statistical analysis. To satisfy the independence requirement for statistical analysis, data were analyzed from one limb only [22]. Data from the third metatarsal sensor (left foot) were consistently absent for some subjects, suggesting a technical failure of the sensor lead, and no further analysis of these data was undertaken.
Differences among the four test conditions in the stance phase duration and cadence were evaluated through one-way analysis of variance (ANOVA) models with repeated measures. A priori one-tail matchedpair t-tests were used to examine differences between Root and Blake orthoses for medial heel and fifth metatarsal loading.
A 4 (stance phase components) × 4 (conditions) repeated-measures ANOVA was used to determine if the stance phase components differed across the four test conditions. Significant interactions were evaluated via post hoc repeated-measures ANOVA models with within-subject contrasts.
Similarly, a 6 (sites) × 4 (conditions) repeatedmeasures ANOVA model was used to examine within-subject factors of test conditions for each of the temporal and pressure variables. The more conservative univariate F tests, with Greenhouse-Geiser adjustments, were used because they are considered more powerful for small sample sizes [23]. Within-subject contrasts were employed when significant main effects of the condition were found. Data were considered unreliable when significant differences were noted between pretest and post-test shoe-only conditions and were omitted from further analysis (hypotheses 1, 2, 3). Assumptions of normality were tested by the Kolmogorov-Smirnov test. An alpha level of 0.05 was used for all statistical tests. Finally, EDG waveforms were inspected to determine the order of the initiation of loading for the sensor sites.
Results
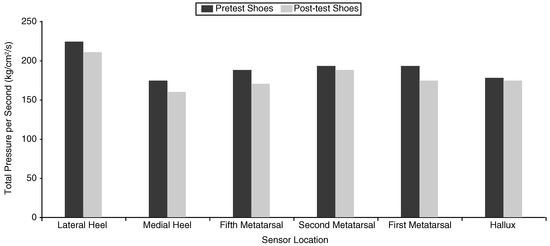
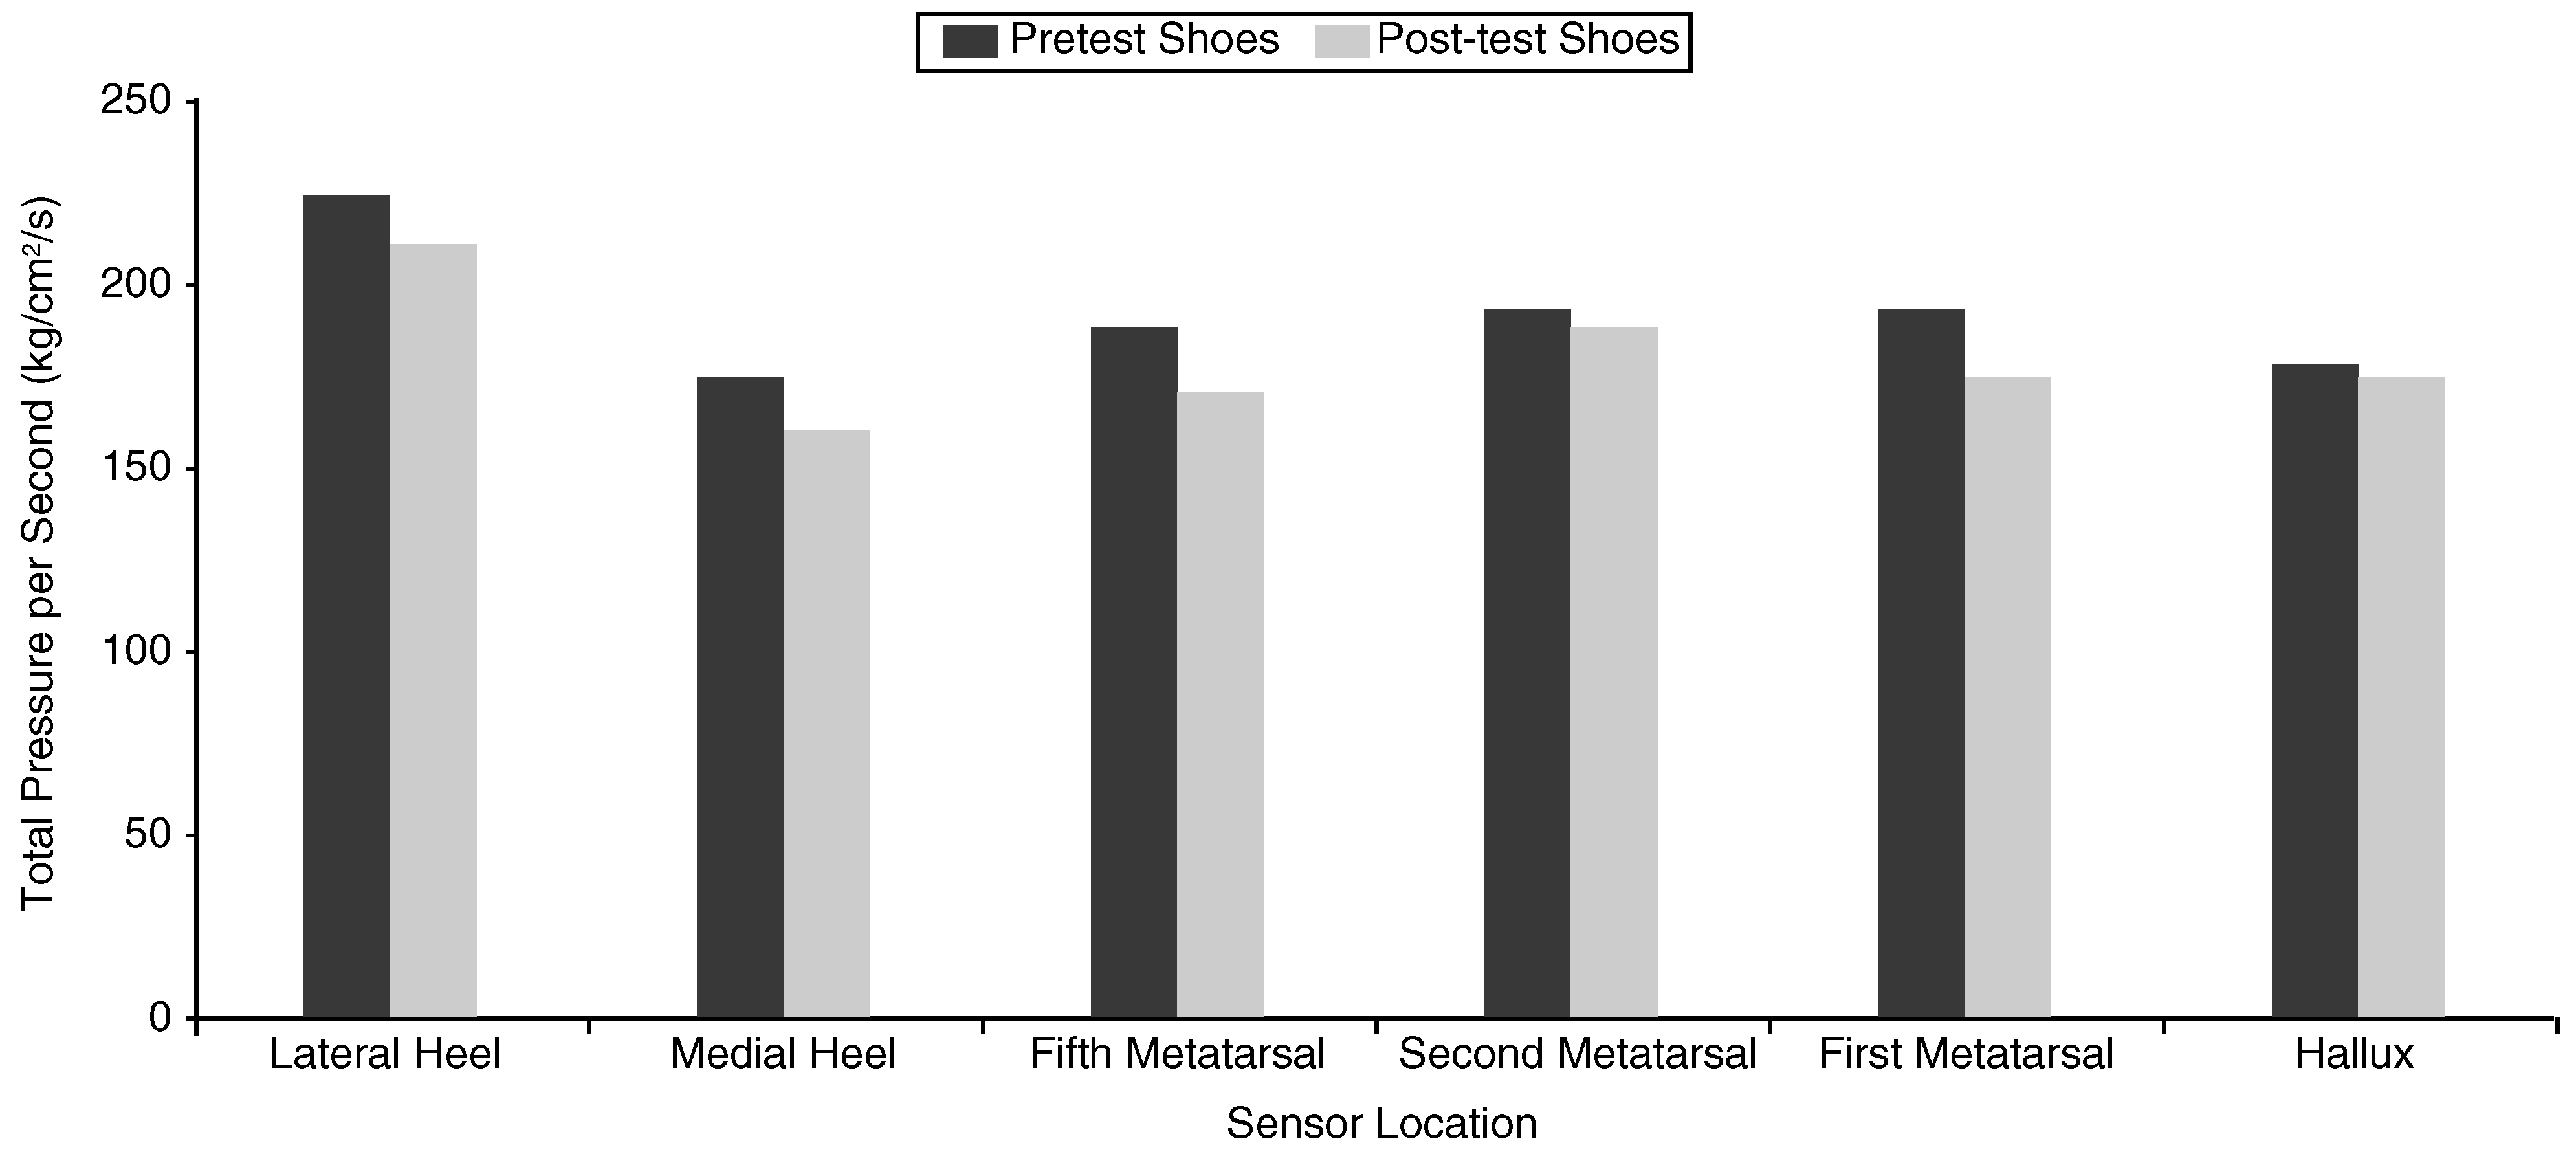
Table 2 demonstrates the mean and standard deviation for cadence and stance phase duration for each test condition. Repeated-measures ANOVA demonstrated no statistically significant difference among conditions in cadence (F = 1.31, P = .28) or stance phase duration (F = .56, P = .58). However, significant differences among conditions were noted in peak pressure (F = 4.58, P =.01) and total pressure per second (F = 6.04, P =.002). Within-subject contrasts demonstrated significant differences between pretest and post-test shoe conditions for these variables (P < .05). The difference in total pressure per second is illustrated in Figure 8.
Table 2.
Cadence and Stance Phase Durations for Each Test Condition.
Figure 8.
Pretest and post-test EDG measurements of total pressure normalized to 1 sec. The post-test measurements were significantly lower at all sites except the hallux (P < .05).
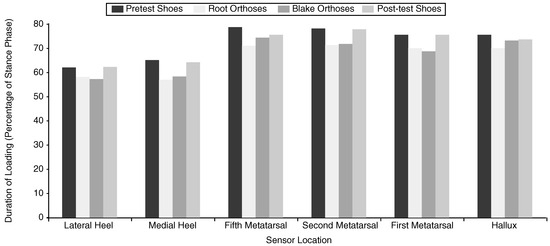
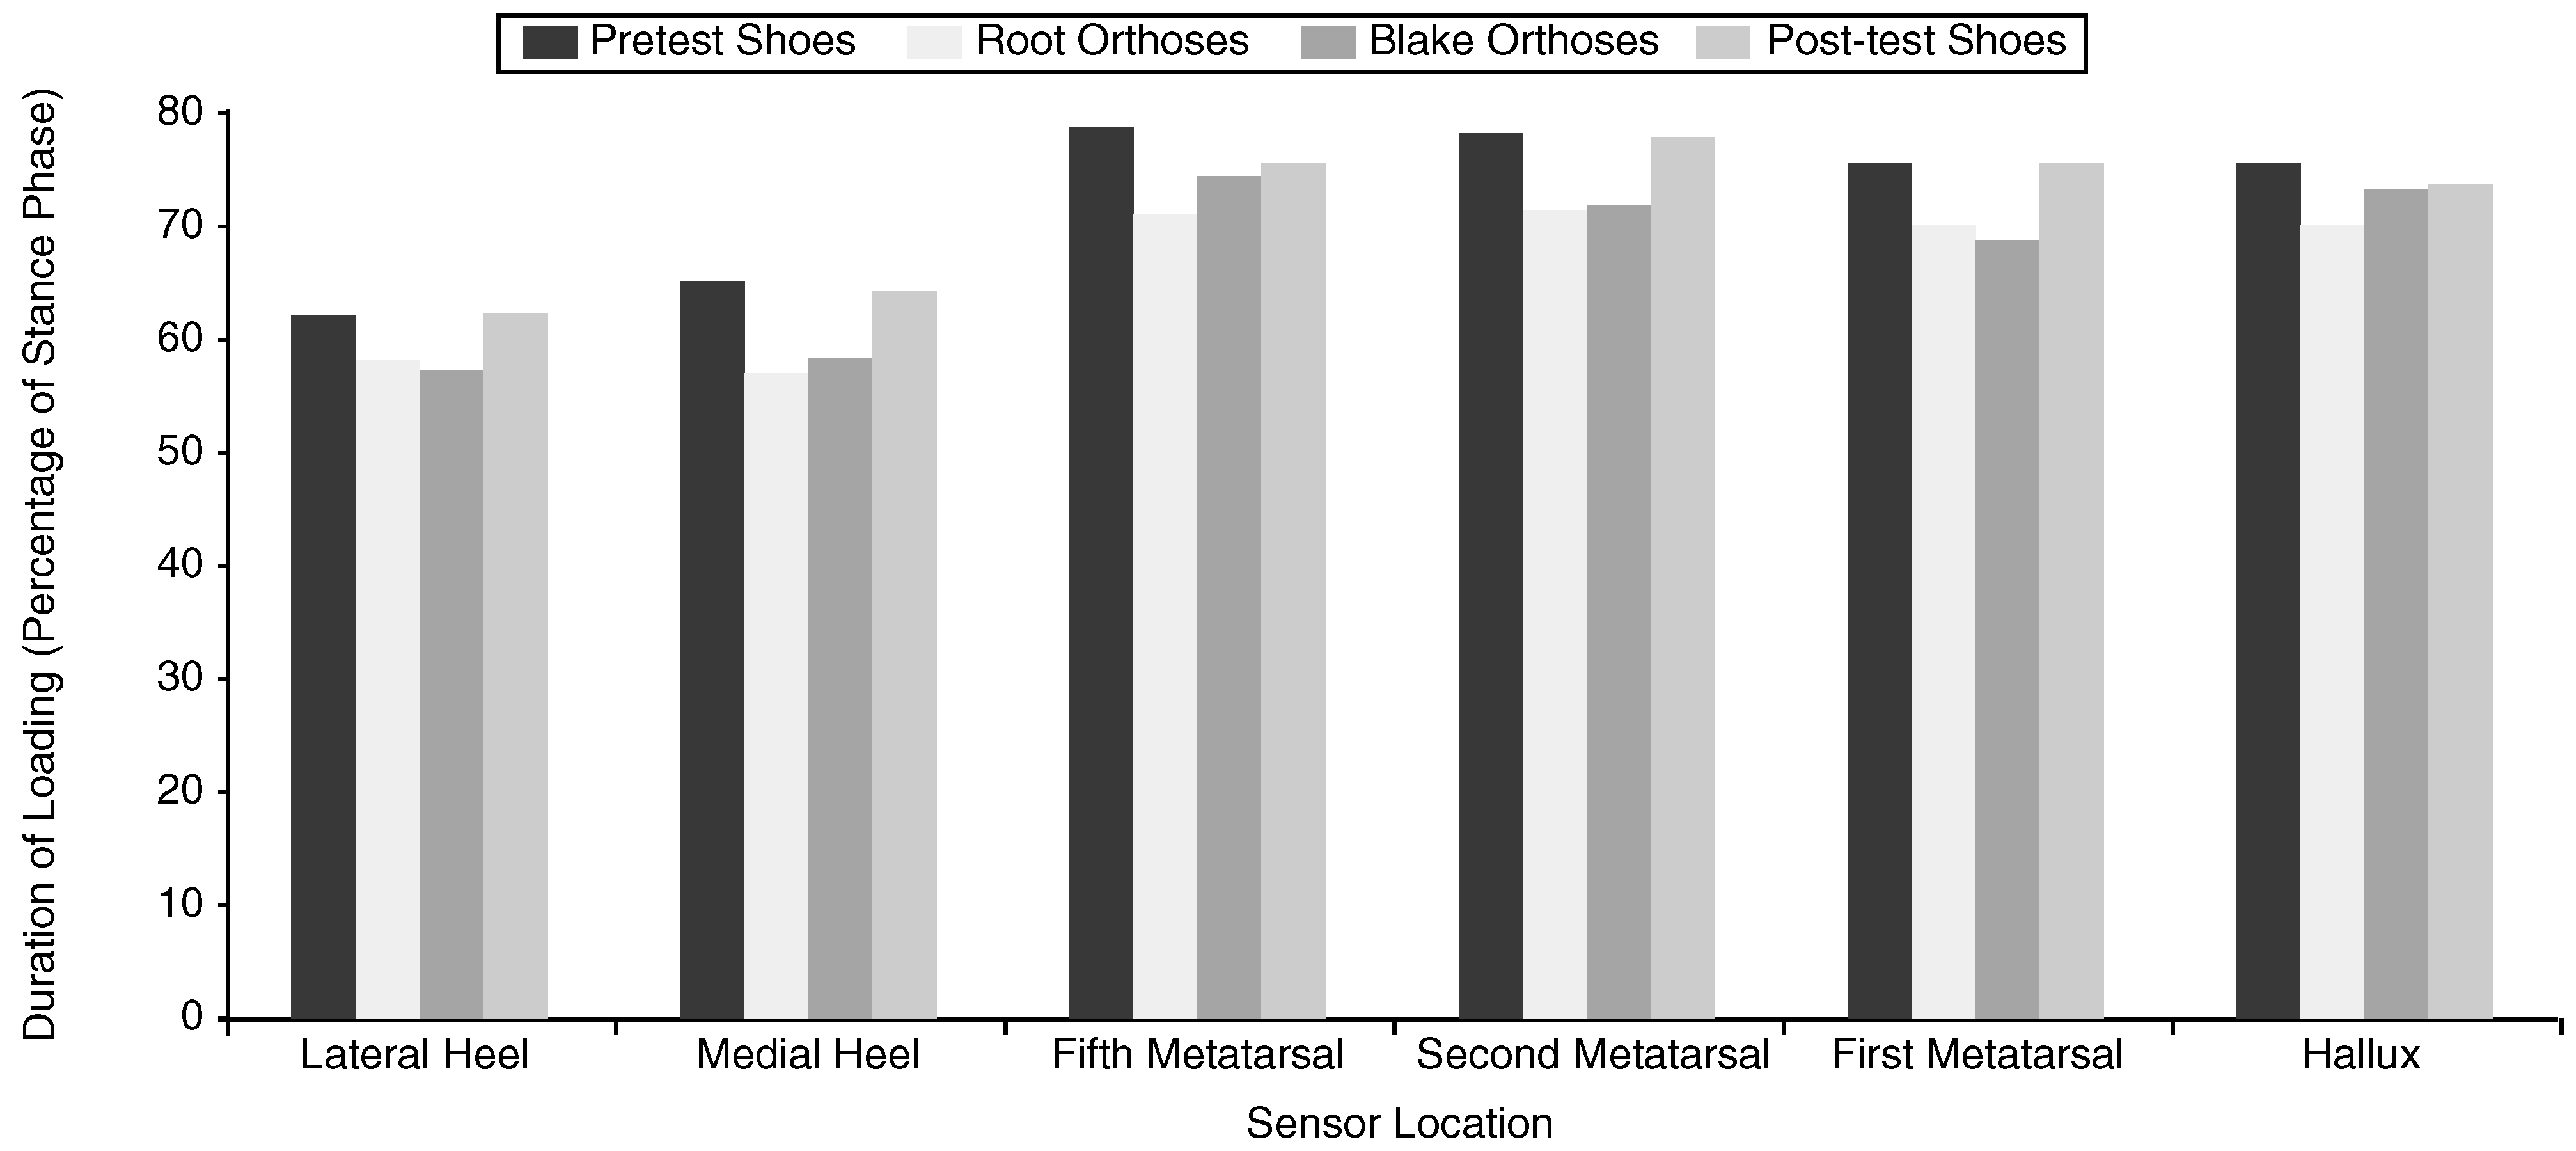
A significant main effect was noted for pressure duration/duration of load (F = 20.09, P = .001), with no significant site-condition interaction being evident. The mean duration of loading for each sensor site is reported in Table 3 and illustrated in Figure 9. There was no main effect for the time to peak pressure (F = 1.59, P = .21).
Table 3.
Duration of Loading for EDG Sensors (Percentage of Stance Phase).
Figure 9.
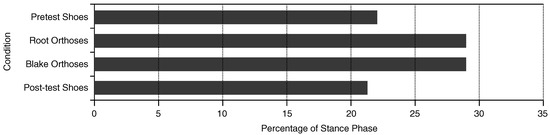
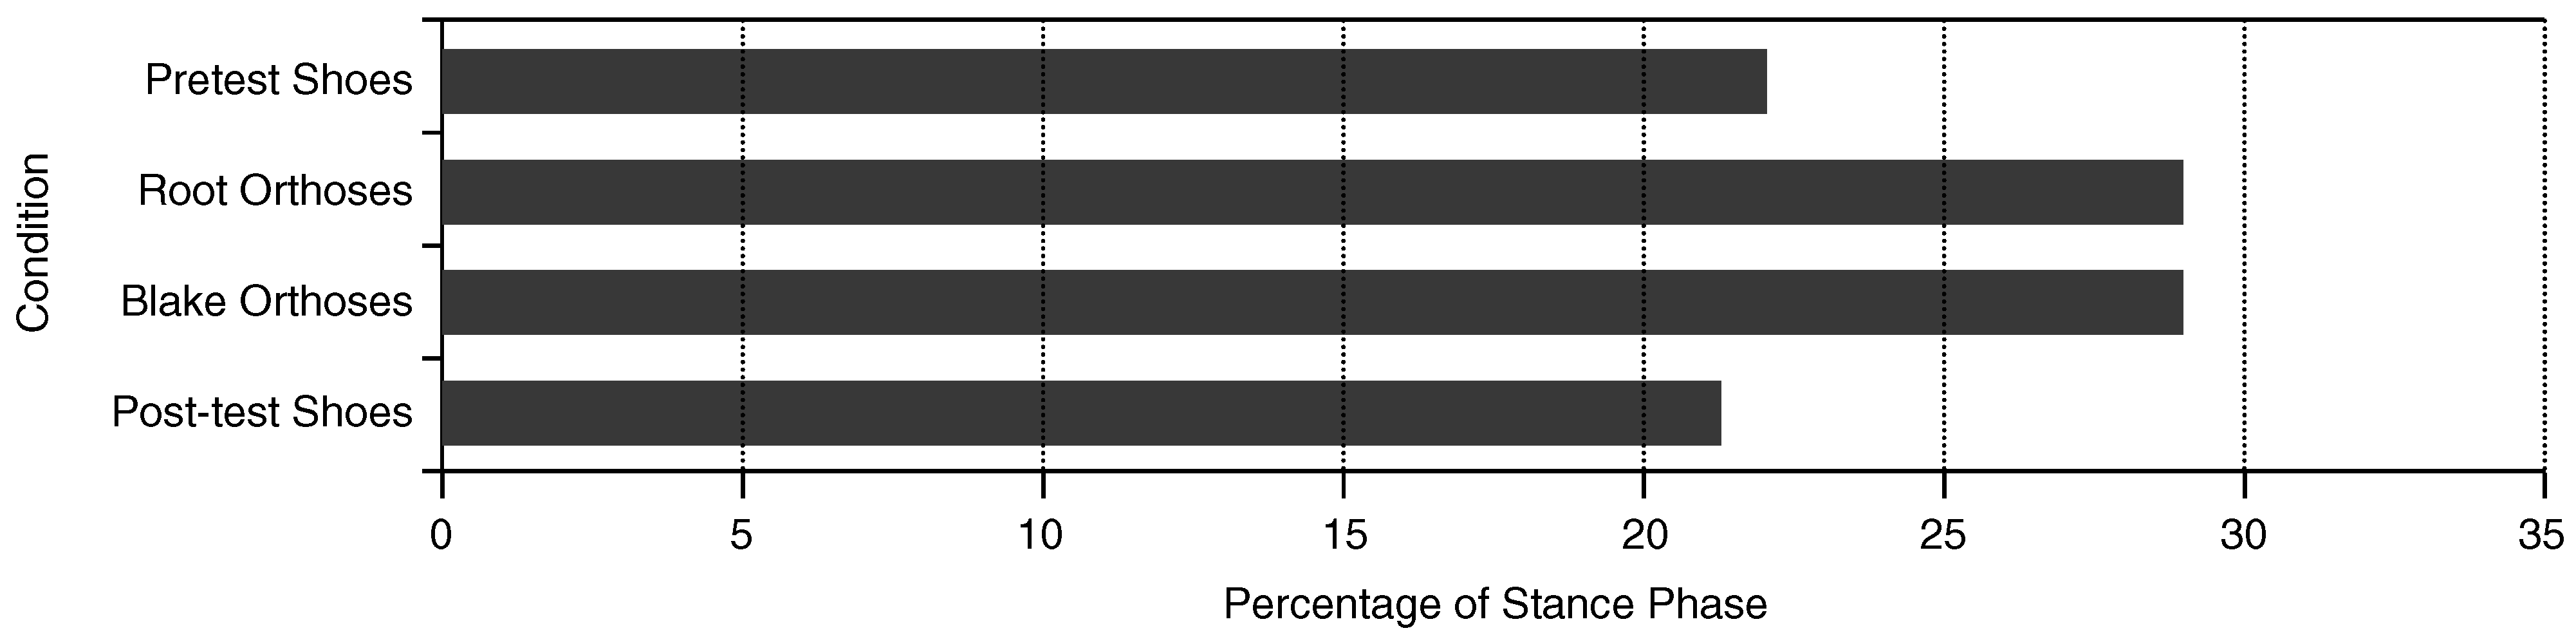
The effects of orthoses on the duration of loading at selected sites beneath the heel and forefoot. A reduction in the duration of loading was evident with orthoses. Paired t-tests demonstrated a significant difference between Rootand Blake-style orthoses at the fifth metatarsal head.
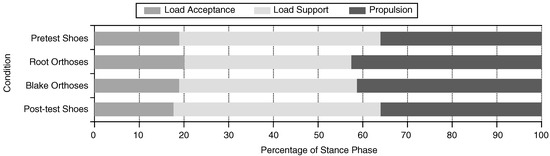
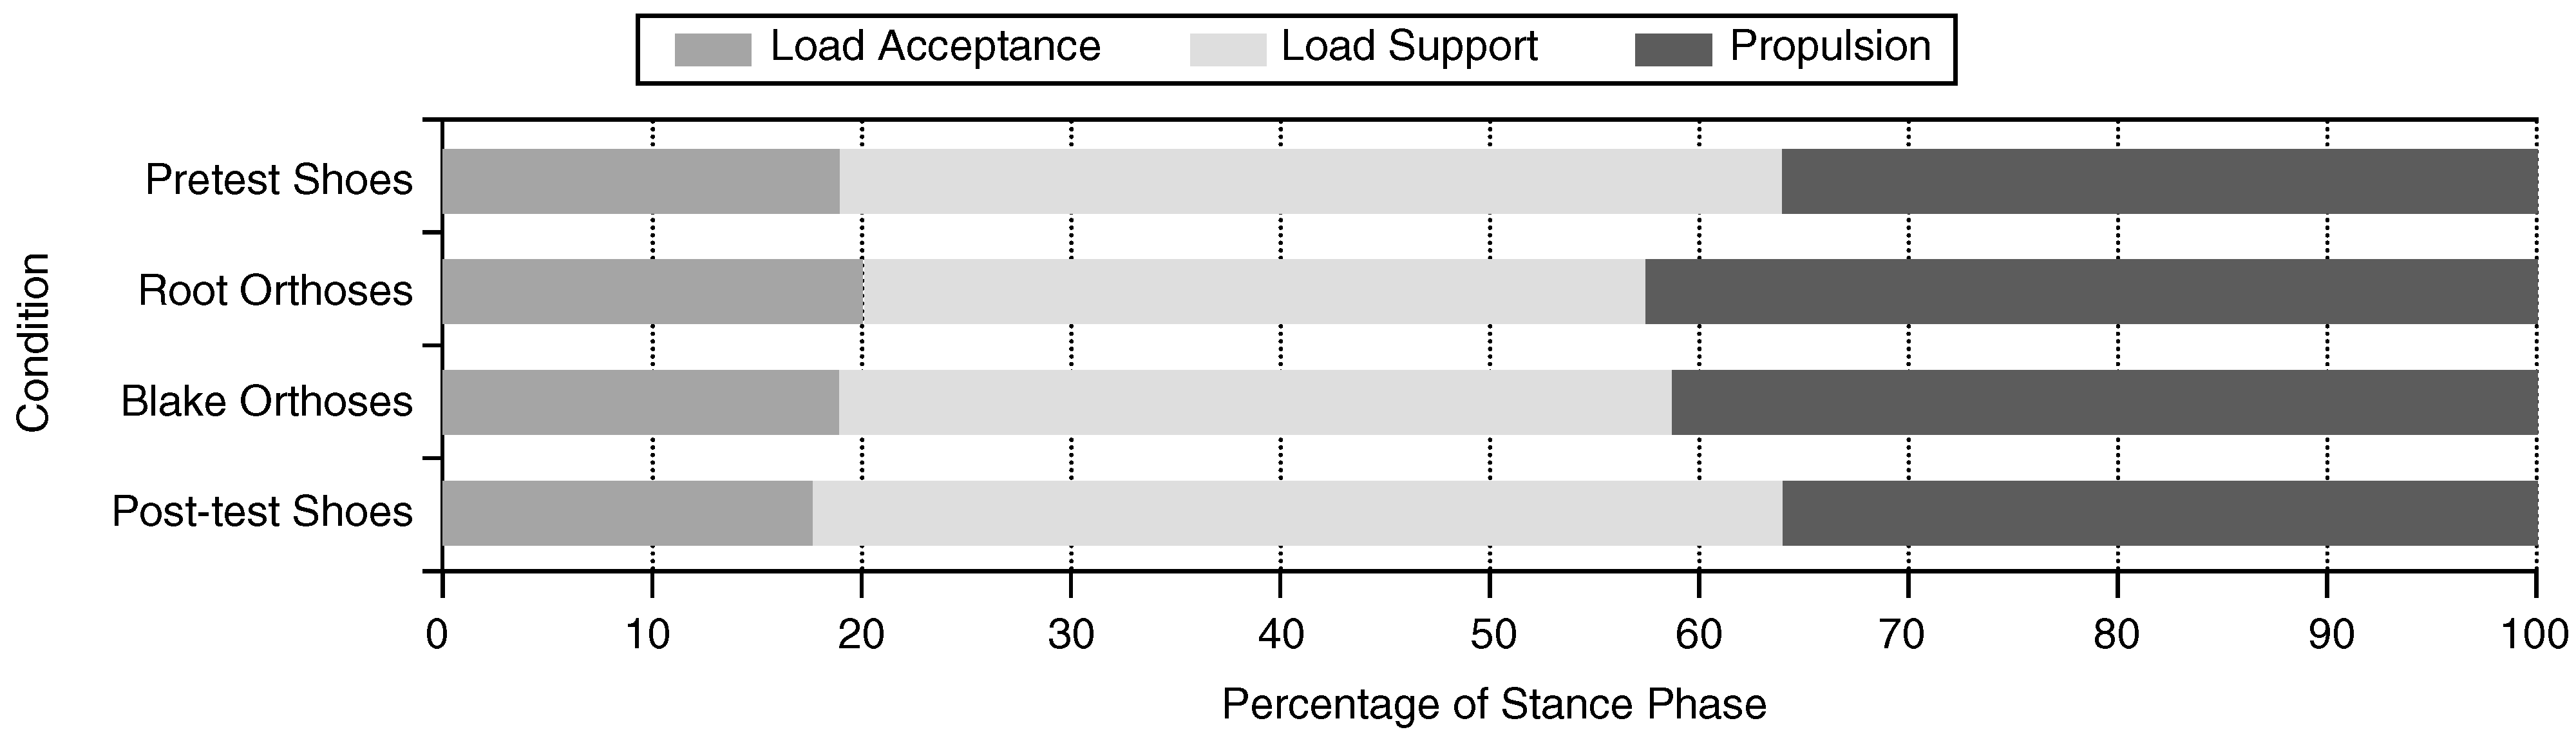
Repeated-measures analysis revealed a significant interaction between stance phase components and test condition (F = 3.76, P = .03). Although post hoc analysis of variance revealed that the load acceptance phase of gait (EDG contact) was unchanged across all conditions, the Blake and Root orthoses were noted to have similar effects on the other subphases of stance, shortening the load support period (EDG midstance) and prolonging the propulsive phase of gait (P < .05). Additionally, the initiation of loading of the medial forefoot (EDG foot-flat), was delayed with orthoses. The durations of the components of the stance phase of gait and the orthoses’ effects are reported in Table 4 and illustrated in Figure 10 and Figure 11. Within-subject contrasts between Root and Blake orthoses did not identify a significant difference between the devices.
Table 4.
Duration of the Components of Stance and the Time to Medial Forefoot Contact (Foot-Flat) as a Percentage of Stance Phase.
Figure 10.
The effect of orthoses on the stance phase components. The significant shortening of load support (EDG midstance) and the longer propulsive phase suggest an earlier heel lift. There was no significant difference among the conditions in the duration of load acceptance (EDG contact). Stance components were normalized to 100% of stance phase.
Figure 11.
The effect of orthoses on the initial loading of the medial forefoot (EDG foot-flat phase). The significant delay in foot-flat, when orthoses are worn, suggests delayed contact of the first and possibly second metatarsal heads.
Paired t-tests showed a significant difference between Root and Blake orthoses for the duration of loading beneath the fifth metatarsal only (F = −3.01, P = .03). No differences were observed for time to peak pressure beneath the fifth metatarsal (F = −.78, P = .22) or medial heel (F = .48, P = .31) or for duration of loading beneath the medial heel (F = −1.27, P = .18).
Inspection of the EDG waveforms showed the initiation of sensor loading followed two patterns: heel, fifth metatarsal, first metatarsal, and hallux (87.5% of trials); and heel, fifth metatarsal, hallux, and first metatarsal (12.5% of trials).
Discussion
The uniformity of cadence and stance phase durations in this study suggests that variations in walking speed were unlikely to adversely affect plantar pressure measurements. The duration of load beneath the selected sites compared favorably with the EDG software reference range, with the mean pressure duration falling within the normal range for each site (Table 3). The reference range was derived from EDG tests of 251 subjects, between 18 and 25 years old, who had no significant clinical pathology and no asymmetry in gait parameters [24]. The patterns of initiation of loading beneath the foot were similar to those Blanc et al [25] found in 105 healthy barefoot adult subjects and in Cornwall and McPoil’s [26] inshoe, plantar pressure study of ten asymptomatic volunteers. On the basis of the sequence of loading beneath the foot and the duration of loading beneath the heel and forefoot, the subjects in this study appeared to exhibit a normal rollover process.
EDG Reliability
The degradation of pressure sensors that use forcesensitive resistor technology has been reported in other studies [13,27] and highlighted as a potential problem by other investigators who have used the EDG system [14,15]. The differences between pretest and post-test measurements in this study suggest that EDG measurements of peak pressure and total pressure per second reduced over time. This study confirmed the potentially unreliable nature of such parameters as peak pressure and total pressure normalized to 1 sec (force-time integral) with the use of the EDG system. Temporal measurements, however, appear to be consistent and reliable.
Effects of Rigid Orthoses
The duration of loading (pressure duration) beneath the heel, metatarsal heads, and hallux was reduced in the orthotic conditions by an average of 4.9% of stance phase (range, 0.8% to 8%). Wearing orthoses shifted the pressure duration toward the lower end of the normal EDG range for each site. Although research into the effects of orthoses has focused to some extent on the therapeutic benefits of reductions in peak pressures, the actual duration of loading may also be an important factor influencing tissue injury [28]. Therefore, this particular effect of the orthoses may be worth further investigation.
The duration of the subphases of stance was also affected in the orthotic trials. With Root orthoses, the duration of load support phase (EDG midstance) was shortened by 8.5% of stance phase; the propulsive phase increased by 5.7% of stance phase; and contact of the medial forefoot (EDG foot-flat) was delayed by 6.7% of stance phase. Blake orthoses shortened the duration of load support phase (EDG midstance) by 5.6% of stance phase; increased the propulsive phase by 5.3% of stance phase; and delayed contact of the medial forefoot by 6.6% of stance phase.
The time between heel strike of the support foot and toe-off of the opposite foot—load acceptance—is also the initial double-support period of gait. The double-support period of gait generally decreases with increasing speed until it disappears altogether in running [29]. The duration of the load support and propulsive phases could have been altered by variations in toe-off of the other foot (load acceptance). However, there was no difference in the duration of the load acceptance phase (EDG contact) between the conditions; therefore, this was extremely important in isolating the effects of the orthoses to the support foot.
Changes in load support and propulsion, and the shorter duration of load beneath the heel, suggest there might be an earlier heel lift for subjects wearing orthoses. Van Gheluwe et al [15] suggested that an early heel lift, associated with an equinus, manifests as a reduction in the duration of load beneath the EDG heel sensors, coupled with an increase in the duration of load beneath the forefoot sensors. In this study, there was no corresponding increase in the duration of loading beneath the forefoot sensors. In fact, it decreased. One possible explanation could be that the load was distributed beneath the midfoot. Other researchers have suggested that orthoses spread the load beneath the foot by increasing the weightbearing surface area [11,28] and provide support to the arch [30]. Langer et al [31] have suggested that the duration of heel contact and load support (EDG midstance) are prolonged with excessive subtalar joint pronation. They reason that a shortened heel contact coupled with a reduced loading support phase (EDG midstance), as seen with the orthoses in this study, is indicative of a more rapid and efficient transition of the foot into a “rigid lever” in preparation for propulsion. They suggest that such a transition is likely to be associated with control of subtalar joint pronation, but this is far from certain. McPoil and Cornwall [32] studied subjects who were minimal, normal, and maximal pronators on the basis of video gait analysis and found no relationship between plantar pressure characteristics and rearfoot motion when initiation of loading beneath the foot was considered.
Inspection of the EDG waveforms indicated that the forefoot was loading from lateral to medial in all subjects. Hence, the prolonged EDG foot-flat phase can be interpreted as a delay in loading the medial column of the foot, which may result from prolonged dorsiflexion of the first ray or prolonged inversion of the forefoot, as the foot accepts load. Tomaro and Burdett [33] and Nawoczenski and Ludewig [34] observed substantially prolonged activity of the anterior tibial muscle in patients wearing foot orthoses. While this would be a plausible explanation for the delay in loading the medial forefoot, this delay is in contrast with the finding of Cornwall and McPoil [26], who observed earlier medial loading with foot orthoses. This may be explained by differences in methodology. Cornwall and McPoil [26] used different orthotic designs and footwear as well as a different pressure measurement system. They placed pressure-measuring insoles beneath the orthoses and recorded the initiation of loading within a zone that delineated the first metatarsal head. This differs substantially from the present study, which uses a smaller discrete sensor over the metatarsal head, resting above the orthosis. The delayed medial forefoot contact could explain the shortened duration of pressure at these sites.
Changes were not observed in the time to peak pressure with orthoses. This was unexpected given that the same footwear and EDG equipment were used as in the Bennett et al14 study. Rigid carbonfiber orthoses would have been expected to have a larger effect than the polypropylene devices used in the earlier study. The different results may be related to the orthoses (fabricated by different technicians), the subjects (two different groups of symptomatic subjects), or the protocol (Bennett et al did not control walking speed).
Differences Between Root and Blake Orthoses
There was no significant difference between Blake and Root orthoses in time to peak pressure beneath the medial heel or fifth metatarsal head. The duration of load was marginally longer beneath the medial heel and the changes to load support phase were smaller with Blake devices, but neither difference was statistically significant.
While a significantly longer duration of loading beneath the fifth metatarsal head was evident for the Blake devices (75.0% versus 71.4% of stance phase, P < .05), the reason for this is unclear. The duration of load with the Blake devices was essentially the same as when wearing shoes alone. If the shorter duration of loading with the Root devices is related to support of the midfoot, the Blake orthoses may have provided less midfoot support. Further research with another subject group is required to confirm this finding.
This study had several limitations. First, sensor degradation prevented the investigation of the orthotic effects on peak pressure and total pressure measurements. Second, owing to the sensor placement, no information regarding midfoot loading was available. Third, the small differences between the devices may be related to two features of the study: the sensor locations and the generic design of the orthoses. As the medial heel sensor is placed adjacent to the longitudinal bisection of the plantar heel surface, it may not have been positioned to capture the point of maximum force application, which would be expected from the heel cup of the Blake orthoses (ie, anteromedial heel). The selected orthotic design specifications may have resulted in two very similar devices. Blake and Ferguson [3] and Baitch et al [7] both indicate that a 25° inverted orthosis is the minimum inversion device commonly used. Blake [6] estimates that it takes between 5° and 10° of cast inversion to produce an effect equivalent to 1° of extrinsic varus rearfoot posting on a Root device. In essence, the medial heel contours in this study may have been essentially the same for both styles of orthoses. In addition, the assessment of the effects of generic orthoses worn for only 1 week may not reflect the true effects of rigid orthoses used in treating patients. Finally, the symptomatic population with a wide range of complaints may have influenced the outcomes. It would have been useful to select subjects with a single foot pathology, as well as an asymptomatic control group.
Conclusion
As with other systems using force-sensitive resistor technology, the EDG system used in this study showed a reduction in pressure readings over time. Timing parameters determined by the EDG appeared to be reliable. Clinicians investigating foot pressures need to consider sensor performance as a factor that can affect their results.
Rigid foot orthoses have been shown to decrease the duration of contact beneath the heel and forefoot, delay medial forefoot contact, and alter the duration of components of the stance phase of gait. These effects were similar when orthoses were compared, and the differences that could be ascertained between the Blake and Root devices were subtle. A study of Blake devices fabricated with higher inversion angles would be useful for comparison of the devices.
More research is required into the clinical significance of the effects of these orthoses, although reducing the duration of load at specific sites beneath the foot may have benefits for patients with pathology localized to these sites. Delaying the initiation of medial forefoot loading may be beneficial for subjects who load this part of the foot excessively or prematurely. Further research using full-length pressure-recording insoles with video analysis or goniometry equipment would provide more extensive information about the orthoses’ effects and designs. In particular, changes in contact surface area, tilting of the foot, and loading beneath the midfoot need to be investigated.
Acknowledgment
Daniel Whitham for his assistance with the data collection procedures of this study. This research was partly funded by the Australian Podiatry Education and Research Foundation, Sunstate and Artisan Orthotic Laboratories, and Queensland University of Technology.
References
- Nicolopoulos, C.S.; Black, J.; Anderson, E.G. Foot orthoses and lower extremity pathology. Foot 1999, 9, 110. [Google Scholar] [CrossRef] [Scilit]
- Levitz, S.J.; Whiteside, L.S.; Fitzgerald, T.A. Biomechanical foot therapy. Clin. Podiatr. Med. Surg. 1988, 5, 731. [Google Scholar] [CrossRef] [Scilit]
- Blake, R.L.; Ferguson, H. The inverted orthotic technique: a practical discussion of an orthotic therapy. J. Br. Podiatr. Med. 1993, 48, 25. [Google Scholar]
- Root, M.L. Development of the functional orthosis. Clin. Podiatr. Med. Surg. 1994, 11, 183. [Google Scholar] [CrossRef] [Scilit]
- Pratt, D.J. Functional foot orthoses. Foot 1995, 15, 101. [Google Scholar] [CrossRef] [Scilit]
- Blake, R.L. Inverted functional orthosis. J. Am. Podiatr. Med. Assoc. 1986, 76, 275. [Google Scholar] [CrossRef] [Scilit]
- Baitch, S.P.; Blake, R.L.; Fineagan, P.L.; et al. Biomechanical analysis of running with 25 degrees inverted orthotic devices. J. Am. Podiatr. Med. Assoc. 1991, 81, 647. [Google Scholar] [CrossRef] [Scilit]
- Nawoczenski, D.A.; Cook, T.M.; Saltzman, C.L. The effect of foot orthotics on three-dimensional kinematics of the leg and rearfoot during running. J. Orthop. Sports Phys. Ther. 1995, 21, 317. [Google Scholar] [CrossRef] [Scilit]
- Kilmartin, T.E.; Wallace, W.A. The scientific basis for the use of biomechanical foot orthoses in the treatment of lower limb sports injuries: a review of the literature. Br. J. Sports Med. 1994, 28, 180. [Google Scholar] [CrossRef] [Scilit] [PubMed]
- Landorf, K.B.; Keenan, A.-M. Efficacy of foot orthoses: what does the literature tell us? Australas. J. Podiatr. Med. 1998, 32, 105. [Google Scholar] [CrossRef] [Scilit] [PubMed]
- Albert, S.; Rinoie, C. Effect of custom orthotics on plantar pressure distribution in the pronated diabetic foot. J. Foot Ankle Surg. 1994, 33, 598. [Google Scholar]
- Poon, C.; Love, B. Efficacy of foot orthotics for metatarsalgia. Foot 1997, 7, 202. [Google Scholar] [CrossRef] [Scilit]
- Brown, M.; Rudicel, S.; Esquenazi, A. Measurement of dynamic pressures at the shoe-foot interface during normal walking with various foot orthoses using the FSCAN system. Foot Ankle 1996, 17, 152. [Google Scholar] [CrossRef] [Scilit] [PubMed]
- Bennett, P.J.; Miskewitch, V.; Duplock, L.R. Quantitative analysis of the effects of custom-molded orthoses. J. Am. Podiatr. Med. Assoc. 1996, 86, 307. [Google Scholar] [CrossRef] [Scilit]
- Van Gheluwe, B.; SmeKens, J.; Roosen, P. Electrodynographic evaluation of the foot during treadmill versus overground locomotion. J. Am. Podiatr. Med. Assoc. 1994, 84, 598. [Google Scholar] [CrossRef] [Scilit] [PubMed]
- Root, M.L.; Weed, J.H.; OrIen, W. Neutral Position Casting Techniques; Clinical Biomechanics Corp.: Los Angeles, CA, USA, 1971. [Google Scholar]
- Anthony, R.J. The fabrication protocol for the manufacture of a functional foot orthosis. J. Br. Podiatr. Med. 1992, 47, 91. [Google Scholar]
- Nilsson, J.; Thorstensson, A. Ground reaction forces at different speeds of human walking and running. Acta Physiol. Scand. 1989, 136, 217. [Google Scholar] [CrossRef] [Scilit]
- Rosenbaum, D.; Hautmann, S.; Gold, M.; et al. Effects of walking speed on plantar pressure patterns and hindfoot angular motion. Gait Posture 1994, 2, 191. [Google Scholar] [CrossRef] [Scilit]
- Learn to Look at the Data and More. In EDG Printouts: News and Updates of the Electrodynogram System; Langer Foundation for Biomechanics and Sports Medicine Research: Deer Park, NY, USA, 1990.
- Gastwirth, B.W.; O’Brien, T.D.; Nelson, R.M.; et al. An electrodynographic study of foot function in shoes of varying heel heights. J. Am. Podiatr. Med. Assoc. 1991, 81, 463. [Google Scholar] [CrossRef] [Scilit]
- Sutton, A.J.; Muir, K.R.; Jones, A.C. Two knees or one person: data analysis strategies for paired joints or organs. Ann. Rheum. Dis. 1997, 56, 401. [Google Scholar] [CrossRef] [Scilit]
- Stevens, J. Applied Multivariate Statistics for the Social Sciences, 2nd ed.; Lawrence Erlbaum: Hillsdale, NJ, USA, 1992. [Google Scholar]
- Langer, S.; Polchaninoff, M.; Hoerner, E.F. Principles and Fundamentals of Clinical Electrodynography; Prepublication Draft; Sheldon Langer, 1984. [Google Scholar]
- Blanc, Y.; Balmer, C.; Landis, T.; et al. Temporal parameters and patterns of the foot roll over during walking: normative data for healthy adults. Gait Posture 1999, 10, 97. [Google Scholar] [CrossRef] [Scilit]
- Cornwall, M.W.; McPoil, T.G. Effect of foot orthotics on the initiation of plantar surface loading. Foot 1997, 7, 148. [Google Scholar] [CrossRef] [Scilit]
- Rose, N.E.; Feiwell, L.A.; Cracchiolo, A. A method for measuring foot pressures using a high resolution, computerized insole sensor: the effect of heel wedges on plantar pressure distribution and center of force. Foot Ankle 1992, 13, 263. [Google Scholar] [CrossRef] [Scilit]
- Mueller, M.J. Application of plantar pressure assessment in footwear and insert design. J. Orthop. Sports Phys. Ther. 1999, 29, 747. [Google Scholar] [CrossRef] [Scilit]
- Bates, B.; Stergiou, N. Normal Patterns of Walking and Running. In Sports Medicine of the Lower Extremity, 2nd ed.; Subotnick, S.I., Ed.; Churchill Livingstone: New York, NY, USA, 1999; p. 157. [Google Scholar]
- Kogler, G.F.; Solomonidis, S.E.; Paul, J.P. In-vitro method for quantifying the effectiveness of the longitudinal arch support mechanism of a foot orthosis. Clin. Biomech. 1995, 10, 245. [Google Scholar] [CrossRef] [Scilit]
- Langer, S.; Polchaninoff, M.; Hoerner, E.F.; et al. A Practical Manual of Clinical Electrodynography; Langer Foundation for Biomechanics and Sports Medicine Research: Deer Park, NY, USA, 1989. [Google Scholar]
- McPoil, T.G.; Cornwall, M.W. Relationship between rearfoot motion and plantar surface loading of the foot during walking. R. Belg. Soc. Phys. Med. Rehabil. 1992, 2, 22. [Google Scholar]
- Tomaro, J.; Burdett, G. The effects of foot orthotics on the EMG activity of selected leg muscles during gait. J. Orthop. Sports Phys. Ther. 1993, 18, 532. [Google Scholar] [CrossRef] [Scilit] [PubMed]
- Nawoczenski, D.A.; Ludewig, P.M. Electromyographic effects of foot orthotics on selected lower extremity muscles during running. Arch. Phys. Med. Rehabil. 1999, 80, 540. [Google Scholar] [CrossRef] [Scilit] [PubMed]

© 2001 American Podiatric Medical Association