


Abstract
Background: It is important to determine the plantar pressure distribution of schoolchildren by applying static and dynamic foot analyses using a pedobarography device. However, it is difficult to obtain clear interpretations from results that can be explained by a large number of plantar pressure variables. The aim of this study was to use principal component analysis (PCA) to predict the main components for reducing the size of big data sets, provide a practical overview, and minimize information loss on the subject of plantar pressure assessment in youths. Methods: In total, 112 schoolchildren were included in the study (mean ± SD: age, 10.58 ± 1.27 years; body mass index, 18.86 ± 4.33). During the research, a pedobarography device was used to obtain plantar pressure data. Each foot was divided into six anatomical regions and evaluated. Global and regional plantar pressure distributions, load and surface areas, pressure-time integrals, weight ratios, and geometric foot properties were calculated. Results: The PCA yielded ten principal components that together account for 81.88% of the variation in the data set and represent new and distinct patterns. Thus, 137 variables affecting the subject were reduced to ten components. Conclusions: The numerous variables that affect static and dynamic plantar pressure distributions can be reduced to ten components by PCA, making the research results more concise and understandable.
Because the feet are a foundational body structure for movement, determining the plantar pressure distribution is extremely important. It may vary depending on factors such as foot anthropometry, contact area, age, sex, and body mass. Although body development depends on nutrition, physical activity level, body structure, general health status, and genetic characteristics, its reflections can be observed as structural and functional changes of the feet [1–3].
Many anatomical features can directly affect foot function. For example, arches of the feet that resist body weight and act as a bridge allow forces to be transferred to the ground. The change in the height of these structures causes the plantar distribution to differ. Especially in children, with the progression in the shape and size of anatomical structures such as bones and muscles, plantar pressure parameters and, consequently, kinesiologic gait variables also change in the growing period [4–7]. In previous studies, it was stated that children’s feet reached an average maturity level at 6 to 8 years old, on average. However, recent studies have held that gait maturation is completed between ages 8 and 13 years [7–11]. Therefore, this age range is important for plantar distribution analyses.
Abnormal plantar distribution and foot postures affect development of the lower extremities and give rise to overuse injuries such as patellar tendinitis, plantar fasciitis, and knee pain. In such cases, plantar analyses are valuable for planning of the rehabilitation strategies in the early period. Changes that may occur during the stance phase of the gait cycle should be closely observed in the young population. For this purpose, plantar pressure assessment provides information about plantar loading characteristics during walking [12–14].
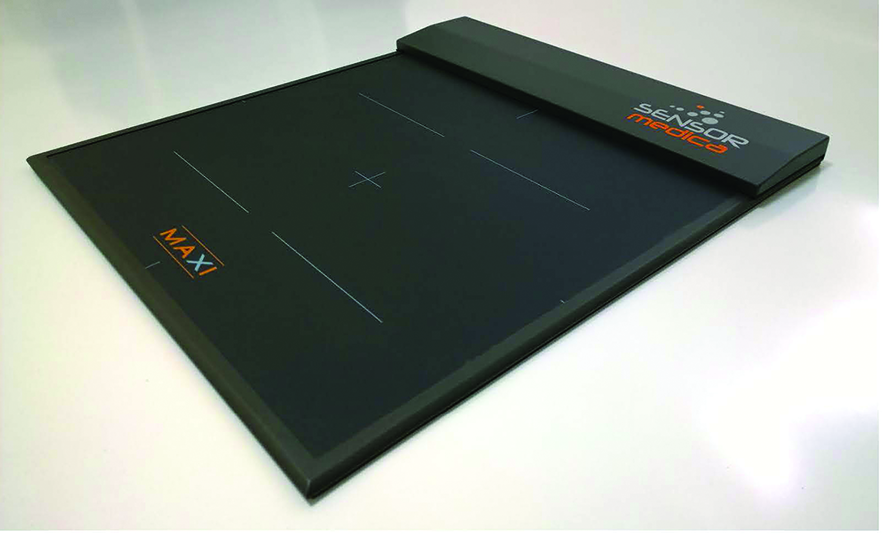
In the past, the footprint method (1920-1930) was used to assess the plantar region. In this method, footprint recordings reveal the contact area of the plantar surface, but the distribution of transmitted pressures is neglected. Today, more objective measurements can be made with accurate sensor technology. Plantar pressure measurements are performed with noninvasive and relatively simple pedobarography technology (Fig. 1). Plantar pressure analysis involves quantification and interpretation of the force applied to the ground and its distribution over the plantar surface. However, such analysis gives rise to many variables, which then need to be interpreted [15–17].
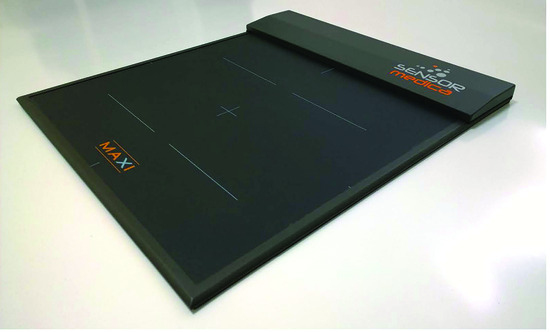
Figure 1.
Pedobarography device.
Although many variables are obtained as a result of the analysis, it is not clearly known by clinicians how important the variables are, and their relationships with each other cannot be clearly interpreted [18,19]. The aim of the present study was to use principal component analysis (PCA) to predict the main components for reducing the size of big data sets, provide a practical overview, and minimize information loss on the subject of plantar pressure assessment in youths.
Methods
Participants
To estimate the study sample size, according to the literature, [20], the mean ± SD plantar pressure value for each region of the foot was reported to be 0.98 ± 0.29 MPa. When the mean pressure was taken as 0.70 MPa according to 80% power, it was calculated that 100 participants should be included based on the results of the statistical analysis (R, Version 3.6.2–CRAN; R Foundation for Statistical Computing, Vienna, Austria).
Children who had no problems that prevented them from standing and walking and had no wounds, ulcers, calluses, etc, in the plantar region met the inclusion criteria. Children who used a walking aid; had wounds, ulcers, calluses, etc, in the plantar region; or had undergone lower-extremity surgery in the past year were not included in the study.
The study included 112 schoolchildren (mean ± SD: age, 10.58 ± 1.27 years; body mass index, 18.86 ± 4.33). Fifty-five percent of participants had a normal body mass index, 29% were overweight, 10% were obese, 3% were thin, and 3% were cachectic. First, the feet of the participants were examined carefully by visual inspection and palpation to ensure that there were no cuts, wounds, or ulcers. The demographic characteristics of each participant were recorded. During the analysis phase, a pedobarography device was used to obtain static and dynamic plantar pressure data. Ethical approval was received from the ethics committee of Biruni University (Istanbul, Turkey).
Pedobarography
Pedobarography is a high-tech method used in the diagnosis and treatment of foot problems. It is a new method that measures static and dynamic loading between the foot and the ground. A foot pressure platform calculates pressure distribution in the plantar area and transmits the data via cable to a computer. Within the scope of the research, a freeMed pedobarography device with freeStep software (Sensor Medica, Guidonia Montecelio, Italy) was used. This is a pressure platform made of aluminum with dimensions of 120 × 50 cm, 8 mm thick, a sensor life of 1,000,000 cycles, 10,000 sensors, 2.5 dpi XY, 8-bit Z resolution, and maximum pressure of 150 N/cm2. When evaluating the foot with freeStep software, each foot was divided into three basic regions—forefoot, midfoot, and rearfoot—and then these regions were each divided into medial and lateral. Thus, analysis was performed on six regions for each foot.
During the assessment, the participants were asked to walk on the freeMed platform, and the plantar pressure results were displayed graphically on the computer screen. As a result of the analysis, warm and cold areas were observed in the image obtained on the computer screen. Areas of high pressure are marked using “warm” colors (red or yellow), and areas of low pressure are marked using “cold” colors (blue or green). The intensity of color is proportional to the pressure received. For the pedobarography device, values of 0.00 to 0.250 MPa are colored blue or green and values greater than 0.250 to 0.350 MPa are colored yellow or red due to the amount of pressure. High pressure values greater than 0.350 MPa are symbolized as dark red colors. The device is calibrated according to the participant’s weight [12,20]. There are different normal ranges for pressure values in the literature. In a study conducted on a cadaver foot, 0.00 to 0.200 MPa is classified as a cold area and 0.200 to 0.300 MPa as a warm area [21]. In another study performed with an anatomical foot model produced in the computer environment, 0.00 to 0.112 MPa was defined as a cold area and 0.112 to 0.167 MPa as a warm area [22].
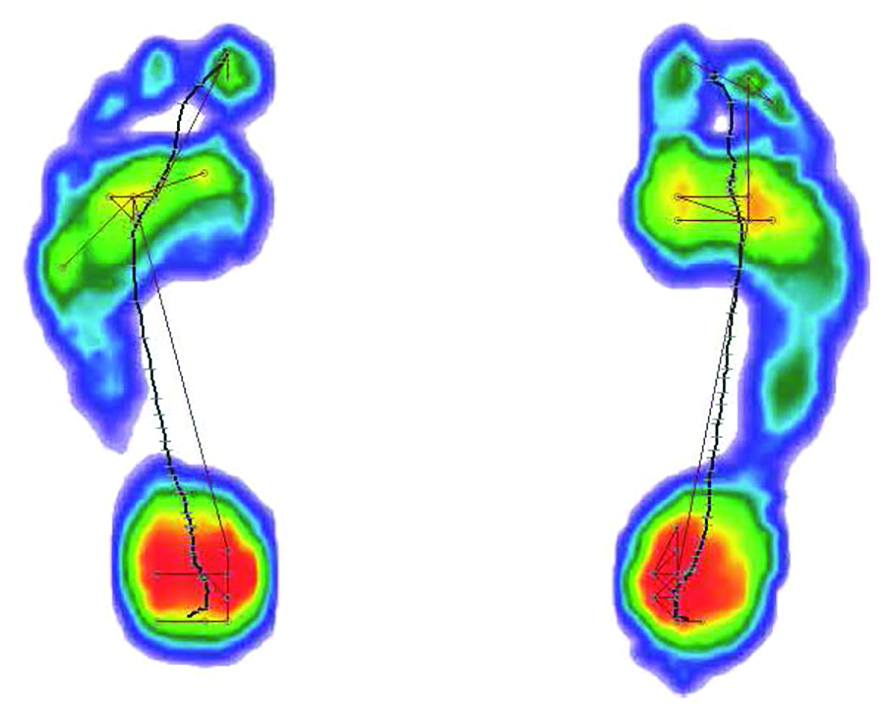
During the static analysis, the participants were asked to stand on the pressure platform for 1 min (Fig. 2). During the dynamic analysis, they were asked to walk along the platform at a natural walking speed (Fig. 3). The participants were analyzed three times in the same session by pedobarography, and averages of the three results were recorded. Before the test, at least two trial gaits were made for each participant. For the test to be valid, the footprint had to be clearly displayed on the computer, otherwise the test was repeated [1,5,13].
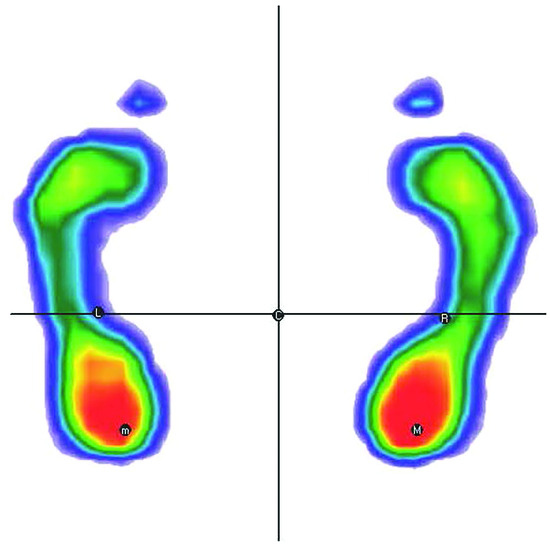
Figure 2.
Static plantar pressure analysis.
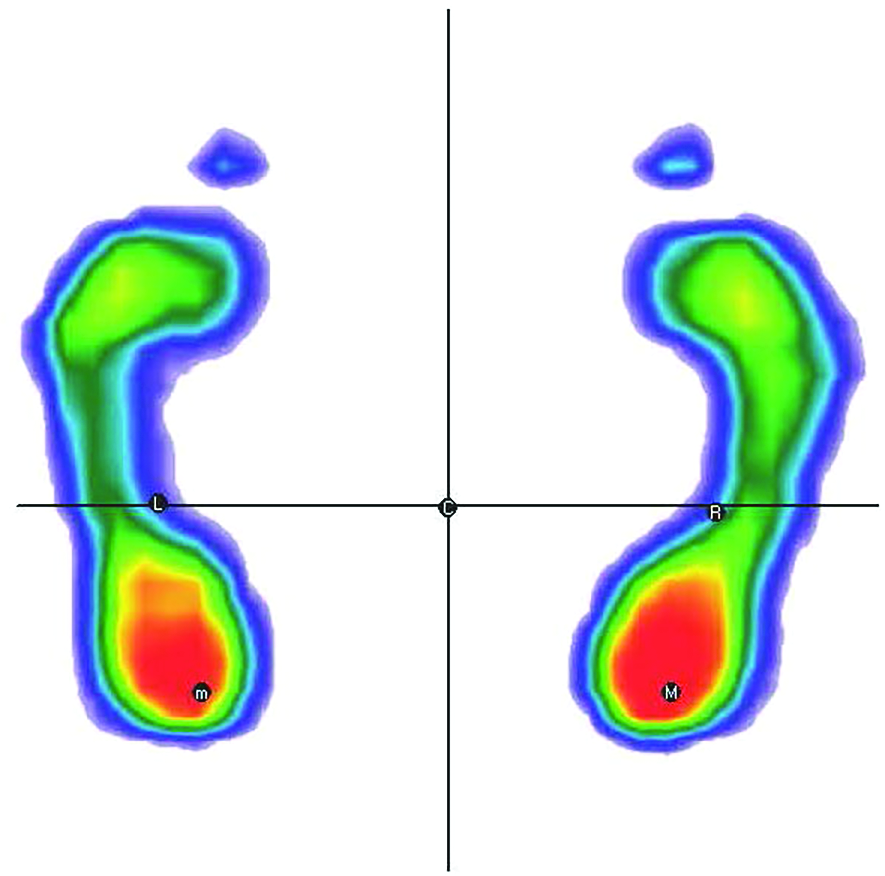
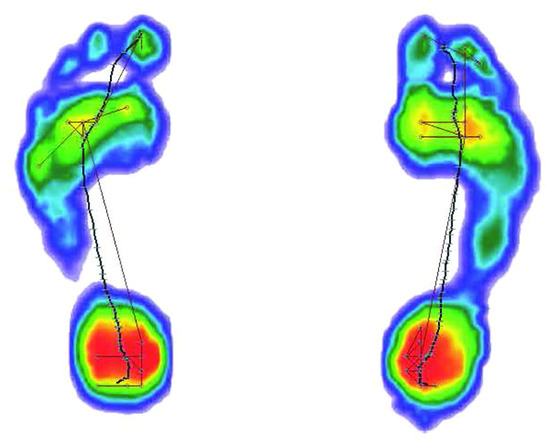
Figure 3.
Dynamic plantar pressure analysis.
Statistical Analysis
Principal component analysis is a multivariate statistics method. It reduces the multidimensionality of a relevant multivariate data set to a small number of independent main components. Each principal component (PC) contains all of the variable information and new variables created as linear combinations or mixtures of initial variables.
In this study, PCA was conducted on 137 plantar pressure variables. In the dynamic analysis, total area of the feet (surface), length of the footprint, average distribution of the load, points of maximum pressure, stance phase temporal parameters (rocker durations), load distribution between forefoot and rearfoot, lateral distribution of the load, foot angle, total phases, and center of force variables were calculated. In the static analysis, total area of the forefoot, rearfoot, and total foot; distribution of the load; percentage of load between forefoot and rearfoot; point of maximum pressure; and average distribution of the load were calculated.
For the proper use of PCA, the data were tested with Kaiser-Meyer-Olkin and Bartlett tests. These tests were used to examine the adequacy of the selected sample and the independence of each variable, respectively. First, PCs with eigenvalues greater than 1.0 were considered, and ten were selected.
Two-sided P ≤ .05 was considered significant. All of the statistical analyses were performed with R, Version 3.6.2 (2019-12-12)–CRAN [23].
Results
According to the results of the PCA, ten PCs explained 81.88% of the total variance (Table 1). Factor loadings of the PCs are given in Table 2. The first PC has the largest possible variance (23.75%), and only some components are selected to represent the correlated variables. As a result, the dimension of the variable space is reduced. The dynamic and static total/regional surface areas, weight, foot length/width, height, and age variables were included in PC-1. It reflects the relationships among plantar surface area, foot geometry, and body anthropometry.

Table 1.
Principal Components
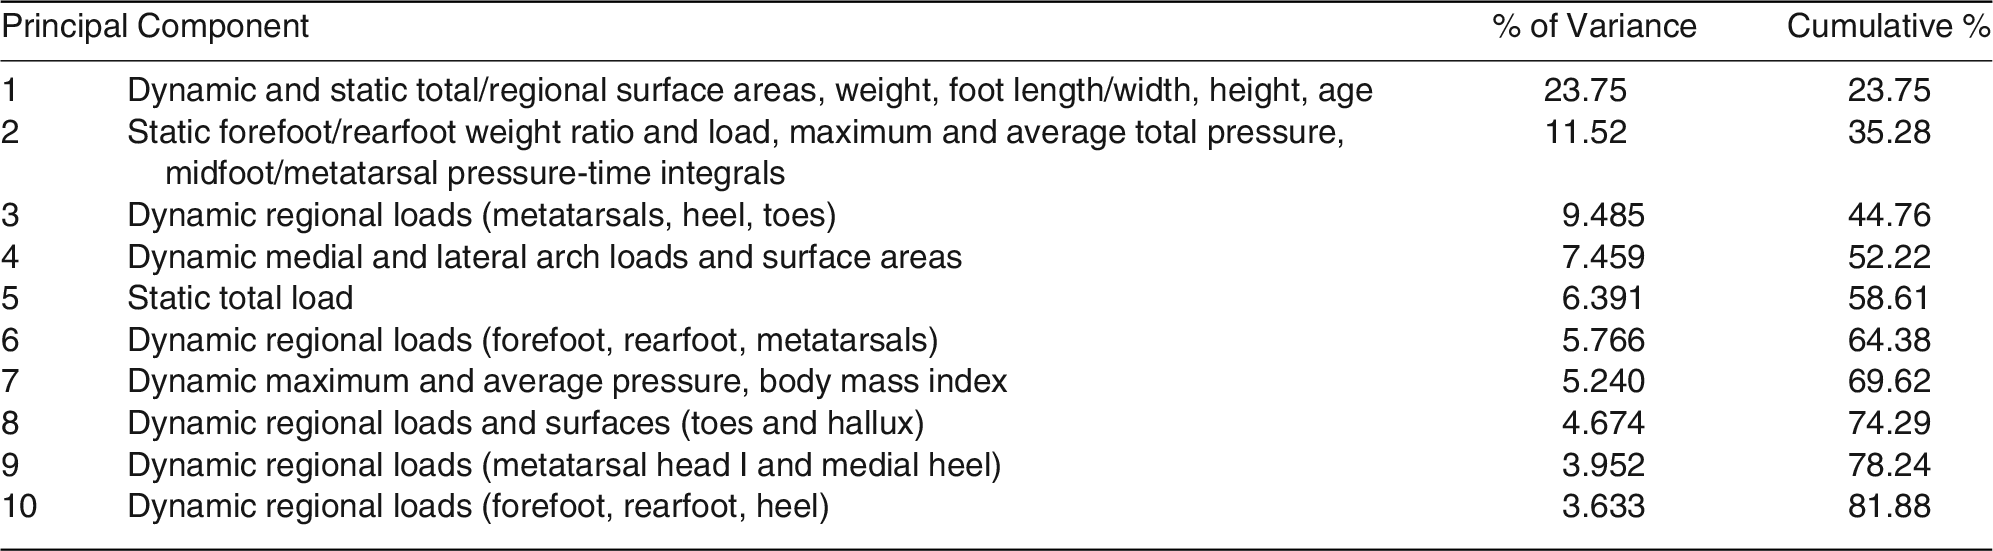
Table 2.
Factor Loadings of the Static and Dynamic Plantar Pressure Variables Examined with Principal Component Analysis
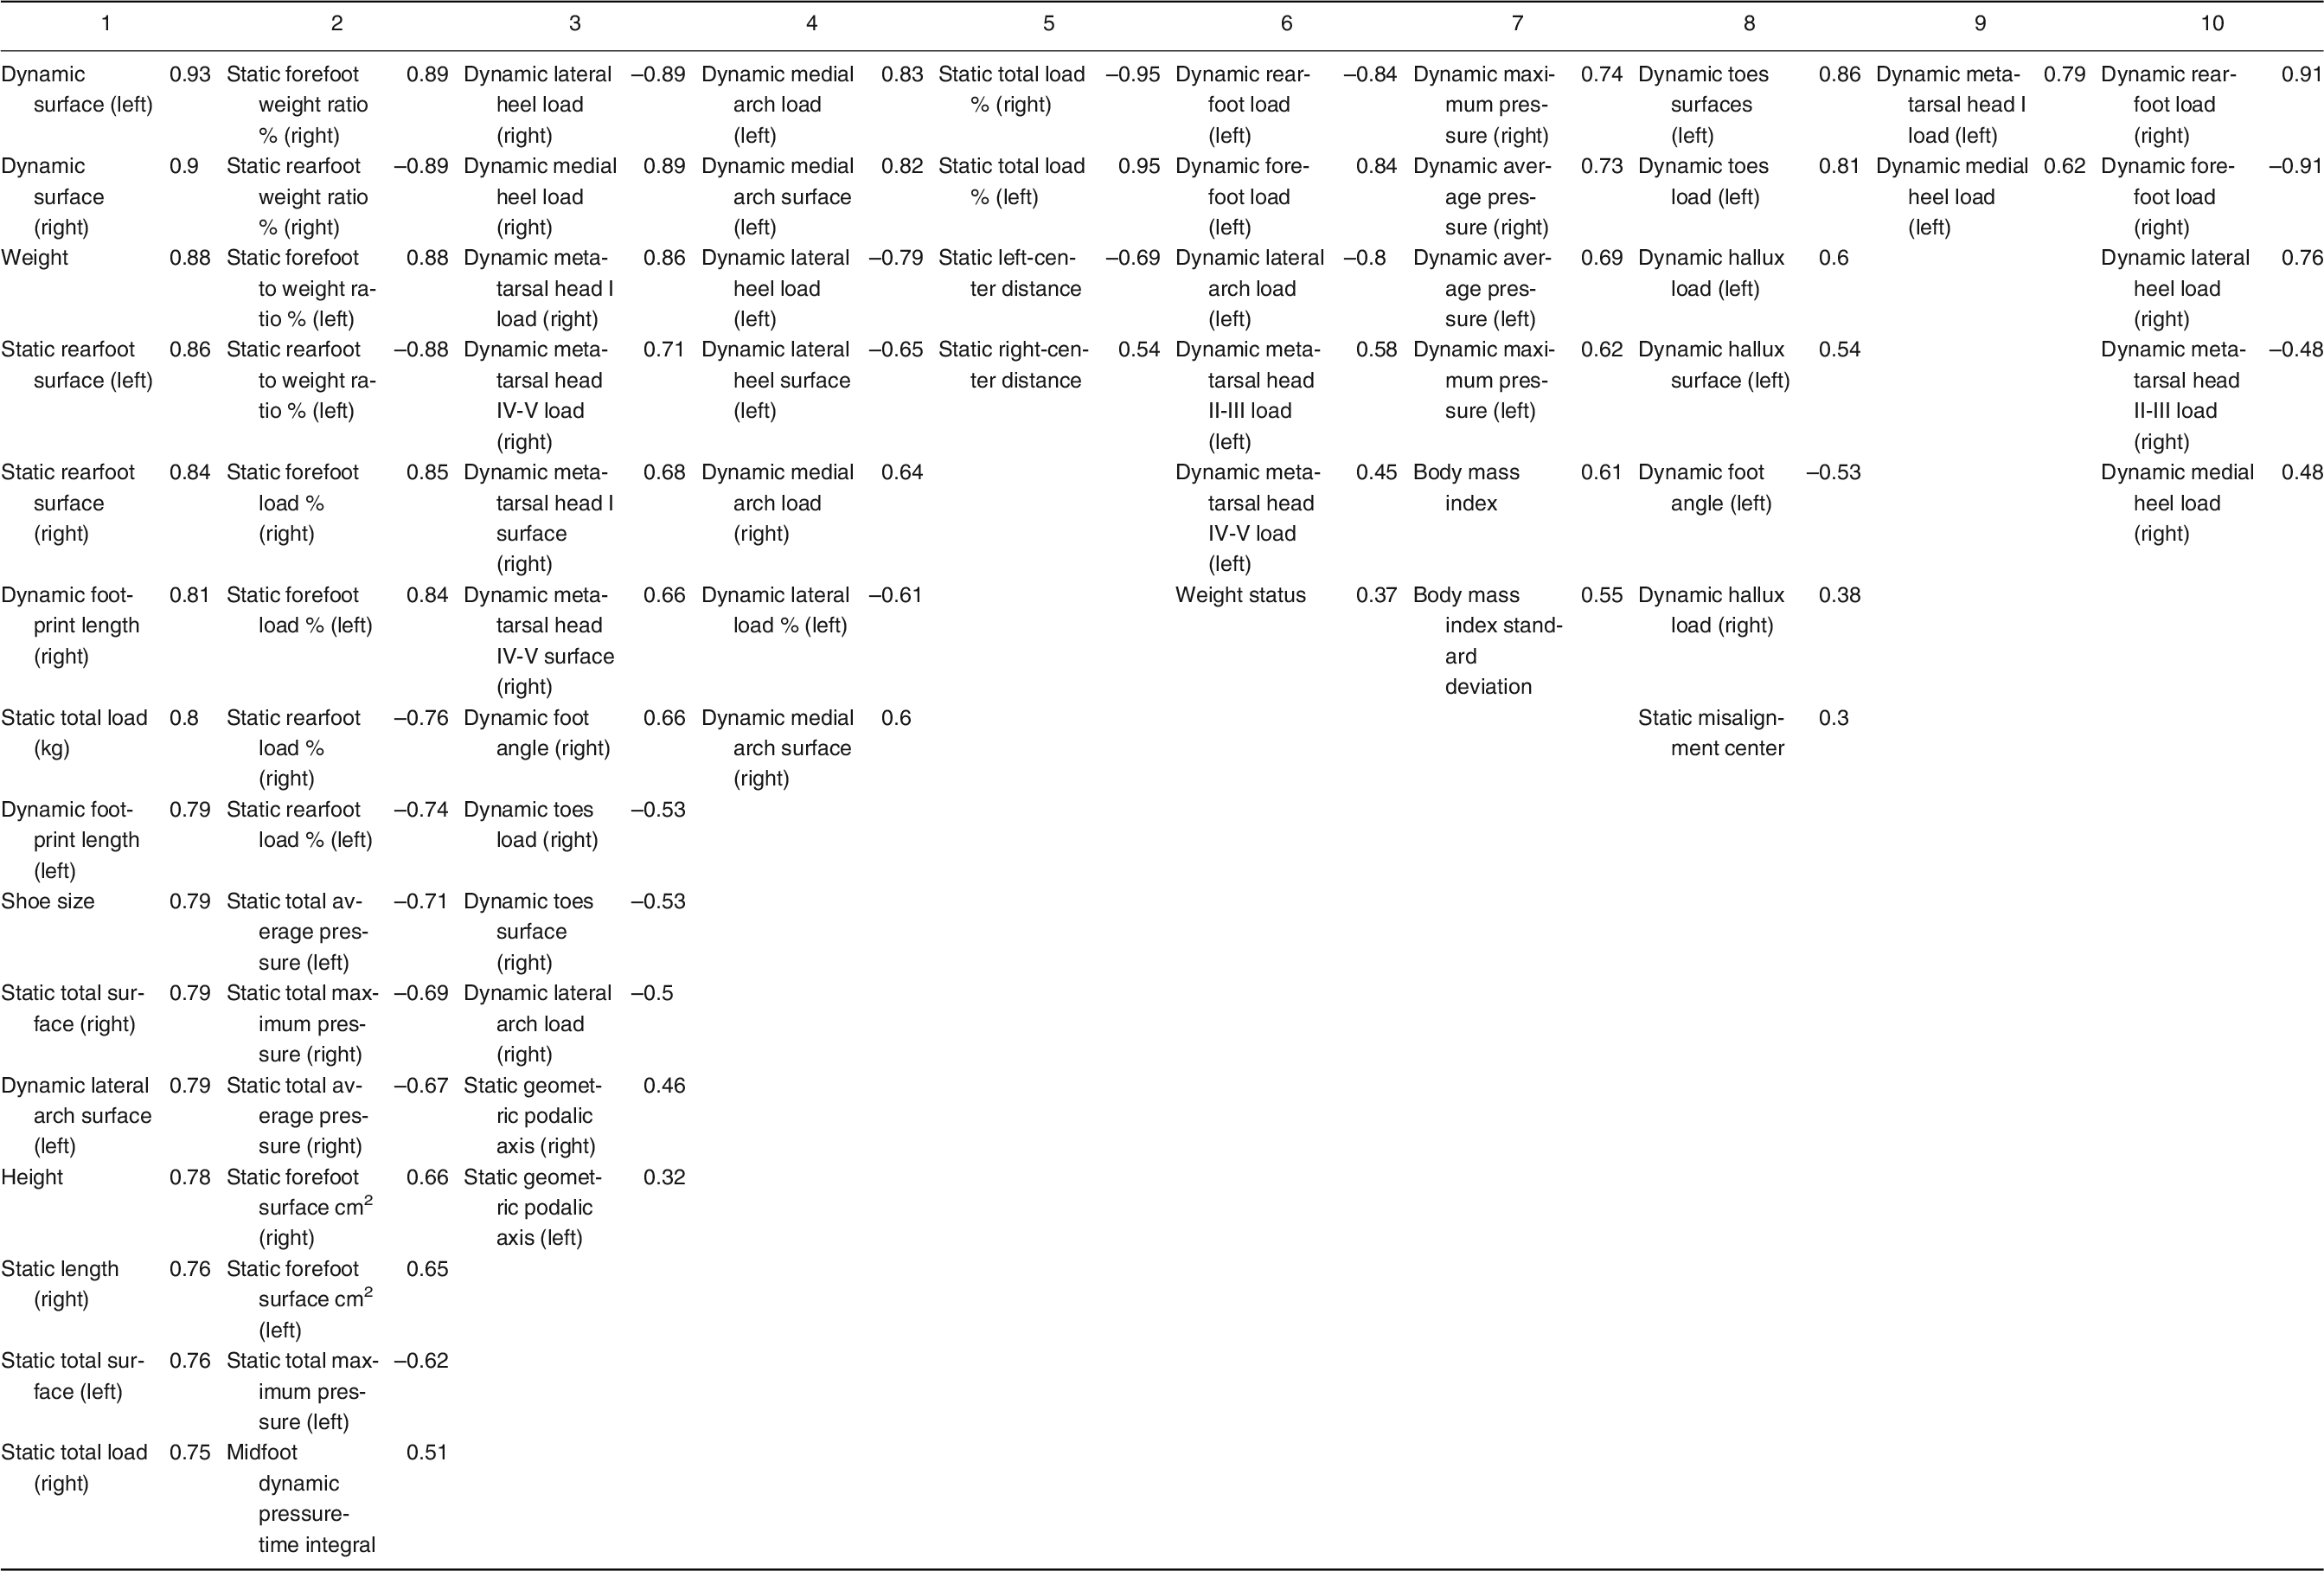
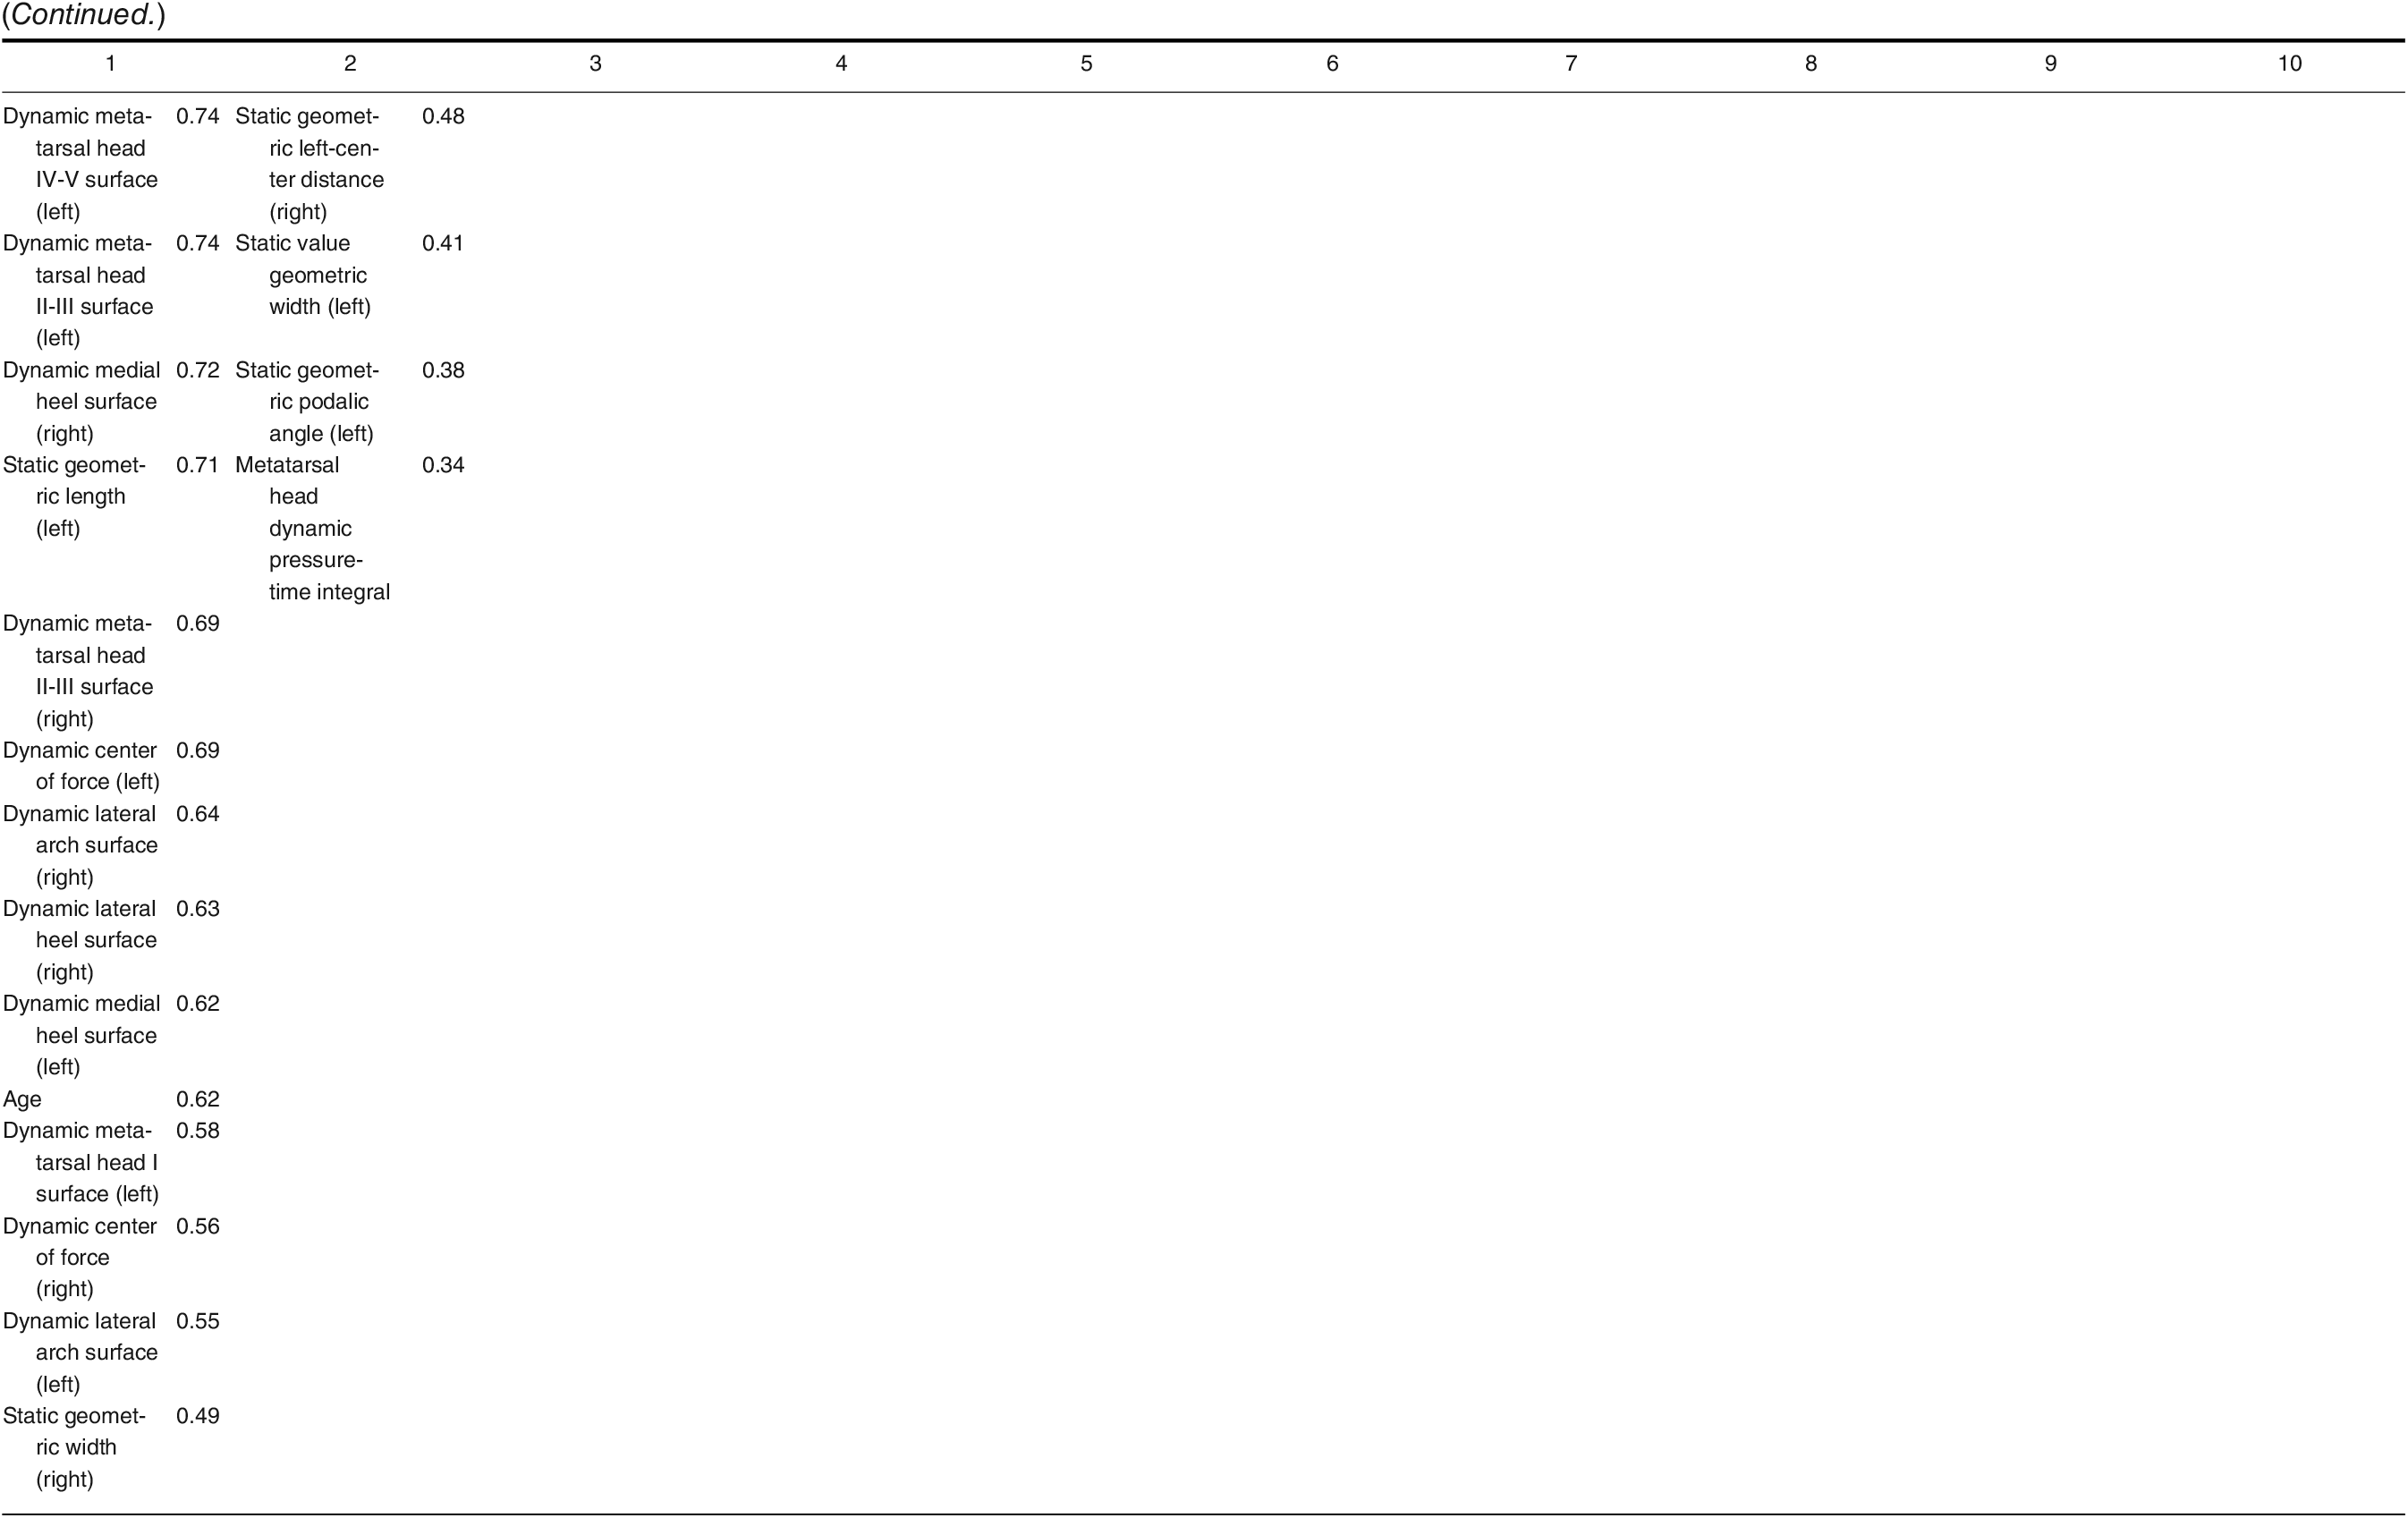
At 11.52% variance, PC-2 is complementary to PC-1 and captures temporal variables that are important for the pressure/time relationship. This component also contains an important variable called forefoot/rearfoot weight ratio. This variable is correlated with the maximum and average total pressures. Interpretation of this relationship in the young population is expected to have valuable results.
Dynamic analysis, which illustrates the nature of walking much more effectively by measuring multiple steps, is observed in eight PCs. Variables of these components contain plantar regions such as the heel, metatarsal heads, and medial arch, which play an important role in carrying the load during walking. Dynamic regional plantar pressure and surface area variables are explained by eight components defined as PC-1, PC-2, PC-3, PC-4, PC-6, PC-8, PC-9, and PC-10.
PC-7 represents the correlation of dynamic maximum/average pressure and body mass index variables. Static pressure seems to be explanatory in terms of general variables such as plantar pressure levels and pressure percentages. We can detect these variables in PC-1, PC-2, and PC-5.
There are also some negatively related variables within the components (ie, in PC-2 and PC-6). The negative variables in PC-2 can be listed as static rearfoot weight ratio, rearfoot load, and average and maximum total pressure and those in PC-6 as dynamic rearfoot load and lateral arch load.
Discussion
Abnormal foot posture affects a large population, so applying the plantar analysis to children in the developmental period will provide early detection of the problems. Although it is exciting for clinicians to apply these high-tech analyses, a large number of variables are obtained, and their interpretation can be just as complicated. In this respect, with the PCA application, the clinician will be able to easily understand which variables should be focused on, and this will bring accuracy and practicality to the evaluations.
When the results of current studies are examined, it is seen that the data are generally analyzed using a univariate method [1,2,4,6,12]. However, multivariate statistical methods consider variations in all of the variables as a whole and, hence, obtain more sensitive and powerful results than univariate statistical methods can yield. When univariate analysis is used for multivariate data, the validity and reliability of the results decrease because of the shortcomings of the test and loss of information. This can be prevented by using PCA [23]. With this advanced statistical method, we obtained ten components for interpreting the data more easily. These components enabled a systematic classification of many important variables obtained from static and dynamic plantar analyses.
The first component of the research (23.75% variance) includes static and dynamic total and regional plantar surface areas, geometric features such as foot length/width, height, and weight variables. Even minor changes in foot structure can affect plantar pressure area and distribution. Therefore, these plantar variables define the foot posture [24]. As children get older, foot length and width develop, in addition to height and weight, and it starts to resemble an adult foot, especially from age 8 years. And these factors affect the size and distribution of plantar loads. The amount of plantar loading gradually increases with the emergence of secondary sexual characteristics; rapid development of bones, ligaments, and tendons; and maturation, especially during adolescence [6,25]. In particular, abnormally increased regional plantar surface area may be associated with severe deformities such as pes planus and hallux valgus [26,27]. Therefore, it is important to follow the variables mentioned in PC-1 regularly for this population.
Dynamic midfoot and metatarsal head pressure-time integrals, which are observed to be related in PC-2 (11.52% variance), are not commonly investigated in the literature, to our knowledge. In addition to the amount of pressure, duration is also a variable that should not be ignored [13]. Especially in the midfoot and metatarsal regions, the increase or decrease in plantar pressure is associated with arch height and, of course, foot posture [28]. It would be helpful to diversify research on this new finding.
Considering the mediolateral regions of the forefoot and the heel as a functional triangle, the shape changes that may disrupt the balance of this structure will cause symptoms such as pain, deformity, and instability [13]. Also, PC-2 reveals the relationship between forefoot plantar load and weight ratio. Even if the total amount of pressure increases with growth, this ratio should remain within healthy limits. The plantar pressure percentage for each foot should be normally distributed for 60% on the rearfoot and 40% on the forefoot. This is a strategy for healthy load distribution [7]. That is why it is important to evaluate this ratio with pedobarographic analysis.
According to the results of the study by Feka et al [7] conducted on children aged 7 to 12 years, it was determined that the rearfoot was the region with the highest pressure of all. As mentioned previously herein, evaluations should be planned to preserve the healthy distribution between the foot segments rather than the area where the load is maximum. For this reason, it will be more effective to follow the variables mentioned in PC-1 and PC-2 in the developmental period.
The relationship between dynamic mediolateral arch plantar pressure percentages and mediolateral surface area is observed in PC-4. Foot shape and medial longitudinal arch geometry are closely related variables [29]. The increase in surface area and plantar load in the medial arch is the main sign of the decrease in medial arch height. Conversely, the increase in medial arch height will cause displacement of the load to the lateral arch [27,30].
Another important point in terms of plantar analysis studies is to examine the foot by dividing it into regions because each area of the foot has a special functional importance for walking. Štefan et al [4] applied dynamic plantar pressure analysis to children in an age range similar to the present study, but unlike our research, the foot was evaluated as a whole and not divided into zones. Only maximum and average pressures and contact areas were calculated, without temporal parameters [4]. In the present study, we analyzed many important dynamic and static plantar variables by dividing each foot into six regions and interpreting the related variables. If the foot is not evaluated in total and regionally, only increasing and decreasing plantar pressure values, depending on weight, will be obtained. Interpreting these evaluations in relation to temporal parameters will increase the dimension of the analysis.
In another study, 175 children aged 10 to 15 years were assessed, and dynamic and static plantar pressures were measured. In the dynamic test, a significant correlation was found between the lateral pressure and left foot anthropometric measures [6]. Similarly, in PC-6, according to the dynamic analysis results, the lateral arch and weight variables were related. This relationship is about midfoot balance distribution. Changes in foot posture affect the load distribution in this region.
Dulai et al [13] suggested that there is no difference between the characteristics of adult and juvenile feet. So the measurements applied to young people reflect the foot health of the whole society. However, to achieve this exactly, it is necessary to select the important variables that can fully describe the foot posture among many variables.
According to Demirbüken et al, [31] changes in the plantar pressure of children in early adolescence are a possible risk factor for structural foot problems. This is why we chose this population for the present research. Age is an important variable for this study and is included in PC-1. With increasing age, the problems become permanent, and it becomes increasingly difficult to change the foot structure. For this reason, it is necessary to intensify foot analysis studies on the young population.
Müller et al [25] revealed that dynamic plantar pressure measurement gives more additional information than static analysis in children aged 1 to 13 years. When all of the PCs are considered in the present study, it has been clearly determined that dynamic analysis takes place in a dominant way. Dynamic plantar pressure parameters were captured in eight PCs in the present study.
Although the results of the present study include findings from many studies in the literature, from a different point of view, the plantar pressure analysis data have been classified by the PCA method and transformed into main components that need to be focused on in the clinic.
Conclusions
The evaluation of plantar pressure distribution is becoming increasingly popular with the contribution of modern technology. However, a large number of variables are detected as a result of plantar pressure analysis. This situation can prevent effective use of the obtained data and cause serious confusion. Interpreting this complex structure by reducing the data to fewer components will make the analysis results more concise and understandable. This will enable more effective use of this technology, which has been widely applied to evaluate the foot health of youths.
Funding
None reported.
Conflicts of Interest
None reported.
References
- Bennetts CJ, Owings TM, Erdemir A, et al: Clustering and classification of regional peak plantar pressures of diabetic feet. J Biomech 46: 19, 2013.
- Keijsers NLW, Stolwijk NM, Louwerens JWK, et al: Classification of forefoot pain based on plantar pressure measurements. Clin Biomech (Bristol, Avon) 28: 350, 2013.
- Rouhani H, Favre J, Crevoisier X, et al: Ambulatory assessment of 3D ground reaction force using plantar pressure distribution. Gait Posture 32: 311, 2010.
- Štefan L, Kasović M, Zvonar M: Association between the levels of physical activity and plantar pressure in 6-14-year-old children. PeerJ 8: e8551, 2020.
- Booth BG, Hoefnagels E, Huysmans T, et al: PAPPI: personalized analysis of plantar pressure images using statistical modelling and parametric mapping. PLoS One 15: e0229685, 2020.
- Matlosz P, Szybisty A, Momola I, et al: Plantar pressure distribution assessment of young school children. Sci Rev Phys Culture 7: 2, 103, 2017.
- Feka K, Brusa J, Cannata R, et al: Is bodyweight affecting plantar pressure distribution in children? an observational study. Medicine (Baltimore) 99: e21968, 2020.
- Zhao Y, Zheng D, Yan S, et al: Children with obesity experience different age-related changes in plantar pressure distributions: a follow-up study in China. Int J Environ Res Public Health 17: 6602, 2020.
- Catan L, Amaricai E, Onofrei RR, et al: The ımpact of overweight and obesity on plantar pressure in children and adolescents: a systematic review. Int J Environ Res Public Health 17: 6600, 2020.
- Yan S, Li R, Shi B, et al: Mixed factors affecting plantar pressures and center of pressure in obese children: obesity and flatfoot. Gait Posture 80: 7, 2020.
- Walsh TP, Butterworth PA, Urquhart DM, et al: Increase in body weight over a two-year period is associated with an increase in midfoot pressure and foot pain. J Foot Ankle Res 10: 31, 2017.
- McPoil TG, Haager M, Hilt J, et al: Can static foot posture measurements predict regional plantar surface area? Foot (Edinb) 24: 161, 2014.
- Dulai S, Ramadi A, Lewicke J, et al: Functional characterization of plantar pressure patterns in gait of typically developing children using dynamic pedobarography. Gait Posture 84: 267, 2021.
- Giacomozzi C, Stebbins JA: Anatomical masking of pressure footprints based on the Oxford Foot Model: validation and clinical relevance. Gait Posture 53: 131, 2017.
- Cousins SD, Morrison SC, Drechsler W: The reliability of plantar pressure assessment during barefoot level walking in children aged 7-11 years. J Foot Ankle Res 5: 8, 2012.
- Ozturk B, Angin E, Guchan Z, et al: Assessment of the plantar pressure, muscle strength and balance in patients with type 2 diabetes mellitus in Cyprus. Open J Endocr Metab Dis 6: 151, 2016.
- Cousins SD, Morrison SC, Drechsler WI: Foot loading patterns in normal weight, overweight and obese children aged 7 to 11 years. J Foot Ankle Res 6: 36, 2013.
- Hafer JF, Lenhoff MW, Song J, et al: Reliability of plantar pressure platforms. Gait Posture 38: 544, 2013.
- Mayolas Pi C, Arrese AL, Aparicio AV, et al: Distribution of plantar pressures during gait in different zones of the foot in healthy children: the effects of laterality. Percept Mot Skills 120: 159, 2015.
- Molina-Garcia P, Miranda-Aparicio D, Molina-Molina A, et al: Effects of exercise on plantar pressure during walking in children with overweight/obesity. Med Sci Sports Exerc 52: 654, 2020.
- Wang Y, Li Z, Wong DW, et al: Effects of ankle arthrodesis on biomechanical performance of the entire foot. PLoS One 10: e0134340, 2015.
- Morales-Orcajo E, Souza TR, Bayod J, et al: Non-linear finite element model to assess the effect of tendon forces on the foot-ankle complex. Med Eng Phys 49: 71, 2017.
- Celik Y: How, Biostatistics and Modern Scientific Research with SPSS, 4th Ed, p 264, Nobel Medical Bookstores, 2017.
- Teyhen DS, Stoltenberg BE, Collinsworth KM, et al: Dynamic plantar pressure parameters associated with static arch height index during gait. Clin Biomech 24: 391, 2009.
- Müller S, Carlsohn A, Müller J, et al: Static and dynamic foot characteristics in children aged 1-13 years: a cross-sectional study. Gait Posture 35: 389, 2012.
- Levy JC, Mizel MS, Wilson LS, et al: Incidence of foot and ankle injuries in West Point cadets with pes planus compared to the general cadet population. Foot Ankle Int 27: 1060, 2006.
- Periyasamy R, Anand S: The effect of foot arch on plantar pressure distribution during standing. J Med Eng Technol 37: 342, 2013.
- Queen RM, Mall NA, Nunley JA, et al: Difference in plantar loading between flat and normal feet during different athletic tasks. Gait Posture 29: 582, 2009.
- Stanković K, Booth BG, Danckaers F, et al: Three-dimensional quantitative analysis of healthy foot shape: a proof of concept study. J Foot Ankle Res 11: 8, 2018.
- Vette AH, Funabashi M, Lewicke J, et al: Functional, impulse-based quantification of plantar pressure patterns in typical adult gait. Gait Posture 67: 122, 2019.
- Demirbüken İ, Özgül B, Timurtaş E, et al: Gender and age impact on plantar pressure distribution in early adolescence. Acta Orthop Traumatol Turc 53: 215, 2019.
© 2022 American Podiatric Medical Association