


Abstract
This paper analyses the short-run dynamic relationship between monetary policy and banking market structure in Colombia during a period of post-pandemic inflation and aggressive policy tightening. Using monthly credit portfolio data for 2017–2024, we compute several concentration indicators (the Herfindahl–Hirschman Index (HHI), CRk ratios, and a dominance index) and employ three complementary identification strategies to evaluate the causal effect of monetary policy innovations on banking concentration. First, a structural VAR model identified through sign restrictions finds that contractionary shocks are associated with a short-run increase in banking concentration (median peak response: +0.60 HHI points at h = 3; 90% credible set: [+0.12, +1.16]), contrasting with the negative short-run response obtained under recursive reduced-form identification. Second, an extended VAR including credit portfolio growth as a mechanism variable confirms that contractionary shocks compress aggregate lending but do not generate robust, persistent changes in concentration. Third, local projections with regime-interaction terms formally test the nonlinear mechanisms discussed in the literature and find evidence of state-dependent transmission: the concentration response is larger in the low-inflation regime and attenuates during high-inflation episodes. All estimated effects are transitory and horizon-sensitive, reinforcing a cautious interpretation. The paper contributes new evidence from an emerging economy on the structural consequences of monetary policy and highlights the importance of identification assumptions in determining the direction of this effect.
JEL Classification:
D43; E52; C22
1. Introduction
The structure of financial markets, particularly the configuration of the banking sector, plays a key role in shaping the effectiveness and consequences of monetary policy.
Although studies on how bank concentration affects monetary policy transmission have abounded in recent decades (Adams & Amel, 2010; Baarsma & Vooren, 2018; Severe, 2016), less attention has been paid to the reverse causal relationship, i.e., whether monetary policy itself alters the structure of the banking sector by increasing or decreasing market concentration. This question has gained importance amid contractionary monetary interventions observed globally, including in emerging markets such as Colombia, in response to post-pandemic inflationary shocks, during which policy rates reached historically high levels and bank concentration is already high. This study is conducted in a context of non-standard monetary conditions. Following the pandemic, Colombia experienced a sharp inflationary episode, prompting the central bank to implement one of the most aggressive and prolonged monetary-tightening cycles in recent decades. This environment provides a natural setting to analyze whether monetary policy shocks generate not only short-term macroeconomic effects, but also persistent structural changes in banking market concentration.
This paper addresses the research question: What is the effect of monetary policy on bank concentration? It is based on emerging empirical evidence suggesting that monetary policy is not structurally neutral. Instead, by changing interest rates and thereby affecting liquidity, central banks may unintentionally favor large, well-capitalized banks, thereby accelerating market consolidation and altering long-term financial dynamics (Jović, 2025). This phenomenon raises new concerns about the compatibility between monetary and competition policies, especially in small and middle-income economies.
To investigate this question, the study focuses on the Colombian banking sector, which provides a relevant context given its stability, profitability, and relatively high concentration. Using monthly bank-level credit participation data, this paper constructs Herfindahl-Hirschman Index (HHI) values from 2017 to 2024. It compares them against changes in the policy interest rate set by Banco de la República. The hypothesis is that monetary policy innovations may be associated with changes in bank concentration during periods of monetary tightening, particularly in contexts of high initial concentration and macroeconomic volatility.
This research draws on multiple streams of literature. Severe (2016) finds that bank concentration reduces the responsiveness of credit to monetary policy and the sensitivity of industrial growth to interest rate changes. Their analysis of 22 OECD countries shows that a 1% reduction in the monetary policy interest rate leads to significantly higher industrial growth in countries with lower bank concentration. Similarly, Baarsma and Vooren (2018) argue that competitive banking sectors facilitate a faster and more complete transmission of unconventional monetary policy. They point out that traditional measures, such as the HHI, often underestimate competitive pressures and suggest that market behavior, captured by indicators such as the Boone index or the Panzar-Rosse H-statistic, is a better predictor of policy effectiveness.
Jović (2025) examines whether monetary policy influences European banking structure in a more direct approach. He finds that prolonged low interest rates have increased concentration, particularly in economies with fragile banking sectors. His findings suggest a two-stage transmission mechanism: first, declining profitability of small and medium-sized banks; second, mergers and exits leading to increased market power of dominant institutions.
This paper adopts a similar analytical approach but focuses on Colombia. The methodology consists of calculating monthly HHI scores from banks’ market shares and modeling them as a function of the policy rate. In doing so, the study aims to contribute to a more integrated understanding of monetary policy by assessing its short-term effects on inflation and output, as well as its structural consequences for financial market concentration.
This paper makes three main empirical contributions. First, it offers new data from an emerging economy operating under a high-inflation tightening regime, a setting that has received less study than in European and North American research. Second, it uses three identification methods (recursive VAR, sign-restricted SVAR, and local projections) and clearly shows how the estimated effects vary with the assumptions, thereby promoting transparency in the methodology. Third, it tests whether the impact of monetary shocks on banking structure depends on the regime, employing a local projection approach with regime-interaction terms to directly explore the nonlinear dynamics highlighted by recent theories.
A key finding is that the sign of the short-term concentration response depends on the identification strategy: the reduced-form recursive VAR yields a negative response, consistent with temporary competitive equalization, whereas the sign-restricted SVAR yields a positive response, consistent with the market-power consolidation mechanism described by Jović (2025). We do not claim to fully settle this debate here; instead, we see this sensitivity as an important insight that warrants future research using higher-frequency monetary policy surprise data, which are currently unavailable at the necessary frequency for Colombia. Readers should consider our results as an evidence-based exploration of a complex relationship, not definitive causal conclusions.
The remainder of the paper is organized as follows. Section 2 reviews the literature on the determinants of banking concentration and on the relationship between monetary policy and bank market structure, including recent evidence on state dependence and nonlinearities. Section 3 describes the data and the empirical methodology, including the construction of the concentration indicators and the specification of the baseline VAR, the sign-restricted SVAR, the extended VAR with credit growth, and the regime-dependent local projections. Section 4 presents the empirical results from each of these identification strategies. Section 5 reports robustness checks, including unit-root and cointegration tests and a comparison of identification schemes. Section 6 discusses the findings, their policy implications, and the study’s limitations.
2. Literature Review
The interaction between monetary policy and the structure of the banking sector has become increasingly relevant, especially amid constantly changing interest rates and the use of unconventional monetary policy instruments (NCMP). Recent literature highlights that the effectiveness of monetary policy transmission is influenced not only by the stance of central banks but also by competitive and concentration dynamics within the banking system, and that monetary policy decisions can, in turn, affect the levels of competition in the banking system.
2.1. Determinants of Concentration in the Banking System
The structure of financial markets has been a central topic of economic research, particularly regarding bank concentration and its effects on competition, financial stability, and consumer welfare. The banking sector has unique characteristics that distinguish it from other sectors, including high barriers to entry, network externalities, and strict regulatory oversight. Traditionally, banking competition has been analyzed through two opposing views: the structure-conduct-performance (SCP) hypothesis and the efficient structure (ES) hypothesis (Bain, 1951; Demsetz, 1973).
The SCP hypothesis postulates that higher concentration in the banking sector reduces competition, leading to higher placement rates, lower deposit rates, and lower financial inclusion (Berger & Hannan, 1989). In contrast, the ES hypothesis posits that concentration results from increased efficiency, as larger banks achieve economies of scale and scope, enabling them to offer better services at lower consumer costs (Berger, 1995). In addition, spatial competition models, such as Hotelling’s (1929) model, have been widely used to analyze product differentiation and competition among banks (Salop, 1979). These models have been extended to include digital banking, emphasizing how neobanks and fintech firms disrupt traditional banking structures. We follow the SCP tradition in treating concentration (HHI, CRk, the dominance index) as a structural proxy for competitive conditions rather than a direct measure of competition itself; as Baarsma and Vooren (2018) note below, structural indicators can diverge from conduct-based measures such as the Boone indicator or the Panzar-Rosse H-statistic, so our concentration-based results should be read as evidence on market structure, with the usual SCP caveat that structure and competitive conduct are related but conceptually distinct.
Research in emerging markets, including Latin America, shows that greater concentration is associated with greater financial exclusion and higher collateral requirements, particularly for SMEs. A concentrated banking market can significantly affect corporate financing. Studies have shown that firms in highly concentrated banking sectors often face higher collateral requirements, which can disproportionately affect small and medium-sized firms (Thein et al., 2024). In markets characterized by high concentration, financial institutions tend to be risk-averse, increasing their propensity to require collateral from SMEs and large corporations. Consequently, this increased concentration puts additional pressure on credit-seeking firms, limiting their ability to invest and expand. A comparative analysis of financial systems across Latin America suggests that bank concentration in Colombia exceeds the regional average, leading to greater barriers to access to credit. In HHI terms, Colombia’s banking sector (around 1778 in 2022) is more concentrated than Ecuador’s (1244 in 2019) and broadly comparable to or somewhat below Peru’s (1800–2000 in 2020), and above Mexico’s (around 1500 in 2020), placing it in the upper range of concentration among major Latin American banking systems (Ocampo et al., 2025). Relative to OECD competition-authority benchmarks, which typically classify markets above 2500 as highly concentrated and 1500–2500 as moderately concentrated, Colombia’s banking sector sits within the moderately-to-highly concentrated range, comparable to several OECD banking markets that have themselves undergone substantial post-crisis consolidation, but with notably less developed capital-market alternatives to bank credit than in most OECD economies. This combination of regionally high concentration, an active and aggressive recent tightening cycle, and underdeveloped non-bank financing channels is what makes Colombia a particularly informative case for studying whether monetary policy itself reshapes market structure: the mechanism we test is more likely to be detectable, if it exists, in a market where bank credit is the dominant financing channel and where concentration is already elevated relative to peers. Research by Cao-Alvira and Gómez-González (2025) on regional banking concentration in Colombia indicates that firms operating in highly concentrated banking environments tend to exhibit higher accounting leverage, reflecting limited access to financing. Concentration dynamics in Colombia over the sample period also reflect active consolidation through mergers and acquisitions rather than purely organic growth of incumbents: notable transactions include Scotiabank’s 2018 acquisition of Citibank’s Colombian retail and SME banking business, and, at the end of our sample window, Davivienda’s acquisition of Scotiabank’s Colombian operations, reported as the largest banking-sector transaction in Colombia in recent years and one that made Davivienda the leading bank by credit cards issued. While our empirical models do not separately identify M&A-driven concentration from organic changes in market share, these episodes are a reminder that part of the concentration trend documented in Section 4 reflects discrete corporate transactions as well as the gradual reallocation of lending that our VAR-based framework is designed to capture; we return to this distinction in the limitations discussion in Section 6.
2.2. Monetary Policy and Bank Concentration
An essential line of literature has studied the relationship between monetary policy and banking market structure. For example, Adams and Amel (2010) investigate whether increasing bank concentration in the United States has led to increased market power, concluding that, although consolidation has increased, it has not necessarily translated into greater pricing power. Their findings suggest that structural indicators, such as concentration ratios, may not fully reflect how consolidation affects bank behavior or market competition. This is important when assessing monetary policy transmission in increasingly concentrated markets.
In the context of the euro area, Baarsma and Vooren (2018) analyze how competition within the banking sector conditions the effectiveness of monetary policy, using a panel error correction model for 14 euro area countries, they show that in more competitive banking environments, the transmission of monetary policy, measured through the pass-through of economic stimulus to long-term interest rates-is faster and more complete. They also highlight the inadequacy of traditional concentration measures (e.g., the HHI) to capture real competitive pressures. They propose using indicators such as the Boone indicator and the Panzar-Rosse H-statistic for more accurate assessments.
Building on these insights, Jović (2025) advances the debate by examining the reverse causal relationship: whether expansionary monetary policy affects bank concentration. His empirical analysis based on VARs and SCVs of 33 European countries between 2008 and 2020 shows that central bank policy rate cuts—by the ECB—led to significant increases in bank concentration, especially in countries with low initial levels of profitability and weaker financial stability. This is known as the second wave of monetary policy effects: the first is a decline in profitability, and the second is a structural shift towards greater market concentration. In particular, the study finds evidence of monetary policy spillovers: ECB policy decisions significantly influenced concentration dynamics even in non-Euro Area countries such as Poland, Hungary, Bulgaria, and Serbia, where national monetary policies had weaker effects.
Severe (2016) empirically demonstrates that bank concentration significantly dampens the macroeconomic effects of monetary policy. Using panel data from 22 OECD countries across 59 manufacturing sectors, he finds that countries with more concentrated banking systems exhibit lower growth and respond less to interest-rate changes. For example, a 100-basis-point reduction in interest rates boosts industrial growth by 0.049% at the average concentration level. However, the policy change has almost twice the effect when the concentration is 5% lower. Severe’s study highlights that monopolistic or oligopolistic banking structures limit the effectiveness of monetary policy by reducing the elasticity of responses in lending and investment. This idea extends and deepens the arguments about microeconomic inefficiency by Berger and Hannan (1989).
Taken together, these studies paint a comprehensive picture of the dual role of bank concentration in the monetary transmission mechanism: on the one hand, it can dampen the responsiveness of lending rates to changes in economic policy, as dominant banks may be less reactive to interest rate changes; on the other hand, monetary policies themselves can catalyze further concentration by disproportionately benefiting larger and more resilient banks. These findings raise significant concerns about the long-term implications of low-interest-rate environments, especially for the design of prudential regulation and for coordination between monetary and financial stability policies.
2.3. State Dependence and Potential Nonlinearities: Conceptual Considerations and Limitations
While a growing body of literature emphasizes nonlinear and state-dependent effects in monetary policy transmission, the baseline specification relies on a linear reduced-form VAR; the empirical strategy complements it with sign-restricted SVAR identification and local projections with regime interactions to formally evaluate state dependence.
Much recent research questions the idea that monetary policy effects are strictly linear, emphasizing that the size, direction, and macroeconomic conditions at the time of central bank actions greatly influence their actual impact. Barnichon and Matthes (2014) propose a framework for detecting nonlinear responses to monetary shocks, revealing that contractionary policies tend to have a stronger and more lasting effect on economic activity than expansionary policies. Their findings support the ‘pushing on a string’ metaphor, showing that contractionary shocks lead to prolonged and pronounced declines. Conversely, expansionary shocks usually have minimal or no impact, except during severe recessions when they are large enough.
This finding significantly impacts the analysis of banking structure. If the contractionary effects of monetary policy are more robust and widespread than its expansionary effects, episodes of monetary tightening may serve as structural selection mechanisms in the financial system. In contexts with high previous concentration—common in many emerging economies—large, well-capitalized banks are better positioned to absorb rises in funding costs and liquidity constraints. Conversely, smaller banks struggle more to maintain their market share. Thus, monetary policy can cause lasting shifts in the competitive landscape of the banking sector, even if that is not its primary regulatory goal.
Furthermore, research on dependence on the economic cycle indicates that the impact of monetary policy depends not just on whether the shock is positive or negative but also on its timing. Barnichon and Matthes (2014) show that expansionary policies produce significant real effects mainly during low-growth or recession periods. Conversely, in expansion phases, these policies primarily lead to inflationary pressures. This asymmetry implies that during monetary normalization after major shocks—such as the pandemic—the structural impacts on the financial system could differ markedly from those seen under typical economic conditions.
From this perspective, examining how monetary policy influences bank concentration amidst high inflation and quick cycles of tightening is especially pertinent. The interplay of strong contractionary shocks and a volatile macroeconomic environment can intensify the nonlinear mechanisms discussed in existing research, accelerating trends toward banking concentration or dominance. Therefore, relying solely on traditional impulse-response functions without accounting for potential asymmetries or different states might undervalue the actual structural impacts of monetary policy on the financial system.
This paper expands on previous research by examining how market structure influences banks’ responsiveness to monetary impulses in Colombia. It considers whether shifts in concentration result from economic policy rather than merely acting as a moderating factor. The empirical analysis formally links the HHI to monetary policy innovations through the VAR, SVAR, and local-projection models described below; the CRk ratios and the dominance index are reported descriptively, to characterize the level and evolution of concentration and dominance over the sample period, and are not themselves modeled as outcomes of monetary policy shocks. This combination situates the Colombian banking system within the context of global monetary dynamics and offers new insights into the joint evolution of structure and policy.
3. Data and Methods
The methodological strategy is divided into two parts. In the first part, we explore the structure of the Colombian banking market by estimating various measures of concentration. In the second part, we will identify the effects of monetary policy on the degree of concentration in the Colombian banking system using VAR and VEC models.
3.1. Data
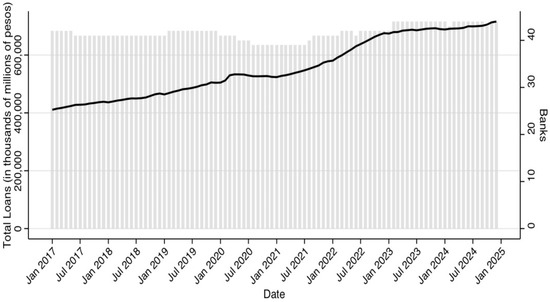
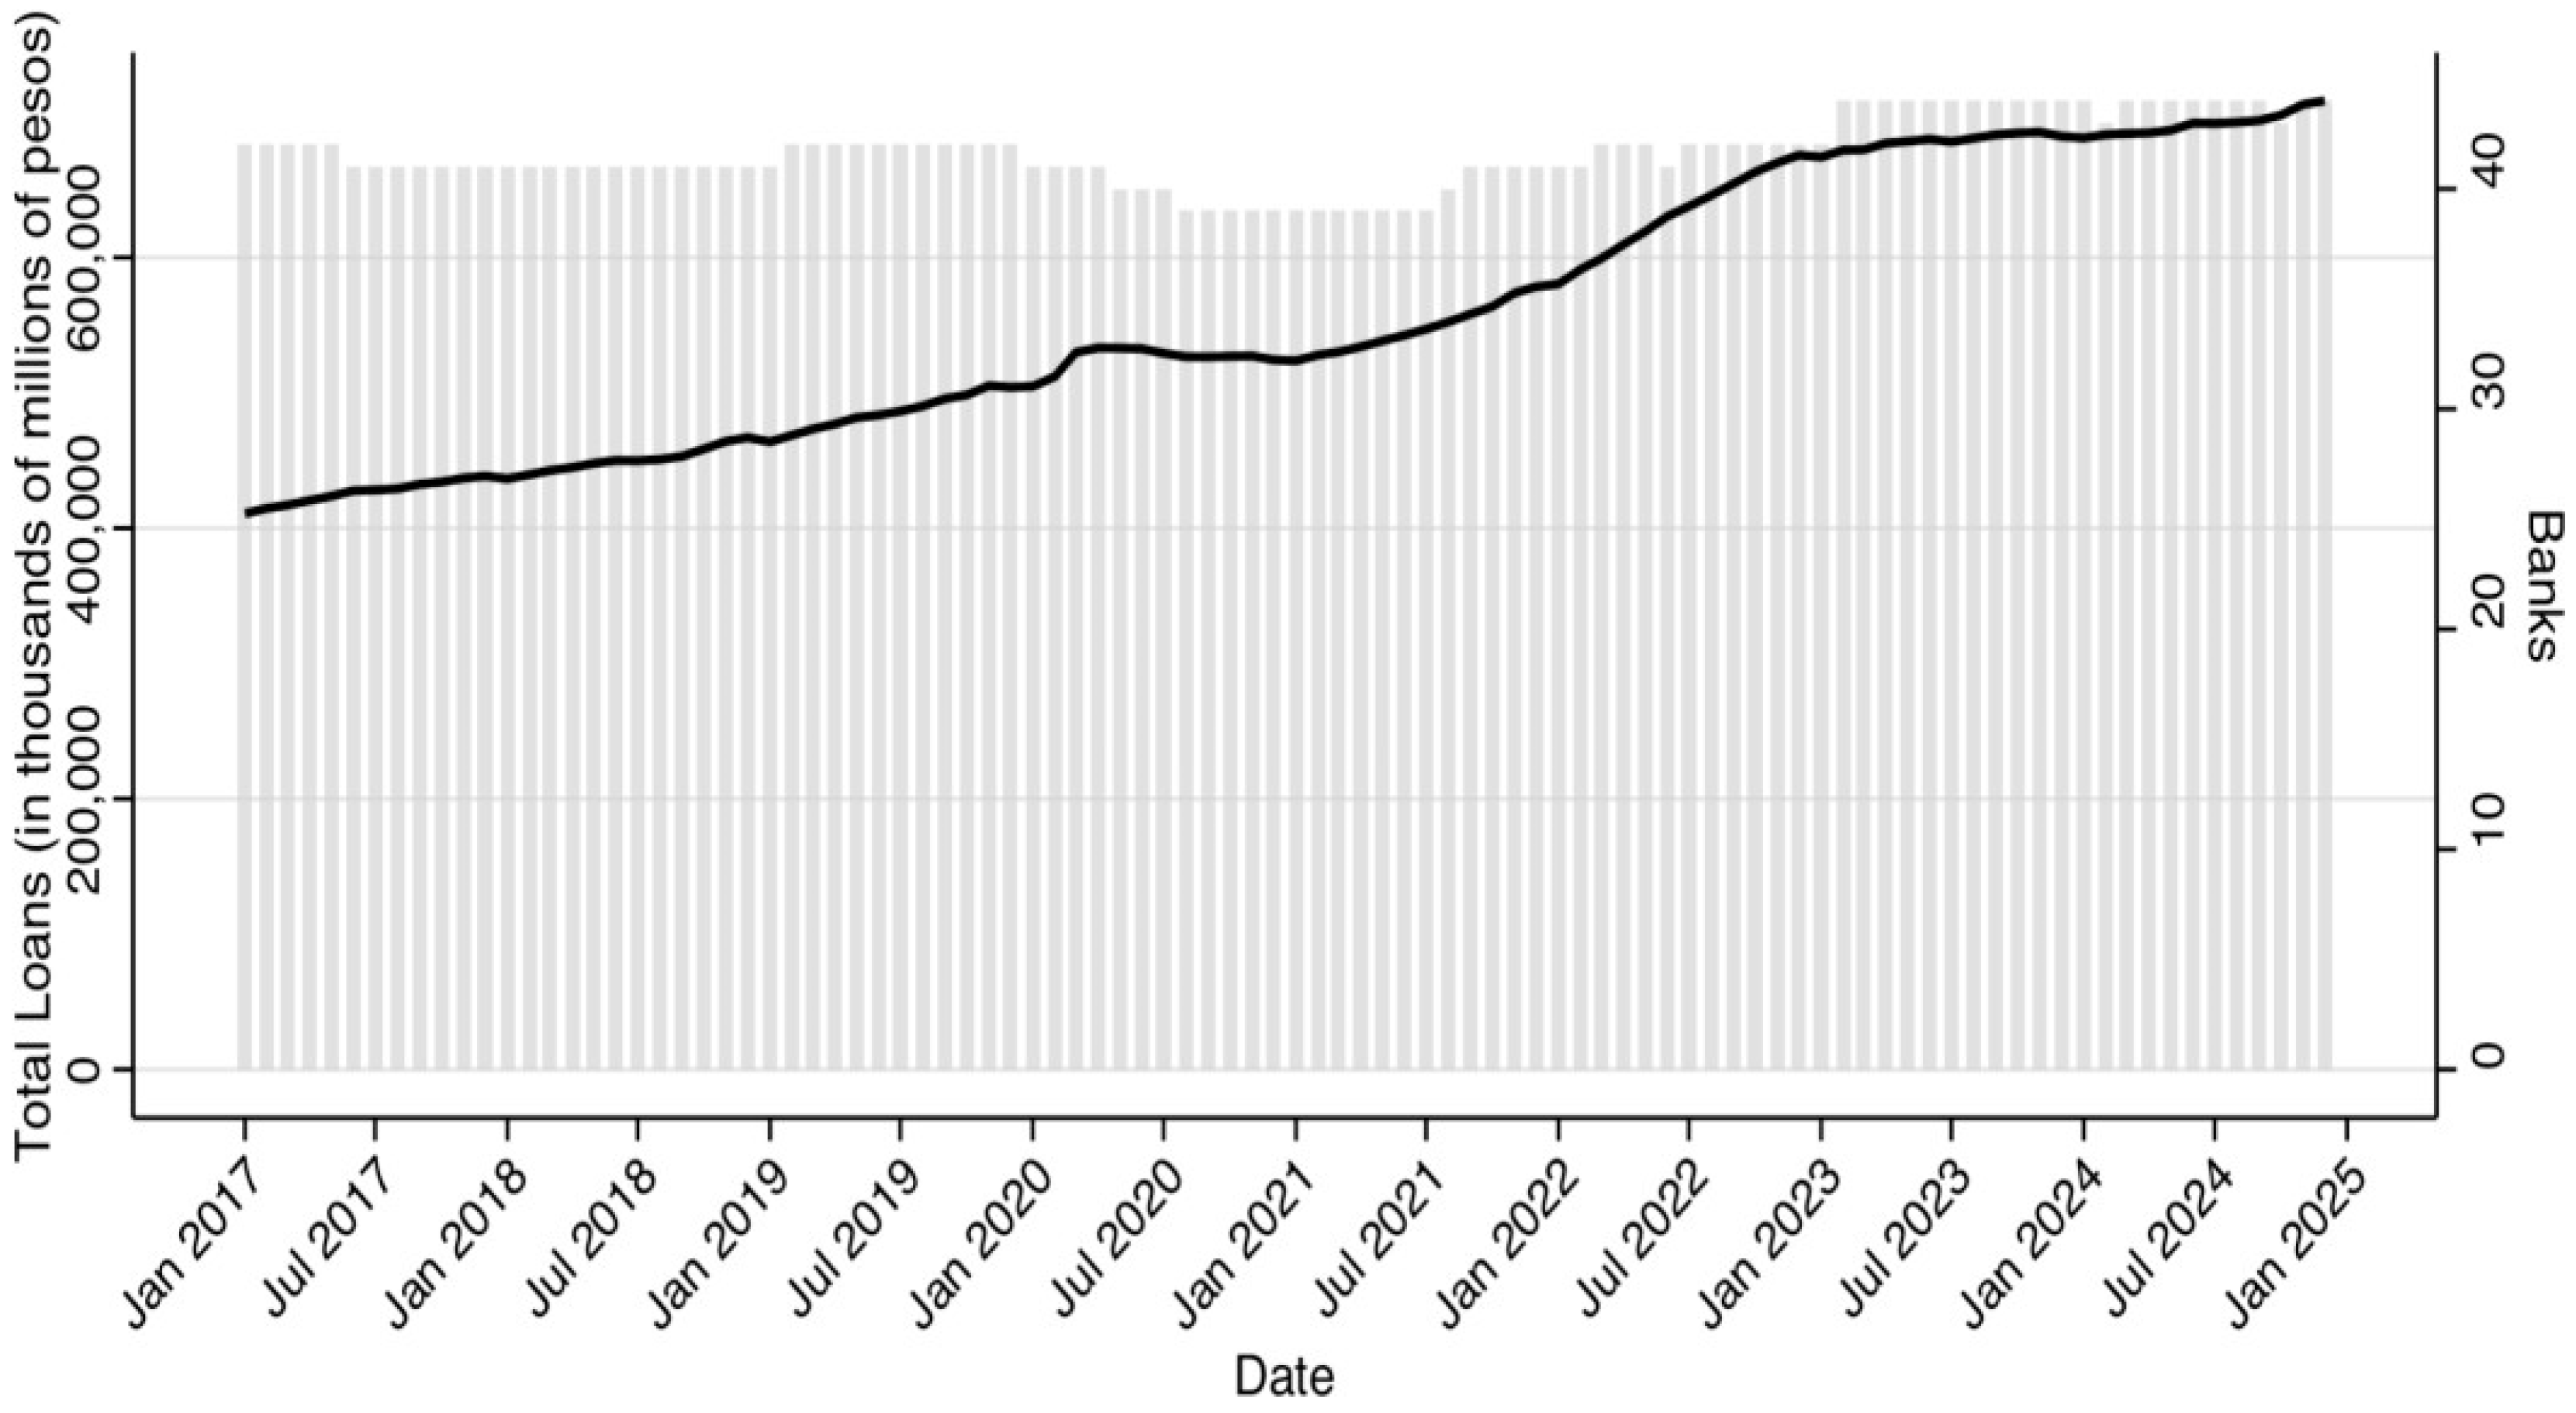
To approximate the degree of concentration of the credit product in the Colombian financial system, data have been collected from the Colombian Financial Superintendency. This entity oversees the operations of banks in the country. The data obtained provides information on the total portfolio, the balance in arrears, the balance at risk, and the written-off balance for each credit establishment from 2017 to 2024. Figure 1 shows the total portfolio evolution (black line) versus the number of establishments (bars) and reveals an increasing trend in the portfolio, indicating an expansion in the credit and assets of the establishments during this period. As for the establishments, a stable number is evident. This could indicate that lending activity could be dominated by a few large institutions as the portfolio grows and the number of establishments changes significantly.
Figure 1.
Total portfolio and number of institutions with credit activity supervised by the Superintendencia Financiera de Colombia.
Secondly, an approximation to the measurement of market concentration in the banking sector has been made using the Herfindahl-Hirschman Index (HHI), which sums the squared market shares of all the companies in the market:
where is the market share of the establishment i, and it is calculated as: , and denotes the credit portfolio of institution in month , denotes the total credit portfolio of the banking system in month , and is the corresponding market share.
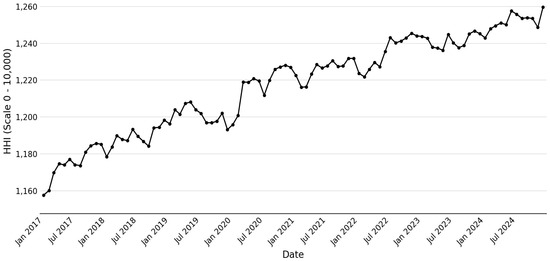
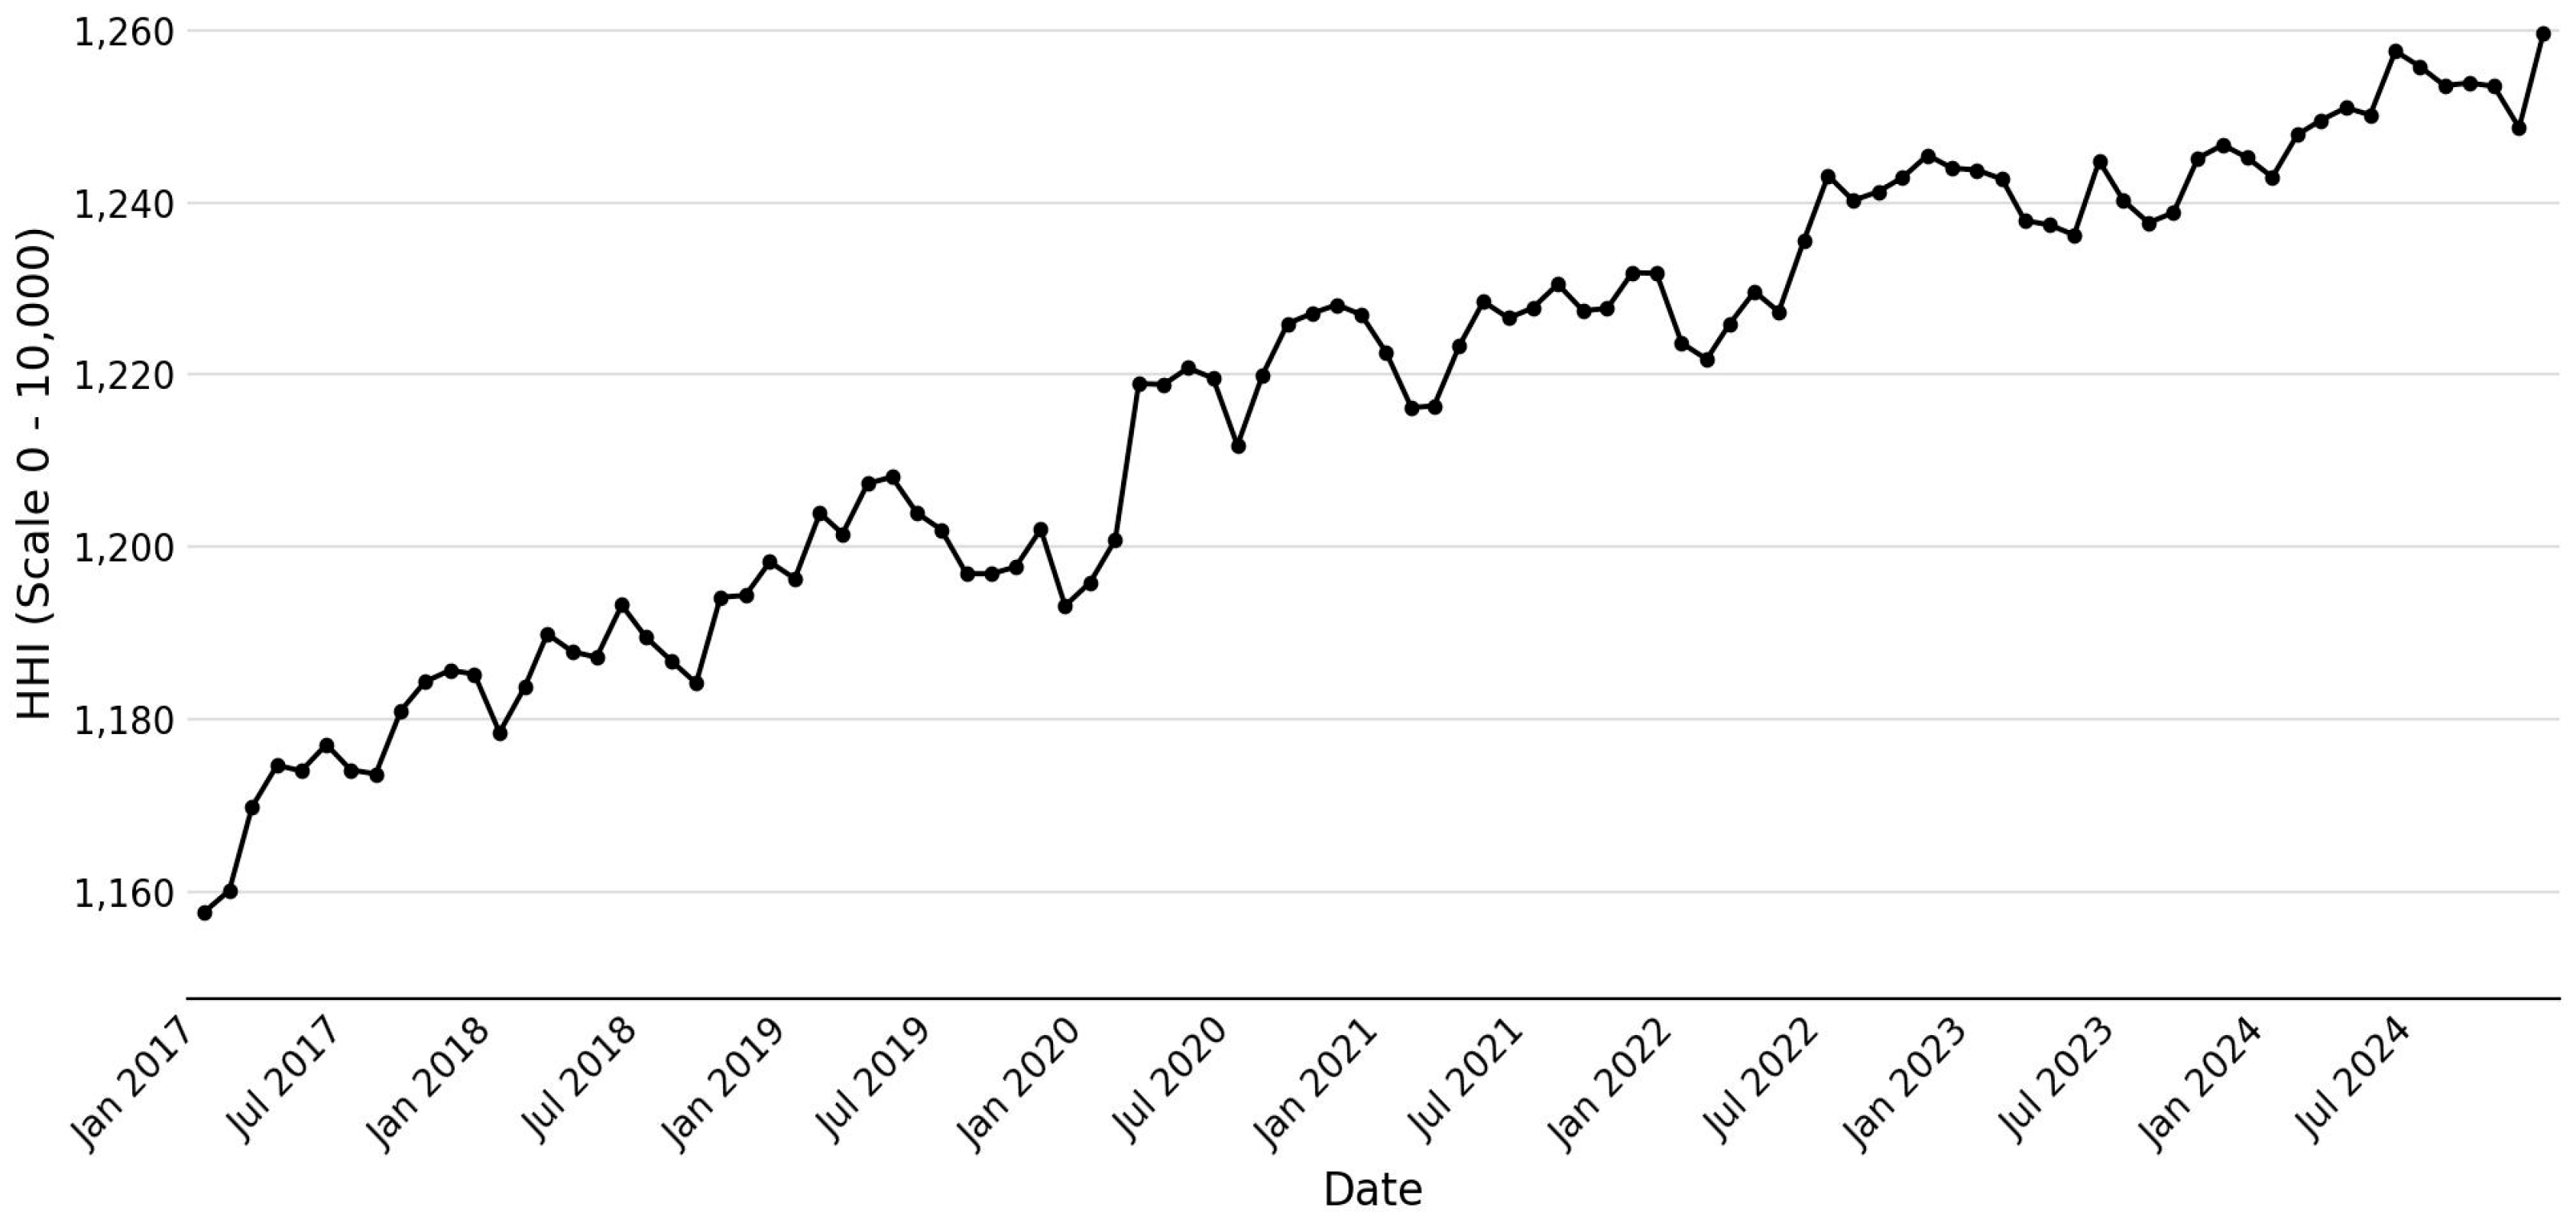
A high HHI indicates greater concentration, suggesting a more monopolistic market structure, whereas a low HHI suggests a more competitive market (Rhoades, 1993). Empirical studies show that financial sector concentration varies significantly across countries. For example, Cetorelli and Gambera (2001) conclude that higher concentration in banking markets correlates with lower credit availability for small and medium-sized enterprises (SMEs). Similarly, Beck et al. (2007) argue that excessive concentration reduces financial inclusion and innovation, as dominant banks face less competitive pressure to innovate. Figure 2 presents the results for the Colombian market. A growing trend is evident, with the country’s leading financial institutions consolidating their market share.
Figure 2.
HHI for the banking system in Colombia.
An alternative measure of concentration is the CRk (k–firm concentration ratio): It measures the combined market share of the k largest banks. It is calculated as follows:
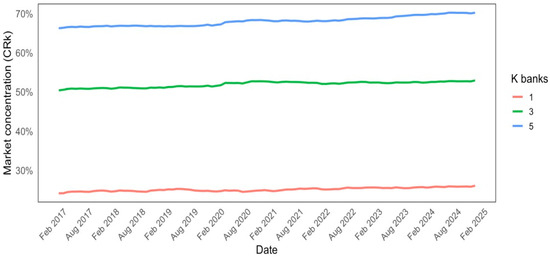
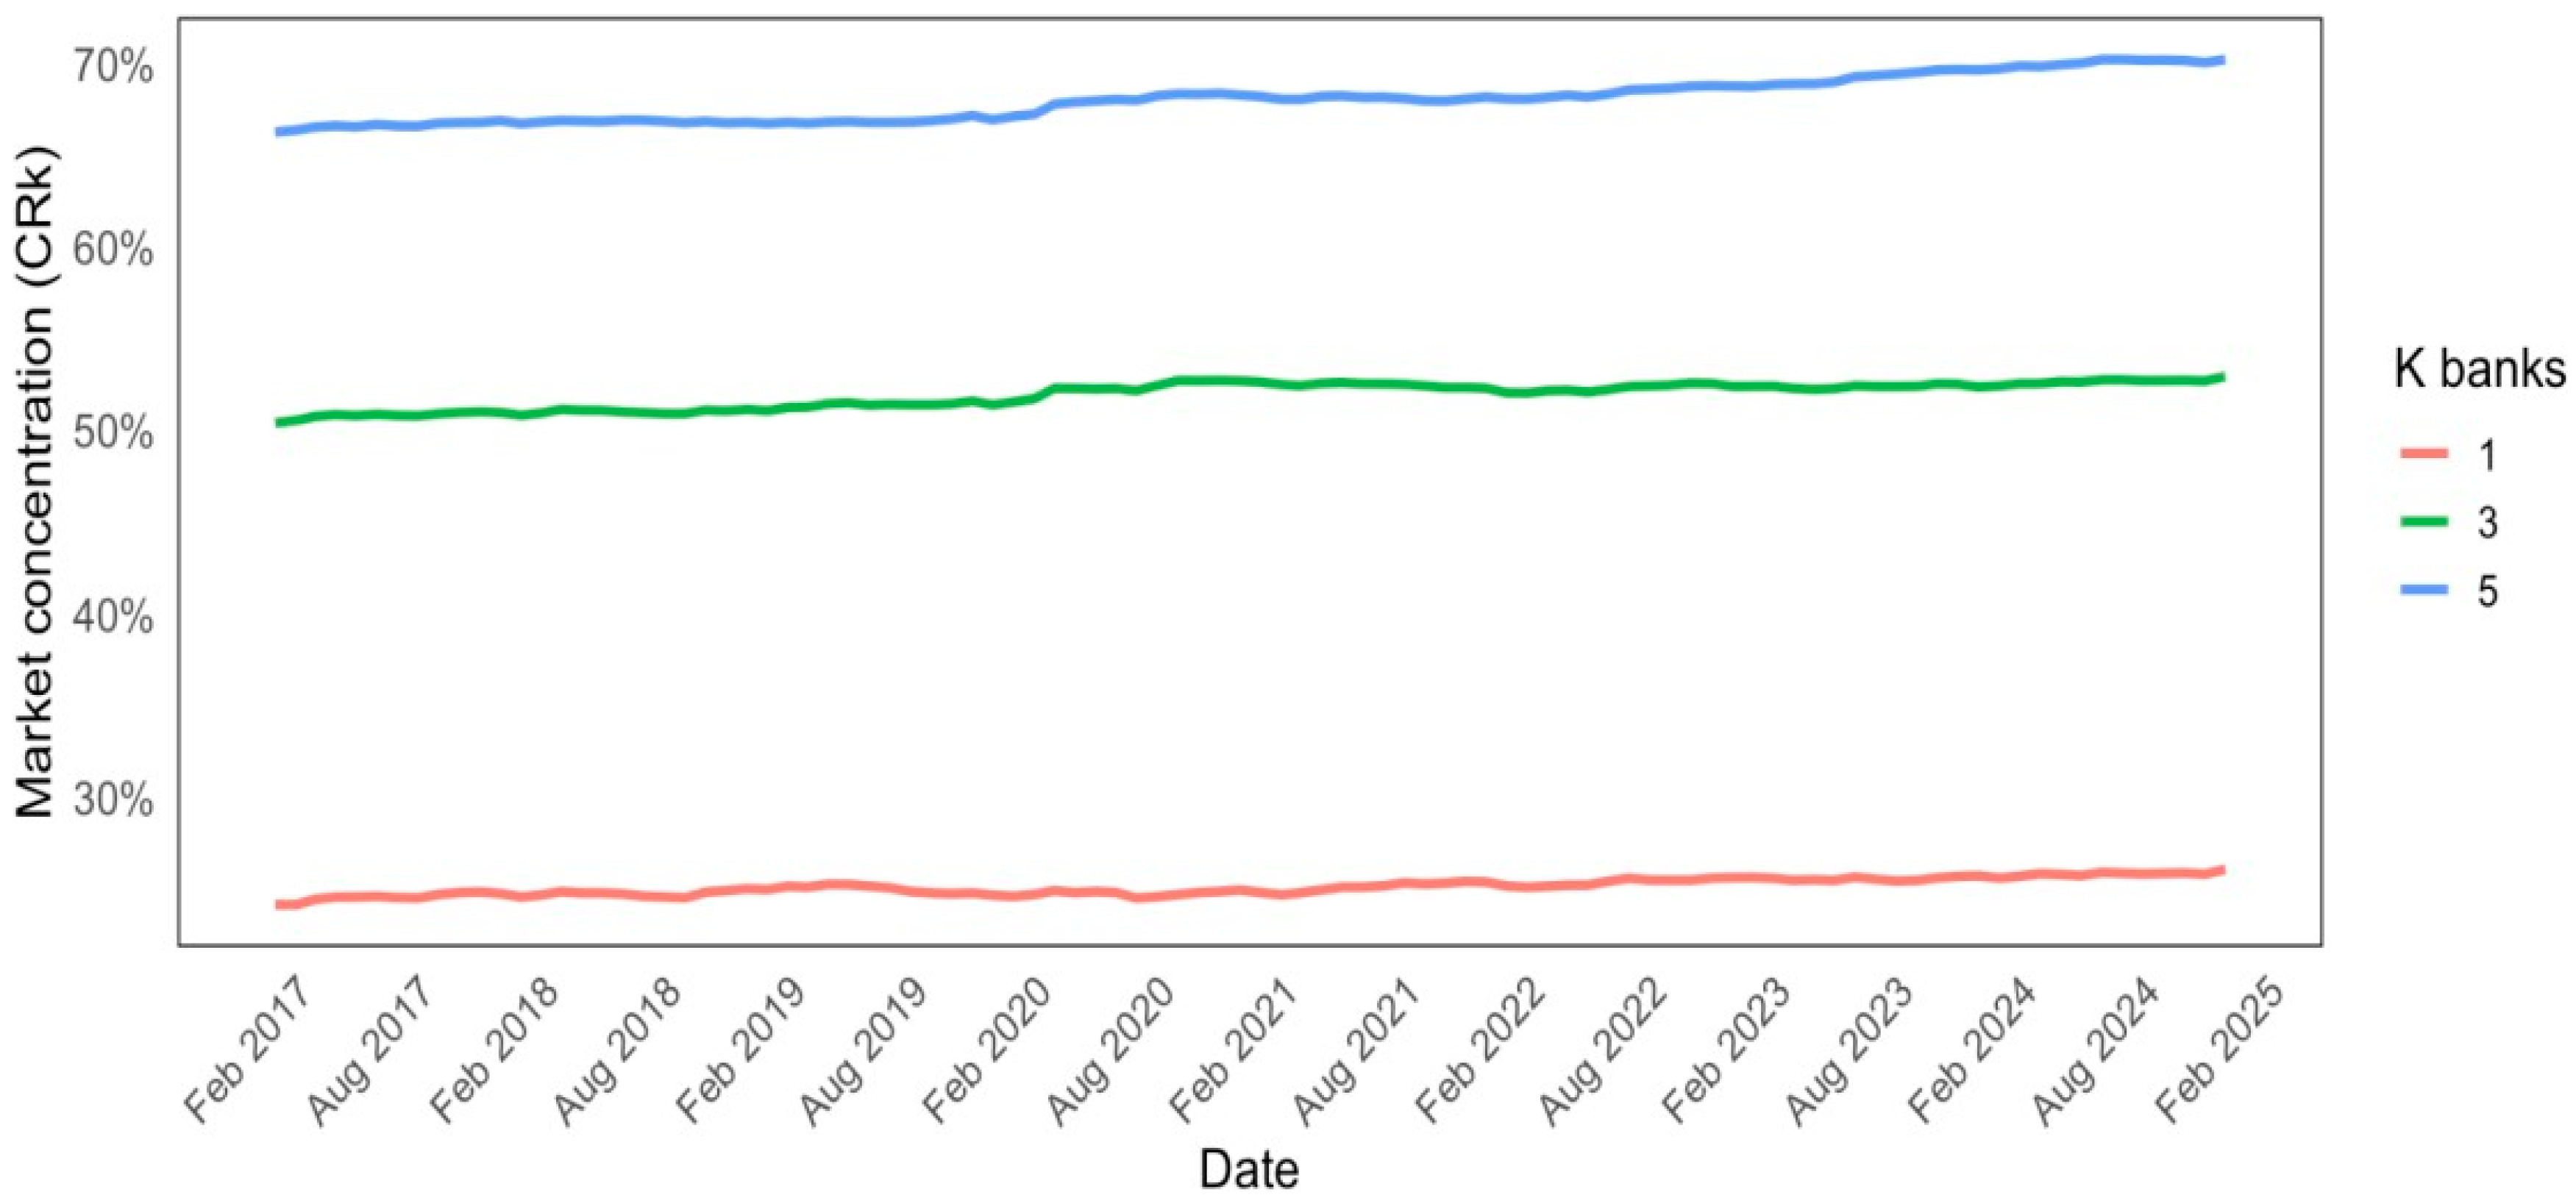
Figure 3 shows the results. The indicator for the Colombian market uses the three most significant and the five largest banks. The increasing market concentration observed in the Colombian financial sector, especially among the top five institutions (CR5), suggests a progressive consolidation of market power. While the CR1 and CR3 indicators remain relatively stable, the gradual increase in CR5 suggests that a handful of institutions are capturing a larger share of total lending activity. This trend raises concerns about reduced competition, as greater concentration may lead to higher borrowing costs, less innovation in financial products, and limited access to credit for SMEs and low-income consumers. However, a concentrated banking system can improve financial resilience from a stability perspective, as dominant banks typically face greater regulatory oversight and have higher capital buffers. The policy challenge lies in balancing competition and stability, ensuring that new market entrants such as neobanks and fintech can operate on a level playing field while maintaining a sound financial system. Future research should assess whether regulatory frameworks foster or hinder competition, particularly in digital banking and alternative lending markets.
Figure 3.
Concentration ratios CR1, CR3, and CR5 for the Colombian credit market.
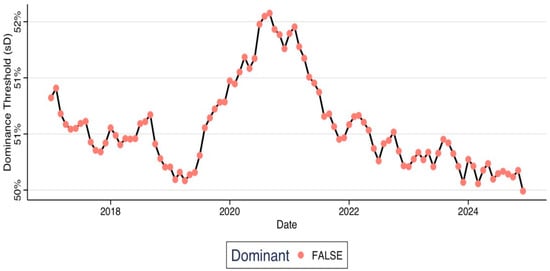
Following Melnik et al. (2008), an endogenous threshold has been estimated to determine when a firm, or several firms, occupy a dominant position in the market. Unlike traditional measures of concentration, such as the HHI index, this approach assesses the relative market power of the largest firm(s) as a function of the industry’s competitive structure. Specifically, in this case, considering what has been observed in the concentration measures, the dominance index has been calculated considering the five largest firms and is defined as follows:
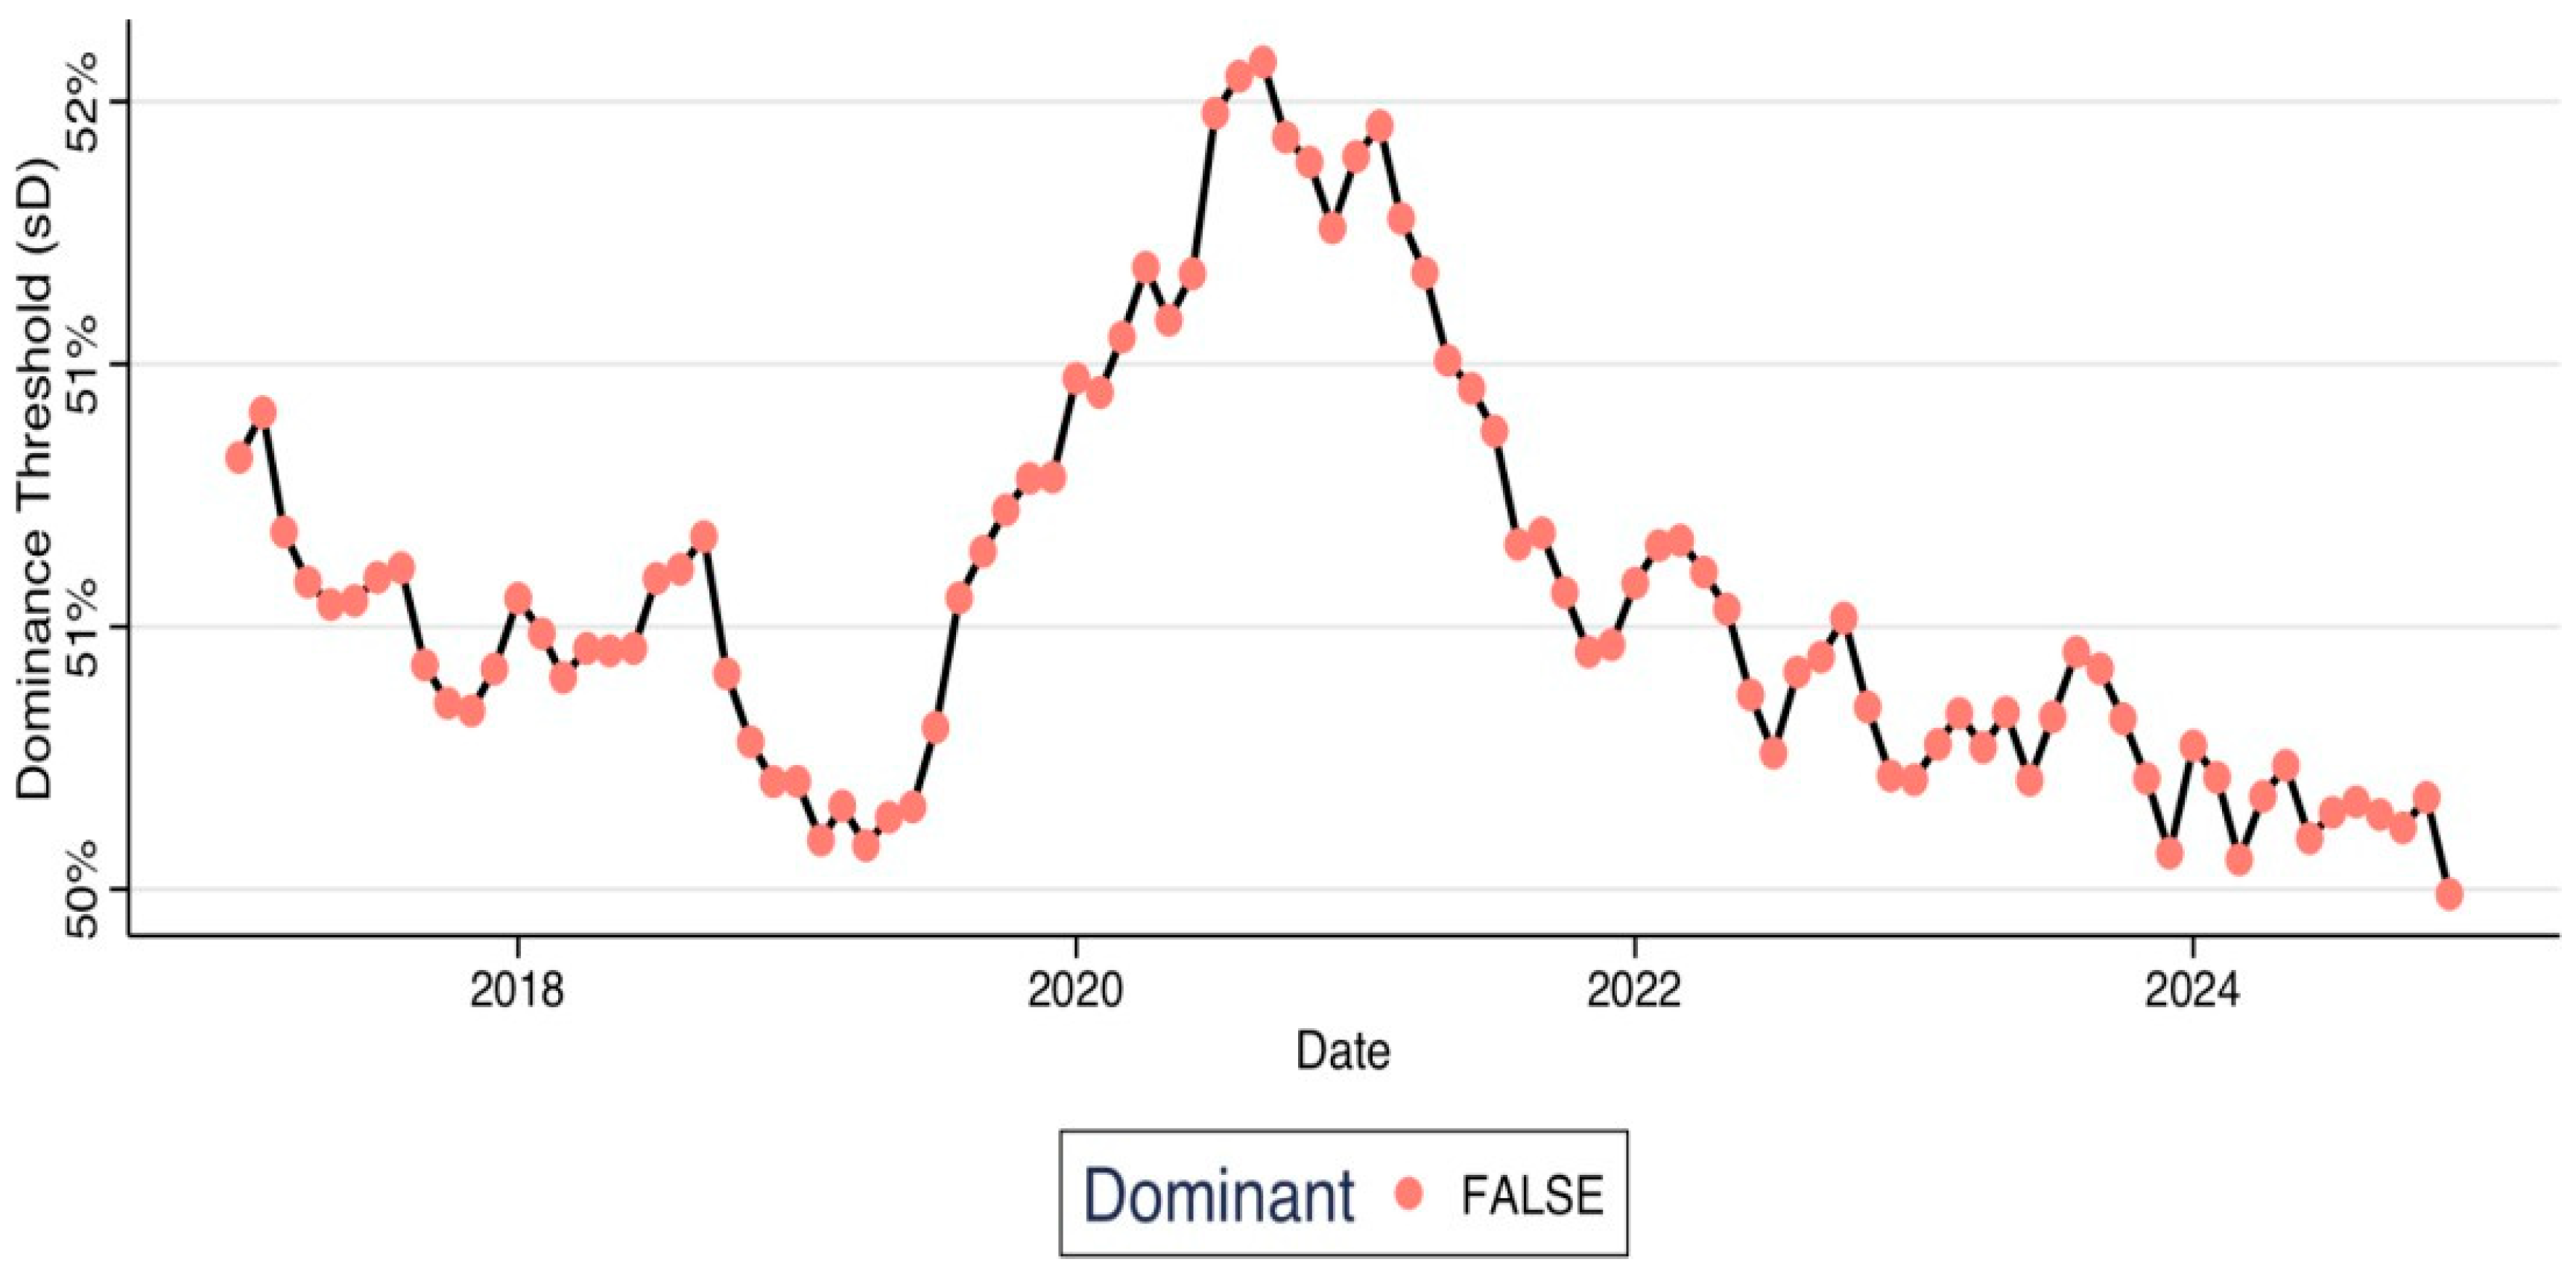
where s1 represents the share of the largest establishment, s2−5 is the sum of the shares of the following four most prominent firms, s6−N corresponds to the total share of the other firms in the market, and γ is a parameter that captures the intensity of potential competition; in this case, a value of 1 has been used. The index structure allows adjusting the definition of dominance according to market conditions. If the gap between the leading establishment and its direct competitors is large, the dominance threshold decreases, implying a stricter criterion for being considered dominant. Figure 4 shows the results for the Colombian case in the period analyzed. The vertical axis shows the concentration threshold for the market to be considered dominant, and the line shows the index’s behavior, with red dots indicating the months when the threshold has not been exceeded.
Figure 4.
Dominance index for Colombia’s credit market.
It is observed that the dominance threshold (sD) has varied, peaking around 2020 and subsequently decreasing, coinciding with the appearance of the first neobank in the Colombian market (Lulo Banco), after which it has not returned to its initial levels. This suggests that although the dominance threshold has fluctuated, no institution has surpassed it in the years analyzed, and that the probability of this occurring, given the emergence of neobanks, has decreased.
3.2. Empirical Analysis of Monetary Policy and Bank Concentration
To analyze the dynamic relationship between banking market concentration and monetary policy in Colombia, a reduced-form vector autoregressive (VAR) model is estimated using monthly financial system data. The baseline specification includes three endogenous variables: banking concentration (HHI), the monetary policy rate, and inflation. Stationarity was assessed using Augmented Dickey–Fuller (ADF) tests with lag length selected via the Akaike Information Criterion (AIC), complemented by KPSS tests to evaluate stationarity under the null of level stationarity.
Given the mixed evidence between the ADF and KPSS tests, stationarity decisions were based on a complementary interpretation of both tests. While ADF, in some cases, weakly rejects the unit-root null, KPSS consistently rejects level stationarity, supporting the treatment of the variables as integrated of order one. Therefore, all variables were transformed into first differences to ensure a consistent and conservative specification.
The results indicate that the variables are predominantly integrated of order 1. Detailed statistics are reported in Appendix A Table A1. These findings support estimation in first differences. Subsequently, VAR models with lags of 1–6 were estimated, and the Akaike information criterion (AIC) was used to select the optimal lag length. Lag selection using the Akaike Information Criterion (AIC) identifies a VAR specification. This lag structure balances model fit and degrees of freedom, given the sample size (96 observations). Therefore, the specification of the estimated equations is as follows:
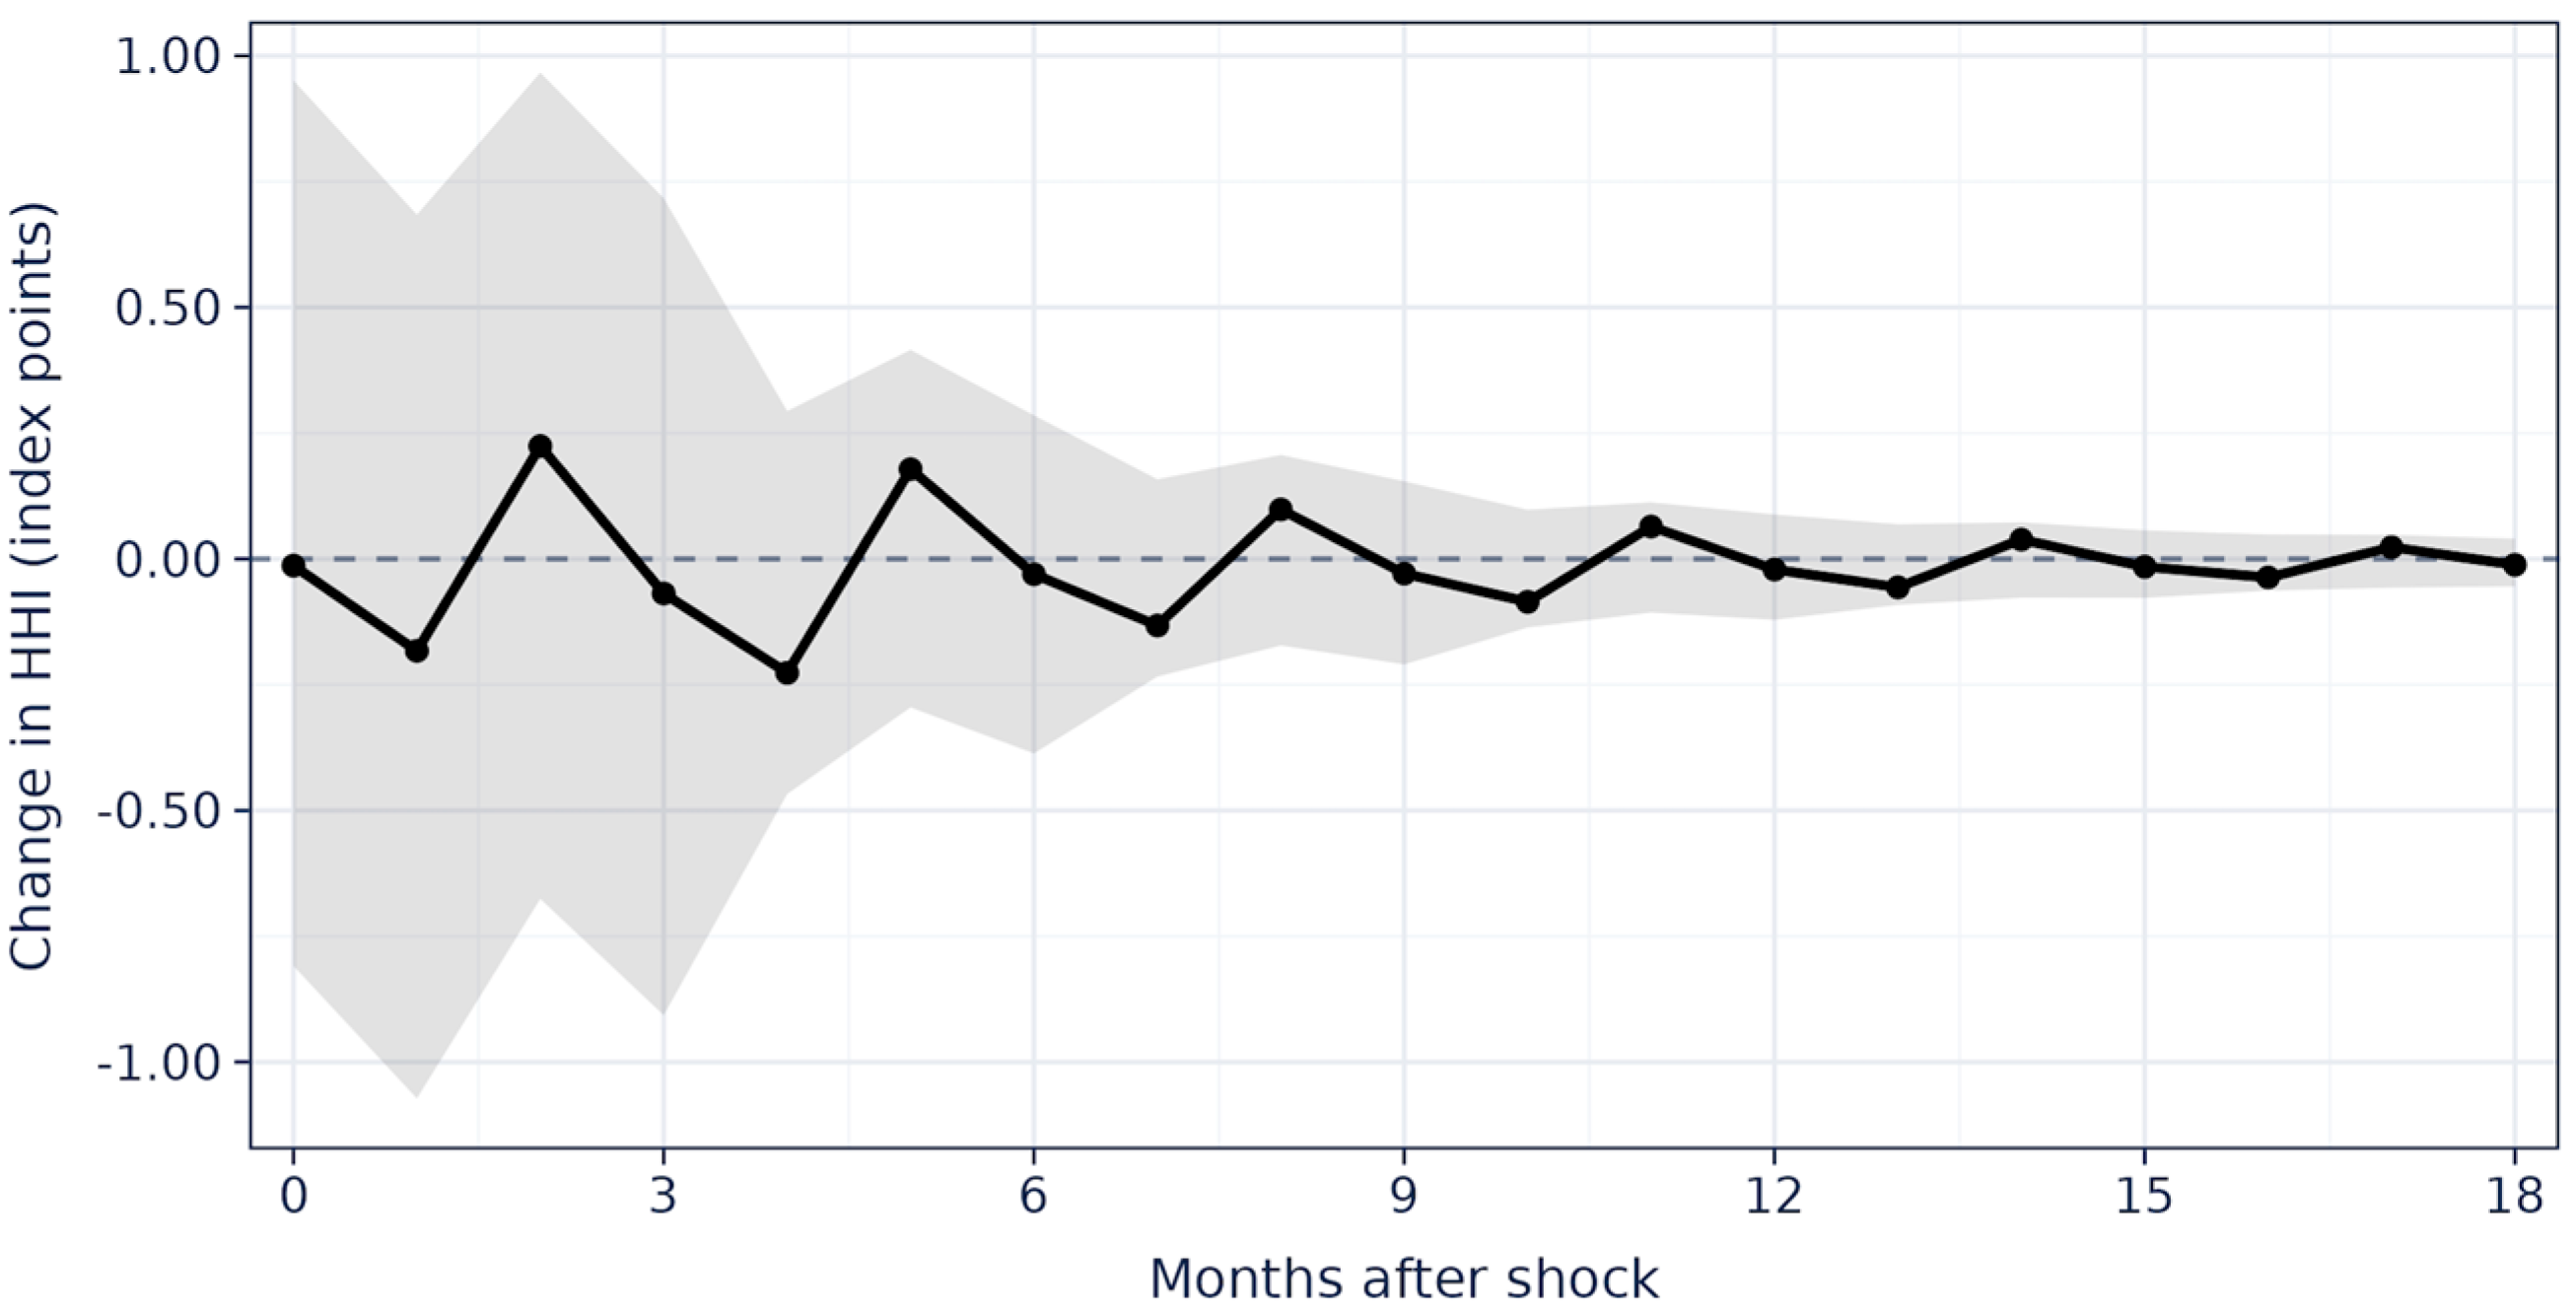
All coefficients are equation-specific, and all variables enter the model in first differences. Once the VAR model was estimated, we simulated impulse-response functions (IRFs) to track the effect of a unit exogenous shock to the monetary policy rate on the HHI index over a 12-month horizon. Figure 5 shows the results. The IRF is calculated recursively from the estimated coefficients, assuming that only the monetary policy variable is shocked in the initial period, while the others remain unperturbed. Impulse–response functions are computed using orthogonalized innovations obtained from a Cholesky decomposition under the maintained identification assumptions. The recursive identification assumes that monetary policy innovations may contemporaneously affect banking concentration, while concentration does not contemporaneously influence policy decisions within the same month. This assumption is grounded in the institutional features of Colombia’s monetary framework. Policy decisions are based primarily on inflation, inflation expectations, and indicators of economic activity. Accordingly, the identified shocks should be interpreted as orthogonalized innovations conditional on these timing restrictions, rather than as fully structural monetary policy shocks identified through external instruments or high-frequency approaches.
Figure 5.
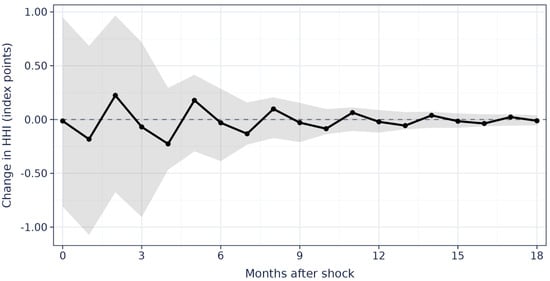
Baseline Reduced-Form VAR. Note: Recursive Cholesky identification. Ordering: Inflation, monetary policy rate, HHI. The solid black line with circular markers represents the estimated impulse response of banking concentration, measured as the change in the HHI index, to a monetary policy shock. The grey shaded area represents the 95% bootstrap confidence interval. The horizontal dashed line indicates the zero-response benchmark. Values above zero indicate an increase in banking concentration, while values below zero indicate a decrease in concentration. The x-axis reports months after the shock, and the y-axis reports changes in HHI index points. Variables are in first differences. Lag order = 3.
This methodology allows us to examine the direction, magnitude, and persistence of monetary policy’s effect on bank concentration. It contributes to understanding how monetary cycles may affect competition in the Colombian banking sector. The estimated VAR captures dynamics specific to a high-inflation and tightening regime and should therefore be interpreted as regime-conditional rather than universal. Results are reported in Section 4.
3.2.1. Structural Identification via Sign Restrictions
To move beyond the constraints of recursive reduced-form identification, we estimate a structural vector autoregressive (SVAR) model in which the monetary policy shock is identified using sign restrictions on the impulse responses of non-concentration variables (Uhlig, 2005; Arias et al., 2018). This method is favored because it does not rely on a specific causal ordering among variables and allows the response of the main variable (banking concentration) to be determined freely by the data.
The five-variable system includes, in first differences: banking concentration (ΔHHI), the monetary policy rate (ΔRate), inflation (ΔInflation), industrial production growth (ΔIPI), and credit portfolio growth (ΔCredit). Sign restrictions are imposed on the impulse responses of the monetary policy shock as follows: (i) the policy rate must respond positively at horizons h = 0, 1, 2, and 3, reflecting a sustained contractionary shock; (ii) inflation must respond negatively at h = 6, 9, and 12, consistent with the standard price-level effect of tightening; (iii) industrial production must respond negatively at h = 3 and 6, reflecting the real activity cost of higher rates; and (iv) credit growth must respond negatively at h = 3. The response of banking concentration is left entirely unrestricted; it is the object of causal inquiry. We acknowledge that expanding the system from three to five variables, while retaining the VAR(3) lag order, increases the parameter count to 80 against 96 monthly observations, which limits the precision with which the reduced-form coefficients can be estimated. We address this concern in three ways: lag length is kept at the parsimonious value selected by AIC for the baseline model rather than re-optimized for the larger system; the sign-restricted SVAR draws only on the impulse responses (not the full coefficient matrix) for inference, which mitigates the cost of imprecisely estimated individual coefficients; and the qualitative pattern of the HHI response is cross-checked against the extended VAR (Section 4.3) and the local projections (Section 4.4), which do not share the same finite-sample bias. We nonetheless flag the limited degrees of freedom as a constraint on the precision of the five-variable specification and return to it in Section 6.
The identification algorithm generates 100,000 random orthogonal rotations of the Cholesky factor of the reduced-form covariance matrix. It keeps only those rotations that meet the specified restrictions. Out of these, 699 rotations (0.7%) satisfy all constraints at once, offering enough valid samples for analysis. Impulse responses are then summarized using the posterior median, the 68th-percentile credible set (like one standard deviation), and the 90th-percentile credible set across all valid draws.
The sign restrictions are designed to capture a conventional contractionary monetary policy shock in a small open emerging economy. The horizon-specific restrictions reflect the delayed response of prices and activity documented in the monetary transmission literature and are consistent with the Colombian inflation-targeting framework. As a robustness check, we verified that the qualitative response of concentration is preserved under narrower horizon windows and under an alternative restriction set excluding the credit response.
3.2.2. Extended VAR Model: Credit Growth as Mechanism Variable
To examine how monetary policy influences banking market structure, we expand the five-variable VAR to explicitly incorporate credit portfolio growth (ΔCredit). This is calculated as the monthly log-difference of the total credit portfolio in Colombia’s financial system. This variable serves as a proxy for the aggregate lending channel: if contractionary monetary policy reduces overall lending, its impact on market concentration may depend on how large and small banks adjust.
The extended system (estimated using first differences and the lag order selected by AIC) enables the decomposition of the impulse response of banking concentration to a monetary policy shock. It also jointly analyzes the responses of credit growth, inflation, and industrial production, offering a more comprehensive view of the transmission mechanism. The ordering follows the same Cholesky scheme as the baseline model, and bootstrap confidence intervals are generated via residual resampling with 2000 replications.
3.2.3. Local Projections and Regime-Dependent Effects
To formally test the nonlinear and state-dependent transmission mechanisms discussed in previous sections, we employ the local projection (LP) method of Jordà (2005), augmented with a regime-interaction term. This approach does not impose the dynamic restrictions of a VAR model, is robust to misspecification at long horizons, and allows the impulse response to differ across economic regimes without requiring an explicit threshold VAR or Markov-switching model (Ramey & Zubairy, 2018; Tenreyro & Thwaites, 2016).
For each horizon h = 0, 1, …, 12, we estimate the following specification:
where εtmp is the monetary policy shock (residual from a reduced-form AR equation for the policy rate, controlling for lagged inflation and lagged HHI growth), Dt is a binary regime indicator equal to one when monthly inflation exceeds 4% (the high-inflation regime), and Xt is a vector of three lags of ΔHHI, ΔRate, and ΔInflation. Standard errors are Newey–West HAC with three lags. The coefficient β1(h) captures the average effect in the low-inflation regime; β1(h) + β2(h) captures the effect in the high-inflation regime; β2(h) tests whether the two regimes differ significantly.
The 4% threshold is not arbitrary: it corresponds to the upper bound of Banco de la República’s inflation-targeting range (a 3% point target with a ±1 percentage point tolerance band), so that the high-inflation regime as we define it coincides with periods in which inflation was running above the band the central bank itself treats as consistent with price stability. The regime threshold of 4% cleanly partitions the sample into two sub-periods: 47 months of relatively stable, below-target inflation (predominantly 2017–2021) and 49 months of elevated inflation (predominantly 2022–2024), coinciding precisely with Colombia’s most aggressive monetary tightening cycle. This partition provides an empirically grounded and theoretically motivated test of whether the transmission from monetary shocks to banking structure differs between normal and inflationary environments. As a robustness extension, future research could re-estimate the regime split at alternative thresholds, such as 3%, 5%, or 6%. In the present study, we retain the 4% cutoff because it is institutionally grounded in Banco de la República’s inflation-targeting framework rather than being treated as a free parameter.
4. Results
This section reports the empirical findings from each of the identification strategies described in Section 3: the baseline reduced-form VAR, the sign-restricted SVAR, the extended VAR with credit growth as a mechanism variable, and the regime-dependent local projections.
4.1. Baseline VAR Results
The impulse–response function of banking concentration (HHI) to a contractionary monetary policy innovation over a 12-month horizon. The estimated response suggests a short-run negative association between monetary tightening and banking concentration. The effect emerges immediately, reaching its most negative magnitude within the first two to three months, then gradually reverts toward zero.
However, the response is not monotonic. After the initial decline, the impulse–response function exhibits mild oscillations around zero, indicating a dynamic adjustment process that may be influenced by short-term feedback mechanisms within the financial system. Importantly, the magnitude of the response diminishes over time, and the effect largely dissipates after approximately 6 to 9 months.
The shaded confidence bands, obtained via bootstrap procedures, include zero across all horizons. This indicates that the estimated response is not statistically distinguishable from zero at conventional confidence levels. Therefore, the results should be interpreted as suggestive evidence of a transient dynamic association rather than as a robust or persistent structural effect. Overall, the findings are consistent with the view that, in the context of a high-inflation tightening cycle, contractionary monetary policy may temporarily alter competitive conditions in the banking sector. However, these effects appear to be short-lived and statistically insignificant, reinforcing the need for cautious interpretation within a linear reduced-form VAR framework. This identification should be interpreted as a reduced-form timing restriction rather than a structural identification strategy.
To complement the impulse-response evidence with formal tests of predictive causality, we conducted Granger causality tests and forecast error variance decomposition (FEVD) for the baseline VAR(3). The policy rate does not Granger-cause banking concentration (F(3,246) = 0.23, p = 0.879), nor does inflation (F(3,246) = 0.41, p = 0.744); the joint test of both macro variables jointly Granger-causing HHI is likewise not significant (F(6,246) = 0.34, p = 0.918). The reverse direction is also not significant (HHI does not Granger-cause the policy rate: F(3,246) = 1.56, p = 0.199). These results are consistent with the IRF-based finding that the baseline reduced-form response is not statistically distinguishable from zero at any horizon. Table 1 reports the FEVD of banking concentration: the policy rate explains less than 1% of the forecast error variance of HHI at every horizon, while inflation explains a similarly modest 1–3%; the overwhelming share of HHI’s own forecast variance is explained by its own innovations.
Table 1.
Forecast error variance decomposition of ΔHHI, baseline VAR(3) (% of forecast error variance).
4.2. Sign-Restricted SVAR Results
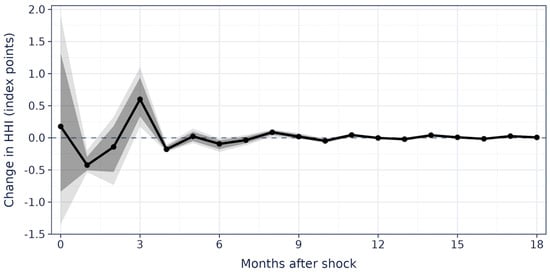
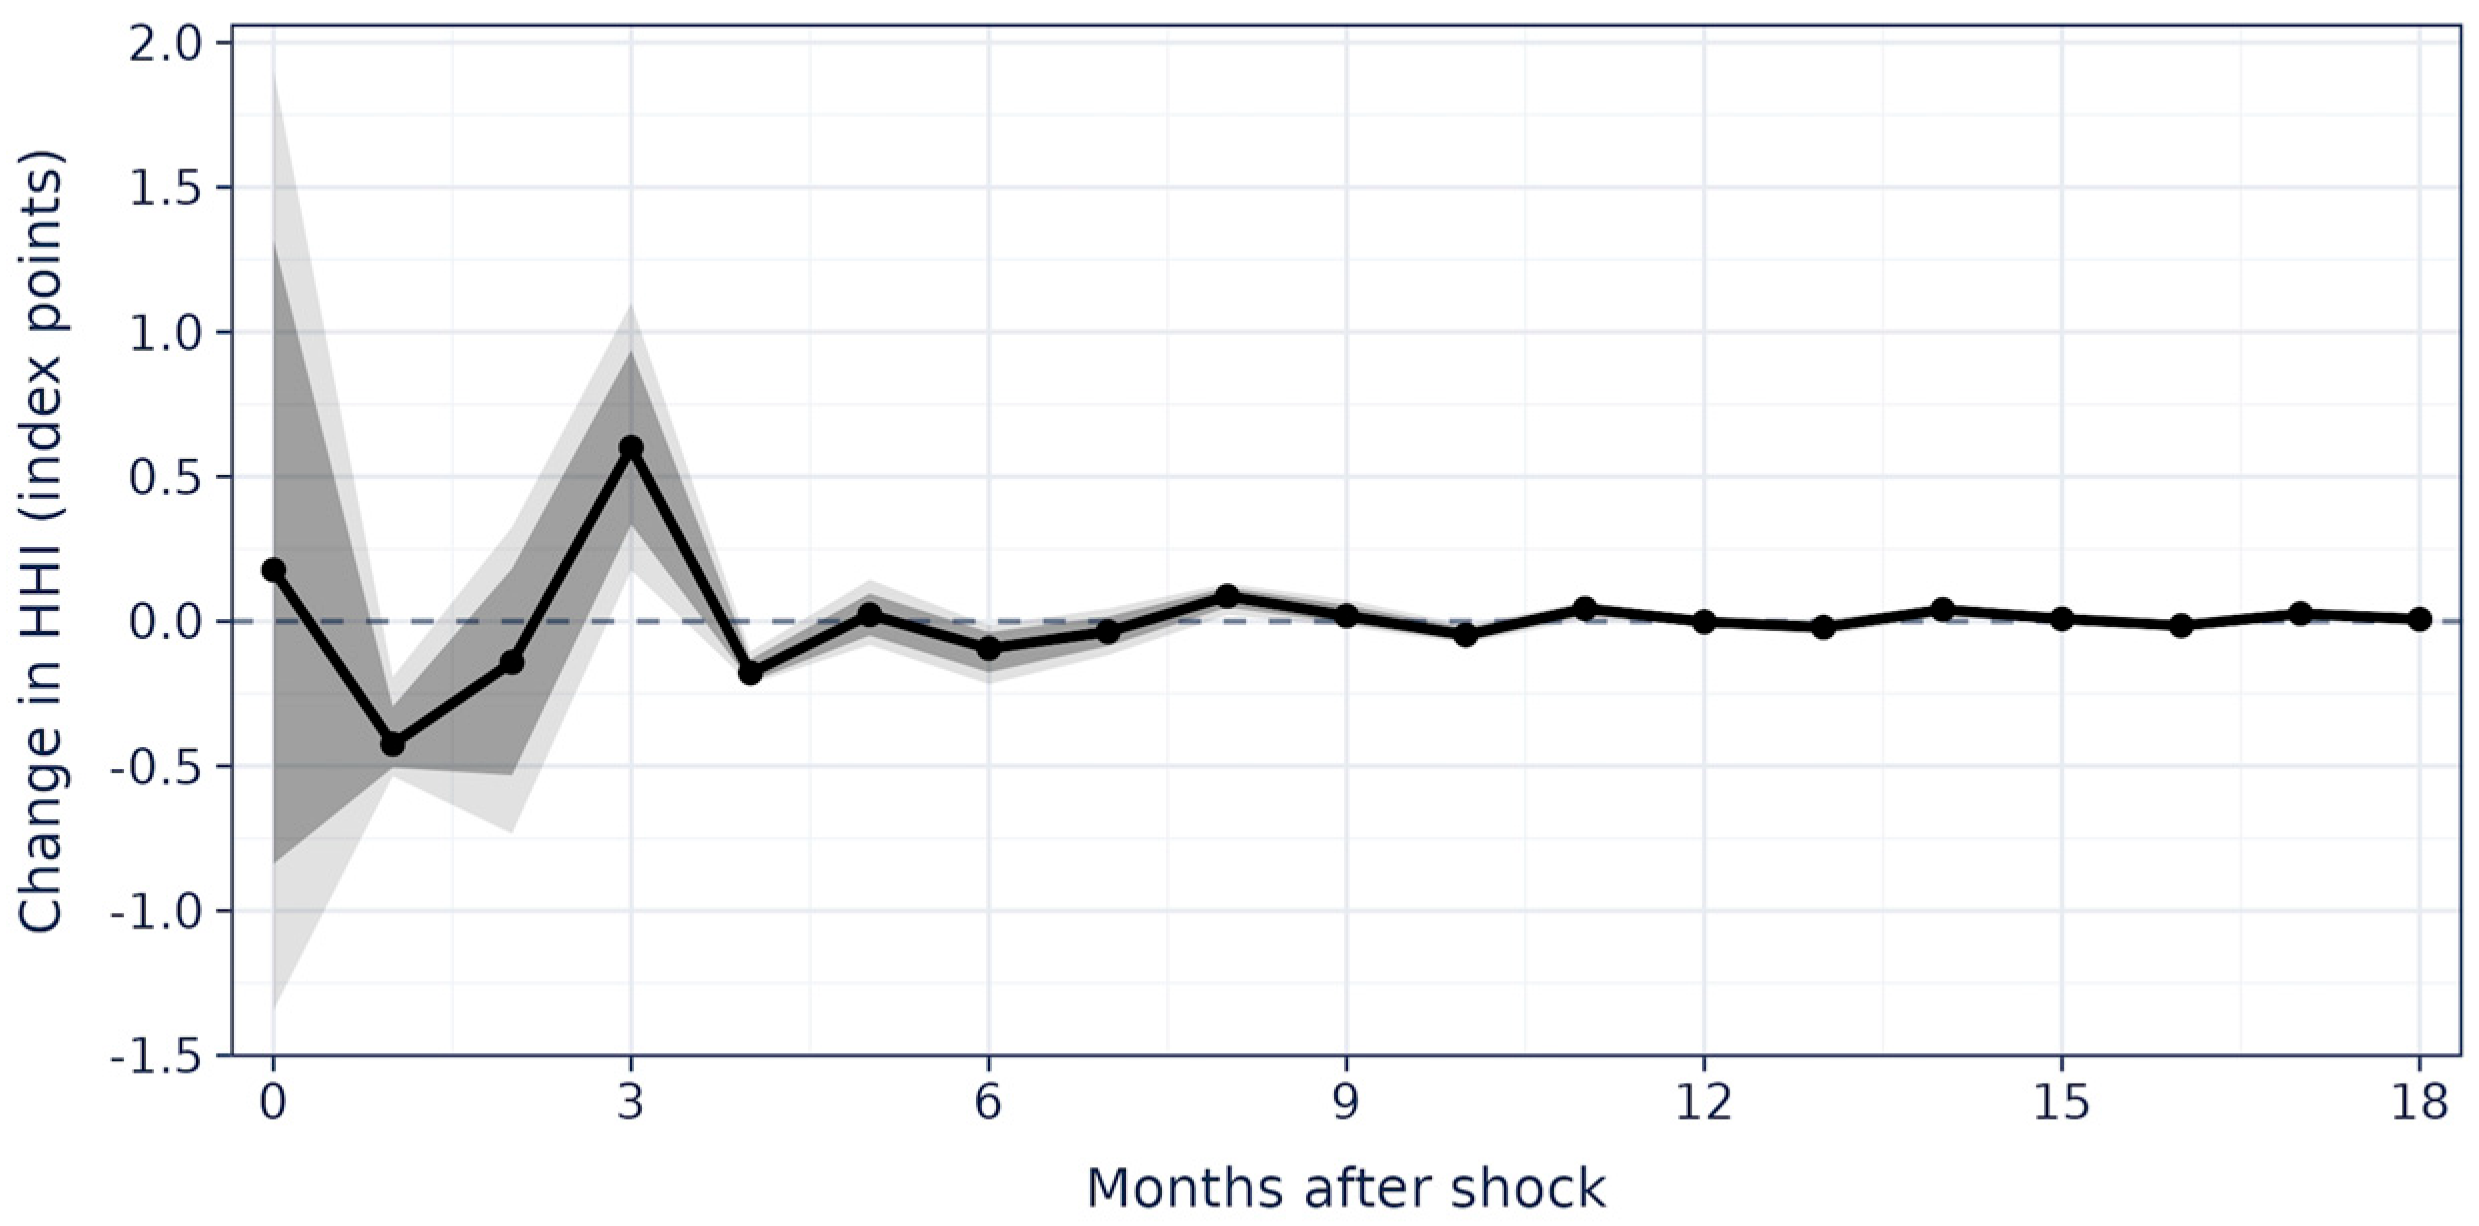
Figure 6 illustrates the impulse response of banking concentration to the sign-identified monetary policy shock. According to this identification method, the median response of the HHI is initially positive, peaking at about +0.60 HHI points at h = 3 (68% credible set: [+0.33, +0.94]; 90% credible set: [+0.12, +1.16]). The 90th-percentile credible set does not include zero at h = 3, indicating a significant positive short-term impact of contractionary monetary policy on banking concentration under this identification approach. The response diminishes by h = 6 and becomes indistinguishable from zero at longer horizons.
Figure 6.
SVAR with sign restrictions. Note: SVAR identified via sign restrictions on non-concentration variables. The solid black line with circular markers represents the median impulse response of banking concentration, measured as the change in the HHI index, to a sign-identified contractionary monetary policy shock. The darker grey shaded area represents the 68% credible interval, while the lighter grey shaded area represents the 90% credible interval. The horizontal dashed line indicates the zero-response benchmark. Values above zero indicate an increase in banking concentration, while values below zero indicate a decrease in concentration. The x-axis reports months after the shock, and the y-axis reports changes in HHI index points. Sign constraints: policy rate > 0 at h = 0, 1, 2, and 3; inflation < 0 at h = 6, 9, and 12; industrial production < 0 at h = 3 and 6; credit growth < 0 at h = 3. The HHI response is left unrestricted. Valid rotations: 699 of 100,000 random orthogonal draws.
This outcome has the opposite sign to the reduced-form baseline VAR, which indicated a temporary negative response. The change in sign highlights how sensitive the estimated direction is to the identification assumptions, emphasizing the need for careful comparison across methods. The sign-restricted analysis aligns with the theoretical mechanism described by Jović (2025): contractionary shocks tend to narrow interest margins more for smaller, less-capitalized institutions, thereby enabling larger incumbents to temporarily increase their market share. Crucially, neither estimate suggests a lasting change in market structure; both effects are short-lived.
The difference between the two identification schemes provides valuable insight: with recursive Cholesky ordering, the point estimate is negative, while with sign-restriction identification, it is positive and statistically distinguishable from zero at short horizons. Because the recursive VAR response is not itself statistically significant at any horizon, this should not be read as two equally robust findings pointing in opposite directions; rather, only the SVAR provides statistically meaningful evidence of a short-run effect, and its sign is consistent with the theoretical mechanism discussed above. The qualitative similarity in shape between the two impulse responses (both decline before reversing) suggests that the apparent sign reversal partly reflects identification-induced differences in precision rather than a fundamental disagreement between models. Future research could benefit from additional structural identification methods, such as utilizing high-frequency instrument data from monetary policy announcement surprises, to further sharpen this distinction.
4.3. Extended VAR Results
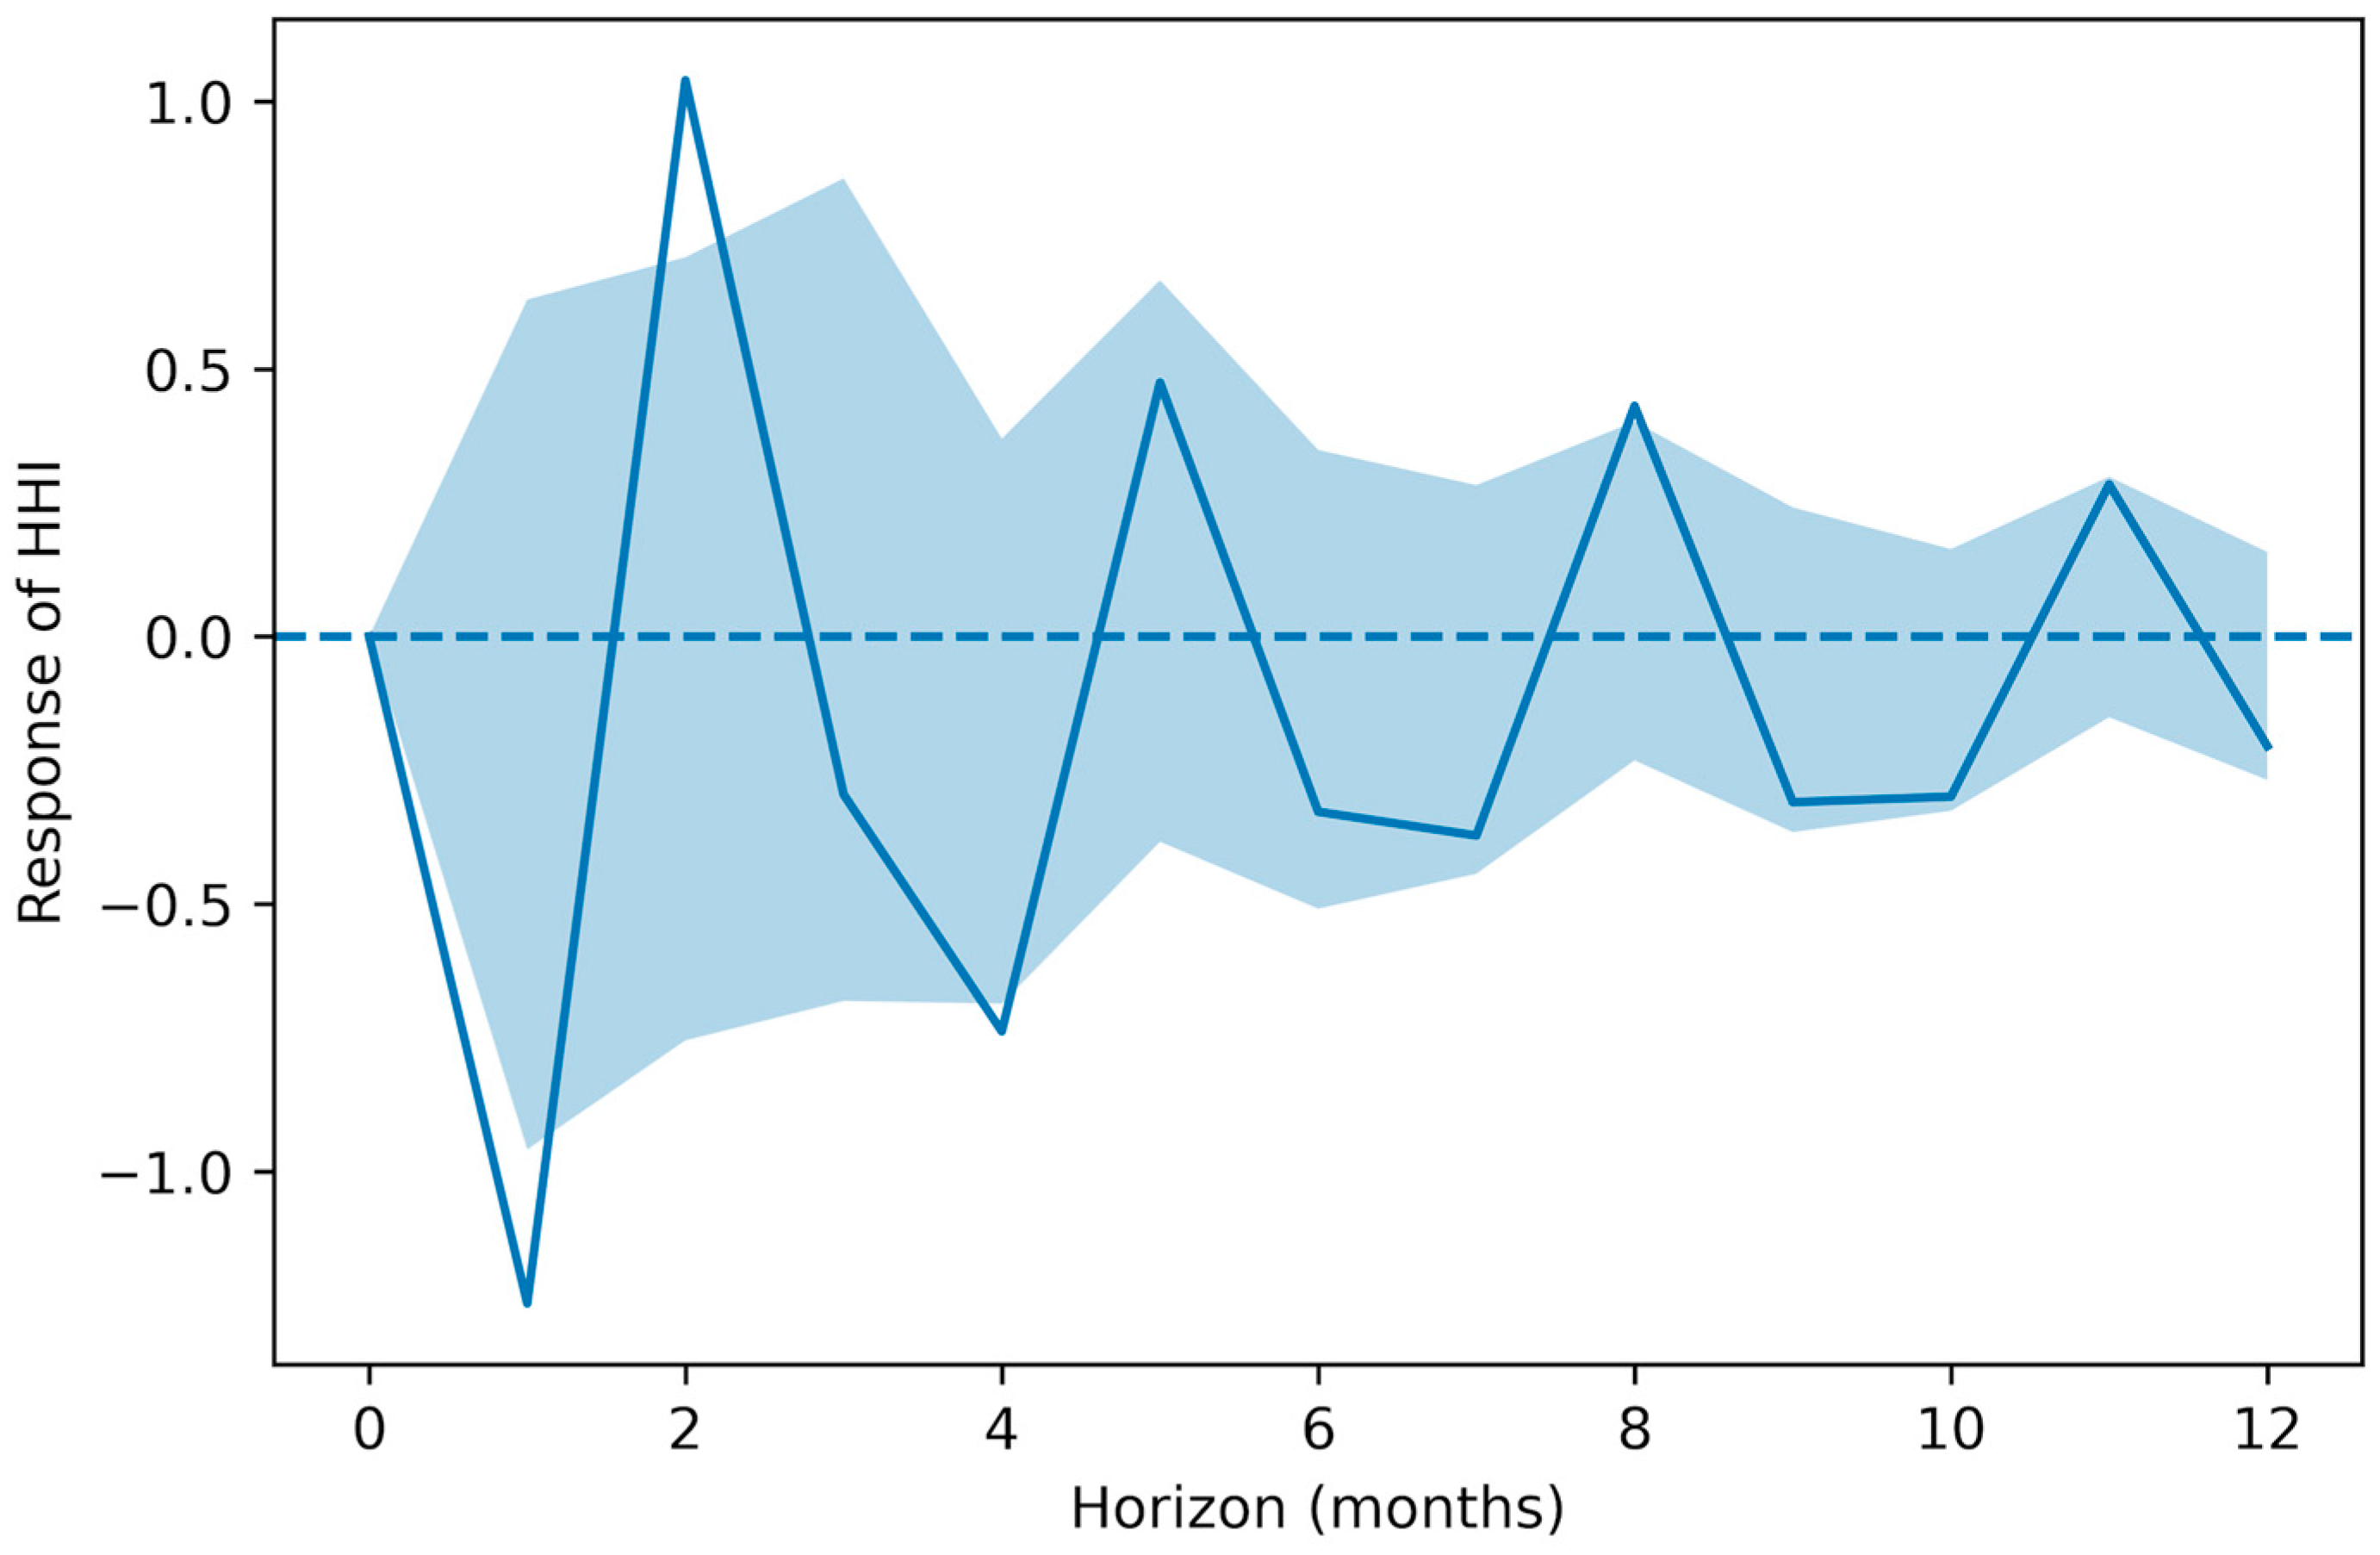
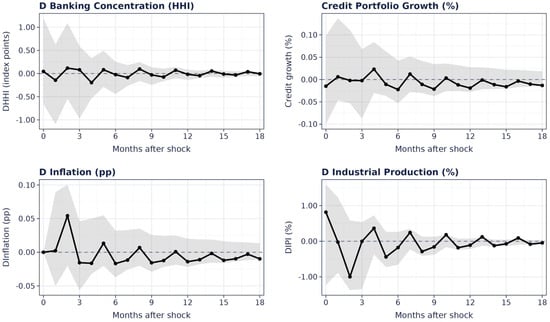
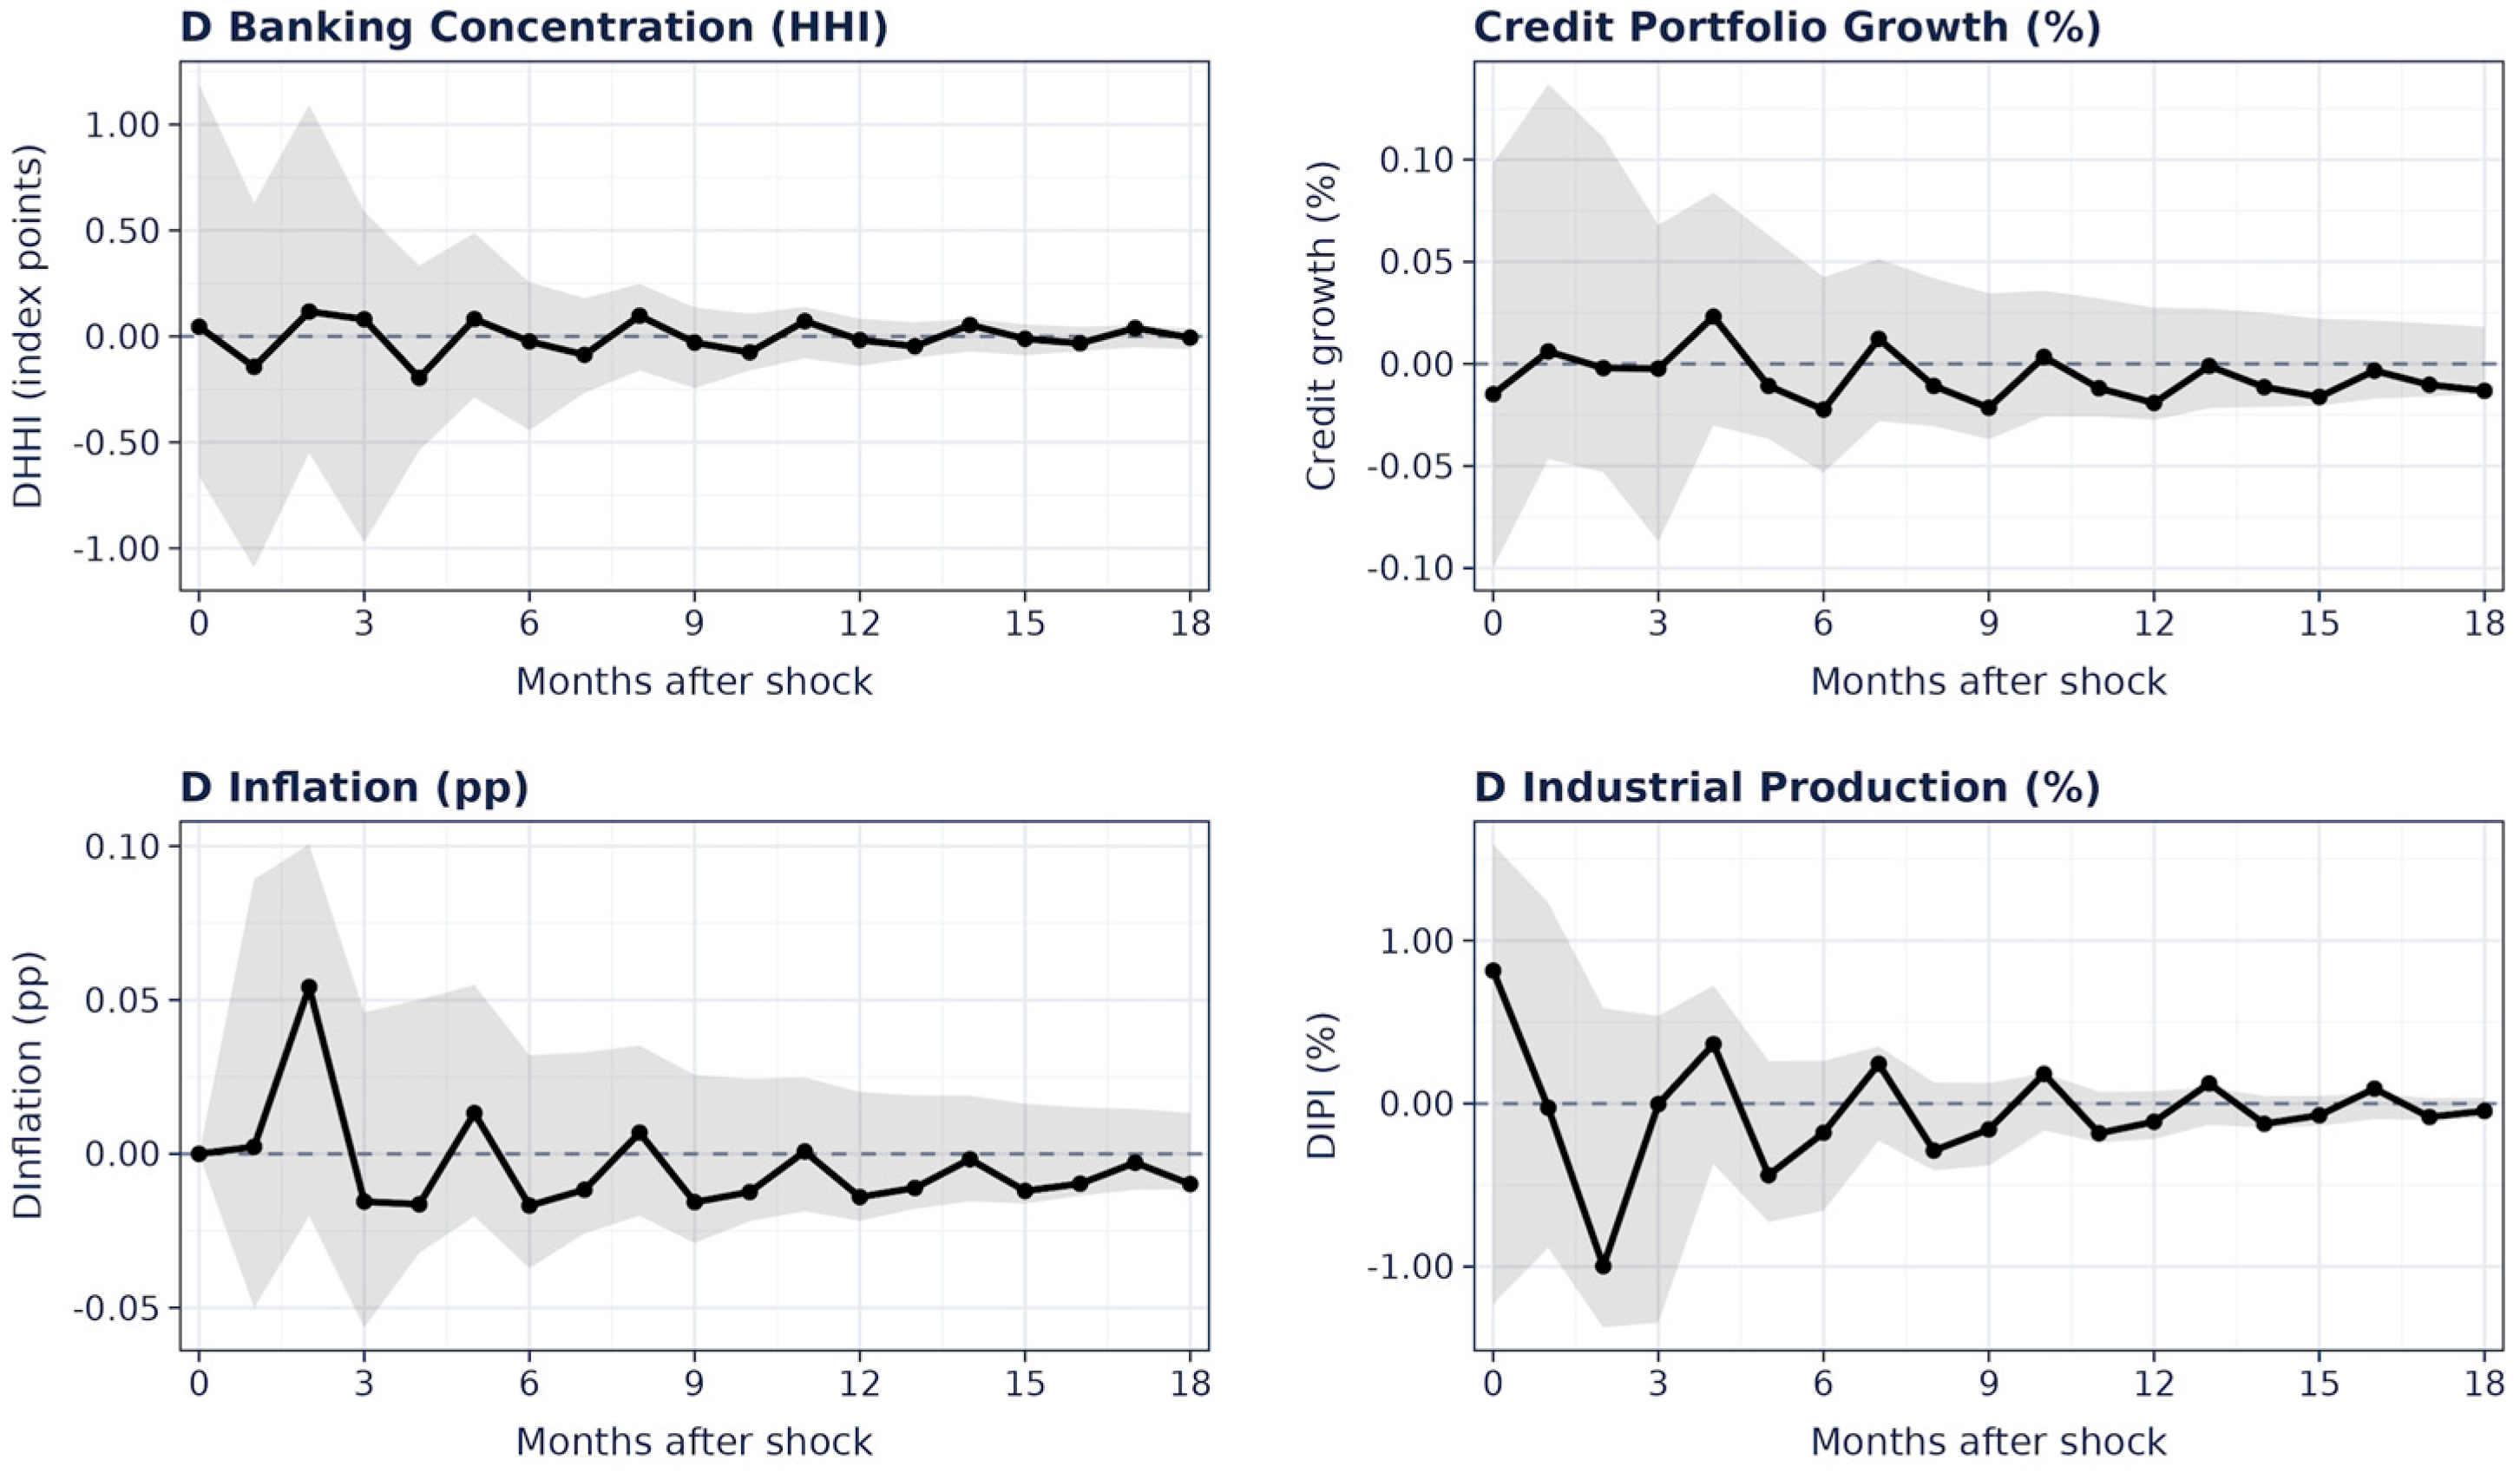
Figure 7 illustrates the complete set of impulse responses in the extended system. The banking concentration response (top-left panel) shows a small, statistically insignificant short-term effect, aligning with the baseline model: the point estimate reaches about +0.14 HHI points at h = 3, but the 95% confidence interval includes zero across all horizons. Credit portfolio growth (top-right panel) reacts negatively at first and stays below zero for the first six months, reflecting a typical lending channel where higher rates slow new credit issuance. Inflation (bottom-left) and industrial production (bottom-right) exhibit the anticipated contractionary responses, serving as a validation that the estimated monetary shock aligns with macroeconomic theory. Figure A1 in Appendix A isolates the HHI panel of Figure 7 at a larger scale, with 95% bootstrap confidence intervals based on 1000 replications, to allow closer inspection of the magnitude and precision of this short-run response.
Figure 7.
Extended VAR: Impulse responses to a contractionary monetary policy shock. Note: The figure reports impulse responses to a contractionary monetary policy shock from the extended VAR specification. Each panel shows the response of a different variable: banking concentration measured by the HHI index, credit portfolio growth, inflation, and industrial production growth. In all panels, the solid black line with circular markers represents the estimated impulse response. The grey shaded area represents the 95% bootstrap confidence interval. The horizontal dashed line indicates the zero-response benchmark. Values above zero indicate a positive response of the corresponding variable after the shock, while values below zero indicate a negative response. The x-axis reports months after the shock. The y-axis reports the response in the units indicated in each panel: HHI index points for banking concentration, percentage points for inflation, and percent changes for credit portfolio growth and industrial production. Variables are in first differences. Bootstrap confidence intervals are based on residual resampling.
Adding credit growth to the analysis does not fundamentally change the estimated concentration response, but it highlights a possible mechanism: a reduction in credit supply does not disproportionately affect the market shares of large institutions to cause a statistically significant or lasting change in the HHI during this period. This aligns with Colombia’s institutional setting, where leading banks maintain diversified portfolios and stable credit shares throughout the cycle.
Lag-order selection by AIC on the five-variable extended system independently confirms VAR(3) as optimal (AIC = −9.635 at lag 3, the global minimum across lags 0–6), corroborating the lag choice retained throughout the paper. Granger causality tests in the extended VAR confirm the baseline conclusion: the policy rate does not Granger-cause HHI (F(3,380) = 0.12, p = 0.950), nor does credit growth (F(3,380) = 0.96, p = 0.409), and the joint test is likewise insignificant (F(6,380) = 0.61, p = 0.720). Interestingly, the policy rate also does not significantly Granger-cause credit growth in this linear sense (F(3,380) = 0.36, p = 0.779), even though the sign-restricted SVAR (Section 4.2) finds a contractionary effect on credit when the shock is identified via sign restrictions rather than Granger-style lag exogeneity; this is a reminder that the two approaches answer different questions; sign restrictions identify a structural shock and its dynamic effect, while Granger tests assess linear predictive content. Table 2 reports the FEVD of HHI in the extended system: credit growth explains a more substantial share of HHI’s forecast variance (14–16% across horizons) than the policy rate (under 1% at every horizon) or inflation (2–4%), suggesting that to the extent aggregate lending conditions matter for concentration, they appear to operate through channels not well captured by the contemporaneous policy rate alone.
Table 2.
Forecast error variance decomposition of ΔHHI, extended VAR(3), 5-variable system (% of forecast error variance).
4.4. Regime-Dependent Local Projection Results
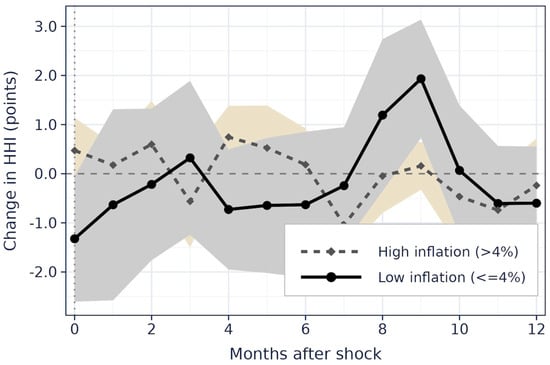
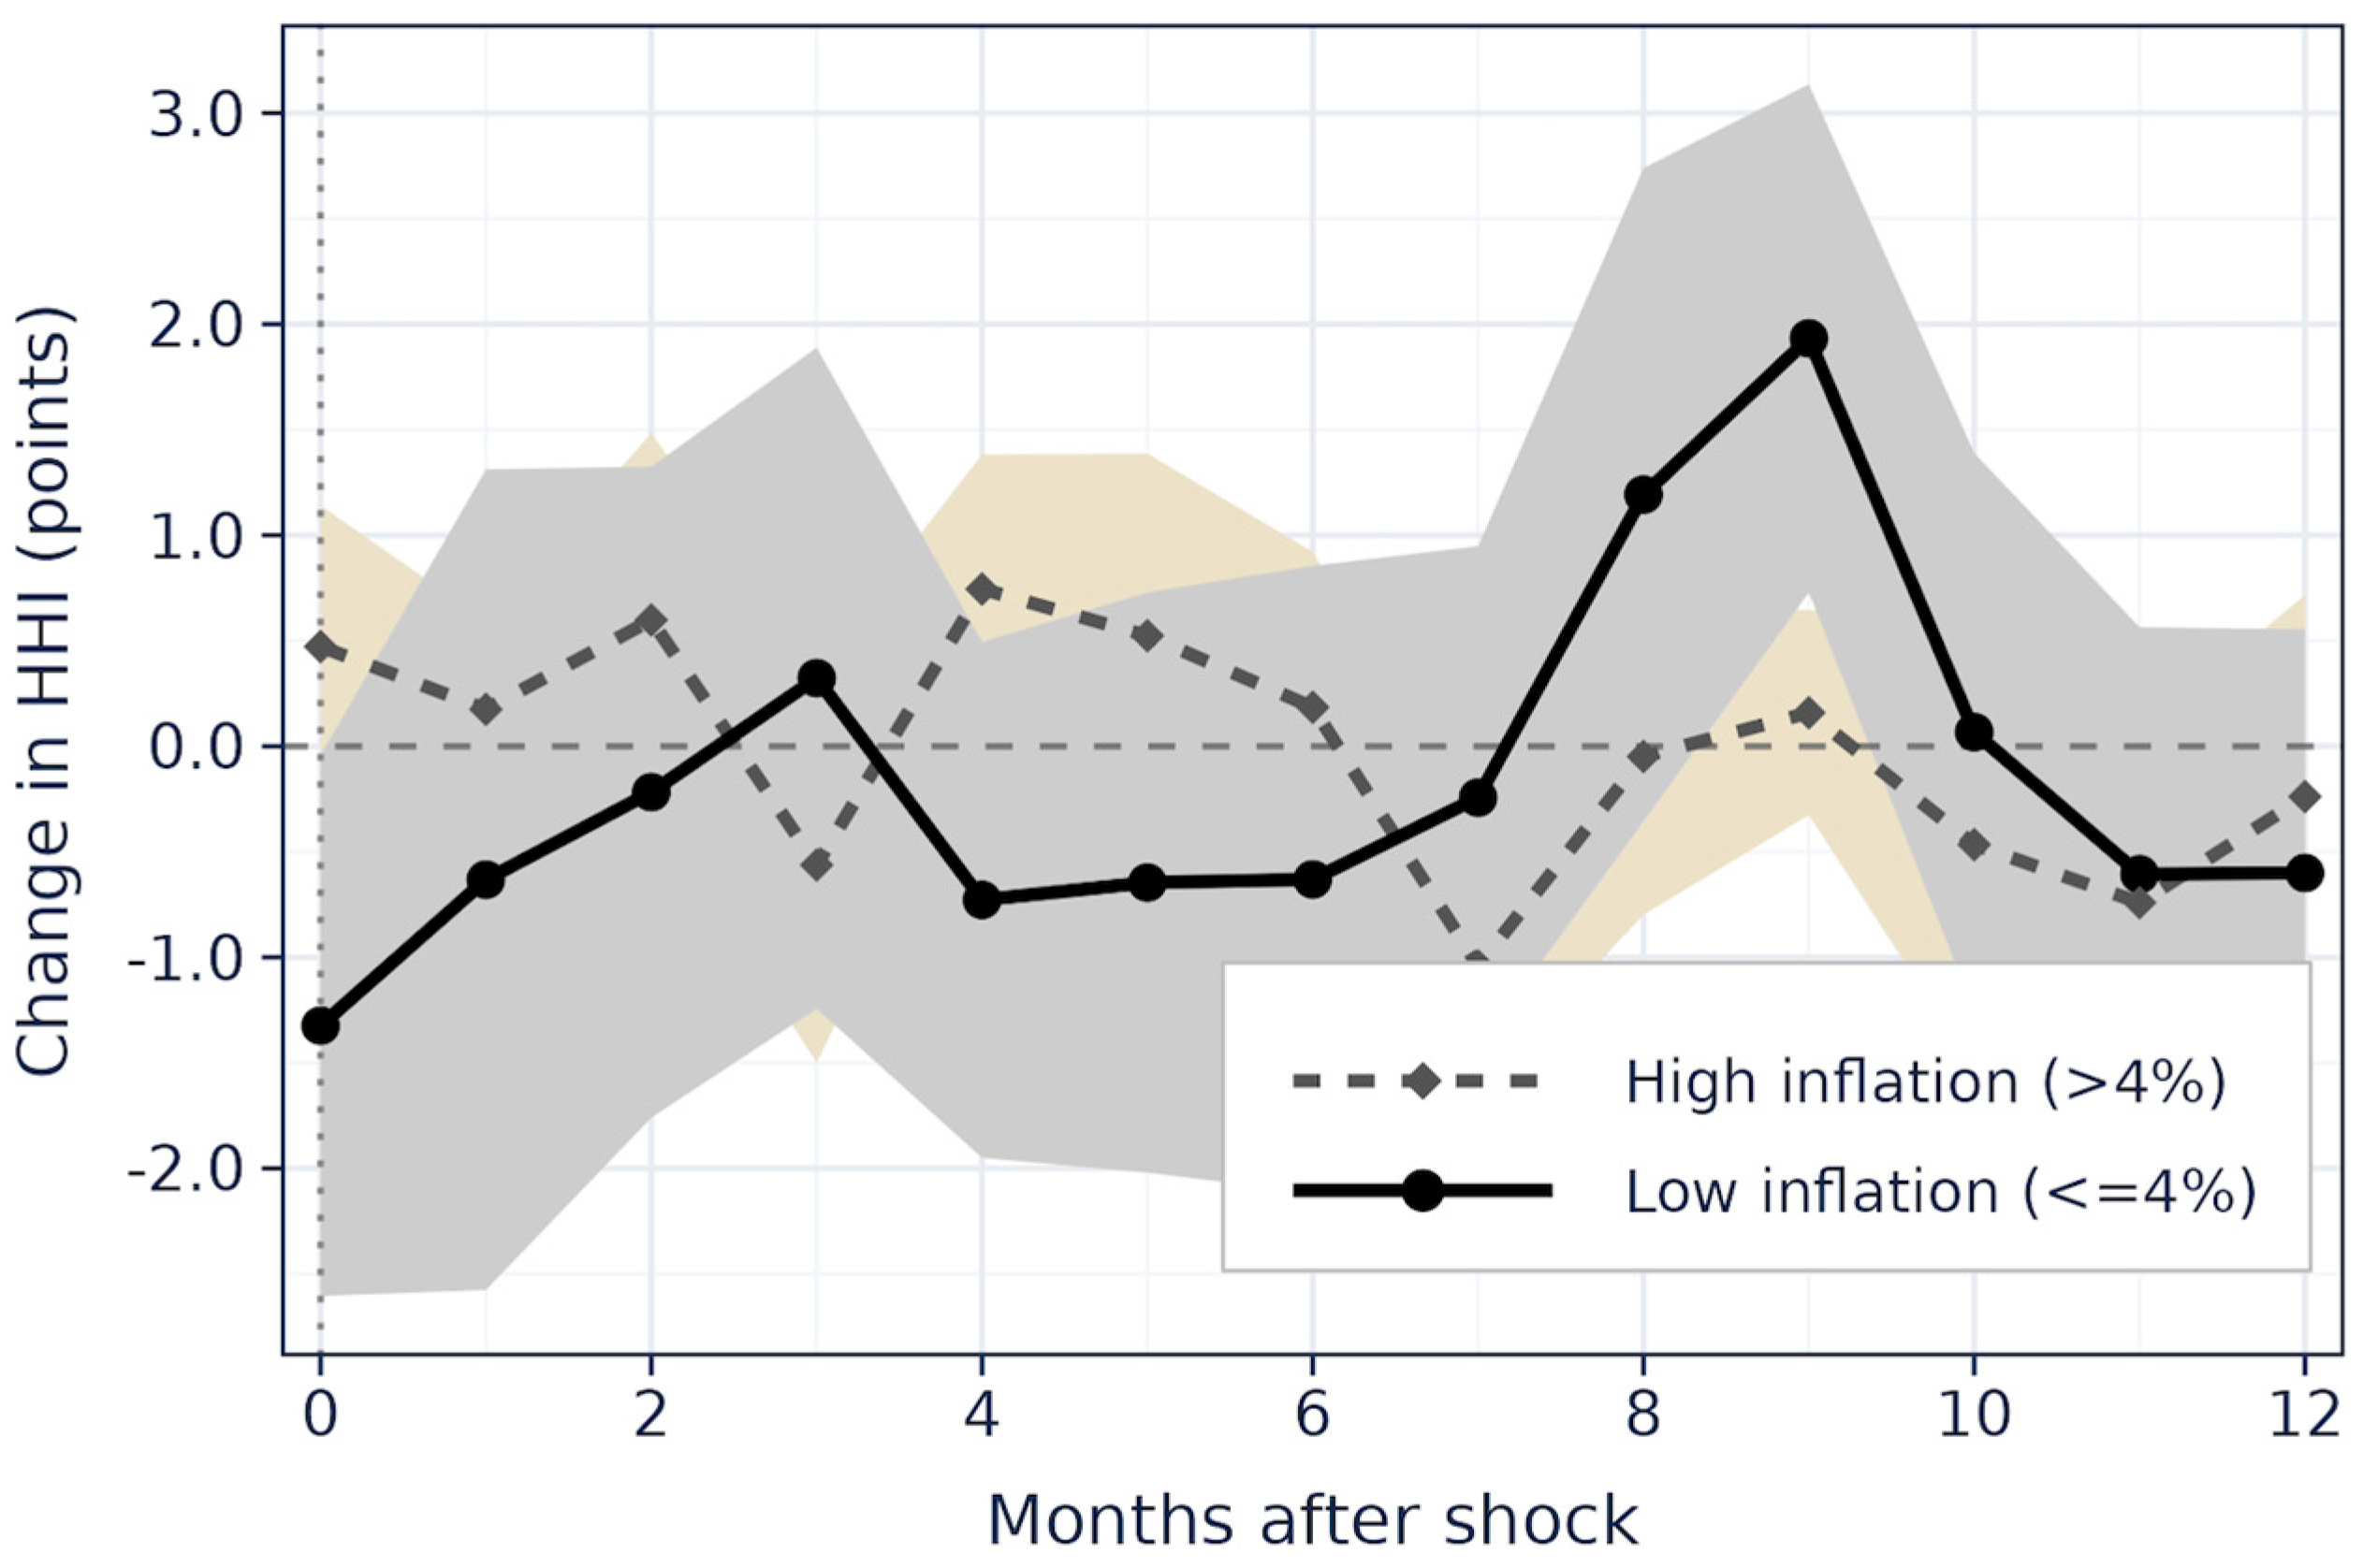
Figure 8 presents the impulse response in the regime-dependent analysis (right panel), which reveals important heterogeneity. In the low-inflation regime (Dt = 0), the estimated effect is positive and numerically larger at medium horizons, particularly at h = 9 (β1 ≈ +1.93, SE = 0.73). In the high-inflation regime (Dt = 1), the corresponding effect is substantially smaller (+0.16, SE = 0.30) and indistinguishable from zero. The interaction coefficient β2(h) is negative across most horizons, suggesting that contractionary shocks have a weaker, or even opposite, effect on concentration during episodes of high inflation. This pattern is consistent with the hypothesis that during aggressive tightening cycles (when the shock is large and widely anticipated), banks of all sizes adjust simultaneously, limiting the differential competitive effects that would alter market structure.
Figure 8.
Local projections. Regime-Dependent responses (inflation threshold = 4%). Note: The figure reports regime-dependent impulse responses of banking concentration, measured as the change in the HHI index, to a monetary policy shock. The solid black line with circular markers represents the estimated response in the low-inflation regime, defined as inflation less than or equal to 4%. The dashed grey line with diamond markers represents the estimated response in the high-inflation regime, defined as inflation above 4%. The shaded areas represent the corresponding confidence intervals around each regime-specific response. The horizontal dashed line indicates the zero-response benchmark. Values above zero indicate an increase in banking concentration after the shock, while values below zero indicate a decrease in banking concentration. The x-axis reports months after the shock, and the y-axis reports changes in HHI index points. The revised figure moves the legend outside the plotting area and uses lower-opacity confidence bands to avoid obscuring the impulse responses.
These results formally confirm the conceptual discussion: the effect of monetary policy on banking concentration is state-dependent. Importantly, neither regime exhibits evidence of persistent long-run effects, reinforcing the conclusion that the interaction between monetary policy and banking structure in Colombia operates primarily through short- to medium-run competitive dynamics rather than through permanent structural shifts.
5. Robustness Analysis
To assess the robustness of the VAR model results in first differences, a series of additional exercises was conducted to examine the stability of dynamic relationships, the potential for cointegration, and the validity of the adopted specification. We start by examining the time-series characteristics of the variables. Table A1 provides mixed evidence in levels, but the joint interpretation of the ADF and KPSS tests is consistent with treating the variables as integrated of order one. On that basis, the empirical models are estimated in first differences. The findings provide mixed evidence at the level. For instance, inflation and the monetary policy rate do not reject a unit root under the ADF test, whereas the KPSS test indicates non-stationarity. Similarly, the concentration index (HHI), industrial production, and the (logged) credit portfolio show persistence consistent with non-stationary behavior. In contrast, all variables become stationary after taking first differences. These outcomes justify employing a basic VAR model in first differences and support the empirical approach outlined in Section 3.2.
Table A3 presents the lag selection criteria for the VAR model. The Akaike Information Criterion (AIC) indicates a three-lag (VAR(3)) setup with an AIC of −1.997, whereas other criteria like BIC suggest simpler models. Given the small sample size and the importance of capturing short-term dynamics, we retain the VAR(3) specification throughout the analysis. This ensures sufficient flexibility for dynamic adjustments without overfitting while maintaining consistency across the baseline, extended, and robustness models.
5.1. Cointegration Tests and VECM Estimation
Table A2 in the annex reports the results of the Johansen cointegration test. The trace statistic for the null hypothesis of no cointegration (r = 0) is 81.23, below the 5% critical value of 95.75, and similar non-rejection patterns are observed for higher ranks. These results indicate the absence of a statistically significant long-run equilibrium relationship among banking concentration, monetary policy, inflation, and real activity. Consequently, the specification in first differences is appropriate. This finding is consistent with the impulse–response analysis in the previous section, where all effects dissipate within 9 to 12 months, confirming that the relationship operates through short-run dynamics rather than long-run structural adjustment. These findings should be interpreted as evidence conditional on a high-inflation tightening episode in an emerging economy with an already concentrated banking system, rather than as a generalizable structural relationship.
5.2. Sensitivity to Identification: Recursive VAR vs. Sign-Restricted SVAR
The robustness of the results to the identification strategy is assessed by comparing the recursive VAR with the sign-restricted SVAR. Under recursive identification (Figure 5), the impulse–response function suggests a negative short-run effect of monetary tightening on concentration. However, the confidence intervals include zero at all horizons, indicating a lack of statistical significance. In contrast, the sign-restricted SVAR (Table A4 and Figure 6) yields a positive and statistically significant response at short horizons. Specifically:
- At , the median response is 0.21, with a 68% credible interval of [0.04, 0.43].
- At , the response peaks at 0.60, with a 68% interval of [0.33, 0.94] and a 90% interval of [0.12, 1.16], both of which exclude zero.
This indicates a statistically meaningful short-run increase in banking concentration following contractionary monetary shocks under this identification scheme. Beyond , the response rapidly declines. At the median is −0.09 with wide credible intervals (−1.15, 0.99), and by and , the response is effectively zero. These results confirm that both the sign and statistical significance of the effect depend critically on identification assumptions, while also showing that the effect is short-lived across specifications.
5.3. Dynamic Patterns and Horizon Dependence
The dynamic pattern of the response is consistent across identification strategies. In the SVAR (Table A4), the response is positive at short horizons (h = 0 and h = 3), becomes statistically insignificant by h = 6, and converges to zero thereafter. Similarly, local projections (Table A5) show that statistically significant effects are concentrated at medium horizons, particularly at h = 9, while responses at shorter and longer horizons are not distinguishable from zero. This confirms that the effect is horizon-dependent and not persistent.
5.4. Summary of Robustness Findings
The robustness analysis presents four main conclusions. First, the empirical specification is solid: stationarity tests (Table A1) support using first differences, and lag selection criteria (Table A3) justify a VAR(3) model. Second, the estimated impact of monetary policy on banking concentration varies significantly across different identification strategies. The sign-restricted SVAR shows a statistically significant short-term increase (e.g., 0.60 at h = 3), while the recursive VAR responses are not statistically significant. Third, the relationship depends on the economic regime: at medium horizons, the effect is substantial and significant in low-inflation periods (1.93 at h = 9), but minimal during high-inflation periods. Evidence of regime dependence mainly appears at medium horizons, especially at h = 9, where the low-inflation response is positive and statistically distinguishable from the high-inflation response. Fourth, the effect is both temporary and dynamic, with responses only appearing at medium horizons and diminishing over time. Overall, these findings suggest caution: monetary policy impacts banking concentration in the short term, depending on the identification approach and economic regime, without implying a stable or long-term structural effect.
6. Discussion
The Colombian financial sector is highly concentrated, with a few dominant institutions controlling the majority of credit services. The Herfindahl-Hirschman Index (HHI) and concentration indices (CR3, CR5) indicate that market concentration has remained persistently high, reinforcing concerns about limited competition. Although the sector has expanded in absolute terms, the distribution of credit remains skewed toward a few large institutions, potentially limiting access for small businesses and underserved populations.
The sign-restricted SVAR and local projection results offer a detailed perspective. Using sign-restriction identification, contractionary monetary shocks lead to a short-term rise in banking concentration at horizon h = 3, aligning with Jović’s (2025) theoretical explanation, which suggests that increased funding costs squeeze margins more for smaller, less-capitalized banks, allowing larger, established banks to expand their market share. This finding differs in sign from the point estimate of the baseline recursive VAR; however, since the recursive VAR response is not statistically significant at any horizon, the SVAR result should be read as the more informative evidence on direction, while the comparison mainly illustrates how identification assumptions affect estimation precision. However, neither method indicates a lasting long-term structural change, as both the SVAR’s credible sets and the LP’s confidence bands approach zero by h = 12. This supports the idea that any competitive effects from monetary tightening are temporary and do not significantly change the Colombian banking market’s structure in the medium term.
The regime-dependent local projections reveal meaningful heterogeneity in transmission. In the low-inflation regime, the concentration response to a contractionary shock is positive and quantitatively larger at medium horizons (h = 9), consistent with a selective mechanism in which tightening conditions disproportionately affect smaller or less diversified institutions during normal times. In the high-inflation regime—when the tightening cycle is aggressive and broad-based—the concentration response is attenuated and statistically indistinguishable from zero, suggesting that during macroeconomic crises, banks of all sizes adjust simultaneously, and the market-share differential effect is dampened. This finding formally confirms the nonlinear and state-dependent intuition discussed in Section 2.3.
It is worth putting the magnitude of these effects in context. The SVAR’s peak estimate of +0.60 HHI points at h = 3 is small relative to the average level of the HHI over the sample period, which sits in the low-to-mid thousands on the 0–10,000 scale; a one-time, short-lived shift of this size would correspond to a marginal reallocation of market share on the order of a few tenths of a percentage point among the largest institutions, not a change in the number or identity of dominant players. Under standard competition-policy benchmarks, a movement of this size would not, on its own, move the market across a concentration-classification threshold (e.g., from moderately to highly concentrated). The economic reading we therefore favor is that monetary tightening produces a detectable but small and transitory tilt toward the largest incumbents, consistent with a temporary funding-cost advantage rather than a durable change in competitive structure. This is also consistent with the qualitative pattern in the LP results, where the largest and only conventionally significant coefficient (β1 ≈ +1.93 at h = 9 in the low-inflation regime) remains an order of magnitude smaller than the persistent, M&A-driven shifts in market share discussed in Section 2.1 (e.g., the Davivienda–Scotiabank transaction), reinforcing that monetary-policy-induced concentration changes and corporate-transaction-driven concentration changes operate on different scales and, plausibly, different time horizons. We do not have bank-level credit data disaggregated by institution size in the present dataset, which would be required to formally test whether large and small banks respond asymmetrically to monetary shocks; the consistency of our aggregate HHI, CR5, and dominance-index results with theoretical predictions of disproportionate effects on smaller, less-capitalized banks is suggestive but indirect, and we flag a bank-level panel extension as a priority for future work.
The short-run reduction in concentration observed following contractionary monetary policy innovations contrasts with evidence from some European contexts, where prolonged low-rate environments were associated with increased consolidation. One possible mechanism is that during tightening cycles in already-concentrated emerging markets, higher funding costs may compress margins more sharply for large incumbents with extensive loan portfolios, while smaller or digital entrants adjust more flexibly through niche strategies. Additionally, the recent entry of neobanks in Colombia may have amplified short-term competitive responses during the tightening phase. Importantly, the impulse responses do not indicate persistent long-term structural changes, suggesting that the observed dynamics reflect temporary competitive adjustments rather than permanent shifts in market dominance.
This paper demonstrates that in a highly concentrated emerging banking system experiencing post-pandemic inflation, monetary policy is not inherently neutral. The results underscore the importance of central banks to assess the structural and competitive impacts of their policy decisions, especially during extended tightening cycles. Translating this into concrete guidance, we offer three specific recommendations. First, because the SVAR evidence points to a short-run, regime-dependent tilt toward larger incumbents during contractionary episodes, Banco de la República and the Superintendencia Financiera could incorporate a routine concentration-monitoring indicator (HHI, CR5, and the dominance index) into the macroprudential dashboard reviewed alongside each policy-rate decision, so that any emerging tilt is flagged while it is still short-lived rather than after it has had time to harden. Second, because the effect is concentrated in the low-inflation regime and attenuates during aggressive tightening, the case for active competition-policy intervention is strongest during normalization phases following a tightening cycle, when smaller institutions are most likely to be recovering market share; this is a more precise window for action than a blanket recommendation to monitor concentration at all times. Third, since neither identification strategy points to a persistent structural effect, we would caution against using these results to justify permanent structural remedies (e.g., divestiture requirements); the evidence instead supports lighter-touch, time-bound measures, such as temporarily easing licensing or interoperability requirements for smaller and digital entrants during the months following a tightening episode, paired with the entry-barrier and interoperability reforms for neobanks and fintechs already noted above. We are conscious that fintech and neobank entry is itself evolving rapidly in Colombia over our sample period (most notably Lulo Banco’s 2022 launch); our framework treats this as part of the background market structure rather than as an explicit channel, and a natural extension would model digital-entrant market share as its own variable interacting with monetary shocks, which our dataset does not currently support at monthly frequency. Additionally, the study has limitations due to the reduced-form VAR framework and the specific monetary regime analyzed. A further limitation concerns potential endogeneity: the policy rate, inflation, and banking-sector outcomes are jointly determined by the central bank’s reaction function, and while our recursive and sign-restricted identification schemes impose timing and sign assumptions intended to approximate the structural shock, we cannot fully rule out that some of the correlation we attribute to monetary policy reflects reverse causality (e.g., the central bank responding to perceived risks to financial stability arising from concentration itself) or omitted common drivers such as exchange-rate shocks or external financial conditions that move both the policy rate and bank balance sheets simultaneously. The lack of statistical significance across horizons should not be interpreted as absence of economic relevance. Instead, it reflects the inherent limitations of small-sample macro-financial VAR models and the high volatility of the post-pandemic period. The consistently negative point estimates suggest a systematic short-run pattern, although the estimates are not precisely estimated. By explicitly reporting confidence intervals, sensitivity to specification, and robustness checks, this paper contributes to improving transparency in empirical macro-financial research, particularly in emerging economy contexts with limited data availability. While our results are estimated specifically for Colombia, we expect the underlying mechanism, that contractionary shocks interact with pre-existing concentration to produce a short-run, state-dependent tilt toward larger incumbents, to be most relevant for other emerging markets that share Colombia’s combination of bank-dominated credit markets, regionally high concentration, and recent aggressive tightening cycles, such as Peru and other Andean economies; markets with lower baseline concentration or more developed capital-market alternatives to bank credit would likely show a weaker or undetectable version of this effect, which is itself a testable prediction for comparative future work.
Future research could improve on this by employing alternative identification methods and extending the analysis over longer periods. While the literature highlights potential nonlinear or state-dependent effects, the empirical strategy adopted here relies on a linear reduced-form VAR framework. The results should therefore be interpreted as average dynamic responses over the sample period rather than as evidence of regime-switching or nonlinear structural behavior.
Author Contributions
Conceptualization, J.E.R.-M. and Y.T.P.C.; methodology, J.E.R.-M. and Y.T.P.C.; software, J.E.R.-M.; formal analysis, O.A.I.-D.; investigation, O.A.I.-D. and H.F.G.-S.; resources, J.E.R.-M. and H.F.G.-S.; data curation, J.E.R.-M.; writing—original draft preparation, O.A.I.-D. and J.E.R.-M.; writing—review and editing, J.E.R.-M.; visualization, Y.T.P.C.; supervision, H.F.G.-S. All authors have read and agreed to the published version of the manuscript.
Funding
This research received no external funding.
Institutional Review Board Statement
Not applicable.
Informed Consent Statement
Not applicable.
Data Availability Statement
These data were derived from the following resources available in the public domain: Banco de la República de Colombia, https://suameca.banrep.gov.co/estadisticas-economicas/ (accessed on 1 January 2025), Superintendencia Financiera de Colombia, https://www.superfinanciera.gov.co/publicaciones/60764/estadisticas-60764/ (accessed on 1 January 2025).
Conflicts of Interest
The authors declare no conflict of interest.
Appendix A. Econometric Diagnostic Tables
Table A1.
Unit Root Tests (ADF and KPSS).
Table A2.
Johansen Cointegration Test (Trace Statistics).
Table A3.
VAR Lag Selection Criteria.
Table A4.
SVAR Sign-restricted IRF HHI responses to monetary shock.
Table A5.
Local projections–Full Sample and Regime Coefficients.
Figure A1.
Impulse response of banking concentration (HHI) to a monetary policy innovation in the extended VAR specification. Shaded areas represent 95% bootstrap confidence intervals (1000 replications). The solid blue line represents the estimated impulse response of the HHI to a monetary policy shock at each horizon. The light-blue shaded area represents the confidence interval around the estimated response. The horizontal dashed blue line represents the zero-response benchmark. Values above the dashed line indicate a positive response of banking concentration, while values below the dashed line indicate a negative response. The x-axis shows the horizon in months after the shock, and the y-axis shows the HHI response.
References
- Adams, R. M., & Amel, D. F. (2010). Market structure and the pass-through of the federal funds rate. Journal of Banking & Finance, 34(5), 1087–1096. [Google Scholar] [CrossRef] [Scilit]
- Arias, J. E., Rubio-Ramírez, J. F., & Waggoner, D. F. (2018). Inference based on structural vector autoregressions identified with sign and zero restrictions: Theory and applications. Econometrica, 86(2), 685–720. [Google Scholar] [CrossRef] [Scilit]
- Baarsma, B., & Vooren, M. (2018). Bank competition and the transmission of unconventional monetary policy in the euro area. European Competition Journal, 14(1), 174–193. [Google Scholar] [CrossRef] [Scilit]
- Bain, J. S. (1951). Relation of profit rate to industry concentration: American manufacturing, 1936–1940. Quarterly Journal of Economics, 65(3), 293–324. [Google Scholar] [CrossRef] [Scilit] [PubMed]
- Barnichon, R., & Matthes, C. (2014). Functional approximation of impulse responses. Journal of Monetary Economics, 99(C), 41–55. [Google Scholar]
- Beck, T., Demirgüç-Kunt, A., & Levine, R. (2007). Finance, inequality, and the poor. Journal of Economic Growth, 12(1), 27–49. [Google Scholar] [CrossRef] [Scilit]
- Berger, A. N. (1995). The profit–structure relationship in banking—Tests of market-power and efficient-structure hypotheses. Journal of Money, Credit and Banking, 27(2), 404–431. [Google Scholar] [CrossRef] [Scilit]
- Berger, A. N., & Hannan, T. H. (1989). The price-concentration relationship in banking. Review of Economics and Statistics, 71(2), 291–299. [Google Scholar] [CrossRef] [Scilit]
- Cao-Alvira, J. J., & Gómez-González, J. E. (2025). On regional bank concentration and firm leverage: The case of Colombia. Emerging Markets Finance and Trade, 61(1), 80–93. [Google Scholar] [CrossRef] [Scilit]
- Cetorelli, N., & Gambera, M. (2001). Banking market structure, financial dependence and growth. Journal of Finance, 56(2), 617–648. [Google Scholar] [CrossRef] [Scilit]
- Demsetz, H. (1973). Industry structure, market rivalry, and public policy. Journal of Law and Economics, 16(1), 1–9. [Google Scholar] [CrossRef] [Scilit]
- Hotelling, H. (1929). Stability in competition. Economic Journal, 39(153), 41–57. [Google Scholar] [CrossRef] [Scilit]
- Jordà, Ò. (2005). Estimation and inference of impulse responses by local projections. American Economic Review, 95(1), 161–182. [Google Scholar] [CrossRef] [Scilit]
- Jović, Ž. (2025). Expansionary monetary policy vs. bank concentration: The eurozone & other European countries. Panoeconomicus, 72(1), 23–51. [Google Scholar] [CrossRef] [Scilit]
- Melnik, A., Shy, O., & Stenbacka, R. (2008). Assessing market dominance. Journal of Economic Behavior & Organization, 68(3–4), 636–648. [Google Scholar] [CrossRef] [Scilit]
- Ocampo, S., Medina, C., & Mojica, A. (2025). Concentration spiral. Phenomenal World. [Google Scholar]
- Ramey, V. A., & Zubairy, S. (2018). Government spending multipliers in good times and in bad: Evidence from US historical data. Journal of Political Economy, 126(2), 850–901. [Google Scholar] [CrossRef] [Scilit]
- Rhoades, S. A. (1993). The Herfindahl–Hirschman index. Federal Reserve Bulletin, 79(3), 188–189. [Google Scholar]
- Salop, S. C. (1979). Monopolistic competition with outside goods. Bell Journal of Economics, 10(1), 141–156. [Google Scholar] [CrossRef] [Scilit] [PubMed]
- Severe, S. (2016). An empirical analysis of bank concentration and monetary policy effectiveness. Journal of Financial Economic Policy, 8, 163–182. [Google Scholar] [CrossRef] [Scilit]
- Tenreyro, S., & Thwaites, G. (2016). Pushing on a string: US monetary policy is less powerful in recessions. American Economic Review, 2(4), 177–201. [Google Scholar]
- Thein, E. E., Niigata, A., & Inaba, K. (2024). Concentrated bank market and SMEs’ collateral issues: A study of the firms of developing Asian countries. Journal of Economic Structures, 13(1), 18. [Google Scholar] [CrossRef] [Scilit]
- Uhlig, H. (2005). What are the effects of monetary policy on output? Results from an agnostic identification procedure. Journal of Monetary Economics, 52(2), 381–419. [Google Scholar] [CrossRef] [Scilit]

Disclaimer/Publisher’s Note: The statements, opinions and data contained in all publications are solely those of the individual author(s) and contributor(s) and not of MDPI and/or the editor(s). MDPI and/or the editor(s) disclaim responsibility for any injury to people or property resulting from any ideas, methods, instructions or products referred to in the content. |
© 2026 by the authors. Licensee MDPI, Basel, Switzerland. This article is an open access article distributed under the terms and conditions of the Creative Commons Attribution (CC BY) license.