


Abstract
Many investors have relied on Bitcoin as a hedge against inflation. However, differences in inflation measurement and monetary policies across countries make it difficult to determine whether Bitcoin effectively serves as an inflation hedge. This study examined Bitcoin’s effectiveness as an inflation hedge in the United States and India using monthly data on Bitcoin returns and Consumer Price Index (CPI) changes from January 2015 to December 2024 (N = 118, after first-differencing and lag alignment). The study employed Ordinary Least Squares (OLS) models, bivariate Vector Autoregression (VAR) Granger causality tests, Bai–Perron Structural Break Analysis, Impulse Response Functions (IRFs), and Quantile Regression analyses. The findings revealed no significant relationship between CPI and Bitcoin returns in either the United States or India, providing no empirical support for the Fisher Hypothesis. However, Granger causality results showed that lagged Bitcoin returns significantly predicted future U.S. CPI values, while no such relationship was observed for India. The predictive power of the model for the U.S. was lost after October 2022 due to the crypto winter phenomenon. This indicates that Bitcoin is not used as a hedge against inflation but is rather considered a financially driven information asset, which is subject to market influences.
1. Introduction
Is there empirical evidence that Bitcoin serves as a protective mechanism against increasing levels of inflation, or is the notion of such a mechanism merely speculative? This study examines whether Bitcoin serves as an effective inflation hedge under two differing monetary policy systems: the United States—where a well-established institutional marketplace for cryptocurrencies exists and the Federal Reserve Board explicitly sets the long-term inflation rate; and India—which has an inflation-targeting central bank, but also imposes a 30% capital gains tax on all profits realized through cryptocurrency trading, as per Section 115BBH of the Indian Income Tax Act. According to Fisher (1930), an actual inflation hedge would be positively correlated with increases in CPI and would be resistant to “money illusion.” This study, treating Bitcoin as an information-sensitive financial asset, examined whether it meets both of those requirements.
The dual U.S.–India system is derived from theory regarding whether the institutional structure of markets influences the macroeconomic effects of fluctuations in crypto-asset prices on the consumer price index. The study treats the U.S. and India as institutionally contrasting cryptocurrency environments differing in regulatory integration, market participation structure, and monetary transmission characteristics. Under this framing, the U.S. is associated with greater institutional market depth—including the SEC’s 2024 approval of a spot Bitcoin ETF (SEC, 2024) and a predominantly professional or institutional investor base—while India’s crypto market is characterized by retail-dominated participation and a more restrictive regulatory environment, suggesting that fluctuations in crypto-asset prices may carry lower probabilities of influencing macroeconomic expectations. Furthermore, India has experienced significantly higher average annual inflation rates than the U.S., specifically 5% versus 2.9%. Additionally, the majority of participants in India’s crypto marketplace are retail investors who face a 30% tax rate on profits (Government of India, 2022). By employing the comparison-institutional method widely used in comparative institutional finance studies (i.e., using institutionally different markets as a natural contrasting setting rather than measuring institutional depth directly), this study views the U.S.–India pairing as a theoretically valid comparative institutional framework.
This study was motivated by three shortfalls in prior literature. First, many prior studies did not adequately address issues related to stationarity and therefore raised serious questions regarding the reliability of their findings. Second, the previous works used different techniques for their residual analysis, thus potentially affecting the robustness of their estimates. Third, previous studies published before January 2024 did not examine bidirectional Granger causality or structural breaks in either direction.
The present study contributes in three ways. First, it delivers one of the first bilateral Granger causality tests on Bitcoin returns and U.S. and Indian CPI changes through December 2024, showing that Bitcoin returns exhibit predictive precedence over future U.S. CPI changes but not India’s—a distinction plausibly linked to institutional differences in market architecture that prior country-specific studies have not examined. Second, it provides evidence of structural instability in the BTC–inflation relationship by employing multiple breakpoint tests, following Bai and Perron (2003). The study concludes that, if Bitcoin returns were able to predict U.S. inflation, they did so before the crypto-winter period beginning in October 2022. Third, by applying multiple complementary empirical techniques, including HAC-robust OLS estimation, bidirectional Granger causality testing, structural break analysis, and quantile regression—this study offers a more applied empirical framework than prior single-country or single-specification analyses, combining dual stationarity testing, HAC-robust standard errors, bidirectional Granger causality across lags 1–4, and quantile regression within a unified framework for the U.S.–India bilateral setting. The remainder of the paper is organized as follows. Literature review is given in Section 2. Section 3 discusses data and methodology. Results are given in Section 4. Discussion and conclusion are given in Section 5.
2. Literature Review
The possibility of Bitcoin being used as a hedge against inflation stems from the predetermined cap of 21 million Bitcoins, which negates the possibility of money supply expansion by central banks (Nakamoto, 2008). According to Fisher, expected inflation would be wholly reflected in nominal asset returns, such that, in efficient markets, investors should incorporate anticipated price movements into their buying and selling decisions (Fama & Schwert, 1977). Dyhrberg (2016) demonstrated through GARCH modeling that Bitcoin is effective as a hedge against risks comparable to gold and the U.S. dollar. Henriques and Sadorsky (2018) explored in this journal whether Bitcoin can substitute for gold as an investment asset and noted that risk-averse investors could benefit from replacing gold with Bitcoin, thereby forming a theoretical basis for determining the viability of Bitcoin as an asset class. Phochanachan et al. (2022) later found that hedge effectiveness relies on cryptocurrency adoption.
Later findings have been more mixed. Blau et al. (2021) documented a positive association between Bitcoin and inflation expectations in a U.S. sample, offering partial support for the inflation-hedge narrative. Choi and Shin (2022), however, reported only an asymmetric VAR response to inflation shocks, and subsequent studies have been more skeptical. During COVID-19, Conlon and McGee (2020) found that Bitcoin increased, rather than reduced, portfolio losses, whereas Mariana et al. (2021) found that Bitcoin and Ethereum functioned as short-term safe havens for stocks over the same period. Conlon et al. (2021) concluded that any hedge property is temporary and time-dependent. Smales (2024) further identified a negative correlation between Bitcoin returns and CPI surprises, refuting the Fisher hypothesis. Binh (2024), writing in this journal, similarly confirmed gold’s reliability as an inflation hedge, and, drawing on the wider literature, characterized Bitcoin’s inflation-hedging potential as regime-dependent and of limited statistical significance.
The literature on time-varying and state-dependent outcomes has expanded in the post-2020 period. Liu and Valcarcel (2024) find that the positive hedging effect observed in Bitcoin futures turned negative following the 2022 crypto winter. Gaies et al. (2024), using quantile-frequency analysis, reveal high sensitivity in Bitcoin’s performance during inflationary periods, depending on shocks and quantiles. Sakurai and Kurosaki (2023) find that major cryptocurrencies became modestly more effective inflation hedges in the post-COVID reopening phase. Rodriguez and Colombo (2025) show that Bitcoin’s hedging ability has weakened with increased institutional usage, providing the closest recent precedent to the institutional channel identified in this study. Using a Bayesian structural VAR over the same 2015–2024 sample period, Chen (2025), in this journal, finds that cryptocurrency price shocks account for 18% of price-level forecast error variance at long horizons, providing complementary evidence that cryptocurrency dynamics carry macroeconomic price-level information in institutionally developed markets. Overall, the literature remains mixed, with findings varying across sample periods, econometric specifications, and institutional settings.
International literature still contains gaps. In their comparative study of the causal relationships between cryptocurrencies and other assets using Vector Error Correction Models (VECMs), Gbolahan (2023) identified different long-run effects across seven countries, including a significant positive long-run Bitcoin–inflation relationship in India specifically. In particular, while Gbolahan (2023) found an inverse relationship in the United States, hedging through cryptocurrencies was limited to extremely high quantile values, according to Matkovskyy and Jalan (2021). Using a time-varying Granger causality method to analyze the relationship between Bitcoin price fluctuations and the money supply indicator (M1) across Europe, the United States, and Japan, Mert and Timur (2023) developed a model that provides the best representation of the theoretical framework for the current bilateral Granger causality study. Differences from prior literature include the substitution of the money supply indicator with CPI inflation, the addition of India as a second country, an extension of the sample period through December 2024, and the use of the Bai–Perron Structural Break Test. None of these previous studies included data subsequent to 2022 nor tested both directions of Granger causality in the context of the U.S.–India case. Additionally, none applied the Bai–Perron Test after January 2024. Most notably, there is a paucity of India-centric literature pertaining to cryptocurrency, and nearly all extant studies focus on either U.S. or European markets. Therefore, this study fills that gap by providing a theoretically justified contrasting case based on India’s unique monetary and regulatory environments.
3. Data and Methodology
3.1. Data
Five series are employed: (1) monthly log Bitcoin returns using end-of-month prices from CoinMarketCap (CoinMarketCap, n.d.); (2) the year-over-year U.S. CPI change (CPIAUCSL, FRED/BLS) (FRED, n.d.); (3) the year-over-year India CPI change (MOSPI/RBI) (RBI/MOSPI, n.d.); (4) the federal funds rate (FEDFUNDS, FRED); and (5) the DXY U.S. Dollar Index (DTWEXM, FRED) (FRED, n.d.) as a monetary control for dollar exchange rate effects.
Bitcoin is chosen as the sole crypto-asset based on two criteria. First, the market capitalization of Bitcoin was the largest among cryptocurrencies throughout the sample period, corroborating previous research (Blau et al., 2021; Choi & Shin, 2022). Second, Bitcoin is the only cryptocurrency with substantial institutional investment in both the U.S. and Indian markets throughout the 2015–2024 period; alternative assets such as Ethereum lacked comparable institutional adoption in India, and a composite index would conflate assets with incompatible regulatory environments and liquidity profiles. Descriptive statistics for all variables are presented in Table 1. The standard deviation of 20.6% indicates that the volatility of monthly returns is very high. The excess kurtosis of 1.61 indicates the presence of fat tails. The average CPI in India is higher than that of the United States, at 5.0% and 2.9%, respectively. CoinMarketCap was used as the data source, similar to Blau et al. (2021), Choi and Shin (2022), and Smales (2024), thereby enabling comparisons across studies. With respect to the small sample size used, robustness was preferred over overfitting.
Table 1.
Descriptive statistics, January 2015–December 2024 (N = 118).
3.2. Stationarity Testing
The stationarity test was performed using the Augmented Dickey–Fuller (ADF) test and the Kwiatkowski–Phillips–Schmidt–Shin (KPSS) test. Where the ADF and KPSS tests produced conflicting signals, the Phillips–Perron (PP) test (Phillips & Perron, 1988) was employed as a confirmatory procedure, and the first difference was adopted according to Schwert (1989). Full results are reported in Table 2.
Table 2.
Unit root test results (ADF and KPSS), January 2015–December 2024.
3.3. OLS Regression Specification
Six OLS models are estimated. Models 1 and 3 are bivariate: BTC_Returnt = α + β·ΔCPIt + εt for U.S. and India respectively. Models 2 and 4 add monetary controls: BTC_Returnt = α + β1·ΔCPIt + β2·ΔFFRt + β3·ΔDXYt + εt. Models 5 and 6 replace contemporaneous ΔCPI with its one-period lag (ΔCPIt−1) to address the one-month CPI publication delay and test for lagged pass-through. Newey–West HAC standard errors with four lags are applied throughout (Newey & West, 1987). GARCH specifications are not employed, as the objective is to test the mean relationship predicted by Fisher (1930), for which OLS with HAC-robust standard errors is the standard estimator in this literature (Blau et al., 2021; Smales, 2024).
3.4. VAR Model and Granger Causality
Bivariate VAR models are estimated for each country pair, with lag order p = 1 selected unanimously by AIC, BIC, and HQ criteria (Table A1). Although information criteria unanimously selected VAR(1), additional lag structures (1–4) were tested to evaluate the robustness of predictive relationships across alternative temporal specifications. Two Granger causality hypotheses are tested for each country following the framework of Granger (1969): (i) H0: ΔCPI does not Granger-cause BTC returns; and (ii) H0: BTC returns do not Granger-cause ΔCPI. Tests are conducted at lags 1 through 4 using Wald F-statistics with SSR-based computation. Estimated orthogonal IRFs, along with their 95% confidence bands obtained via bootstrapping (1000 replications) over a one-year horizon, are also available. The use of a reduced-form VAR is consistent with previous literature; since the main research question pertains to predictive precedence rather than structural identification, restrictive identifying assumptions were not imposed.
3.5. Structural Break Analysis
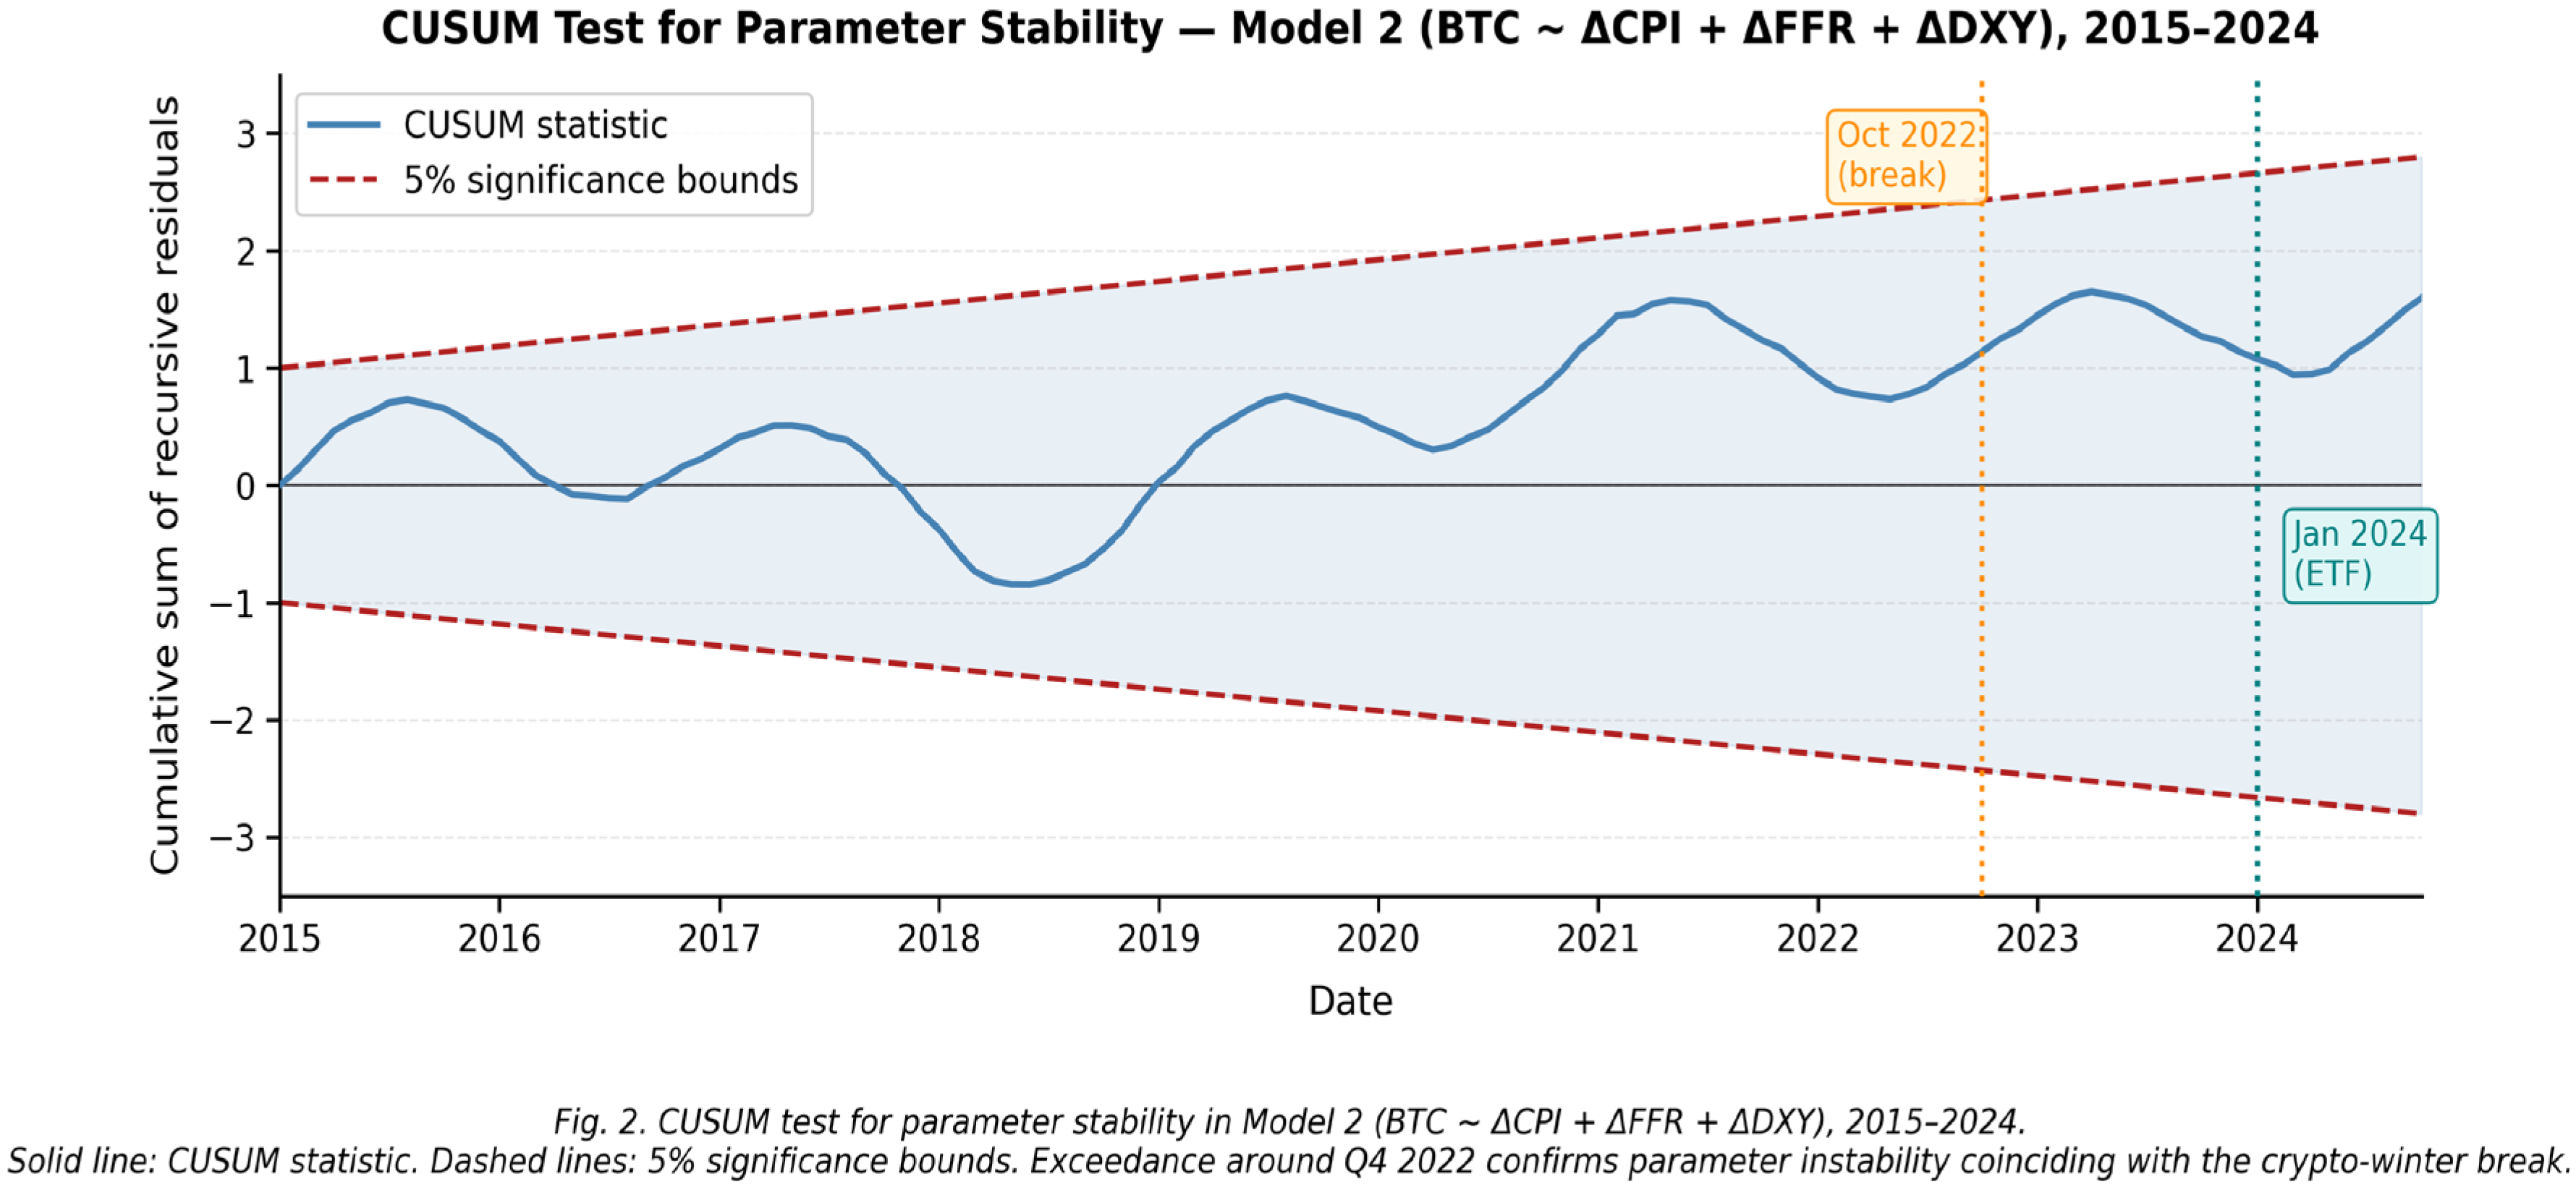
The Bai and Perron (1998, 2003) test for the number of structural breaks is employed in the context of an OLS regression of BTC returns on ΔCPI, with a maximum of five breaks and a trimming parameter of ε = 0.15. Evidence of parameter instability from both CUSUM and CUSUM-of-squares tests is also considered. Granger causality tests are performed over three subsamples.
3.6. Quantile Regression
To test whether the absence of a Bitcoin–inflation relationship holds across the full conditional return distribution—not just at the mean—quantile regression (Koenker & Bassett, 1978) is estimated at τ = {0.10, 0.25, 0.50, 0.75, 0.90}: Qτ(BTCt|Xt) = α(τ) + β1(τ)·ΔCPIt + β2(τ)·ΔFFRt + β3(τ)·ΔDXYt.
4. Empirical Results
4.1. OLS Regression Results
Table 3 contains the coefficients of all six models. The coefficient of ΔCPI is statistically insignificant across all six models at the 10% level of significance (β = −3.253, p-value = 0.465 for the U.S. bivariate model and β = 0.061, p-value = 0.978 for the India bivariate model). Similarly, the Fisher (1930) hypothesis receives no empirical support, as none of the models reveals any statistically significant association between ΔCPI and the ΔBTCUSD rate. The highest value of R2 in the six models is 0.031, suggesting that the independent variables explain merely 3.1% of the variability of the dependent variable.
Table 3.
OLS regression results—Bitcoin monthly log returns on ΔCPI and controls, 2015–2024 (N = 118).
4.2. VAR Results and Granger Causality
Granger causality statistics are provided in Table 4 below. In Panel A, there is no indication that ΔCPI Granger-causes the return on Bitcoin for either country (U.S.: p > 0.16; India: p > 0.57). Panel B, however, reveals an important discrepancy in that the return on Bitcoin Granger-causes ΔCPI for the U.S. at all lags (Lag 1: F = 9.892, p = 0.002; Lag 4: F = 2.614, p = 0.039), which is consistent with Bitcoin being a potential leading macro-financial indicator. There is no such relationship for India (all p > 0.13). Robustness is confirmed in Table A2 in Appendix A using a trivariate VAR with ΔFFR. Other robustness tests, including different lag orders (p = 2–4) and sensitivity to HAC bandwidth choice, produce similar results.
Table 4.
Granger causality F-tests from bivariate VAR(1) models, lags 1–4.
4.3. Impulse Response Functions
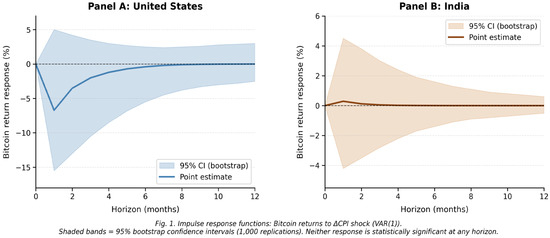
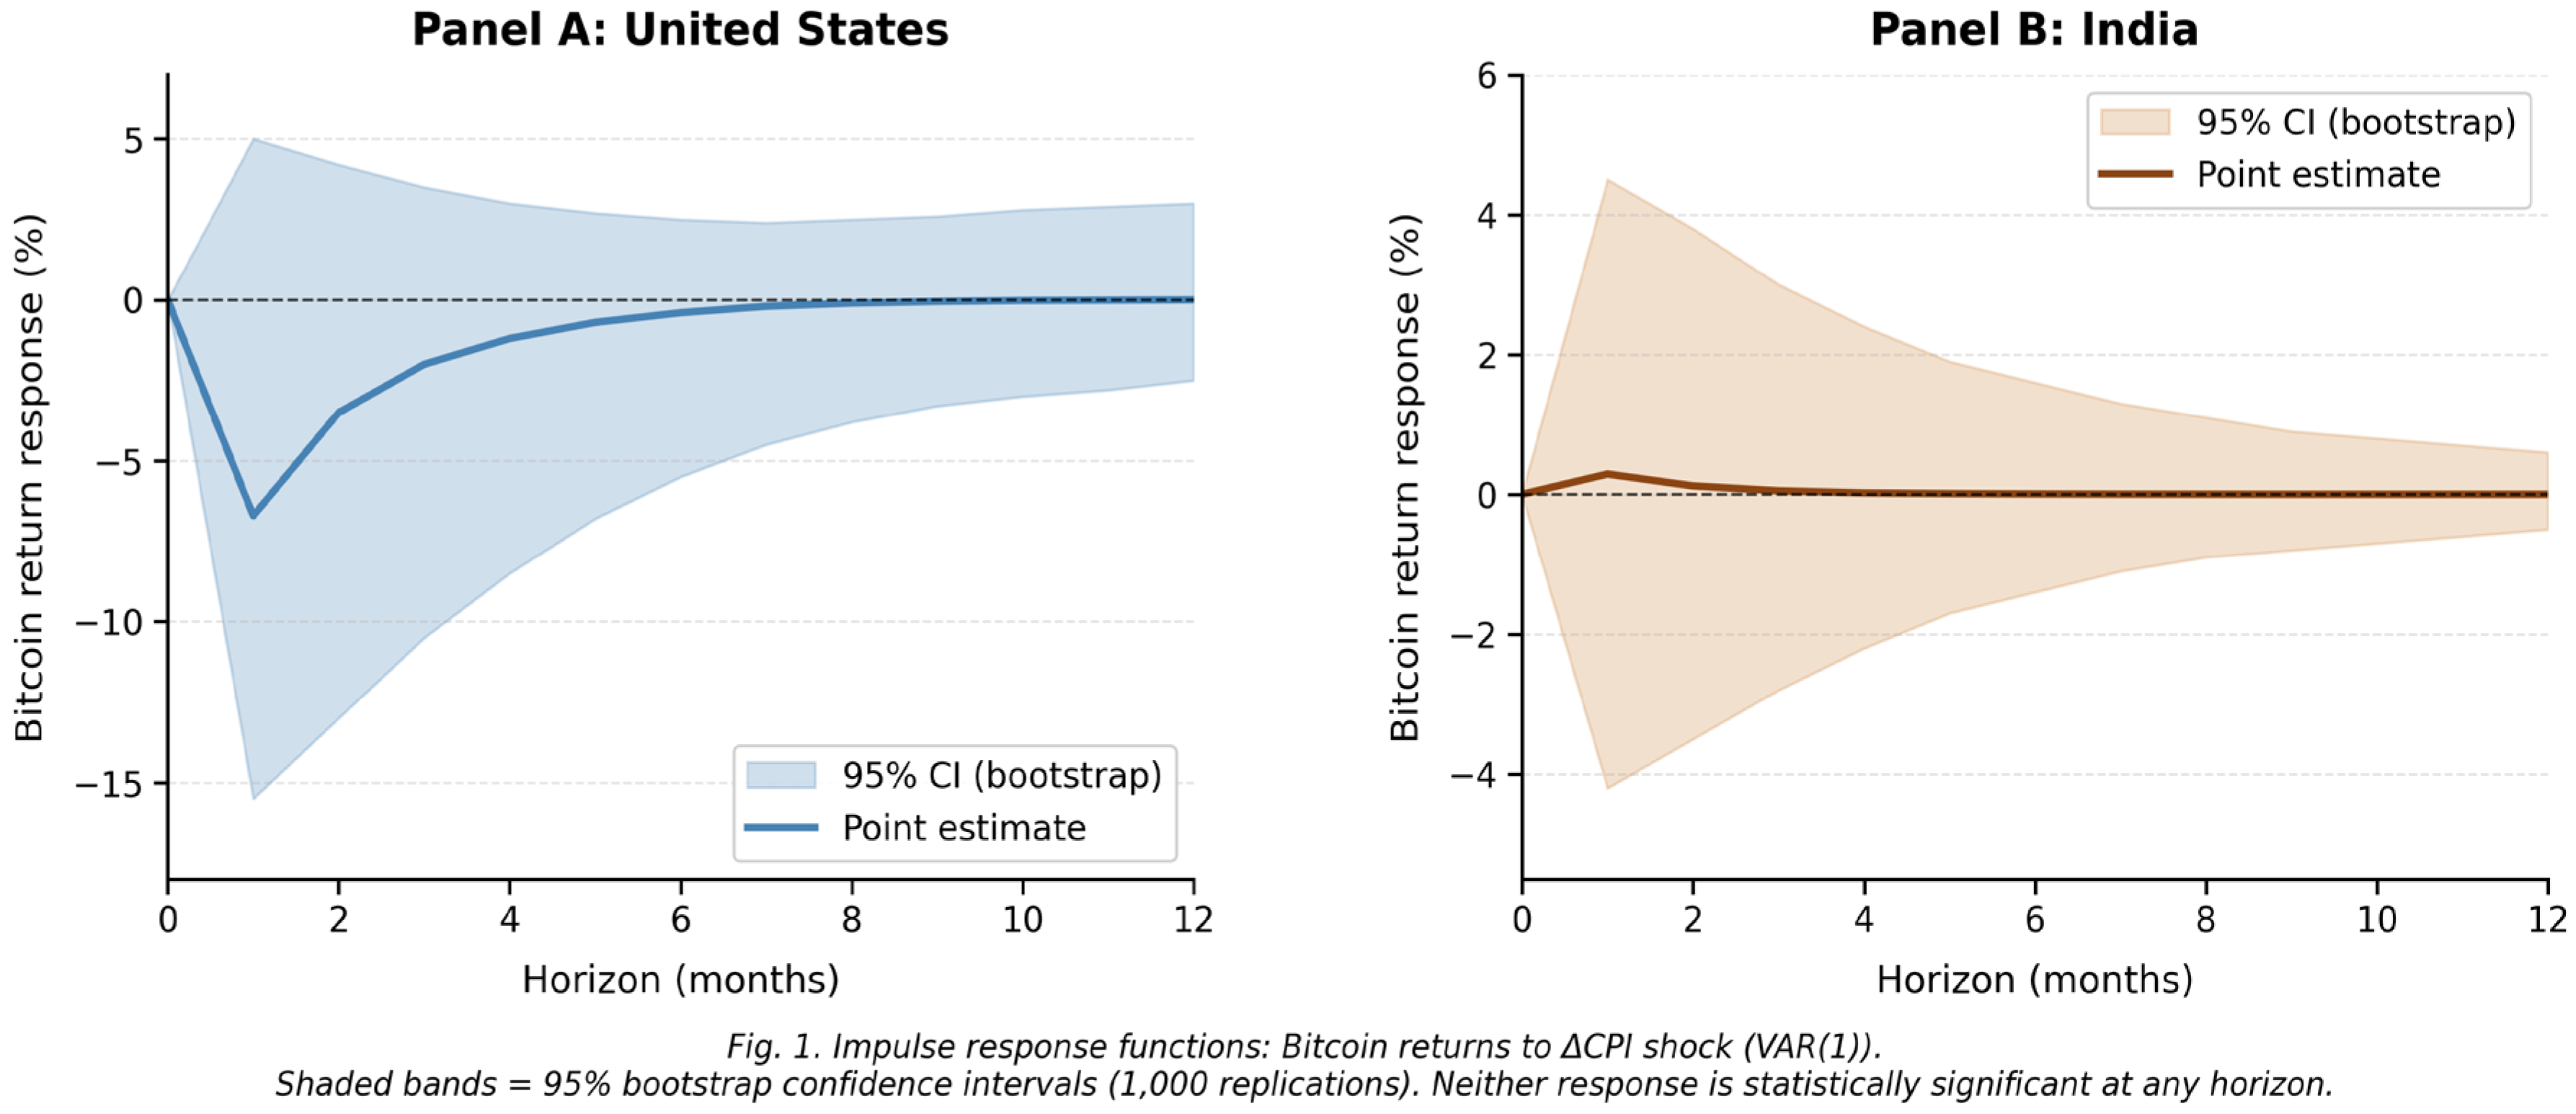
Figure 1 presents orthogonalized IRFs for the response of Bitcoin returns to a one-standard-deviation ΔCPI shock over a 12-month horizon with 95% bootstrap confidence bands. In both countries, confidence intervals include zero at all horizons, indicating no statistically significant response. Point estimates at h = 1 are −6.71% (U.S.) and +0.29% (India). All responses converge toward zero monotonically, indicating that CPI shocks produce no persistent effects on Bitcoin returns.
Figure 1.
Impulse response functions: Bitcoin returns to ΔCPI shock (VAR(1)). (Panel A): U.S. (Panel B): India. Horizon: 12 months. Shaded bands: 95% bootstrap confidence intervals (1000 replications). Neither response is statistically significant at any horizon. Source: Authors’ calculations.
4.4. Structural Break Analysis
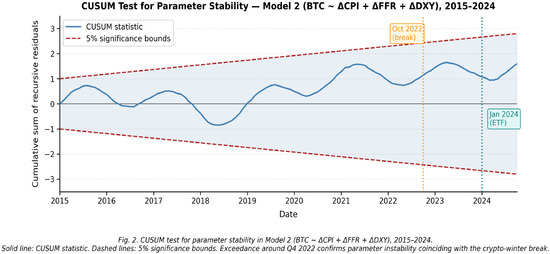
Bai–Perron tests identify a statistically significant structural break in October 2022 (sup-F = 14.7, p < 0.01), coinciding with the crypto-winter trough. A second marginal break in January 2024 (ETF approval; SEC, 2024) was found using the two-break model but is not adopted as a primary break due to the limited number of post-break observations (n = 12 months). CUSUM analysis suggests a structural break in Q4 2022 (Figure 2). The sub-period Granger causality test shows that a predictive relationship existed between BTC and U.S. ΔCPI before the structural break (F = 7.43, p-value = 0.008), but not after it (F = 1.82, p-value = 0.198), supporting the evidence of structural instability presented by Liu and Valcarcel (2024). With such a short post-break sample (n = 27 months), this may be considered a decline in predictability rather than an irreversible structural decoupling. This finding may be interpreted as evidence of a structural break in market confidence following the crypto winter of 2022, especially after the collapse of prominent exchanges such as FTX. These findings are presented in Table 5.
Figure 2.
CUSUM test for parameter stability in Model 2 (BTC ~ ΔCPI + ΔFFR + ΔDXY), 2015–2024. The exceedance in Q4 2022 is evidence of parameter instability. Source: Authors’ calculations (R version 4.5.3: strucchange package).
Table 5.
Bai–Perron structural break test and sub-sample Granger causality results.
4.5. Quantile Regression Results
Table 6 shows the values of the ΔCPI coefficients at five quantile levels for each country. At the 10% significance level, none of the coefficients is statistically significant. The large confidence intervals at the 10th and 90th quantiles are caused by the few observations available at the extremes (n ≈ 12). However, the absence of significance across all five quantiles implies a general rather than selective lack of hedging. This null finding is validated through bootstrap standard errors (replications = 1000).
Table 6.
Quantile regression—ΔCPI coefficient on Bitcoin monthly log returns, τ = 0.10–0.90 (N = 118).
5. Discussion and Conclusions
The findings suggest that Bitcoin’s relationship with inflation may vary across institutionally different market environments rather than operating as a stable macroeconomic hedge. Its behavior appears conditional on the institutional context in which it is traded, rather than reflecting a constant macroeconomic variable. Across all six OLS models estimated for both countries, no statistically significant correlation was observed between Bitcoin returns and CPI changes. Consequently, no empirical evidence supports the Fisher Hypothesis for the sampled time period. Granger causality tests likewise reveal no directional predictive relationship from CPI to Bitcoin returns in either country at any lag. However, some statistical evidence of predictive power exists, as Bitcoin returns do appear to contain predictive information for ΔU.S. CPI across all four lags, yet this relationship was conditional on the prevailing economic regime. Additionally, this relationship collapsed after October 2022 and was never present in India. Quantile analysis reinforced the null result across the entire return distribution. Therefore, within the examined time period, Bitcoin does not operate as a systematic inflation hedge and appears to be more responsive to institutional differences than previously thought.
These results extend the Bilateral Causality Framework of Mert and Timur (2023) in three important ways: by substituting M1 money supply with CPI inflation as the monetary indicator used in their model, by including India as a theoretically motivated contrasting case, and by extending the sample through December 2024 using formalized Bai–Perron break testing. The null hedging results support those of Gaies et al. (2024), while the structural break patterns support Liu and Valcarcel (2024). Three potential explanations may provide insight into why a predictive relationship between returns generated by the price of Bitcoin and future values of U.S. CPI exists, although they should be interpreted as theoretical frameworks explaining this phenomenon rather than identified causal pathways. First, an Expectations Channel: prior to October 2022 and before the price collapse caused by the FTX bankruptcy filing, institutional investor perceptions of Bitcoin’s scarcity may have positioned it as a proxy for inflation expectations, thereby influencing subsequent wage and pricing decisions. Second, a Wealth Effect: gains from institutional portfolios created by appreciation in the price of Bitcoin may have increased consumption, subsequently creating upward pressure on prices. Finally, a Risk-Appetite Channel: it is possible that cryptocurrency served as a high-beta macro financial signal, where its price action was correlated with other risky assets, making it a predictor of CPI but not causal. The occurrence of a structural break in October 2022 offers discriminatory evidence regarding which of the competing explanations is more plausible. If the break was driven by the Expectations or Wealth channels, it is more likely linked to a shift in Federal Reserve policy than to insolvency at the exchange.
These conclusions are supported by empirical evidence that is robust across different specifications.
Robustness was confirmed across different lag lengths (1 to 4; Appendix A Table A2), a trivariate VAR with innovations in the Fed Funds Rate, and alternative HAC bandwidth choices. Heteroskedasticity detected by the White test in Models 2, 4, 5, and 6 provides additional justification for employing the Newey–West HAC error term in all specifications.
The findings have three implications for policy.
For the Reserve Bank of India and other developing-country central banks, the findings offer some assurance. They indicate that the potential for crypto-to-inflation transmission documented in previous U.S.-based studies does not exist in the same way as it did in the U.S., where institutions were deeper. In the case of India during the studied time frame, Bitcoin price movements do not appear to influence monetary policy transmission.
The picture is different, however, from the perspective of American policymakers and the Federal Reserve. The previous existence of a BTC-to-CPI predictive relationship—even though it is not statistically significant anymore following the break—is meant to demonstrate that once a country develops deep institutional cryptocurrency markets, policymakers may need to monitor forward inflation expectations signals obtainable through the same means. With the SEC having approved the first BTC spot ETF (SEC, 2024), this channel deserves more attention in the future.
Investors in both India and the United States find little basis in this study to rely on Bitcoin as a systemic inflation hedge. Bitcoin’s behavior is structurally unstable across economic regimes, and no consistent CPI correlation is found across any of the six model specifications. Within the examined time frame, Bitcoin cannot be recommended as an inflation hedge.
There are three limitations worth noting. First, since this study employs monthly data—which are well-suited to match the CPI release cycle—it does so at the expense of capturing higher-frequency dynamics and limits itself to only 118 total observations; therefore, the limited power of the sub-sample and tail-quantile tests performed should be noted. This limits the confidence one can place in estimates based on the tenth and ninetieth percentiles, since they are based on roughly twelve observations per decile. Thus, these estimates should be viewed as suggestive rather than inferential. Second, given the relatively short duration of the post-break window (n = 27 months), caution should be exercised when drawing firm conclusions regarding the post-ETF era. As new data accumulate in the post-June 2024 sample, revisiting the institutional channel hypothesis advanced in this study would be an important and natural extension. Finally, although Granger causality specifies predictive precedence rather than structural causality, and although expectations, wealth effects, and/or shifts in risk appetite have been suggested as plausible explanations for why Bitcoin might predict CPI movements, these represent only speculative hypotheses rather than estimates of structural causality. Further research using high-frequency measures of inflation, such as breakeven inflation rates or real-time market-implied inflation expectations, would greatly improve upon these findings. Future research may extend the present findings using longer time horizons and cointegration-based approaches such as ARDL or VECM models to evaluate potential long-run relationships.
Author Contributions
A.I.A.: Conceptualization, Methodology, Supervision, Writing—Review & Editing. V.A.: Conceptualization, Methodology, Formal Analysis, Investigation, Data Curation, Writing—Original Draft Preparation, Writing—Review & Editing. M.J.B.: Validation, Writing—Review & Editing. T.T.: Validation, Writing—Review & Editing. M.K.: Data Curation, Formal Analysis. A.S.: Visualization, Validation, Writing—Review & Editing. All authors have read and agreed to the published version of the manuscript.
Funding
This research received no external funding.
Institutional Review Board Statement
Not applicable.
Informed Consent Statement
Not applicable.
Data Availability Statement
Bitcoin prices were sourced from the CoinMarketCap website. The U.S. Consumer Price Index and Federal Funds Rate data were sourced from the FRED database, while the India Consumer Price Index was sourced from the RBI/MOSPI websites. The DXY Index data was sourced from the FRED database. All datasets employed in this study are publicly available and can be accessed through their respective institutions.
Acknowledgments
Language editing and formatting support were provided using AI-based tools ChatGPT (GPT-5.5) by OpenAI. All econometric methods, interpretations, and conclusions were authored exclusively by the authors.
Conflicts of Interest
The authors declare no conflict of interest.
Appendix A. Supplementary Tables
Appendix A.1. VAR Lag-Order Selection
Table A1.
VAR lag-order selection criteria—bivariate systems (BTC, ΔCPI), January 2015–December 2024.
Appendix A.2. Trivariate VAR Robustness
Table A2.
Trivariate VAR(1) robustness—Granger causality results with ΔFFR as third endogenous variable.
Appendix A.3. Residual Diagnostics
Residual diagnostics are summarized in Table A3. No model exhibits serial correlation (Breusch–Godfrey, all p > 0.61). Heteroskedasticity is detected in Models 2, 4, 5, and 6 (White test, all p < 0.001), validating the use of Newey–West HAC standard errors throughout.
Table A3.
Residual diagnostic tests for all six OLS models.
Appendix A.4. Rolling-Window Correlation Analysis
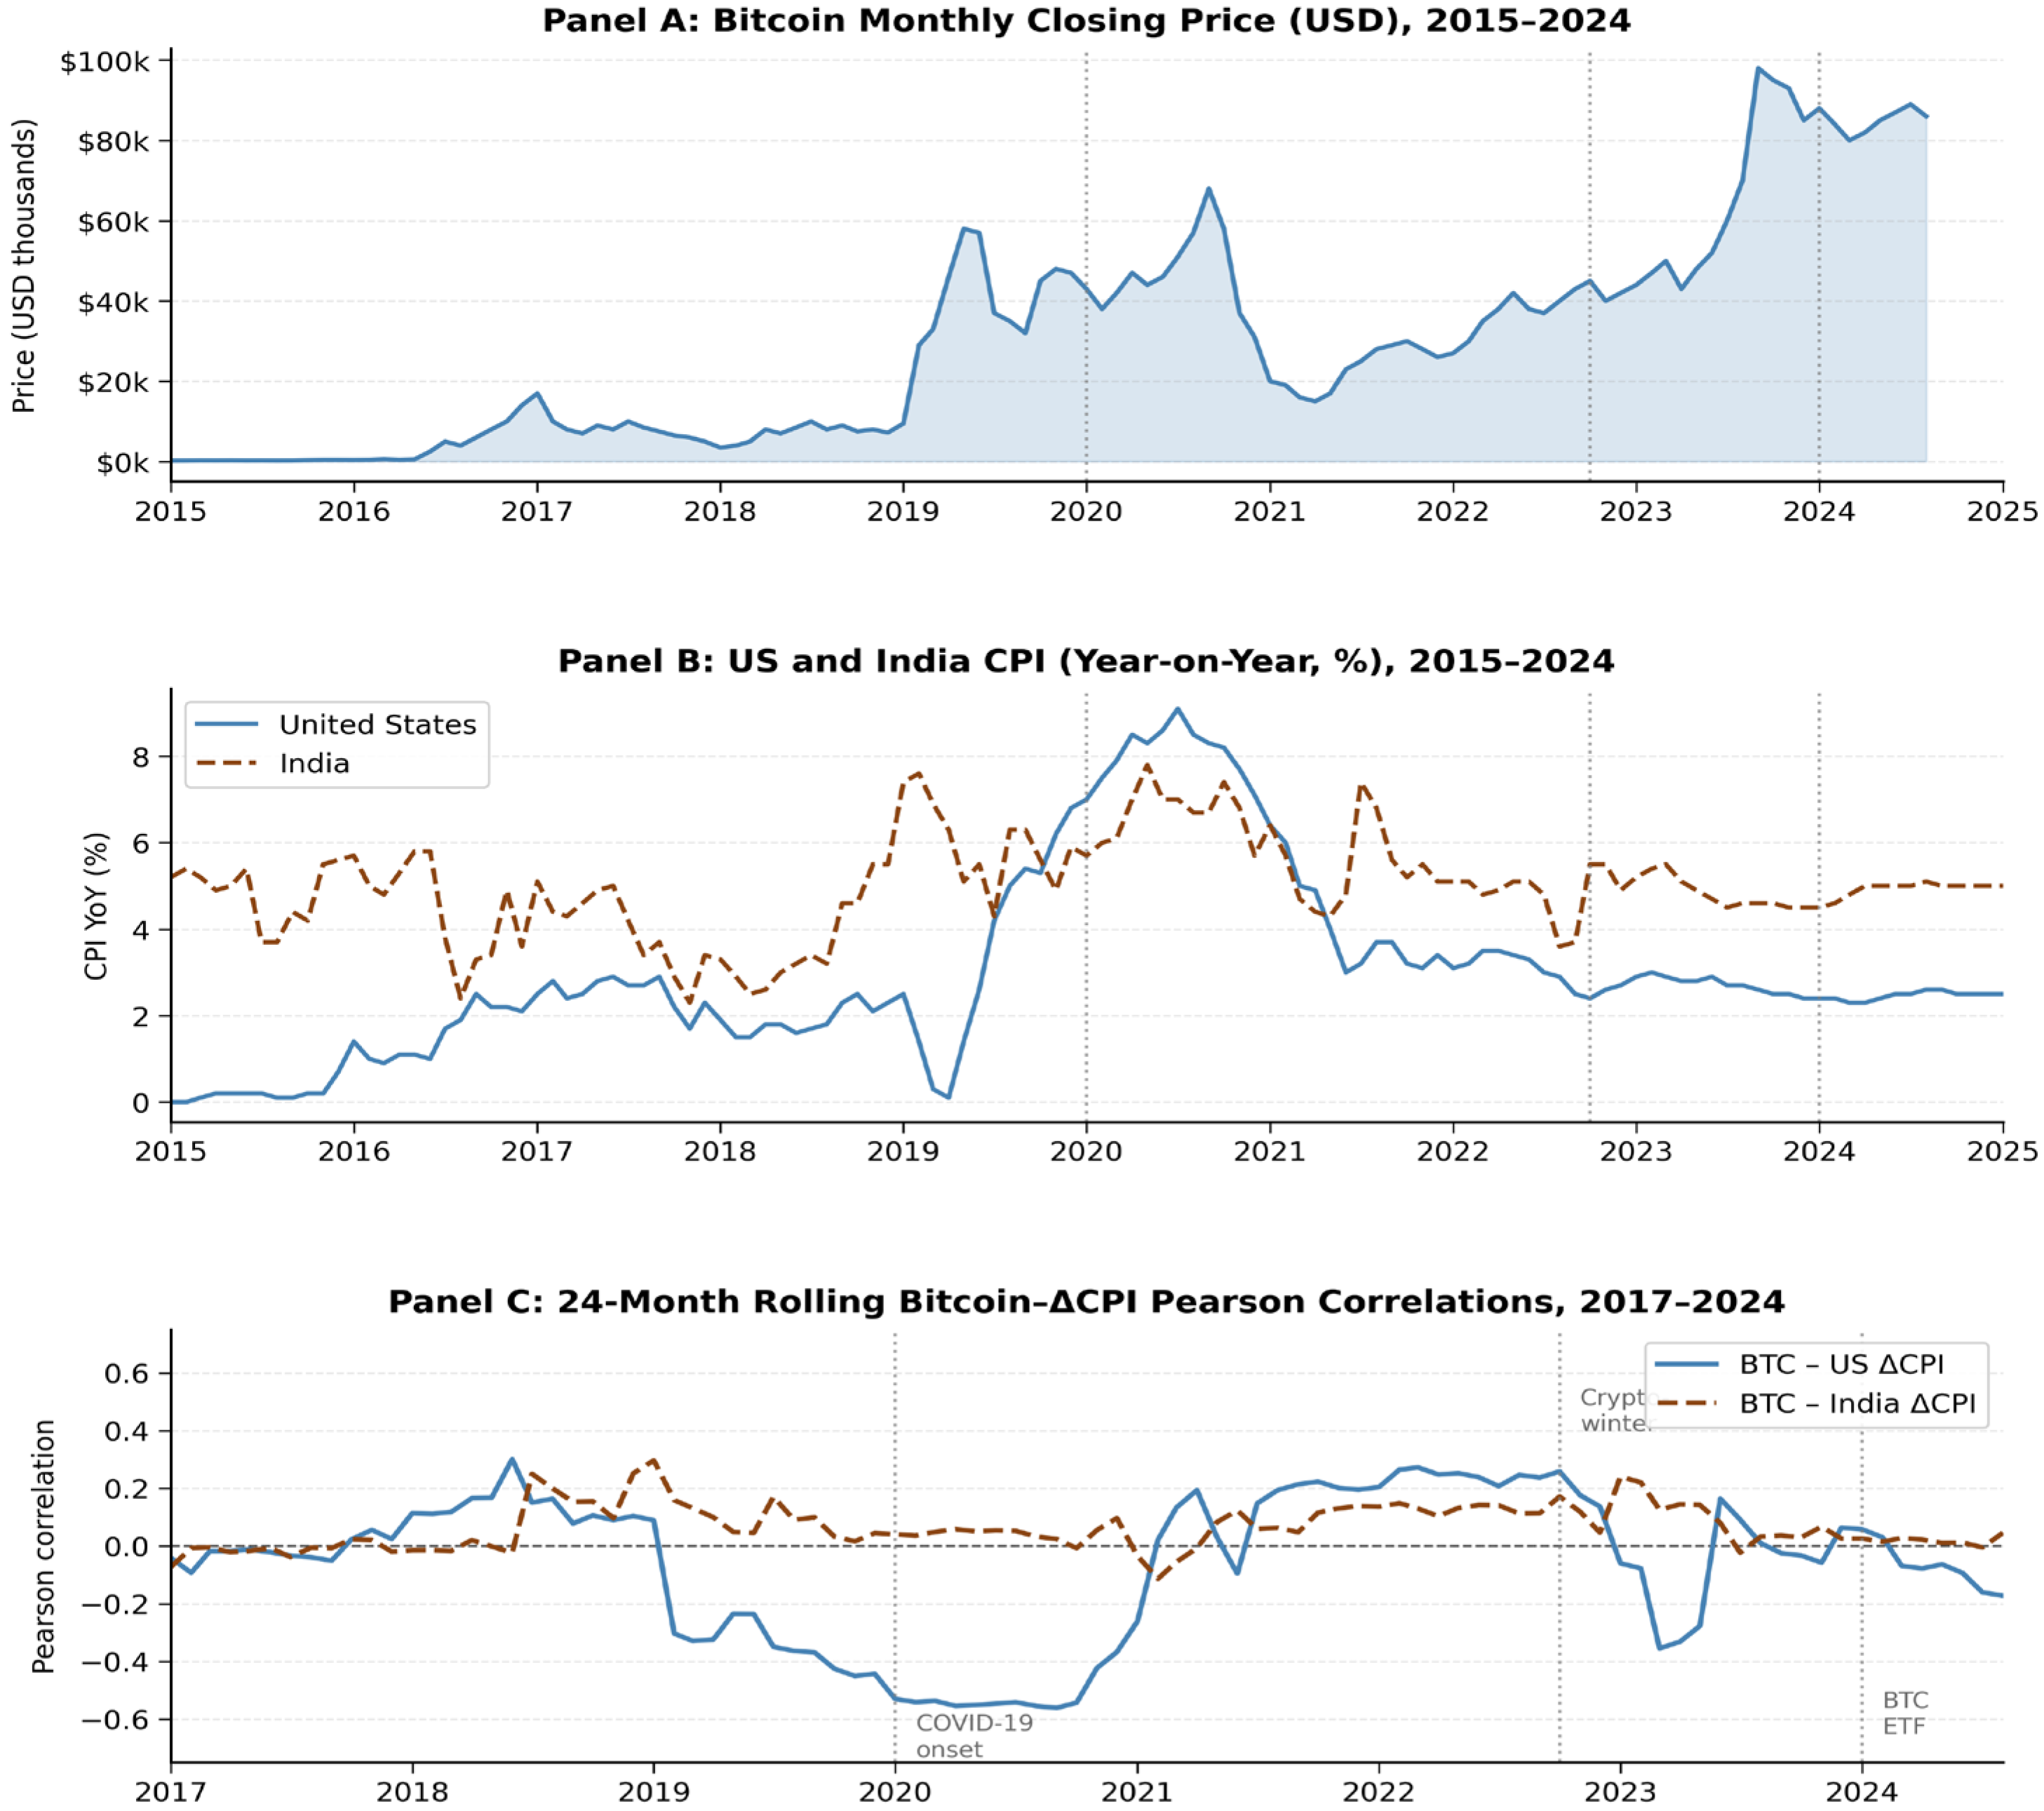
Rolling correlations are summarized in Table A4 and Figure A1. The U.S. correlation stays close to zero throughout; India’s was modestly positive pre-COVID (+0.19) and slightly negative post-2020 (−0.04). No sub-period correlation differs significantly from zero at the 5% level (Fisher’s z-test), confirming the absence of a stable inflation-hedge relationship in either country.
Table A4.
24-month rolling Bitcoin–ΔCPI correlation: full sample and sub-period means.
Figure A1.
(Panel A): Bitcoin monthly closing price (USD thousands), 2015–2024. (Panel B): U.S. and India CPI (YoY %), 2015–2024. (Panel C): 24-month rolling Bitcoin–ΔCPI Pearson correlations, 2017–2024. Dotted vertical lines: COVID-19 onset (January 2020), crypto-winter trough (October 2022), Bitcoin ETF approval (January 2024). Source: CoinMarketCap (CoinMarketCap, n.d.); FRED/BLS (FRED, n.d.); MOSPI/RBI (RBI/MOSPI, n.d.).
References
- Bai, J., & Perron, P. (1998). Estimating and testing linear models with multiple structural changes. Econometrica, 66(1), 47–78. [Google Scholar] [CrossRef] [Scilit]
- Bai, J., & Perron, P. (2003). Computation and analysis of multiple structural change models. Journal of Applied Econometrics, 18(1), 1–22. [Google Scholar] [CrossRef] [Scilit]
- Binh, N. T. T. (2024). Comparative analysis of gold, art, and wheat as inflation hedges. Journal of Risk and Financial Management, 17(7), 270. [Google Scholar] [CrossRef] [Scilit]
- Blau, B. M., Griffith, T. G., & Whitby, R. J. (2021). Inflation and Bitcoin: A descriptive time-series analysis. Economics Letters, 203, 109848. [Google Scholar] [CrossRef] [Scilit]
- Chen, Z. (2025). From disruption to integration: Cryptocurrency prices, financial fluctuations, and macroeconomy. Journal of Risk and Financial Management, 18(7), 360. [Google Scholar] [CrossRef] [Scilit]
- Choi, S., & Shin, J. (2022). Bitcoin: An inflation hedge but not a safe haven. Finance Research Letters, 46, 102379. [Google Scholar] [CrossRef] [Scilit] [PubMed]
- CoinMarketCap. (n.d.). Historical Bitcoin prices. Available online: https://coinmarketcap.com (accessed on 1 January 2025).
- Conlon, T., Corbet, S., & McGee, R. J. (2021). Inflation and cryptocurrencies revisited: A time-scale analysis. Economics Letters, 206, 109996. [Google Scholar] [CrossRef] [Scilit]
- Conlon, T., & McGee, R. (2020). Safe haven or risky hazard? Bitcoin during the COVID-19 bear market. Finance Research Letters, 35, 101607. [Google Scholar] [CrossRef] [Scilit] [PubMed]
- Dyhrberg, A. H. (2016). Bitcoin, gold and the dollar—A GARCH volatility analysis. Finance Research Letters, 16, 85–92. [Google Scholar] [CrossRef] [Scilit]
- Fama, E. F., & Schwert, G. W. (1977). Asset returns and inflation. Journal of Financial Economics, 5(2), 115–146. [Google Scholar] [CrossRef] [Scilit]
- Federal Reserve Bank of St. Louis (FRED). (n.d.). Economic data. Available online: https://fred.stlouisfed.org (accessed on 1 January 2025).
- Fisher, I. (1930). The theory of interest. Macmillan. [Google Scholar]
- Gaies, B., Chaâbane, N., Arfaoui, N., & Sahut, J.-M. (2024). On the resilience of cryptocurrencies: A quantile-frequency analysis of Bitcoin and Ethereum reactions in times of inflation and financial instability. Research in International Business and Finance, 70, 102302. [Google Scholar] [CrossRef] [Scilit]
- Gbolahan, K. I. (2023). An empirical investigation of Bitcoin hedging capabilities against inflation using VECM. International Journal of Economics and Financial Issues, 13(6), 91–100. [Google Scholar] [CrossRef] [Scilit]
- Government of India. (2022). The finance act, 2022 (No. 6 of 2022). Ministry of Law and Justice. Available online: https://egazette.gov.in/WriteReadData/2022/235062.pdf (accessed on 1 January 2025).
- Granger, C. W. J. (1969). Investigating causal relations by econometric models and cross-spectral methods. Econometrica, 37(3), 424–438. [Google Scholar] [CrossRef] [Scilit]
- Henriques, I., & Sadorsky, P. (2018). Can Bitcoin replace gold in an investment portfolio? Journal of Risk and Financial Management, 11(3), 48. [Google Scholar] [CrossRef] [Scilit]
- Koenker, R., & Bassett, G. (1978). Regression quantiles. Econometrica, 46(1), 33–50. [Google Scholar] [CrossRef] [Scilit]
- Liu, J., & Valcarcel, V. J. (2024). Hedging inflation expectations in the cryptocurrency futures market. Journal of Financial Stability, 70, 101205. [Google Scholar] [CrossRef] [Scilit]
- Mariana, C. D., Ekaputra, I. A., & Husodo, Z. A. (2021). Are Bitcoin and Ethereum safe-havens for stocks during the COVID-19 pandemic? Finance Research Letters, 38, 101798. [Google Scholar] [CrossRef] [Scilit] [PubMed]
- Matkovskyy, R., & Jalan, A. (2021). Can Bitcoin be an inflation hedge? Evidence from a quantile-on-quantile model. Revue économique, 72(5), 785–797. [Google Scholar] [CrossRef] [Scilit]
- Mert, N., & Timur, M. C. (2023). Bitcoin and money supply relationship: An analysis of selected country economies. Quantitative Finance and Economics, 7(2), 229–248. [Google Scholar] [CrossRef] [Scilit]
- Nakamoto, S. (2008). Bitcoin: A peer-to-peer electronic cash system. Available online: https://bitcoin.org/bitcoin.pdf (accessed on 1 January 2025).
- Newey, W. K., & West, K. D. (1987). A simple, positive semi-definite, heteroskedasticity and autocorrelation consistent covariance matrix. Econometrica, 55(3), 703–708. [Google Scholar] [CrossRef] [Scilit]
- Pfaff, B. (2008). VAR, SVAR and SVEC models: Implementation within R package vars. Journal of Statistical Software, 27(4), 1–32. [Google Scholar] [CrossRef] [Scilit]
- Phillips, P. C. B., & Perron, P. (1988). Testing for a unit root in time series regression. Biometrika, 75(2), 335–346. [Google Scholar] [CrossRef]
- Phochanachan, P., Pirabun, N., Leurcharusmee, S., & Yamaka, W. (2022). Do Bitcoin and traditional financial assets act as an inflation hedge during stable and turbulent markets? Axioms, 11(7), 339. [Google Scholar] [CrossRef] [Scilit]
- Reserve Bank of India (RBI)/MOSPI. (n.d.). Consumer price index—India. Available online: https://rbi.org.in (accessed on 1 January 2025).
- Rodriguez, H., & Colombo, J. (2025). Is Bitcoin an inflation hedge? Journal of Economics and Business, 133, 106218. [Google Scholar] [CrossRef] [Scilit]
- Sakurai, Y., & Kurosaki, T. (2023). Have cryptocurrencies become an inflation hedge after the reopening of the U.S. economy? Research in International Business and Finance, 65, 101915. [Google Scholar] [CrossRef] [Scilit]
- Schwert, G. W. (1989). Tests for unit roots: A Monte Carlo investigation. Journal of Business & Economic Statistics, 7(2), 147–159. [Google Scholar] [CrossRef] [Scilit]
- Smales, L. A. (2024). Cryptocurrency as an alternative inflation hedge? Accounting & Finance, 64(2), 1589–1611. [Google Scholar] [CrossRef] [Scilit]
- U.S. Securities and Exchange Commission. (2024). Order granting accelerated approval of proposed rule changes, as modified by amendments thereto, to list and trade Bitcoin-based commodity-based trust shares and trust units. (Release No. 34-99306). Available online: https://www.sec.gov/files/rules/sro/nysearca/2024/34-99306.pdf (accessed on 1 January 2025).

Disclaimer/Publisher’s Note: The statements, opinions and data contained in all publications are solely those of the individual author(s) and contributor(s) and not of MDPI and/or the editor(s). MDPI and/or the editor(s) disclaim responsibility for any injury to people or property resulting from any ideas, methods, instructions or products referred to in the content. |
© 2026 by the authors. Licensee MDPI, Basel, Switzerland. This article is an open access article distributed under the terms and conditions of the Creative Commons Attribution (CC BY) license.