


Abstract
This paper examines global equity market integration, commodity-price exposure, and volatility spillovers in Ghana’s frontier equity market. Using daily data from January 2011 to December 2025, we estimate a multi-factor asset pricing model nested within a GARCH framework for the Ghana Stock Exchange Composite Index (GSECI) and the Financial Sector Index (GSEFSI). The model jointly estimates first-moment return exposures and second-moment volatility spillovers from a global equity market and three key global commodity markets: gold, crude oil, and cocoa, while controlling for asymmetric volatility, return serial dependence, and domestic macro-financial shifts associated with banking sector recapitalization and the Domestic Debt Exchange Programme (DDEP). The Ghanaian equity market is exposed to the global equity market, indicating measurable but economically modest global integration, with stronger exposure in the financial sector. Commodity-price exposures are selective, with gold and crude oil exposures concentrated in the financial sector, whereas the cocoa factor is negatively associated with returns on both indices. The variance results show persistent volatility, inverse asymmetric volatility responses, and differentiated volatility spillovers from global equity and commodity markets. The DDEP period is associated with significant equity market repricing, particularly in the financial sector. These findings indicate that Ghana’s equity market dynamics are shaped jointly by global equity and commodity market information, frontier market frictions, and sovereign–bank conditions.
Keywords:
asset pricing; frontier markets; global integration; commodity prices; market microstructure; sovereign–bank nexus; Ghana JEL Classification:
G12; G14; G15; F30; O43
1. Introduction
The integration of frontier equity markets into global financial markets remains an important question in international asset pricing literature. In fully integrated markets, expected returns should primarily reflect exposure to common global sources of systematic risk; in segmented or partially segmented markets, local risks, institutional constraints, and market-specific frictions continue to influence asset prices (Bekaert & Harvey, 1995; Bekaert et al., 2007; Harvey, 1995). Frontier markets in Sub-Saharan Africa are especially relevant in this debate because they may offer international diversification benefits owing to their historically low correlations with developed markets, yet their pricing dynamics are often complicated by thin trading, non-synchronous price adjustment, limited liquidity, and delayed information assimilation (Fisher, 1966; Lesmond, 2005; Scholes & Williams, 1977; Schotman & Zalewska, 2006). These market microstructure frictions make it difficult to measure global integration using standard models and may obscure the transmission of external information into domestic equity prices. At the same time, frontier markets do not operate in isolation; they are exposed to global financial conditions, commodity-price movements, and shifts in international investor sentiment that may affect both expected returns and conditional volatility (Claessens & Forbes, 2013; Gajurel & Chawla, 2022a; Sachs & Warner, 2025).
Among frontier African markets, Ghana provides a particularly useful empirical setting for examining global integration, commodity-price exposure, and the sovereign–bank nexus. The Ghana Stock Exchange (GSE) operates within a relatively small and less liquid equity market embedded in a resource-dependent open economy. At the same time, Ghana is closely linked to global commodity markets through gold, crude oil, and cocoa, which are central to the country’s international trade and macro-financial conditions. Movements in these commodity markets may therefore be reflected in domestic equity prices through export earnings, fiscal revenues, exchange-rate expectations, inflationary pressures, and investor risk assessment (Harding & Venables, 2016; Sachs & Warner, 2025; UNCTAD, 2024). This combination of frontier market characteristics and global commodity market exposure makes Ghana an informative case for examining whether equity returns are primarily associated with global equity market conditions, and global commodity market movements. During the sample period, the GSE also operated through major domestic macro-financial shifts, including banking sector recapitalization, and sovereign debt restructuring under the Domestic Debt Exchange Programme (DDEP) (International Monetary Fund, 2025). These episodes are relevant for equity pricing because sovereign stress can be transmitted to banks through sovereign-debt holdings, capital impairment, funding conditions, and weakened financial intermediation (Acharya et al., 2014; Farhi & Tirole, 2018; Gennaioli et al., 2014). The case of Ghana therefore provides a useful empirical laboratory for examining how global equity and commodity market conditions, and domestic sovereign–bank conditions are reflected in return and volatility dynamics in a frontier equity market.
Despite the growing importance of African capital markets, the existing empirical literature remains relatively fragmented. Studies of regional volatility transmission (Shettima et al., 2019) and commodity-equity market nexus (Ben Flah et al., 2025; Lin et al., 2014; Maharana et al., 2025; Ofori-Boateng et al., 2022) provide important evidence on African, commodity-dependent, and emerging equity markets. However, most studies examine either broad African market connectedness, aggregate stock market volatility, or individual commodity channels. Less attention has been given to a unified asset-pricing framework that jointly examines global equity market integration, gold, crude oil and cocoa price exposure, volatility transmission, domestic macro-financial shifts, and the distinction between Ghana’s aggregate equity market and its financial sector index. This distinction is important because broad composite indices may conceal sectoral differences. In Ghana, the financial sector is more liquid than many non-financial segments of the market and is more directly connected to global financial conditions through banking sector linkages, cross-border financial relationships, and internationally linked financial intermediation. The financial sector is also more directly exposed to sovereign balance-sheet conditions, bank recapitalization requirements, and domestic financial sector stress. Since banks often hold significant sovereign claims, sovereign distress can be transmitted to financial institutions through capital impairment, funding conditions, and weakened intermediation capacity (Acharya et al., 2014; Farhi & Tirole, 2018; Gennaioli et al., 2014). A comparison between the Ghana Stock Exchange Composite Index (GSECI) and the Ghana Stock Exchange Financial Sector Index (GSEFSI) therefore allows us to distinguish aggregate market dynamics from financial sector specific transmission channels.
In this study, we address these theoretical and empirical gaps using a multi-factor asset-pricing framework nested within a GARCH framework (Baur, 2012; Bekaert et al., 2014; Dungey & Gajurel, 2015). We ask three related questions. First, to what extent are Ghanaian equity returns exposed to global equity market movements? Second, are gold, crude oil, and cocoa price changes reflected in Ghanaian equity returns and volatility? Third, do these exposures differ between the broader equity market and the financial sector index? Using daily data from January 2011 to December 2025, we estimate the model separately for the GSECI and the GSEFSI, allowing us to contrast aggregate market dynamics with financial sector specific return and volatility responses. Building on established approaches for modelling asymmetric volatility in emerging and frontier markets (Gajurel, 2019; Gajurel & Chawla, 2022a), the empirical framework evaluates first-moment return exposures and second-moment volatility spillovers from global equity markets and global commodity markets, while accounting for serial dependence, volatility clustering, asymmetric news effects, and domestic macro-financial shifts. This framework allows us to examine Ghana’s global equity market integration, assess whether major commodity price movements are reflected in return and volatility dynamics, and determine whether these relationships differ between the broader market and the financial sector.
We document four main findings. First, Ghanaian equity returns are positively exposed to the global equity factor. The magnitude of this exposure is economically modest, but it is stronger for the financial sector index than for the broader market. This suggests that Ghana’s financial sector equities are more sensitive to global financial conditions than the aggregate equity market.
Second, commodity price exposures differ across commodities and market segments. Gold and crude oil exposures are concentrated in the financial sector, whereas cocoa exposure is evident in both the broader equity market and the financial sector index. Financial sector equities are positively exposed to gold price movements but negatively exposed to crude oil price movements. In contrast, cocoa price exposure is negative for both indices, suggesting that cocoa market information is reflected more broadly across Ghanaian equities.
Third, volatility spillover patterns also differ between the aggregate market and the financial sector. For the aggregate market, volatility spillovers originate mainly from the global equity market, with limited evidence of commodity market volatility spillovers. For the financial sector, volatility spillovers are broader: financial sector volatility is associated with global equity market volatility as well as crude oil and cocoa volatility, while gold volatility does not transmit significantly. The negative crude oil and cocoa volatility spillover coefficients indicate that commodity volatility transmission is not uniformly volatility-amplifying and is specific to the financial sector.
Fourth, both indices exhibit return and volatility dynamics consistent with a relatively less liquid frontier equity market. Returns display short-run dependence, consistent with delayed price discovery, thin trading, and non-synchronous information assimilation, features commonly documented in frontier markets (Lesmond, 2005; Schotman & Zalewska, 2006). The volatility process also shows an inverse asymmetric response, whereby positive shocks are associated with a larger volatility response than negative shocks of equal magnitude. Domestic macro-financial indicators further suggest that banking sector recapitalization and sovereign debt restructuring under the DDEP are relevant for understanding Ghanaian equity market dynamics during the sample period.
2. Related Literature
2.1. An Overview of Ghanaian Equity Market
Ghana has a relatively young yet institutionally established securities market. The GSE was incorporated in July 1989 and commenced trading on 12 November 1990 (Ghana Stock Exchange, 2025). Since then, the GSE has served as the principal organized market for the issuance and trading of equity and fixed-income securities in Ghana. Beyond its Main Market for larger corporates, GSE now operates the Ghana Alternative Market (GAX) for small and medium-sized enterprises, the Ghana Fixed Income Market (GFIM), the Commercial Paper Market, the Green and Sustainable Bond Market, and an over-the-counter market for public unlisted securities (Ghana Stock Exchange, 2025). This institutional architecture reflects Ghana’s broader effort to deepen domestic capital markets and reduce reliance on bank-based financing.
Table 1 provides some fundamental indicators of the Ghana Stock Exchange over the 2011–2025 period. The table shows that the Ghanaian equity market remains relatively small, with about 30 listed firms. Total market capitalization of all listed firms declined from about USD 30.4 billion in 2012 to USD 6.2 billion in 2023, before recovering to USD 16.5 billion in 2025. Trading activity remains modest, consistent with the characteristics of a less liquid frontier equity market. Annual trading volume ranges from about 201 million shares to 3.82 billion shares, with a median of about 420 million shares. Trading value ranges from about USD 54 million to USD 358 million, with a median of about USD 113 million. The World Bank measure of listed domestic firms’ market capitalization relative to GDP is available only for selected years; however, the most recent available observations are below 10%, standing at 8.7% in 2022, 7.7% in 2023, and 9.2% in 2024. These features, including a limited number of listed firms, concentrated market capitalization, thin secondary market liquidity, and non-synchronous price adjustment, are consistent with the GSE’s classification as a frontier equity market (Bekaert et al., 2007). The market microstructure frictions carry direct implications for empirical modelling. In thin and illiquid frontier markets, observed index returns may not incorporate external information contemporaneously because transaction costs, low trading frequency, and delayed order execution generate serial dependence and sluggish price discovery (Bekaert et al., 2007; Scholes & Williams, 1977). A model of Ghanaian equity returns must therefore accommodate short-run return dependence, volatility persistence, and asymmetric volatility adjustment.
Table 1.
Fundamental indicators of the Ghana Stock Exchange.
A further defining feature of Ghana’s macro-financial environment is its dependence on primary commodity exports. Gold, crude oil, and cocoa together accounted for about 88 percent of Ghana’s total export earnings in 2025, up from 84 percent in 2024; gold alone contributed 67 percent, followed by cocoa beans and products at 12 percent and crude oil at 8 percent (Bank of Ghana, 2026). This structure creates channels through which global commodity-price movements may be reflected in domestic equity prices, including export earnings, foreign-exchange inflows, fiscal revenues, sovereign-risk perceptions, input costs, and inflationary dynamics. These channels are especially relevant for the financial sector because of the sovereign–bank nexus. Ghanaian banks hold significant government securities, so sovereign stress during episodes such as banking-sector recapitalization and the Domestic Debt Exchange Programme may be reflected in bank balance sheets, funding conditions, and financial-sector equity valuations. The case of Ghana therefore provides a useful empirical laboratory for examining how global equity and commodity market movements, and domestic sovereign–bank conditions are reflected in the return and volatility dynamics of a frontier equity market.
2.2. Review of Literature
This paper is related to three strands of literature in international finance: international equity market integration, commodity market exposure, and volatility spillovers in emerging and frontier markets. In the case of Ghana, these strands naturally intersect because the equity market is small and relatively less liquid, while the economy is closely linked to global commodity markets: gold, crude oil, and cocoa. We briefly review these strands before discussing Ghana specific evidence and the literature gap.
The global equity market integration literature examines the comovement of domestic equity markets with global benchmarks and the pricing of global versus domestic risk factors. From an asset pricing perspective, full market integration implies that domestic equity returns should reflect exposure to global risk factors, while market segmentation allows local risk factors to retain pricing relevance. Bekaert et al. (2009) show that risk-based factor models are useful for explaining international stock-return comovements. Bekaert et al. (2011) find that, although segmentation has declined in many countries, it remains significant in emerging markets. Bekaert et al. (2013) further establish that institutional and regional integration can reduce valuation differentials across markets. Gajurel and Chawla (2022a) and Gajurel and Thapa (2026) show that emerging and frontier markets also exhibit global comovement, mainly during heightened market conditions. Dungey and Gajurel (2014) further demonstrate that global equity market information spillovers may differ at the financial sector level relative to aggregate market level. This line of work motivates our examination of whether Ghanaian equity returns are exposed to global equity market movements and whether this exposure differs between the aggregate market and the financial sector.
A second related literature examines the nexus between global commodity markets and equity markets. Commodity markets have become increasingly financialized through futures trading, commodity-index products, exchange-traded products, and commodity-linked securities (Cheng & Xiong, 2014; Tang & Xiong, 2012). As a result, commodity price movements may be reflected in equity markets through trade linkages, expected cash flows, inflation and exchange rate expectations, portfolio rebalancing, investor sentiment, and cross-market information flows. The oil-price literature shows that stock market responses depend on the source of oil shocks and the structure of the economy (Gajurel & Chawla, 2022b; Kilian & Park, 2009). For oil-exporting economies, oil market shocks are especially relevant because they can affect export earnings, fiscal revenues, exchange-rate conditions, and investor expectations (Basher et al., 2018). Gold also has a distinct financial market role because it is widely used by investors as a hedge and safe-haven asset, especially during periods of market stress (Baur & Lucey, 2010; Baur & McDermott, 2010). These dynamics are particularly relevant to Ghana, where crude oil and gold rank among the country’s major export commodities, alongside cocoa. Since these commodities are traded in global markets, information from gold, crude oil, and cocoa markets may be reflected in Ghanaian equity returns and volatility due to both direct trade linkages and financial market spillover channels.
A third literature examines volatility spillovers and inter-market transmission, especially in emerging and frontier markets. This literature shows that return and volatility transmission is not uniform across markets, asset classes, or market conditions. Diebold and Yilmaz (2012) provide a seminal framework for measuring the magnitude and direction of volatility spillovers across asset markets. Beirne et al. (2010) examine global and regional spillovers in emerging stock markets and find that mature and regional markets can transmit return and volatility shocks to local emerging markets. Gajurel and Chawla (2022a) show that frontier and emerging equity markets differ in their exposure to global and regional information spillovers, yet remain exposed to volatility spillovers. Gajurel and Thapa (2026) further document that weak return integration does not necessarily insulate frontier markets from volatility transmission, particularly during episodes of market stress. Urom et al. (2023) examine spillovers from global commodity and developed equity markets to African equity markets and report that African markets are weakly connected on average, but that connectedness increases during stressful market conditions. Furthermore, Ben Flah et al. (2025) document evidence of volatility transmission between global commodity markets and African equity markets, while Maharana et al. (2025) show that the spillover and hedging roles of gold and oil vary across aggregate and sectoral equity indices. The literature, therefore, suggests that emerging and frontier equity markets are exposed to various global markets and that these exposures vary with market conditions.
Ghana-specific empirical evidence remains limited but provides useful foundations. Lin et al. (2014) examine the dynamic volatility relationship between the global crude oil market and the Ghanaian stock market using various GARCH-family models. They document significant volatility spillover and interdependence between the crude oil market and the Ghanaian equity market, with transmission running more prominently from the oil market to the stock market than in the reverse direction. Ofori-Boateng et al. (2022) extend this line of research by examining the heterogeneous effects of cocoa, crude oil, and gold price volatility on stock returns and return volatility for firms listed on the GSE. They show that these commodity markets have diverse effects on GSE returns and volatility, with crude oil and gold price changes associated with higher stock returns and cocoa price changes associated with lower stock returns. More recently, Ben Flah et al. (2025) examine shock and volatility transmission between global commodity markets and stock markets in Nigeria, Ghana, and Côte d’Ivoire, and provide further evidence that commodity-market volatility is relevant for these equity markets. To the best of our knowledge, no existing study examines Ghana’s global equity market integration and its exposure to gold, crude oil, and cocoa price factors within a unified asset-pricing framework. Prior studies also do not formally link commodity market transmission with short-run return dependence associated with frontier-market trading conditions and structural shifts arising from domestic macro-financial policy initiatives. This paper addresses these gaps.
3. Empirical Framework
We begin this empirical-framework section with a single-factor international asset pricing representation and then extend it to a multi-factor framework by incorporating commodity market factors that are central to Ghana’s international trade. Next, we augment the mean equation with ARMA dynamics and structural break indicators to account for short-run return dependence, market microstructure frictions, and domestic macro-financial episodes. Finally, we embed the mean equation within an EGARCH specification to capture asymmetric volatility, and second-moment spillovers from international equity and commodity markets.
3.1. The Factor Model
Motivated by Arbitrage Pricing Theory (Ross, 1976) and the international asset-pricing literature (Dungey & Gajurel, 2015; Harvey, 1995), we begin with a single-factor model, a conventional international market model representation, in which domestic equity returns, , depend on exposure to the global equity market factor, :
where is the constant term, measures the global systematic risk exposure of the domestic equity market, and captures the component of domestic equity returns not explained by the global equity market factor. In this framework, captures the degree to which the domestic market is integrated with the global equity market.
For a commodity-dependent frontier economy, however, global equity market exposure alone may not fully characterize the relevant international information set (Basher & Sadorsky, 2006; Brooks et al., 2016; Gajurel & Chawla, 2022b). Ghana’s economy is closely linked to three major global commodities: gold, cocoa, and crude oil. We, therefore, extend the single-factor model by incorporating a vector of commodity market factors:
where is the vector of commodity market factors for gold, crude oil, and cocoa, respectively, and is the corresponding vector of commodity factor loadings. The elements of measure the sensitivity of domestic equity returns to commodity market information.
3.2. ARMA Dynamics and Structural Shifts
The factor representation in Equation (2) describes the contemporaneous relation between domestic equity returns and external information factors. In frontier equity markets, however, observed returns may deviate from this contemporaneous factor-pricing relation because market depth and liquidity constraints can affect both expected returns and measured factor exposures (Bekaert et al., 2007). Thin trading, nonsynchronous price adjustment, stale prices, and gradual information incorporation can induce serial dependence in index returns and weaken the measured contemporaneous response to external information shocks (Lesmond, 2005; Scholes & Williams, 1977). Major Ghana-specific macro-financial episodes may also shift the conditional mean of equity returns by changing investors’ assessment of banking-sector stability, sovereign risk, market liquidity, and the broader macro-financial environment. To account for these features, we augment the factor model with autoregressive and moving-average components and structural-shift indicators as follows:
where and capture short-run return dependence, and p and q denote the autoregressive and moving-average lag orders, respectively; the vector contains the structural-shift dummies or indicators, and is the corresponding vector of shift coefficients.
3.3. Asymmetric Volatility and Volatility Spillovers
Equity returns commonly exhibit volatility clustering and asymmetric volatility responses, where positive and negative innovations of similar magnitude may have different effects on conditional volatility. These features are especially relevant in frontier and emerging markets, where limited liquidity, trading frictions, and delayed information incorporation can amplify volatility persistence and asymmetric volatility responses (Bekaert et al., 2007; Lesmond, 2005). To model these dynamics, we embed the mean equation in (3) within an EGARCH specification (Nelson, 1991). The EGARCH model captures volatility persistence and asymmetric news effects without imposing non-negativity restrictions on the variance parameters. A GARCH specification is chosen, consistent with existing evidence that this parsimonious structure is usually sufficient to capture the volatility-clustering properties of financial data (Engle, 2004; Hansen & Lunde, 2005).
Let , where is the conditional variance of domestic equity returns and is the standardized innovation. The baseline EGARCH variance equation is given by
where is the constant term, captures the magnitude effect of lagged shocks, captures asymmetric volatility responses, and captures volatility persistence.
In addition to these domestic volatility dynamics, uncertainty originating in global equity and commodity markets may be transmitted to the Ghanaian equity market through volatility spillovers (Dungey & Gajurel, 2015; Lin et al., 2014; Ofori-Boateng et al., 2022). We therefore extend the baseline EGARCH specification as follows:
where denotes the conditional variance of the global equity market factor, and is its corresponding volatility-spillover coefficient. The vector contains the conditional variances of the gold, crude oil, and cocoa factors, respectively, while denotes the corresponding vector of commodity-market specific volatility-spillover coefficients.
Equations (3) and (5) jointly allow us to distinguish first-moment information effects from second-moment volatility spillovers. The mean equation captures whether global equity market and commodity market information is incorporated into Ghanaian equity returns, while the variance equation captures whether uncertainty from international equity and commodity markets is transmitted to the conditional volatility of Ghanaian equity returns.
3.4. Empirical Implementation
Following empirical factor-model applications in the international integration literature, we implement the latent-factor structure using observable market returns as empirical proxies for the underlying information factors (Bekaert & Harvey, 1995; Dungey & Gajurel, 2015). The latent global equity market factor, , is proxied by daily returns on a broad European equity market index. This choice reflects the overlap between Ghanaian and European trading hours and the plausibility of contemporaneous information transmission at daily frequency. Although world or US equity market returns are commonly used as global factor proxies, the European index is more closely aligned with Ghana’s trading window and reduces the need for ad hoc lead–lag or two-day return adjustments (see, for example, Forbes and Rigobon (2002)). We avoid such smoothing because it may complicate the interpretation of contemporaneous factor loadings in an ARMA–EGARCH setting, where short-run return dependence and volatility dynamics are modelled explicitly.
The commodity market factors, , are proxied by daily returns on gold, crude oil, and cocoa prices. For the second-moment spillover analysis, the conditional variances of the global equity market factor and the commodity market factors are estimated from univariate volatility models and then included in Equation (5). This implementation allows the empirical model to distinguish return-level information effects from volatility spillovers while maintaining a consistent factor-based structure in both the mean and variance equations. The autoregressive and moving-average lag orders in the conditional mean equation are selected using the Bayesian information criterion (BIC). Based on this criterion, an ARMA structure is used in the baseline estimations.
3.5. Sample and Data
The empirical analysis uses daily data from 18 January 2011 to 31 December 2025. The sample window is determined by the availability of equity market data for Ghana in the Refinitiv Workspace database. The start date, however, coincides with the beginning of major commercial crude oil production in Ghana. All index and price series are obtained from Refinitiv Workspace, formerly Thomson Reuters. See Table 2 for the Refinitiv symbols for each series. Refinitiv provides two Ghanaian equity indices: the aggregate-market return index (GSECI) and the financial-sector return index (GSEFSI), which are used as the equity series in our empirical analysis. The daily index and price series are obtained on a synchronized five-day-week calendar. This synchronization is applied using a standard data-lapping convention, which aligns observations across equity and commodity markets and mitigates differences arising from trading holidays, non-trading days, and market-closing times. All index and price series are measured in U.S. dollars. The return series are then computed as daily log returns expressed in percentage terms, , where denotes the synchronized index value or commodity price on day t. The common global factor is proxied by returns on a broad European equity market index, while the commodity-related factors are proxied by returns on gold, Brent crude oil, and cocoa price series.
Table 2.
Data series and Refinitiv symbols.
We also include two indicator variables to capture major domestic structural shifts. The DDEP indicator variable takes the value 1 for the period from 5 December 2022 to 14 February 2023, corresponding to the Domestic Debt Exchange Programme period, and 0 otherwise. The banking-sector indicator variable takes the value 1 for the period from 14 August 2017 to 4 January 2019, aligning with the banking-sector reform and clean-up actions announced and undertaken by Ghanaian authorities, and 0 otherwise.
4. Results and Discussion
4.1. Summary Statistics
Table 3 presents the descriptive statistics for the daily return series used in the empirical analysis. The table includes returns on the World, US, and European equity indices to provide a broader global equity market perspective. The summary statistics reveal several features that motivate our empirical model. The GSECI return () has a small positive daily mean, while the GSEFSI return () has a negative mean over the sample period. Ghanaian equity returns also display higher unconditional volatility than the World, US, and European equity benchmarks, indicating that the domestic market is more volatile in daily-return terms despite being smaller and less liquid. The Ghanaian equity returns are positively skewed, whereas the World, US, European, and commodity returns are negatively skewed. This contrast suggests that the distributional characteristics of Ghanaian equity returns differ from those of larger international markets and commodity-price returns.
Table 3.
Summary statistics.
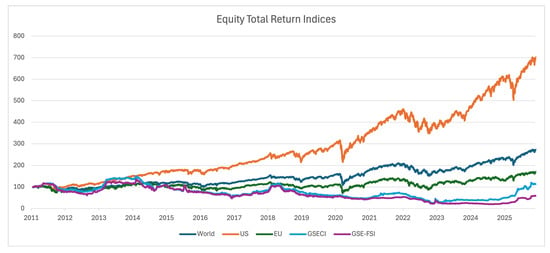
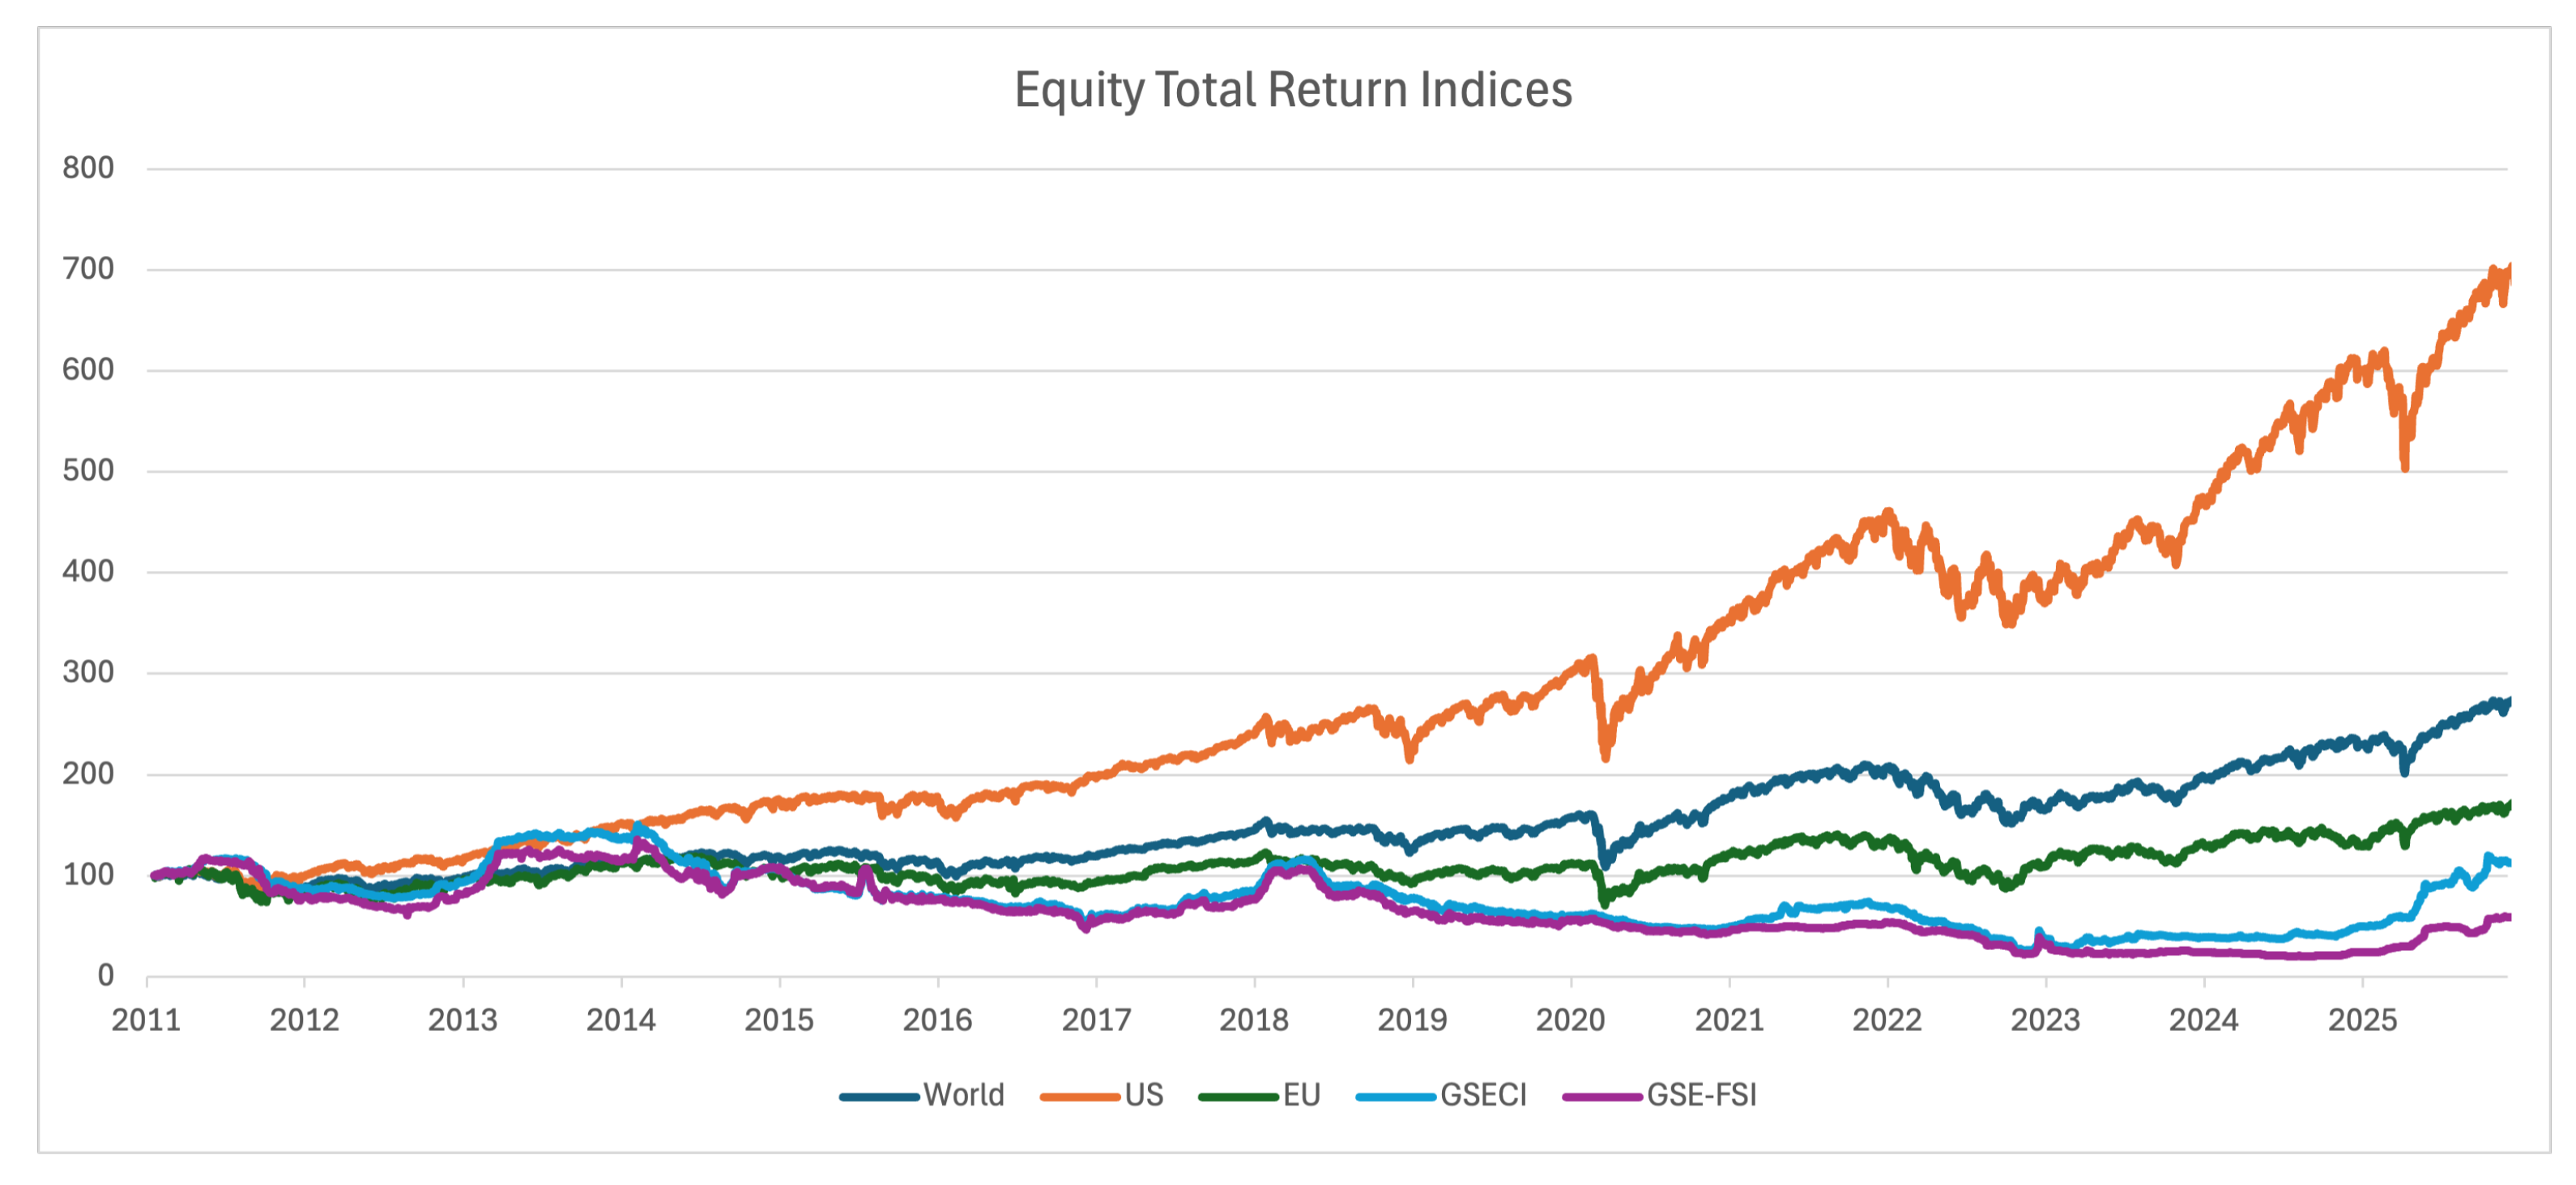
Figure 1 plots the total return indices for the World, US, European, Ghanaian aggregate, and Ghanaian financial-sector equity markets, with all series indexed to 100 on 18 January 2011. The figure highlights a divergence between Ghanaian equities and major international equity markets in cumulative performance. Over the sample period, the US equity index increased by almost sevenfold, while the World and European indices increased by approximately 2.7 times and 1.7 times, respectively. By comparison, the GSECI increased by only about 1.5 times, whereas the GSEFSI declined by roughly one-third. Although Ghanaian equities underperformed the major global benchmarks, their movements appear visually more aligned with the European equity index than with the US index, particularly in periods of broad market weakness and recovery. This pattern is consistent with the use of the European equity market as a time-synchronous proxy for external equity market information relevant to Ghana. The weak performance of the Ghanaian equity indices, particularly the financial-sector index, also coincides with a period of major domestic financial and macroeconomic adjustments, including banking-sector clean-up and recapitalization, sovereign-debt restructuring under the Domestic Debt Exchange Programme, and other corrective policy initiatives undertaken during the sample period.
Figure 1.
Equity indices. The figure plots equity total return indices for the World, US, European, Ghana Composite, and Ghana Financial Sector indices. All series are measured in U.S. dollars, and indexed to 100 on 18 January 2011.
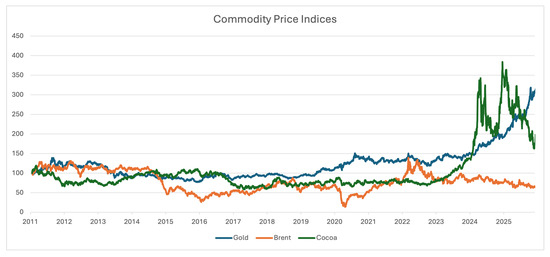
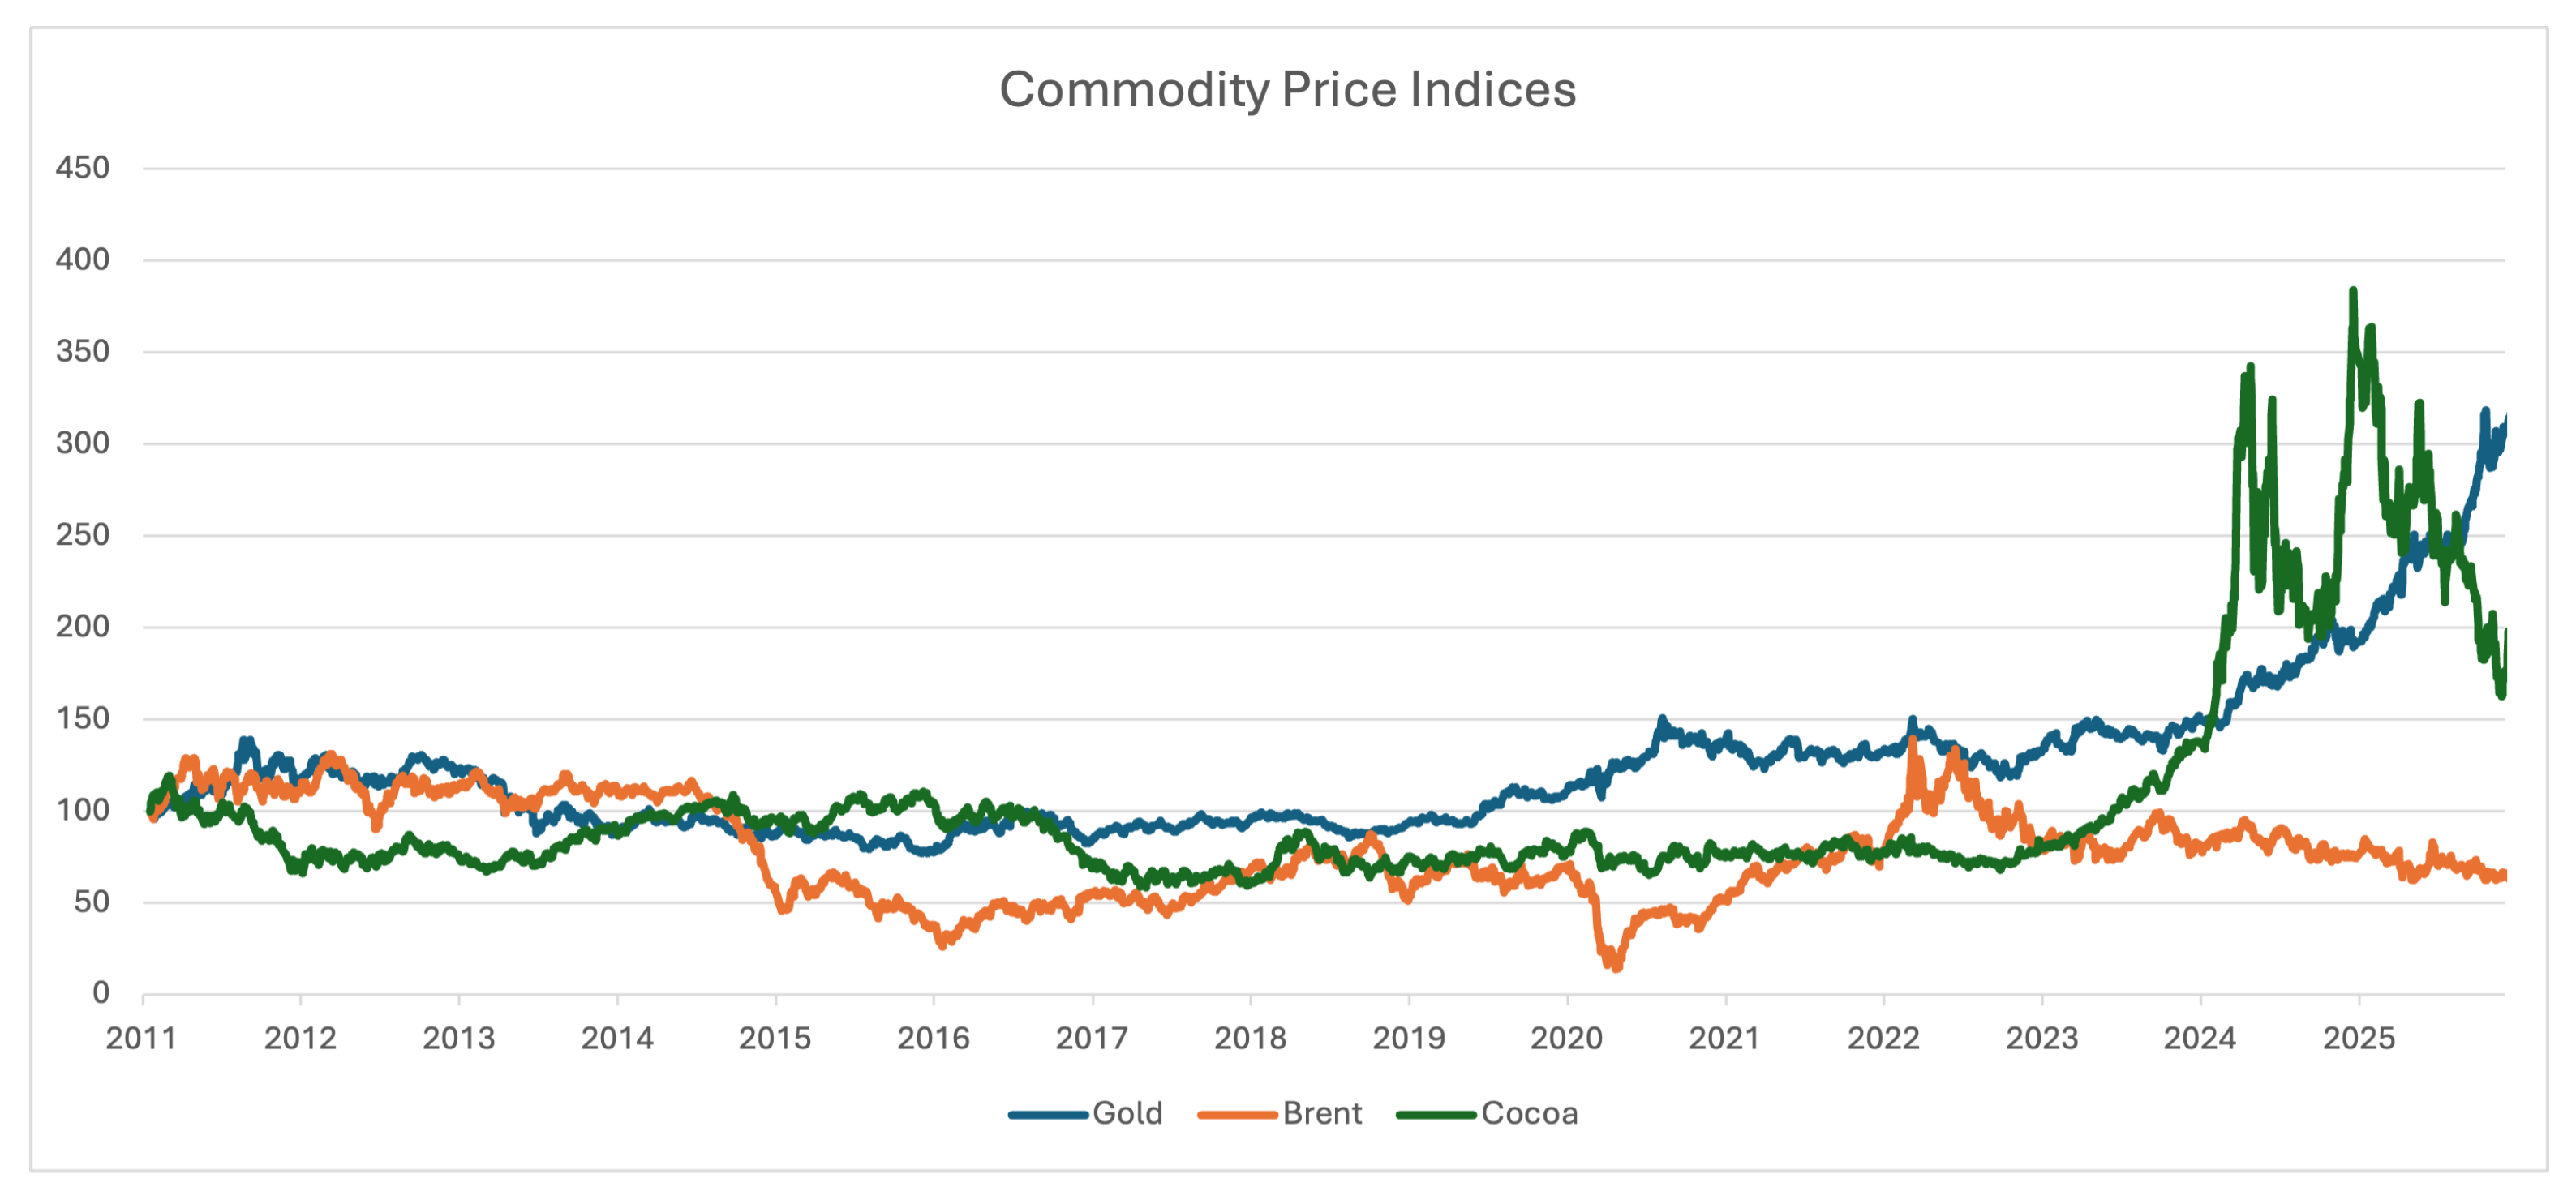
Figure 2 plots the commodity price indices for gold, Brent crude oil, and cocoa, with all series indexed to 100 at the beginning of the sample period. The figure shows substantial heterogeneity in commodity-price dynamics. Gold prices display a relatively steady upward trend, with stronger increases after 2019 and further acceleration toward the end of the sample. Brent crude oil prices are more cyclical, with a sharp decline during 2014–2016, a pronounced fall around the COVID-19 period, and a strong rebound during 2021–2022 before weakening again. Cocoa prices are comparatively subdued for much of the sample but rise sharply from 2023 onward, reaching exceptional levels in 2024 before partially retreating. These distinct price patterns provide visual motivation for treating gold, cocoa, and crude oil separately in our empirical analysis. Although Ghana’s economy is linked to all three commodities, their price dynamics differ substantially in timing, persistence, and volatility, suggesting that commodity-price information may be reflected in Ghanaian equities through different channels and may appear differently in returns and volatility.
Figure 2.
Commodity price indices. The figure plots commodity price indices for gold, Brent crude oil, and cocoa. All series are indexed to 100 at the beginning of the sample period.
4.2. Regression Results
Table 4 and Table 5 present the stepwise regression results for the composite index return series (RGSECI) and the financial-sector-index return series (RGSEFSI), respectively. Each table reports seven model specifications, allowing us to evaluate the incremental roles of international equity market information, commodity factors, and structural macro-financial shift indicators in explaining Ghanaian equity returns, while accounting for market microstructure frictions, volatility persistence, asymmetric volatility, and volatility spillovers.
Table 4.
EGARCH regression results for the GSECI.
Table 5.
EGARCH regression results for the GSEFSI.
The mean-equation results provide strong evidence of short-run return dependence in both indices. Across all specifications, the first and second autoregressive terms ( and ) are positive and statistically significant, indicating short-horizon return persistence. In a frontier equity market, such persistence is consistent with gradual price adjustment, thin trading, non-synchronous trading, and delayed information assimilation. The first moving-average term () is negative and statistically significant, suggesting partial correction of transitory return innovations. Taken together, the ARMA estimates indicate that GSE equity returns are characterized by short-run continuation and correction dynamics, consistent with market microstructure frictions in the return-generating process.
The estimated coefficient on the global equity factor, , is positive and statistically significant across all specifications for both the aggregate market and the financial sector. For the RGSECI, ranges from approximately 0.025 to 0.033, while for the RGSEFSI it ranges from approximately 0.032 to 0.049. Interpreted as the market’s exposure to global systematic risk, these estimates indicate that Ghanaian equity returns incorporate international equity market information, although the magnitude of the exposure remains economically modest. Since returns are measured in percentage terms, these estimates imply that a one-percentage-point increase in the global equity factor is associated with an increase of about 0.025 to 0.033 percentage points in aggregate-market returns and about 0.032 to 0.049 percentage points in Ghanaian financial-sector returns. The positive but modest estimates of are consistent with partial global integration, indicating that Ghanaian equities carry global systematic risk exposure while retaining a substantial domestic component in their return dynamics. The greater sensitivity of the RGSEFSI to the global equity factor suggests that financial-sector equities are more closely linked to global financial conditions than the broader market, reflecting the cross-border linkages of banks and financial institutions.
The commodity factor results for the aggregate index in Table 4 indicate that the RGSECI does not respond uniformly to Ghana’s major globally traded export commodities. In the restricted single-commodity specifications, Specifications (4)–(6), each commodity factor is introduced separately alongside the ARMA terms, the global equity factor, and the structural break indicators. The loading on the gold factor, , is positive in both specifications but lacks statistical significance at conventional levels. The result is plausible because changes in gold may be reflected in the Ghanaian equity market through export earnings, foreign-exchange liquidity, fiscal revenues, and macroeconomic expectations rather than through a simple contemporaneous cash-flow channel for listed firms. Also, the comovement with the gold factor may be diluted by sectoral heterogeneity, limited direct representation of gold-producing firms, thin trading, and the dominance of other firm-specific and market-wide influences at daily frequency.
The results are similar for the crude oil factor, . The coefficient is positive but lacks statistical significance in both specifications. The results suggest that while crude oil price changes may improve export and fiscal prospects, it may also generate offsetting pressures through fuel costs, inflation, monetary-policy responses, and macro-financial uncertainty.
By contrast, the estimated loading on the cocoa factor, , is negative and statistically significant in both the restricted single-commodity specification, Specification (6), and the full specification, Specification (7), indicating a more stable first-moment relationship with aggregate equity returns. This result should not be interpreted as evidence that cocoa is economically unimportant to Ghana. Rather, it suggests that international cocoa-price changes do not translate mechanically into positive contemporaneous listed-equity returns. One possible explanation is Ghana’s cocoa-pricing structure, in which producer prices are institutionally determined through the Ghana Cocoa Board and the Producer Price Review Committee and are linked to forward-sales arrangements. This structure may weaken the immediate pass-through from international cocoa-price changes to domestic equity valuations (Staritz et al., 2023). Cocoa-price changes may also affect listed equities through indirect fiscal, foreign-exchange, rural-income, and broader macroeconomic channels that are not immediately reflected in positive daily stock returns. Overall, the aggregate-index results point to selective commodity-price transmission, with stronger evidence for cocoa than for gold or crude oil.
The commodity-price results for the financial-sector index in Table 5 contrast sharply with the aggregate-index evidence, especially for gold and crude oil. GSEFSI returns respond more systematically to commodity-price factors than GSECI returns. The coefficient on the gold factor is positive and highly significant, suggesting that gold-market information is incorporated more strongly into financial-sector equities than into the aggregate equity market. This finding is economically plausible because banks and other financial firms may become indirectly exposed to gold-price changes through their core intermediation functions. As Ghana is one of Africa’s major gold producers and gold is the country’s leading export commodity, gold-price increases can improve foreign-exchange inflows, external balances, liquidity conditions, exchange-rate expectations, and sovereign-risk perceptions. These macro-financial improvements may, in turn, be reflected in banks through deposit growth, credit demand, funding costs, borrower balance sheets, and expectations about loan quality and macroeconomic stability. Thus, the significant gold-factor loading for the financial-sector index suggests that gold-market information is transmitted through the financial intermediation channel rather than through a broad aggregate-market channel.
The crude oil-price changes are negatively associated with financial-sector returns in both specifications. At first glance, this result may appear counterintuitive because Ghana is an oil-producing economy and may benefit from favourable oil-price changes. However, higher oil prices can also be associated with weaker financial-sector equity performance through fuel-cost pressures, inflationary expectations, monetary-policy tightening, exchange-rate uncertainty, and weaker borrower balance sheets. For the financial sector, cost, inflation, and credit-risk channels therefore appear to outweigh any positive export-revenue or fiscal channel at daily frequency.
Cocoa-price changes are also negatively associated with financial-sector returns, mirroring the evidence for the aggregate index. This suggests that the negative cocoa-price relation is not confined to the broader market but extends to financial-sector equities. Taken together, the results for the financial sector indicate that commodity-price information is incorporated selectively into financial-sector returns: gold carries positive information, whereas crude oil and cocoa are associated with negative first-moment comovement.
The structural macro-financial break indicators suggest that major domestic policy and sovereign-financial episodes are associated with equity market repricing, although the effects differ across market segments. The DDEP indicator is positive and statistically significant in the specifications in which it appears for both indices, with coefficients ranging from approximately 0.58 to 0.62 for the RGSECI and from approximately 0.65 to 0.80 for the RGSEFSI. The somewhat larger financial-sector response is consistent with the sovereign–bank nexus, as banks and other financial institutions are more directly exposed to sovereign-debt holdings, balance-sheet adjustments, credit-risk perceptions, and shifts in financial-sector confidence. However, the positive DDEP coefficient should not be interpreted mechanically as evidence that debt restructuring was beneficial in a welfare sense; rather, it indicates a conditional pricing shift during the DDEP period, possibly reflecting uncertainty resolution, clearer expectations about the restructuring framework, anticipated macroeconomic stabilization, or a rebound from previously depressed valuations. By contrast, the banking-sector recapitalization indicator shows a weaker and less uniform effect: it is positive and statistically significant for the aggregate market, with a full-specification coefficient of 0.146, but positive and statistically insignificant for the financial-sector index, with a corresponding coefficient of 0.105. Overall, the break-indicator results suggest that domestic macro-financial episodes are associated with Ghanaian equity pricing, but the estimated coefficients are market-segment-specific and should be interpreted as conditional mean shifts rather than direct causal effects.
The variance-equation results provide further evidence on the volatility dynamics of Ghanaian equities. The ARCH and GARCH terms are statistically significant across specifications for both indices, indicating pronounced volatility clustering and persistence. The asymmetric volatility coefficient, , is also positive and statistically significant. Under the EGARCH parameterization used in this study, this implies an inverse asymmetric volatility response, whereby positive return innovations generate stronger volatility responses than negative innovations of comparable magnitude. This pattern differs from the more commonly documented negative-shock asymmetry in mature equity markets, where negative return innovations often generate larger volatility responses. In the Ghanaian context, the positive asymmetry may reflect the trading environment of a thinly traded frontier market, where favourable information can trigger heightened investor attention, return-chasing behaviour, liquidity pressures, and rapid repricing. Conversely, negative information may be absorbed more slowly if loss aversion, limited liquidity, or delayed trading responses dampen immediate selling pressure.
The second-moment spillover results show that international information transmission operates not only through the mean-return channel but also through the conditional volatility channel. In the aggregate market, volatility spillovers are limited and arise mainly from the global equity market and gold market. For the financial-sector index, however, volatility spillovers are broader and more differentiated. Financial-sector volatility responds to spillovers from the global equity market, the global crude oil market, and the global cocoa market, but not from the gold market. Importantly, the crude oil and cocoa volatility-spillover coefficients are negative, suggesting that heightened volatility in these commodity markets is associated with lower conditional volatility in financial-sector returns. This finding is consistent with a dampening volatility relation, highlighting the market-segment-specific nature of commodity-volatility transmission. These findings indicate that volatility spillovers are not uniform across the aggregate market and the financial sector, and that some external information is reflected in Ghanaian equity volatility even when the corresponding mean-return relation is weak or absent.
We conduct several robustness checks to test the sensitivity of the baseline results. Although the benchmark specification uses EGARCH to accommodate asymmetric volatility within the factor model framework, re-estimation under a threshold GARCH specification yields closely comparable estimates. Imposing zero restrictions on the ARMA terms in the conditional mean leaves the estimated global equity market and commodity factor exposures essentially unchanged, suggesting that the baseline findings do not reflect short-run return dynamics. The results are similarly robust when the factors are replaced by innovations constructed by demeaning each return series used as the corresponding factor, and when the sample is redefined to begin in January 2012.
5. Summary and Conclusions
In this paper, we examine global integration, commodity prices, volatility spillovers, market microstructure frictions, and the sovereign–bank nexus in Ghana’s frontier equity market using a multi-factor asset-pricing model nested within a GARCH framework. Based on daily data for the GSECI and GSEFSI, we distinguish aggregate market dynamics from financial-sector-specific responses to global equity market conditions, commodity-market conditions in gold, crude oil, and cocoa markets, and major domestic macro-financial episodes.
We find that Ghanaian equity returns load positively on the global equity factor, indicating a measurable, although economically modest, degree of global integration through exposure to global systematic risk. This exposure is stronger for the financial-sector index than for the broader market, suggesting that financial sector equities are more sensitive to global financial conditions. We also show that commodity-factor exposures vary across commodities and market segments. The coefficient on the gold factor is positive but not statistically significant for the aggregate market, whereas it is positive and highly significant for the financial-sector index. The coefficient on the crude oil factor is positive but not statistically significant for the aggregate market, but negative and statistically significant for the financial-sector index. By contrast, the coefficient on the cocoa factor is consistently negative and statistically significant for both indices. These findings suggest that global commodity-market information is reflected in Ghanaian equities selectively through different macro-financial channels and need not appear uniformly or immediately in daily stock returns. The structural break indicators further show that domestic macro-financial episodes, particularly the DDEP period, are associated with equity market repricing, although these effects should be interpreted as conditional pricing shifts rather than direct causal effects.
We further document persistent conditional volatility, inverse asymmetric volatility responses, and selective volatility spillovers from global equity and commodity markets. Volatility spillovers are limited in the aggregate market and arise mainly from the global equity and gold markets, whereas financial-sector volatility responds to spillovers from the global equity, crude oil, and cocoa markets. These findings show that return-based evidence alone can understate the extent of international information transmission in frontier equity markets. For investors and risk managers, the results highlight the need to account for both commodity-specific exposures and volatility spillovers when allocating to Ghanaian equities. For policymakers, the findings underscore the importance of strengthening market liquidity, improving information dissemination, and reducing the vulnerability of financial institutions to sovereign and commodity-related macro-financial shocks.
Our paper also suggests several directions for future research. Future studies could examine more directly the role of market microstructure in Ghanaian equities, including thin trading, delayed price discovery, and non-synchronous information adjustment. Analysis at the firm level may also provide a deeper understanding of how information from global equity and commodity markets is reflected across listed firms and sectors. Given the negative association between cocoa price changes and Ghanaian equity returns documented in this paper, further research could examine the cocoa market in more detail, including domestic market structure, government programmes, producer incentives, and seasonal pricing arrangements. Such analysis may provide useful domestic policy insights, given the central role of cocoa in Ghana’s export earnings, rural income, and macro-financial conditions. Future work may also use machine learning (ML) and deep learning (DL) approaches where the objective is to capture nonlinear patterns, improve volatility forecasting, or identify complex interactions among global equity, commodity, exchange-rate, and domestic financial variables. More Ghana specific research on volatility modelling would further enrich our understanding of how global and domestic shocks are transmitted in small and less liquid frontier equity markets.
Author Contributions
Conceptualization, D.G.; methodology, D.G.; formal analysis, D.G. and A.A.; data curation, D.G. and A.A.; writing—original draft preparation, D.G. and A.A.; writing—review and editing, D.G. and A.A. All authors have read and agreed to the published version of the manuscript.
Funding
This research received no external funding.
Institutional Review Board Statement
Not applicable.
Informed Consent Statement
Not applicable.
Data Availability Statement
The data used in this study are available from Refinitiv Workspace and the public sources cited in the manuscript, subject to their access conditions.
Acknowledgments
This work benefited from the comments of three anonymous reviewers, whose thoughtful suggestions enhanced the manuscript’s rigor and clarity. The authors acknowledge the assistance of artificial intelligence platforms (ChatGPT-5.4, Gemini 3, and Perplexity) for linguistic enhancement.
Conflicts of Interest
The authors declare no conflicts of interest.
References
- Acharya, V. V., Drechsler, I., & Schnabl, P. (2014). A pyrrhic victory? Bank bailouts and sovereign credit risk. The Journal of Finance, 69(6), 2689–2739. [Google Scholar] [CrossRef] [Scilit]
- Bank of Ghana. (2026). Summary of economic and financial data. Bank of Ghana. Available online: https://www.bog.gov.gh/wp-content/uploads/2026/01/Summary-of-Economic-and-Financial-Data-January-2026.pdf (accessed on 1 May 2026).
- Basher, S. A., Haug, A. A., & Sadorsky, P. (2018). The impact of oil-market shocks on stock returns in major oil-exporting countries. Journal of International Money and Finance, 86, 264–280. [Google Scholar] [CrossRef] [Scilit]
- Basher, S. A., & Sadorsky, P. (2006). Oil price risk and emerging stock markets. Global Finance Journal, 17(2), 224–251. [Google Scholar] [CrossRef] [Scilit]
- Baur, D. G. (2012). Financial contagion and the real economy. Journal of Banking & Finance, 36(10), 2680–2692. [Google Scholar] [CrossRef] [Scilit]
- Baur, D. G., & Lucey, B. M. (2010). Is gold a hedge or a safe haven? An analysis of stocks, bonds and gold. Financial Review, 45(2), 217–229. [Google Scholar] [CrossRef] [Scilit]
- Baur, D. G., & McDermott, T. K. (2010). Is gold a safe haven? International evidence. Journal of Banking & Finance, 34(8), 1886–1898. [Google Scholar] [CrossRef] [Scilit]
- Beirne, J., Caporale, G. M., Schulze-Ghattas, M., & Spagnolo, N. (2010). Global and regional spillovers in emerging stock markets: A multivariate GARCH-in-mean analysis. Emerging Markets Review, 11(3), 250–260. [Google Scholar] [CrossRef] [Scilit]
- Bekaert, G., Ehrmann, M., Fratzscher, M., & Mehl, A. (2014). The global crisis and equity market contagion. The Journal of Finance, 69(6), 2597–2649. [Google Scholar] [CrossRef] [Scilit]
- Bekaert, G., & Harvey, C. R. (1995). Time-varying world market integration. The Journal of Finance, 50(2), 403–444. [Google Scholar] [CrossRef]
- Bekaert, G., Harvey, C. R., & Lundblad, C. (2007). Liquidity and expected returns: Lessons from emerging markets. The Review of Financial Studies, 20(6), 1783–1831. [Google Scholar] [CrossRef] [Scilit]
- Bekaert, G., Harvey, C. R., Lundblad, C. T., & Siegel, S. (2011). What segments equity markets? Review of Financial Studies, 24(12), 3841–3890. [Google Scholar] [CrossRef] [Scilit]
- Bekaert, G., Harvey, C. R., Lundblad, C. T., & Siegel, S. (2013). The European Union, the Euro, and equity market integration. Journal of Financial Economics, 109(3), 583–603. [Google Scholar] [CrossRef] [Scilit]
- Bekaert, G., Hodrick, R. J., & Zhang, X. (2009). International stock return comovements. Journal of Finance, 64(6), 2591–2626. [Google Scholar] [CrossRef] [Scilit]
- Ben Flah, I., Samet, K., El Ammari, A., & Terzi, C. (2025). Shock and volatility transmissions across global commodity and stock markets spillovers: Empirical evidence from Africa. Journal of Risk and Financial Management, 18(6), 332. [Google Scholar] [CrossRef] [Scilit]
- Brooks, C., Fernández-Pérez, A., Miffre, J., & Nneji, O. (2016). Commodity risks and the cross-section of equity returns. The British Accounting Review, 48(2), 134–150. [Google Scholar] [CrossRef] [Scilit]
- Cheng, I.-H., & Xiong, W. (2014). Financialization of commodity markets. Annual Review of Financial Economics, 6, 419–441. [Google Scholar] [CrossRef] [Scilit]
- Claessens, S., & Forbes, K. J. (2013). International financial contagion. Springer Science & Business Media. [Google Scholar]
- Diebold, F. X., & Yilmaz, K. (2012). Better to give than to receive: Predictive directional measurement of volatility spillovers. International Journal of Forecasting, 28(1), 57–66. [Google Scholar] [CrossRef] [Scilit]
- Dungey, M., & Gajurel, D. (2014). Equity market contagion during the global financial crisis: Evidence from the world’s eight largest economies. Economic Systems, 38(2), 161–177. [Google Scholar] [CrossRef] [Scilit]
- Dungey, M., & Gajurel, D. (2015). Contagion and banking crisis: International evidence for 2007–2009. Journal of Banking & Finance, 60, 271–283. [Google Scholar] [CrossRef] [Scilit]
- Engle, R. F. (2004). Risk and volatility: Econometric models and financial practice. American Economic Review, 94(3), 405–420. [Google Scholar] [CrossRef] [Scilit]
- Farhi, E., & Tirole, J. (2018). Deadly embrace: Sovereign and financial balance sheets doom loops. The Review of Economic Studies, 85(3), 1781–1823. [Google Scholar] [CrossRef] [Scilit]
- Fisher, L. (1966). Some new stock-market indexes. The Journal of Business, 39(1), 191–225. [Google Scholar] [CrossRef] [Scilit]
- Forbes, K. J., & Rigobon, R. (2002). No contagion, only interdependence: Measuring stock market comovements. The Journal of Finance, 57(5), 2223–2261. [Google Scholar] [CrossRef] [Scilit]
- Gajurel, D. (2019). Asymmetric volatility in the Nepalese stock market. Journal of Comparative International Management, 22(1), 41–59. [Google Scholar]
- Gajurel, D., & Chawla, A. (2022a). International information spillovers and asymmetric volatility in South Asian stock markets. Journal of Risk and Financial Management, 15(10), 471. [Google Scholar] [CrossRef] [Scilit]
- Gajurel, D., & Chawla, A. (2022b). The oil price crisis and contagion effects on the Canadian economy. Applied Economics, 54(13), 1527–1543. [Google Scholar] [CrossRef] [Scilit]
- Gajurel, D., & Thapa, B. S. (2026). The integration-contagion paradox: Global linkages and crisis transmission in South Asian stock markets. International Journal of Financial Studies, 14(4), 86. [Google Scholar] [CrossRef] [Scilit]
- Gennaioli, N., Martin, A., & Rossi, S. (2014). Sovereign default, domestic banks, and financial institutions. The Journal of Finance, 69(2), 819–866. [Google Scholar] [CrossRef] [Scilit]
- Ghana Stock Exchange. (2025). GSE 2024 Factbook. Ghana Stock Exchange. Available online: https://gse.com.gh/wp-content/uploads/2025/12/GSE-2024-FACTBOOK.pdf (accessed on 16 May 2026).
- Hansen, P. R., & Lunde, A. (2005). A forecast comparison of volatility models: Does anything beat a GARCH(1,1)? Journal of Applied Econometrics, 20(7), 873–889. [Google Scholar] [CrossRef] [Scilit]
- Harding, T., & Venables, A. J. (2016). The implications of natural resource exports for non-resource trade. IMF Economic Review, 64(2), 268–302. [Google Scholar] [CrossRef] [Scilit]
- Harvey, C. R. (1995). Predictable risk and returns in emerging markets. The Review of Financial Studies, 8(3), 773–816. [Google Scholar] [CrossRef] [Scilit]
- International Monetary Fund. (2025). Ghana: Fourth review under the arrangement under the Extended Credit Facility, request for modification of performance criteria, financing assurances review, and monetary policy consultation–Press release; staff report; and statement by the Executive Director for Ghana (IMF Country Report No. 25/175). International Monetary Fund. [Google Scholar]
- Kilian, L., & Park, C. (2009). The impact of oil price shocks on the U.S. stock market. International Economic Review, 50(4), 1267–1287. [Google Scholar] [CrossRef] [Scilit]
- Lesmond, D. A. (2005). Liquidity of emerging markets. Journal of Financial Economics, 77(2), 411–452. [Google Scholar] [CrossRef] [Scilit]
- Lin, B., Wesseh, P. K., Jr., & Appiah, M. O. (2014). Oil price fluctuation, volatility spillover and the Ghanaian equity market: Implication for portfolio management and hedging effectiveness. Energy Economics, 42, 172–182. [Google Scholar] [CrossRef] [Scilit]
- Maharana, N., Panigrahi, A. K., & Chaudhury, S. K. (2025). Commodity spillovers and risk hedging: The evolving role of gold and oil in the Indian stock market. Commodities, 4(2), 5. [Google Scholar] [CrossRef] [Scilit]
- Nelson, D. B. (1991). Conditional heteroskedasticity in asset returns: A new approach. Econometrica, 59(2), 347–370. [Google Scholar] [CrossRef] [Scilit]
- Ofori-Boateng, K., Agyapong, E. K., Ohemeng, W., & Annor, L. D. J. (2022). Commodity price volatility and stock market returns in an emerging economy. International Social Science Journal, 72(245), 585–601. [Google Scholar] [CrossRef] [Scilit]
- Ross, S. A. (1976). The arbitrage theory of capital asset pricing. Journal of Economic Theory, 13(3), 341–360. [Google Scholar] [CrossRef] [Scilit]
- Sachs, J. D., & Warner, A. M. (2025). Natural resource abundance and economic growth. Annals of Economics and Finance, 26(2), 891–931. [Google Scholar]
- Scholes, M., & Williams, J. (1977). Estimating betas from nonsynchronous data. Journal of Financial Economics, 5(3), 309–327. [Google Scholar] [CrossRef] [Scilit]
- Schotman, P. C., & Zalewska, A. (2006). Non-synchronous trading and testing for market integration in Central European emerging markets. Journal of Empirical Finance, 13(4–5), 462–494. [Google Scholar] [CrossRef] [Scilit]
- Shettima, M. A., Gambo, A. I., Abraham, O., Adamu, H. D., & Gadanya, B. S. (2019). Return and volatility spillovers between Ghanaian and Nigerian equity markets. International Journal of Economics, Business and Management Research, 3(3), 1–15. [Google Scholar] [CrossRef] [Scilit]
- Staritz, C., Tröster, B., Grumiller, J., & Maile, F. (2023). Price-setting power in global value chains: The cases of price stabilisation in the cocoa sectors in Côte d’Ivoire and Ghana. The European Journal of Development Research, 35, 840–868. [Google Scholar]
- Tang, K., & Xiong, W. (2012). Index investment and the financialization of commodities. Financial Analysts Journal, 68(6), 54–74. [Google Scholar] [CrossRef] [Scilit]
- UNCTAD. (2024). Economic development in Africa report 2024. United Nations. [Google Scholar]
- Urom, C., Ndubuisi, G., Del Lo, G., & Yuni, D. (2023). Global commodity and equity markets spillovers to Africa during the COVID-19 pandemic. Emerging Markets Review, 55, 100948. [Google Scholar] [CrossRef] [Scilit]

Disclaimer/Publisher’s Note: The statements, opinions and data contained in all publications are solely those of the individual author(s) and contributor(s) and not of MDPI and/or the editor(s). MDPI and/or the editor(s) disclaim responsibility for any injury to people or property resulting from any ideas, methods, instructions or products referred to in the content. |
© 2026 by the authors. Licensee MDPI, Basel, Switzerland. This article is an open access article distributed under the terms and conditions of the Creative Commons Attribution (CC BY) license.