


Abstract
This study examines the determinants of profitability for 21 Bulgarian commercial banks over the period from the first quarter of 2007 to the first quarter of 2025, using financial statement data. Bank profitability is measured by return on assets (ROA) and return on equity (ROE) and modeled within a panel autoregressive distributed lag (PMG-ARDL) framework. The empirical specification combines bank-specific and macroeconomic variables, allowing for the identification of both long-run equilibrium relationships and short-run bank-level dynamics. The long-term results indicate that the net interest margin (NIM), net fee and commission margin (NFM), government bond yields, the growth of the gross domestic product (GDP), and the loan-to-deposit ratio (LDR) positively affect profitability. On the other hand, higher unemployment, rising housing prices, increased loan loss impairments, and the ratio of cash holdings to total assets reduce profitability. The findings provide policy-relevant insights for bank management, regulators, and macroprudential authorities regarding efficiency, income diversification, and credit risk management. The findings facilitate a more comprehensive assessment of banking sector resilience and provide a foundation for the development and refinement of macroprudential and supervisory policy measures.
1. Introduction
The profitability of commercial banks in Bulgaria is one of the most important factors for financial system stability and efficiency in a country highly dependent on bank financing. The profitability of commercial banks in Bulgaria depends on both microeconomic and macroeconomic factors. Understanding the degree of influence that commercial banks’ profitability has from various influencing factors is of great importance. In addition to being the dominant sector of the financial system of the country, commercial banks are the main sources of financing of firms and households. As such, they contribute to the country’s economic stability and growth. Following the 2008–2009 financial crisis, the banks in Bulgaria have been subject to a prolonged period of low interest rates. The banks have also had to comply with more stringent national and EU regulations as well as the effects of the COVID-19 pandemic, the post-2022 high-inflation environment, the monetary tightening after the high-inflation period, and the continued transition to the Eurozone. The 2012 Government debt crisis in selected EU countries and the 2014 default of Corporate Commercial Bank additionally challenged the banking system stability.
Following its peak in 2007, the profitability of Bulgarian commercial banks began to decline, reaching a trough in 2012 and partially recovering in the years that followed. Profitability remains a central issue for both policymakers and banking managers and owners. Bank profits are the main source of capital accumulation and improve the capacity to lend. Banks’ profitability represents the capacity of banks to generate income and their ability to absorb shocks, maintain lending activity, and contribute to economic growth. While the sector has demonstrated resilience and strong capital adequacy and liquidity, profitability has fluctuated substantially due to various microeconomic and macroeconomic factors. These dynamics justify the need for a comprehensive evaluation of the main factors affecting the profitability of Bulgarian commercial banks in the short term and in the long run.
This paper contributes to the empirical literature by analyzing the profitability of 21 Bulgarian commercial banks over the period from the first quarter of 2007 to the first quarter of 2025, using quarterly, publicly available bank-level and macroeconomic data. The study employs a pooled mean group autoregressive distributed lag (PMG-ARDL) panel framework following Pesaran et al. (1999), which is well suited to the data structure and allows for the simultaneous estimation of heterogeneous short-run dynamics and homogeneous long-run equilibrium relationships between profitability measures and a set of bank-specific and macroeconomic determinants.
This study offers additional contributions to a well-developed body of literature on bank profitability by offering results for the underdeveloped area of the Central and Eastern European (CEE) countries, specifically Bulgaria, in several ways. First, most of the studies rely on annual data and static panel econometric techniques. Most studies do not capture the long-term adjustment toward equilibrium and assume homogeneity across banks. Second, available research typically covers shorter time periods and does not cover multiple structural breaks, such as the Global Financial Crisis of 2007–2009, followed by the massive quantitative easing (QE), the COVID-19 pandemic, and the recent high-inflation period and monetary tightening. Third, while there exists a significant body of literature concerning the CEE region or Bulgaria, it is rare for studies to be limited solely to these regions. Fourth, none of the studies provide a microeconomic analysis of the panel constituents and their individual dynamic coefficients. Fifth, the combination of microeconomic and macroeconomic variables in the study was not applied to Bulgarian banks, either as part of a broader study or as a study focused on Bulgaria. These gaps are addressed in this article by applying the PMG-ARDL framework of Pesaran et al. (1999). The methodology is applied to quarterly microeconomic data for Bulgarian commercial banks over the period from the first quarter of 2007 to the first quarter of 2025. This study will contribute to the current debates regarding financial stability, monetary policy transmission mechanisms, and sustainable banking practices. By identifying the primary factors driving profitability in the short and long term, this study will provide valuable insight for regulators, bank management, and policymakers seeking to promote a more stable and competitive banking industry in Bulgaria.
Several aspects impose limitations on the research. The sample of 21 banks is largely representative of the banking system, but still it excludes banks with missing data for the whole period analyzed. M&A activity in the sector also omits data for acquired banks prior to their acquisition or merger. The panel of banks comprises heterogeneous banks and bank branches, owned by domestic or international entities. Changes in accounting and reporting requirements necessitate the discretionary adjustments to previously reported data to conform to the new classification categories. The results should be considered with caution due to the 2026 euro adoption in Bulgaria, which could alter the relationship between profitability and its determinants in the future. Finally, the study focuses on quantitative analysis and ignores qualitative investigation methods.
Despite these limitations, the study offers a robust and comprehensive empirical framework that can be amplified in the future by adding more variables, expanding the period, and introducing new constituents to the panel, including on a regional or EU-wide basis.
The object of the paper is the profitability of Bulgarian commercial banks. The subject of the study is the determinants of profitability of Bulgarian commercial banks, including microeconomic factors such as capital adequacy, liquidity, asset quality, and operational efficiency as well as macroeconomic factors such as GDP growth, unemployment, housing prices, and government bond yields. The goal of the study is to identify and evaluate the key determinants of profitability for Bulgarian commercial banks, approximated by the (ROA) and (ROE), during the period between the first quarter of 2007 and the first quarter of 2025. The main thesis of this paper is that the profitability of Bulgarian commercial banks is determined by a mix of bank-specific financial indicators and macroeconomic factors, with long-term equilibrium relationships existing between them.
The remainder of the paper is structured as follows. Section 2 reviews the theoretical and empirical literature on bank profitability determinants. The literature review focuses almost exclusively on emerging markets. Section 3 reveals the data and methodology of the study. Section 4 provides the empirical results and a brief analysis and discussion. Section 5 concludes with key findings and policy implications for the Bulgarian banking sector.
2. Literature Review
Bank profitability factors are scrutinized in the empirical literature, and the CEE region lately attracts the interest of researchers. Three general groups of factors can be outlined: bank-specific (microeconomic), macroeconomic, and institutional factors.
Bank-specific factors directly influence profitability, revealing managerial efficiency, risk management, and operational performance. The cost-to-income ratio (CIR) negatively affects ROA, ROE, and the net interest margin (NIM) in numerous studies (see B. P. Athanasoglou et al., 2006; Căpraru & Ihnatov, 2014; Onofrei et al., 2018; Niu, 2024; Dietrich & Wanzenried, 2011; García-Herrero et al., 2009; Mirzaei et al., 2013; Endri et al., 2025). Analyzing a panel of 143 commercial banks from Romania, Hungary, Poland, Czech Republic, and Bulgaria from 2004 to 2011, Căpraru and Ihnatov (2014) found that ROA, ROE, and NIM (as dependent variables) are negatively associated with CIR. Niu (2024) analyzes 9027 banks using quarterly data over the period between 2001 and 2016 and finds similar negative association. The results of Dumicic and Rizdak (2013) also support the negative effect of CIR on profitability in their GMM panel study on the main determinants of the net interest margin of CEE banks during the 1999–2010 period. Onofrei et al. (2018) also identify the presence of such a negative link in Bulgaria, Czech Republic, Hungary, Lithuania, Latvia, Poland, and Romania between 2003 and 2012. Dietrich and Wanzenried (2011) analyze the profitability of 372 commercial banks in Switzerland over the period from 1999 to 2009 using a panel GMM evaluation technique. García-Herrero et al. (2009) analyze the Chinese banks for the period 1997–2004, using a GMM panel econometric approach. Mirzaei et al. (2013) analyze 1929 banks in 40 emerging and advanced economies over the 1999–2008 period using fixed effect (FE) and random effect (RE) panel estimation methodologies. In a recent study, Endri et al. (2025) analyze Indonesian banks using quarterly data for the period 2018 to 2022, applying FE panel modeling. B. P. Athanasoglou et al. (2006) use FE and RE panel least squares methodology in researching bank profitability between 1998 and 2002 in Albania, Bosnia and Herzegovina, Bulgaria, FYROM, Romania, and Serbia-Montenegro. Lending of Bulgarian commercial banks is subject to a panel investigation in the works of Peshev and Stamenova (2025), and profitability measures are among the determinants. However, panel studies analyzing profitability in Bulgaria are scarce.
In a similar way, loan-loss provisions and non-performing loans are negatively associated with profitability, indicating that poor asset quality reduces returns (see Căpraru & Ihnatov, 2014; Dumicic & Rizdak, 2013; B. P. Athanasoglou et al., 2006; Djalilov & Piesse, 2016; Horobet et al., 2021; Dietrich & Wanzenried, 2011). In early European transition countries, during the 2000–2013 period, the loan-loss provision ratio exhibits a positive link with ROA, revealed by the panel GMM study of Djalilov and Piesse (2016). Horobet et al. (2021) analyze bank profitability in the CEE region, using a GMM methodology. B. P. Athanasoglou et al. (2006) use FE and RE panel least squares methodology in researching bank profitability between 1998 and 2002 in Albania, Bosnia and Herzegovina, Bulgaria, FYROM, Romania, and Serbia-Montenegro.
The capital-to-assets ratio (CAR) exhibits a positive relationship with both ROA and ROE (Căpraru & Ihnatov, 2014; Djalilov & Piesse, 2016; García-Herrero et al., 2009; Claeys & Vander Vennet, 2008; and Zajñac & Paczos, 2025; Endri et al., 2025), implying that better-capitalized banks tend to be more profitable. From another perspective, Horobet et al. (2021), Niu (2024), and Dietrich and Wanzenried (2011) find a negative relationship, suggesting that higher CAR may signal lower risk-taking or constrained lending, harming profitability. Zajñac and Paczos (2025) analyze a panel of 1033 banks in 11 CEE EU states using 2006–2020 data.
The bank size matters, but it has mixed effects on profitability in the covered studies. The natural logarithm of total assets is negatively linked to profitability, indicating diseconomies of scale (Căpraru & Ihnatov, 2014; Djalilov & Piesse, 2016; Mirzaei et al., 2013; Dietrich & Wanzenried, 2011). On the contrary, larger institutions benefit from diversification and economies to scale (B. P. Athanasoglou et al., 2006; García-Herrero et al., 2009; Zajñac & Paczos, 2025). The natural logarithm of assets leads to higher ROA but reduces ROE in the work of Niu (2024).
Liquidity measures, such as the liquid assets-to-total assets, exert negative relationships with profitability, according to Niu (2024) and Zajñac and Paczos (2025). The coefficient on the loan-to-deposit ratio (LDR) is positive with respect to ROA in the study of Endri et al. (2025).
Macroeconomic factors considerably influence bank profitability. In the studies analyzed and logically justifiable, the GDP growth has a positive effect on bank profitability (Albertazzi & Gambacorta, 2009; Căpraru & Ihnatov, 2014; Zajñac & Paczos, 2025; Dietrich & Wanzenried, 2011; Onofrei et al., 2018; Niu, 2024) because of the pro-cyclical nature of banking. Karkowska and Pawłowska (2017) do not find significant association between the GDP growth rate and the dependent profitability measures. Claeys and Vander Vennet (2008) report a negative relationship between economic growth and net interest margin (NIM), suggesting that higher economic growth may be associated with lower interest margins.
Inflation has mixed effects on profitability according to the reviewed studies. It has a positive effect in the works of Căpraru and Ihnatov (2014), B. P. Athanasoglou et al. (2006), García-Herrero et al. (2009), and Zajñac and Paczos (2025). On the contrary, Horobet et al. (2021) identify inflation as a negative factor for bank profitability. Moderate inflation is possibly healthy for the banking sector, but perhaps excessive inflation can erode bank profit margins and destabilize the bank.
The state of the labor market is indicative of the bank performance. The credit risk and non-performing loans increase with a higher unemployment rate, leading to lower profitability. The unemployment rate deteriorates the profitability of banks in the works of Horobet et al. (2021) and Niu (2024).
The stock market volatility is positively associated with ROE and in the study of Albertazzi and Gambacorta (2009) but demonstrates a negative association in their model with the profit before tax variable. This illustrates that broader macro-financial variables can affect banks through multiple transmission channels, from credit risk to investment returns.
Together with bank-specific and macroeconomic determinants and institutional and structural factors, such as regulatory and regime changes, the ownership structure further shapes the profitability of banks.
Empirical evidence from Claeys and Vander Vennet (2008), B. P. Athanasoglou et al. (2006), and García-Herrero et al. (2009) indicates a positive relationship between market share and bank profitability, consistent with the view that larger banks achieve efficiency gains through economies of scale and enhanced pricing power. In the study of Borisov (2017), mergers and acquisitions (M&A) led to increased efficiency and higher profitability for Bulgarian banks. Djalilov and Piesse (2016) identify a positive effect of the concentration measure (HHI) on ROA. In the studies of Claeys and Vander Vennet (2008) and Horobet et al. (2021), the concentration ratio exhibits a negative link with the NIM variable.
García-Herrero et al. (2009) find that state-owned banks in China are less profitable than privately owned institutions, perhaps due to inefficiency and policy-driven lending. In the study of Dietrich and Wanzenried (2011), state-owned (co-owned) banks have a positive effect on bank profitability. Foreign ownership has positive effect on profitability in the work of Mirzaei et al. (2013), probably due to better know-how and access to financial support by the acquiring company. Evidence from Karkowska and Pawłowska (2017) suggests that foreign bank ownership does not exert a statistically significant effect on the dependent variable.
Other institutional factors, such as ERM II and euro adoption, affect bank profitability. Zajñac and Paczos (2025) analyze a panel of 1033 banks in 11 CEE EU states using 2006–2020 data. Euro adoption and ERM entry improve ROA and ROE according to the panel regression comprising only those two variables (Zajñac & Paczos, 2025). In the models with a broader set of bank-specific and macroeconomic variables, the euro adoption even plays a negative role for ROA and ROE (ibid.).
Dumicic and Rizdak (2013) identify a negative link between the 3-month money market rate and NIM. Niu (2024) suggests the presence of a negative link between the term spread and profitability. Interest spreads support the bank profitability in the paper of Mirzaei et al. (2013).
The literature review performed in the current section demonstrates that bank profitability is determined by a complex set of microeconomic, macroeconomic, and institutional factors. Sometimes, even in the same study, the same set of factors play different role in profitability, e.g., small vs. large banks, transition countries vs. old Western EU countries, etc. Also, it is not uncommon for different panel econometric techniques applied on the same data to produce contradictory results, as in the study of Djalilov and Piesse (2016).
3. Data and Methodology
This study followed a structured multi-stage empirical procedure designed to identify and evaluate the determinants of profitability of Bulgarian commercial banks using dynamic panel econometric techniques. The methodological framework integrated data preparation, statistical diagnostics, model selection, and dynamic panel estimation, enabling the identification of both long-run equilibrium relationships and short-run adjustment dynamics.
First, a balanced panel dataset was constructed comprising quarterly observations for 21 Bulgarian commercial banks over the period from the first quarter of 2007 to the first quarter of 2025. Profitability was measured using return on assets (ROA) and return on equity (ROE), while the explanatory variables included bank-specific financial indicators and macroeconomic variables reflecting operational efficiency, income structure, liquidity, credit risk, and macroeconomic conditions. The variables were introduced as ratios, rates, and natural logarithms, consistent with standard empirical practice in macro-financial panel studies.
Second, preliminary statistical analysis was performed to examine the distributional properties and relationships among variables. This stage included descriptive statistics, normality tests, and correlation analysis to identify potential outliers, heterogeneity, and multicollinearity. These diagnostics provided essential insights into the statistical characteristics of the dataset and guide the selection of appropriate econometric techniques.
Third, panel unit root tests were conducted to determine the order of integration of each variable and to avoid spurious regression results. Macroeconomic and financial variables are frequently characterized by non-stationary stochastic properties.
Fourth, diagnostic tests were performed to examine cross-sectional dependence and to determine the appropriate panel estimation framework. In addition, model selection between the mean group (MG) and pooled mean group (PMG) estimators was conducted using the Hausman specification test.
Fifth, the core empirical estimation was conducted using the pooled mean group autoregressive distributed lag (PMG-ARDL) approach of Pesaran et al. (1999). This methodology allowed for heterogeneous short-run dynamics across banks while imposing homogeneity on long-run relationships, making it particularly suitable for macro-financial data. The presence of cointegration was further verified using the Kao (1999) residual-based cointegration test, confirming the existence of stable long-run equilibrium relationships between profitability and its determinants.
Finally, the empirical results were interpreted in two complementary dimensions. The long-run equations identified the structural determinants of bank profitability, while the short-run error-correction models captured adjustment dynamics and the speed at which profitability returned to equilibrium following shocks. In addition, the PMG framework allowed for estimation of individual bank-level short-run coefficients, providing insights into heterogeneity across banks in terms of profitability adjustment and sensitivity to financial and macroeconomic conditions.
Overall, this methodological procedure ensured robust empirical identification of profitability determinants by combining rigorous statistical diagnostics with a dynamic panel econometric framework capable of capturing both equilibrium relationships and transitional dynamics. The results of these procedures are presented and analyzed in the following chapter.
The panel comprised quarterly data for 10 variables (two of which were the dependent variables) of 21 Bulgarian commercial banks over the period between the first quarter of 2007 and the first quarter of 2025, producing 1533 observations.
Table 1 provides information about data constituents. The source of microeconomic data was the publicly available financial statements section of the web site of Bulgarian National Bank. Most of the macroeconomic variables were fetched from the website of National Statistical Institute.
Table 1.
Panel constituents (list of banks).
The bank selection process was based on data availability for the analyzed period. Selected 21 banks had data for the whole analyzed period, and the sample represented the population well in terms of share of profit, equity, loans, liabilities, and assets in comparison to the whole banking system. The panel omitted banks with incomplete data for the whole period to avoid biases arising from unbalanced panels. The panel constituents possessed heterogeneous features since some banks varied by ownership, business model, asset and operation size, and whether they are a bank or bank branch, established by the mother company in Bulgaria for a specific reason. As of the end of the period, banks owned or controlled by Bulgarian entities or individuals are International Asset Bank; CHPB Texim, Central Cooperative Bank; Tokuda bank; TB Investbank; Municipal Bank; First Investment Bank; Bulgarian American Credit Bank, Bulgarian Development Bank. Banks with Bulgarian ownership hold around 20% of the assets as of the end of the period. Banks with foreign ownership own around 80%, of which bank branches account for approximately 1.6% of the bank assets. The four largest banks operating in Bulgaria (United Bulgarian Bank, Unicredit Bulbank, DSK bank, and Eurobank Bulgaria) are owned and controlled by foreign financial groups and control roughly 70% of bank assets.
Table 2 provides the list of bank-specific and macroeconomic indicators. The literature review to a large degree supported the data selection process. The study encompassed variables commonly used in banking and economic analysis. Profitability of individual banks was measured by ROA and ROE for the twelve trailing months (TTM). Specifically, profit for the most recent twelve-month period (four quarters) was divided by the average total assets and average equity, respectively. The CIR variable accounted for operational efficiency, with lower values indicating better cost efficiency. It was calculated as the ratio of operating expenses to net banking income. The net interest margin (NIM) was calculated as the ratio of net interest income to interest-earning assets. The net fee and commission (NFM) was calculated as the ratio between net fees and commission income to interest-earning assets. NIM and NFM were the main sources of net banking income for Bulgarian banks, which operate under a traditional business model. The yield on 10-Year Government Bonds (GYIELD) was the benchmark for long-term interest rates and anchors to some extent lending and deposit interest rates, which are important for the macroeconomy. The natural logarithm of the house price index (HPR) tracks house price dynamics. The unemployment rate (UR) accounts for labor market health and for the capacity utilization in the economy. The dynamics of the LDR can be interpreted as an indicator of banks’ risk-taking appetite and liquidity preferences. The LDR indicator was calculated as the ratio of total loans granted to total deposits received, reflecting the extent to which deposits were used to finance lending activities. The economic growth was represented by the natural logarithm of seasonally adjusted quarterly real GDP figures (GDP). The cash-to-assets ratio (CASHR) is indicative of the liquidity position and for the risk aversion of the bank. The CASHR variable was calculated as the ratio of cash and cash equivalents to total assets, measuring the share of highly liquid funds available to the bank relative to its total asset base. The loan-loss-to-loans ratio (LLR) measures credit risk and asset quality. The LLR variable was calculated as the ratio of loan loss provisions to total gross loans, measuring the extent of expected credit losses relative to the bank’s total lending portfolio. The mix of selected variables provided a comprehensive view of financial stability, profitability, and macroeconomic conditions and was in line with literature review and logical inference.
Table 2.
Variables.
It is standard practice in empirical research on banking system indicators to combine variables expressed in natural logarithms—such as bank size (measured by total assets), gross domestic product (GDP), monetary aggregates, and other monetary values—with variables expressed as ratios and interest rates (Albertazzi & Gambacorta, 2009; B. P. Athanasoglou et al., 2006; P. P. Athanasoglou et al., 2008; Căpraru & Ihnatov, 2014; García-Herrero et al., 2009; Koetter & Poghosyan, 2010; Killins, 2000; Sufian & Chong, 2008; Peshev & Stamenova, 2025). This approach reflected the distinct statistical properties and economic interpretation of scale variables, which were appropriately modeled in logarithmic form, and proportional or rate-based indicators, which retained their natural interpretation when expressed as percentages or ratios.
Accordingly, this study employed a semi-logarithmic specification in which the dependent variable was expressed as a ratio, while the explanatory variables consisted of a combination of financial and macroeconomic indicators introduced as rates, ratios, and natural logarithms. In this framework, the estimated coefficients on logarithmic explanatory variables had a semi-elasticity interpretation: a 1% increase in GDP or in the house price index led to a change in the dependent variable—such as return on assets (ROA) or return on equity (ROE)—equal to one-hundredth of the corresponding coefficient, expressed in percentage points (pp). By contrast, for explanatory variables expressed as ratios or rates, a one percentage point increase (i.e., an absolute increase of 0.01) resulted in a change in the dependent variable equal to the estimated coefficient multiplied by 0.01 pp. This specification facilitated a consistent and economically meaningful interpretation of coefficients across variables measured in different functional forms.
Usually, financial and macroeconomic variables exhibited time-varying statistical properties, such as the mean, median, and variance. Varying statistical features signaled that variables were non-stationary at levels and had unit roots. The data of the study were tested for the presence of unit roots. The panel unit root tests applied in the study included Levin, Lin, and Chu (LLC), ADF-Fisher, Im–Pesaran–Shin (IPS) of Im et al. (2003), cross-sectionally augmented IPS (CIPS) test of Pesaran (2007), and PP-Fisher tests. The results of the unit root tests, along with the correlation analysis and descriptive statistics, are presented in the following section.
The PMG-ARDL approach of Pesaran et al. (1999) deals well with a combination of I(0) and I(1) variables. This method is well suited for panel data with variables integrated of different orders, as long as none are I(2).
where
- Δyit is the change in the dependent variable (ROA or ROE) for the i-th cross-sectional unit (bank) over a period-t;
- Δxit is vector of the changes in the explanatory variables for the i-th cross-sectional unit (bank) over a period-t;
- ϕi is error correction term coefficient for the i-th cross-sectional unit (bank);
- β is common long-run coefficients (assumed homogeneous across groups);
- λij is short-run coefficients for the i-th cross-sectional unit (bank)’s dependent variable with j-lags;
- δij is short-run coefficients for the i-th cross-sectional unit (bank)’s explanatory variable with j-lags;
- μi is group-specific fixed effects, the intercept term for each cross-sectional unit (bank)-I;
- ϵit is the error term for the i-th cross-sectional unit (bank) over a period-t.
The cointegration equation exhibits the long-run equation and is introduced in Equation (2).
where
- yit is the dependent variable (ROA or ROE) for the i-th cross-sectional unit (bank) over a period-t;
- xit is vector of explanatory variables for the i-th cross-sectional unit (bank) over a period-t;
- ηit is the stationary process (the long-run error).
The error-correction term (ECT) employed in the PMG–ARDL short-run equation (Equation (1)) and revealed in Equation (3) is the lagged cointegration residual of Equation (2).
Equation (1) specifies the formal representation of the PMG estimator. The model assumes homogeneity of long-run coefficients across all groups (cross-sections); at the same time, it allows for heterogeneity across short-run coefficients (see Pesaran et al., 1999).
4. Results and Discussion
The current section presents the empirical results of the study. It systematizes the results of the descriptive and statistical analysis of the variables performed, including unit root tests and correlation tests. The section then details the long-run equilibrium relationships and the short-run ones for ROA and ROE models using the PMG-ARDL approach. This section also details the analysis of the short-term error-correction models for each individual bank.
Table 3 and Table 4 present the descriptive statistics based on an individual sample of 1533 for each variable. The profitability results, measured through ROA and ROE, signal high heterogeneity in the results despite being positive on average (see Figure A1 and Figure A2). High standard deviations and kurtosis, particularly for ROE, are perhaps caused by dividend payouts, the impact of financial crises, credit impairments, and economic fluctuations.
Table 3.
Descriptive stat (individual sample).
Table 4.
Descriptive stat (continuation).
The CIR variable displays substantial variability and irregularity, with a maximum of 28.16 and a minimum of −18.96, having high skewness of 8.22 and kurtosis above 310, indicating severe non-normality and large heterogeneity across banks’ operational efficiency.
The net interest margin (NIM) reports a 1% on average per quarter and keeps the margin relatively stable. The kurtosis and skewness statistics, however, indicate that few large banks achieve high margins in specific periods.
The net fee-to-operating-income ratio (NFM) shows considerable heterogeneity across banks. The variable’s high skewness and kurtosis suggest that few banks register high net fee and commission margin, whereas most generate more modest income from this source.
The government bond yield (GYIELD) averages about 3.2%. The skewness and kurtosis capture the transition from high yields in the post-crisis years to low yields during the ECB’s unconventional monetary easing period and the post-2022 increases.
The natural logarithm of the house price index (HPR) shows moderate variation and a slight right-skewed distribution.
Table 4 presents summarized descriptive statistics for the rest of the variables from the dataset. The unemployment rate (UR) variable has an average value of 7.3% and shows moderate variation around the mean, signaling the common cyclical behavior of the Bulgarian labor market over the sample period.
The LDR exerts a considerable deviation from the central tendency, with values spanning between 0.09 and 3.72, and displays considerable positive skewness of 2.94.
The ratio of loan loss provisions to total loans (LLR) is low on average, but outliers probably reflect high credit risk periods during downturns.
The natural logarithm of the real seasonally adjusted quarterly GDP maintains low volatility, as it is the natural logarithm of a trending seasonally adjusted macroeconomic variable.
The Jarque–Bera test statistics and corresponding p-values lead to the rejection of the null hypothesis of normality for all variables, indicating the presence of non-normal distributions and potential outliers.
The panel unit root tests applied in the study include LLC, ADF-Fisher, IPS, CIPS test of Pesaran (2007), and PP-Fisher tests. The results are reported in Table 5. The LLC test assumes a common unit root process, while the ADF-Fisher and PP-Fisher tests allow for heterogeneity. All tests’ results are valid at the 1% level of significance. Using both IPS and CIPS strengthens the empirical strategy by demonstrating that the stationarity results are robust to both independence and cross-dependence assumptions, thereby supporting the validity of the subsequent PMG-ARDL estimation. The panel unit root tests are performed on a balanced panel covering 21 cross-sections and 1 470 observations from the first quarter of 2007 until the first quarter of 2025. The results from the unit root tests in Table 5 reveal the distinction between level-stationary and first-difference stationary variables. Most of the variables are level stationary. The following variables are non-stationary at levels but integrated of one, I(1): HPR, GDP, CASHR, and LDR. The mix of I(0) and I(1) will lead to spurious results if a proper panel econometric technique is not selected. The PMG-ARDL approach of Pesaran et al. (1999) deals well with a combination of I(0) and I(1) variables. This method is well suited for panel data with variables integrated of different orders as long as none are I(2). The PMG-ARDL approach allows for short-run heterogeneity across units while imposing long-run homogeneity. The long-run association, represented by the cointegration equations, is the same for all banks, while short-run dynamics vary among individual banks.
Table 5.
Unit root tests.
The PMG-ARDL approach is also preferred for a mix of I(0) and I(1) data in panels with moderate cross-sections and long-time series (Roodman, 2009; Pesaran et al., 1999).
The correlation matrix in Table 6 shows ROA and ROE do not experience strong positive or negative correlation with other variables. The macroeconomic variables exert strong negative or positive correlations with each other, especially HPR, UR, and GDP, suggesting potential presence of multicollinearity among some of the variables (see Table 7).
Table 6.
Correlation matrix.
Table 7.
Correlation matrix (continuation).
The study follows the procedures of Pesaran and Smith (1995) and Pesaran et al. (1999) to determine the appropriate estimator between the PMG and the mean group (MG) methods. As noted by Blackburne and Frank (2007), panels characterized by a relatively large number of cross-sectional units (N) and time periods (T) as well as non-stationarity and cross-sectional heterogeneity are well suited to the panel ARDL framework of Pesaran et al. (1999). The current study has large N and T features.
Model selection between the PMG and MG estimators is conducted using the Hausman (1978) specification test, which is computed on the vector of long-run slope coefficients. The test statistic H follows a chi-square distribution with k-degrees of freedom, where H∼χ2(k) with k = 10. The long-run coefficients are derived from the PMG and MG estimators on an ARDL (5, 4, 4, 4, 4, 4, 4, 4, 4, 4, 4) specification.
For the baseline specification with ten explanatory variables for the ROA model, the Hausman statistic equals 11.21 with a p-value of 0.341. This indicates the failure to reject the null hypothesis of common long-run coefficients. Consequently, the PMG model is selected. Using the same setup and applying it to the ROE models yields a H-statistic of 8.766, with a p-value of 0.554. The Hausman test fails to reject the null hypothesis of common long-run coefficients in the ROE model; therefore, the PMG model is preferred.
The presence of cross-sectional dependence is examined using Pesaran’s (2004, 2021) cross-sectional dependence (CD) test and Friedman’s (1937) rank-based test, which are employed as complementary diagnostics in line with the recommendations of De Hoyos and Sarafidis (2006). For the ROA model, the cross-sectional dependence tests provide no evidence of strong dependence across cross-sectional units. Specifically, Pesaran’s CD test yields a Z-statistic of 0.287 with a p-value of 0.198, while Friedman’s chi-square statistic equals 82.91 with a p-value of 0.178. Both tests fail to reject the null hypothesis of cross-sectional independence.
Similarly, for the ROE model, Pesaran’s CD test produces a Z-statistic of 0.673 with a p-value of 0.501, and Friedman’s test reports a chi-square statistic of 88.12 with a p-value of 0.100. Taken together, the results consistently indicate the absence of strong cross-sectional dependence. Accordingly, the analysis proceeds under the assumption of cross-sectional independence, supporting the application of the PMG–ARDL framework of Pesaran et al. (1999).
Bardi and Hfaiedh (2021) use panel macro econometric regression applying the PMG-ARDL approach without having a cross-dependent data concern since it is common the same macroeconomic variables to affect cross-sectional units. Bardi and Hfaiedh (2021) combine a mix of rates, ratios, numerical values, and monetary variables.
The following subsections of the Results and Discussion section presents the results of the long-run and short-run interdependencies of the applied PMG-ARDL approach of Pesaran et al. (1999).
4.1. Long-Run Equations
Table 8 provides the results of the error-correction equations revealed in current section. These cointegration equations reveal the long-run interdependence between the dependent and explanatory variables, following the methodology specified in the Section 3. Equation (4) reveals the long-term relationship between the dependent variable (ROA) and the explanatory variables. All variables have p-value below 0.01 and are assumed to be significant at the 1% level of significance.
ROAit = −0.005CIRit + 0.683NIMit + 1.352NFMit + 0.359GYIELDit − 0.077HPRit
− 0.177URit + 0.014LDRit + 0.221GDPit − 0.030CASHRit − 0.266LLRit + ηit
− 0.177URit + 0.014LDRit + 0.221GDPit − 0.030CASHRit − 0.266LLRit + ηit
Table 8.
Long-run equations (error-correction equations).
Note that all variables are significant at the 1% level of significance.
The other profitability measure approximated by the ROE dependent variables is presented in Equation (5). The equation reveals the long-term relationship between the dependent variable (ROE) and the explanatory variables. All variables are statistically significant at the 1% level, with the exception of NFMit, LLRit, URit, and CASHRit, which do not reach significance at this threshold. In contrast, the LDRit is not statistically significant, as its p-value exceeds 0.30.
ROEit = −0.09CIRit + 9.30NIMit − 24.353NFMit + 6.268GYIELDit − 1.3575HPRit −
0.793URit − 0.067LDRit + 4.30GDPit + 0.202CASHRit + 1.42LLRit + ηiit
0.793URit − 0.067LDRit + 4.30GDPit + 0.202CASHRit + 1.42LLRit + ηiit
Note that all variables are significant at the 1% level of significance except NFMit, CASHRit, URit, LLRit, which are significant at the 5% level of significance, while LDRit and are insignificant at the 5% level, with p-values considerably above the 0.33 level.
The results of the ROA equation suggest that all coefficients are statistically significant. The dependent variable (ROA) relates negatively with the CIR variable, CASHR, LLR, and the UR and the HPR variable. The NIM, NFM, GYIELD, LDR, and the GDP are positively related to the dependent variables.
Using the same set of explanatory variables as in the ROA specification, with ROE as the dependent variable, largely confirms the findings obtained from the ROA model (see Table 8). The coefficients on NFM, UR, CASHR, and LLR are only weakly significant, reaching significance at the 5% level. In contrast, the LDR variable remains statistically insignificant, with p-values exceeding 0.30. The dependent variable (ROE) exhibits a negative relationship with the CIR variable at the 1% level of significance, with the UR variable at the 5% level, and with the HPR variable at the 1% level. In contrast, the LDR variable is statistically insignificant, with p-values exceeding 0.30. The coefficient on NFM is statistically significant at the 5% level but not at the 1% level. Although NFM is theoretically expected to enhance bank profitability, its negative sign and relatively low level of statistical significance suggest that this effect should be interpreted with caution, particularly as it contradicts the results obtained from the ROA model.
It is clear from these long-run findings that the NIM, GYIELD and the GDP have a positive relationship with the ROE (dependent) variables and confirm the findings of the ROA model.
It could be summarized that the negative association between CIR and the profitability measures indicates that inefficiency in operations deteriorates bank profitability.
NIM supports bank profitability, especially banks with a traditional business model, such as that of Bulgarian banks. NFM is the other main source for bank profitability for the case of the ROA model. However, the variable is statistically insignificant in the ROE model. For traditional banks, lending activity and charging fees and commissions are the main sources of bank income and profitability. Higher bond yields—GYIELD—improve ROE probably since bond yields are indicative of the rate on loans. On the other hand, higher house prices—HPR—may signal overheating in the housing market, increasing risk and realizing it leads to lower profitability. Higher UR significantly reduces ROE, and lower extends ROA, likely due to larger credit risk and lower economic activity. The GDP positively affects bank profitability in both models. The LDR variable has a positive relationship with the ROA dependent variable and has no relationship with the ROE model, indicating that risk-taking generates bank profitability and confirms the negative relationship between the CASHR variable and the ROA dependent variable.
The Kao (1999) residual-based cointegration test is applied to examine whether a long-run equilibrium relationship exists among the variables included in the ROA and ROE panel models. The results are summarized in Table 9 and indicate strong evidence of cointegration for both models, though the ROA model displays higher t-stat. The Kao cointegration test employs an Augmented Dickey–Fuller (ADF) statistic applied to the residuals from the panel regression. The p-value of the t-stat for the ROA and ROE models is significant at 1%. The negative coefficient of RESID(−1) and D(RESID(−1)) display the speed of adjustment toward the long-run equilibrium, i.e., 25% of the deviation is correct each quarter for the ROA model and 94% for the ROE model.
Table 9.
Kao residual cointegration tests.
4.2. Short-Term Interdependencies
The present sub-section analyzes the short-run error-correction models, revealed in Equations (6) and (7), together with Table 10.
Table 10.
Short-run models’ results.
The lag-lengths in the ARDL specification were determined using an automatic selection procedure based on the Akaike Information Criterion (AIC). Given the structure of the dataset, with a time dimension of T = 73 and N = 21 cross-sectional units and a relatively high number of explanatory variables (10 regressors), the Akaike Information Criterion (AIC) is the most appropriate choice for selecting lag lengths in a PMG-ARDL specification. AIC applies a lighter penalty for additional parameters than BIC or HQ, which is advantageous in dynamic models like PMG-ARDL (see Kripfganz & Schneider, 2023). The estimation routine evaluated 20 admissible ARDL(p, q1,…, qk) combinations within these limits using a common selection sample, and selected the model with the lowest AIC, namely ARDL(5, 4, 4, 4, 4, 4, 4, 4, 4, 4, 4).
Equation (6) reveals the short-term dynamics between the change in ROA and its regressors, which are statistically significant at the 1% and 5% level of significance respectively.
ΔROAit = −0.146ECTi,t−1 + 0.125ΔROAi,t−1 + 0.081ΔROAi,t−2 + 0.005ΔCIRit −
0.004ΔCIRi,t−1 − 0.004ΔCIRi,t−2 − 0.006ΔCIRi,t−3 − 0.073ΔGYIELDit + 0.014ΔCASHRi,t−2
− 0.466ΔLLRit − 0.278 + ηit
0.004ΔCIRi,t−1 − 0.004ΔCIRi,t−2 − 0.006ΔCIRi,t−3 − 0.073ΔGYIELDit + 0.014ΔCASHRi,t−2
− 0.466ΔLLRit − 0.278 + ηit
Note that all variables are significant at the 1% level of significance except D(ROA(-2)), D(CIR(-2)), D(GYIELD), and D(CASHR(-2)), which are significant at the 5% level of significance.
On the other hand, Equation (7) presents the short-term interdependencies between the change in ROE and its explanatory variables, which are statistically significant at the 1% and 5% level of significance, respectively.
ΔROEit = −0.284ECTi,t−1 + 0.215ΔROEi,t−1 + 0.147ΔROEi,t−2 − 10.56 + ηit
Note that all variables are significant at the 5% level of significance except D(ROA(-1)), which is significant at the 1% level of significance.
The short-term models, where the dependent variables are the first differences of both profitability measures, ROA and ROE, reveal a strong interdependence between past values of the dependent variable and current values. This fact suggests that a strong momentum process is underway (see Table 10). Past values of profitability influence current profitability, but the effect fades away over time. A one percentage point (pp) change in the past value (one and two quarters lag) of the change in ROE leads to 21.5% (one quarter lag) and 14.7% (lag of two quarters) change in the change in ROE, respectively.
The CIR is negatively associated with the change in ROA, and one pp change in the D(CIR) variable leads to 0.5% decline in the dependent variable, while the D(CIR(-1)) variable leads to a 0.4% decline of the dependent variable. In similar magnitude is the effect of the second and third lag of the variable on the dependent variable (see Table 10). Operational inefficiencies in the short run harm short-term performance of commercial banks in Bulgaria.
The short-run results laid out in Table 10 reveal that a one pp increase in the change of loan losses-to-loans ratio (the LLR variable) reduces ROA by 46.7%, implying a strong negative impact. Loan loss impairments deteriorate bank profitability, as the logic states.
The rise in government bonds (the GYIELD variable) is inversely related to the short-term change in the profitability, possibly reflecting opportunity cost or channeling macroeconomic slowdown due to rising bond yields. Higher bond yields trigger down bond prices and the value of banks’ bond portfolio, which might be a factor for overall lower profitability, especially for banks with large bond portfolios. A one pp change of the GYIELD rate leads to 7.3% decline in the change ROA in the short term (see Table 10).
The change in the liquidity measure CASHR with two lags supports short-term profitability but contradicts long-term results. A one pp change in the ratio leads to 1.2% increase in the short-run change of ROA.
Both ECT coefficients are negative and significant at the 1% level of significance for the ROA model and at the 5% for the ROE model. The ROA model corrects 14.6% of its disequilibrium each quarter, while the ROE model adjusts more strongly, with 28.4% disequilibrium corrected each quarter. The speed of adjustment is faster for the ROE model, even though the p-value for the ECT of the model is 0.03 in comparison to 0.00 for the ROA model.
The constant of the model is statistically significant at the 1% level of significance for the ROA model and at the 5% level of significance for the ROE model. Both coefficients are negative, and the value of −0.278 of the ROA model reveals small negative bias. The much larger negative constant for the ROE model of −10.56 may indicate structural downward pressure of omitted variables or even misspecification for the latter model.
More variables of the ROA model are significant in comparison to the ROE model, favoring the explanatory power of the ROA model.
As can be seen at Table 11, the log-Likelihood measure is much higher for the ROA model giving preferences for the higher goodness-to-fit of the model, almost twice as high as the ROE model’s value. The value of the Akaike Info Criterion, Schwarz Criterion and Hannan–Quinn Criterion are times lower for the ROA model, justifying the model superiority. The ROA model has much tighter residuals, hinting it is more precise. On other hand, the ROE model has larger dispersion of the dependent variable and much higher overall error, measured through the sum squared residuals.
Table 11.
Summarized statistics and goodness-to-fit stats.
4.3. Individual Banks’ Short-Run Results
4.3.1. ROA Models (at the Bank Level)
The cointegration equation in the applied in the study PMG-ARDL Pesaran et al. (1999) model is common for all banks, while the approach allows for identifying individual short-term models for the banks comprising the panel. Short-term individual banks’ ROA models are revealed in Table A1 and Table A2 in Appendix A. Equation (4) represents the cointegration relationships and serves as the ECT.
All banks’ ECTs exhibit a negative relationship with the dependent variable, reducing system disequilibrium each quarter except for ING Bank N.V.-Sofia Branch (bank ID 145), CHPB Texim (bank ID 545), and Allianz Bulgaria Commercial Bank (bank ID 561) (see Table A1 in Appendix A). The latter three banks increase their disequilibrium with each quarter, justified by their positive coefficient. The average coefficient of the ECT accepts the value of −0.153, meaning that on average, 15.3% of banks’ disequilibrium is reduced each quarter (for banks with available coefficients). The highest speed of adjustment is observed for the City Bank Europe-Bulgaria branch (ID: 250), TBI Bank (Former NLB Bank West-East) (ID: 310), and Bulgarian Development Bank (former Nastarchitelna Bank) (ID: 620), which correct between 46% and 52% of their disequilibrium each quarter.
The lagged ROA variables D(ROA (-1)), D(ROA(-2)), and D(ROA(-3)) reveal positive average effects (0.132, 0.089, and 0.052, respectively), implying that past profitability is a factor for current profitability, highlighting the momentum effect in profitability (see Table A1 in Appendix A). For some of the banks, one of the lagged variables may have a negative effect, but the mean and average values justify it. The D(ROA(-4)) has a negative coefficient value on average for all banks but is not invalidating the positive effects of previous three lags.
The average coefficients for D(CIR) and its lags range between approximately −0.006 and −0.004 (more precisely, from about −0.006 to −0.004, depending on the lag), with a high proportion of zero or negative values across banks. These results suggest that increases in operational inefficiency tend to have a modest negative impact on short-run performance, as can be seen at Table A1 in Appendix A. One unit change of the CIR ratio (current and lagged values) leads to about 0.4–0.6% decline in profitability on average across all presented lagged values.
The short-run impact of the change in the NIM variable on the profitability reveals that the change in the NIM variable in the current quarter (D(NIM)) and the first quarter has negative average values of −0.096 and −0.053, respectively, but the median values are positive (0.096 and 0.106, respectively), meaning that 7 out of 19 banks with available coefficients showed positive coefficients in the current quarter. Banks with following IDs have short-run negative effects: 120, 150, 250, 350, 470, 620, and 660. Almost the same seven banks demonstrate negative effects with the dependent variable in the one-quarter lag, while six banks experience negative effects in lag-two and five banks experience negative effects in lag three (out of the banks with available coefficients). For most of the banks, there is a positive association between the NIM variable and the dependent variable.
The NFM variable has a positive effect on the dependent variable in the current quarter and in the third quarter-lagged variable in the sense of positive average and median value. The NFM coefficients are statistically significant for much less banks, but the magnitude and the number of quarters with positive coefficients of the explanatory variable prevail considerably. Banks with the following IDs have short-run negative effects (in at least one of the reported quarters, where coefficients are available): 130, 145, 150, 240, 250, 350, 440, 545, and 920. It could be concluded, the NFM is in favor of higher short-term profitability.
The current change in government bond yields (D(GYIELD)) showed a predominantly negative impact, with an average coefficient of −0.094 and median of −0.051 and 13 out of 18 banks with available coefficients maintaining negative relationship with the dependent variable. This suggests that rising yields tend to reduce bank performance in the short run, potentially due to valuation losses on bond holdings or increased funding costs. The first lag of the variable has negative mean and positive median effects, with 11 banks showing positive coefficients and 9 experiencing negative interdependencies (out of banks with available coefficients). The second lag of the first-differenced government bond yield, D(GYIELD(-2)), demonstrates a positive relationship with the dependent variable based on its positive mean and median values. Conversely, the third lag, D(GYIELD(-3)), is characterized by negative mean (−0.021) and median (−0.048) values, suggesting an inverse relationship. Government bonds have mixed meaning for individual banks. Banks with predominantly negative effects are City Bank Europe-Bulgaria branch (ID 250), Tokuda Bank (ID 260), BNP Paribas S.A.—Sofia branch (ID 440), and Allianz Bulgaria Commercial Bank (ID 561), as can be seen from Table A2 in Appendix A. Banks that hold a large share of government bonds as their assets may experience lower profitability due to higher government bond yields, which move in the opposite direction with bond valuations.
The change in housing prices (D(HPR)) and its lags demonstrate relatively mild effects. The current quarter’s change has a negative mean of −0.030 and negative median of −0.008 (see Table A2 in Appendix A). However, the lagged terms, D(HPR(-1)), D(HPR(-2)), and D(HPR(-3)), exhibit small average values (0.0002, 0.018, and 0.009, respectively), while most banks continue to display a positive relationship with the profitability dependent variable within the lagged framework. Higher house prices stimulated bank profitability in the short run, likely due to improved collateral values and reduced credit risk.
The unemployment rate, D(UR), demonstrates a negative effect on the dependent variable, in the current period and in lags D(UR(-1)) and D(UR(-2)). These findings indicate that rising unemployment tends to deteriorate bank performance, likely due to poorer credit quality and reduced loan demand. On the contrary, the third lag, D(UR(-3)), has a positive average value of 0.013 and a positive median value, as can be seen from Table A2 in Appendix A.
Lending growth outpacing deposit growth supports short-term profitability of banks, justified by the positive association between the change in ROA and current and lagged values of the D(LDR) variable. The LDR can also be considered as an indicator for risk-taking appetite, being positively related. The average and median coefficients for the current and first two lags are small but positive, as can be seen from Table A2 in Appendix A.
The short-run association between the GDP growth and the ROA varies and is heterogeneous among banks. The current change in the D(GDP) has a tiny positive mean coefficient, while D(GDP(-3)) has a near-zero mean (slightly negative). Economic activity stimulates bank profitability and reduces credit risk and loan loss impairments, but the size of the coefficients suggests a very small impact and an almost-balanced distribution of banks with positive and negative effects. The first and second lags of the economic growth variable D(GDP(-1)) and D(GDP(-2)) exhibit negative mean effects. The following banks have the largest negative short-term effects: TB Investbank (ID 120), City Bank Europe-Bulgaria branch (ID 250), TBI Bank (Former NLB Bank West-East) (ID 310), and Bulgarian Development Bank (Former Nastarchitelna Bank) (ID 620). The activity of these smaller and special case banks probably does not depend on the economic growth in the current period, and bank ID 250 and 310 especially may step in and increase their activity and profitability due to their specialty in the short run.
The liquidity indicator (D(CASHR)) and its lags predominantly demonstrate positive effects despite a smaller magnitude, judging by the small-coefficient values. This finding suggests that maintaining higher liquidity buffers tends to support profitability, contradicting the fact that cash holdings yield low returns. Higher liquidity triggers lower funding costs, increases shock absorption ability, and gives banks the opportunity to find good and effective lending opportunities. In general, one pp change in the ratio leads to about 1% change in the dependent variable. Largest positive effect comes from TBI Bank (Former NLB Bank West-East) (ID 310), Bulgarian Development Bank (ID 620), BNP PARIBAS S.A.—SOFIA branch (ID 440), Tokuda Bank (ID 260), and TE-DZHE Zirat Bank-Sofia branch (ID 350), while the largest negative effect exhibits CHPB Texim (ID545).
Loan loss impairments play a crucial role in the short term, according to the results of the ROA model. The D(LLR) exhibits a strong negative effect on the change in ROA, in the current, second (D(LLR(-2))), and the third lag (D(LLR(-3))). The current value of the variable has sharply negative effect, with a mean of −0.49 and median of −0.41. The negative effect fades away with the second and third lag, with a mean of −0.09 and −0.02, respectively. The first lag (D(LLR(-1))) has a positive effect of 0.08 on average and a median value of 0.09. The results justify the hypothesis that losses related to materialized credit risk deteriorate profitability, but the effect weakens over time. This confirms that maintaining strong credit standards and early risk detection are essential for short-run bank profitability.
The negative intercept, with a mean of −0.29 and a median of −0.22 suggests that the short-run change in the ROA variable tends to be slightly negative in the short run, ceteris paribus. Structural factors in the banking sector such as narrow interest margins, high operational costs, or competitive pressures may be in force for deteriorating profitability if all else is kept equal. Without doing business and reporting net interest and fee incomes and without favorable macroeconomic imbalances, banks’ ROA will shrink due to running costs. For three of the banks, there is positive constant, meaning that for their short-term profitability, it is better that their bank-specific and macroeconomic factors did not change. For those banks the positive intercept is associated with positive ECT, violating the cointegration justification.
The study also differentiates bank performance in terms of ROA by local and foreign ownership. Bulgarian-owned banks—including International Asset Bank, CHPB Texim, Central Cooperative Bank, Tokuda Bank, TB Investbank, Municipal Bank, First Investment Bank, Bulgarian American Credit Bank, and Bulgarian Development Bank—hold approximately 20% of banking system assets, while foreign-owned banks account for roughly 80%. Bulgarian-owned banks demonstrate slightly weaker adjustment dynamics compared to foreign-owned banks, although both groups follow similar general patterns.
Foreign-owned banks generally demonstrate larger ECT coefficients in absolute terms, indicating faster adjustment toward long-run equilibrium profitability. This reflects their stronger capitalization, superior access to funding, and more efficient risk management.
Short-run changes in NIM have a stronger positive impact on ROA in foreign-owned banks, especially in longer lags. This indicates that net interest income plays a more pronounced role in profitability for foreign-owned banks. These banks benefit from lower funding costs, stronger reputation, and access to international capital markets, allowing them to maintain more stable and wider interest spreads.
Changes in GYIELD and UR generally exert stronger adverse impact on ROA for Bulgarian-owned banks, implying that locally owned banks are more vulnerable to macroeconomic shocks. Similarly, changes in LLR exhibit stronger negative effects for Bulgarian-owned banks, reflecting greater sensitivity to credit risk materialization. This suggests that domestically owned banks are more exposed to local economic conditions and possess lower capacity to absorb credit risk shocks compared to foreign-owned institutions.
4.3.2. ROE Models (at the Bank Level)
The present section analyzes short-term results of the PMG-ARDL model applied in the study. The cointegration equation is common for all banks, while the approach allows for identifying individual short-term models for the banks comprising the panel. The short-term ROE models of individual banks are revealed in Table A3 and Table A4 in Appendix B.
As in the ROA models discussed above, the error correction terms (ECTs) for almost all banks exhibit a negative relationship with the dependent variable, indicating a quarterly adjustment toward restoring long-run equilibrium. The only exceptions are Bulgarian-American Credit Bank (bank ID 160), CHPB Texim (bank ID 545), and Allianz Bulgaria Commercial Bank (bank ID 561), whose ECTs do not display this expected adjustment pattern (see Table A3 and Table A4 in Appendix B). These three banks have positive ECT coefficients (+0.005, +0.013, and +0.045, respectively) and increase their disequilibrium with each quarter passed. The average coefficient of the ECT accepts the value of −0.278, meaning that on average, 27.8% of banks’ disequilibrium is reduced each quarter. The highest speed of adjustment is observed for the BNP Paribas S.A.—Sofia branch (ID: 440; ECT = −2.267), City Bank Europe-Bulgaria branch (ID: 250; ECT = −1.506), and ING Bank N.V.—Sofia branch (ID: 145; ECT = −0.960), which correct between 96% and 227% of their disequilibrium each quarter, indicating extremely fast adjustment toward equilibrium.
The short-term effect of lagged first differences of the return on equity (ROE) variable on the change in ROE in the current period is positive for the three lags. The average coefficients accept values of approximately 0.214, 0.152, and 0.071, respectively, implying that past profitability positively influences current profitability. Banks that increased ROE last quarter tend to experience continued short-run profitability improvements, though a few banks exhibit negative values, indicating temporary reversals. The positive effect is strongest in the first and second lags, but it starts fading away in the third quarterly lag. The dependent variable displays inertia since a +1 pp ROE shock currently increases future ROE cumulatively over the next quarters. The fifth-quarter lag of the dependent variable, D(ROE(-4)), demonstrates a weak and slightly negative average effect, with a mean coefficient of −0.027 and a median value of −0.086, based on 19 banks with available coefficients. This indicates that profitability shocks are largely absorbed within one year, and their persistence beyond four quarters becomes limited and unstable. The negative average coefficient suggests partial reversal of earlier profitability shocks, reflecting mean-reverting behavior in bank equity returns. Overall, the fifth-quarter lag confirms that ROE persistence weakens substantially after one year, supporting the conclusion that bank profitability adjusts toward equilibrium within four quarters.
The average coefficients for D(CIR) and its lags range between approximately −0.058 and −0.041, confirming that increases in operational inefficiency tend to have a negative impact on short-run performance, as can be seen at Table A3 and Table A4 in Appendix B. A one pp increase in the CIR ratio leads to an approximately 0.4–0.6% decline in profitability, confirming the importance of operational efficiency for bank performance.
In comparison to the ROA models, the ROE models with significant NIM link are fewer, and the results vary considerably, as can be seen in Table A3 and Table A4. In general, the changes in the net interest margin, D(NIM), generate large but inconsistent effects. Coefficients range from strongly negative to strongly positive values across banks. Banks exhibiting the strongest positive association include the BNP Paribas S.A.—Sofia branch (ID 440), the City Bank Europe-Bulgaria branch (ID 250), and TBI Bank (ID 310). Some banks exhibit negative association, indicating heterogeneity in interest income dynamics and balance sheet structures.
The first difference in government bond yields, D(GYIELD), along with its lagged terms, shows a predominantly negative relationship with D(ROE), with the contemporaneous explanatory variable having an average coefficient of −0.340. This suggests that increases in government bond yields might lead to higher interest rates on deposits and loans and can increase credit risk and profitability, probably also due to lower valuation of held bond portfolios or reducing loan demand. Banks with the strongest negative sensitivity include the BNP Paribas S.A.—Sofia branch (ID 440), the City Bank Europe-Bulgaria branch (ID 250), and Unicredit Bulbank (ID 660).
Changes in the Log of the House Price Rate (D(HPR)) and its lags have mixed effects on D(ROE). The current and first lag exhibit weak or slightly negative average effects, while the third lag demonstrates a positive impact, confirming that higher house prices support profitability through improved collateral values and reduced credit risk.
The change in the unemployment rate (D(UR)) shows a negative average effect across most lags, confirming that rising unemployment deteriorates profitability due to worsening credit quality and reduced economic activity. This relationship is particularly strong for smaller domestically owned banks such as TB Investbank (ID 120) and International Asset Bank (ID 470).
It could be summarized that in comparison to ROA, ROE models exhibit greater coefficient volatility and stronger sensitivity to bank-specific and macroeconomic shocks. This reflects the leverage nature of ROE and its higher sensitivity to financial and operational conditions.
The D(GDP) and its lags show mixed effects, with average coefficients close to zero. Current and first lags show weak positive association, while second and third lags demonstrate weak negative association. The largest negative effects are observed for TBI Bank (ID 310) and TB Investbank (ID 120), reflecting the specific business models of smaller banks.
Changes in CASHR and LDR generally show a mildly positive relationship with D(ROE), confirming that stronger liquidity and higher intermediation support profitability. However, the magnitude of coefficients remains small, indicating secondary importance relative to credit risk and efficiency factors.
Loan loss provisions (LLR) exert a strong and economically significant negative impact on short-run ROE. The contemporaneous coefficient D(LLR) has a large negative mean of −3.546 and median of −3.161, confirming that credit risk materialization immediately and substantially reduces profitability. The strongest negative effects are observed for Allianz Bulgaria Commercial Bank (ID 561; −8.086), Procredit Bank (ID 230; −6.936), and Eurobank Bulgaria (ID 920; −6.161). The first lag (D(LLR(-1)) shows a positive average effect (mean of 0.540), indicating partial recovery after initial provisioning, with the largest positive effect again for Allianz Bulgaria Commercial Bank (ID 561; +3.306), while CHPB Texim (ID 545; −2.336) shows the largest negative delayed impact. The second and third lags, D(LLR(-2)) and D(LLR(-3)), exhibit moderate negative average effects (−0.220 and −0.324, respectively), confirming that credit loss shocks gradually weaken but may persist up to one year. Overall, the results confirm that LLR is the most important short-run determinant of ROE, with large immediate negative effects followed by gradual adjustment and partial recovery and substantially higher sensitivity observed across domestically owned and higher-risk banks.
The intercept coefficient is significant for 13 out of 21 banks, and most intercepts are negative, averaging around −2.7, indicating that ceteris paribus, the profitability is set on a declining path. Only a few banks show slightly positive constants.
Comparing the ROA and ROE PMG-ARDL models reveals a clear divergence in how the two indicators respond to bank-specific and macroeconomic shocks. The ROA models exhibit lower volatility in coefficients and coefficients of lower value. In the ROE models, coefficients are more volatile and more sensitive to changes in macroeconomic and bank-specific factors.
ROE models to a larger extent support the conclusions for the ROA models for identifying differences between locally owned and foreign-owned banks’ short-term dynamics. ROE models confirm the conclusions for the ROA models regarding ownership structure differences. Foreign-owned banks such as Unicredit Bulbank (ID 660), DSK Bank (ID 300), United Bulgarian Bank (ID 200), and BNP Paribas S.A. branch (ID 440) demonstrate faster adjustment toward equilibrium, justified by larger absolute ECT coefficients.
The change in CIR has a stronger negative impact on ROE for foreign-owned banks, reflecting their stronger operational efficiency discipline.
Short-run changes in NIM have stronger and more consistent positive effects for foreign-owned banks, reflecting their superior funding access and balance sheet management.
As in the ROA models, changes in GYIELD and UR exert stronger adverse impact on Bulgarian-owned banks, implying higher vulnerability to macroeconomic shocks. Similarly, the change in LLR has a stronger negative impact on Bulgarian-owned banks’ ROE, confirming their higher sensitivity to credit risk materialization and weaker shock absorption capacity.
5. Conclusions
This study investigates the determinants of profitability of Bulgarian commercial banks over the period from the first quarter of 2007 to the first quarter of 2025, using quarterly panel data and a dynamic econometric framework. The empirical analysis follows a structured methodological procedure, including descriptive analysis, panel unit root testing, cross-sectional dependence diagnostics, model selection using the Hausman test, and an estimation of long-run and short-run relationships using the pooled mean group autoregressive distributed lag (PMG-ARDL) estimator. This approach is particularly appropriate given the presence of both stationary and non-stationary variables and the need to jointly estimate long-run equilibrium relationships and heterogeneous short-run dynamics across banks.
The results confirm the existence of stable long-run equilibrium relationships between bank profitability and its determinants. In the long run, profitability, measured by both return on assets (ROA) and return on equity (ROE), is positively influenced by net interest margin, government bond yields, loan-to-deposit ratio, and economic growth, reflecting the importance of core banking income, favorable macroeconomic conditions, and efficient balance sheet utilization. Conversely, operational inefficiency, unemployment, higher cash holdings, house price dynamics, and loan loss provisions exert negative effects on profitability, highlighting the role of cost discipline, credit risk management, and macroeconomic stability.
The short-term dynamics reveal that a strong error correction is underway for both profitability models, ROA and ROE, respectively. Each quarter, the ROA model corrects for 14.61% of its disequilibrium, while the ROE model reduces the equilibrium by 28.4%. Short-run profitability dynamics also exhibit strong persistence, with past profitability exerting a positive and statistically significant influence on current profitability. At the same time, increases in operational costs, credit risk materialization, and adverse macroeconomic developments negatively affect short-run performance.
Importantly, the PMG-ARDL framework enables the identification of heterogeneous short-run dynamics at the individual bank level. Some banks demonstrate high sensitivity to costs or unemployment, others to bond yields or loan losses. A couple of banks show positive error-correction coefficients, showing their divergence from long-run equilibrium. The ECT divergence is likely caused by unique business models or structural characteristics. Coefficients of bank branches and smaller banks often are among the outliers, even diverging from the central tendencies for the panel. Larger banks demonstrate more consistent behavior. Overall, the ROA model reveals stronger explanatory power than the ROE model, confirmed by higher log-likelihood, lower information criteria, and residuals dynamics. Selected methodology also allows segregating short-term profitability by type of ownership. Foreign owned banks adjust faster to equilibrium and are more resilient to macroeconomic shocks and their profitability depends on the core banking income, namely the NIM. Local banks are more sensitive to materialized credit risk. Materialized credit risk has bigger negative impact on profitability for locally owned banks.
The findings in the study have practical implications for regulators, bank managers, analysts, and policymakers. The coefficients of the explanatory variables can help in calibrating the correct measures for supporting bank profitability. Banks with Bulgarian ownership must be subject to stricter supervision during boom times and larger support during economic challenging times. The higher sensitivity of the profitability of banks with Bulgarian ownership to credit risk, cost inefficiencies, and macroeconomic conditions underline the need for improved cost controls, provisioning policies, and appropriate credit risk management.
Overall, the methodological framework applied in this study—combining panel unit root tests, cross-sectional dependence diagnostics, Hausman specification testing, and PMG-ARDL estimation—provides robust and consistent empirical evidence on the determinants of bank profitability in Bulgaria. The findings confirm that bank profitability is driven by a combination of structural bank-specific characteristics and macroeconomic conditions, with both long-run equilibrium relationships and heterogeneous short-run adjustment processes playing a critical role.
The analysis performed in present scientific article distinguishes from existing literature by providing new empirical evidence on the bank profitability dynamics across different phases of the business cycle. The novelty of the study is measured in several dimensions. The time span covers the structural breaks of global financial crisis, local banking crisis, the COVID-19 pandemic, global high-inflation period, and monetary tightening using quarterly data. The combination of bank-specific and macroeconomic variables is customized for the Bulgarian commercial banks, together with the applied methodology, and can be considered in the analysis of small and open economies. The identified long-term and short-run dynamic equations, together with analyzing individual bank dynamics through the PMG-ARDL framework, allows the study to stand out in empirical banking literature.
Despite the contributions, the study has the following limitations. First, the analysis is constrained by data availability. Banks without complete data for the whole period were excluded from the research. Second, the ARDL-PMG framework captures both short- and long-term dynamics, but it does not explicitly distinguish structural breaks caused by various national and international events. Third, the ownership classification is as of the end of the period and does not fully capture potential changes in ownership, control, and management over time.
Future research could address these limitations by explicitly testing for structural breaks at both the aggregate and individual bank levels, for example, through the inclusion of appropriately specified dummy variables. In addition, further investigation of the relationship between bank ownership structure, performance, and risk-taking behavior would provide valuable insights into the mechanisms underlying profitability dynamics. Expanding the sample period and incorporating additional banks excluded due to data constraints would also enhance the robustness and generalizability of the findings, allowing for a more comprehensive assessment of profitability determinants in the banking sector.
Funding
This work was financially supported by the UNWE Research Programme (Research Grant No. 29/2025/A).
Institutional Review Board Statement
Not applicable.
Informed Consent Statement
Not applicable.
Data Availability Statement
Data is available upon request.
Acknowledgments
Following the second revision of this manuscript, generative artificial intelligence tools (ChatGPT ver.5.2., OpenAI, San Francisco, CA, USA) were used to improve the clarity, coherence, and linguistic quality of selected parts of the text. The author retained full responsibility for the study’s conception, research design, methodology, data collection, empirical analysis, interpretation of results, and conclusions. The AI tool was used solely for language editing and stylistic refinement.
Conflicts of Interest
The author declares no conflicts of interest. The funders had no role in the design of the study; in the collection, analyses, or interpretation of data; in the writing of the manuscript; or in the decision to publish the results.
Abbreviations
The following abbreviations are used in this manuscript:
| ARDL | Autoregressive distributed lags |
| CASHR | Cash-to-assets ratio |
| CD | Cross-sectional Dependence |
| CEE | Central and Eastern European |
| CIR | Cost-to-income ratio |
| ECB | European Central Bank |
| ECT | Error-Correction Term |
| EU | European union |
| FE | Fixed effects |
| GDP | Gross domestic product |
| LDR | Loans-to-deposit ratio |
| LLR | Loan-loss-to-loans ratio |
| NIM | Net interest margin |
| NFM | Net fee and commission margin |
| PMG | Pooled Mean Group |
| pp | Percentage point |
| PMG-ARDL | Pooled Mean Group—Autoregressive Distributed Lag |
| QE | Quantitative easing |
| RE | Random effects |
| ROA | Return on Assets |
| ROE | Return on Equity |
| TTM | Twelve trailing months |
| UR | Unemployment rate |
Appendix A. Short-Run ROA Models
Table A1.
Short-run ROA models’ coefficients.
Table A2.
Short-run ROA models’ coefficients (continuation).
Appendix B. Short-Run ROE Models
Table A3.
Short-run ROE models’ coefficients.
Table A4.
Short-run ROE models’ coefficients (continuation).
Appendix C. Figures
Figure A1.
ROA (%).
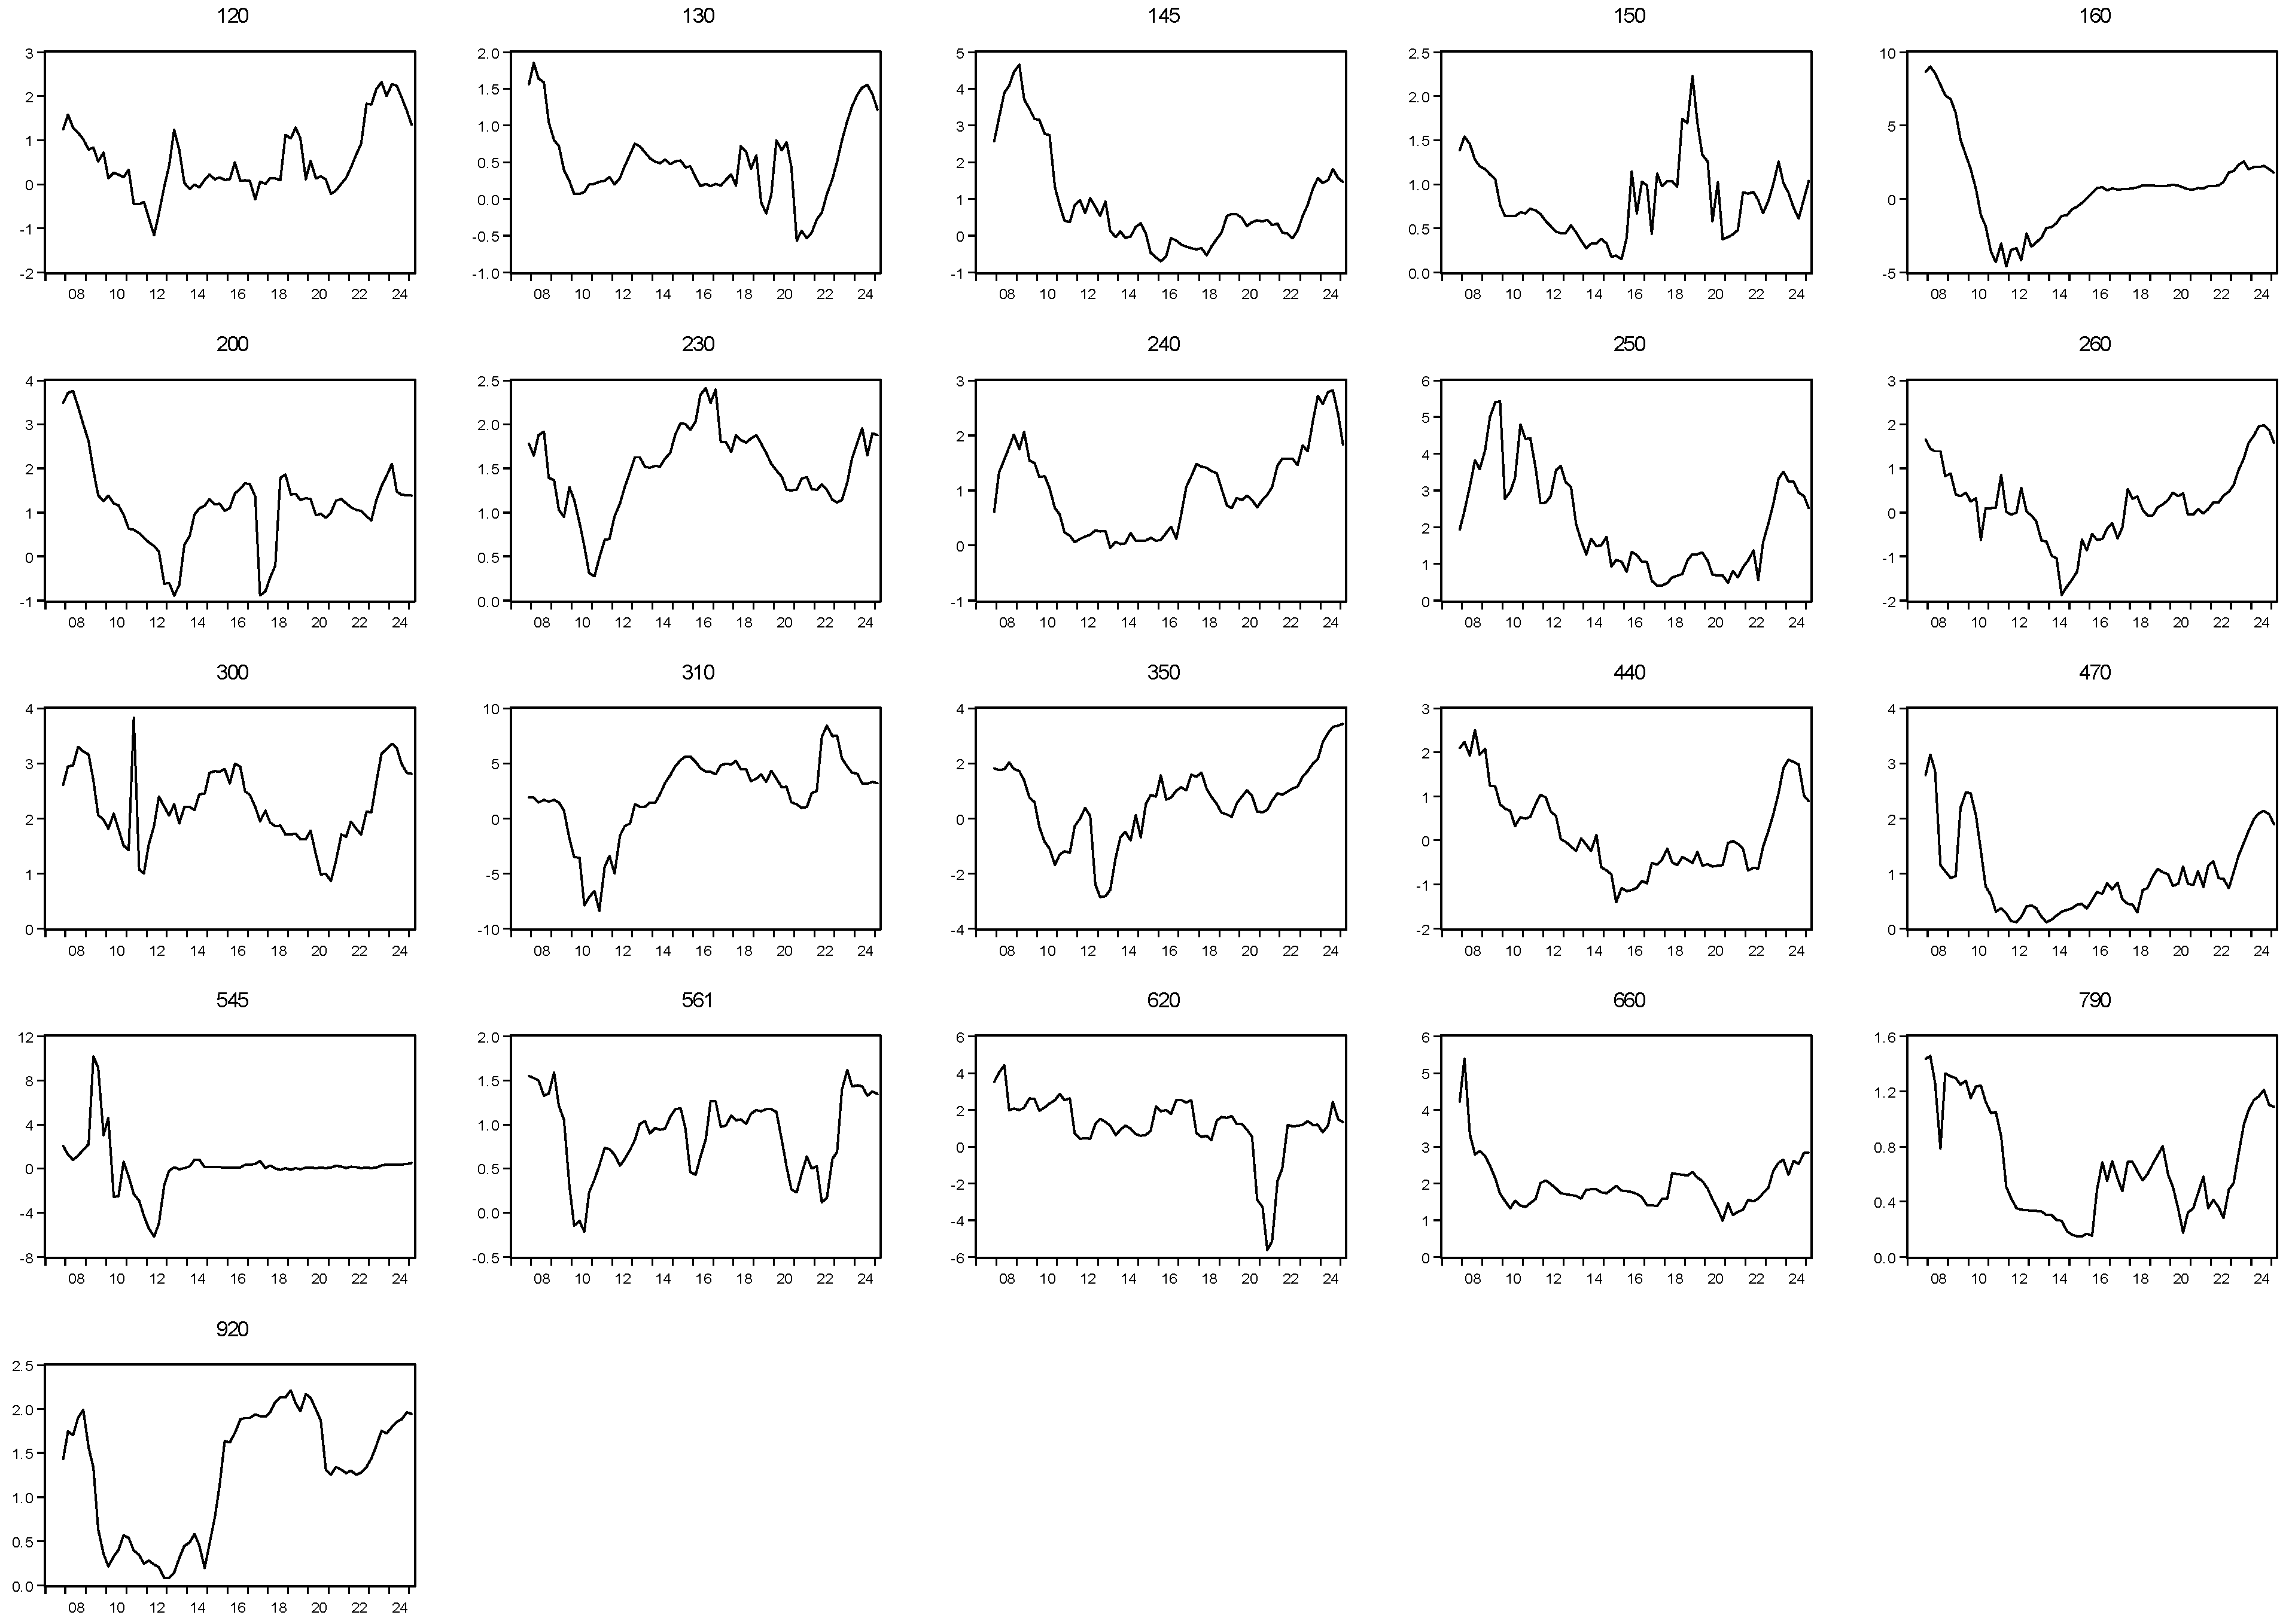
Figure A2.
ROE (%).
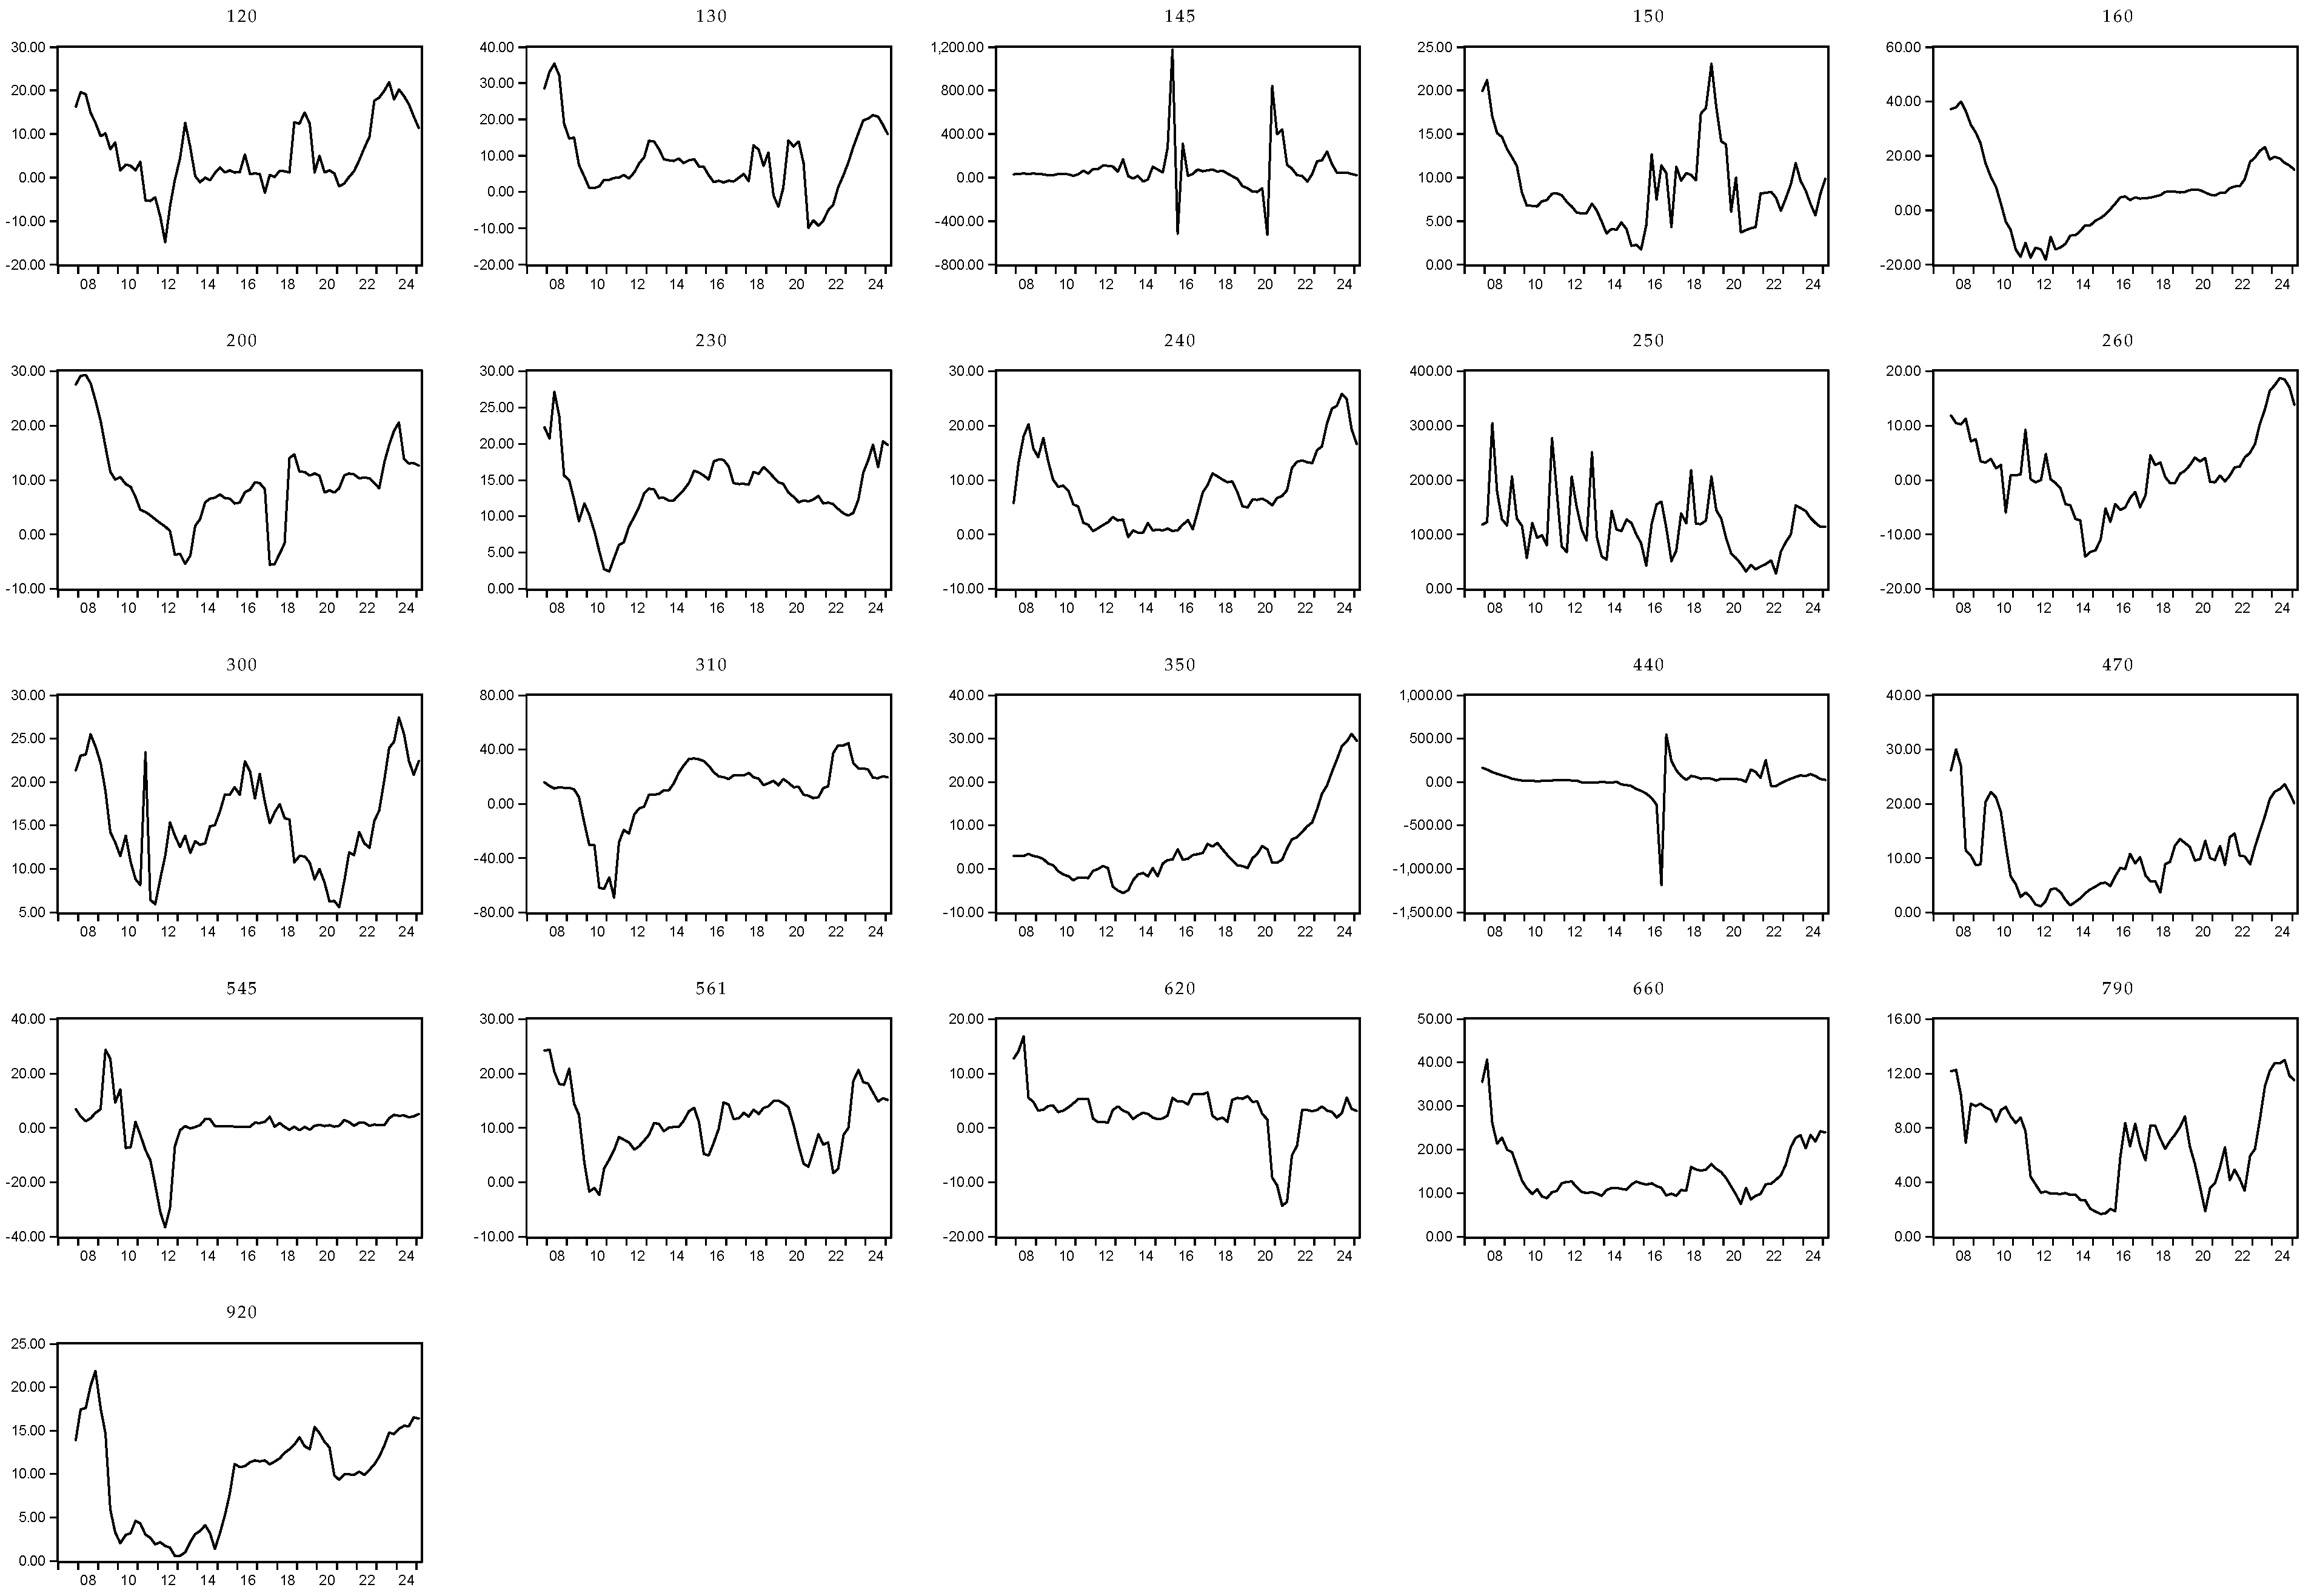
References
- Albertazzi, U., & Gambacorta, L. (2009). Bank profitability and the business cycle. Journal of Financial Stability, 5(4), 393–409. [Google Scholar] [CrossRef] [Scilit]
- Athanasoglou, B. P., Delis, M. D., & Staikouras, C. K. (2006). Determinants of bank profitability in the South and Eastern European region, Bank of Greece (Working Paper No. 47). Available online: https://papers.ssrn.com/sol3/papers.cfm?abstract_id=4163741 (accessed on 25 September 2025).
- Athanasoglou, P. P., Brissimis, S. N., & Delis, M. D. (2008). Bank-specific, industry-specific and macroeconomic determinants of bank profitability. Journal of International Financial Markets, Institutions and Money, 18(2), 121–136. [Google Scholar] [CrossRef] [Scilit]
- Bardi, W., & Hfaiedh, M. A. (2021). International trade and economic growth: Evidence from a panel ARDL-PMG approach. International Economics and Economic Policy, 18(4), 847–868. [Google Scholar] [CrossRef] [Scilit]
- Blackburne, E. F., & Frank, M. W. (2007). Estimation of nonstationary heterogeneous panels. Stata Journal, 7(2), 197–208. [Google Scholar] [CrossRef] [Scilit]
- Borisov, L. (2017). Impact of mergers and acquisitions on the profitability and efficiency of the banks in Bulgaria. VUZF Review, 2017(2), 16–30. [Google Scholar] [CrossRef]
- Căpraru, B., & Ihnatov, I. (2014). Banks’ profitability in selected Central and Eastern European countries. Procedia Economics and Finance, 16, 587–591. [Google Scholar] [CrossRef] [Scilit]
- Claeys, S., & Vander Vennet, R. (2008). Determinants of bank interest margins in Central and Eastern Europe: A comparison with the West. Economic Systems, 32(2), 197–216. [Google Scholar] [CrossRef] [Scilit]
- De Hoyos, R. E., & Sarafidis, V. (2006). Testing for cross-sectional dependence in panel-data models. The Stata Journal: Promoting Communications on Statistics and Stata, 6(4), 482–496. [Google Scholar] [CrossRef] [Scilit]
- Dietrich, A., & Wanzenried, G. (2011). Determinants of bank profitability before and during the crisis: Evidence from Switzerland. Journal of International Financial Markets, Institutions and Money, 2, 307–327. [Google Scholar] [CrossRef] [Scilit]
- Djalilov, K., & Piesse, J. (2016). Determinants of bank profitability in transition countries: What matters most? Research in International Business and Finance, 38, 69–82. [Google Scholar] [CrossRef] [Scilit]
- Dumicic, M., & Rizdak, T. (2013). Determinants of banks’ net interest margins in Central and Eastern Europe. Financial Theory and Practice, 37(1), 1–30. [Google Scholar] [CrossRef] [Scilit]
- Endri, E., Sparta, S., Wiwaha, A., Karyatun, S., Oemar, F., & Setiawan, A. (2025). Banking profitability and COVID-19: Evidence from Indonesia. Montenegrin Journal of Economics, 21(4), 115–128. [Google Scholar] [CrossRef] [Scilit]
- Friedman, M. (1937). The use of ranks to avoid the assumption of normality implicit in the analysis of variance. Journal of the American Statistical Association, 32(200), 675–701. [Google Scholar] [CrossRef]
- García-Herrero, A., Gavilá, S., & Santabárbara, D. (2009). What explains the low profitability of Chinese banks? Journal of Banking & Finance, 33(11), 2080–2092. [Google Scholar] [CrossRef] [Scilit]
- Hausman, J. A. (1978). Specification tests in econometrics. Econometrica, 46(6), 1251–1271. [Google Scholar] [CrossRef] [Scilit]
- Horobet, A., Radulescu, M., Belascu, L., & Dita, S. M. (2021). Determinants of bank profitability in CEE countries: Evidence from GMM panel data estimates. Journal of Risk and Financial Management, 14(7), 307. [Google Scholar] [CrossRef] [Scilit]
- Im, K. S., Pesaran, M. H., & Shin, Y. (2003). Testing for unit roots in heterogeneous panels. Journal of Econometrics, 115(1), 53–74. [Google Scholar] [CrossRef] [Scilit]
- Kao, C. (1999). Spurious regression and residual-based tests for cointegration in panel data. Journal of Econometrics, 90(1), 1–44. [Google Scholar] [CrossRef] [Scilit]
- Karkowska, R., & Pawłowska, M. (2017). The concentration and bank stability in Central and Eastern European countries (NBP Working Paper No. 272, p. 30). Narodowy Bank Polski, Education & Publishing Department. Available online: https://nbp.pl/wp-content/uploads/2022/10/272_en.pdf (accessed on 5 October 2025).
- Killins, R. N. (2000). Real estate prices and banking performance: Evidence from Canada. Journal of Economics and Finance, 44, 78–98. [Google Scholar] [CrossRef] [Scilit]
- Koetter, M., & Poghosyan, T. (2010). Real estate prices and bank stability. Journal of Banking & Finance, 34(6), 1129–1138. [Google Scholar] [CrossRef] [Scilit]
- Kripfganz, S., & Schneider, D. C. (2023). ardl: Estimating autoregressive distributed lag and equilibrium correction models. The Stata Journal, 23(4), 983–1019. [Google Scholar] [CrossRef] [Scilit]
- Mirzaei, A., Moore, T., & Liu, G. (2013). Does market structure matter on banks’ profitability and stability? Emerging vs. advanced economies. Journal of Banking & Finance, 37(8), 2920–2937. [Google Scholar] [CrossRef] [Scilit]
- Niu, J. (2024). Liquidity hoarding and bank profitability: The role of economic policy uncertainty. Finance Research Letters, 68, 106003. [Google Scholar] [CrossRef] [Scilit]
- Onofrei, M., Bostan, I., Roma, A., & Firtescu, B. N. (2018). The determinants of commercial bank profitability in CEE countries. Romanian Statistical Review, (2), 33–46. [Google Scholar]
- Pesaran, M. H. (2004). General diagnostic tests for cross section dependence in panels. University of Cambridge. [Google Scholar] [CrossRef] [Scilit]
- Pesaran, M. H. (2007). A simple panel unit root test in the presence of cross-section dependence. Journal of Applied Econometrics, 22(2), 265–312. [Google Scholar] [CrossRef] [Scilit]
- Pesaran, M. H. (2021). General diagnostic tests for cross-sectional dependence in panels. Empirical Economics, 60(1), 13–50. [Google Scholar] [CrossRef] [Scilit]
- Pesaran, M. H., Shin, Y., & Smith, R. P. (1999). Pooled mean group estimation of dynamic heterogeneous panels. Journal of the American Statistical Association, 94(446), 621–634. [Google Scholar] [CrossRef]
- Pesaran, M. H., & Smith, R. (1995). Estimating long run relationships from dynamic heterogeneous panels. Journal of Econometrics, 68(1), 79–113. [Google Scholar] [CrossRef] [Scilit]
- Peshev, P. I., & Stamenova, R. A. (2025). Panel investigation of the factors determining the supply of bank loans in Bulgaria using microeconomic data. Economics-Innovative and Economics Research Journal, 13(3), 493–520. [Google Scholar] [CrossRef] [Scilit]
- Roodman, D. (2009). A note on the theme of too many instruments. Oxford Bulletin of Economics and Statistics, 71(1), 135–158. [Google Scholar] [CrossRef] [Scilit]
- Sufian, F., & Chong, R. R. (2008). Determinants of bank profitability in a developing economy: Empirical evidence from the philippines. Asian Academy of Management Journal of Accounting & Finance, 4(2). Available online: https://ejournal.usm.my/aamjaf/article/view/aamjaf_vol4-no2-2008_5 (accessed on 28 January 2026).
- Zajñac, J., & Paczos, W. (2025). Euro adoption and banks profitability in Central and Eastern Europe (No. E2025/17). Cardiff Economics Working Papers. Available online: https://www.econstor.eu/bitstream/10419/324444/1/1930668031.pdf (accessed on 11 October 2025).

Disclaimer/Publisher’s Note: The statements, opinions and data contained in all publications are solely those of the individual author(s) and contributor(s) and not of MDPI and/or the editor(s). MDPI and/or the editor(s) disclaim responsibility for any injury to people or property resulting from any ideas, methods, instructions or products referred to in the content. |
© 2026 by the author. Licensee MDPI, Basel, Switzerland. This article is an open access article distributed under the terms and conditions of the Creative Commons Attribution (CC BY) license.