


Abstract
This study examines the pricing dynamics of Non-Fungible Tokens (NFTs) in the secondary market using advanced machine-learning techniques. We construct a large dataset of Ethereum-based NFT transactions initially comprising over 500,000 raw blockchain observations spanning multiple NFT segments, including art, collectibles, gaming, metaverse, and utility assets, over the period from November 2018 to March 2023. Following data preprocessing, synchronization across data sources, and the construction of history-dependent features, the analysis focuses on a final analytical sample of approximately 70,000 transactions. To address the challenges of non-fungibility, thin trading, and high price dispersion, we develop an interpretable predictive framework that integrates domain-informed manual feature engineering, automated Deep Feature Synthesis, and dimensionality reduction via Principal Component Analysis. Three non-linear models—Random Forest, XGBoost, and a Multilayer Perceptron—are trained and evaluated using both random and time-aware validation strategies. The results indicate that XGBoost consistently achieves the highest predictive accuracy, both overall and across individual NFT segments, while historical transaction prices emerge as the dominant predictor of future prices. Segment-level analysis reveals substantial heterogeneity in predictability, with art and collectible NFTs exhibiting more stable pricing patterns than gaming and metaverse assets. Overall, the findings highlight strong path dependence and reputation-driven valuation in NFT markets and demonstrate that carefully designed machine-learning models can deliver high predictive performance without sacrificing economic interpretability.
Keywords:
non-fungible tokens; digital asset valuation; machine learning; decentralized finance; feature engineering; predictive modeling JEL Classification:
C45; C53; G12; O33; L86
1. Introduction
Just before the end of 2021, the most expensive non-fungible token (NFT) sale to date took place. The Merge, a “fragmented artwork”, by the digital artist Pak, consisted of 266,445 “masses” and was owned at the time by 28,983 collectors. Over a three-day period mass prices led to a total transaction volume of USD 91.8 million. To this day, the true identity of the artist Pak remains unknown (Cassady, 2021). Since then, NFT markets have experienced exponential growth.
The valuation of Non-Fungible Tokens is an increasingly important issue in the finance literature. NFTs have evolved from niche digital collectibles into assets that are actively traded, held in portfolios, and integrated into decentralized finance (DeFi) ecosystems. Despite growing market participation, NFT prices remain difficult to interpret due to thin trading, extreme heterogeneity, and the absence of a well-defined equilibrium market price. These characteristics challenge traditional valuation frameworks and motivate the development of predictive approaches capable of operating in data-rich yet structurally complex environments. Understanding NFT price dynamics is therefore relevant not only for investors and creators, but also for researchers interested in price discovery, market efficiency, and asset valuation in emerging digital markets.
From a practical perspective, reliable NFT valuation frameworks are relevant for portfolio allocation, risk management, and the design of digital marketplaces. In addition, NFTs are increasingly used as collateral or as components of financial products within DeFi protocols, where consistent pricing mechanisms are essential. From a research perspective, NFT markets offer a natural laboratory for studying valuation under extreme non-fungibility, thin trading, and reputation-driven demand, making them a compelling subject for modern financial economics.
Despite a growing body of empirical work on NFT markets, existing studies are often limited to narrow subsets of assets or specific modeling approaches and provide limited evidence on cross-segment generalization and interpretability in price prediction. Studies have suggested that NFT prices are shaped by a combination of factors, including rarity, aesthetic qualities, collection name, creation date, the broader cryptocurrency environment, social media activity, and creator reputation (Q. Wang et al., 2021; Ante, 2022). In particular, Nadini et al. (2021) utilized a large dataset from Ethereum-based marketplaces and discovered that visual traits, sales history, and marketplace activity all played measurable roles in NFT valuation. Traditional modeling techniques underperform in such complex environments due to the non-linearity and high dimensionality attributes of the NFT universe posing significant challenges for past scholars. This has led to increasing interest in machine-learning approaches, although their adoption remains constrained by fragmented and sparse data (Nadini et al., 2021;Ali et al., 2023).
We comprehensively investigate NFT valuation dynamics through a structured and rigorous machine learning approach, including extensive data preprocessing, advanced feature engineering, and thorough model tuning and evaluation. Etherscan Explorer was used as a more direct data extraction source, and data transformation was applied to ensure data integrity and quality. Feature engineering techniques, including synthesis methods such as Deep Feature Synthesis, feature selection, and Principal Component Analysis (PCA), were employed to construct informative and interpretable predictors. The engineered features are used to train three advanced machine learning models: Random Forest, XGBoost, and Multilayer Perceptron (MLP), selected for their ability to model complex patterns in high-dimensional data. The robustness and reliability of our models are ensured through extensive hyperparameter tuning and validation procedures.
This study contributes to the NFT literature by providing a detailed comparative analysis of machine learning methodologies and identifying key factors influencing NFT prices. Our approach highlights the value of PCA-derived features and demonstrates strong predictive performance across different NFT segments. This study makes several contributions to the growing literature on NFT valuation. First, it introduces a comprehensive and reproducible predictive pipeline that integrates Deep Feature Synthesis, domain-informed manual feature engineering, principal component analysis, and a two-stage feature-selection procedure. Second, using a large, multi-segment dataset of Ethereum-based NFT transactions, the study provides a systematic comparison of three advanced non-linear machine-learning models (Random Forest, XGBoost, and Multilayer Perceptron) under a unified framework. Empirically, the results show that tree-based ensemble methods—particularly XGBoost—achieve the highest predictive accuracy across NFT segments. Third, the analysis emphasizes interpretability by identifying economically meaningful drivers of NFT prices and demonstrating the dominant role of prior transaction history. A key contribution of this study is to show that a compact set of historical transaction information—summarizing the most recent prices of an NFT and related assets within the same collection—is sufficient to predict future prices with high accuracy, highlighting strong price persistence and reputation-driven dynamics in NFT market Finally, the segment-level evaluation highlights heterogeneity in pricing dynamics across NFT categories, offering practical insights for investors, creators, and platform designers. These findings offer practical insights for industry stakeholders and set a methodological benchmark for future research in the rapidly evolving NFT landscape.
The remainder of the paper is structured as follows. Section 2 reviews the related literature and develops the research hypotheses. Section 3 describes the data sources and presents descriptive statistics. Section 4 outlines the methodological framework, including data preprocessing, feature engineering, dimensionality reduction, and model construction. Section 5 reports and discusses the empirical results. Section 6 concludes and highlights limitations and directions for future research.
2. Literature Review and Hypotheses Development
NFT price predictions in the literature follow the broader social hype surrounding digital assets. However, the characteristics of NFTs differentiate them from traditional assets as well as cryptocurrencies, complicating price forecasting. Non-fungibility—in the sense that each NFT is unique in its metadata—restricts all modeling techniques that rely on comparable historical items (Kong & Lin, 2023). Vastly different valuations can be observed even within the same NFT collection.
Other structural challenges of NFTs are data sparsity and thin trading. NFTs trade at irregular frequencies: some are sold multiple times, while others are sold only once or not at all. Sparse transaction data limits the volume of reliable data for supervised learning models, and the lack of regular transaction activity causes time-series models to struggle with pattern recognition from infrequent or irregularly spaced data points (Z. Wang et al., 2023). While prior studies document these key features of NFT markets, they provide limited guidance on how such structural characteristics can be systematically incorporated into predictive valuation frameworks.
Scholars have also investigated the correlation between NFT prices and social signals. Luo et al. (2023) showed that NFTs are highly sensitive to social media activity, particularly on Twitter and Discord. This implication highlights the role of visibility and engagement in shaping interest in NFT collections. However, the empirical relationship between social activity and prices is complex: increased tweet volumes and high engagement may raise a collection’s reputation and visibility but do not always translate directly into higher sale prices. Not all highly visible collections achieve high transaction values. Consistent with this view, Flamini and Naldi (2025) review the NFT pricing literature and document a wide range of intrinsic and extrinsic price determinants including utility, rarity, and sentiment-related factors—while noting substantial heterogeneity in their empirical relevance across NFT categories and studies.
Investor activity in blockchain environments is hard to interpret, and sentiment analysis methods face limitations in this domain. These observations suggest that social signals influence reputation and visibility, but they do not provide a stable or universally applicable predictive factor for prices across collections and time. Hence, while social and network variables are important to consider, their inconsistent availability and measurement across collections constrain their use in a large cross-collection empirical framework.
Traditional asset-pricing models are ill-suited to NFT markets due to fundamental structural differences between NFTs and conventional financial assets. Standard models typically rely on assumptions of fungibility, continuous trading, and well-defined equilibrium prices, which underpin concepts such as expected returns, risk premia, and arbitrage. NFTs violate these assumptions: each token is non-fungible by design, trading is highly irregular and sparse, and prices are formed through episodic transactions rather than continuous market clearing. As a result, equilibrium-based valuation frameworks offer limited guidance for NFT pricing. These characteristics motivate a data-driven, predictive approach that conditions on observable transaction history and market information rather than attempting to estimate an unobservable fundamental value.
There also appears to be a common conception in the past literature about the failure of linear models to capture NFT trading effects, since the assumption of linearity does not hold in many NFT settings (Heaton, 2017). Linear models assume a straight-line relationship between features and the target variable. NFT prices are influenced by nonlinear dynamics that often interact in complex, non-additive ways. Linear models frequently fail in domains with rich feature interactions and heterogeneous items. As a result, econometric approaches that assume additivity and stationarity tend to underperform when applied to highly idiosyncratic, thinly traded NFT markets.
Researchers have applied progressively advanced approaches to address the challenges of NFT predictability. Dawod et al. (2023) employed multiple ML models, including Random Forest, XGBoost (Extreme Gradient Boosting), and LightGBM (Light Gradient Boosting Machine), using item characteristics, market events, and rarity scores; their results indicate that gradient-boosting methods can outperform alternatives in terms of predictive accuracy. Similarly, Z. Wang et al. (2023) utilized AdaBoost (Adaptive Boosting) and Random Forest algorithms to predict NFT sale prices and price fluctuations. More recently, Bagili (2024) incorporated image features alongside transactional metadata using convolutional neural networks (CNNs) for images and LSTM (Long Short-Term Memory) models for temporal dynamics. In this context, Iosif and Katelaris (2024) provide a structured survey of machine learning applications in the NFT domain, emphasizing the heterogeneity of data sources and analytical choices and highlighting the need for systematic and comparable feature-engineering frameworks in predictive NFT research.
NFTs’ peculiarity in distinct trading makes the application of predictive models challenging, and empirical findings to date are limited in scope. Studies that demonstrate moderate to high accuracy typically do so within their specific datasets, often focusing on single collections or narrowly defined subsets. The widespread segmentation of available transactional data means that many models are trained on limited slices of the market, which limits generalizability across different NFT types and use cases. Beyond price determinants, the broader economic and platform environment also shapes NFT investment behavior; for example, Lee et al. (2025) analyze risk factors in NFT investment platforms and show how speculation, volatility, and platform-specific characteristics influence investor outcomes.
Another important issue identified in the literature is interpretability. Most models—especially deep learning approaches such as CNNs and LSTMs—are low in interpretability and therefore provide limited explanatory power. Models without explicit attention or interpretability mechanisms have a considerable drawback for stakeholders (creators, investors, and platform designers) who need to understand the drivers behind valuations. This lack of transparency complicates practical adoption and the formulation of economic conclusions from purely predictive results.
Moreover, the tendency of machine-learning studies to sacrifice interpretability for performance exacerbates concerns about external validity: high in-sample or within-collection performance does not guarantee cross-segment robustness. This limitation motivates methods that seek a balance between predictive accuracy and interpretability, for example, by combining automated feature construction with dimensionality-reduction and feature-selection techniques that preserve economic meaning.
Past research limitations, as described, highlight a critical need for interpretable models that can operate effectively across the heterogeneous landscape of NFT types while preserving predictive reliability. By engaging critically with the existing body of literature and identifying its conceptual and methodological gaps, we position the present study to address these shortcomings directly.
The objective of this study is to develop and evaluate an interpretable machine-learning framework capable of predicting NFT prices across heterogeneous asset segments using transaction-level and market-based information derived from secondary-market activity.
Hypothesis 1 (H1).
Machine-learning models that combine transaction-level information and macro-financial features achieve statistically significant out-of-sample predictive accuracy for NFT prices across multiple segments.
Hypothesis 2 (H2).
Features derived from recent transaction history explain a larger share of predictive performance than macro-financial features.
3. Data Description
This study utilizes a multi-source dataset comprising NFT transaction records, digital currency records, and historical data indexes of traditional assets. The dataset is presented in preprocessed form, prior to any transformations’ application.
3.1. Data Overview
The dataset captures NFT activity between November 2018 and March 2023, for 30 of the most popular collections such as Bored Ape Yacht Club, Azuki, CloneX, and Art Blocks. The final sample includes approximately 500,000 transactions involving 76,100 unique NFTs. Data sources include Etherscan.io for NFT transactions, Nonfungible.com for segment classification (Appendix A, Table A1), Investing.com for digital currency indicators, and Yahoo Finance for traditional assets (S&P 500, Oil, and Gold). The “Miscellaneous” segment was excluded from the analysis because it aggregates NFTs that do not belong to economically coherent or interpretable categories. Assets in this segment include heterogeneous smart contracts with widely differing use cases and pricing mechanisms, which limits meaningful feature construction and segment-level inference. Including this residual category would introduce additional noise without improving generalizability.
These transactions were conducted through various digital currencies (Appendix A, Table A2); the majority of which were made through ETH. All digital currency data, including rates, indices, and market capitalization, is sourced from Investing.com. Data for traditional assets, such as the S&P 500 index, Oil, and Gold transaction rates, were drawn from Yahoo Finance. All NFT transactions were mapped to calendar days based on their transaction timestamps, and corresponding daily macro-financial values were merged accordingly. To ensure accuracy, all transaction prices were converted into ETH based on the average daily exchange rates. This conversion ensures accurate and consistent financial reporting in a standardized currency format, providing control over exchange rate volatility during the sample period.
3.2. Descriptive Statistics
Prior to any transformations, the initial dataset consists of 409,983 transactions of 76,096 NFTs. By observing the data distribution (Appendix A, Table A3) by category (Appendix A, Figure A1), transaction volumes vary across segments with Collectibles and Metaverse NFTs being the most traded.
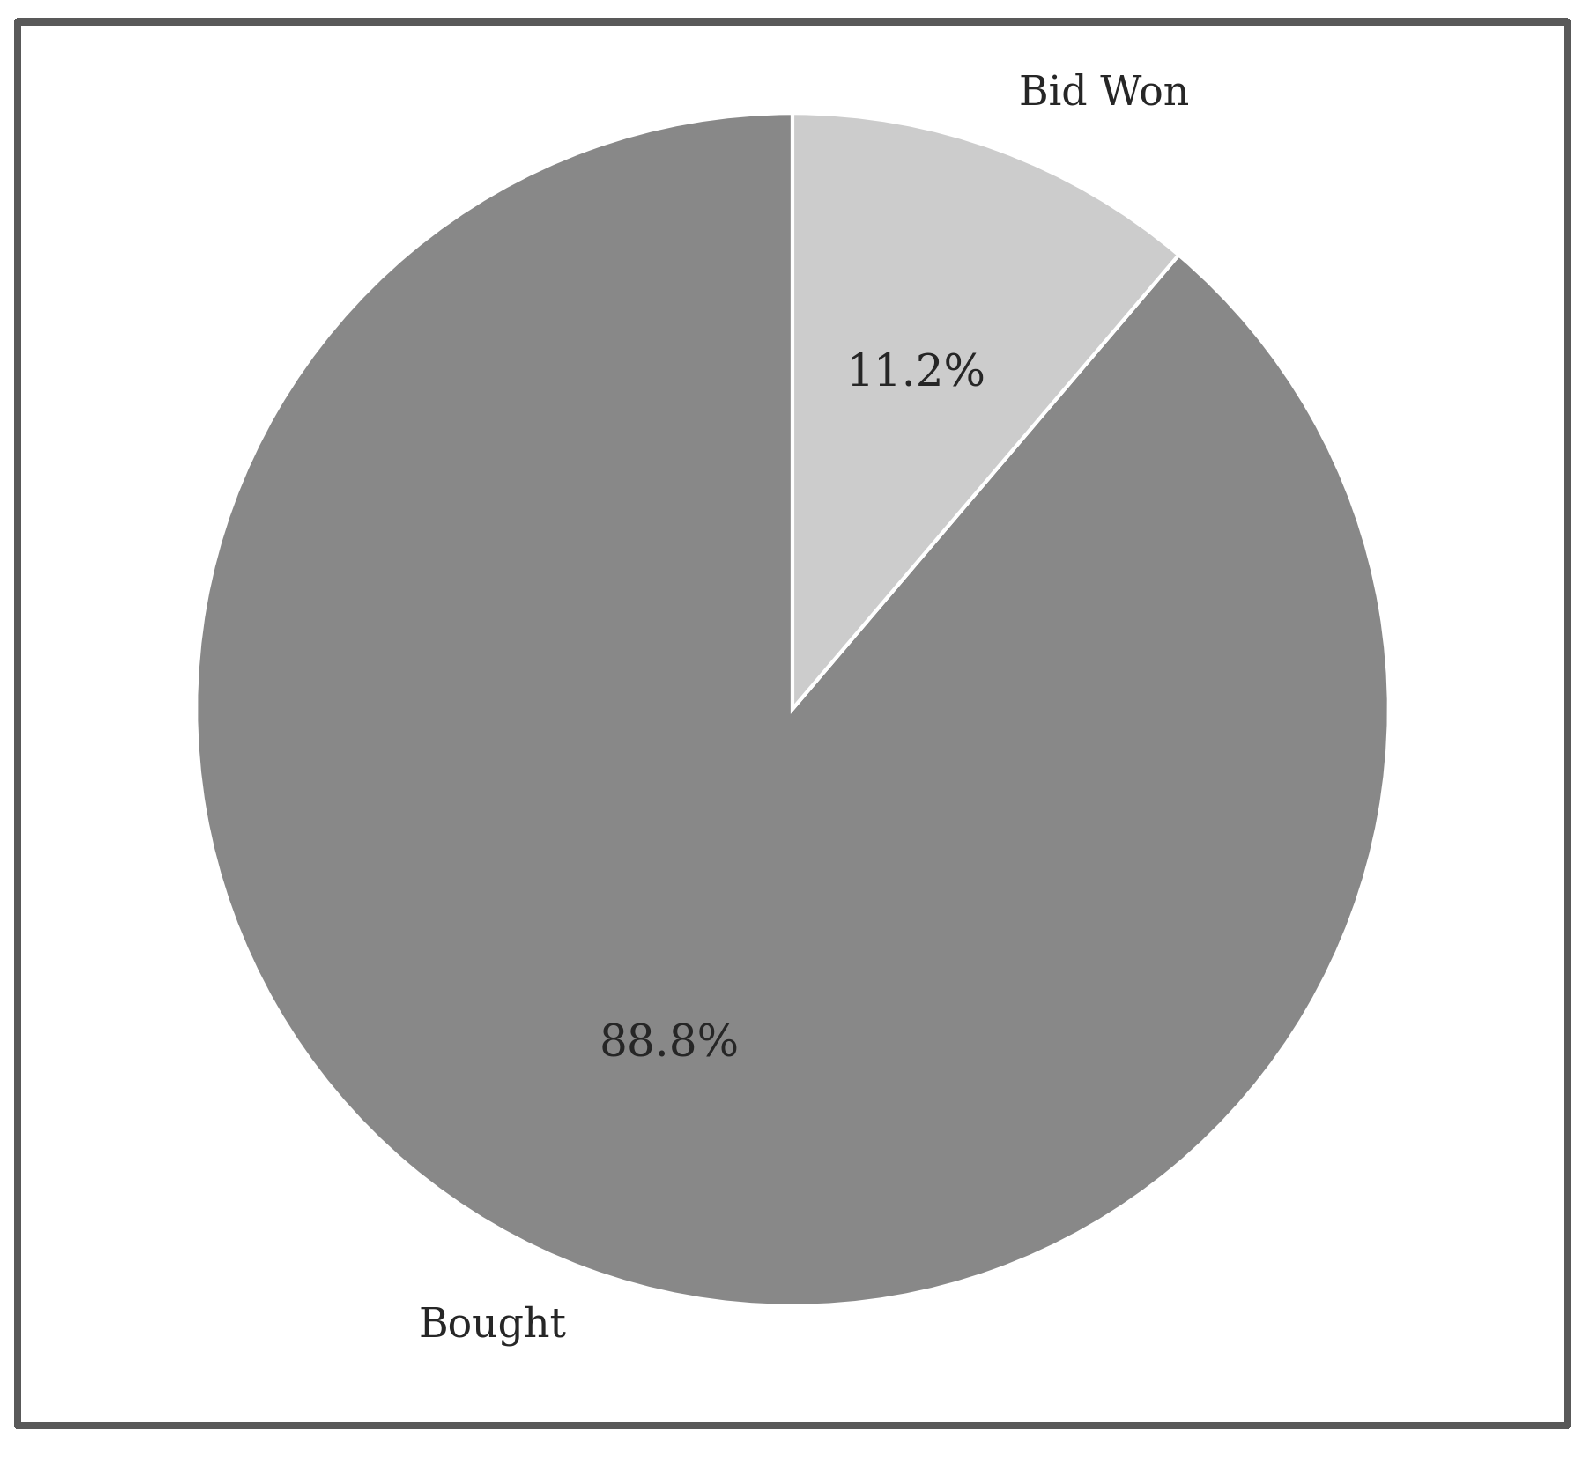
Variety in fee structures, user interfaces, and trading mechanisms across platforms shapes price dynamics and trading behavior NFTs can be sold either through direct purchase or via auction mechanisms, Direct sales is the leading transaction type, and primary NFT Marketplaces for exchanging digital assets are OpenSea followed by LooksRare. Notably, there is a degree of market specialization as certain categories of NFTs tend to be more commonly available on specific platforms (Appendix A, Table A4, Figure A1, Figure A2 and Figure A3). Price reflects the sale price of NFTs in Ether. The mean of 26.29 ETH and the median of just 2.05 ETH indicate that while most transactions occur at relatively low values, a small number of exceptionally high-priced sales significantly influence the average. The minimum observed value is zero, suggesting the presence of free transactions or Airdrops, free distribution of digital tokens to users’ wallets, typically as a promotional strategy or reward.
Other indicators, such as SNP500_ETH, GOLD_ETH, and OIL_ETH, provide contextual information by expressing traditional asset prices in terms of Ether. These variables display modest variation. BTC_ETH and USD_ETH represent macro-financial indicators, normalized to ETH, and are used to explore potential external influences on NFT pricing. The BTC_ETH exchange rate has moderate variability. Notably, the variables are expressed on different scales, and there are indications of extreme outliers.
The correlation matrix of our Initial numeric variables (Appendix A Table A5) reveals several notable relationships. As expected, the price of NFTs shows weak correlation with the macroeconomic variables, suggesting that NFT pricing behavior is mainly independent of broad macro-financial indicators in raw terms. In contrast, powerful correlations are observed among the macroeconomic variables themselves. USD_ETH, SNP500_ETH, and GOLD_ETH are highly correlated, indicating multicollinearity. OIL_ETH also correlates highly with this group. BTC_ETH shows moderate correlation with macro variables and minimal correlation with Price, reinforcing the notion that Bitcoin and Ethereum valuations influence each other to some extent but do not directly dictate NFT pricing. These variables appear to track general ETH-denominated market trends and may not contribute uniquely to modeling without dimensionality reduction.
4. Methodology
This section outlines the methodological approach adopted to build and evaluate predictive models for NFT pricing. The process involves a step by step procedure of data transformation, feature engineering, dimensionality reduction, and feature selection, leading to the construction and evaluation of predictive models.
4.1. Data Transformation
This subsection describes the preprocessing steps applied to the raw NFT transaction data prior to feature construction and model estimation. These steps include price definition and transformation, outlier treatment, and data alignment across sources, followed by feature engineering. The pipeline consists of price definition and transformation, outlier treatment, and feature engineering, which together produce the final feature set used for model training and evaluation.
4.1.1. Data Preprocessing
The analysis is conducted using transaction-level prices of NFTs observed in the secondary market. Each observation corresponds to an executed transaction price expressed in Ether (ETH), which serves as the reference currency throughout the study. Transaction timestamps are recorded at the block level and aligned to daily frequency only for the purpose of synchronizing macro-financial variables; NFT prices themselves are not aggregated and remain at the transaction level.
NFT prices exhibit a highly right-skewed distribution with extreme values. To stabilize variance and reduce the influence of extreme observations while retaining zero-valued transactions (e.g., free transfers or airdrops), all price variables are transformed using the log-one-plus transformation. Specifically, we apply:
where denotes the transaction price in Ether. This transformation allows zero-price observations to be retained in the sample and improves numerical stability. All predictive models are estimated using the transformed price variable, and reported performance metrics are interpreted accordingly. As a final preprocessing step, numeric price variables are transformed using the log-one-plus transformation.
NFT price distributions exhibit heavy right tails and extreme values, which may reflect both genuine market events and potential market manipulation. To limit the influence of extreme observations while preserving economically meaningful price behavior, we apply a percentile-based trimming strategy. Specifically, transactions with prices above the 99th percentile of the price distribution are excluded from the main analysis. This conservative threshold retains the vast majority of transactions, including high-value NFTs.
4.1.2. Feature Engineering
Feature construction enriches the dataset with variables capable of capturing NFT transaction dynamics more accurately. A semi-automated approach was followed, combining Deep Feature Synthesis (DFS) and manual feature design. DFS is an effective method for generating features in predictive modeling tasks (Kanter & Veeramachaneni, 2015). DFS is implemented through an open-source Python library, Featuretools (version 1.31.0). This framework performs automated feature engineering. It excels at transforming temporal and relational datasets into feature matrices for machine learning and is capable of constructing higher-order features that accurately reflect relational patterns present in the dataset (Feature Labs, 2024).
In addition to the automated procedures, a set of manually engineered features derived from the literature review findings. These variables were constructed to capture aspects of NFT pricing behavior that are not easily derived through automated synthesis, such as transaction recency, creator activity, or segment indicators. These features follow domain knowledge and insights drawn from prior research. Automated feature generation via DFS is further combined with manual feature construction to derive macro-financial feature sets that capture broader market conditions. Specifically, for each macroeconomic indicator expressed relative to Ether—Bitcoin (BTC/ETH), the U.S. dollar (USD/ETH), the S&P 500 index (S&P500/ETH), crude oil (OIL/ETH), and gold (GOLD/ETH)—we construct structured groups of lagged, rolling, and extremal features. These include contemporaneous levels, returns, rolling averages, rolling maxima and minima, and return-based aggregates computed over multiple time windows ranging from 7 to 120 days. This design enables the models to capture short-, medium-, and longer-term market dynamics while preserving temporal ordering and interpretability. The combined Deep Feature Synthesis and manual feature-engineering process resulted in excess of 200 candidate features, including macro-financial indicators, transaction-level variables, creator-level aggregates, market-level statistics, and temporal features. This high-dimensional feature set was subsequently reduced through feature selection and dimensionality reduction.
4.2. Feature Selection
In the second stage, a Genetic Algorithm is applied to further optimize the feature subset. The algorithm generates candidate feature combinations, each of which is evaluated using a fitness function based on model performance. This approach has been shown to be effective in complex and non-linear settings, where interactions between variables play an important role (Ding et al., 2025). By iteratively refining the feature space, the procedure balances predictive accuracy with interpretability.
After feature generation, the expanded feature set—including transaction-level variables, manually engineered features, and DFS-generated variables—is reduced through a two-stage feature selection process. In the first stage, a Random Forest model is trained to rank feature importance and identify redundant or weakly informative variables (Ding et al., 2025). This initial screening helps mitigate overfitting and reduces dimensionality by eliminating features with limited predictive contribution.
To prevent information leakage, feature selection is performed exclusively on the training data within each validation fold. The selected feature subset is then applied to the corresponding test data. Table 1 summarizes the variables retained after the two-stage feature selection and dimensionality reduction process described above. Following feature selection and subsequent dimensionality reduction via Principal Component Analysis. This structured selection process ensures computational efficiency while preserving the most informative features for model estimation.
Table 1.
Feature selection result variables.
Principal Component Analysis
Principal Component Analysis (PCA) reduces dimensionality and transforms the original dataset into a new coordinate system defined by orthogonal axes—called principal components—which successively capture the directions of maximum variance in the data. Through PCA sets of highly correlated variables (Appendix A Table A3) are transformed into a smaller set of linearly uncorrelated components (Scikit-learn Developers, 2024). The final model specification consists of four variables/components. This structured selection process ensures computational efficiency while preserving the most informative features for model estimation.
4.3. Predictive Modeling, Training and Validation Strategy
Optimizing the feature subset enables the construction of predictive models capable of estimating NFT prices and testing the proposed hypotheses. Three machine-learning models are employed: Random Forest, XGBoost, and a feedforward Neural Network. This model selection balances interpretability with the ability to capture complex, non-linear relationships. To ensure consistency, all models are trained using the same set of selected features obtained through the preprocessing and feature selection pipeline described in Section 4.1 and Section 4.2. The input variables include transaction-level features, manually engineered variables, DFS-generated features, and PCA-derived components summarizing correlated feature groups. Model performance is evaluated using standard regression metrics, including Root Mean Squared Error (RMSE) and the coefficient of determination (R2).
The Random Forest algorithm is selected for its ability to handle high-dimensional data and its robustness to overfitting. By constructing an ensemble of decision trees and averaging their predictions, the model reduces variance and improves generalizability, even in the presence of noisy or redundant variables (Breiman, 2001). XGBoost is employed due to its efficiency and strong predictive performance on structured data, making it particularly suitable for NFT transaction environments. In addition, its gradient-boosting framework allows it to handle data sparsity effectively (Chen & Guestrin, 2016). Finally, a Multilayer Perceptron (MLP) neural network is used to model non-linear mappings through layered transformations. The network adopts a feedforward architecture with ReLU activation functions and dropout regularization (Brownlee, 2019) and is trained using backpropagation to minimize prediction error (Rumelhart et al., 1986).
To prevent information leakage, feature selection and Principal Component Analysis are applied exclusively to the training data within each validation fold. The resulting transformations are then applied to the corresponding test data. Model evaluation is conducted using an 80/20 train–test split, complemented by time-aware validation to account for the temporal structure of NFT transactions and ensure realistic out-of-sample performance.
4.3.1. Optimization and Hyperparameter Tuning
Hyperparameters for all predictive models are selected through cross-validated tuning procedures applied exclusively to the training data. This approach ensures robust model calibration while preventing information leakage. Across models, optimization focuses on controlling model complexity, improving generalization, and mitigating overfitting.
The Random Forest (RF) regressor serves as the baseline model, consistent with the study’s hypotheses and prior empirical evidence. Model training employs a 10-fold cross-validation procedure on the training data. The RF is tuned by setting the number of trees to 100 to stabilize predictions, restricting the maximum tree depth to 10 to limit overfitting, and requiring a minimum of five observations per leaf. In addition, a random subset of features is selected at each split, and model estimation is conducted using an 80/20 train–test split.
For the XGBoost regressor, hyperparameter optimization is conducted using grid search combined with cross-validation on the training data. The tuning grid includes the number of estimators (100, 200), maximum tree depth (4, 6, 8), learning rate (0.01, 0.05, 0.1), subsampling ratio (0.8, 1.0), column sampling by tree (0.8, 1.0), and minimum child weight (1, 3, 5). This configuration allows the model to balance flexibility and generalization by controlling tree complexity, learning dynamics, and sensitivity to noise.
The Multilayer Perceptron (MLP) is implemented as a fully connected feedforward neural network and optimized using a randomized hyperparameter search via Keras Tuner. The architecture consists of two hidden layers with ReLU activation functions, with dropout regularization applied after the first hidden layer to reduce overfitting. The first hidden layer contains 96 neurons followed by a dropout rate of 0.3, while the second hidden layer contains 16 neurons. The model is trained using the Adam optimizer with a learning rate of 0.005 and mean squared error loss, with early stopping and a validation split used to monitor convergence and prevent overfitting.
Across all models, hyperparameter tuning is performed exclusively on the training data within each validation fold, and the resulting configurations are applied to the corresponding test data. Detailed hyperparameter settings for each model are reported in the Appendix A.
The final stage of the analysis evaluates model performance across different NFT segments. The best-performing specification is subsequently applied at the segment level to assess predictive accuracy within each category and to examine heterogeneity in pricing dynamics across asset types.
4.3.2. Model Formulation
Let denote the log-transformed price of NFT transaction , and let represent the corresponding vector of input features obtained after preprocessing, feature selection, and dimensionality reduction. All models considered in this study aim to estimate a non-linear function such that:
where denotes an error term. Random Forest and XGBoost approximate using ensembles of decision trees, whereas the Multilayer Perceptron models as a composition of affine transformations and non-linear activation functions across multiple hidden layers. This unified formulation provides a common framework for comparing predictive performance across models.
4.3.3. Exclusion of Social and Network Variables
Social and network-related factors—such as social media activity, community engagement, and creator visibility—have been shown to influence investor attention and short-term market dynamics in digital asset markets. However, under a semi-strong interpretation of the Efficient Market Hypothesis, publicly observable information, including widely disseminated social signals, is expected to be rapidly incorporated into asset prices (Fama, 1970). From this perspective, the predictive content of social information should be largely reflected in recent transaction prices. Empirical evidence from financial markets supports this view, showing that sentiment indicators often react contemporaneously to price movements rather than provide stable out-of-sample predictive power for future returns (Tetlock, 2007; Sprenger et al., 2014).
Moreover, incorporating social and network variables into a large-scale, cross-collection NFT framework presents substantial practical challenges. Consistent, historical, and token-level social metrics are not uniformly available across NFT collections and time periods, and such data are often subject to noise, manipulation, and platform-specific biases. For these reasons, the present study focuses on transaction-based predictors that are directly observable and consistently measurable across the full sample. In this setting, historical transaction prices are interpreted as sufficient statistics that aggregate both market fundamentals and publicly reflected social and reputational effects.
5. Results and Discussion
5.1. Data Transformation Output
Following the Methodology approach, the data were cleaned by removing observations with missing values and excluding price outliers above the 99th percentile. This action is applied, apart from statistical justification, also as a precautionary measure to filter out manipulated market activity, such as “wash trading”. In the NFT context, wash trading typically occurs through multiple wallets controlled by a single user to simulate market demand, distort price signals, and mislead potential buyers. Manual and automated feature engineering was guided by domain knowledge and multiple test runs. As already established in the literature review, NFT prices are strongly correlated with reputation, both at the level of individual tokens and their creators. Market value is often shaped by perceived credibility and prior success. Past scholars attempted to measure community recognition associated with NFTs and their creators through social media metadata. Despite this obvious association, recognition reacts to investment activity, it does not proceed it. Our variables provide information about the token’s previous transaction activity, its creator, the equivalent market platform, and its corresponding segment. This is achieved by reducing the dataset size to NFTs that have been sold at least 3 times. Despite the drawback of excluding from prediction initial NFT sales, our dataset provides advanced investor behavior information to build accurate predictive models. Subsequent to the manual feature engineering, we applied DFS. The resulting dataset consists of 235 features and 70,087 observations. Date variable was used to create time lags and inform about previous transaction patterns. As expected, many of those features are aggregated combinations of the original variables. For optimal model performance, a single representative variable was selected among groups of similar variables.
A genetic algorithm (GA) was implemented for feature selection among these five sets, using the DEAP library and optimizing a Random Forest regressor’s cross-validated R-squared score. The GA used a population size of 30 and ran for 20 generations with a two-point crossover (0.5), mutation probability (0.2) and tournament selection (size 3). The best-performing individual represented the optimal subset of features. The selected variables from the five economic macro sections, although modified to some extent, remain highly correlated.
Additionally, there is a very high correlation among the groups of lag variables created from CreatorSale and Price. The Cumulative Explained Variance graphs (Figure 1) provide clear evidence about the number of PCA components that are necessary to maintain without decreasing explanatory value.
Figure 1.
Cumulative Explained Variance.
PCA is applied to three feature groups: CreatorSale variables, PreviousPrice variables, and macroeconomic variables. For sale-related variables, a representative component is selected based on feature-importance estimation. The previous sales of the same creator and the lagged sales of the same NFT are further combined into a unified group, denoted as PriorSale. The selection of components is guided by cumulative explained variance criteria, as illustrated in Figure 1.
After data transformation and variable selection, the final dataset is summarized in Table 2. As reported in Table 2, the first principal component derived from the group of highly correlated prior sale price features (PriorSale_PCA1) exhibits a mean close to zero and a standard deviation of approximately 2.52, indicating substantial variation in the underlying latent factor. Similarly, the macroeconomic component (Macro_PCA1), which aggregates multiple macro-financial indicators, also has a mean near zero and a standard deviation of approximately 1.35, consistent with standard PCA normalization.
Table 2.
Descriptive statistics of optimum variables.
The strong positive correlation (Table 3) between the first principal component of previous sale prices and the current NFT price indicates that it is a strong predictor of the current NFT price. Correlation levels among our independent variables are low after performing the PCA. The economic macro component and the time interval are mildly correlated with the prediction variable.
Table 3.
Correlation matrix of optimum variables.
The principal component analysis applied in this study serves not merely as a dimensionality-reduction technique, but as a means of constructing economically interpretable latent factors from highly correlated variables. In particular, the first principal component derived from prior transaction prices (PriorSale_PCA1) captures the overall level of recent valuation and reputation associated with an NFT and its collection, reflecting strong price persistence and path dependence. The second component (PriorSale_PCA2) captures residual variation in transaction history, which can be interpreted as dispersion or instability in past pricing. Similarly, the macro-financial component (Macro_PCA1) aggregates common variation across cryptocurrency, equity, and commodity indicators expressed relative to Ether, capturing broad market and liquidity conditions. By summarizing correlated information into a small number of latent factors, PCA preserves economically meaningful signals while mitigating multicollinearity and noise, making these components well suited for predictive modeling in thinly traded and heterogeneous NFT markets.
5.2. Machine Learning Model Performance
Three ML algorithms were selected for comparison: Random Forest (RF), XGBoost, and a Multilayer Perceptron (MLP). These models represent a range of methodological approaches, allowing for a comprehensive evaluation of predictive performance across techniques. Model assessment is a key process for indicating how each model handled the structured features of the dataset and determining which one offered the most reliable results in forecasting NFT prices. Models were evaluated via R2, RMSE, and MAE on both log-transformed and original ETH scales.
5.2.1. Random Forest Regressor and Hyperparameter Tuning: Full-Sample Predictive Analysis
The tuned Random Forest model achieved an R-squared of 0.880 on the training dataset and 0.853 on the test set, suggesting strong predictive power. Comparison of actual results to prediction, the root mean squared error (RMSE) is 0.329, and the mean absolute error (MAE) is 0.206. To directly express predictions and errors in Ethereum (ETH), we apply a reverse logarithmic transformation. The model explains about 85% of the variation in actual NFT sale prices. The model’s predictions diverged from the target, on average, by around 1.21 ETH. We observe that the model provides reasonably accurate price estimates relative to the typical NFT price in the dataset. Significant for low-priced NFTs. The error is roughly 50% of the typical price; this error level is consistent with the high price variability of the NFT market. The root-mean-squared error being higher than the MAE suggests the presence of cases where the model under- or overestimated the price more substantially.
The first analyzed component of past sales prices (PriorSale_PCA1) is by far the most influential predictor (Figure 2). As we anticipated, the reputation of creators and the token can be interpreted through their previous transaction records and is capable of projecting future behavior. Macro_PCA1 adds some additional predictive value, indicating that the market’s status quo levels for other assets do correlate with NFT demand. Finally time between sales (TimefromLastSale) and the second prior sale component (PriorSale_PCA2) do contribute minimally to the model’s performance.
Figure 2.
Random Forest feature importances.
The tuned RF model captures effectively the primary structure of NFT prices as illustrated in the Kernel Density Estimation (KDE) plot (Figure 3). The predicted and actual distributions are aligned across the vast majority of the dataset. Apparently, there are some noticeable discrepancies for certain price levels at specific peaks and in the upper price tail. This is typical of environments with inherent volatility and a limited number of high-priced assets, like the NFT market.
Figure 3.
KDE density plot for price (RF model).
5.2.2. Cross-Segment Predictive Performance of the Tuned Random Forest Regressor
Cross segment evaluation provides us with insights into how well the model generalizes to NFTs with distinct characteristics and market dynamics.
The model achieved the highest performance (Table 4) within the Art and Collectible segments, with high R-squared values and relatively low MAEs. However, within the Art segment, the MAE is significantly lower. The model appears less effective on Game and Metaverse, with reduced R-squared values, while, however, retaining the same error levels. Performance is notably weaker in the Utility Segment partly due to its small sample size.
Table 4.
Random Forest regressor performance metrics by NFT segment.
By observing the relationship between actual and predicted NFT prices (Figure 4), the tuned Random Forest regressor captures the general price patterns across segments reasonably well. The majority of predictions fluctuate slightly from the ideal fit line, particularly for mid-range prices. The cross-segment analysis complies with the overall dataset application. In both cases, we observe an overall average satisfactory performance, apart from NFTs with extreme price values. In such cases, accuracy decreases and the magnitude varies by segment.
Figure 4.
Actual vs. Predicted NFT prices (log-scale ETH) by color-coded segment.
KDE evaluations (Figure 5), confirm that predictions align with the actual price across segments, while the degree of alignment varies. For most segments, the volume of transactions per smaller price margins is more concentrated below 1 ETH. In Collectibles, there is also a secondary peak slightly below 3 ETH. For Game and Collectibles, the tails around the peak tend to be wider, implying more dispersed price behavior.
Figure 5.
RF KDE of actual vs. predicted prices by color-coded segment.
Feature-importance patterns (Figure 6) remain broadly consistent with the full-sample model, with PriorSale_PCA1 dominant across all segments. Minor variations appear in Game, Metaverse, and Utility, where secondary features matter slightly more.
Figure 6.
Random Forest feature importances per segment.
5.2.3. Extreme Gradient Boosting with Hyperparameter Optimization
To complement the Random Forest analysis, an XGBoost regressor was implemented and evaluated on the full dataset. The XGBoost model, tuned with optimal hyperparameters, achieved a mean R-squared of 0.808. Specifically, on the training dataset, the R-squared value is 0.884, with a modest decline in performance on the test set, where the R-squared value is 0.858. These high levels of interpretation mean that the XGBoost regressor generalizes well to unseen data with minimum overfitting. The mean squared error on the test set is 0.105, with a corresponding root mean squared error of 0.324 and a mean absolute error of 0.201. The reverse logarithmic transformation of the model’s results in an R-squared of 0.827. The predictions differ from actual prices by a mean absolute error of 1.19 ETH. The RSME of 2.38 ETH reflects the typical magnitude of prediction errors for larger deviations. The results demonstrate that the model captures the pricing dynamics of NFTs on a log scale and their original prices and maintains a strong predictive ability.
The feature importance hierarchy of the RF regressor remains intact for the XGBoost regressor also (Figure 7), but with a minor increase in the importance of the lesser variables PriorSale_PCA2 and TimefromLastSale. PriorSale_PCA1 remains the key variable for XGBoost.
Figure 7.
XGBoost feature importances.
The KDE plot (Figure 8) shows that the predicted density closely follows the general price distribution, with slight discrepancies. The predicted density tends to overstate the frequency of observations near certain price peaks and slightly understate densities in intermediate ranges. The distribution reflects the presence of distinct clusters within the Market. Overall, the XGBoost model accurately represents the overall distribution and generates realistic price predictions.
Figure 8.
KDE density plot for price (XGBoost model).
5.2.4. Cross-Segment Predictive Performance of XGBoost with Hyperparameter Optimization
At segment level (Table 5) the XGBoost regressor performed best on Art and Collectible, with R-squared values of 0.848 and 0.840, respectively. The low RMSE (0.270 for Art, 0.320 for Collectible) and MAE (0.153 and 0.208, respectively) further support the model’s accuracy in predicting these asset classes. In the Game and Metaverse segments, the model’s performance declined to 0.691 and 0.594 R-squared values, while retaining the same level of errors, as measured by MAE and RMSE. Finally, the Utility segment, due to its nature and the lesser volume of observations, appears more challenging to interpret. Despite the lowest R-squared value of 0.458, the RMSE and MAE are low, which may indicate that price variation within this segment is narrower.
Table 5.
XGBOOST regressor performance metrics by NFT segment.
Upon examining the Actual vs. Predicted prices plot (Figure 9), it is evident that most NFT price predictions cluster closely around the ideal fit line. There appears to be an increased deviation at higher price levels, suggesting that predictions become less reliable as prices rise. This deviation likely reflects speculative behaviors within the NFT market at high price points.
Figure 9.
XGBoost actual vs. predicted NFT prices by color-coded segment.
Art and Metaverse NFT segments are more volatile, which translates to broader dispersion from the ideal line and less accurate predictions. Utility NFTs appear generally concentrated in lower price ranges. In Collectables and Collectibles and Game NFTs predictions are strongly along the ideal fit indicating that the model is highly effective.
Per Segment KDE plots (Figure 10) demonstrate close alignment between predicted and actual distributions particularly in the Art and Collectible categories where the density peaks overlap substantially. For Game and Metaverse segments, the KDE plots show broader actual price distributions relative to predictions, suggesting that the model underestimates variability in these categories. The sharp peak in the Utility segment at lower price levels exhibits a strong correlation between actual and predicted densities near the mode, although deviations are observed at the tails. The KDE plot illustrates that the model is proficient in pattern comprehension with minor limitations in segments with more complex price structures.
Figure 10.
XGBoost KDE of actual vs. predicted prices by color-coded segment.
On XGBoost feature importances for each segment (Figure 11), ProrSale_PCA1 remains the dominant predictor for prices. Especially Art and Collectible markets are highly influenced by historical transaction patterns, while other features contribution is minimal for these segments. For Game and Metaverse categories, contributions from Macro_PCA1 and TimefromLastSale are relatively larger, which makes prices in these segments more sensitive to global market indicators. Interestingly, the Utility segment displays a slightly more balanced distribution of feature importance. Here ProrSale_PCA2 and TimefromLastSale have a meaningful contribution.
Figure 11.
XGBoost feature importances per segment.
5.2.5. Optimized Multilayer Perceptron Neural Network
The optimal enforced MLP model explained a substantial portion of the variation in the target variable, achieving an R-squared value of 0.836. The MSE is 0.121 with a corresponding RMSE of 0.348. By inverting the log transformation, R-squared drops slightly to 0.794. On average, the model’s predictions deviate by a MAE of 1.361 ETH from the actual price, and the RMSE is 2.597. The MPL has a generally good fit across the entire dataset, with high explanatory ability and modest errors.
Permutation importance (Figure 12) shows PriorSale_PCA1 as the most influential variable for the MLP model. Macro_PCA1, TimefromlastSale, and PriorSale_PCA2 have minor contributions. The MLP model captures the price patterns at a sufficient level as observed on the KDE density plot (Figure 13). Both the predicted and actual prices exhibit a similar multi-modal shape; the model appears to be more consistent at lower price values. However, there is an apparent discrepancy in less-frequent high values, and the model slightly tends to overestimate the frequency of mid-to-high-priced NFTs.
Figure 12.
MLP feature importances.
Figure 13.
KDE density plot for price (MLP model).
5.2.6. Cross-Segment Predictive Performance of the Optimized Multilayer Perception Neural Network
The tuned MLP evaluation at the segment level reveals varying performance across NFT categories (Table 6). Art and Collectible segments demonstrate the strongest fit, with R-squared values of 0.805 and 0.821, respectively, and relatively low errors that are close to the model’s estimates on the entire dataset. Predictive power appears to be reduced in the Game and Metaverse segments, with an increased error level, but still close to the overall performance. In contrast, the R-squared values decreased to 0.616 and 0.551.
Table 6.
MLP performance metrics by NFT segment.
The Utility segment also exhibits low R-squared values but with minimal errors. The model generalizes well with strong performance for segments with larger and more stable datasets. This strong performance is also evident in the scatterplot of actual versus predicted prices (Figure 14). Collectible NFTs, shown in orange, dominate the distribution, and their predictions are closely clustered around the diagonal of actual prices. For the Art and Game segments, we observe a broader positioning of the predictions, especially at lower price levels. The distribution of Metaverse NFT predictions is dense and slightly skewed below the ideal line. Predictions for utility tokens follow expected prices with minor deviations. The model’s output is consistent with the ideal fit universally; however, the level of consistency varies across each segment, indicating that there are also unique patterns in prices within each segment.
Figure 14.
MLP actual vs. predicted NFT prices by color-coded segment.
For Art and Game segments, we observe a broader positioning of the predictions, especially at lower price levels. The distribution of Metaverse NFT predictions is dense and slightly skewed below the ideal line. Utility tokens’ predictions follow expected prices with minor differences.
The patterns in the scatterplot of each segment reveal their uniqueness and similarities. The model’s output is consistent with the ideal fit universally; however, the level of consistency varies across each segment, indicating that there are also unique patterns in prices within each segment.
The KDE density plot (Figure 15) also demonstrates a strong alignment between predicted and actual price distributions, as previous validation checks suggested. Of course, there is a level of deviance among segments. The MLP model on Game and Metaverse segments displays intermediate performance, most notably at the tails and at the distribution’s width. The model also failed to capture the tail behavior in the Collectible sector, but manages to partially reproduce the main structure. For the Art and Utility segments, the predicted values closely match the shape and central tendency of the actual ones. The MLP model’s predictions align with the general price patterns sufficiently.
Figure 15.
MLP KDE of actual vs. predicted prices by color-coded Segment.
The permutation feature importance across the five segments (Figure 16) recognizes a structural dependence on PriorSale_PCA1, the primary sales component. The primary variable’s dominance is a strong indicator that prior price behavior drives future NFT evaluations. This phenomenon appears firmer in the Art and Collectible segments because these markets rely heavily on the reputation of the NFT’s collection or creator, which is reflected in the previous sales. The Game and Metaverse segments show a minor increase in relevance among secondary features such as Macro_PCA1 and TimefromLastSale. The nature of these segments, especially the Metaverse as a digital real estate universe, is potentially more sensitive to global asset exchange rates.
Figure 16.
MLP feature importances per segment.
For Utility NFTs, Macro_PCA1 also registers a comparatively higher importance than other segments. The prices of NFTs acquired for use as tools or mediums often fluctuate in response to real-world economic conditions, external use cases, or demand factors. Despite the minor diversity, a general hierarchy in feature importance prevails, with similar contributions across all segments, reinforcing the notion of a single model capable of making cross-segment predictions.
5.2.7. Comparative Analysis of Predictive Model Performance
Following the results of the three advanced machine learning methods—Random Forest, XGBoost, and a Multilayer Perceptron—that were trained for NFT price prediction, a comparative representation of the evaluation metrics reveals key observations. This comparative assessment is crucial for understanding model generalization, interpretation abilities, and effectiveness across the complex NFT universe. An initial observation is the notably high levels of R-squared values, with no signs of overfitting, as confirmed by our evaluation checks. These high levels may be attributed to the highly fluctuating NFT market of the sampling period. In such environments, due to the large volume of transactions, past and future sales tend to exhibit similar patterns.
Building on the well-established notion that linear models fail to capture NFT price trends, our results (Table 7) confirm the past literature suggestion that the three models have potentially high predictive power on NFT prices. The thorough evaluation demonstrates consistent advantages for the tuned XGBoost model.
Table 7.
Performance of ML models on the full dataset.
The model outperforms in predictive ability both on Log-Transformed Prices and at the ETH scale. XGBoost achieved the highest R-squared value in both the test and training datasets, along with the lowest MAE and RMSE. The model’s predictions demonstrated a tighter clustering to the actual prices and increased accuracy for mid-value NFTs. XGBoost exhibited superiority sustainably across individual segments (Table 8), more importantly, for high-value segments like Art and Collectibles.
Table 8.
Model performance by segment: evaluation metrics.
With similar performance, the tuned Random Forest follows, delivering robust accuracy metrics that are very close to those of XGBoost. The RF model demonstrated its well-known strength in capturing complex interactions among the data; its predictions are only marginally less effective than those of XGBoost. In addition to high-priced NFTs, the RF model’s predictions were more distant than those of XGBoost. Ensemble learning methods based on decision trees effectively combine effectiveness, accuracy, and ease of interpretability in NFT price prediction.
Beyond statistical performance differences, the comparative results provide important insights into the economic mechanisms underlying NFT price formation. Across all three models, the principal component capturing prior sales history emerges as the dominant predictor, indicating strong path dependence in NFT pricing. This suggests that market participants rely heavily on historical transaction outcomes as signals of value, reputation, and perceived quality. Such behavior is consistent with earlier empirical evidence in NFT markets (e.g., Nadini et al., 2021; Dawod et al., 2023) and contrasts with traditional financial assets, where prices are more tightly anchored to fundamentals. The findings therefore point to limited informational efficiency and a reputation-driven valuation process, in which past prices act as a coordinating signal for future trades rather than merely reflecting intrinsic value.
The MPL networks are capable of capturing nuanced nonlinear relationships. In practice, despite extensive hyperparameter tuning, the MLP proved less effective than the decision tree-based models. Particularly in high-heterogeneity segments such as Game and Metaverse, the MLP model did not achieve the same level of predictive accuracy, exhibiting slightly higher errors compared to its counterparts and a comparatively lower degree of interpretability. MLP’s predictions illustrated notable dispersion for mid-to-high price ranges and greater variance for high price levels. Potentially, the MLP could benefit from data scaling, suggesting that a larger volume of data and increased features would be beneficial.
Segment-wise, all models consistently predicted prices more accurately in the Art and Collectible segments, which are more established markets, revealing a more stable price behavior. On the other hand, the Game and Metaverse Segments are much more volatile markets and harder to interpret, with lower R-squared values for all models and higher error levels. Utility NFTs appeared to be more sensitive to macro and temporal features due to their functional use and being less driven by speculative interest.
On interpretability and decision logic of the three models, the same variable consistently emerged as the most influential in feature importance tests. PriorSale_PCA1, a synthetic feature derived from historical sales data, proved to be the most effective predictor of NFT prices. This underscores the importance of a token and its collection’s reputation as depicted throughout past transactions, in shaping future market value. Besides the primary feature, the extent to which models incorporate Macro_PCA1 varies, and decision tree-based models attributed more importance to it than MLP.
The predictive performance achieved in this study compares favorably with prior empirical work on NFT price prediction. Existing studies typically report moderate explanatory power and focus on narrow subsets of NFTs—often limited to single collections or specific market segments—and rely on restricted feature sets or single modeling approaches (e.g., Dawod et al., 2023; Z. Wang et al., 2023; Bagili, 2024). In contrast, the proposed framework integrates structured transaction-level feature engineering, dimensionality reduction, and cross-segment evaluation, yielding consistently strong out-of-sample performance across heterogeneous NFT categories. Moreover, the results show that tree-based ensemble methods particularly XGBoost achieve robust predictive accuracy while maintaining a higher degree of interpretability than deep learning alternatives. The notion that all social signaling in incorporated in past sale prices under EMH and the exclusion of noisy social variables created variables generated allowed for robust results. These findings extend existing empirical evidence by demonstrating that predictive accuracy and interpretability need not be mutually exclusive in NFT valuation models when feature engineering and dimensionality reduction are carefully designed.
5.3. Practical Implications for Investors and DeFi Markets
The empirical findings of this study carry several practical implications for investors, creators, and decentralized finance (DeFi) market participants. Most notably, the strong and consistent dominance of prior transaction history in predicting future NFT prices highlights the central role of reputation and path dependence in NFT valuation. For investors, this implies that historical price information, both at the token and creator or collection level, constitutes a sufficient and economically meaningful signal for assessing future valuation prospects. Rather than relying on noisy external indicators or subjective assessments, market participants can focus on recent transaction patterns as a transparent and readily observable source of information.
From an investment perspective, the results suggest that NFT markets exhibit limited informational efficiency relative to traditional financial assets. Prices appear to be anchored primarily to past transactions rather than to forward-looking fundamentals, which creates predictable structures that can be exploited for valuation, portfolio construction, and risk management. For example, investors seeking exposure to NFTs may use models such as the one proposed in this study to benchmark observed prices against model implied values, helping to identify potentially over or under-priced assets within established collections.
The findings are also relevant for DeFi protocols that integrate NFTs as collateral, valuation inputs, or components of financial products. Reliable and interpretable pricing mechanisms are essential for collateralized lending, liquidation thresholds, and risk controls. The proposed machine learning architecture provides a data driven alternative to heuristic floor-price rules or oracle systems that rely on sparse or outdated information. By incorporating recent transaction history and market wide signals, such models can support more stable and transparent valuation frameworks, reducing systemic risk arising from mispricing or abrupt market corrections.
Moreover, the observed heterogeneity across NFT segments has direct implications for market design and participant behavior. Art and Collectible NFTs, which exhibit higher predictability and stronger dependence on historical prices, are more suitable candidates for structured financial applications such as lending or fractionalization. In contrast, Game and Metaverse NFTs display greater volatility and weaker predictability, suggesting that higher risk buffers or conservative valuation rules may be necessary when these assets are used in DeFi contexts.
Finally, the emphasis on interpretability distinguishes the proposed framework from purely black-box approaches. By demonstrating that a compact set of economically meaningful features particularly recent transaction history drives predictive performance, the study provides actionable insights that can be understood and trusted by market participants. This balance between predictive accuracy and interpretability enhances the practical usability of machine-learning models in NFT markets and supports their adoption by investors, platforms, and protocol designers.
6. Conclusions
This study provides empirical support for both hypotheses formulated in the paper. Consistent with (H1), the results show that machine-learning models combining transaction-level information and macro-financial features achieve statistically significant out-of-sample predictive accuracy for NFT prices across multiple market segments. In line with (H2), the findings further indicate that features derived from recent transaction history play a dominant role in explaining predictive performance relative to macro-financial factors. Together, these results highlight the importance of historical price information and path-dependent dynamics in NFT valuation and demonstrate that carefully structured and interpretable feature representations enable robust price prediction in markets characterized by non-fungibility and sparse trading. To support this task, we constructed a dataset through systematic data extraction and transformation methodologies that effectively integrated historical transactional metadata and economic indicators—the combination of advanced feature engineering methods, domain knowledge, manual process, alongside automated Deep Feature Synthesis. Principal Component Analysis and feature selection shaped the final feature set. The implementation of Random Forest, XGBoost, and Multilayer Perceptron models provided critical insights for their predictive performance and practical interpretation within the NFT universe. Each model was tuned following an optimization of hyperparameters procedure to maximize performance.
The empirical results indicate that the XGBoost model consistently outperforms other approaches, delivering superior predictive accuracy both overall and across individual NFT segments, supporting the notion that XGBoost is well-suited for the complex, non-linear relationships of the NFT market. Random Forest demonstrated similarly high accuracy, confirming the efficacy of tree-based ensemble methods in managing the variability inherent in NFT data. The neural network, although slightly less accurate, demonstrated substantial promise, particularly given its adaptability to capture intricate nonlinear interactions.
Notably, our findings reinforce the dominant role of prior sales history, represented through the principal component PriorSale_PCA1. This highlights the strong correlation between token and creator reputation and their impact on sale prices. Information contained in a small window of recent transaction history—specifically the most recent sales of an NFT together with recent sales within its collection—is sufficient to predict future prices with high accuracy, reflecting pronounced price persistence and reputation effects in NFT markets. This insight highlights an important area of practical consideration for stakeholders in the NFT ecosystem. Global market economic indicators and transaction timing also provided valuable contributions to interpretation, suggesting additional features for future research.
Segment-wise performance analyses reveal the similarities and differentiations in dynamics in various NFT categories. Art and Collectible segments exhibited clearer patterns and higher predictability, reflecting their established market stability. Conversely, the Game, Metaverse, and Utility segments presented greater variability and complexity, indicating potential areas for methodological improvements and enrichment in feature development.
The present work has achieved significant predictive accuracy, as evidenced by elevated R-squared values and reasonably low mean absolute errors. Thus, providing investors with valuable insights into the future price value of established tokens and informing decision-making in the NFT universe. These high R-squared values may be attributed to the highly fluctuating NFT market during the sampling period. In such environments, due to the large volume of transactions, past and future sales tend to exhibit similar patterns.
In conclusion, this research substantially advances our understanding of NFT price dynamics through the use of sophisticated, interpretable machine learning models. It sets a robust methodological benchmark for future studies and offers actionable insights for both researchers and practitioners navigating the evolving NFT market.
6.1. Limitations
Our data are sourced from an Ethereum block explorer. Following data preprocessing and transformation, feature engineering and selection, our dataset was restricted to transactions of tokens that had been sold at least three times during the observation period. Despite the original 0.4M transactions, the research would benefit from an expansion of data. Additionally, complementary features should be included that enrich our feature variables, given the dominance of our primary variable.
6.2. Future Research
NFT markets exhibit substantial heterogeneity across categories such as art, collectibles, gaming-related NFTs, and metaverse assets, which differ in economic characteristics, usage values, and demand drivers. While the present study provides a unified predictive framework and a segment-level evaluation, developing fully category-specific valuation models—incorporating utility-based or network-driven mechanisms—constitutes a promising direction for future research that would require distinct data sources and methodological approaches.
Future research should also explore live blockchain data feeds as well as the development of other advanced machine learning approaches, such as convolutional neural networks and transformer models. Implementing a real-time data pipeline would generate a significantly larger volume of transactional data, enable alternative techniques and supporting faster investment decisions.
Funding
The Article Processing Charge (APC) was funded by the Department of Management Science and Technology, Athens University of Economics and Business.
Institutional Review Board Statement
Not applicable.
Informed Consent Statement
Not applicable.
Data Availability Statement
The data used in this study are publicly available from the sources described in the Data Description section, including blockchain explorers and publicly accessible market data providers.
Conflicts of Interest
The author declares no conflict of interest.
Appendix A
Table A1.
NFT segments.
Table A2.
Digital currency.
Table A3.
Initial variable description.
Table A4.
Digital markets.
Table A5.
Descriptive statistics of the initial dataset.
Table A6.
Correlation matrix of initial numeric variables.
Figure A1.
Distribution of NFT Segment.
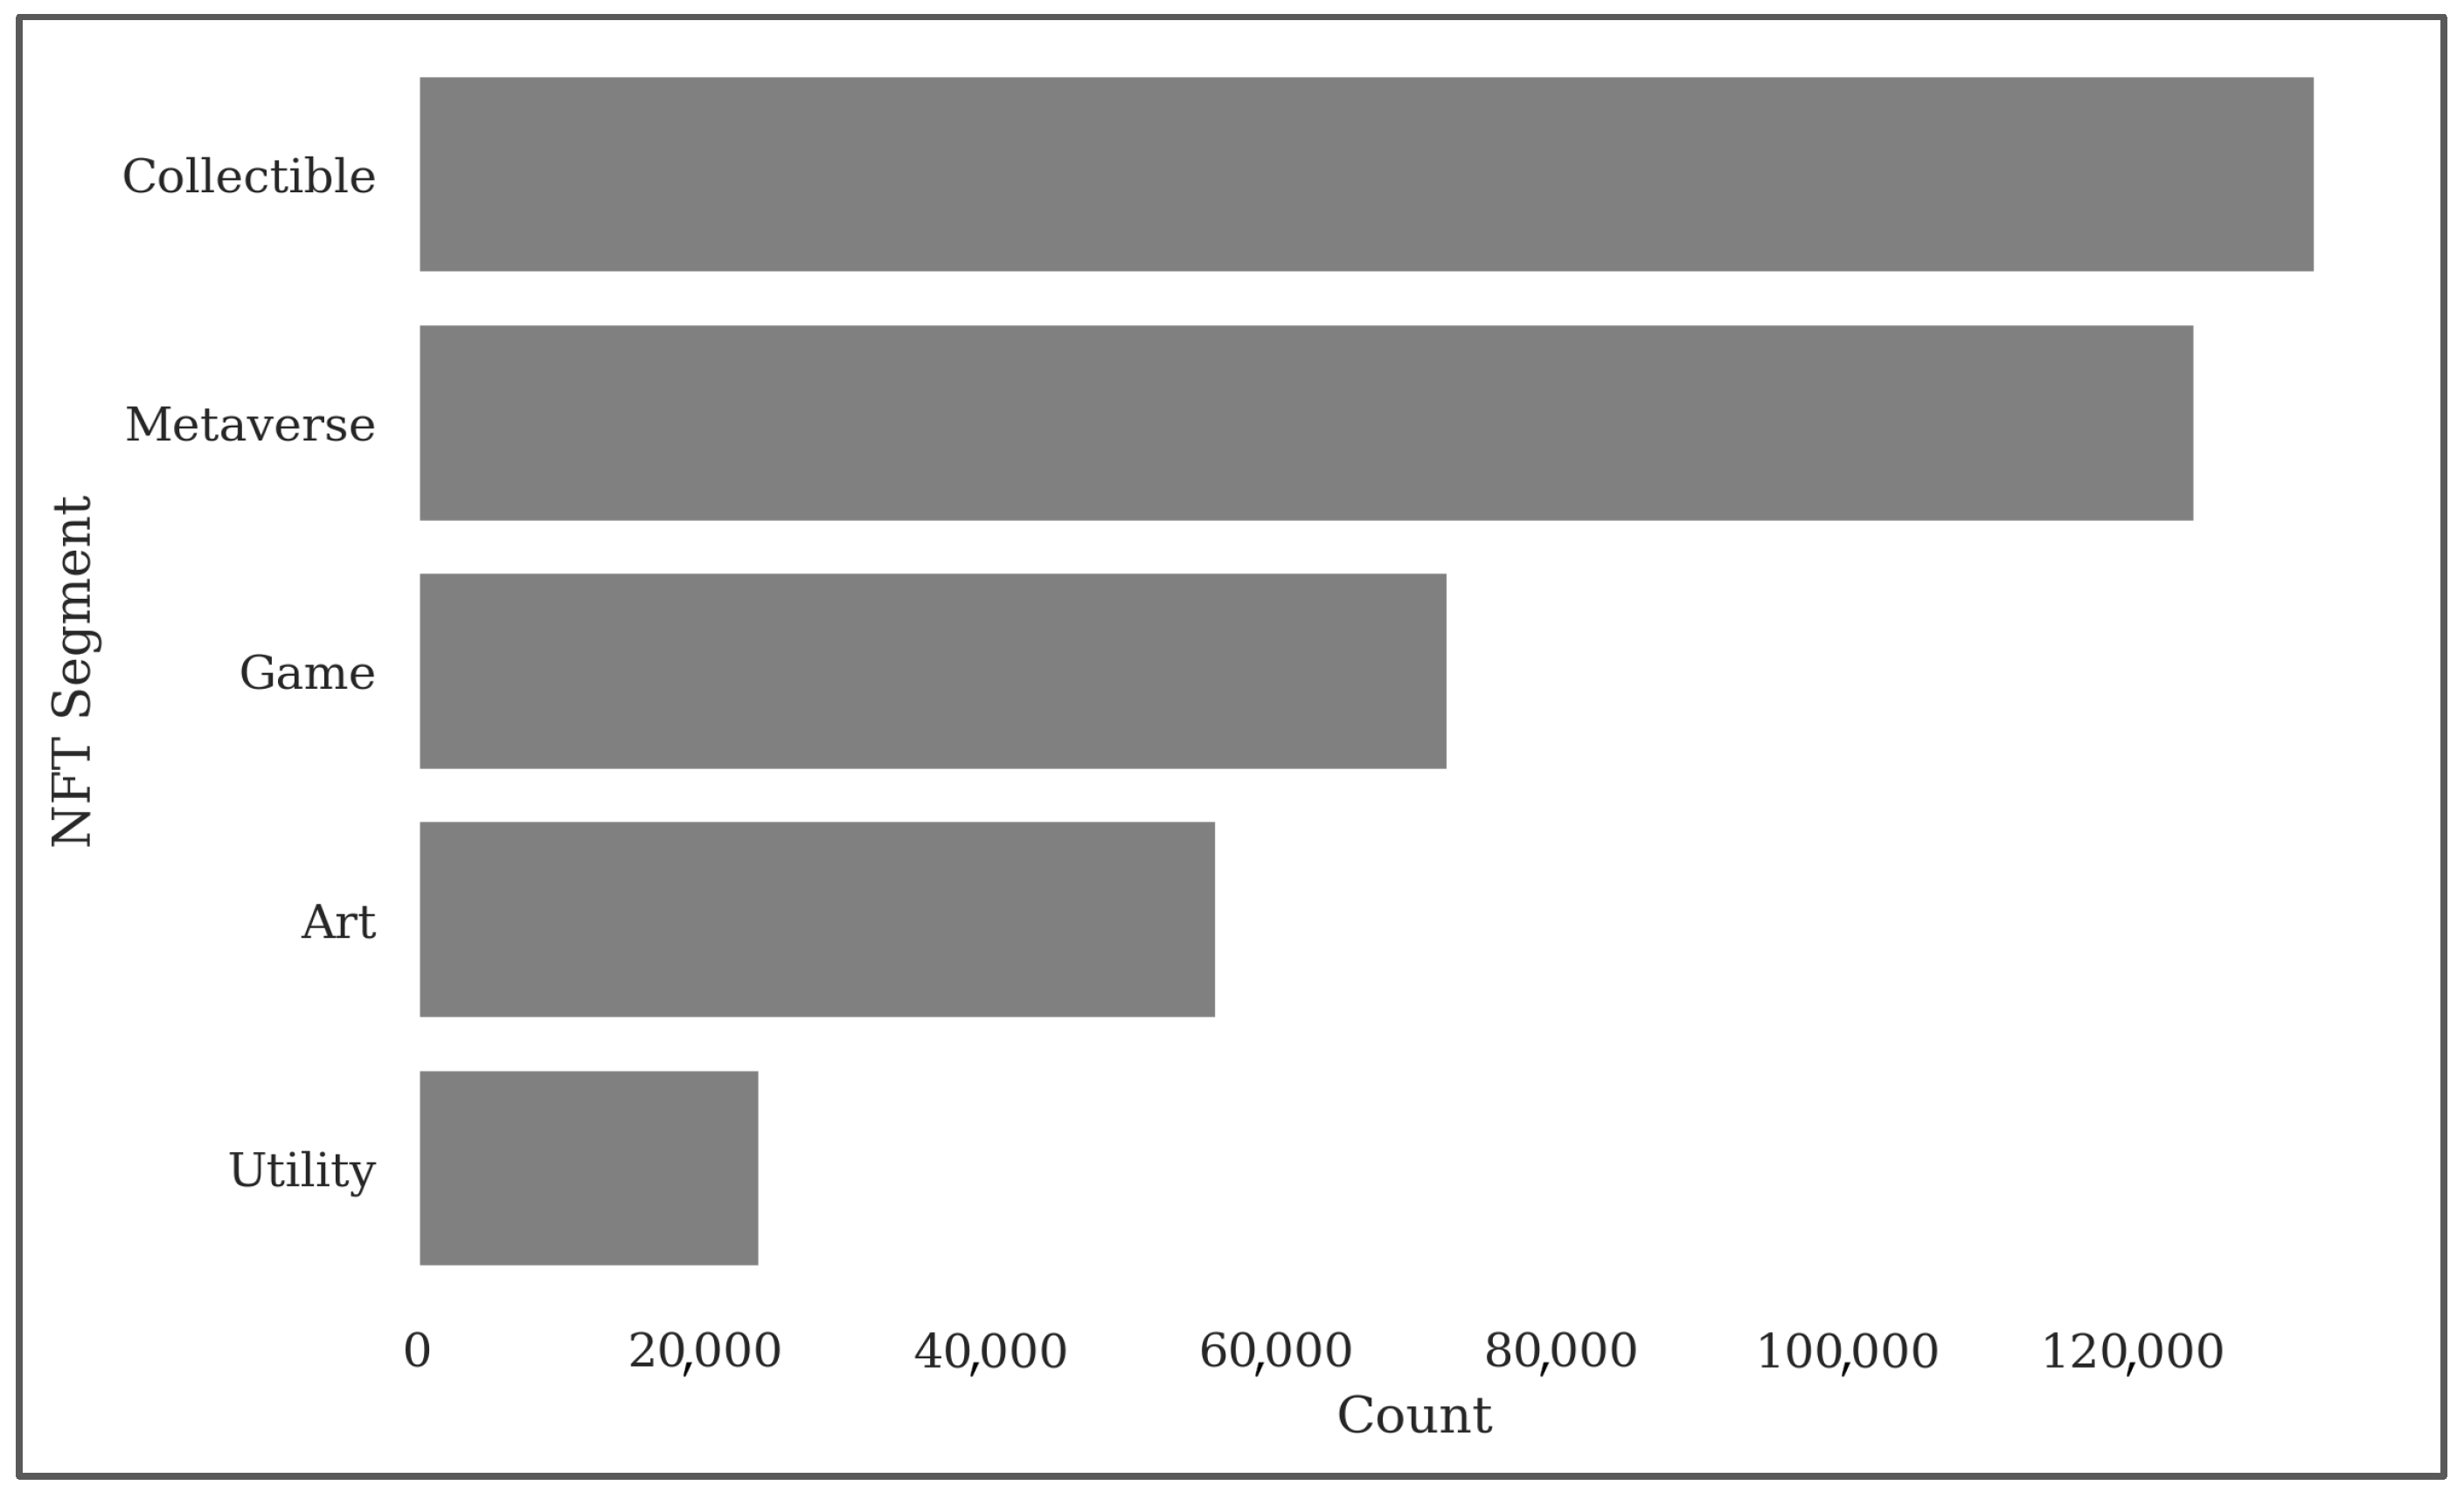
Figure A2.
Top 10 NFT creators.
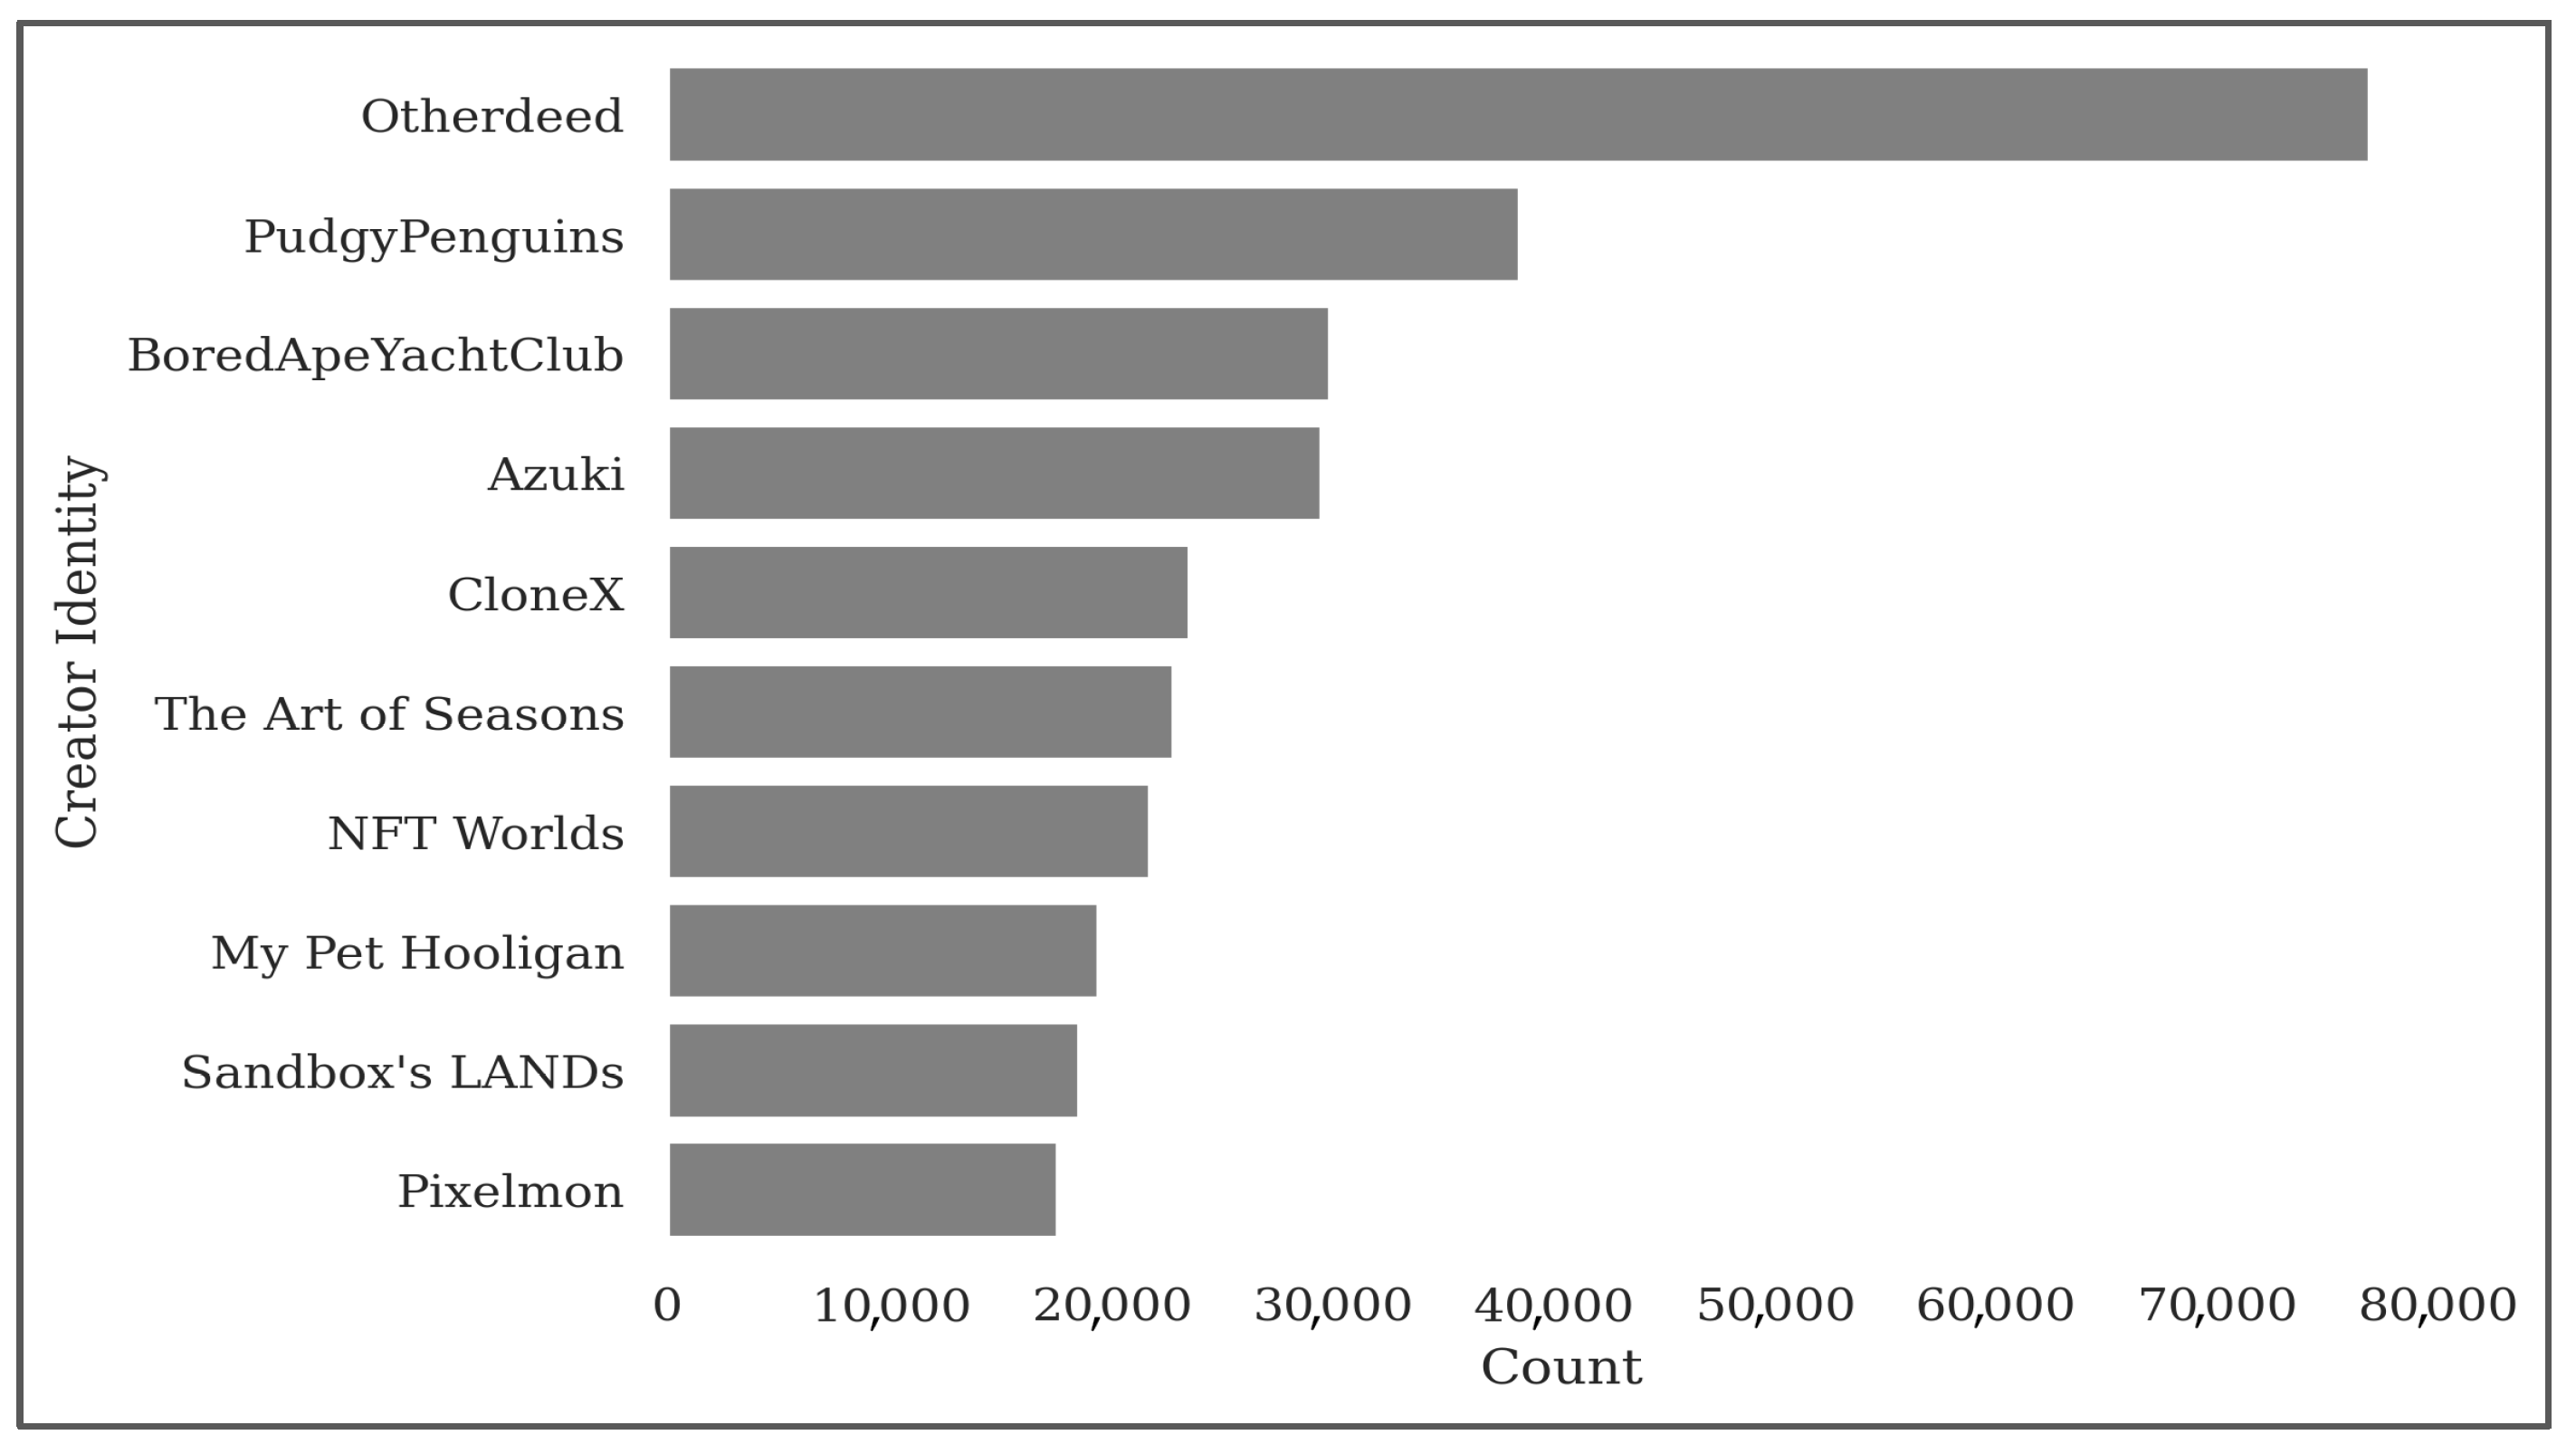
Figure A3.
Distribution of transaction types.
References
- Ali, O., Momin, M., Shrestha, A., Das, R., Alhajj, F., & Dwivedi, Y. K. (2023). A review of the key challenges of non-fungible tokens. Technological Forecasting and Social Change, 187, 122248. [Google Scholar] [CrossRef] [Scilit]
- Ante, L. (2022). The non-fungible token (NFT) market and its relationship with bitcoin and ethereum. FinTech, 1(3), 216–224. [Google Scholar] [CrossRef] [Scilit]
- Bagili, A. P. (2024). NFT price prediction using machine learning [Master’s thesis, San José State University]. [Google Scholar] [CrossRef] [Scilit]
- Breiman, L. (2001). Random forests. Machine Learning, 45(1), 5–32. [Google Scholar] [CrossRef] [Scilit]
- Brownlee, J. (2019). How to choose an activation function for deep learning. Machine Learning Mastery. Available online: https://machinelearningmastery.com/choose-an-activation-function-for-deep-learning/ (accessed on 2 June 2025).
- Cassady, D. (2021, December 6). NFT project the merge breaks records with USD 91.8 million in sales. The Art Newspaper 2021. Available online: https://www.theartnewspaper.com/2021/12/06/nft-sells-for-dollar918m-on-nifty-gateway-possibly-achieving-the-highest-ever-sale-for-a-work-by-a-living-artist (accessed on 24 January 2025).
- Chen, T., & Guestrin, C. (2016, August 13–17). XGBoost: A scalable tree boosting system. 22nd ACM SIGKDD International Conference on Knowledge Discovery and Data Mining (pp. 785–794), San Francisco, CA, USA. [Google Scholar] [CrossRef] [Scilit]
- Dawod, A., Munkhdalai, L., Park, K. H., Ryu, K. H., & Pham, V. H. (2023, February 9–11). NFT appraisal using machine learning. 5th Asia Pacific Information Technology Conference (APIT 2023) (pp. 160–166), Ho Chi Minh City, Vietnam. [Google Scholar] [CrossRef] [Scilit]
- Ding, J., Du, J., Wang, H., & Xiao, S. (2025). A novel two-stage feature selection method based on random forest and improved genetic algorithm for enhancing classification in machine learning. Scientific Reports, 15, 16828. [Google Scholar] [CrossRef] [Scilit] [PubMed]
- Fama, E. F. (1970). Efficient capital markets: A review of theory and empirical work. The Journal of Finance, 25(2), 383–417. [Google Scholar] [CrossRef] [Scilit]
- Feature Labs. (2024). Featuretools documentation: Deep feature synthesis. Available online: https://docs.featuretools.com (accessed on 2 June 2025).
- Flamini, M., & Naldi, M. (2025). What is the right price for non-fungible tokens (NFTs)? A systematic review of the current literature. FinTech, 4, 73. [Google Scholar] [CrossRef] [Scilit]
- Heaton, J. (2017). An empirical analysis of feature engineering for predictive modeling. arXiv, arXiv:1701.07852. [Google Scholar]
- Iosif, E., & Katelaris, L. (2024). Integrating machine learning with non-fungible tokens. Computers, 13, 147. [Google Scholar] [CrossRef] [Scilit]
- Kanter, J. M., & Veeramachaneni, K. (2015). Deep feature synthesis: Towards automating data science endeavors. In Proceedings of the 2015 IEEE international conference on data science and advanced analytics (DSAA) (pp. 1–10). IEEE. [Google Scholar] [CrossRef] [Scilit]
- Kong, D.-R., & Lin, T.-C. (2023). Alternative investments in the fintech era: The risk and return of non-fungible token (NFT). SSRN 2021, SSRN Scholarly Paper No. 3914085. Available online: https://ssrn.com/abstract=3914085 (accessed on 24 January 2026).
- Lee, M.-F., Li, J.-T., Lin, W.-R., & Wang, Y.-H. (2025). Evaluation of digital asset investment platforms: A case study of non-fungible tokens (NFTs). AppliedMath, 5, 3. [Google Scholar] [CrossRef] [Scilit]
- Luo, J., Jia, Y., & Liu, X. (2023). Understanding NFT Price Moves through Tweets Keywords Analysis. In Proceedings of the 2023 ACM Conference on Information Technology for Social Good (GoodIT ’23) (pp. 410–418). Association for Computing Machinery. [Google Scholar] [CrossRef] [Scilit]
- Nadini, M., Alessandretti, L., Di Giacinto, F., Martino, M., Aiello, L. M., & Baronchelli, A. (2021). Mapping the NFT revolution: Market trends, trade networks, and visual features. Scientific Reports, 11(1), 20902. [Google Scholar] [CrossRef] [Scilit]
- Rumelhart, D. E., Hinton, G. E., & Williams, R. J. (1986). Learning representations by back-propagating errors. Nature, 323(6088), 533–536. [Google Scholar] [CrossRef] [Scilit]
- Scikit-learn Developers. (2024). Sklearn.decomposition. PCA: Principal component analysis (PCA). Scikit-learn. Available online: https://scikit-learn.org/stable/modules/generated/sklearn.decomposition.PCA.html (accessed on 2 June 2025).
- Sprenger, T. O., Tumasjan, A., Sandner, P. G., & Welpe, I. M. (2014). Tweets and trades: The information content of stock microblogs. European Financial Management, 20(5), 926–957. [Google Scholar] [CrossRef] [Scilit]
- Tetlock, P. C. (2007). Giving content to investor sentiment: The role of media in the stock market. The Journal of Finance, 62(3), 1139–1168. [Google Scholar] [CrossRef] [Scilit]
- Wang, Q., Li, R., Wang, Q., & Chen, S. (2021). Non-fungible token (NFT): Overview, evaluation, opportunities and challenges. arXiv, arXiv:2105.07447. Available online: https://arxiv.org/abs/2105.07447 (accessed on 29 November 2025).
- Wang, Z., Chen, Q., & Lee, S.-J. (2023). Prediction of NFT sale price fluctuations on opensea using machine learning approaches. Computers, Materials & Continua, 75, 2443–2459. [Google Scholar] [CrossRef] [Scilit]
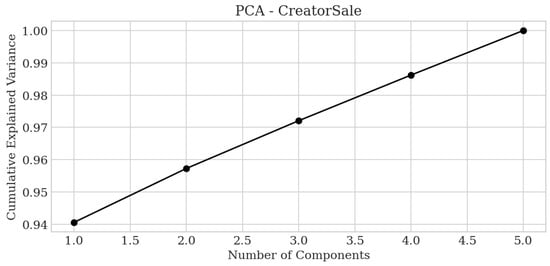
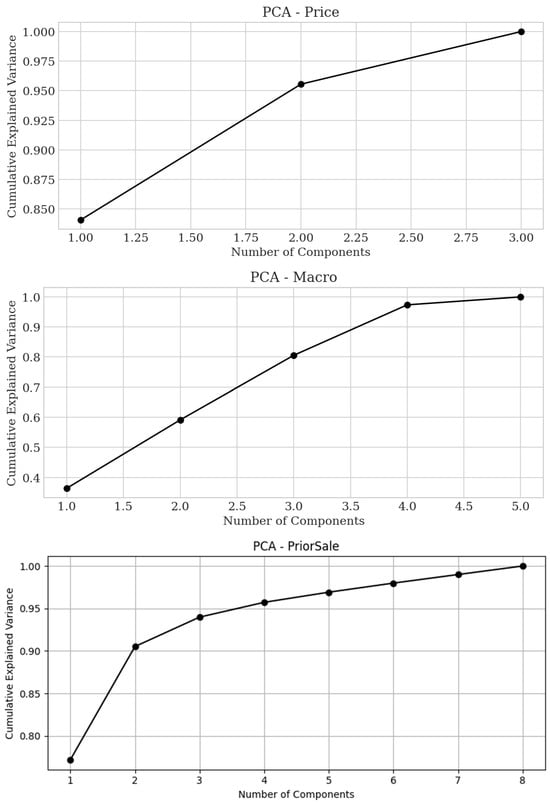
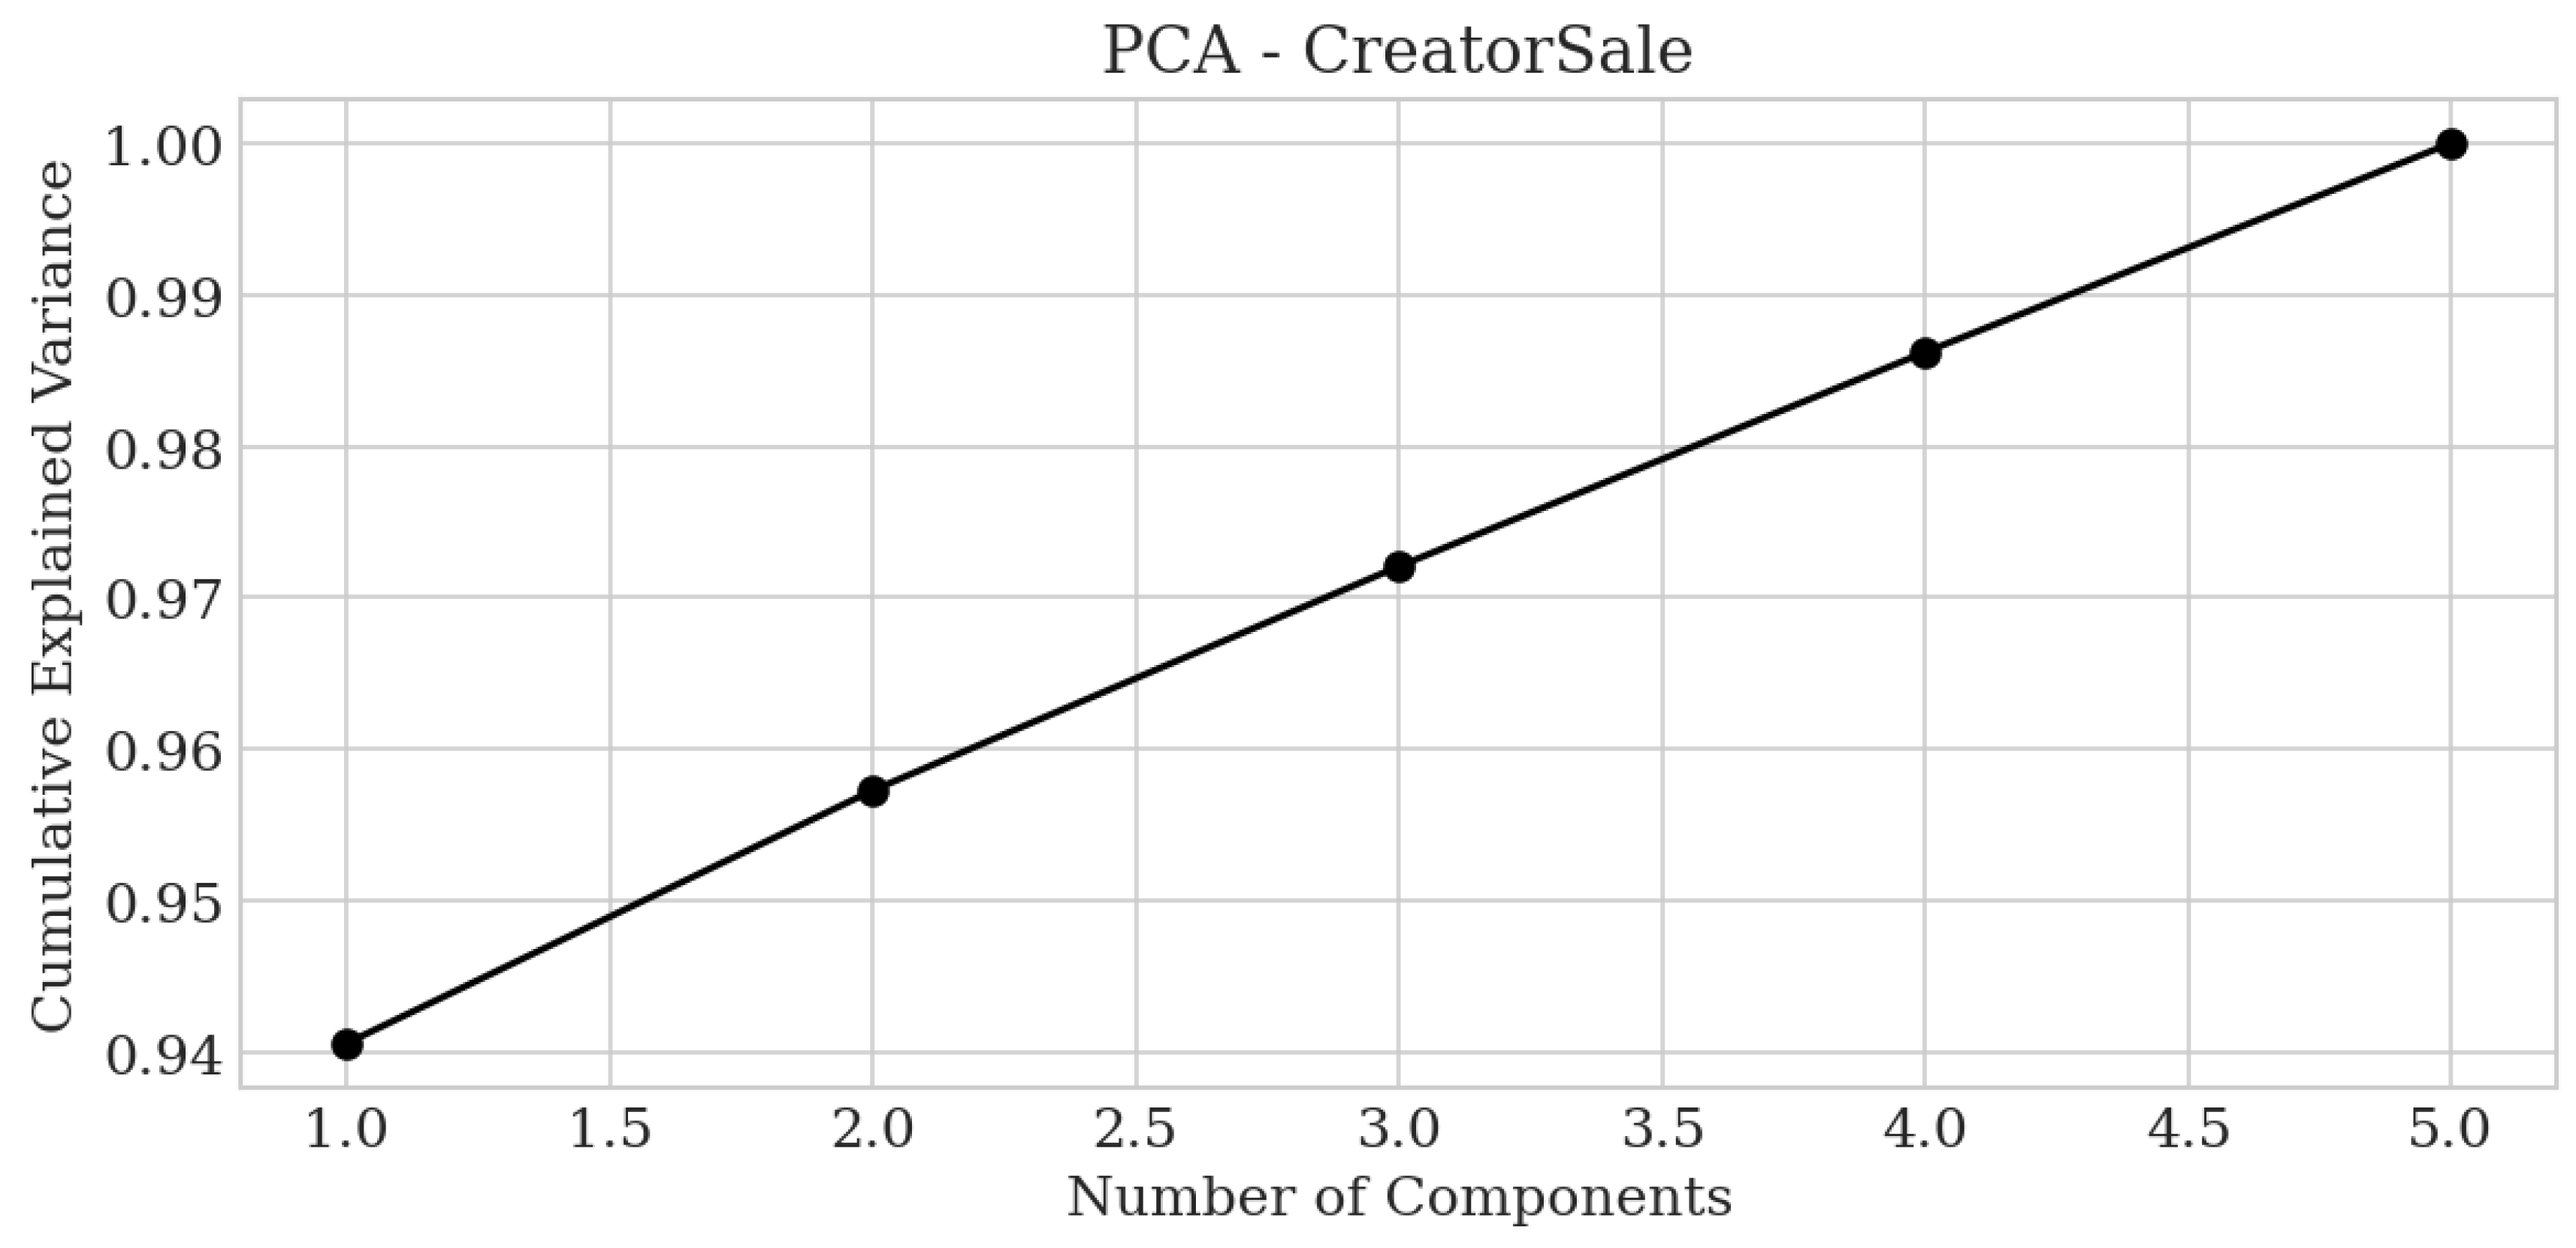
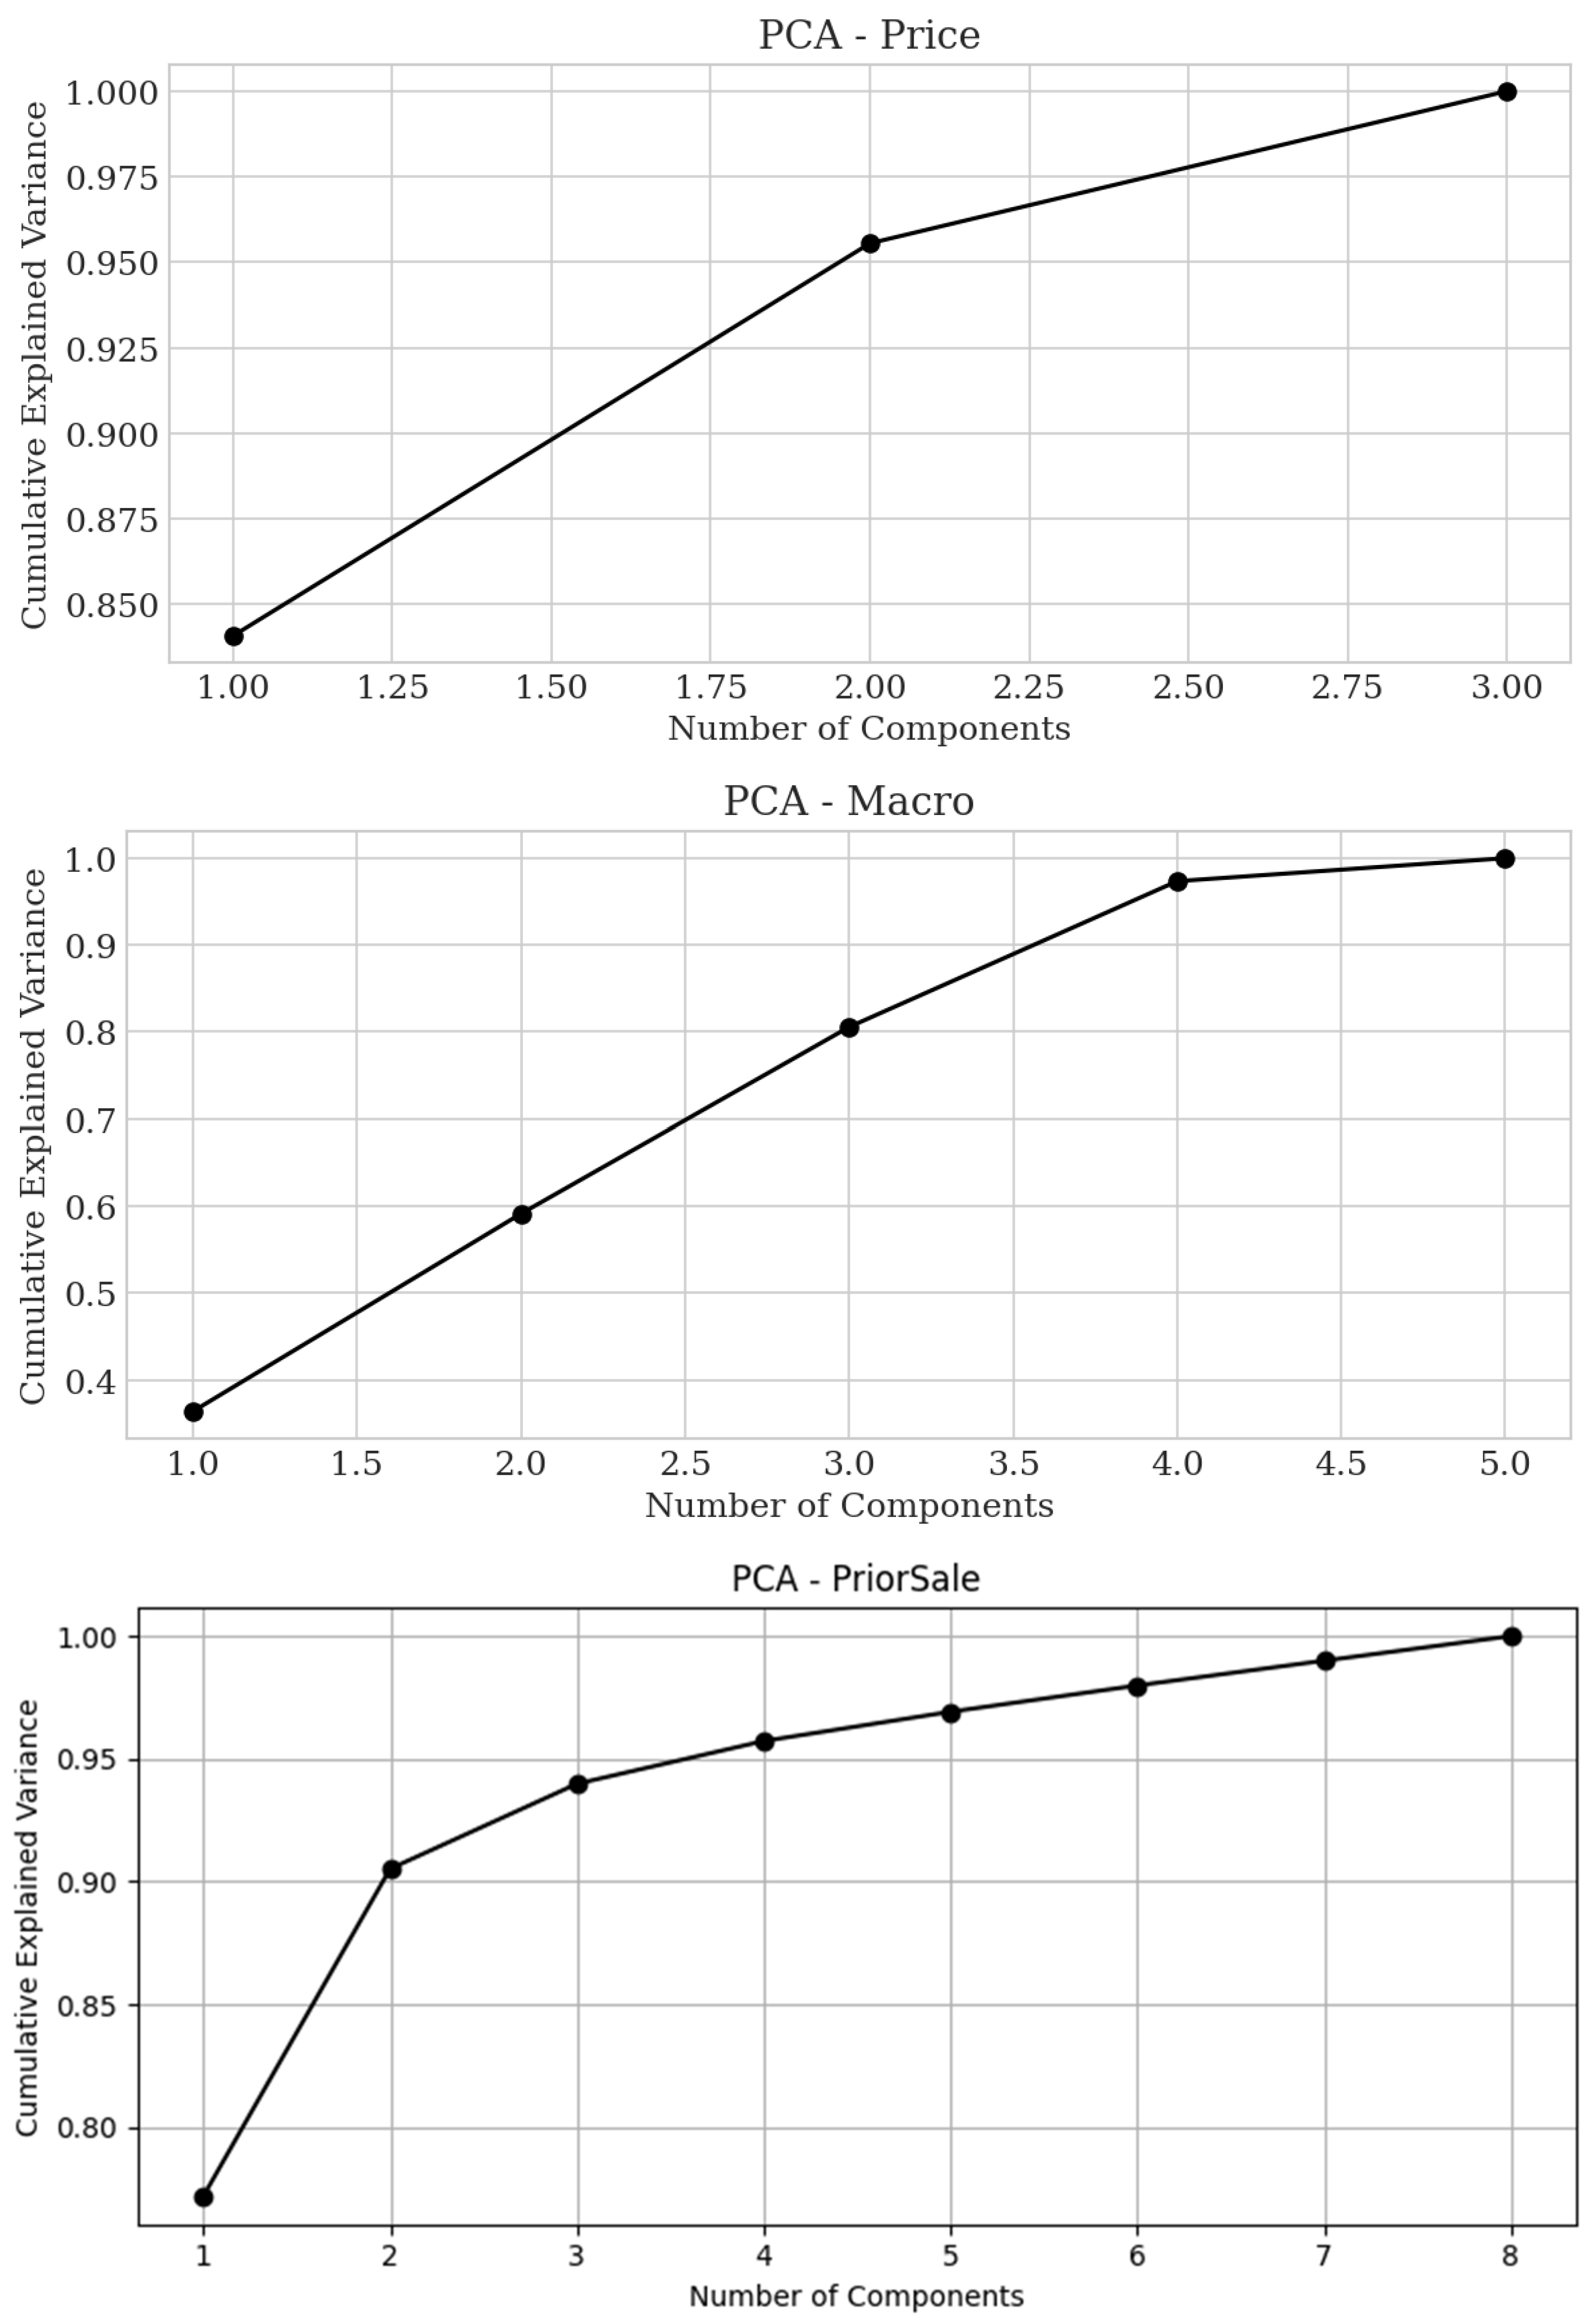
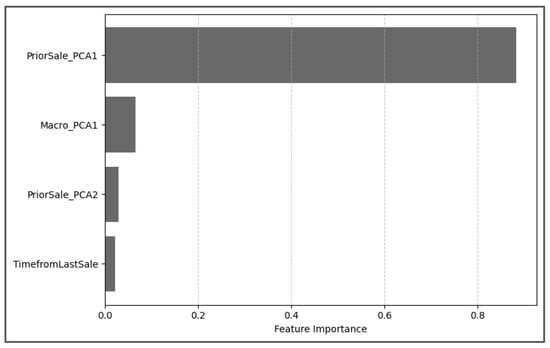
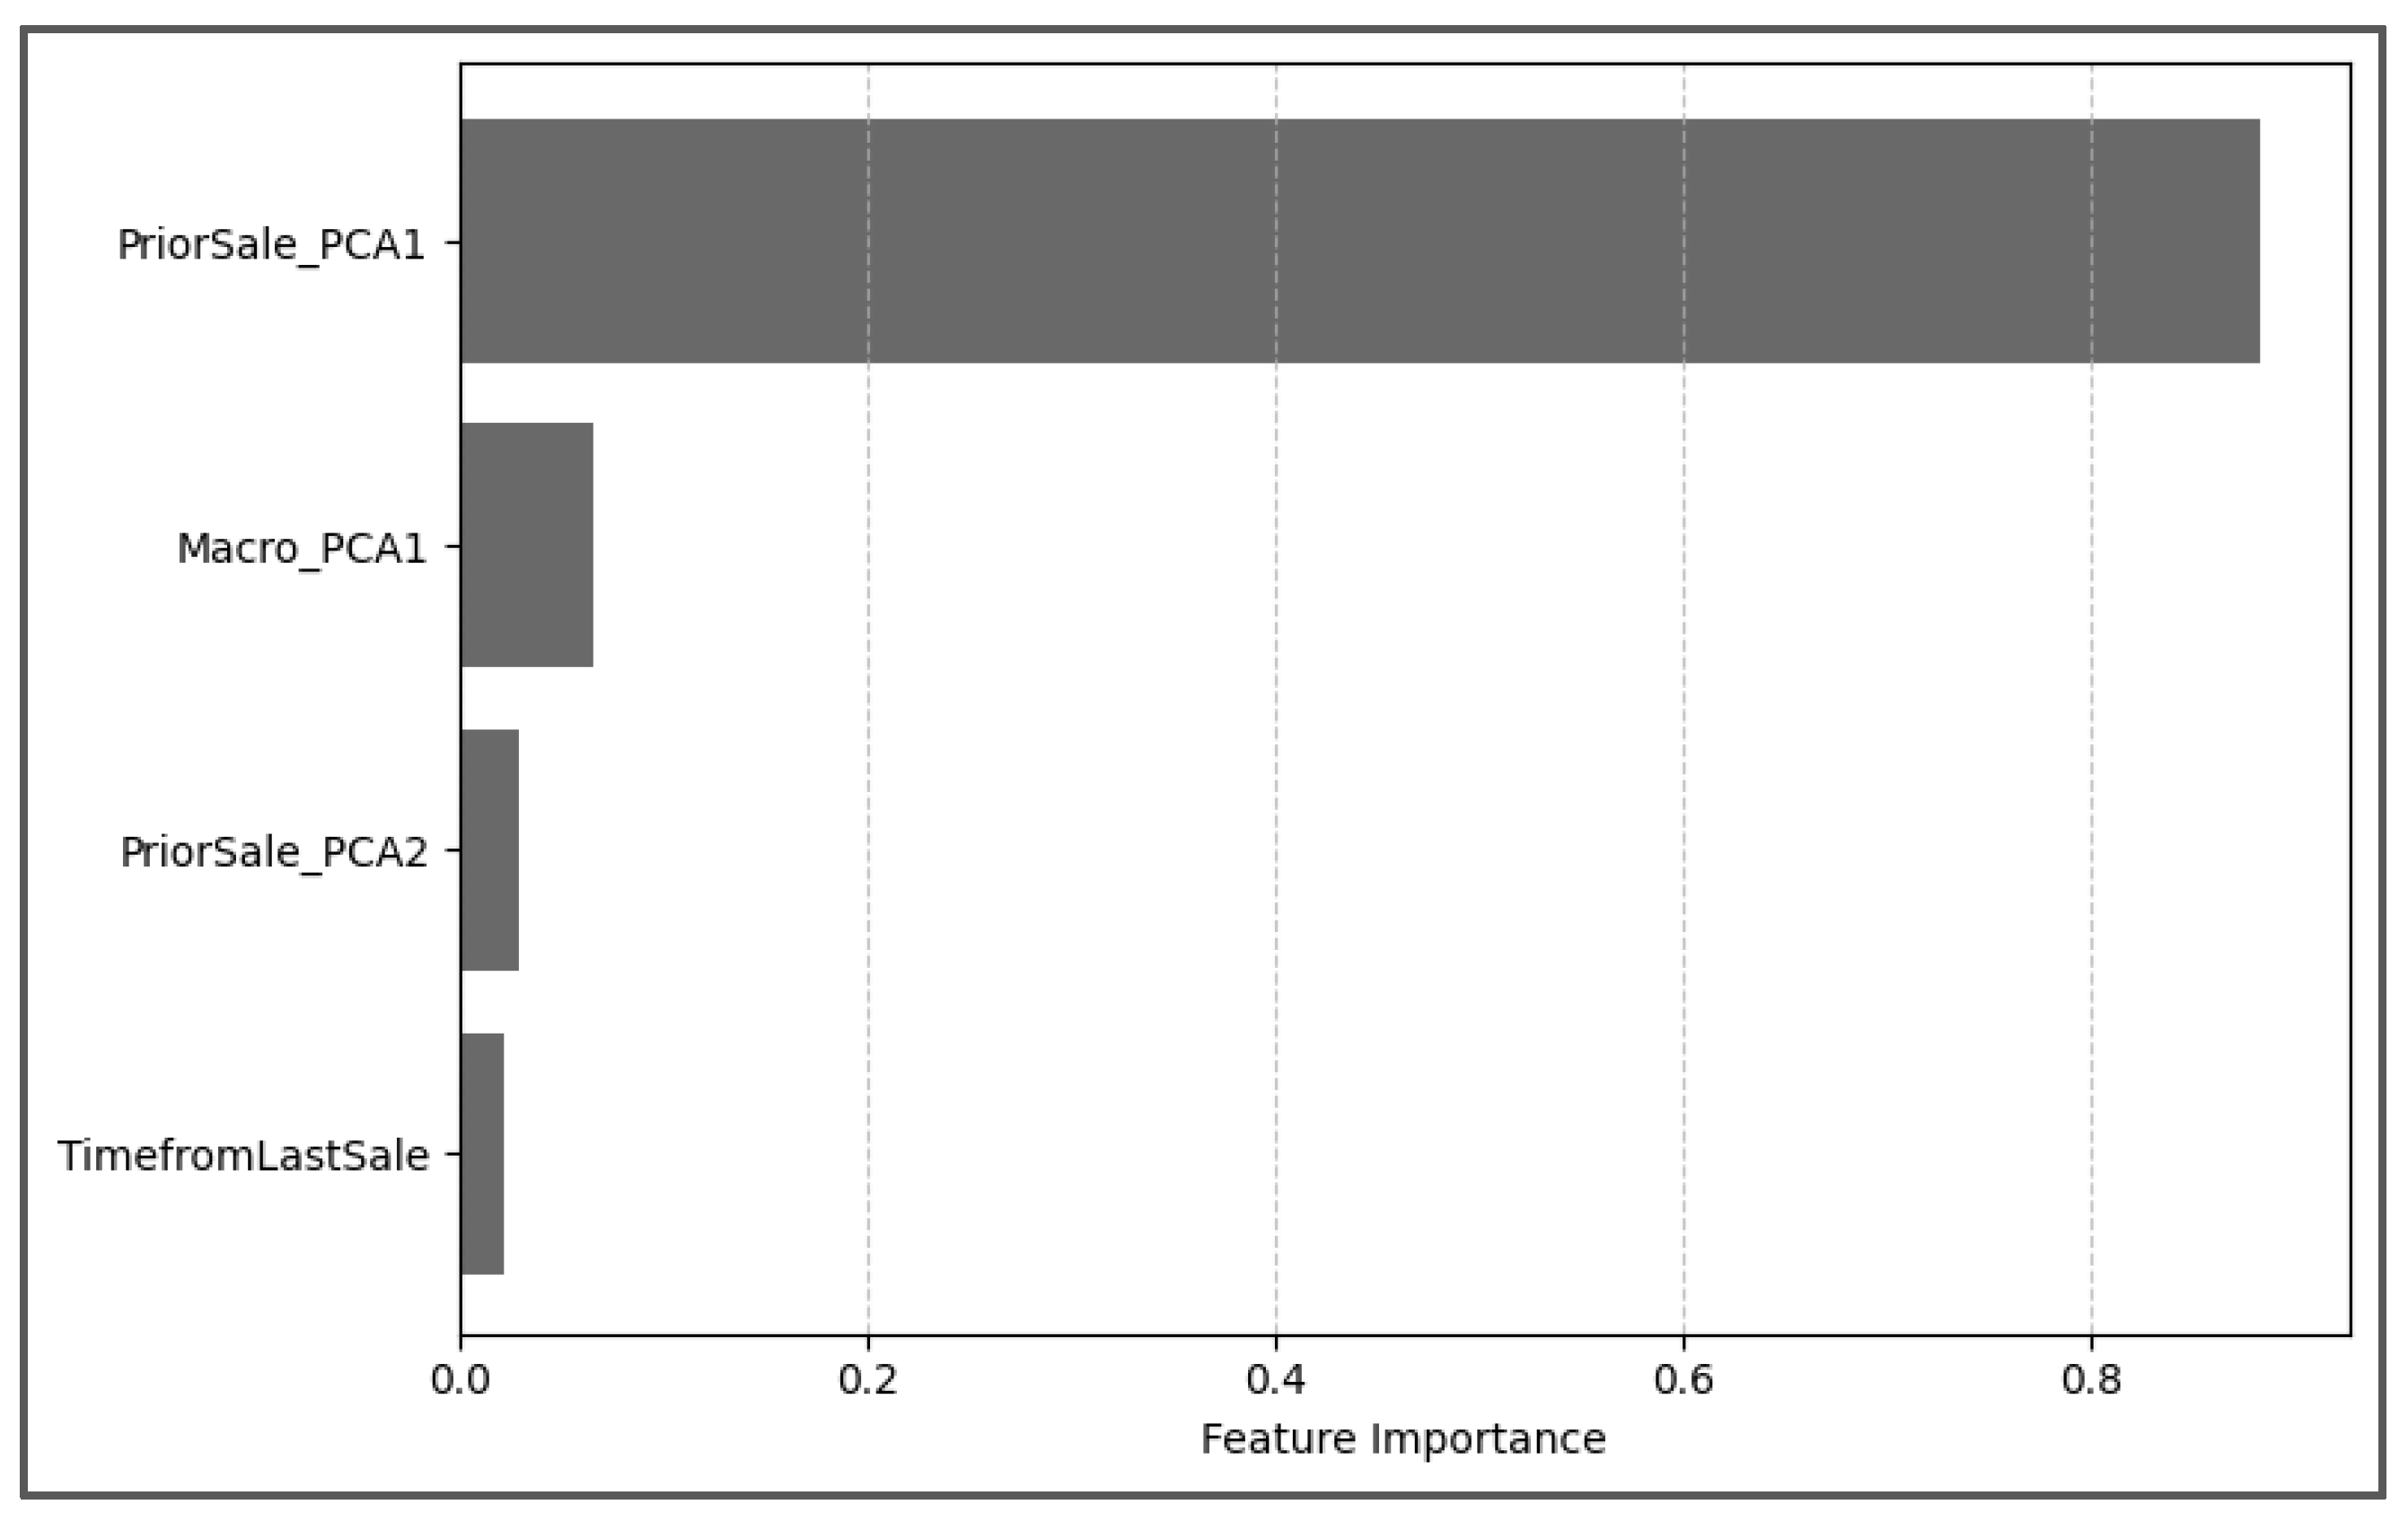
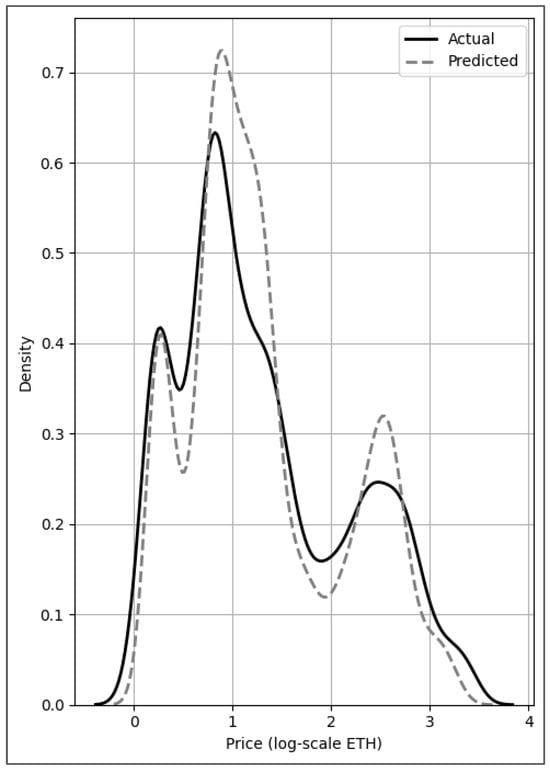
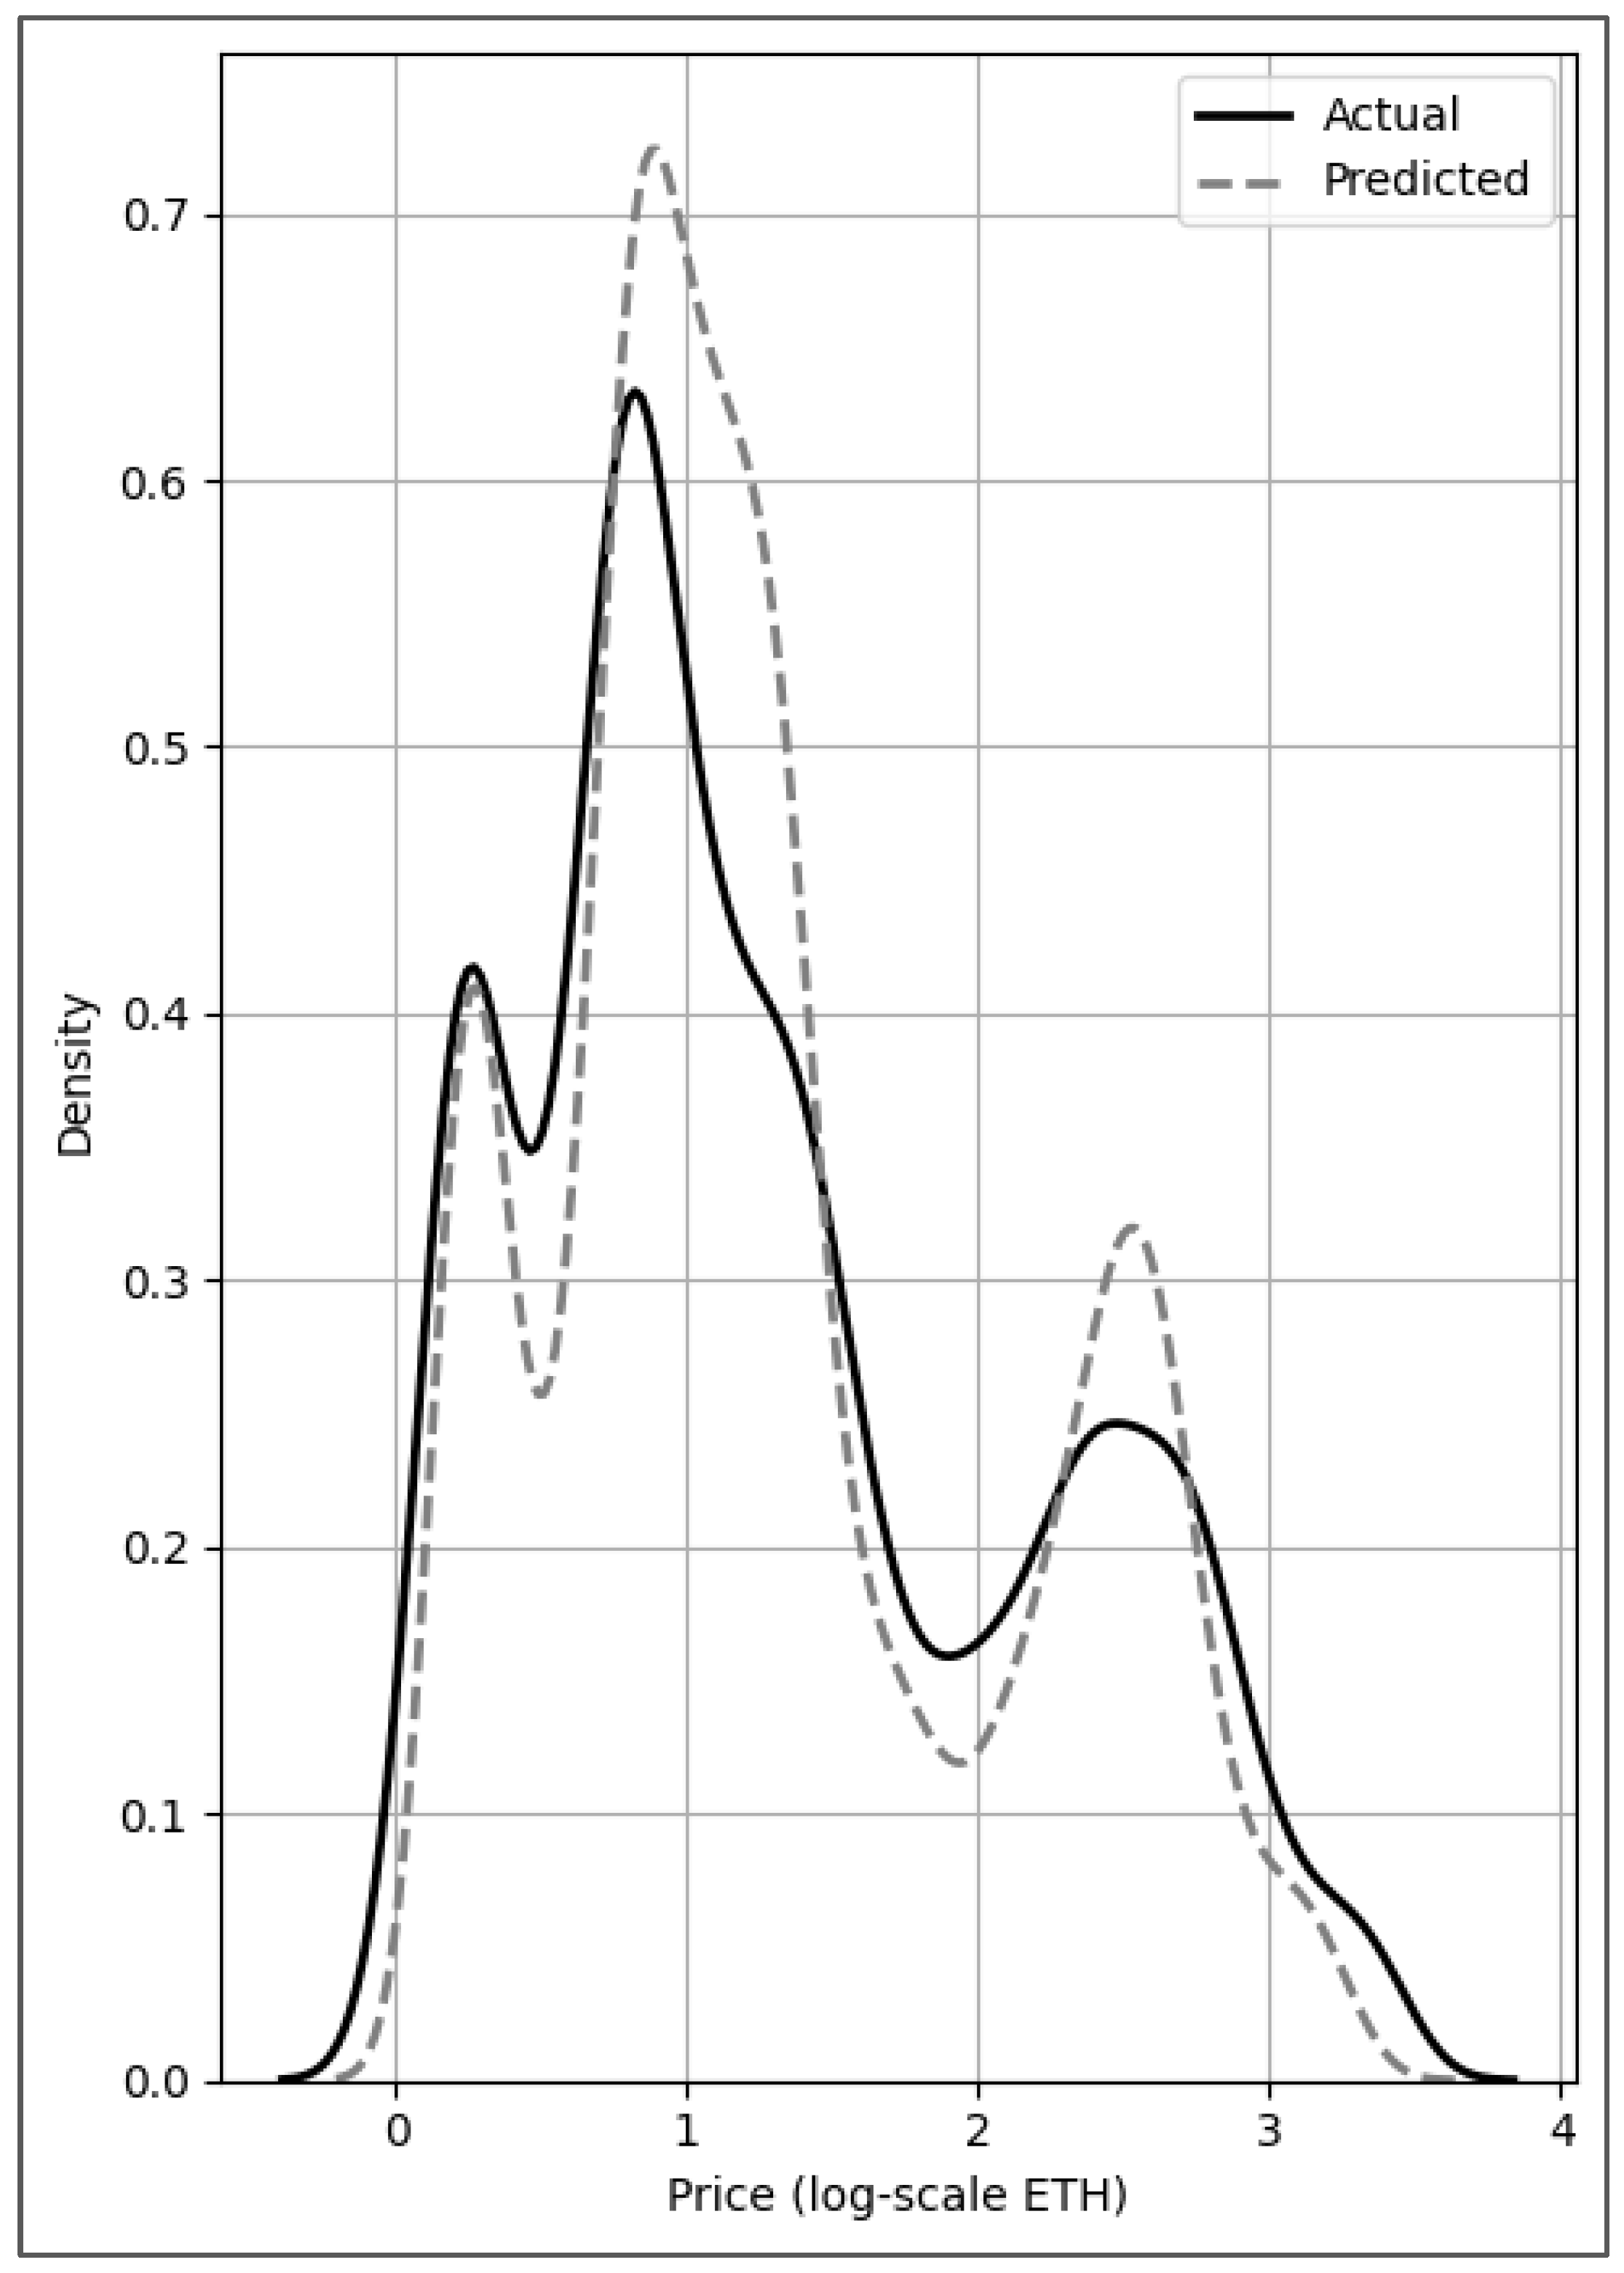
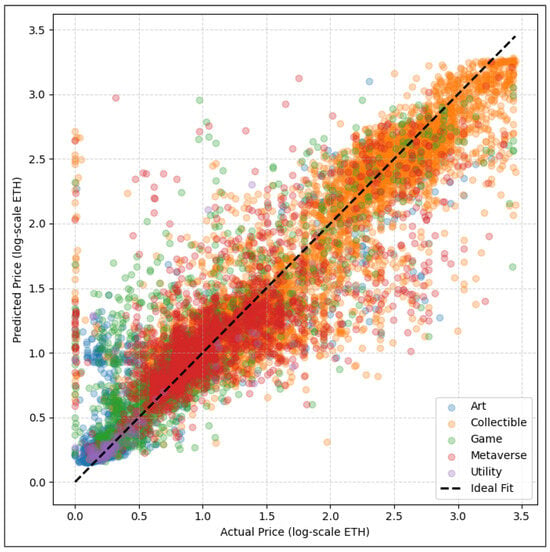
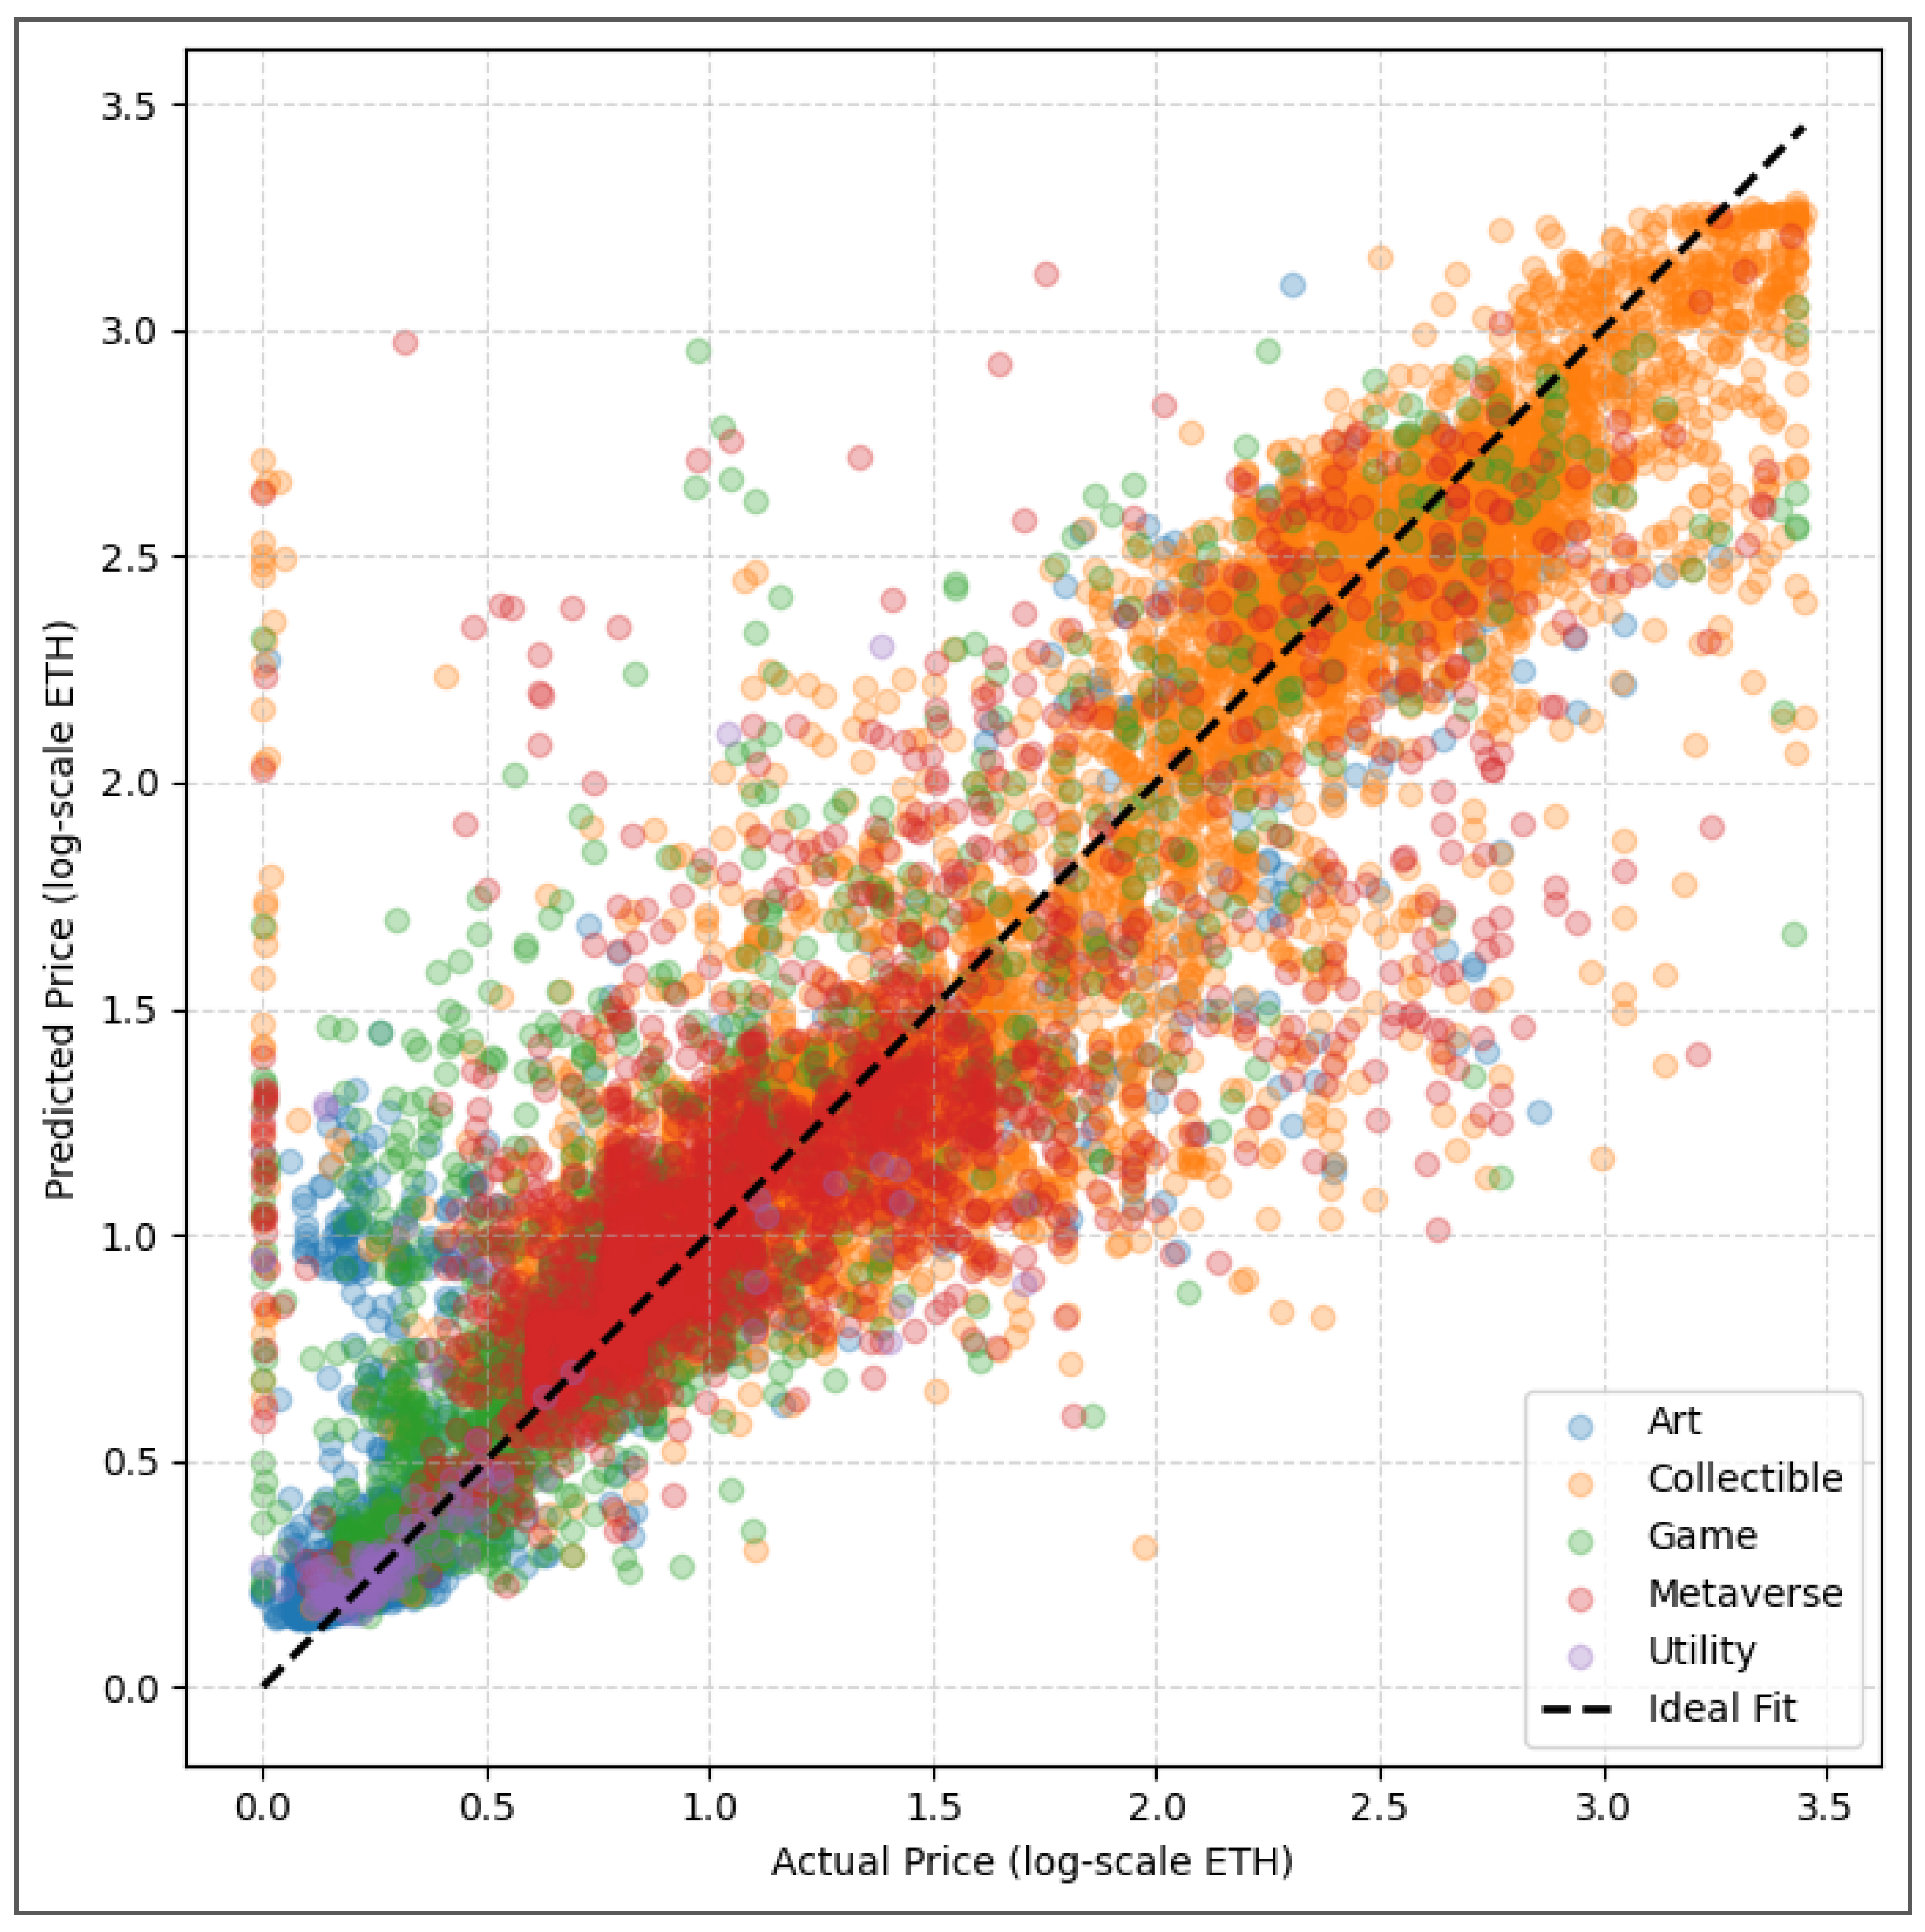
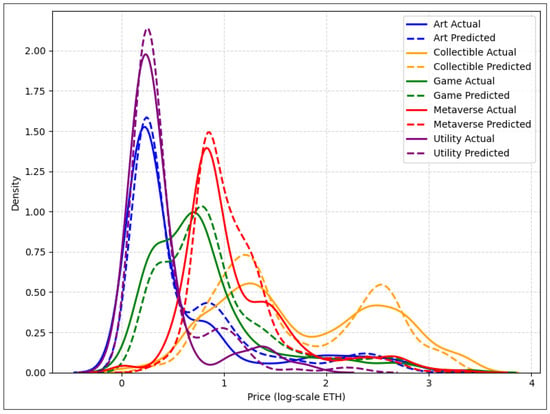
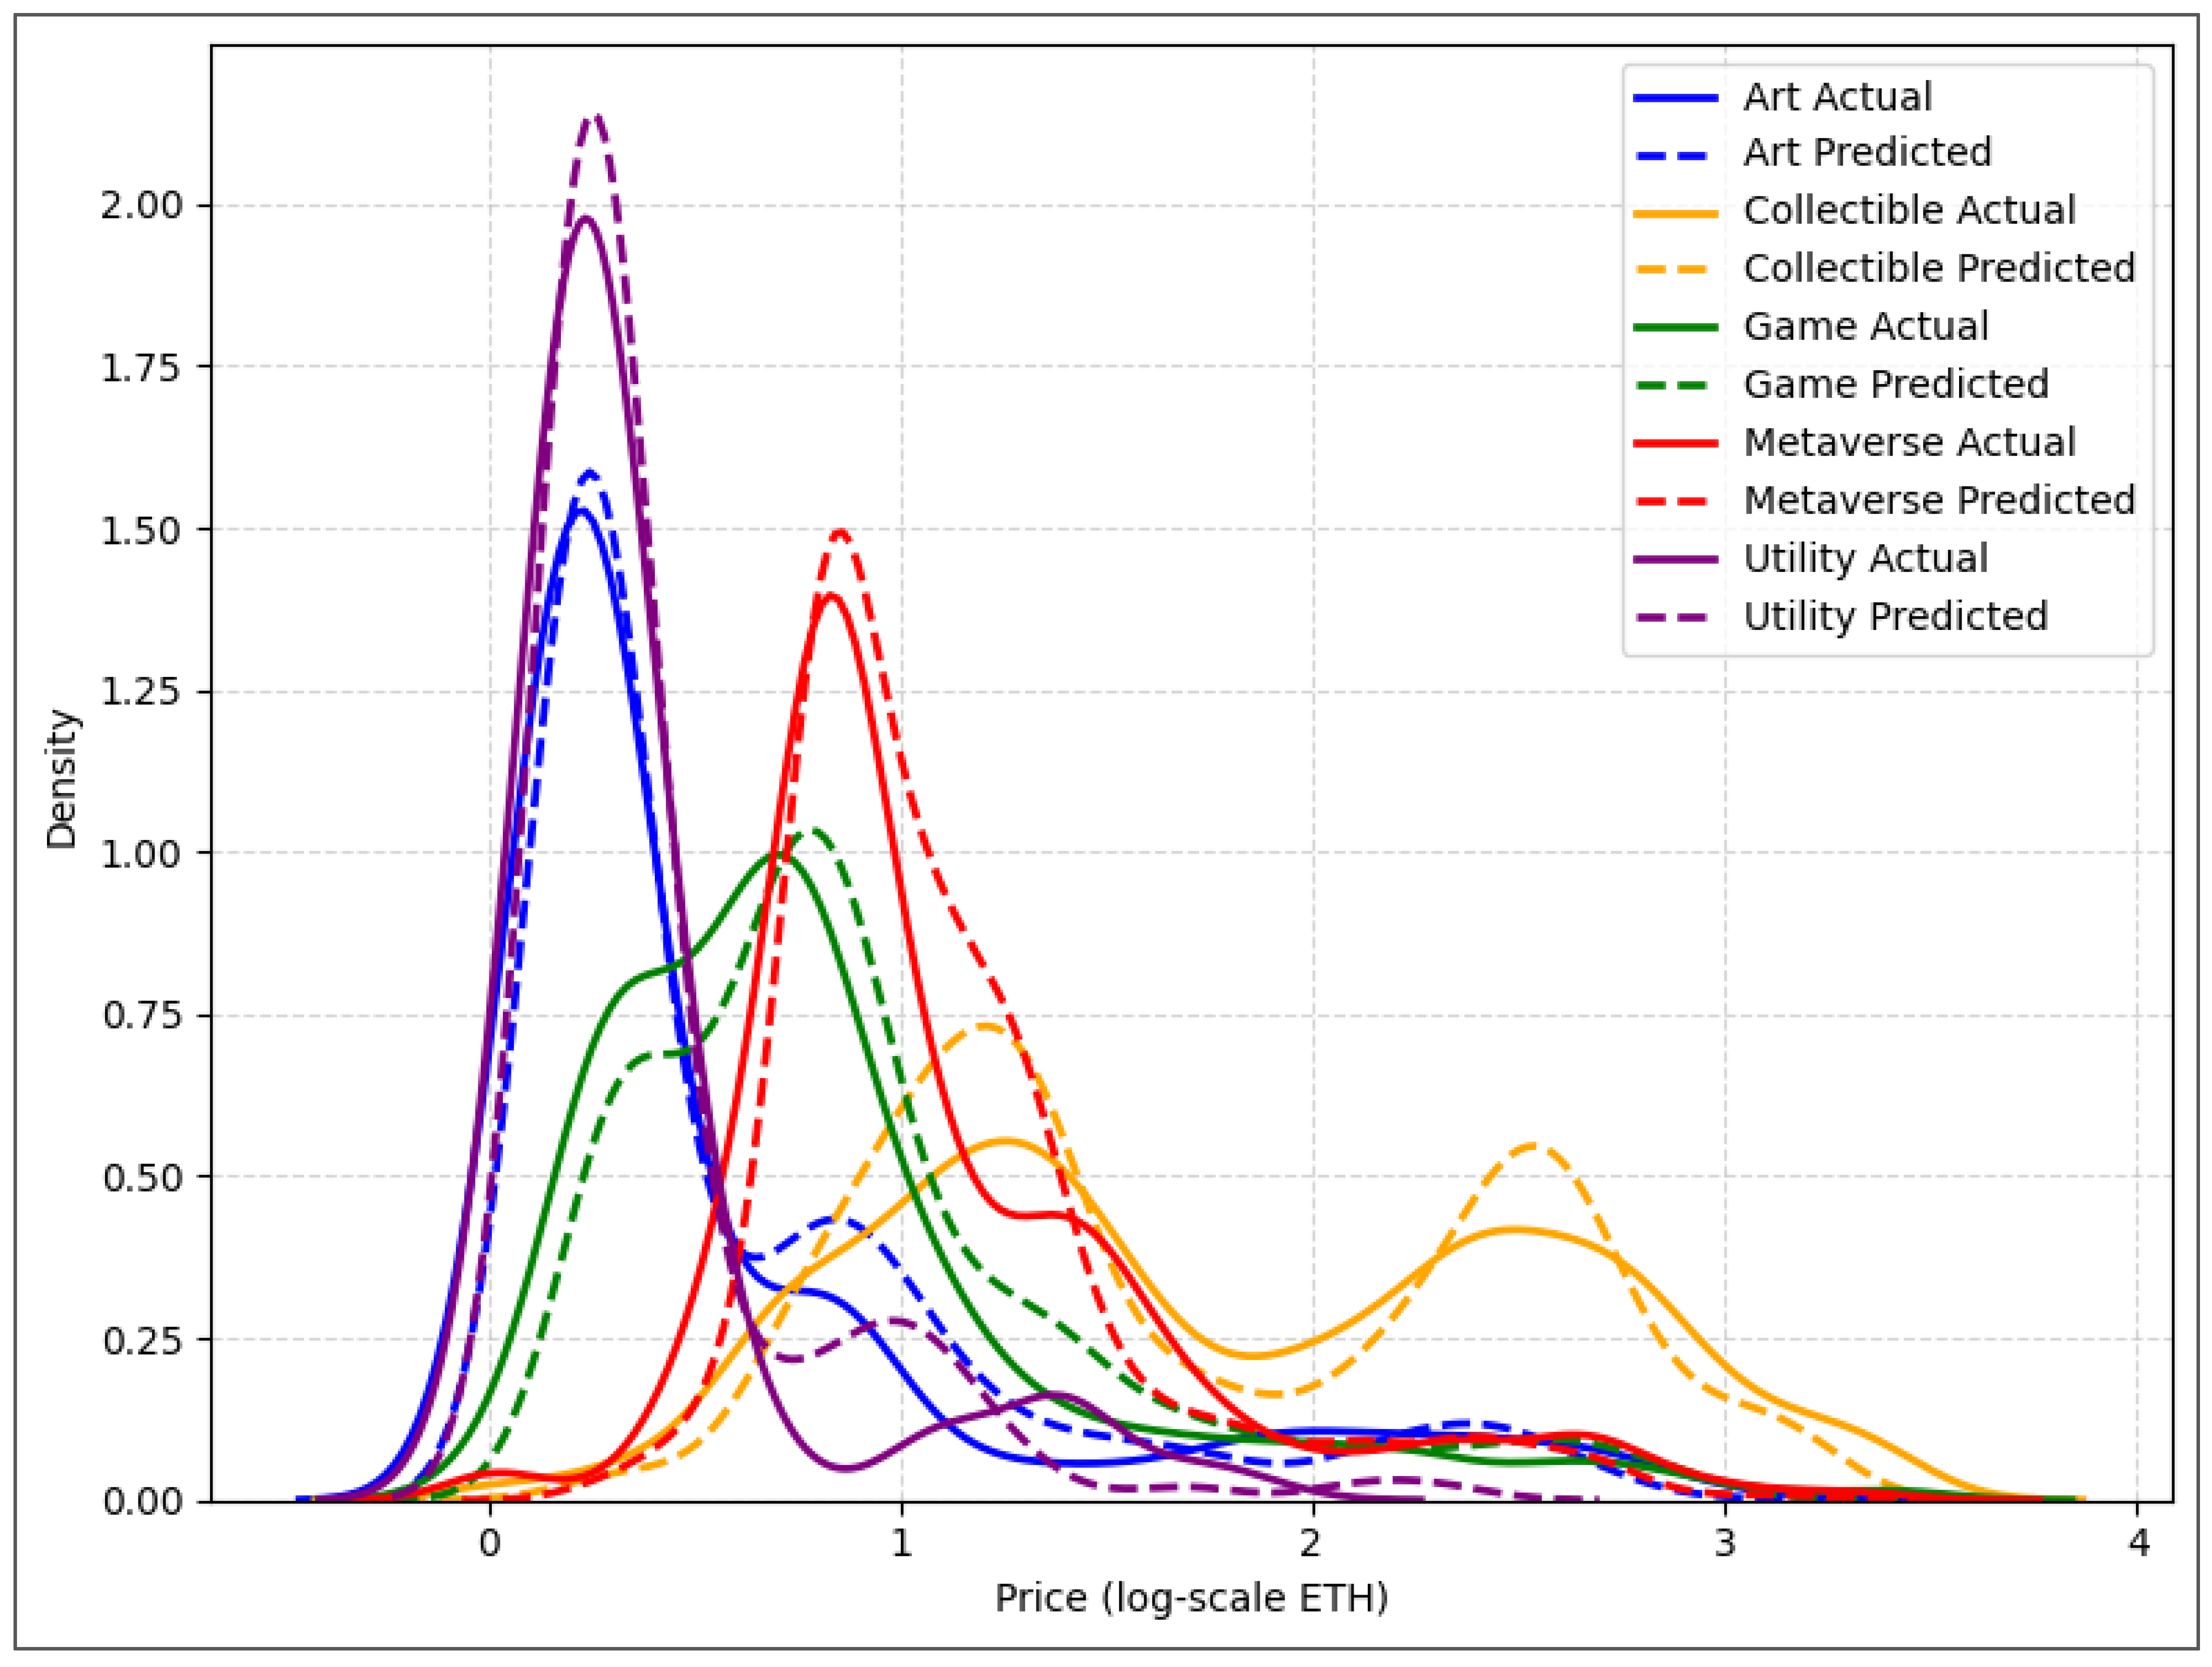
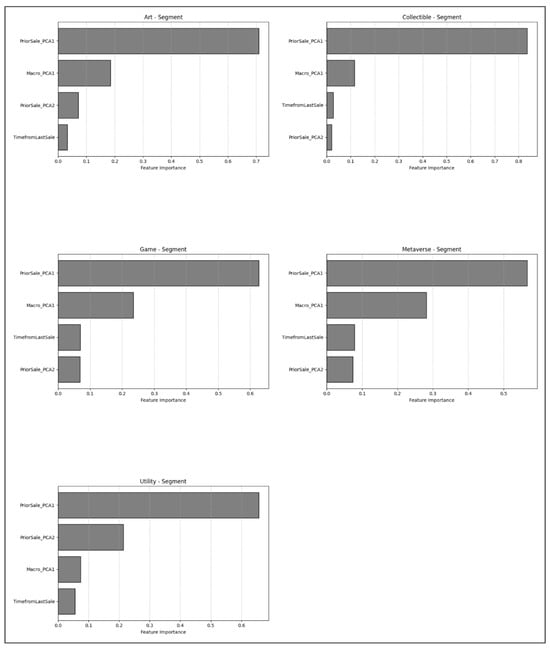
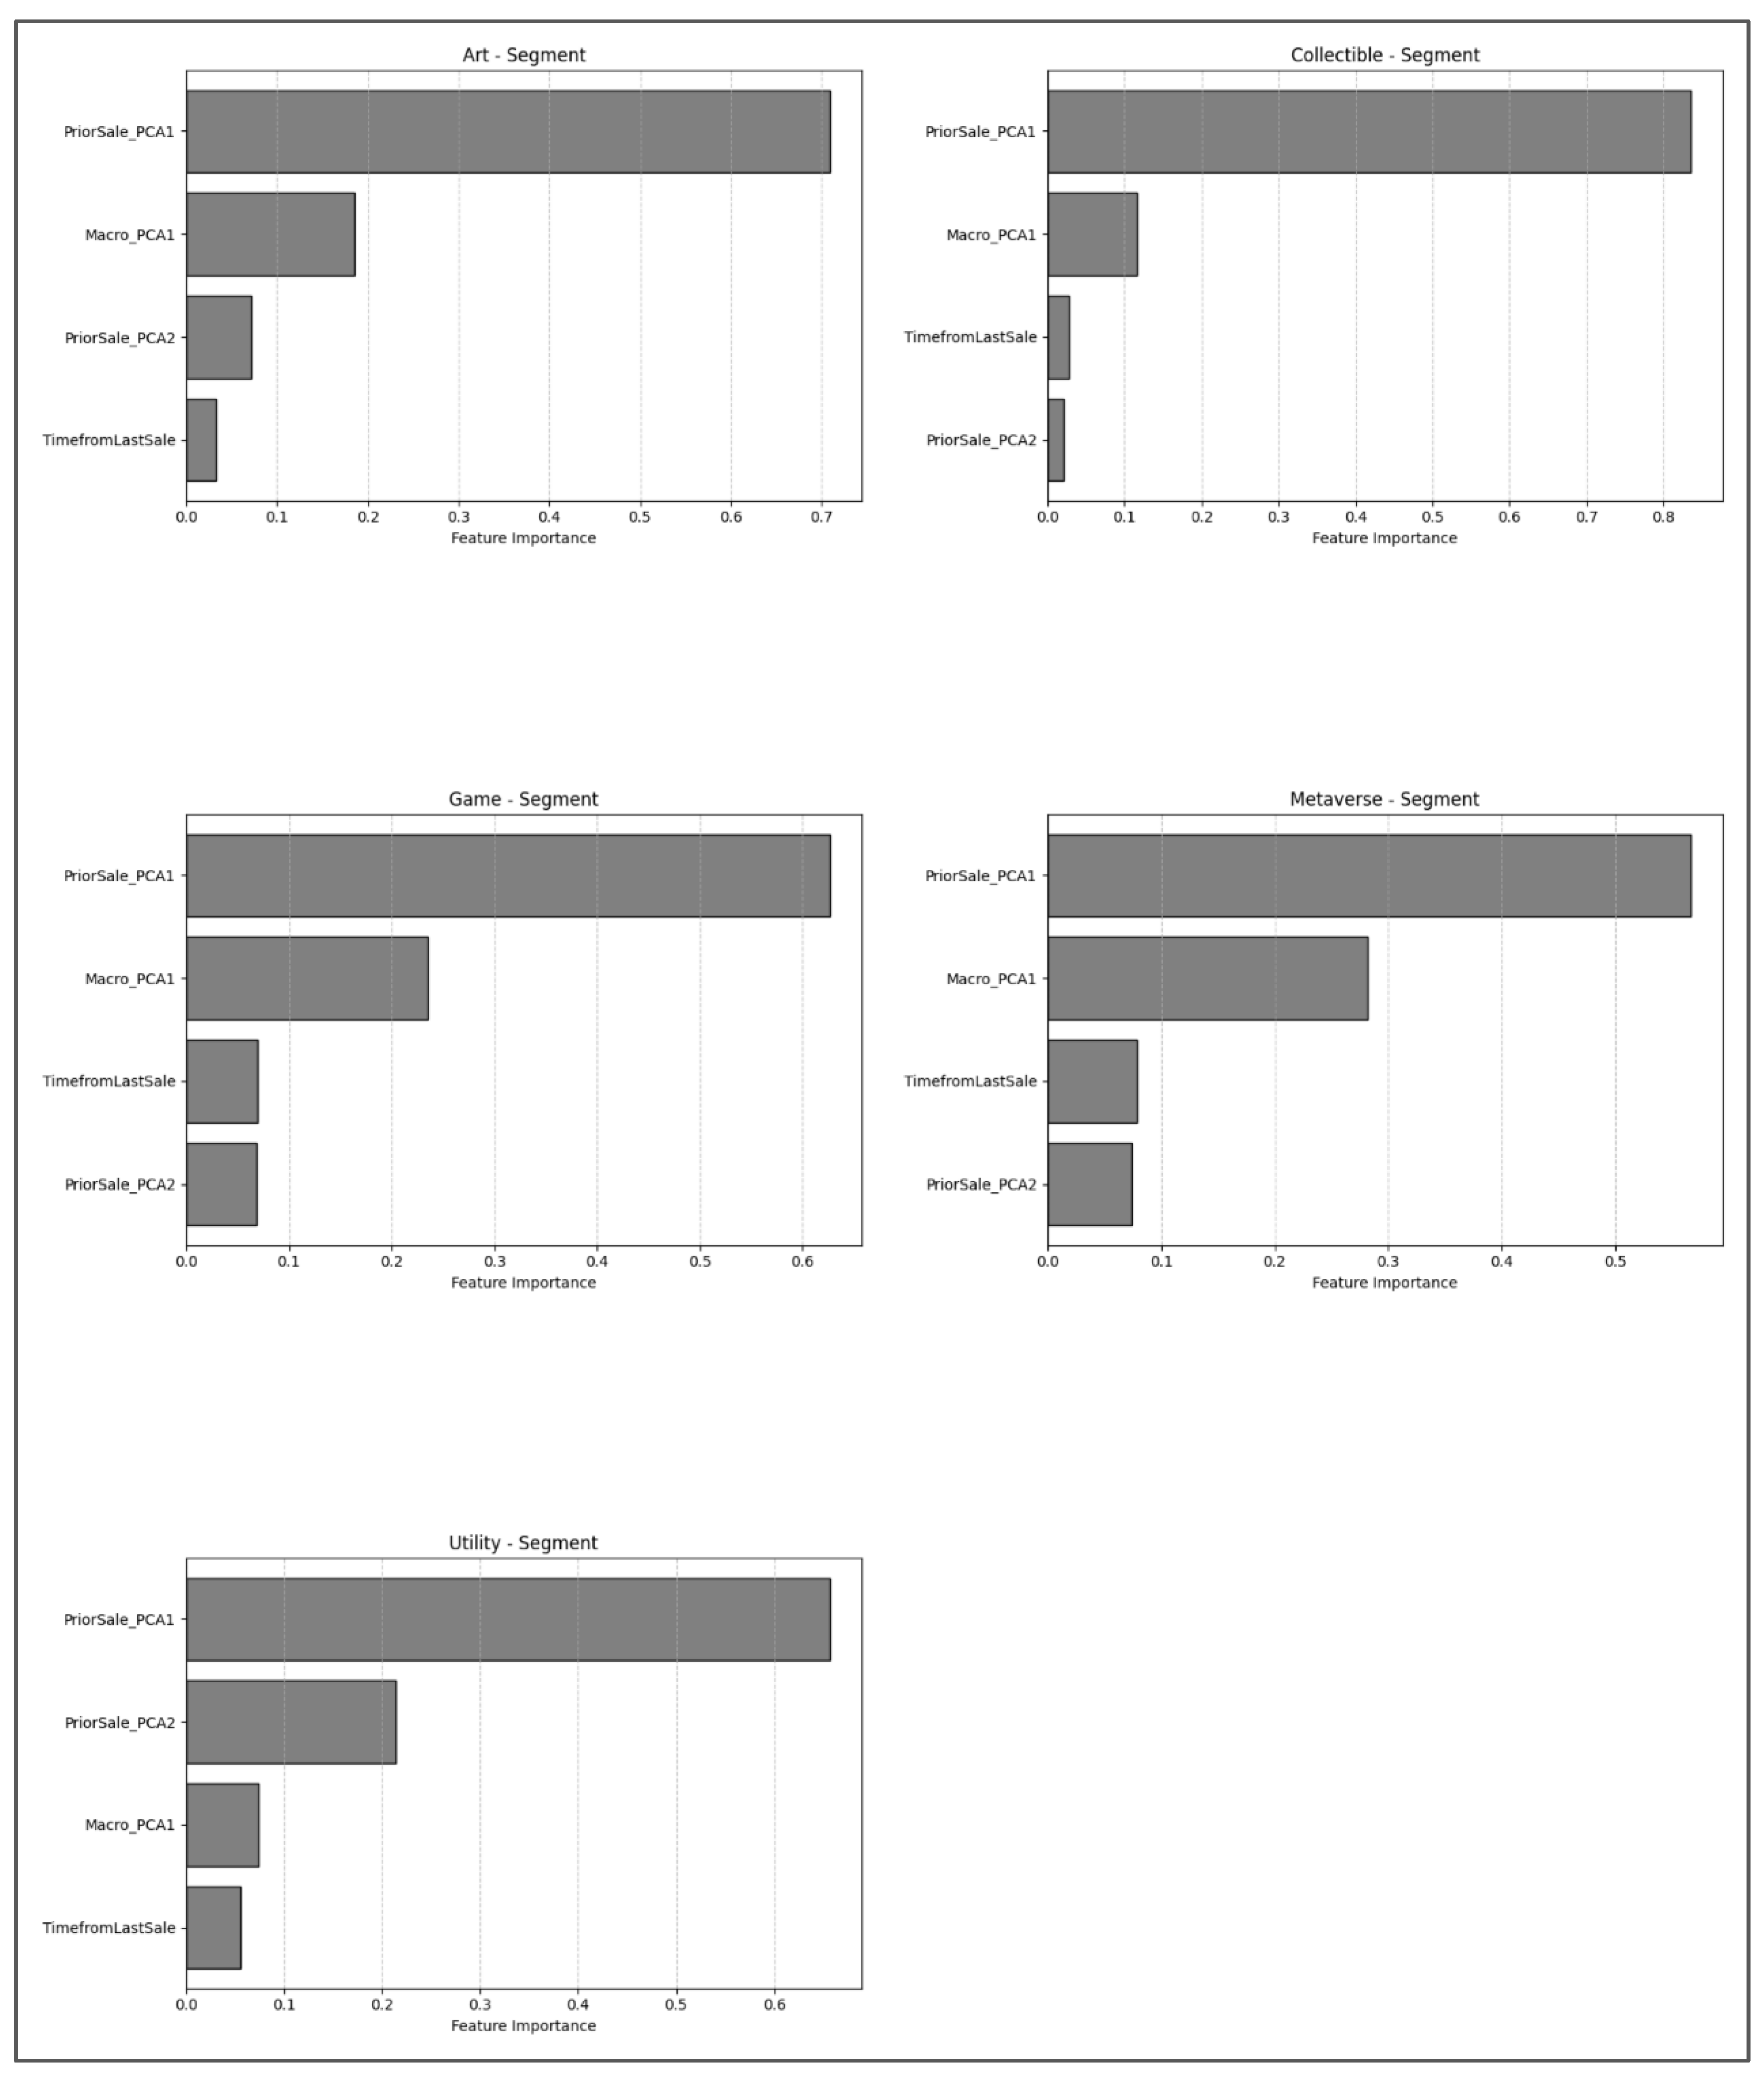
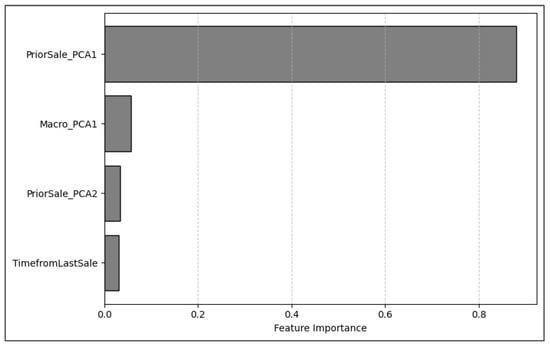
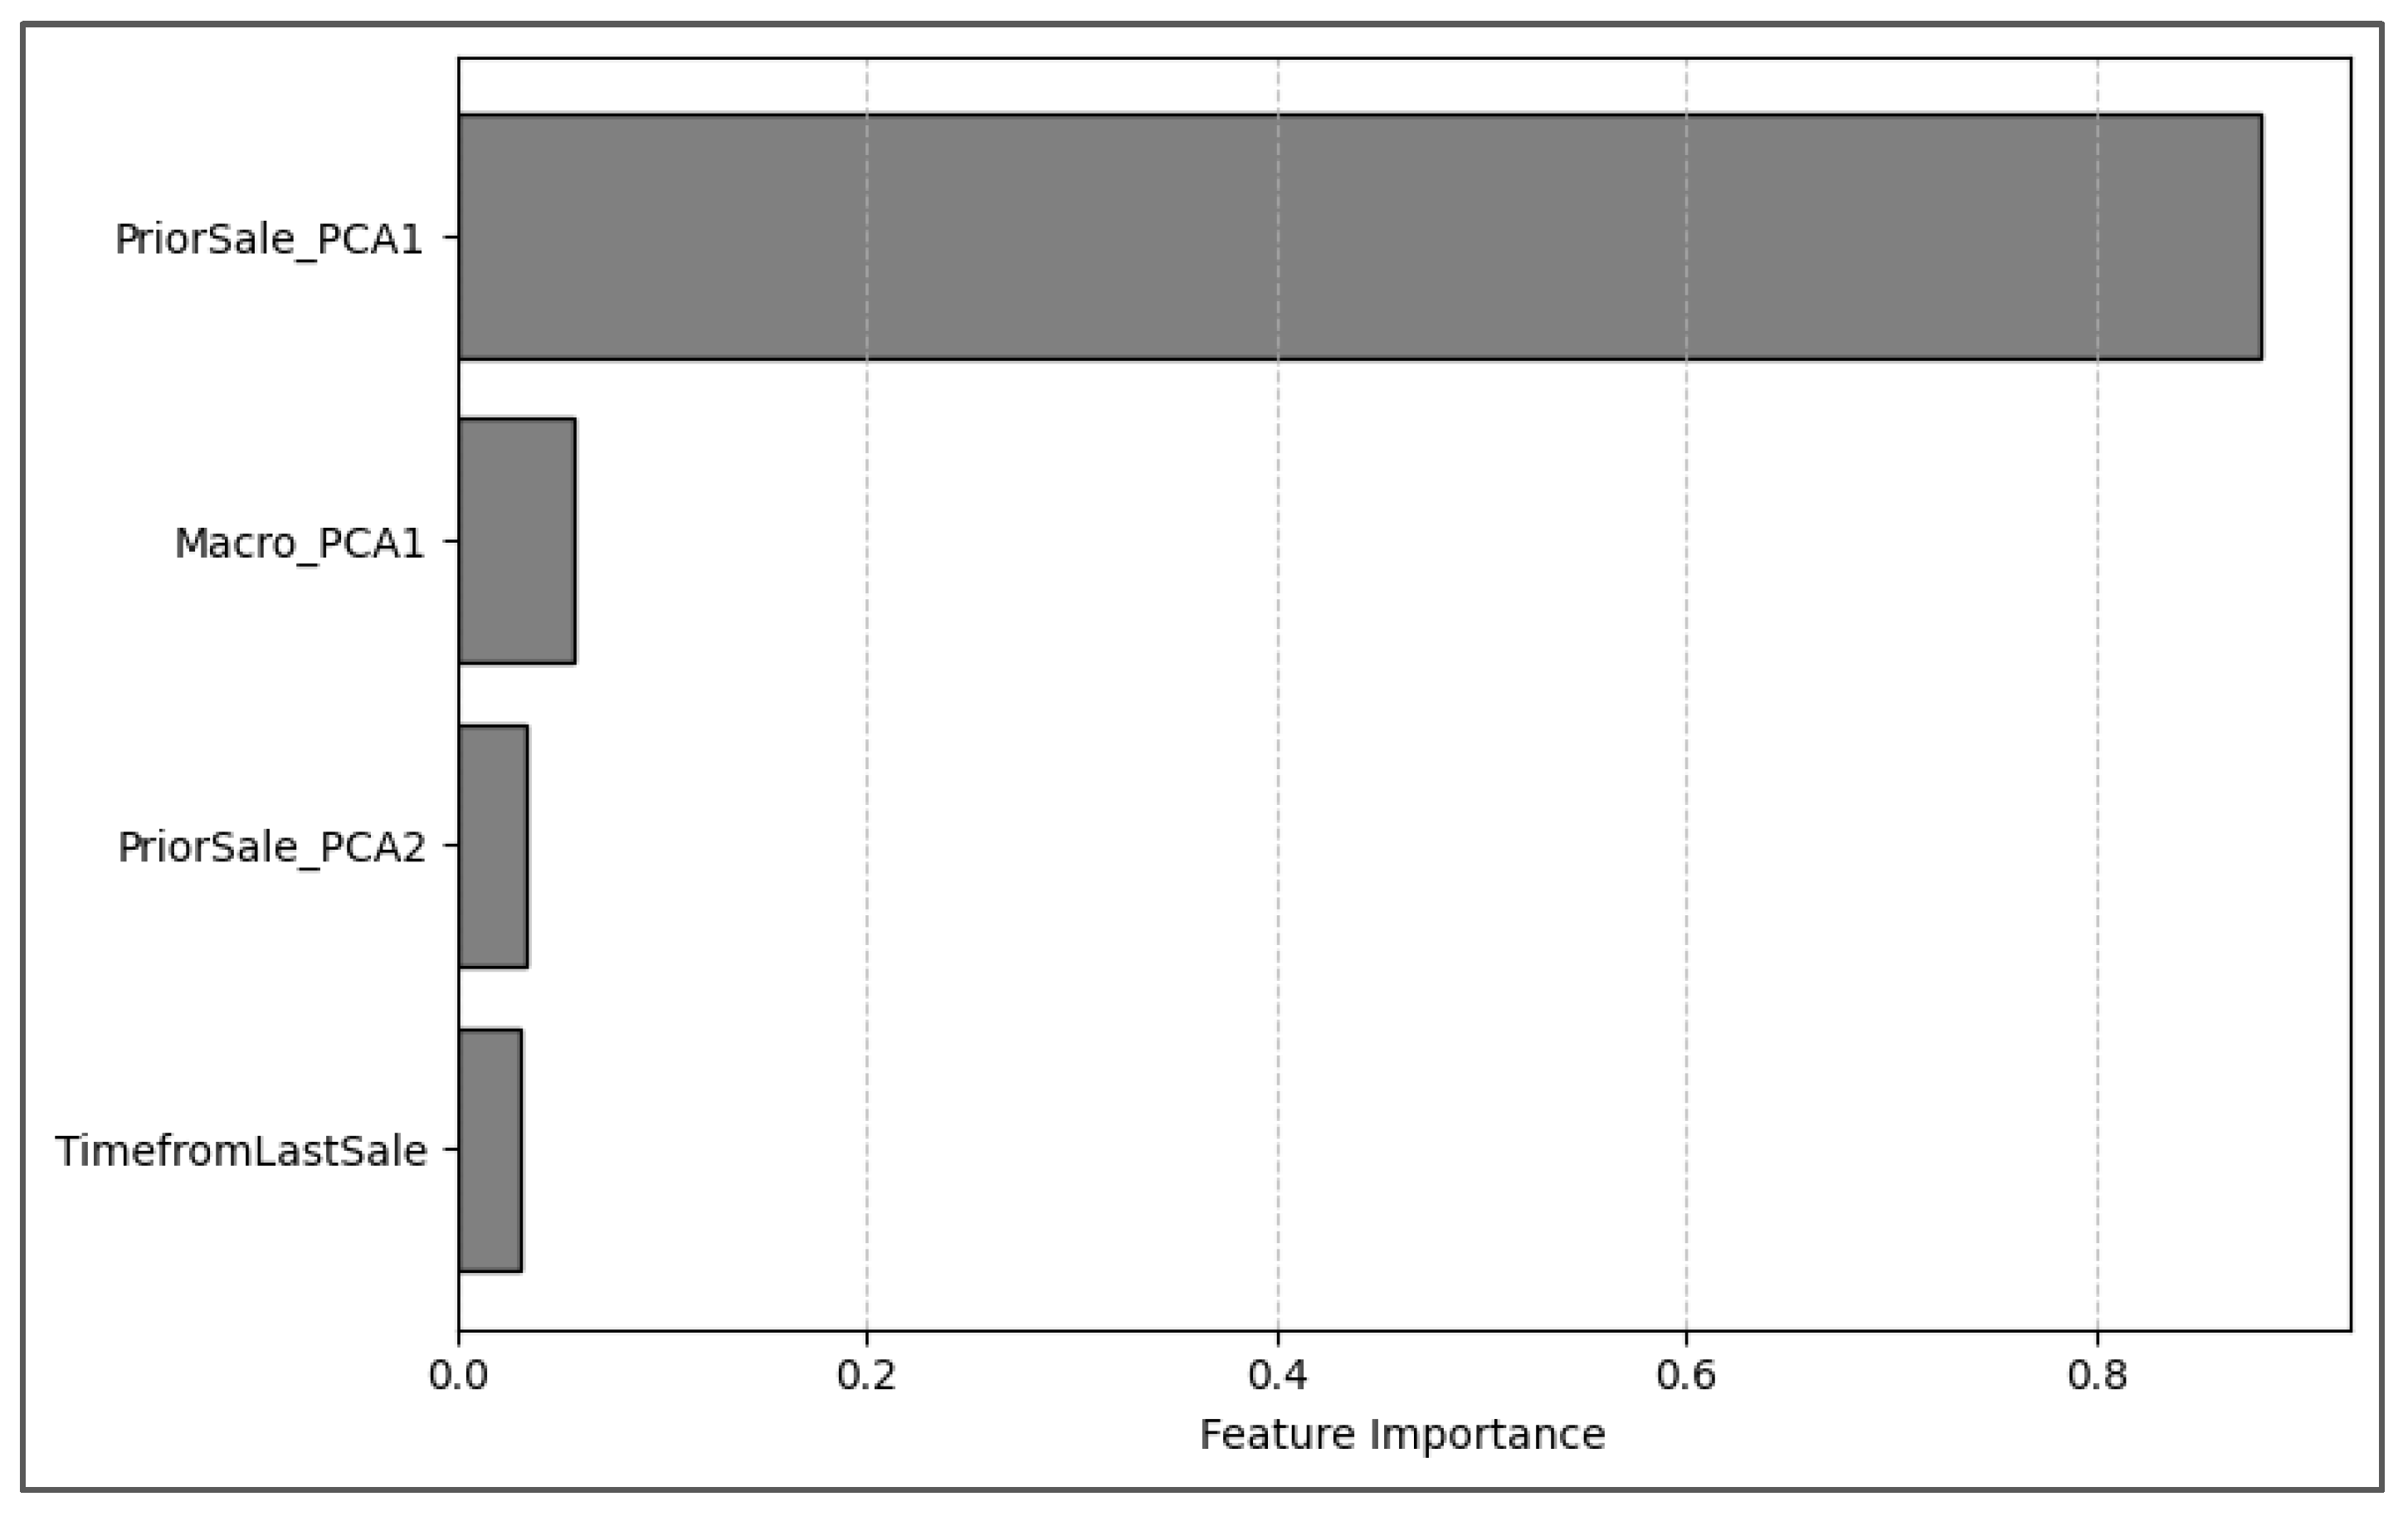
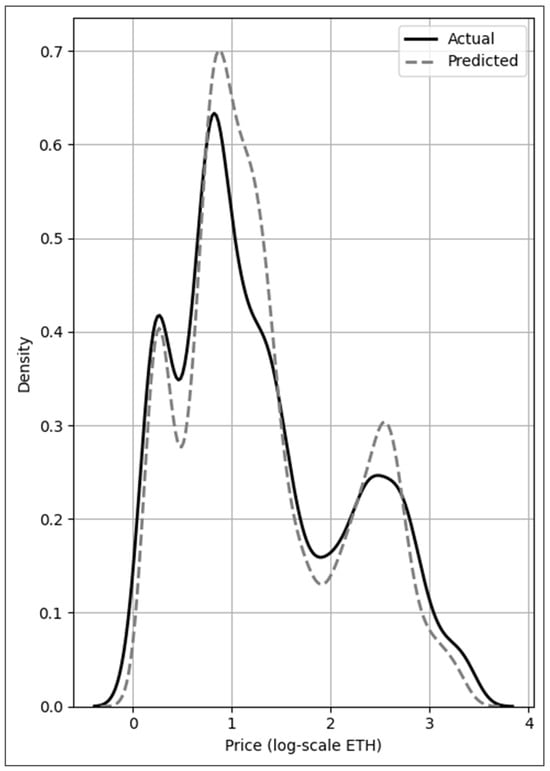
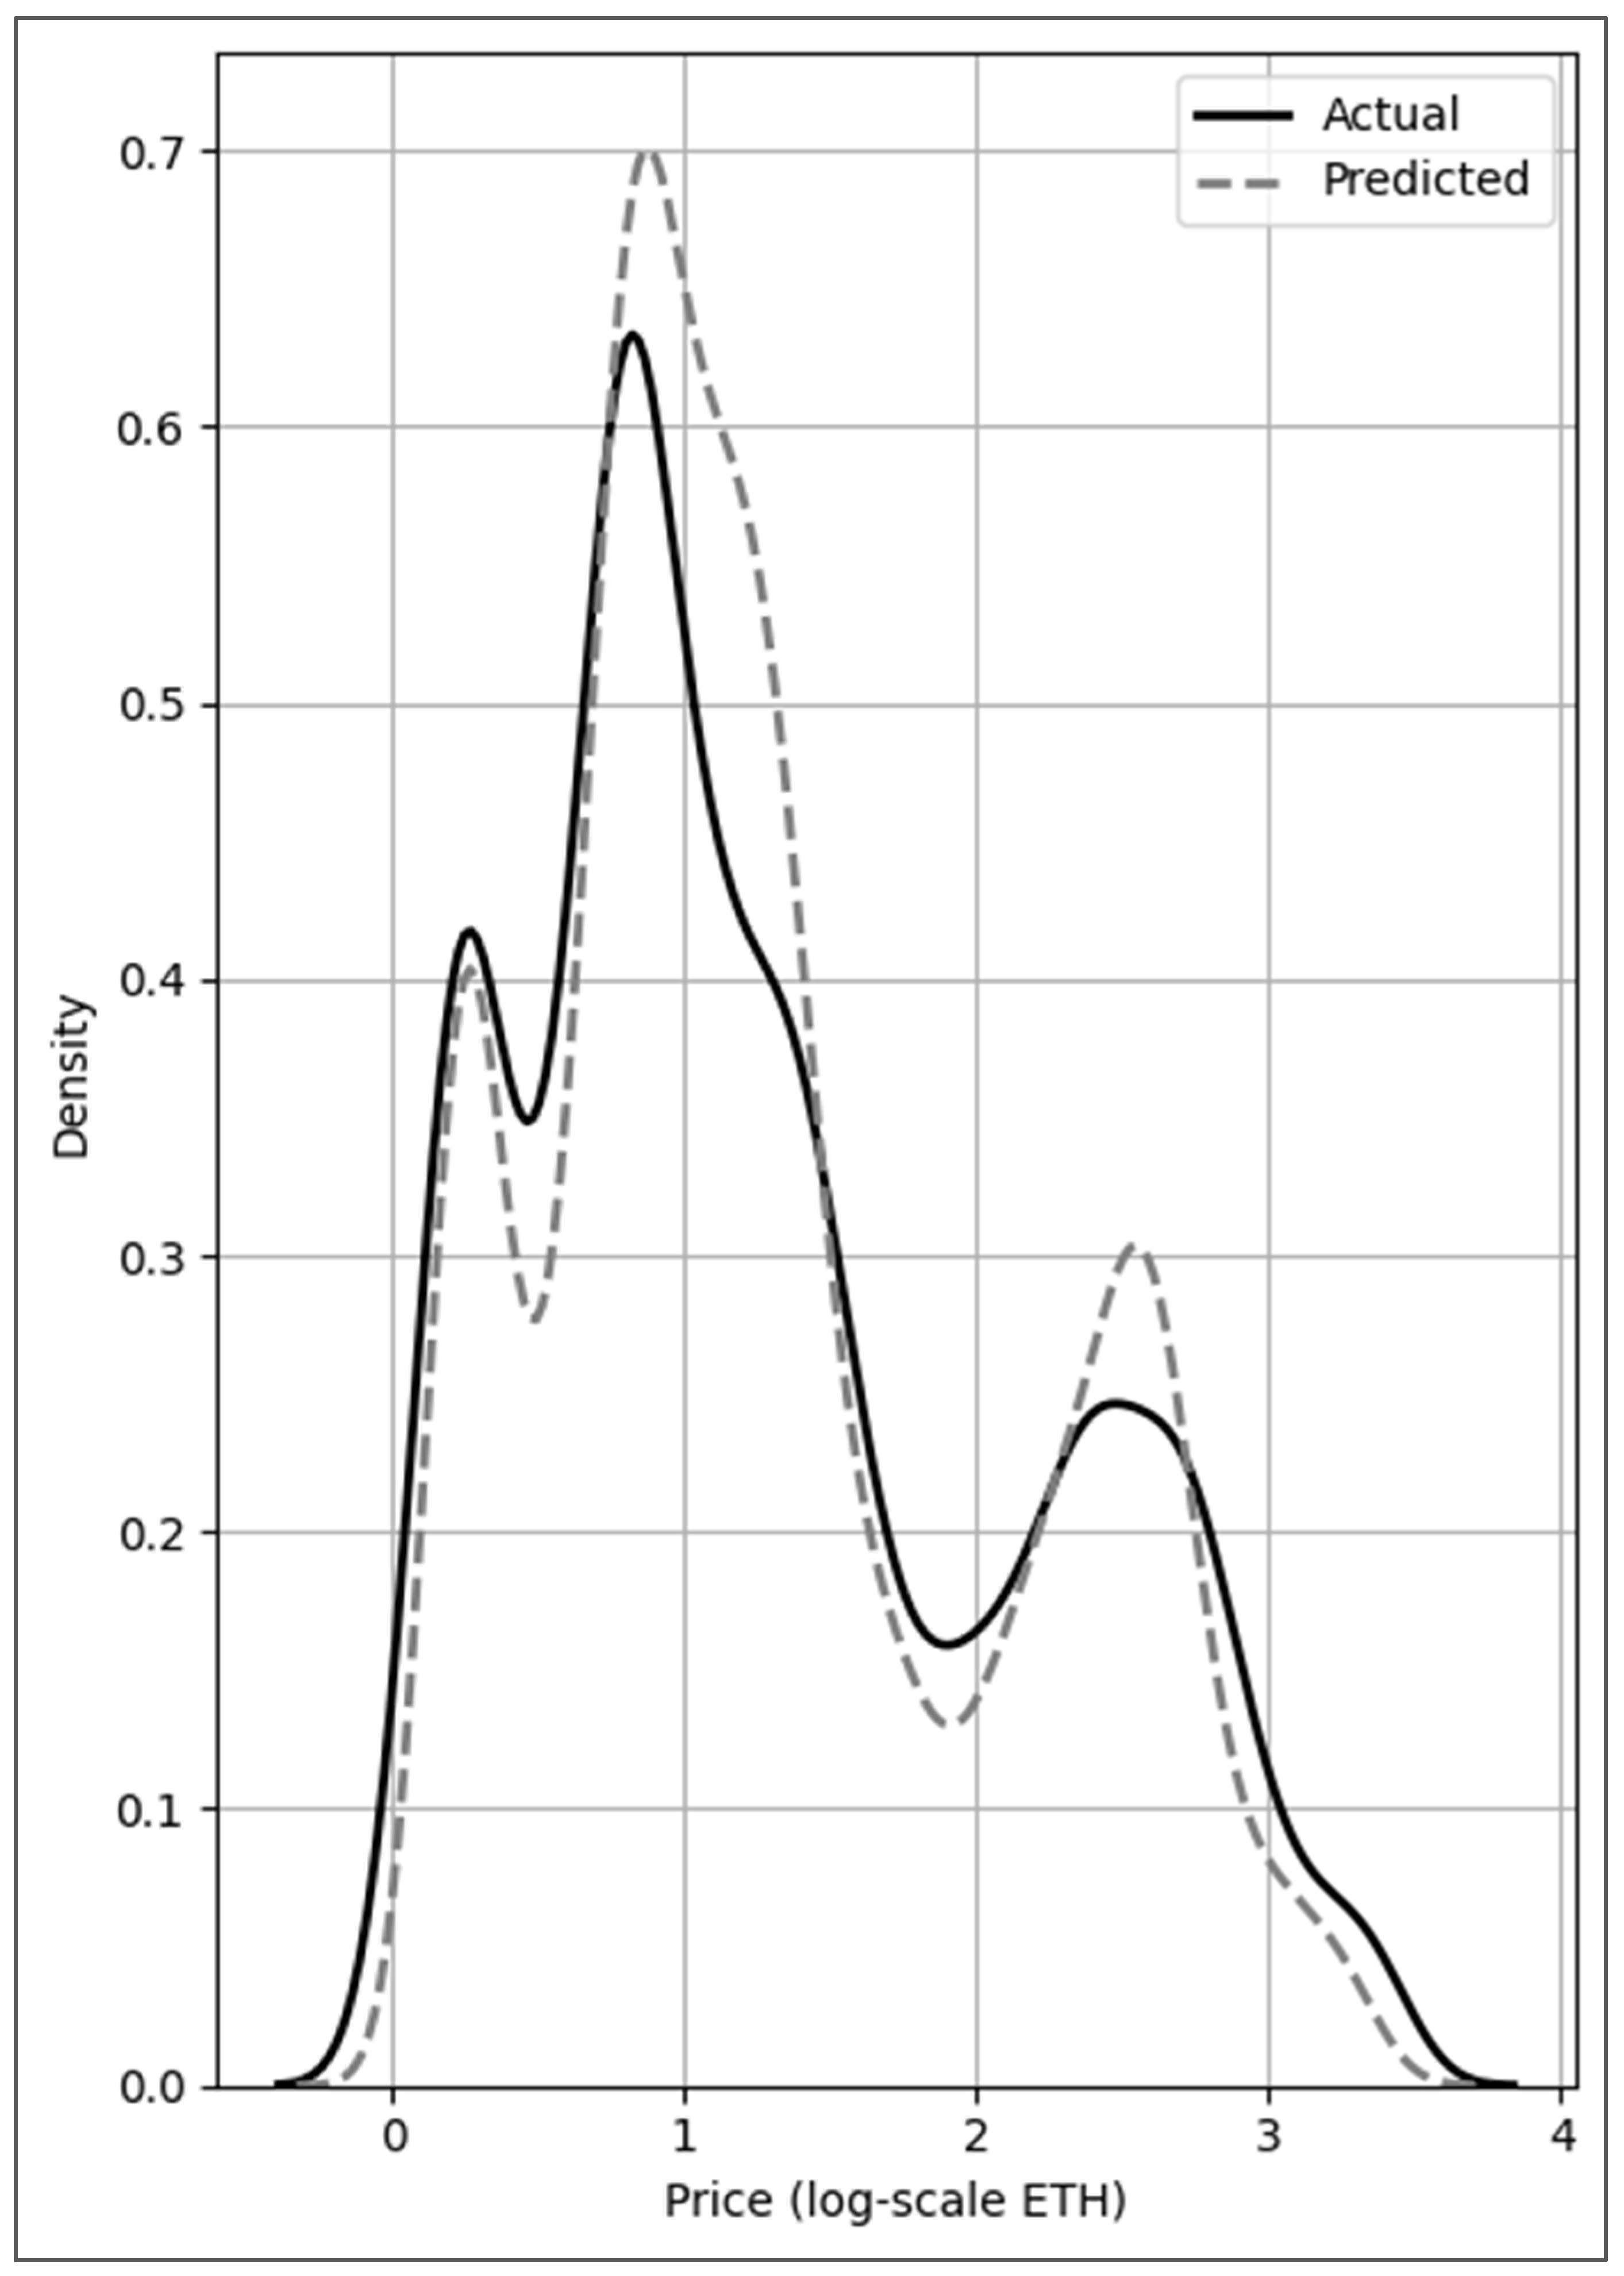
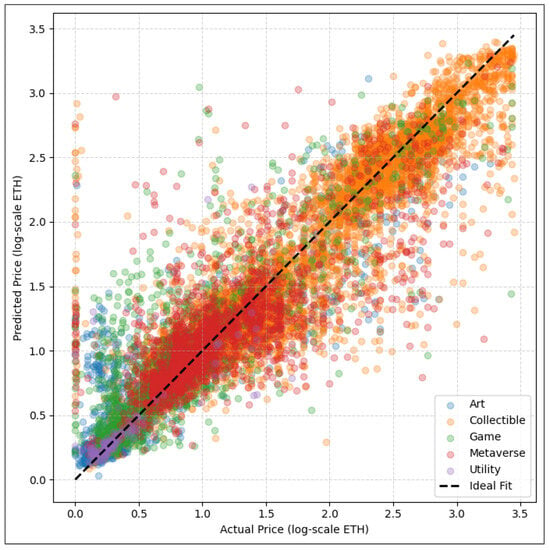
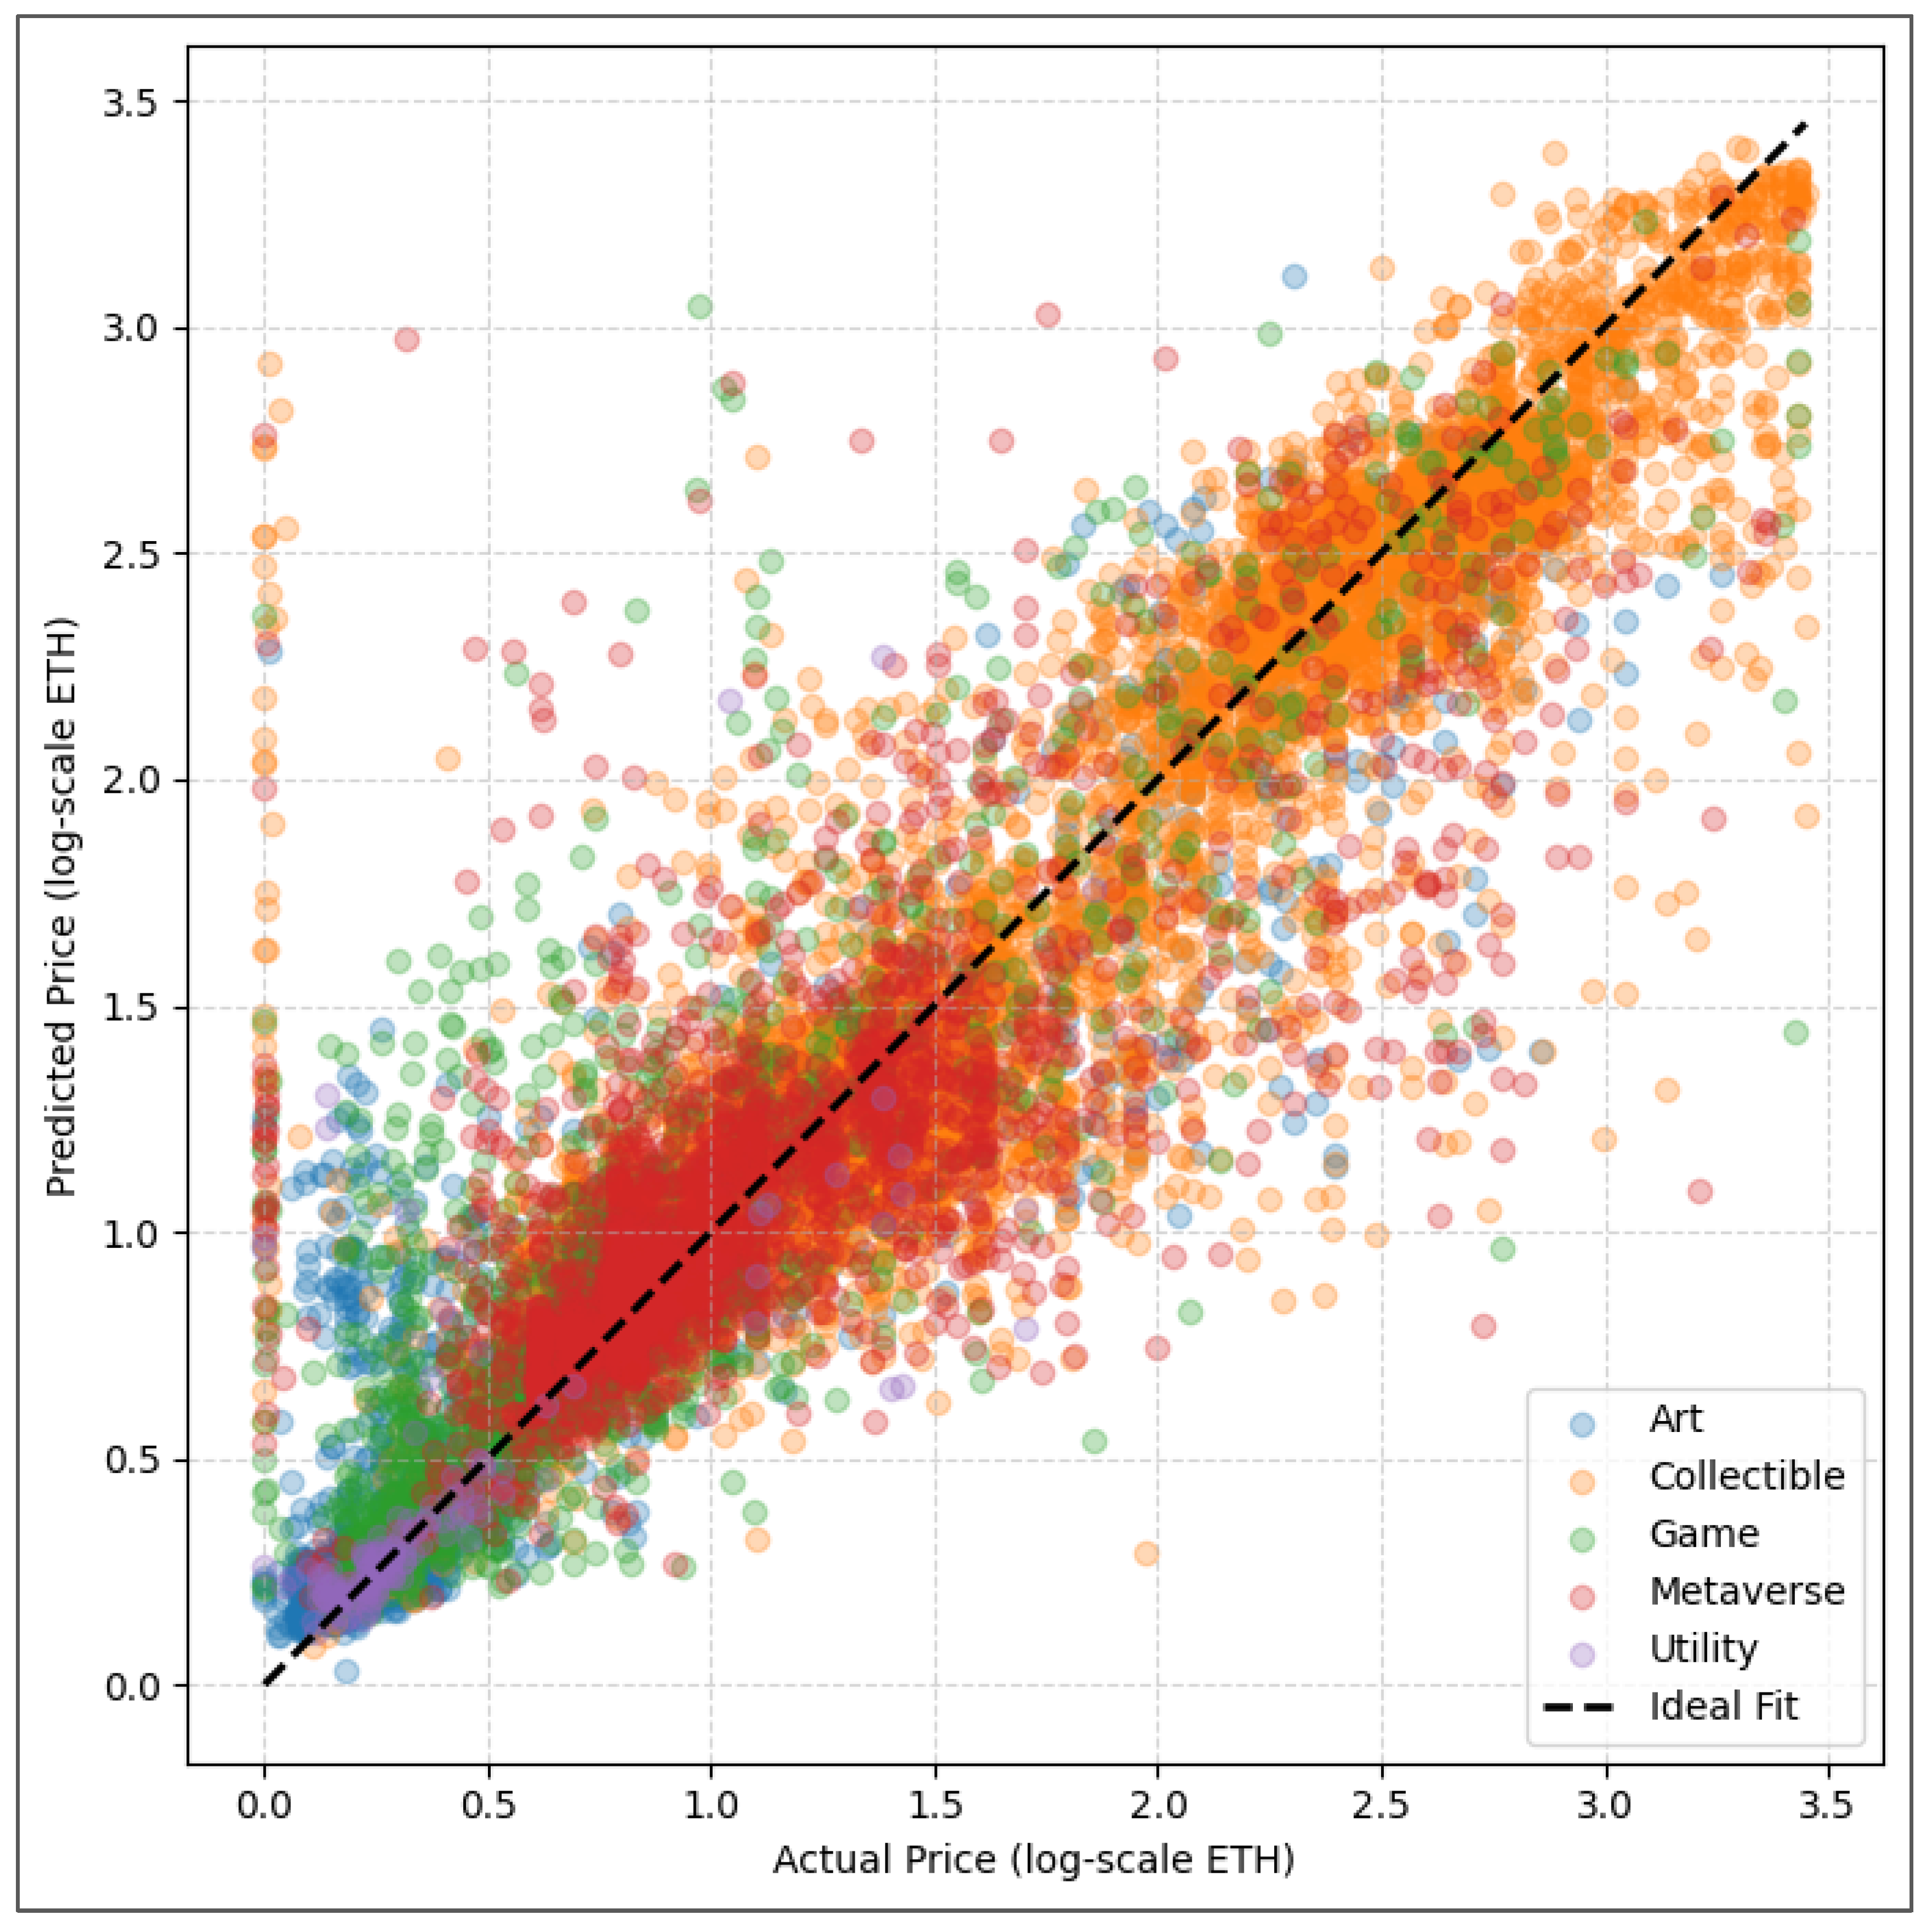
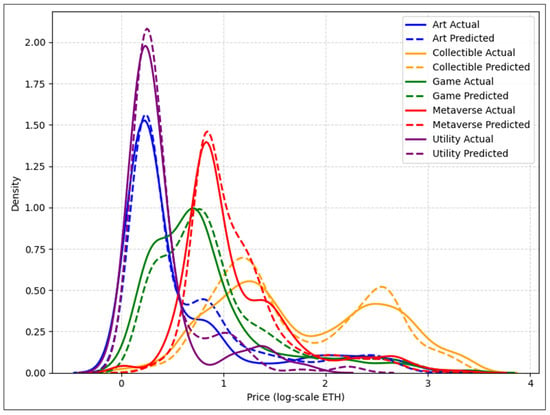
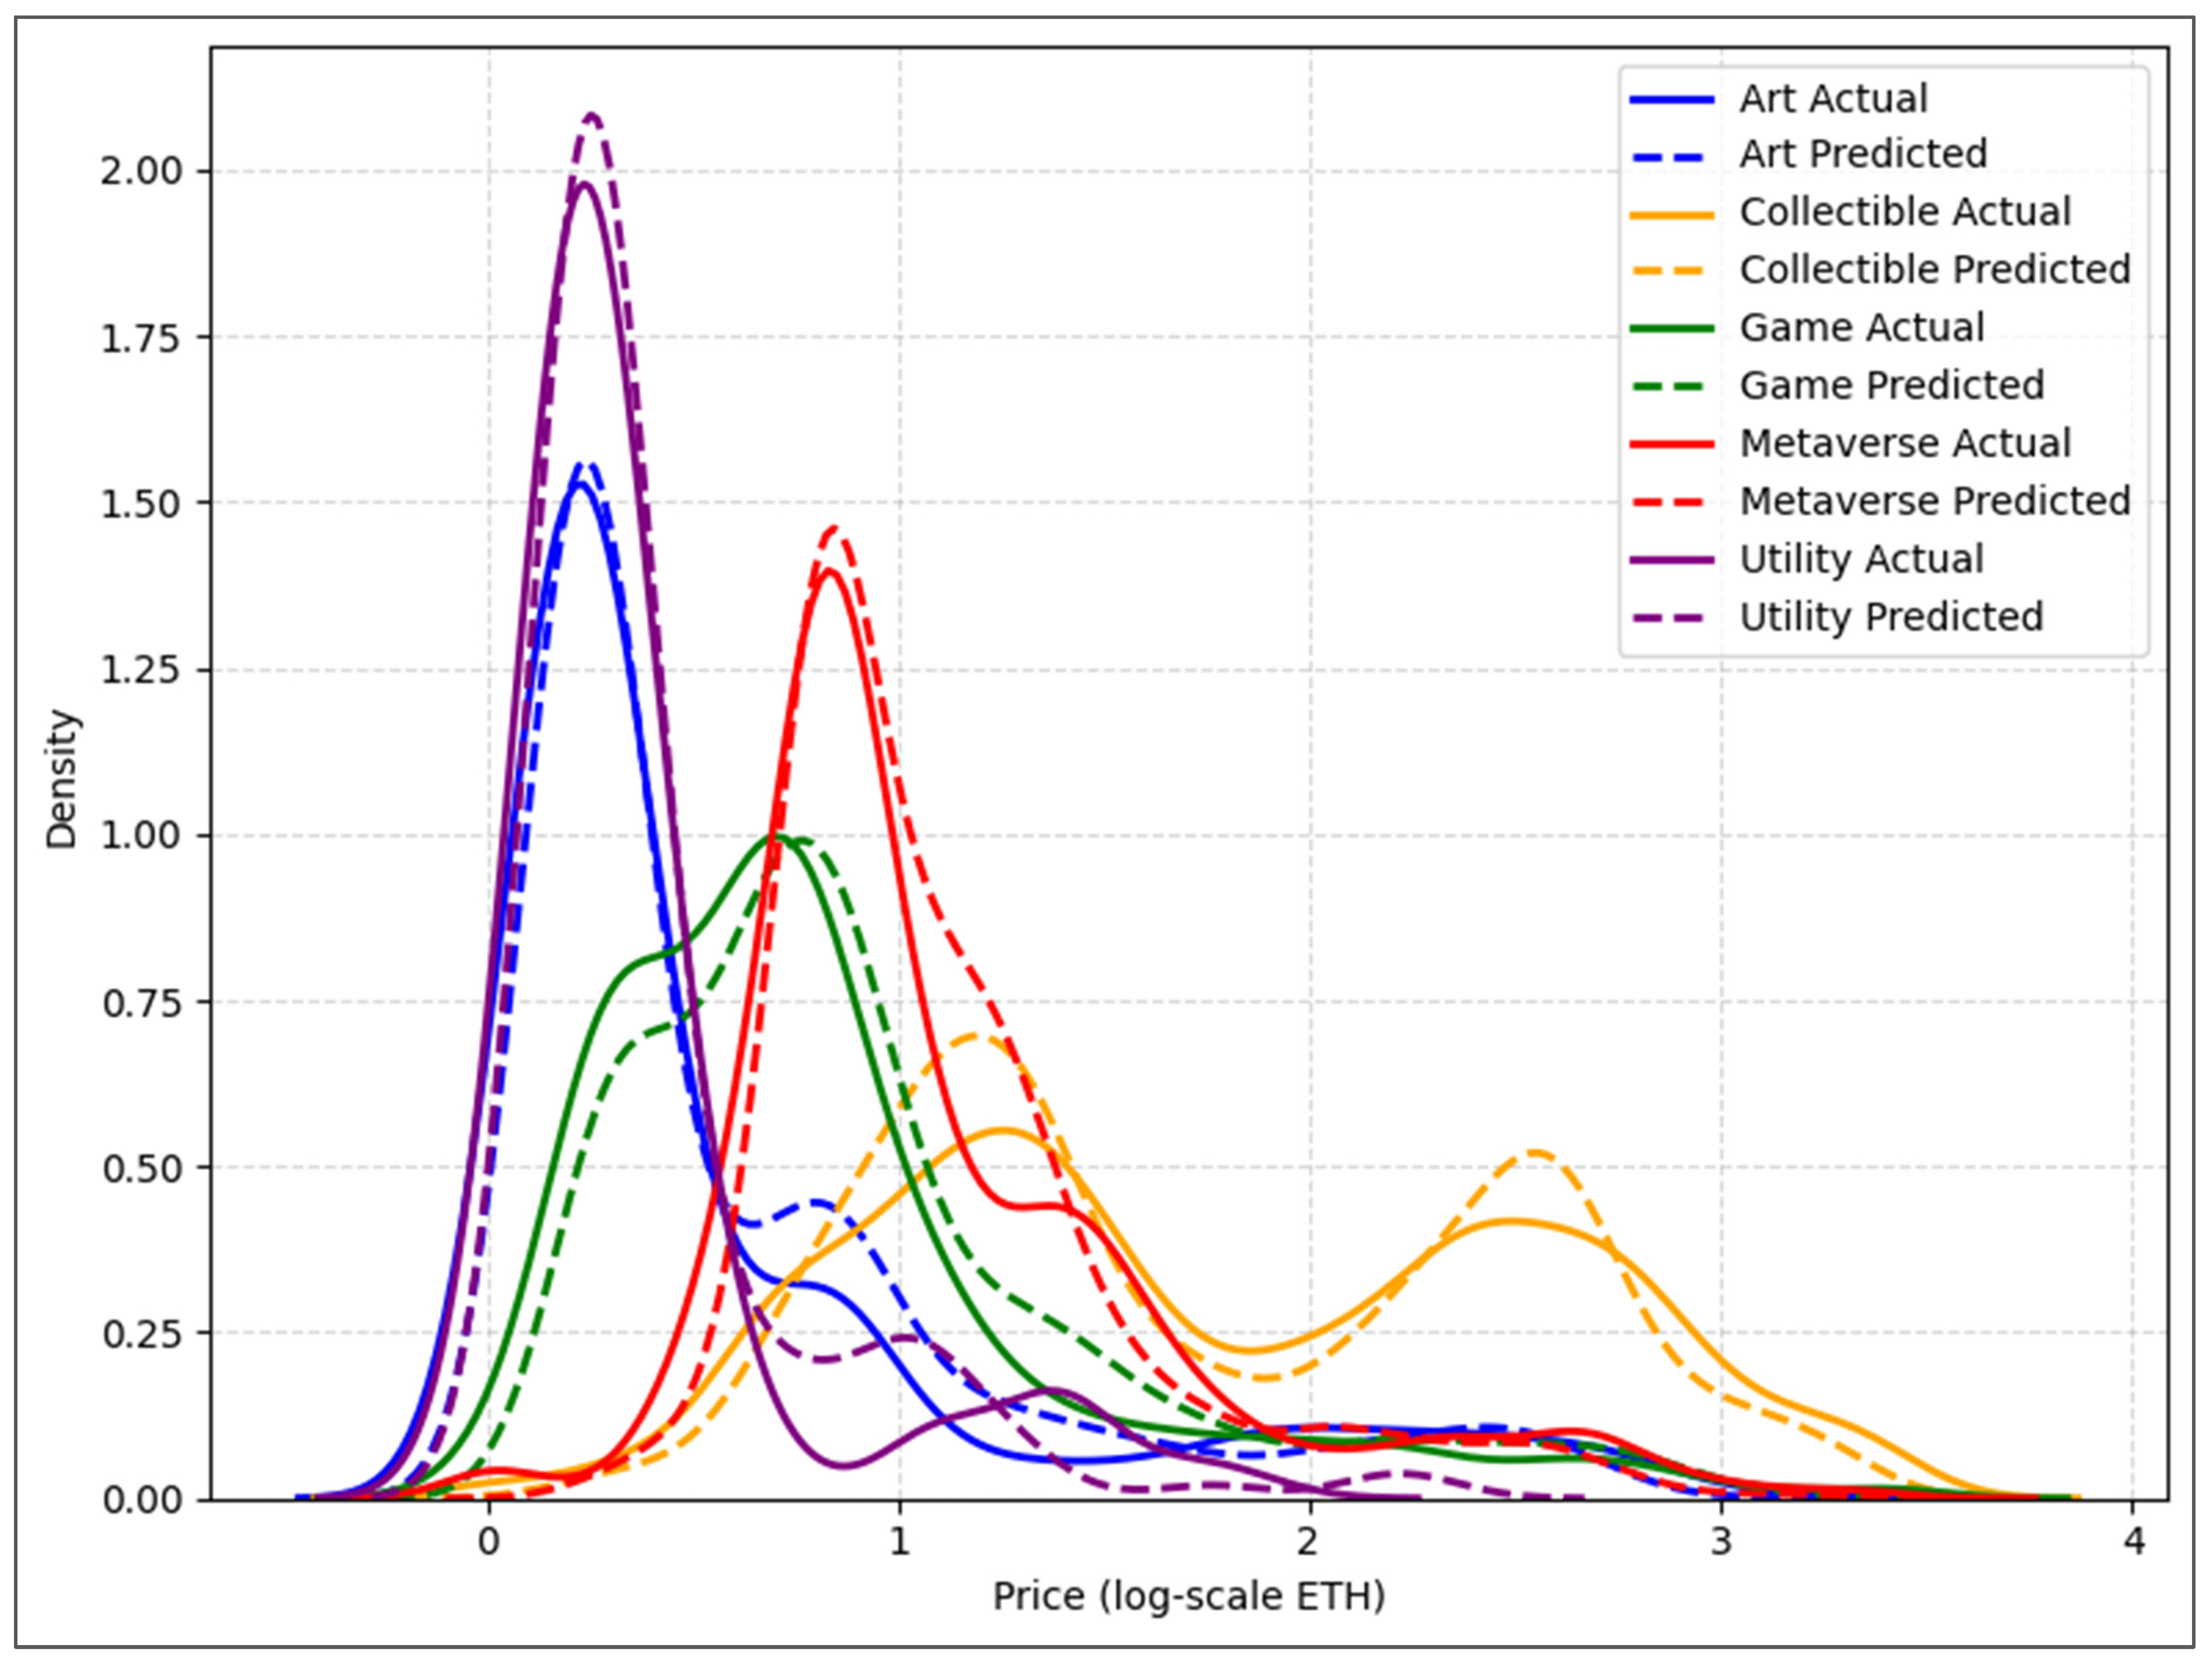
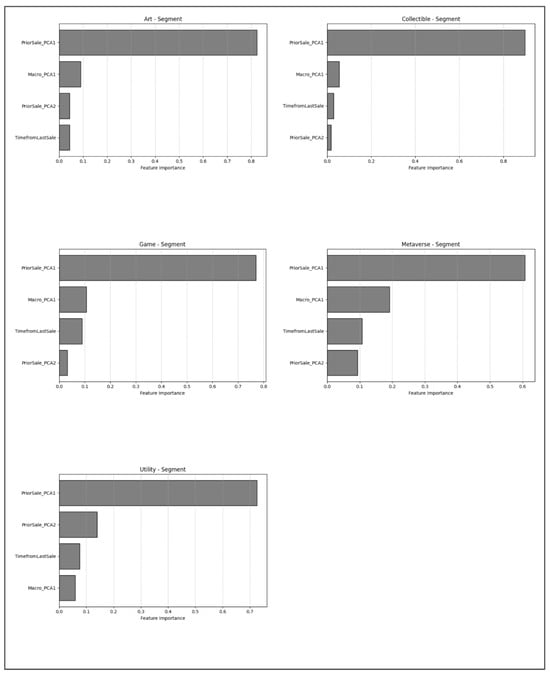
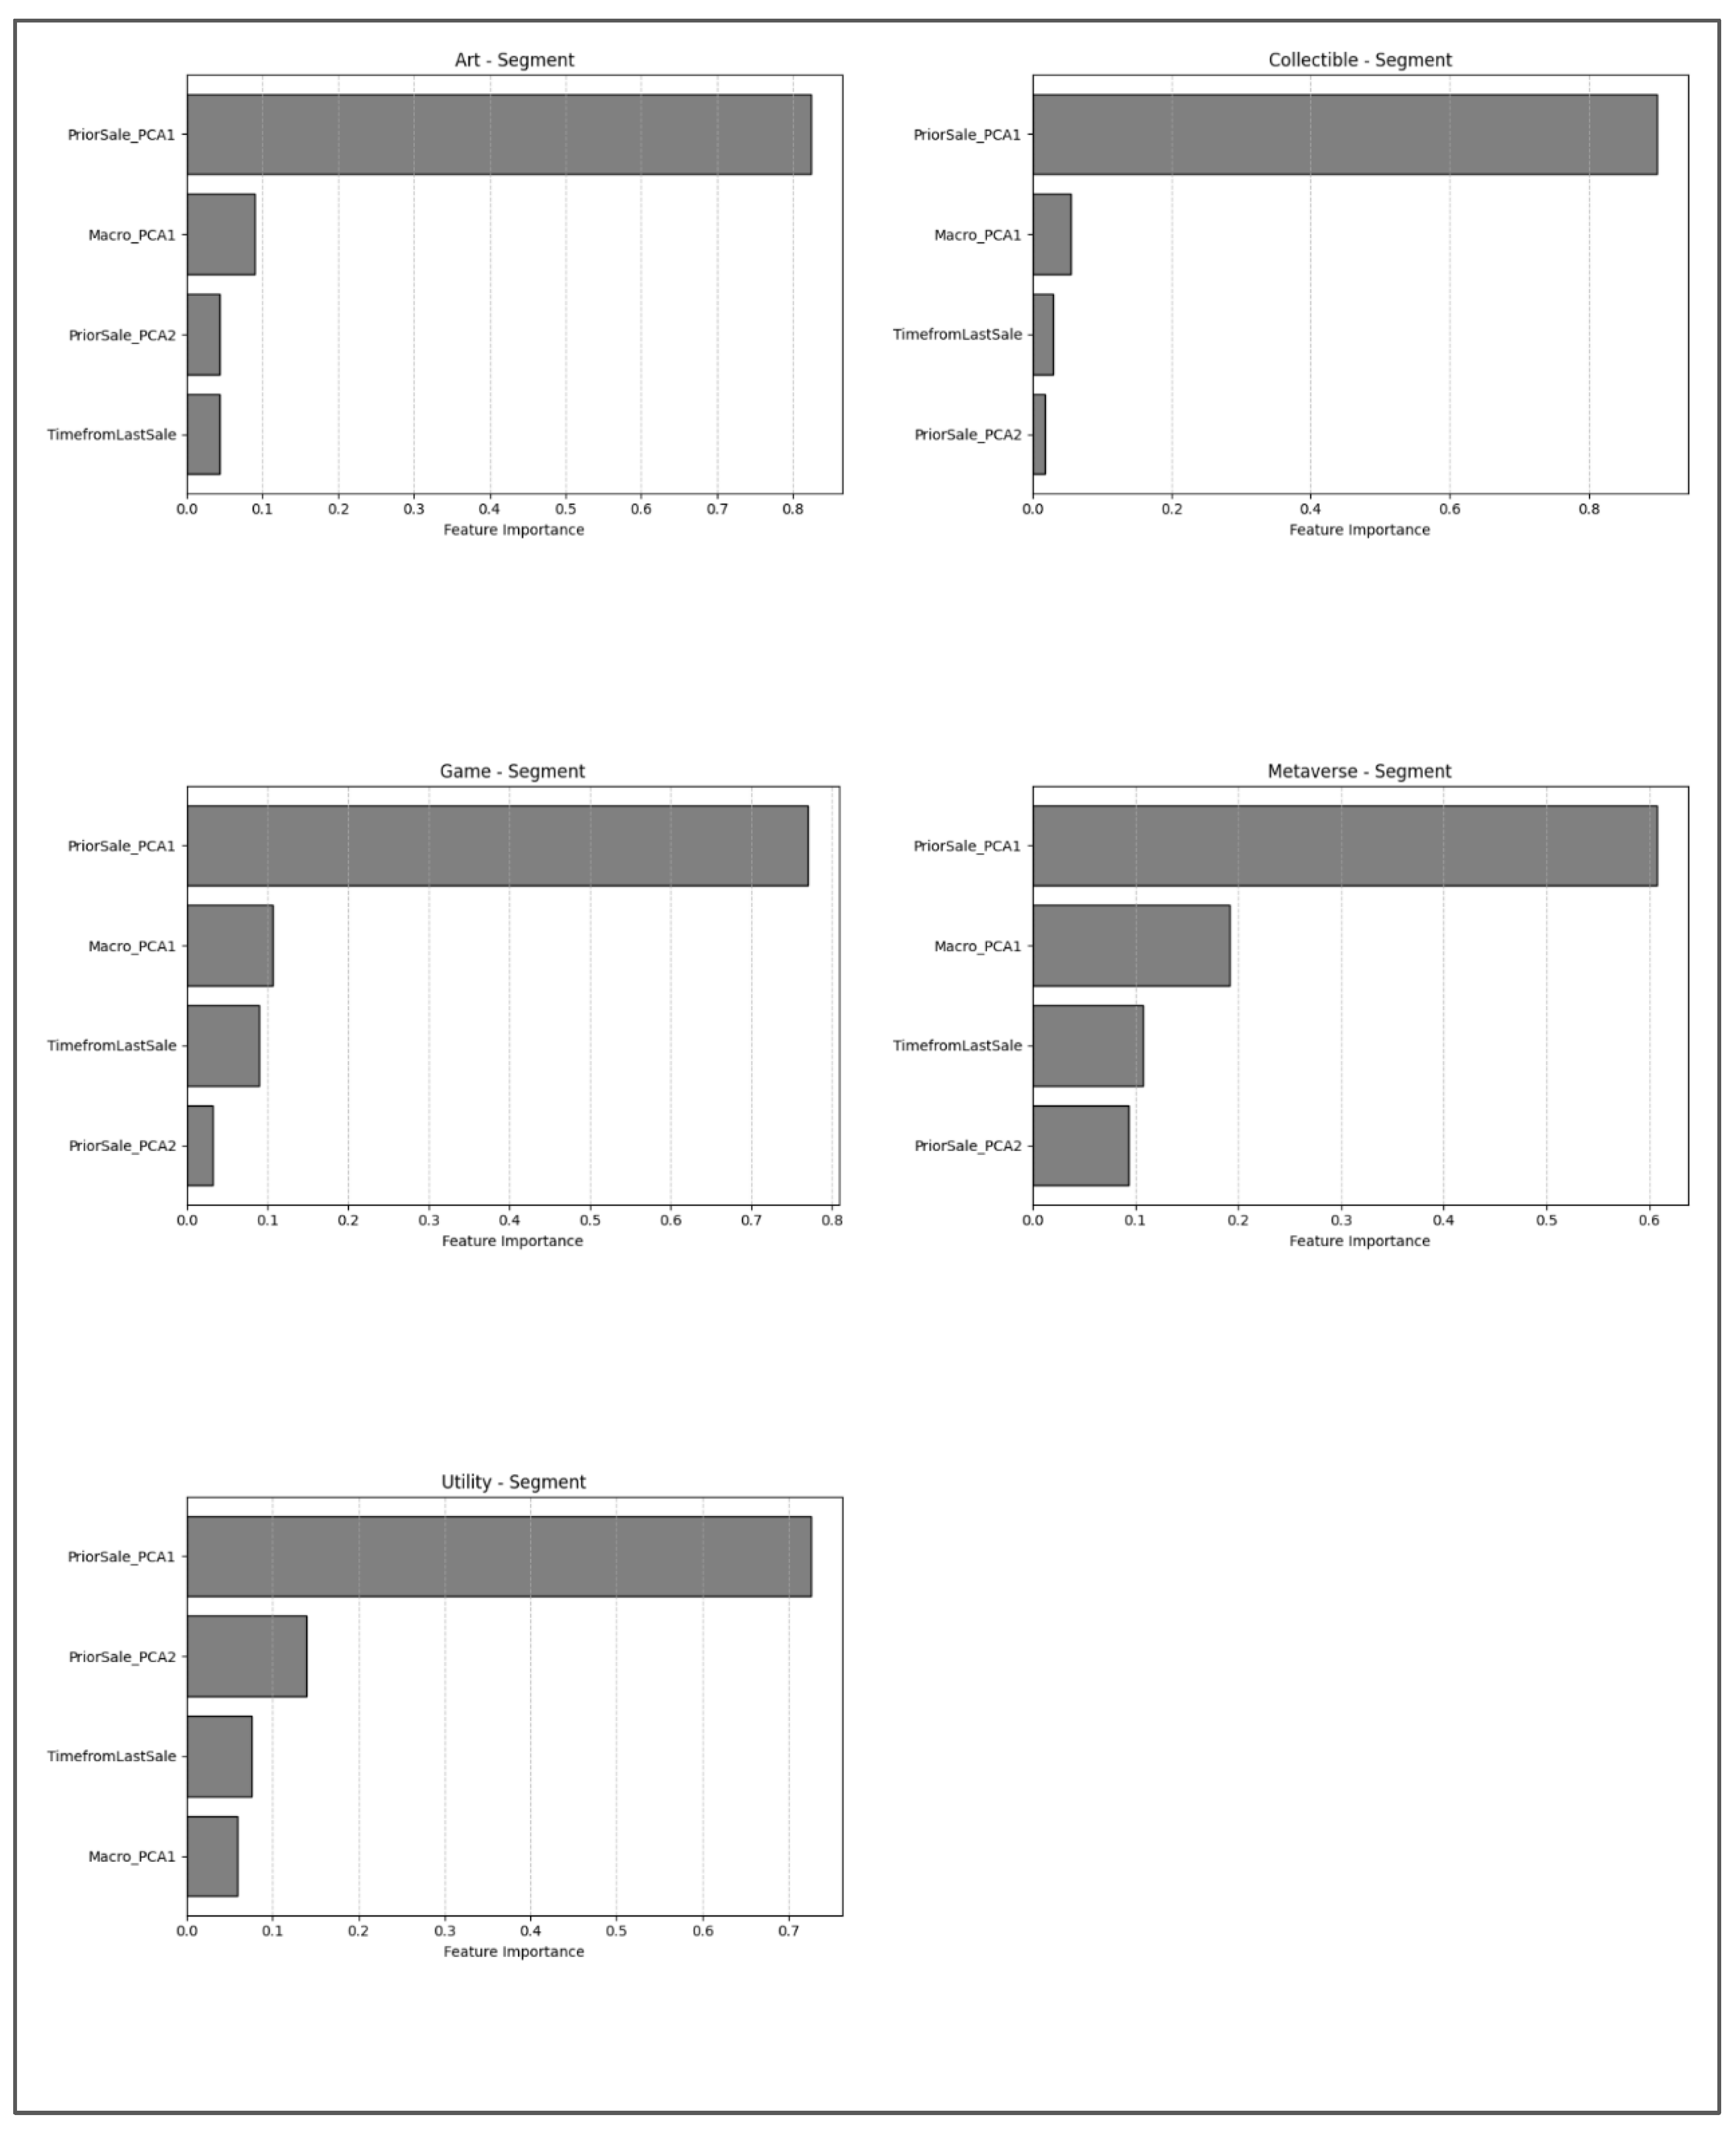
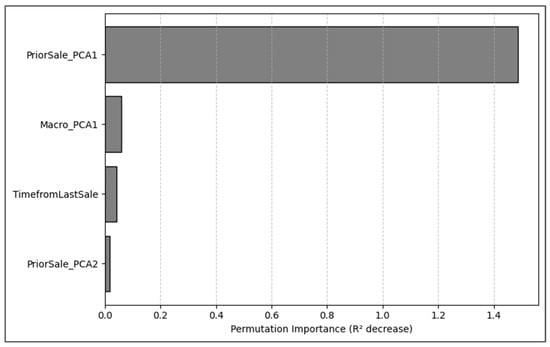
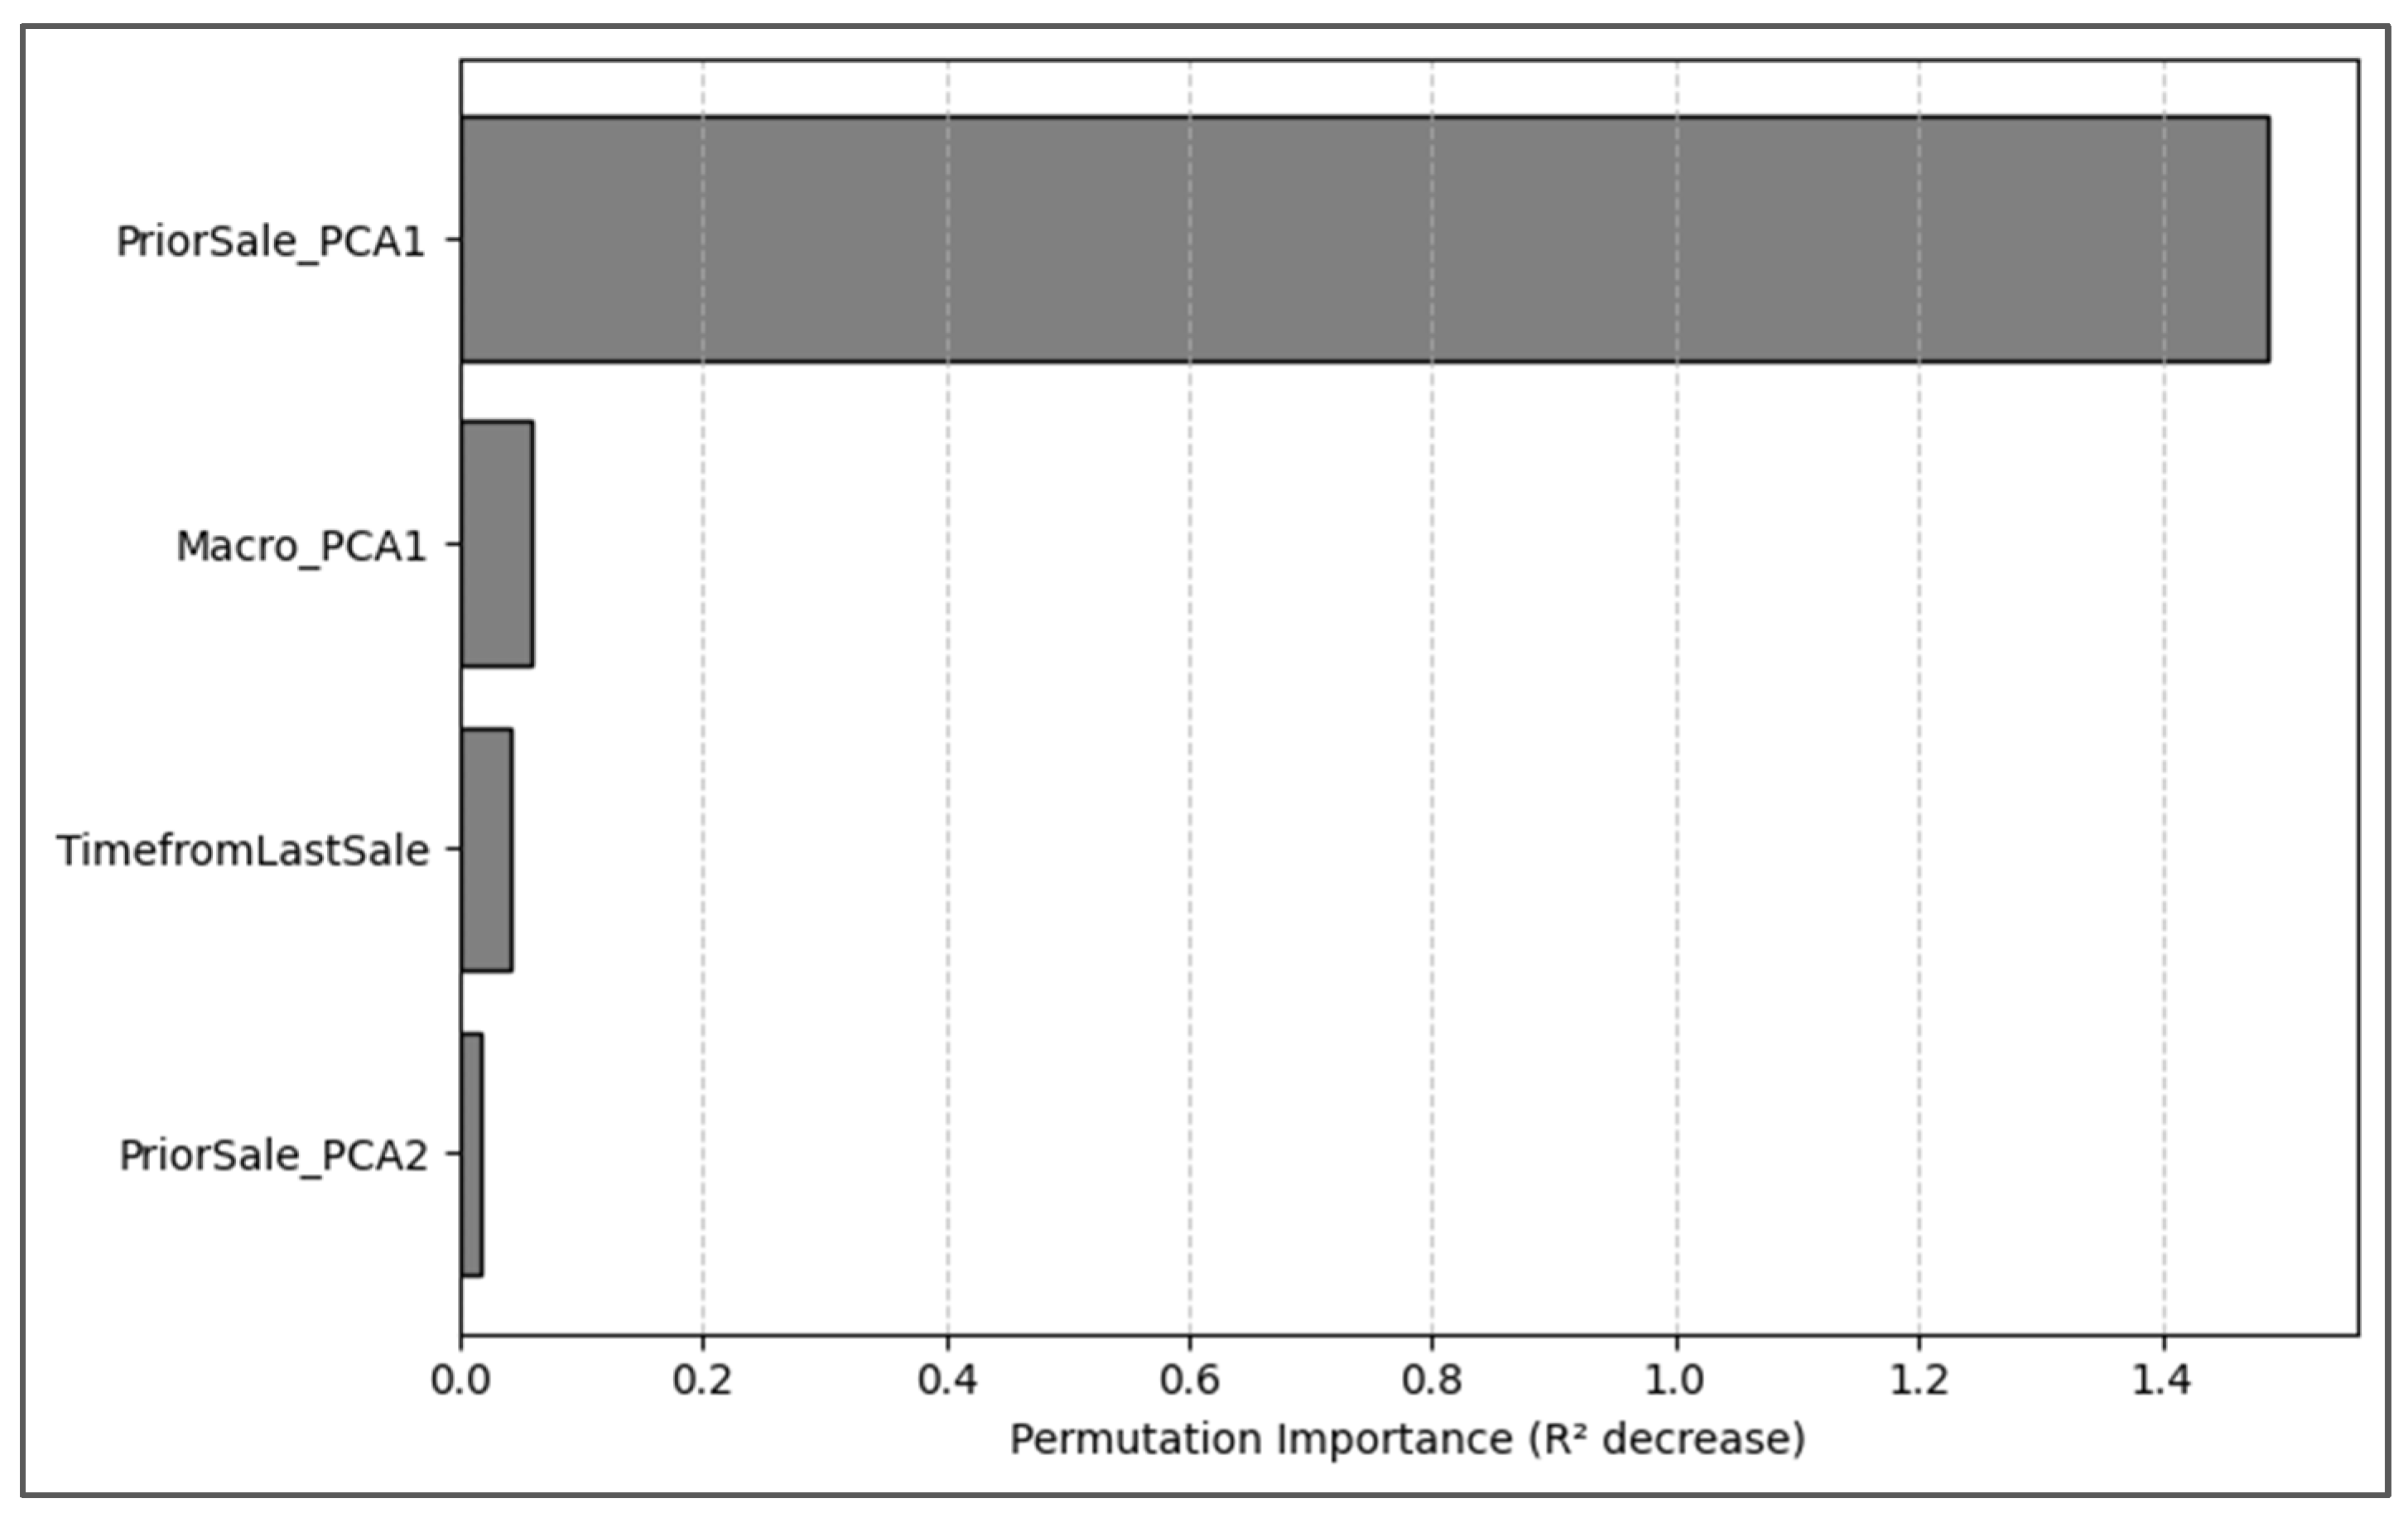
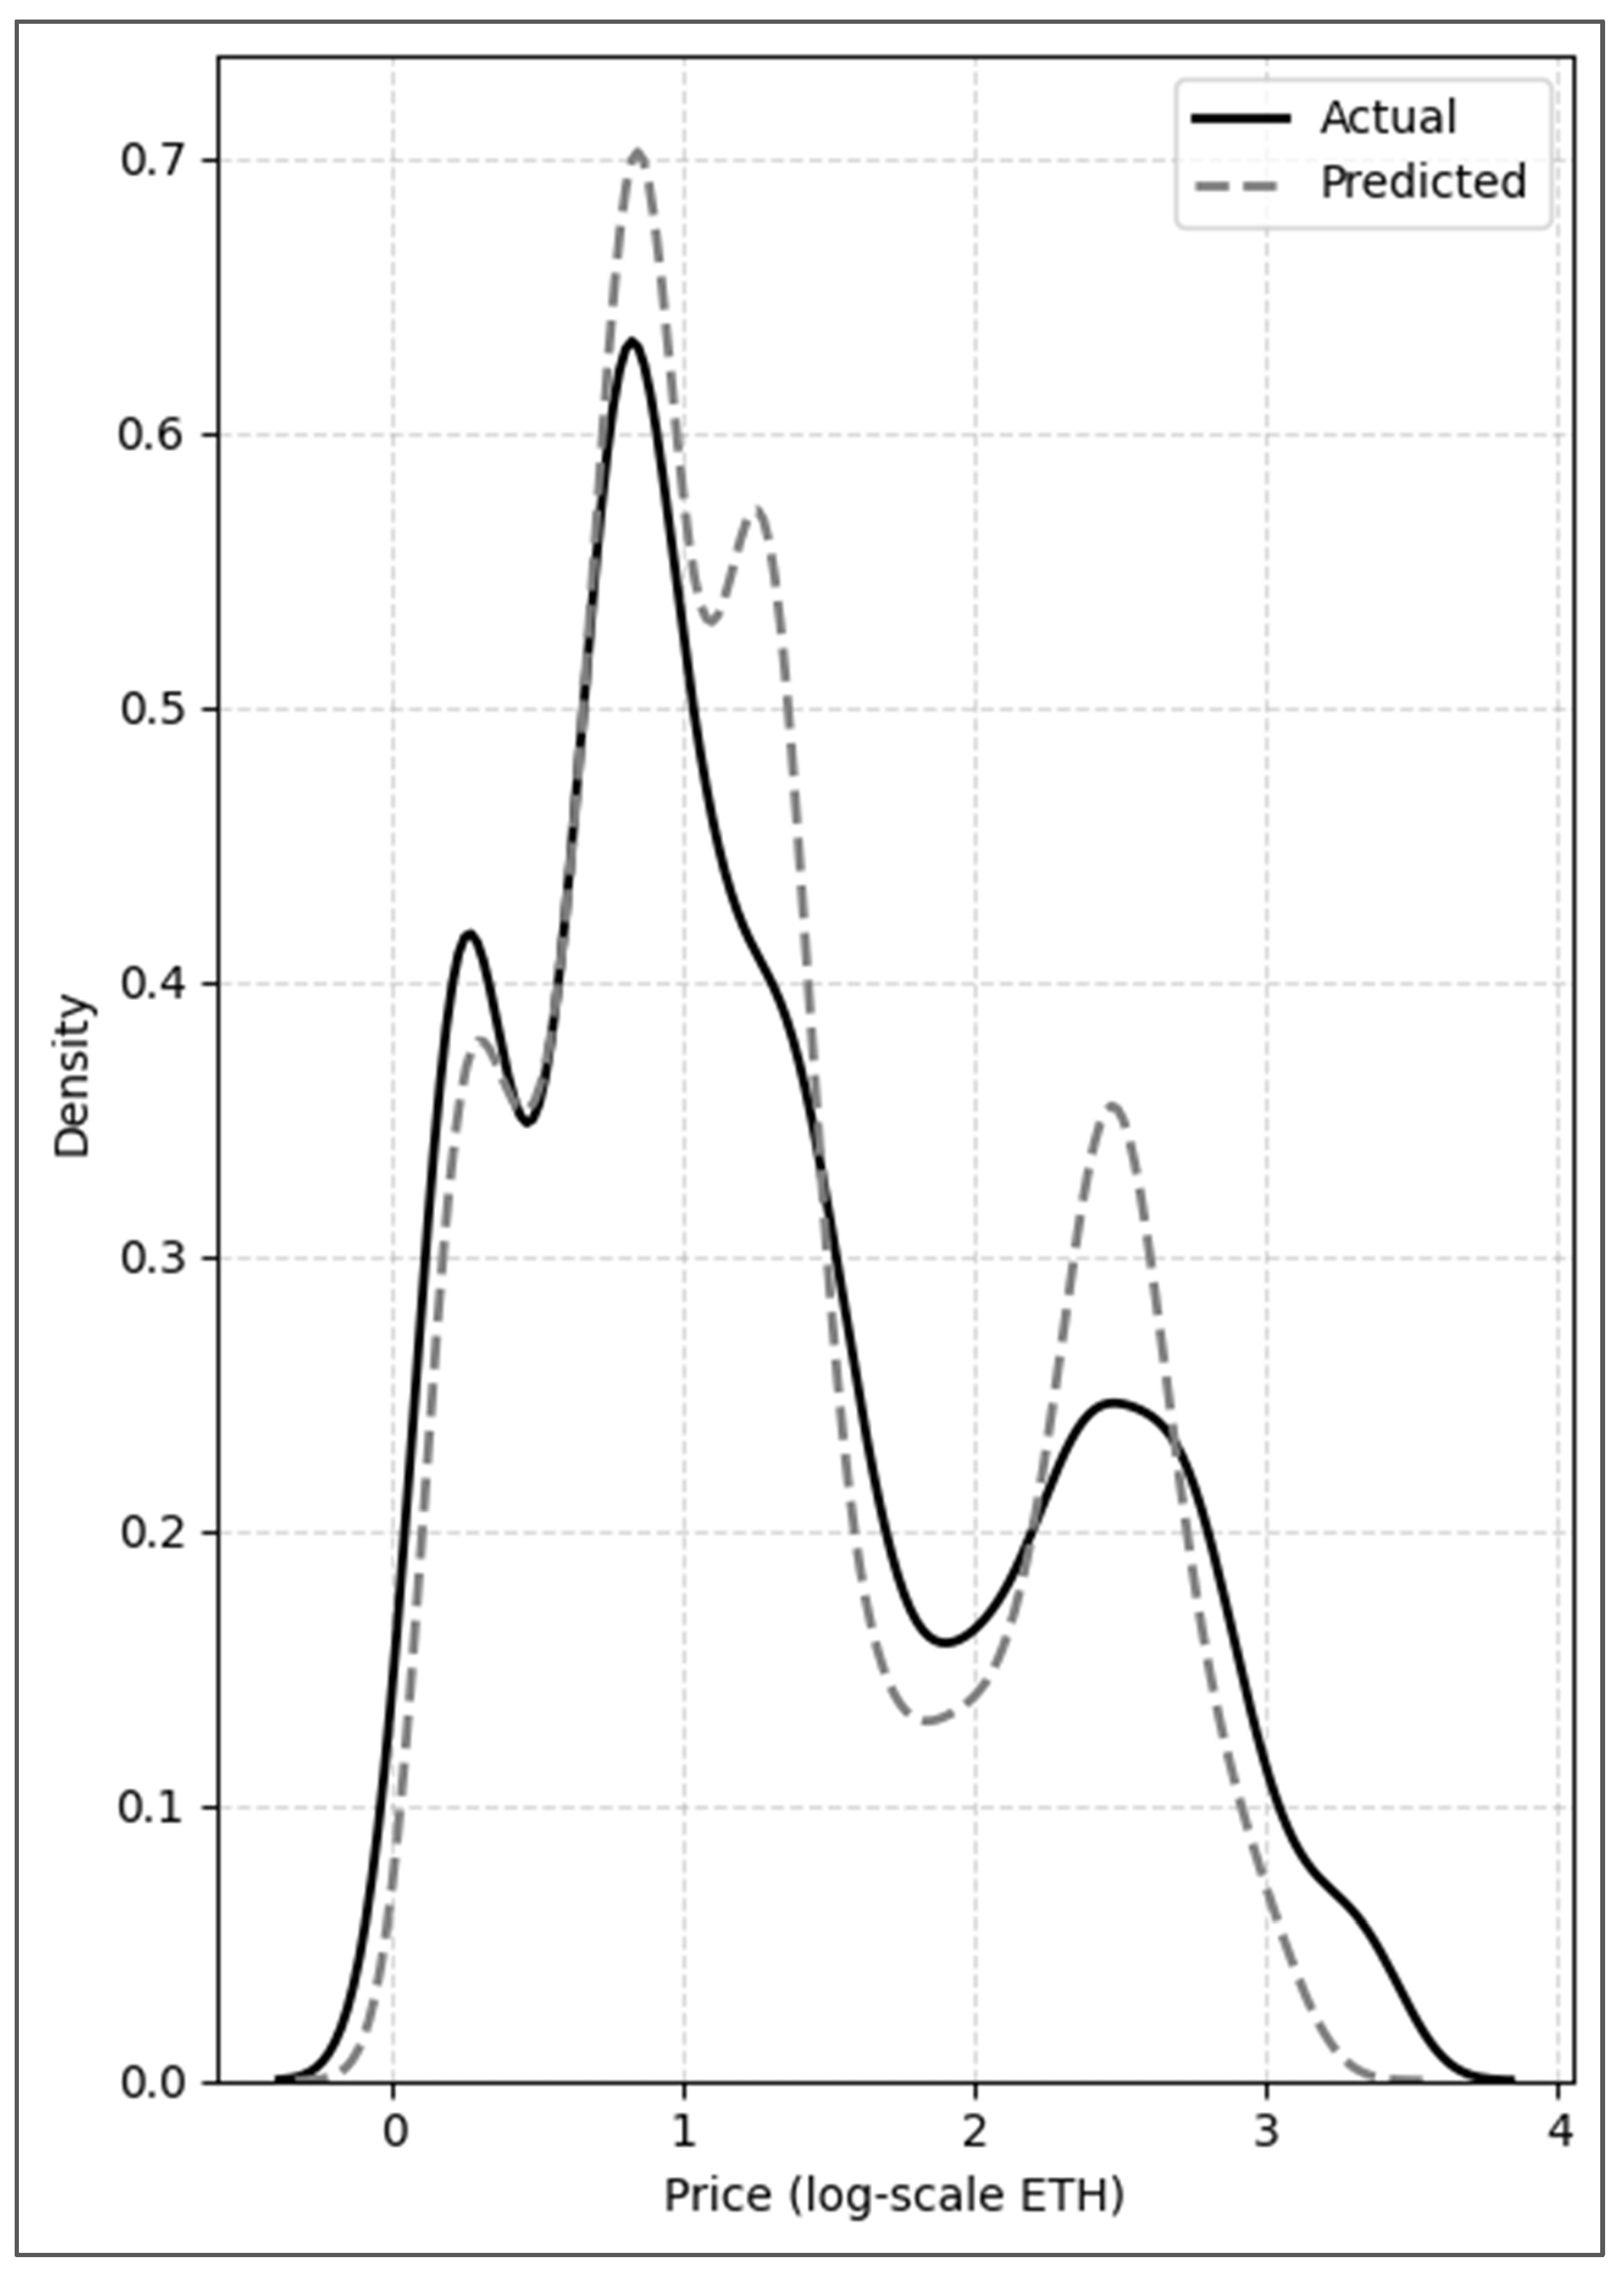
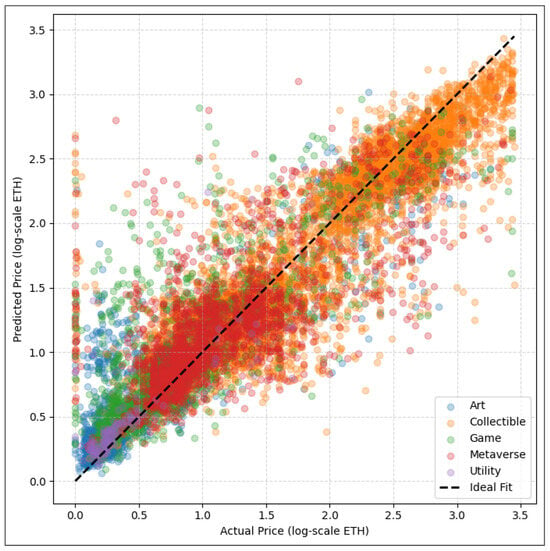
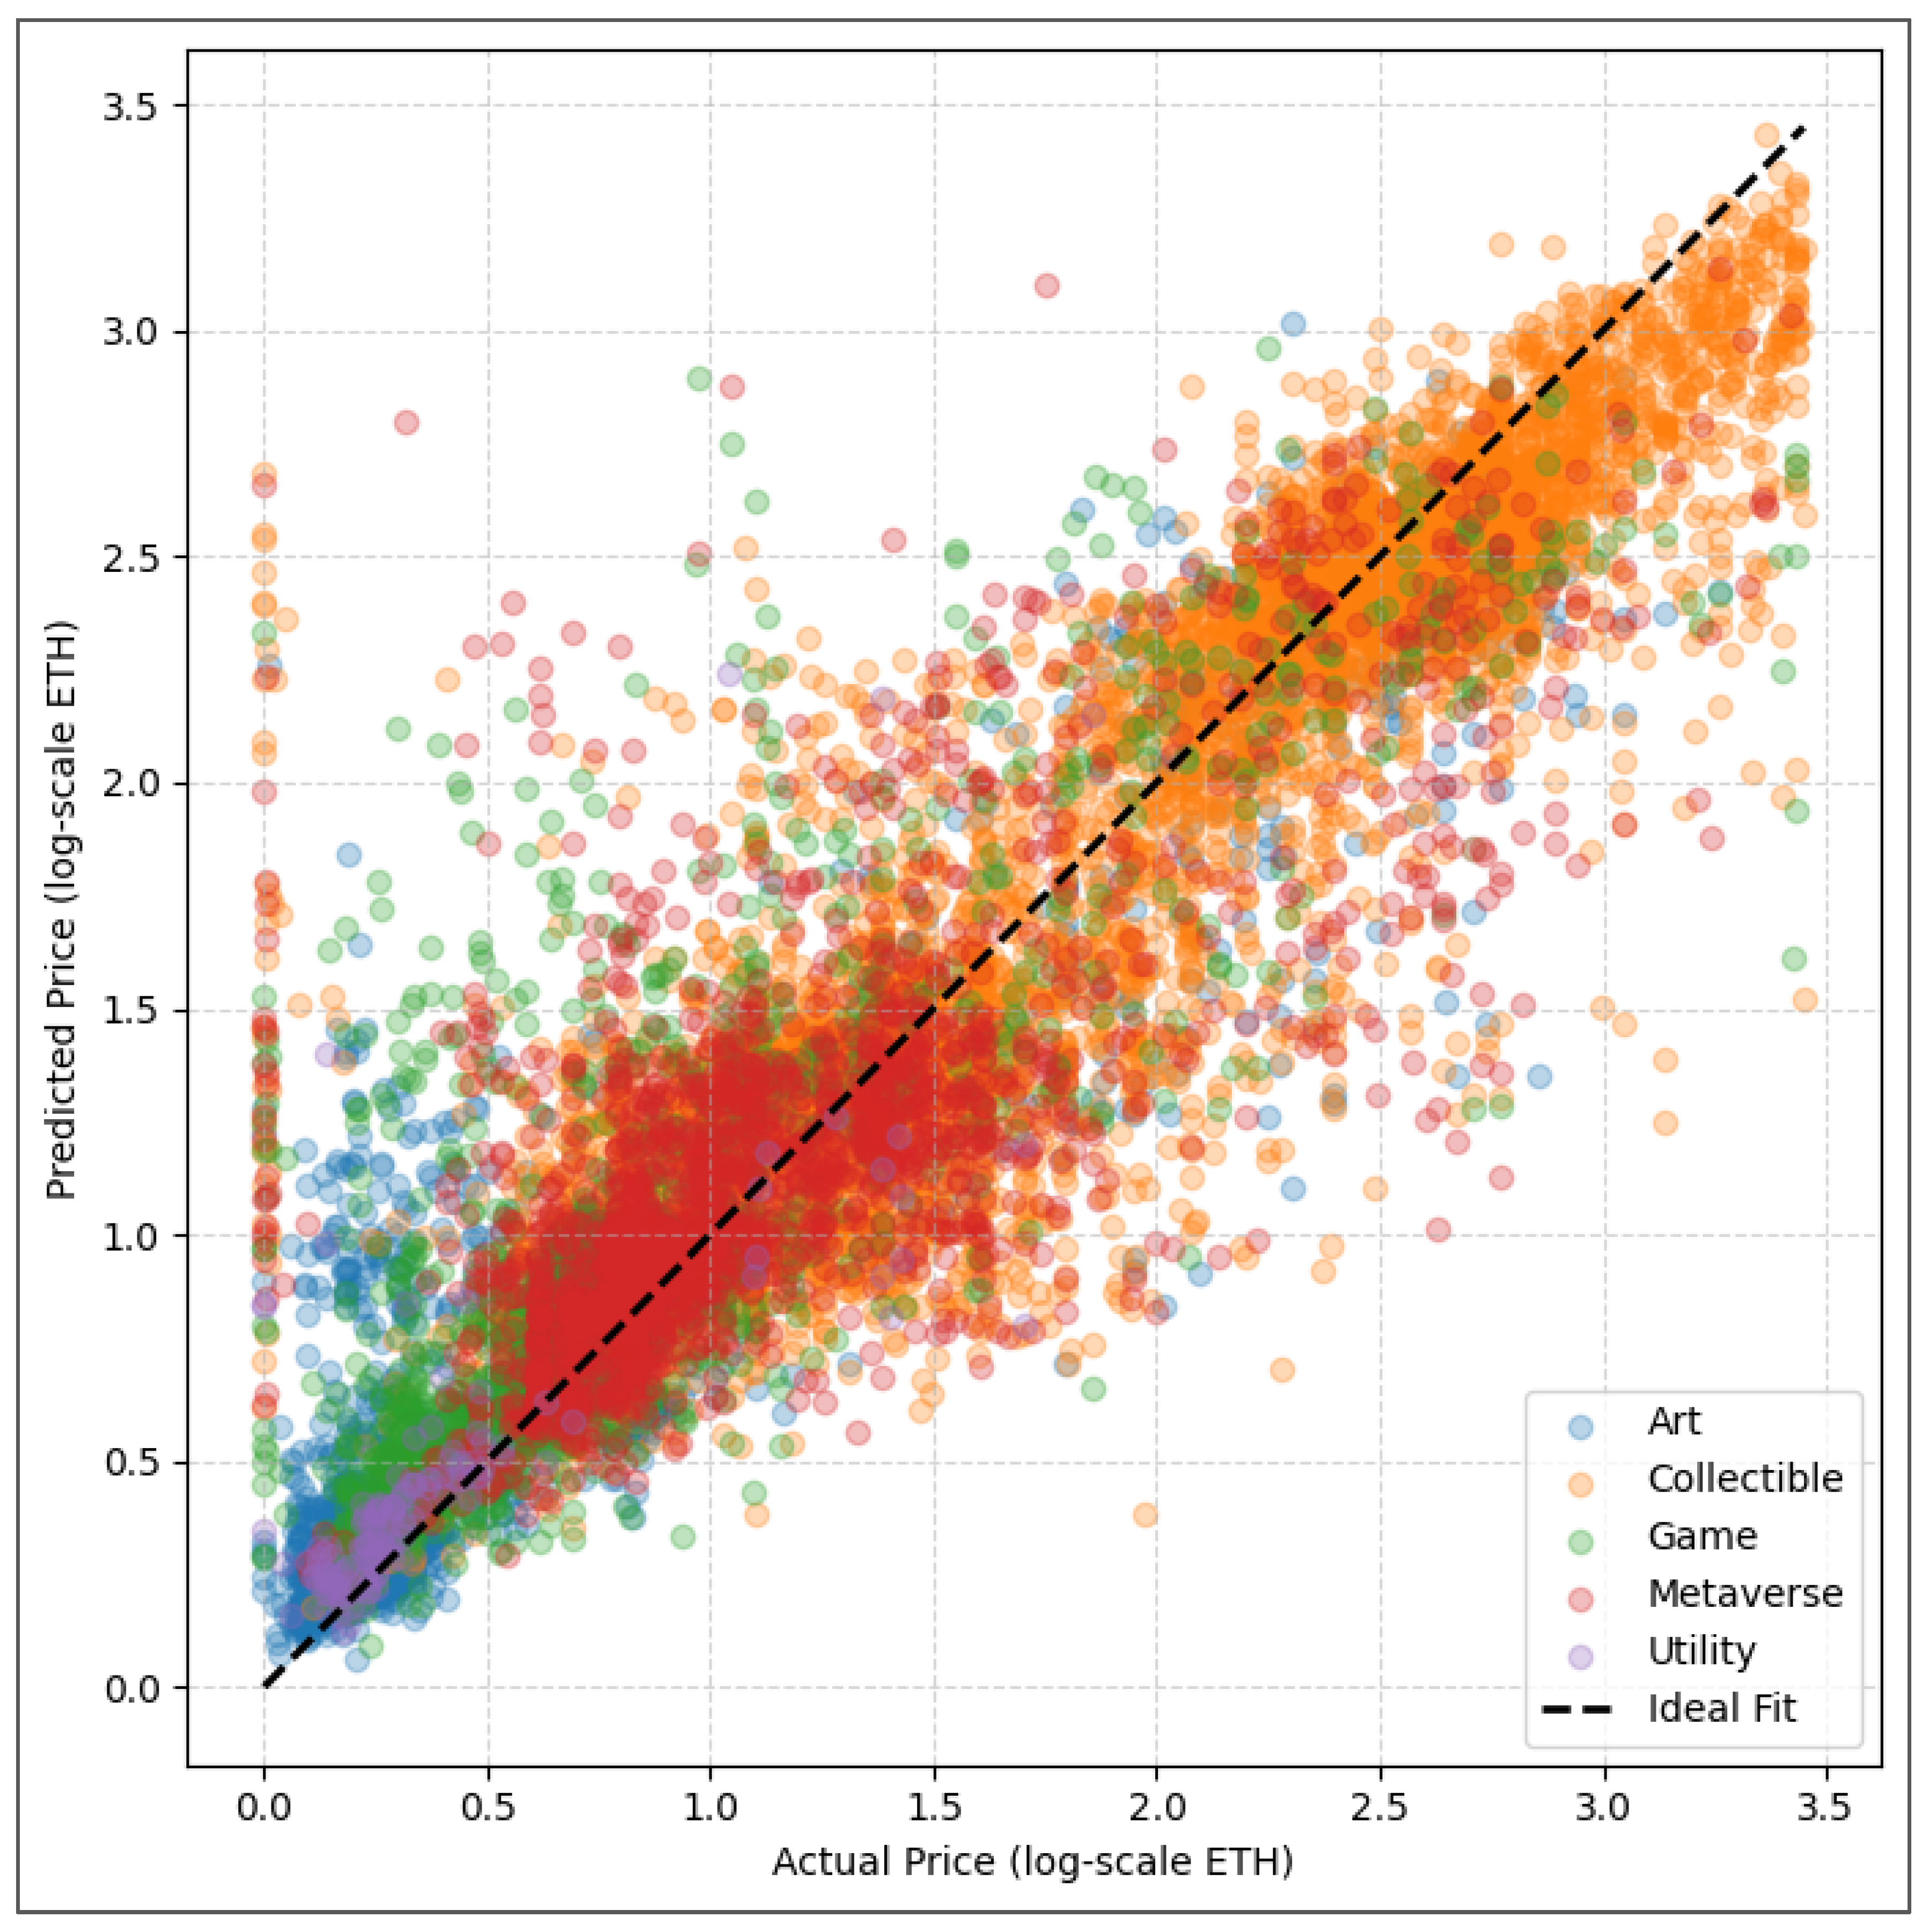
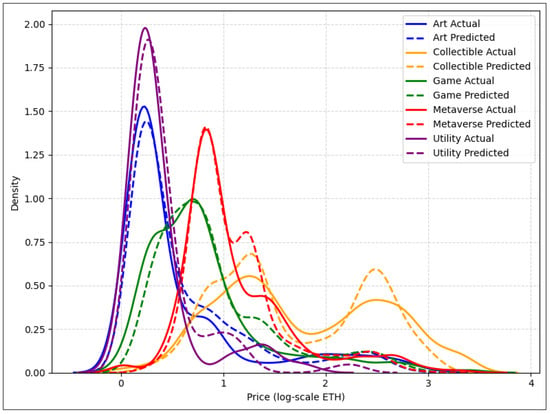
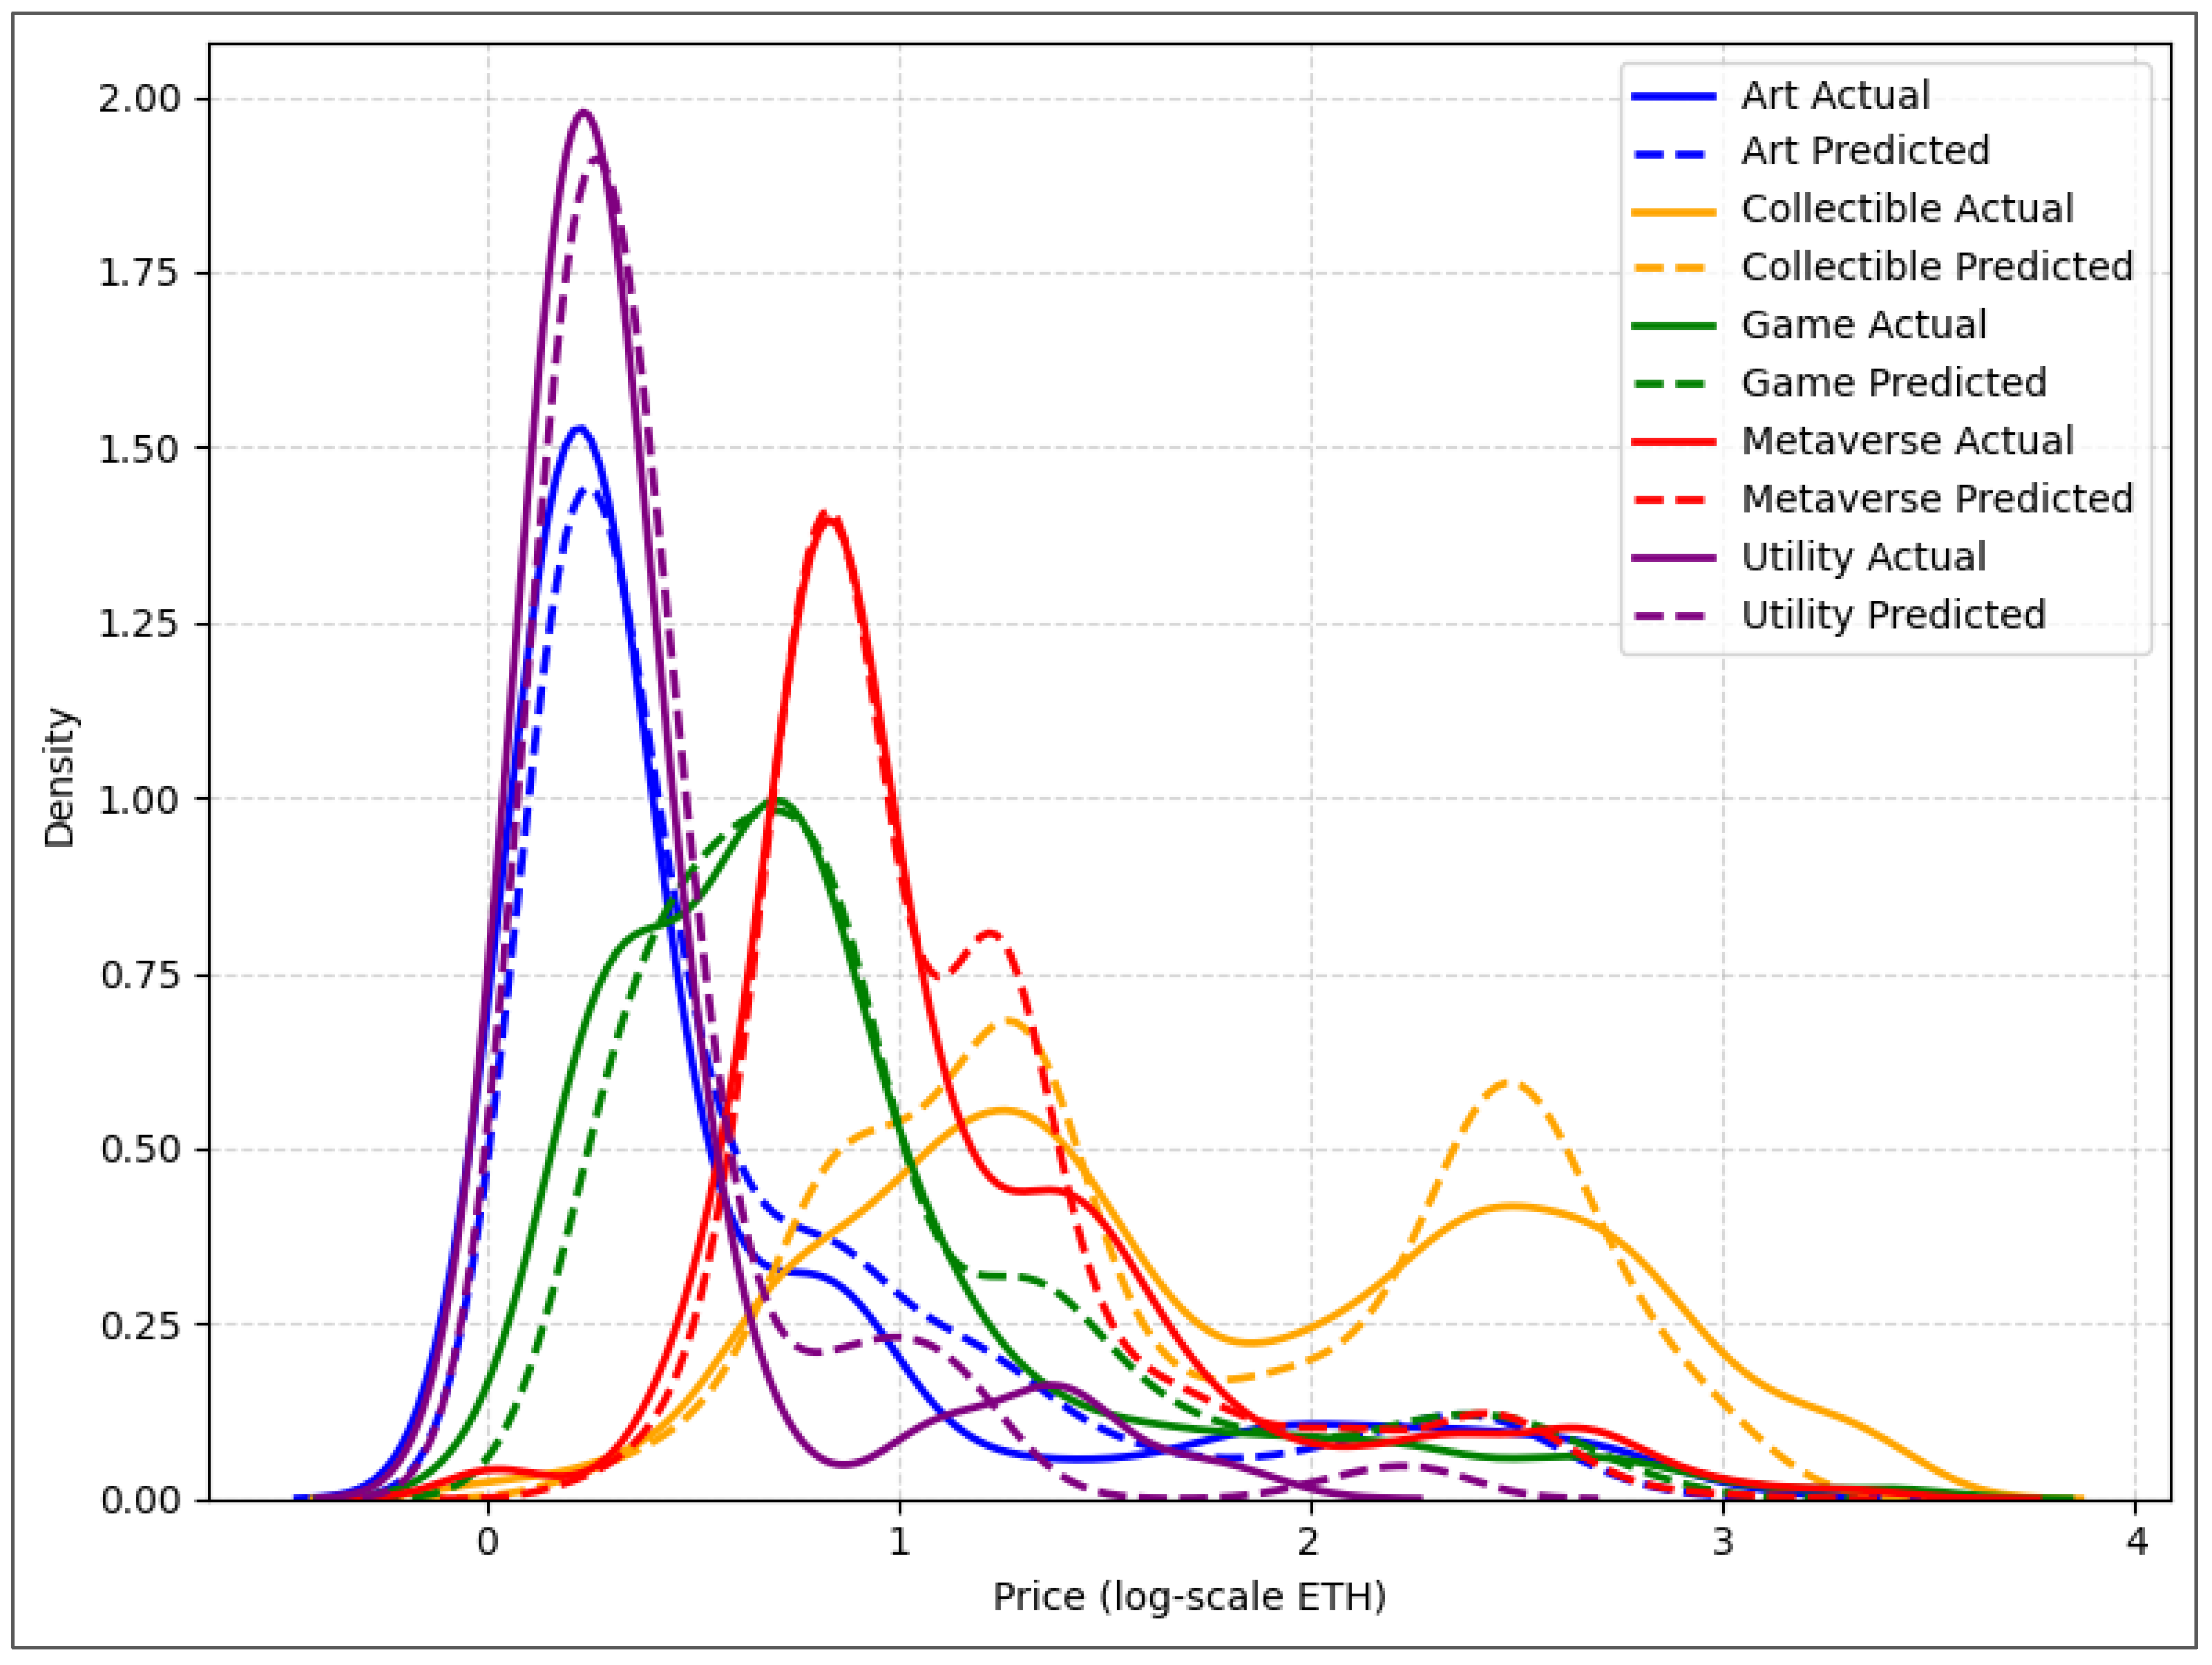
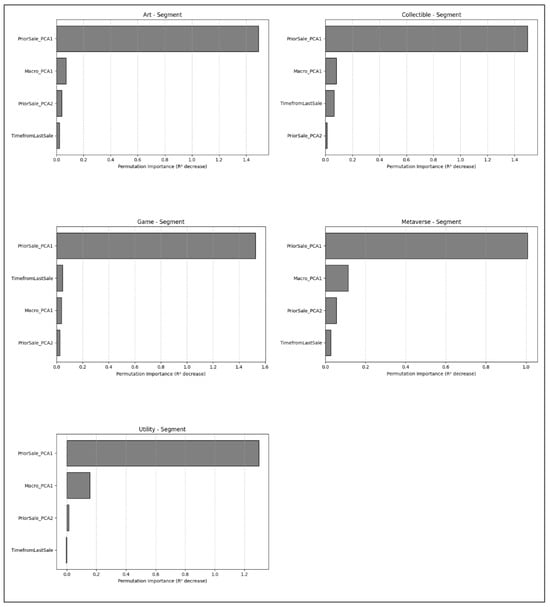
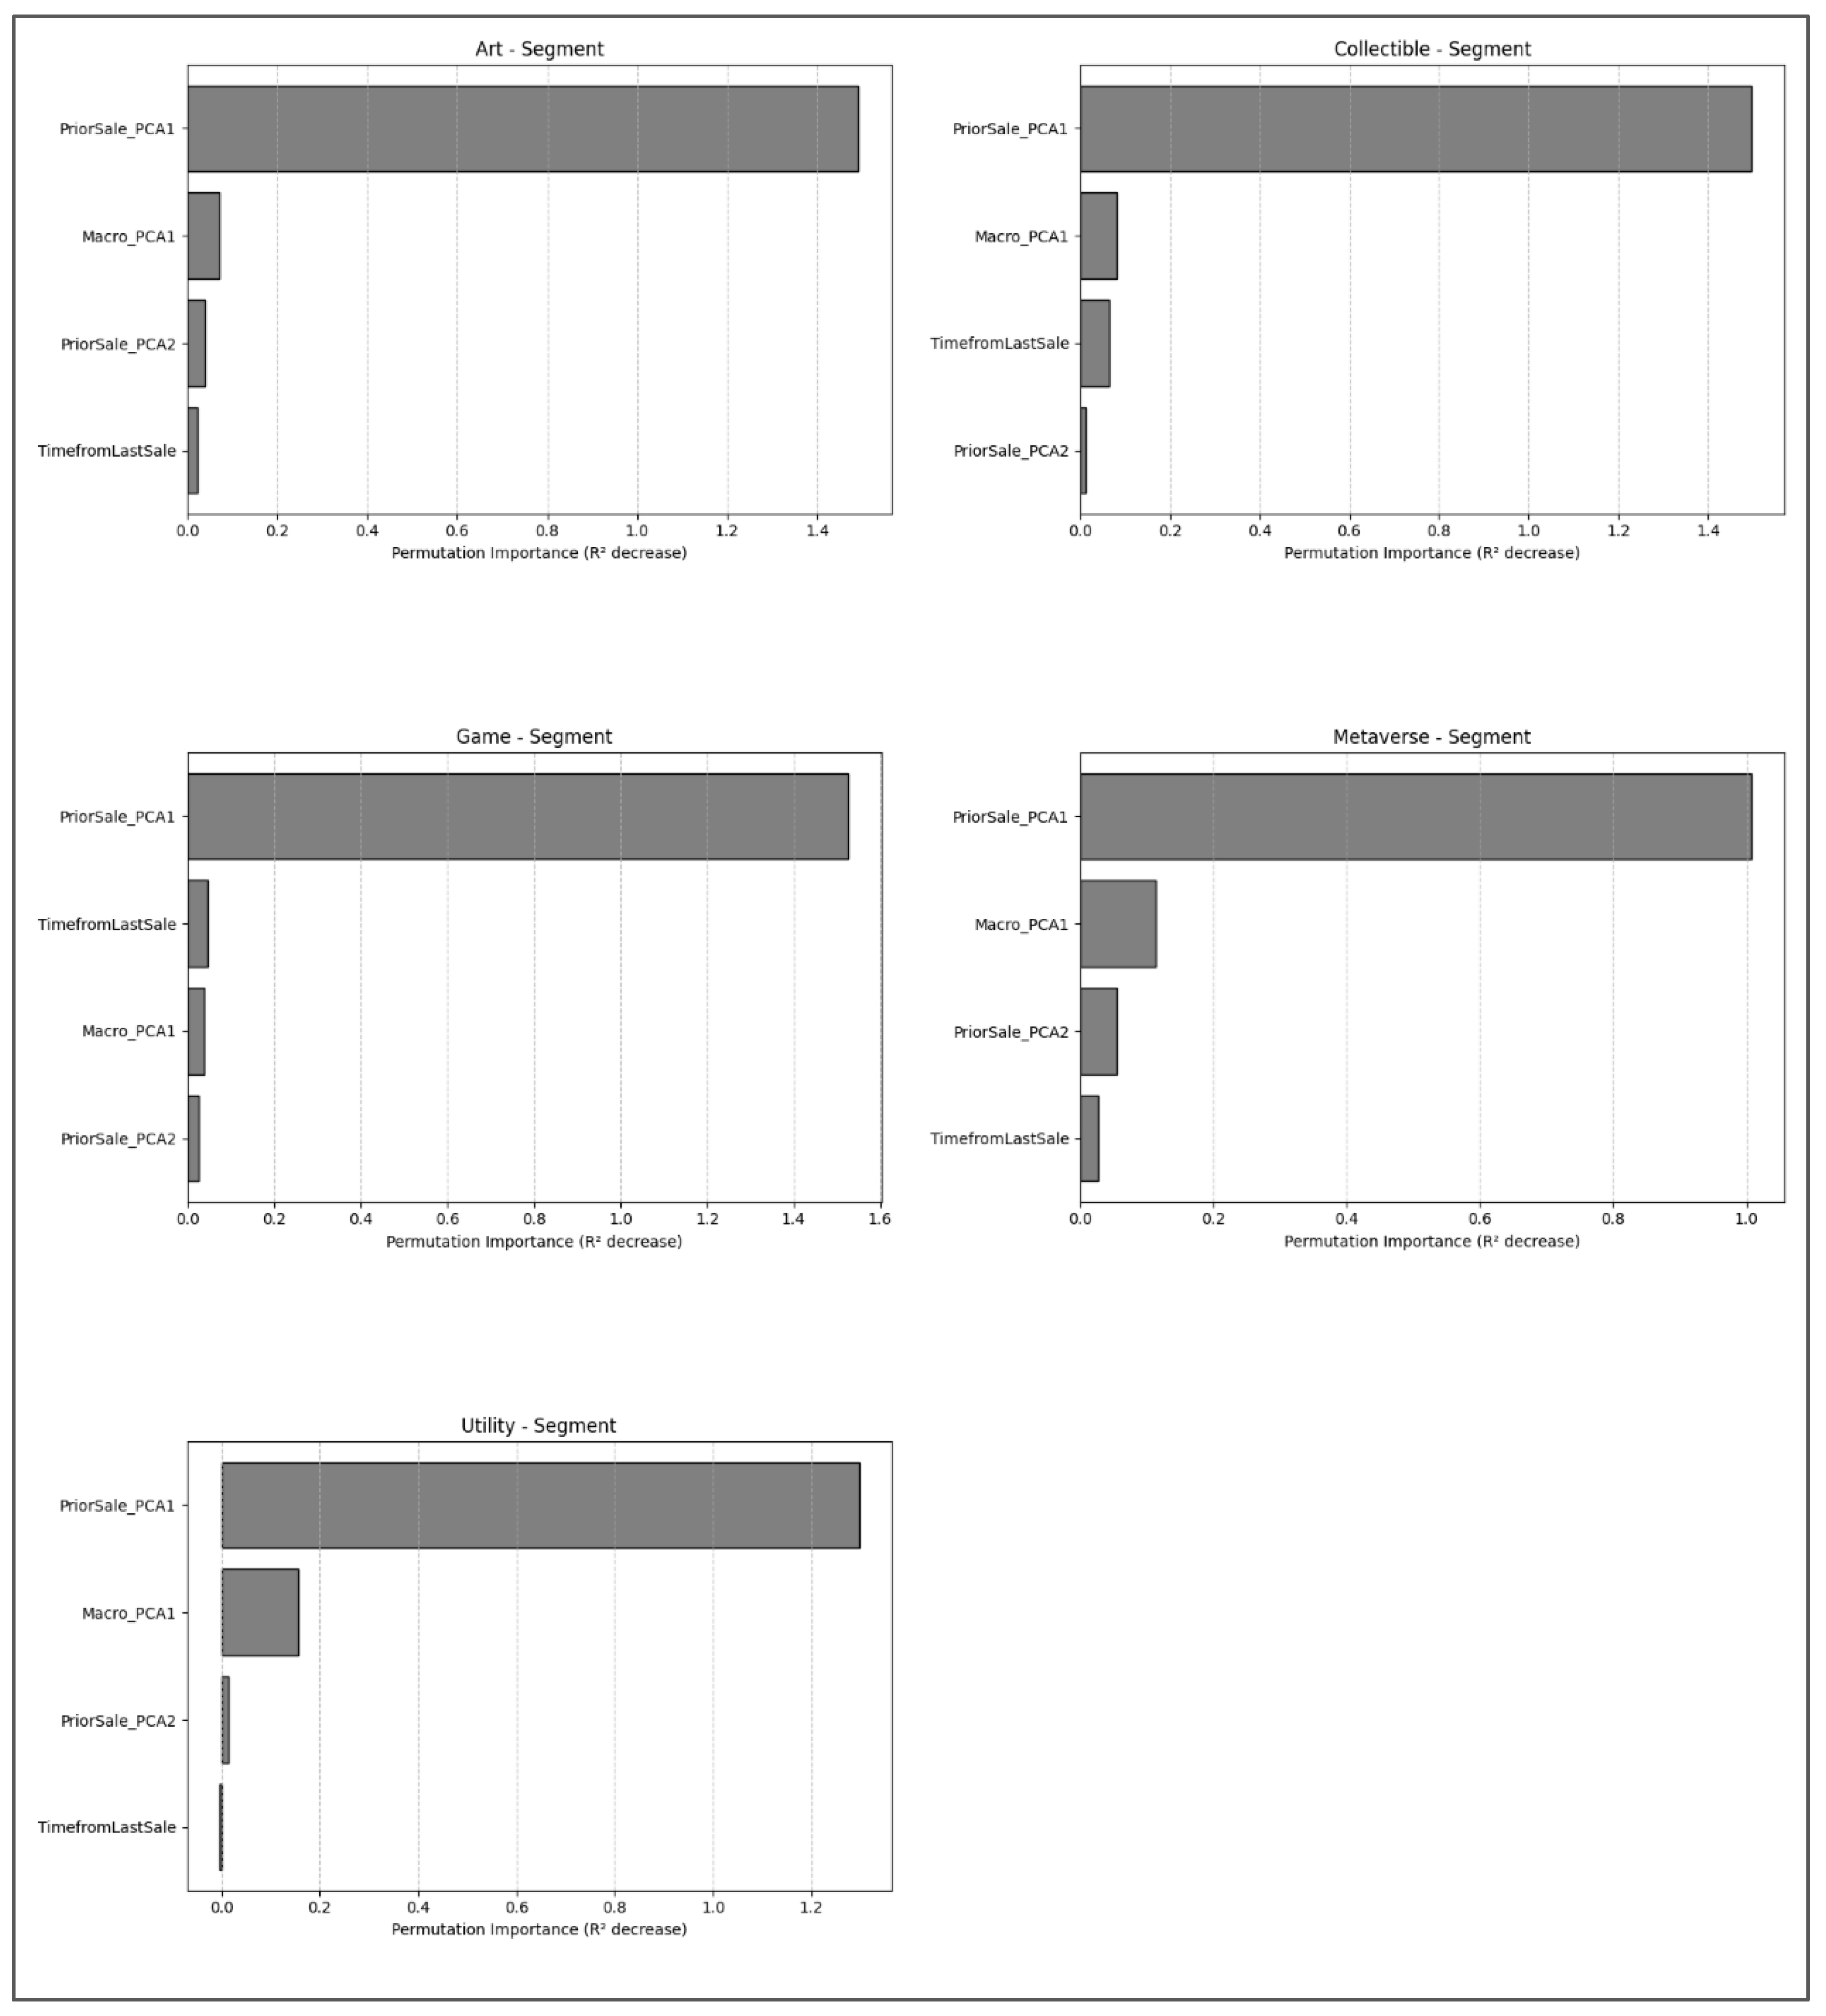

Disclaimer/Publisher’s Note: The statements, opinions and data contained in all publications are solely those of the individual author(s) and contributor(s) and not of MDPI and/or the editor(s). MDPI and/or the editor(s) disclaim responsibility for any injury to people or property resulting from any ideas, methods, instructions or products referred to in the content. |
© 2026 by the author. Licensee MDPI, Basel, Switzerland. This article is an open access article distributed under the terms and conditions of the Creative Commons Attribution (CC BY) license.