


Abstract
Operating structure, not financing, is the main determinant of profitability in small firms. This study reaches that conclusion by comparing, in the same model and on the same scale, two explanations offered for why some small firms earn more than others how they are financed and how they organise their costs. Existing studies focus almost entirely on financing and treat costs as a background control. The evidence comes from a large panel of unlisted Italian firms observed between 2014 and 2025, including innovative start-ups, innovative SMEs and conventional firms, and each result is checked with three independent types of analysis. Firms that devote a larger share of the value they create to wages earn systematically less, in every type of firm. Part of this link reflects how profits are recorded in the accounts. The link between equity and profitability, by contrast, is weak and its direction cannot be established, because profitable firms accumulate equity and cause and effect cannot be separated. Profitability is also determined differently across groups of firms fall into distinct operating profiles. Support schemes for innovative firms that focus on access to finance may therefore be addressing the wrong constraint.
JEL Classification:
G32; L25; C23; C38; M41
1. Introduction
Why one small firm earns more than another is usually answered by reference to how it is financed. The literature on small and medium enterprises is organised around capital structure, and its central result is unusually stable; better capitalised firms are more profitable, as Matias and Serrasqueiro (2017), Dalci (2018), Quoc Trung (2021), Kalash (2023) and Youssef et al. (2023) establish across national panels. This paper asks a question the same data can answer but that has not been posed; when capital structure and the operating model are placed in one equation and measured on the same scale, which carries more of the variation in profitability?
Two terms must be defined before the argument proceeds. Capital structure is used here in its standard corporate-finance sense (Modigliani & Miller, 1958; Myers, 1984; Rajan & Zingales, 1995): the composition of the sources from which a firm funds its assets, that is, the mix of own funds and borrowed funds on the liability side of the balance sheet. This term is used throughout this paper, consistently with the literature reviewed below. Capital structure is measured by the equity ratio, net worth as a percentage of total assets, which records how much of the firm is financed by its owners rather than by creditors, and it is complemented by the liquidity ratio, which records the short-term side of the same funding mix. Cost composition, which we also call the operating model, refers instead to the way the value a firm produces is absorbed by its inputs: the share of value added paid to labour, and the shares of output spent on purchased services, materials and leased assets. The first describes how an activity is financed; the second, how it is carried out.
This study reverses the usual emphasis between these two blocks, and the reversal needs a justification rather than an assertion. It does not mean that capital structure is dropped or presumed unimportant; both blocks enter the same equation and are compared on the same standardised scale, so that neither is given priority by construction. What is reversed is which block is treated as the object of analysis and which as a background control. Four reasons motivate this. The first is conceptual. Profit is what remains of value added once its inputs have been paid, and the operating model determines the margin a firm earns before any financing choice applies; for small unlisted firms with limited access to external funds (Berger & Udell, 1998), capital structure is to a large extent the accumulated result of past profits, as the pecking-order argument of Myers (1984) and Myers and Majluf (1984) predicts, rather than an independent cause of current ones. The second is empirical; net worth contains the current year’s profit, so that the equity ratio is partly determined by the very outcome it is used to explain, whereas the cost shares are fixed largely by technology and contracts before the year’s profit is known. The third is the imbalance of the evidence documented below, in which studies relating capital structure to profitability outnumber those examining cost composition by more than sixteen to one. The fourth is institutional; the Italian certification scheme, like its European counterparts, presumes that innovative firms are constrained mainly by access to finance, and that presumption can be tested only if the operating side is measured with the same care as the financial one.
The first gap is that cost composition, including the share of value added absorbed by labour, the intensity of purchased services and reliance on leased rather than owned capacity, is almost absent from the literature. It enters firm-level profitability models as a control when it enters at all, and the studies that examine the operating side, such as Campisi et al. (2019), Grau and Reig (2021), Chadha et al. (2023) and Tripathi et al. (2024), measure efficiency or working capital rather than the composition of the cost base. The scarcity is measurable; of 2827 records retrieved from Scopus, twenty-seven relate labour cost, value added or outsourcing to firm profitability, against 447 relating capital structure to it.
The second gap is methodological. Endogeneity is treated as a nuisance corrected by internal instruments and reported in a robustness column, as in Canarella and Miller (2018), Vijayakumaran and Vijayakumaran (2019), Dsouza et al. (2025) and Saiz-Sepulveda et al. (2026). Two facts are rarely acknowledged. Net worth contains the current year’s profit, on which return on assets is computed, so that part of any contemporaneous association is an accounting identity. Profitability is persistent, as Hirsch and Hartmann (2014), Y. Yang et al. (2015), Hirsch et al. (2021) and Choi et al. (2024) establish; so, any lagged ratio embedding past profit is correlated with the current error by construction.
The third gap concerns the tools that could test the specification itself. Accounting-based taxonomies (Linares-Mustarós et al., 2018; Juntunen et al., 2022; Kristóf & Virág, 2022) select partitions on a single validity index and do not re-estimate the relationship inside the groups, while machine learning on accounting data (Pap et al., 2022; Shetty et al., 2022; Vajjhala & Strang, 2024; Mahmood et al., 2025) is framed as prediction and compared with linear models on raw levels rather than on the transformation a fixed-effects estimator uses.
The originality of this study lies in holding one sample and one equation fixed while three methods interrogate different assumptions about it. The setting is the Italian population of certified innovative start-ups and innovative SMEs with a control group of conventional firms including 91,756 firm-year observations on 14,913 firms. Evaluations from Vannoni (2019), Manaresi et al. (2021), Migliaccio and Pavone (2021), Aiello et al. (2024), Anderloni and Harasheh (2025) and Scandurra et al. (2025), are used to estimate average effects while the mechanism is presumed. Panel estimation asks whether the association survives the estimator; unsupervised partitioning asks whether one coefficient vector describes every firm; machine-learning regression asks whether the linear form is adequate, on the same firm-demeaned data. The contribution is fourfold. The relative weight of the two blocks is measured within a single specification; the capitalisation coefficient is shown not to be identified by accounting data of this kind, and the reason for this is diagnosed; the structure of profit determination differs across the regulatory populations the scheme defines; and machine learning is used diagnostically rather than competitively.
These choices distinguish the study from its closest antecedents in four concrete respects. First, where Matias and Serrasqueiro (2017), Dalci (2018), Kalash (2023) and Youssef et al. (2023) estimate the effect of capital structure with cost variables entering as unexamined controls, this study measures financial and operating determinants on a common standardised scale within one equation, so that their relative weight becomes a result rather than an assumption. Second, where Canarella and Miller (2018) and Dsouza et al. (2025) report instrumented estimates of capitalisation as a robustness check, this study shows why such instruments fail when profitability is persistent and reports the full range of estimates rather than a preferred column. Third, where evaluations of the Italian certification scheme such as Manaresi et al. (2021) and Aiello et al. (2024) measure average effects on certified firms, this study shows that the structure through which profitability is determined differs across the regulatory populations themselves. Fourth, where Pap et al. (2022) and Vajjhala and Strang (2024) use machine learning to predict, this study uses it to test the econometric specification, and directly addressing the accounting relation linking profitability to the labour share, which prior work leaves unexamined. Table 1 maps each of these differences to the section of the paper in which it is tested.
Table 1.
From untested assumptions in the literature to tests in this study.
2. Literature Review
Two hundred studies were retrieved from Scopus; three quarters were published after 2021, and most regressed a profitability ratio on a capitalisation or leverage ratio in a national panel of five to ten years. This review is organised around the three questions the paper asks. The first, which block of determinants matters more, requires the literature on capital structure (Section 2.1) to be read against the less copious literature on cost structure (Section 2.2). The second, whether the effect of capital structure can be estimated credibly, draws on the literature on endogeneity and profit persistence, reviewed together because the second aspect explains why the remedies described in the first fail (Section 2.3). The third, whether one linear equation describes all firms, draws on clustering and machine learning applied to accounting data (Section 2.4). Section 2.5 reviews the Italian certification regime in which the three questions are asked, Section 2.6 draws the strands together, and each subsection closes by stating how it leads to the next.
2.1. Capital Structure and Profitability in Small Firms
The studies reviewed in this section are deliberately recent, but they inherit their questions from an older body of work. Whether capital structure affects performance at all is the question Modigliani and Miller (1958) answered in the negative under conditions no small firm satisfies, and departures from those conditions have featured since: taxes and distress costs in the trade-off tradition, information asymmetry in Myers (1984) and Myers and Majluf (1984), agency costs in Jensen and Meckling (1976). The empirical regularities the recent panels reproduce were established by Titman and Wessels (1988), Rajan and Zingales (1995) and, specifically for small firms, Berger and Udell (1998). Profit persistence has an equally settled pedigree in Mueller (1977), Geroski and Jacquemin (1988) and Fama and French (2000), whose mean-reversion estimates anticipate the autoregressive coefficient reported in Section 4.
Whether the way a firm is financed shapes what it earns is among the most heavily worked questions in the empirical literature on small and medium enterprises, and its central result is unusually stable. Matias and Serrasqueiro (2017) establish it for Portugal, Dalci (2018) for Chinese manufacturers, Quoc Trung (2021) for Vietnam, Kalash (2023) for an emerging-market panel, Youssef et al. (2023) for non-financial UK SMEs, and Gonçalves et al. (2024), Bhawna and Sahay (2025) and Nkosi et al. (2026) for further national samples. Consistency of the sign conceals disagreement about why it holds; under pecking-order reasoning, profitable firms accumulate retained earnings and borrow less, so that causality runs from performance to structure, while under trade-off and agency reasoning, leverage disciplines managers. Singh et al. (2025) and Demiraj et al. (2025) report evidence compatible with more than one mechanism, which a single contemporaneous correlation cannot separate. Samples are almost always listed or bank-financed firms, the equity or debt ratio is the focal variable, and cost-structure variables enter as undiscussed controls; so, whether capital structure matters more than the operating model is never asked. Section 2.2 establishes what is known about that.
2.2. Cost Structure and the Operating Model
The operating side of firms enters the corpus through a different door. Grau and Reig (2021) studied operating leverage in European agri-food SMEs, Campisi et al. (2019) and Alhassan and Ohene-Asare (2016) measured efficiency by data envelopment, Chadha et al. (2023) and Tripathi et al. (2024) examined working-capital efficiency in Indian MSMEs, and Bhattu-Babajee and Seetanah (2022) and Prasad and Mondal (2025) relate value added to performance. These are studies of efficiency, not of cost composition; they ask how well inputs are converted into output, not how the cost base is divided between labour, purchased services, materials and leased capacity, which statutory accounts report for every firm and what managers can act on. Of 2827 records retrieved across eighteen queries, only 27 relate labour cost, value added or outsourcing to profitability at firm level, against 447 relating capital structure to it, and no study places the two blocks in one equation. Doing so raises a prior question, whether the coefficient on capital structure can be estimated credibly at all, which Section 2.3 addresses.
2.3. Identification and Profit Persistence
The largest theme in the corpus is methodological in substance if not in title. Forty-six of the two hundred studies address endogeneity explicitly, mostly by instrumenting the focal regressor with its own lags or by moving to system GMM; Canarella and Miller (2018), Vijayakumaran and Vijayakumaran (2019), Samal and Yadav (2025), Dsouza et al. (2025) and Saiz-Sepulveda et al. (2026) are representative. The treatment is uniform. An instrumented column is added to the robustness table and reported as confirming the main result; instrument validity is tested in a minority of cases, and a Hansen or Sargan statistic is almost never allowed to overturn the specification. When the instrumented and fixed-effects estimates disagree, the disagreement is attributed to instrument weakness and the fixed-effects estimate retained, and the alternative reading, that neither identifies the parameter, appears nowhere. Failures are therefore invisible, and the mechanism that would invalidate the instruments here goes unacknowledged: net worth contains the current year’s profit and return on assets is computed on that same profit. Talamas Marcos (2025) and Rastogi and Kumar (2024) are among the few to exploit institutional variation rather than internal lags.
A separate branch of the literature establishes that profitability reverts towards a firm-specific mean at a measurable rate. Hirsch and Hartmann (2014) and Hirsch et al. (2021) document persistence in European food processing and retailing, Jaisinghani (2016) in Indian pharmaceuticals, Opstad et al. (2022) in restaurants, and Doyran and Santamaria (2019), Killins (2020) and Hoang et al. (2026) in banking and insurance. A parallel strand estimates the speed of adjustment towards a target capital structure; relevant studies include those by Y. Yang et al. (2015), Sinha and Vodwal (2022), Choi et al. (2024), Abdeljawad and Farhood (2025) and Al Barakat and Ali (2026). Neither approach connects persistence to identification. If profitability at t is predicted by profitability at t − 2, and the capitalisation ratio at t − 2 embeds the profit of t − 2, lagged capitalisation is correlated with the current error by construction and cannot serve as an instrument. Even an identified coefficient would rest on two further untested assumptions, that one set of coefficients describes every firm and that the relationship is linear; Section 2.4 examines the tools that could test these assumptions.
2.4. Clustering and Machine Learning as Tests of the Specification
Clustering enters the firm-level literature as description. Linares-Mustarós et al. (2018) classified firms by financial performance and distress profile, Juntunen et al. (2022) identified latent classes of accounting outsourcing firms, Ljungkvist and Andersén (2021) and Anton et al. (2021) constructed taxonomies of small manufacturers and of energy start-ups, Kristóf and Virág (2022) and Salina et al. (2020) partitioned sectors and banks on financial indicators, and Williams et al. (2025) and Bayaraa et al. (2019) combined clustering with efficiency analysis. Two limitations recur. Partitions are selected on a single index, usually silhouette, which falls monotonically in the number of clusters and therefore favours coarse solutions by construction. Moreover, the analysis stops at the partition; groups are profiled and named, but the estimating equation is seldom re-estimated inside them. Thus, the reader learns that firms differ without learning whether the pooled coefficients mean anything.
The most established use of machine learning on accounting data is binary classification. Shetty et al. (2022), Gavurova et al. (2022), Papíková and Papík (2024), Cheraghali and Molnár (2026) and Bijoy et al. (2026) predict bankruptcy or distress; Zhang et al. (2025) predict fraud; Ariza-Garzón et al. (2024) and Antar and Tayachi (2025) add explainability tools to the same task. The comparison with a parametric benchmark is almost always made on raw levels, where the learner has between-firm variation available and a fixed-effects estimator does not, so that the reported advantage mostly reflects unmodelled firm heterogeneity rather than functional form; correcting the comparison changes the size of the gap by a factor of nearly three.
A newer strand applies the same algorithms to continuous measures of performance. Pap et al. (2022), Vajjhala and Strang (2024), Garg et al. (2025), Mahmood et al. (2025) and Sultana et al. (2026) model profitability or organisational performance directly, Giudici et al. (2023) compare classification models, and Kristóf and Virág (2022) and Vašaničová et al. (2025) combine supervised and unsupervised methods on financial ratios. These studies rank algorithms and, increasingly, variables, but they do not turn the result back on the econometric specification. The gap between a linear model and an ensemble is reported as a reason to prefer the ensemble, not as a measurement of what the linear form omits, and it is neither decomposed into curvature, interaction and local structure nor located in the distribution. Both assumptions matter most where the population is most heterogeneous, and the Italian certification regime, reviewed in Section 2.5, provides such a population.
2.5. Innovative Start-Ups and Certified Smes
The Italian certification regime has generated its own literature. Manaresi et al. (2021) evaluate the Start-up Act, Migliaccio and Pavone (2021) and Vannoni (2019) examine the capital structure of certified firms, Angilella et al. (2023), Aiello et al. (2024), Anderloni and Harasheh (2025) and Scandurra et al. (2025) compare certified firms with conventional peers, and Domma and Errico (2023), Schifilliti and La Rocca (2024) and Di Berardino and Antenozio (2026) study governance and digital orientation within the population. The dominant design compares average outcomes of certified and non-certified firms and treats the financing constraint as given; it does not ask whether profit is determined differently across the populations, which is what remains comparable once fixed effects absorb average differences. The register also provides a classification the analyst did not construct, a natural external test of any data-driven partition that no study in the corpus uses. Section 2.6 draws the five strands together.
2.6. Synthesis
Read in sequence, the five strands form one argument rather than a list. The capital-structure literature poses the question through only one of its two strands; the cost-structure literature shows how thin the other is; the literature on identification and persistence shows that the aspects that have been studied cannot be estimated credibly with the tools in use; the literature on clustering and machine-learning supplies tools that could test the remaining assumptions of the standard design but have not been used for that purpose; and the certification regime supplies a population in which all three questions can be asked of the same firms. The present study follows that sequence; Section 4 addresses the first two questions, Section 5 and Section 6 the third, and every step is carried out on the certified and conventional populations together.
Table 1 is not a summary of the review. For each strand, it reports what the text does not bring together, including the assumption the literature leaves untested, the test this paper applies to it, the section in which it is applied and the result, so that it serves as a map from the literature to the empirical sections. The full list of the two hundred studies, by theme, is in Supplementary Section S1. Read down the second column, the untested assumptions share a structure; each strand of the literature answers its own question competently and stops where it would have to interrogate its own specification. Samples are narrow, method and question have drifted apart, and the mechanical relation between an accounting ratio and regressors built from the same statements goes unexamined. The present study addresses these boundaries by holding one sample, one equation and one set of variables fixed across three methods.
3. Data and Methodology
The panel was assembled from thirty-one AIDA extractions covering the universe of Italian certified innovative start-ups and innovative SMEs together with a control group of conventional small and medium enterprises drawn from North-West Italy. Each extraction reported 137 harmonised accounting variables replicated over ten financial years; the reference year of each column was reconstructed from the balance-sheet closing date, which was serialised differently across extractions. Regulatory status and sector codes were merged from the business register maintained by the Ministry of Enterprise, matched on fiscal code and added only after the accounting variables were built.
Firms are assigned to the three populations on a legal rather than a statistical basis. Innovative start-ups are companies registered in the special section of the Business Register established by Article 25 of Decree-Law 179/2012, converted into Law 221/2012, the Italian Start-up Act. Registration requires, among other conditions, that the company be an unlisted capital company incorporated for no more than five years, that from its second year, its value of production does not exceed EUR five million, that it has not distributed profits, and that its corporate purpose be the development of innovative, high-technology products or services. It also requires at least one of three innovation criteria: research and development expenditure of at least 15 per cent of the greater of costs or value of production; a workforce of which at least one third hold or are pursuing a doctorate, or at least two thirds hold a master’s degree; or ownership or licence of a patent or of registered software. Innovative SMEs are companies registered in the special section established by Article 4 of Decree-Law 3/2015, converted into Law 33/2015. They must be small or medium enterprises in the sense of Commission Recommendation 2003/361/EC, unlisted, with certified latest financial statements and not registered as innovative start-ups, and they must meet at least two of the same three criteria, with thresholds of 3 per cent for research and development and of one-fifth for doctoral staff or one-third for master’s graduates. Conventional SMEs are companies that satisfy the thresholds of the same Recommendation in AIDA—fewer than 250 employees, sales not exceeding 50 million euros and total assets not exceeding EUR 43 million euros. Those included in this study were located in North-West Italy (NUTS 1 region ITC) and were registered in neither special section. Membership of the two certified populations was established by matching fiscal codes against the registers. Because registration rests on requirements declared by the firm and confirmed annually, the classification records the legal regime to which each firm is subject, not a judgement by the authors on how innovative it is.
The estimating sample comprised 91,756 firm-year observations on 14,913 firms between 2014 and 2025. It was identical across all three methods and all appendices, so that differences between results are attributable to method rather than to sample. See Table 2.
Table 2.
Composition of the estimating sample.
The panel is unbalanced in a way correlated with regulatory status. Start-ups file meaningful accounts in roughly one year in three against more than nine in ten for conventional SMEs; so, conventional SMEs contributed close to two thirds of the observations while accounting for under half the firms. Appendix A establishes how much the weighting scheme matters.
The dependent variable is return on assets. The regressors form two blocks. The financial block comprises the equity ratio, the liquidity ratio, capital turnover and the logarithm of total assets; the operating block comprises the labour cost share of value added, purchased services and materials as proportions of the value of production, and payments for leased assets on the same basis. All continuous variables were winsorised at the first and ninety-ninth percentiles for each year.
The variables are taken directly from the statutory accounts. Return on assets is operating profit as a percentage of total assets. The equity ratio is net worth as a percentage of total assets; the liquidity ratio is current assets net of inventories divided by current liabilities; capital turnover is revenue divided by total assets; size is the natural logarithm of total assets. The first two measure capital structure in the sense defined in Section 1; capital turnover and size are balance-sheet measures of asset use and scale that enter the same block because they share its denominator. The labour share is total personnel costs as a percentage of value added; purchased services, materials and payments for leased assets are each expressed as a percentage of the value of production.
Two measurement decisions determined the sample. Cost ratios expressed against the value of production become uninformative where production approaches zero, so that the sample is confined to observations with positive value of production, positive value added, and value of production of at least one per cent of total assets. The restriction removes 8.8 per cent of observations, but not neutrally: 29.3 per cent of start-up observations against 1.0 per cent of conventional ones, because pre-operating firms are concentrated among the certified. Rescaling the cost ratios on total assets is not an alternative, since return on assets carries assets in its denominator and the rescaled ratios would stand in an accounting identity with it; regressing ROA on the asset-scaled versions yields an R2 of 0.488 against 0.088 for the output-scaled ones.
The estimators and diagnostics are canonical. The choice between fixed and random effects rests on Mundlak (1978) and Hausman (1978), with the variance test described by Breusch and Pagan (1980); the dynamic specification addresses the bias identified by Nickell (1981) using the estimator described by Anderson and Hsiao (1981), generalised by Arellano and Bond (1991) and Blundell and Bond (1998). Overidentification is tested following Hansen (1982), and the first-stage F is read in the light of Bound et al. (1995), Staiger and Stock (1997) and Stock and Yogo (2005), whose warning that a large F reflects sample size as much as instrument strength is directly relevant to Supplementary Section S3. Inference clustered by firm follows Petersen (2009), with the multiway alternative as stated by Cameron et al. (2011).
The clustering algorithms compared in Section 5 are those of MacQueen (1967), Ward (1963), Dempster et al. (1977), Bezdek (1981) and Ester et al. (1996); the validity criteria are those of Caliński and Harabasz (1974), Dunn (1974), Davies and Bouldin (1979) and Rousseeuw (1987), with the stability index as presented by Hubert and Arabie (1985). The learners are those of Breiman (2001) and Friedman (2001), and the interaction statistic used in Section 6 is that of Friedman and Popescu (2008). Two properties stated in these sources are lost in the applied literature; the silhouette coefficient favours coarse partitions by construction, and the first-stage F does not measure instrument strength in the sense that controls bias amplification. All estimations were carried out in Python 3.11.15 (Python Software Foundation, Wilmington, DE, USA), using linearmodels 7.0 for the panel and instrumental-variable estimators, scikit-learn 1.8.0 for clustering and machine-learning regression, and statsmodels 0.15.0, NumPy 2.4.4, pandas 3.0.2 and SciPy 1.17.1.
The equation is then estimated three times by methods that interrogate different assumptions: panel estimation, which tests whether the average association survives the choice of estimator and whether the equity ratio can be instrumented; unsupervised partitioning, which tests whether one coefficient vector describes every firm; and machine-learning regression, which tests the adequacy of the linear form on the same firm-demeaned data the fixed-effects estimator uses. Figure 1 sets out the estimation strategies.
Figure 1.
Estimation strategies. Source: the authors.
4. Panel Estimation
The equation relates return on assets to the four financial and the four operating regressors defined in Section 3. It is estimated by pooled OLS, by the between estimator, by fixed effects with firm dummies and with firm and year dummies, and by random effects, and it is then put through four robustness treatments: weighted least squares under two weighting schemes, fixed effects with every regressor lagged one year, and a dynamic specification in first differences following Anderson and Hsiao (1981). Standard errors are clustered by firm throughout. The five static estimators use all 91,756 observations on 14,913 firms; the lagged and dynamic specifications fall to 76,261 and 64,031 observations. Sample, definitions and winsorisation are held fixed, so that the columns differ only in the estimator.
Which estimator serves as the reference is settled by test rather than by preference, and the three tests that settle it interrogate different nulls (Table 3).
Table 3.
Panel structure tests.
The F statistic asks whether firm effects exist at all, the Breusch–Pagan multiplier whether their variance is non-zero, and the Hausman statistic whether they are correlated with the regressors. Rejecting all three rules out both the pooled and the random-effects model and fixes two-way fixed effects as the reference specification. Table 4 reports this, with the between and the firm-only fixed-effects columns alongside.
Table 4.
Two-way fixed effects. Dependent variable: ROA (%).
Statistical significance is assessed at two levels. For each coefficient, the t-statistic is computed from standard errors clustered by firm, which are robust to heteroskedasticity and to serial correlation within firms, and the stars in Table 4 report the corresponding p-values. For the model as a whole, the null hypothesis that all eight slope coefficients are jointly zero is tested with a Wald statistic built on the same clustered covariance matrix. Its value is at least 344.5 on 8 and 14,912 degrees of freedom in the reference specification, so that the null is rejected at any conventional level, and it is rejected equally clearly in every column of Table 4 and in each of the four cluster-specific equations estimated in Section 5. The panel-structure tests of Table 3 complete the assessment, since they reject the pooled model in favour of firm effects and the random-effects model in favour of fixed effects. With more than ninety thousand observations, however, statistical significance is easily achieved, and this paper does not rest its conclusions on it. Economic significance is judged on the standardised scale of Table 5, and robustness on the stability of the estimates across the specifications of Table 6 and Appendix A.
Table 5.
Effect of a one-standard-deviation increase in each regressor on ROA (percentage points), four estimators.
Table 6.
The coefficient on the equity ratio across all fourteen specifications.
All eight regressors are significant at the one per cent level, and the within R2 of 0.4232 shows that the specification accounts for a substantial share of the variation in profitability inside firms over time. Because the regressors are measured on incompatible scales, however, the coefficients cannot be compared as they stand; read downwards, the column would make turnover appear to dominate by a factor of thirty. Table 5 therefore rescales each coefficient to the effect of a one-standard-deviation increase, in percentage points of ROA, so that the regressors can be compared directly across variables and estimators.
Capital turnover dominates under every estimator and the labour share follows immediately. A one-standard-deviation increase in turnover is worth between 3.69 and 4.04 points of ROA across the four estimators, a comparable increase in the labour share costs between 3.89 and 4.47, and capitalisation is worth between 2.06 and 3.00; purchased services, materials and leased assets contribute between 0.5 and 1.8 points each, and liquidity is negligible. The two blocks therefore contribute at the same order of magnitude, which the unrescaled coefficients of Table 4 conceal, and the ordering is unchanged across estimators. The last column of Table 5 sets the within estimate against the between estimate for each regressor.
That comparison is the diagnostic least often reported in this literature. Regarding the labour share, the two estimates almost coincide, at −4.20 between firms and −3.89 within them, and the natural reading—that a relationship holding both across and within firms is structural—is the wrong one here. An accounting relation holds in both dimensions because it is a property of how the statements are constructed; coincidence is the first trace of the identity examined in Section 7. With regard to size and liquidity, which enter no identity, the two estimates diverge and change sign; so, within-firm asset growth operates differently from being structurally large. Capitalisation is higher within than between, which is what the mechanical component of that coefficient would predict.
That mechanical component is an elementary objection which the literature reporting a positive capitalisation coefficient rarely confronts; net worth contains the current year’s profit, and return on assets is computed on that same profit. The objection is not confined to capitalisation. Four of the eight regressors are ratios of items subtracted from the income statement with regard to the aggregate it is subtracted from, so that the operating block is more exposed than the financial one. Section 7 develops this point in full.
Three treatments separate identity from relationship, and they do not agree with one another. Lagging every regressor by one year reverses the sign, from +0.177 to −0.068, with significance unchanged. Modelling persistence instead, including first differences with ROA(t − 2) instrumenting the lagged difference, in the manner of Anderson and Hsiao, returns the coefficient to positive and larger than the static estimate at +0.228, with an autoregressive parameter of 0.271 and a first-stage F of 18,230. Instrumenting the equity ratio directly, across five instrument sets, produces a negative estimate in every case. Table 6 reports the coefficient under all fourteen specifications, with its standard error and ninety-five per cent confidence interval.
The table is the finding. The five static estimators cluster between +0.12 and +0.18 and the two weighted variants stay within that band; lagging moves the coefficient below zero; the dynamic specification moves it back above every static estimate; each instrumental-variable specification places it between −0.12 and −0.28. These are not overlapping confidence intervals around a common parameter but qualitatively different answers to the same question, and no ranking of the estimators by their own diagnostics resolves the disagreement, because the specifications that reverse the sign are precisely the ones designed to address the identity problem. The sign of the capitalisation coefficient is not identified by these data, and that instability is the result rather than an obstacle to it.
The operating coefficients behave in the opposite way. Across seven of the eight estimators, the labour share ranges only between −0.115 and −0.141, and the ranking of the four operating variables never changes. The contrast is not what it first appears, because return on assets and the labour share are consecutive lines of the same income statement, and an estimator-invariant coefficient is what that construction produces; Section 7 takes up this point. The comparison establishes an asymmetry; the equity ratio is not mechanically determined by the cost base and its sign is nonetheless unidentified, while the labour share is mechanically related to the outcome and stable for that reason.
The instrumental-variable estimates are reported in full in Supplementary Section S3, because they fail on their own terms. All five instrument sets are strong, with first-stage F statistics from 24 to 2327, but strength is not validity. The overidentified specification using the second and third lags rejects the Hansen test with a statistic of 77.18, and with ROA persistent at 0.271, the equity ratio at t − 2 embeds profit at t − 2, which predicts profit at t; so, the exclusion restriction fails by construction at any lag length. The one instrument with a defensible exclusion restriction, net external equity injections, has a within-firm correlation of only 0.103 with the equity ratio, which amplifies any violation of exclusion roughly tenfold. A design based on external policy variation also fails; the step increases in the income-tax deduction for investors in certified firms, from 19 per cent to 30, 50 and 65 per cent between 2017 and 2025 (Supplementary Section S8). The instrument is weak, with a first-stage F of 3.1, and wrongly signed, and an event study around registration as an innovative SME shows a rise of about 1.5 percentage points in the equity ratio but a decline in ROA that begins before registration. Neither design identifies the capitalisation coefficient.
Two further features of the panel bear on how the coefficients should be read. The first is that the weighting scheme determines whose experience the estimates describe, since the panel is unbalanced in a way correlated with regulatory status. Weighting by total assets halves capitalisation to 0.099 while raising capital turnover from 5.29 to 6.89, so that in the firms which carry the aggregate, the operating model matters more and capital structure less (Table A2 and Supplementary Section S2).
The second feature is that a single coefficient vector has been imposed on three populations that the regulation itself treats as distinct. Estimating the equation separately by regime, on the same observations and the same specification, tests that restriction directly, and Table 7 reports the three vectors on the standardised scale of Table 5, together with the Wald tests of their equality.
Table 7.
Coefficients estimated separately by regulatory regime, one-standard-deviation effects on ROA (percentage points).
Wald tests reject equality of the coefficient vectors in all three pairwise comparisons: 87.18 between start-ups and innovative SMEs, 181.94 between start-ups and conventional SMEs, and 138.08 between the two SME categories, each on eight degrees of freedom with p below 10−4. What differs is not the level of profitability, which the fixed effects absorb, but the structure of its determination. Capital turnover carries a coefficient of 7.02 among start-ups and 7.35 among innovative SMEs against 4.17 among conventional SMEs, the labour share weighs most heavily on conventional SMEs at −0.163, and capitalisation is highest among start-ups at 0.232. Section 5 asks whether the partition that matters is the regulatory one or one the data would choose for themselves.
The inference above rests on assumptions about the error term that Appendix Diagnostic Tests: Heteroskedasticity, Cross-Section Dependence and Coefficient Stability tests on the residuals of the reference specification. Heteroskedasticity is present. The modified Wald test of Greene (2018) rejects equal error variances across firms, and the Breusch–Pagan test in the studentised form of Koenker (1981) rejects homoskedasticity with respect to the regressors, χ2(8) = 8103.1. Cross-sectional dependence is present as well. The CD statistic of Pesaran (2021) is 132.9 with firm effects only and 44.9 once year effects are added (Table A5). Standard errors computed with the estimator of Driscoll and Kraay (1998), which is robust to both, are up to five times larger for the labour share, but every coefficient remains significant at the one per cent level, the smallest t-statistic being 4.9 (Table A6).
Stability over time is examined in Table A7, which re-estimates the equation in four three-year sub-periods. Every coefficient keeps its sign in every period, but equality of the full coefficient vector is rejected across the four periods and before and after 2020 (Table A5). The capital-structure coefficient moves within a narrow band from 0.19 to 0.26, and capital turnover rises from 3.5 to 6.3. The labour share remains negative and significant throughout, but its magnitude falls from −0.18 in 2014–2016 to −0.07 in 2023–2025, as the share of young certified firms rises from 0.5 to 30 per cent of observations and value added over total assets falls from 0.39 to 0.34, which the process described in Section 7 translates into a smaller slope. The stability of the labour-share coefficient across estimators and groups is therefore not stability over time, and the claims made for it below are confined to the former.
In comparison with related studies, the positive association between capitalisation and profitability under the five static estimators, between +0.121 and +0.177, reflects that reported for small and medium enterprises by Matias and Serrasqueiro (2017), Quoc Trung (2021), Kalash (2023) and Youssef et al. (2023), and the sign implied by the negative relation between profitability and leverage documented for larger firms by Titman and Wessels (1988) and Rajan and Zingales (1995). The estimates depart from that literature at the point where the latter usually stops. Those studies report a static or a single instrumented estimate; here, the sign reverses under lagging and under every instrument set, which is more consistent with the pecking-order reading of Myers (1984) and Myers and Majluf (1984), in which profits accumulate as equity, than with a causal effect of capitalisation on profitability. Persistence itself is in line with the regularity documented by Mueller (1977), Geroski and Jacquemin (1988), Hirsch and Hartmann (2014) and Hirsch et al. (2021), but its magnitude is lower than for listed firms. Fama and French (2000) estimate that profitability reverts towards its mean at about 38 per cent a year, a persistence of roughly 0.6, against 0.271 here. The heterogeneity across regulatory regimes has no direct counterpart, since evaluations of the Italian scheme such as Manaresi et al. (2021) and Aiello et al. (2024) compare average outcomes, whereas Table 7 shows that the structure of profit determination differs, with capital turnover and size weighing far more among start-ups than among conventional SMEs. Finally, the diagnostic tests described in Appendix Diagnostic Tests: Heteroskedasticity, Cross-Section Dependence and Coefficient Stability support the firm-clustered inference recommended by Petersen (2009) for firm panels and show that the conclusions also survive standard errors robust to cross-sectional dependence.
5. Unsupervised Structure
The panel estimates of Section 4 impose a restriction the data have not been asked to confirm, that a single coefficient vector describes every firm. This restriction can be tested without leaving the equation, by partitioning firms on the equation’s own variables and re-estimating within each partition. The exercise describes coefficient heterogeneity; it establishes no causal effect.
Each firm is summarised by the decade median of the nine variables entering the equation, standardised to zero mean and unit variance, with reference to the same 14,913 firms and 91,756 observations used in Section 4. Regulatory status is withheld from the procedure and used afterwards only as an external check. Thirty-two configurations were evaluated across six algorithm families—k-means, Ward agglomerative, Gaussian mixture and fuzzy c-means for k between two and seven, density-based clustering over five radii, and random-forest proximity clustering for k between two and four—of which twenty-nine returned at least two groups. Each was scored on eleven validity criteria: silhouette, Calinski–Harabasz, Davies–Bouldin, Dunn, maximum diameter, minimum separation, the Pearson gamma, entropy, the Herfindahl–Hirschman index of cluster balance, partition R2 and, where defined, the Bayesian information criterion.
Selecting on any single index is systematically misleading. Silhouette and Calinski–Harabasz fall monotonically in k; so, on either alone, the two-cluster solution always wins, while partition R2 and the Dunn index reward finer partitions; the density-based configurations attain the highest silhouette values only by classifying between four and thirty-three per cent of firms as noise (Supplementary Section S4). Averaging ranks across the nine directional indices selects k-means at k = 4, placed first on partition R2 among the balanced solutions and keeping its smallest group at 14.9 per cent of firms. Fifty bootstrap resamples at eighty per cent give a mean adjusted Rand index of 0.9375, and the coefficient pattern reported below survives the neighbouring three-cluster solution.
The four groups are best read on the standardised scale of Figure 2, where each cell states how far a group’s typical firm lies from the sample mean in standard deviations.
Figure 2.
Cluster profiles, standardised means.
The colours identify the archetypes, and the medians in Table 8 give their magnitudes in the units of the accounts. Cluster 0, a third of all firms, is labour-intensive, with a labour share of 89.6 per cent of value added, the lowest capitalisation in the sample at 17.3 per cent and the lowest median return at 3.03. Cluster 1, twenty-seven per cent, is materials-intensive and the largest in scale. Cluster 2, twenty-four per cent, consists of micro service firms, with purchased services at 57.4 per cent of output and the smallest scale in the sample. Cluster 3, fifteen per cent, is the only group defined financially rather than operationally, with capitalisation of 70.1 per cent, a liquidity ratio of 3.70, the lowest capital turnover and the highest median return at 10.23.
Table 8.
Cluster profiles, medians of the original variables.
Two features of the separation matter more than the labels. Capitalisation and liquidity are extreme in Cluster 3 and virtually identical across the other three groups, where they say almost nothing about eighty-five per cent of firms, whereas the labour share and purchased services take a distinct value in each group and order them. Capital structure characterises an archetype but does not organise the partition. Although profitability played no part in forming the groups, median ROA rises monotonically across them from 3.03 to 10.23. Because regulatory status was withheld from the procedure, its correspondence with the partition, shown in Figure 3, is an external test of both.
Figure 3.
Cluster composition by regulatory regime.
Partition and register correspond strongly without coinciding: χ2(6) = 6821.9 with Cramér’s V of 0.4780. Conventional SMEs concentrate in the two established operating archetypes, 46.0 and 46.9 per cent; innovative start-ups are distributed almost inversely, 53.1 per cent in the micro-service group and 24.2 per cent in the capitalised one, as expected of small, service-oriented, recently equity-funded firms; innovative SMEs are spread across all four groups. The regulatory categories carry real information about the operating model but are not the same partition. The point of the partition is what happens when the equation is re-estimated inside it, with the same specification, estimator and observations (Table 9).
Table 9.
Equation re-estimated within each cluster (selected coefficients).
Pairwise Wald tests reject equality of the coefficient vectors for all six pairs, with statistics between 84.45 and 374.34 on eight degrees of freedom. Rejection at this sample size is not by itself informative, since almost any restriction is rejected on ninety thousand observations; what matters is the magnitude and the pattern of the differences, which Table 10 shows by expressing each within-cluster coefficient as a multiple of the pooled estimate from Table 4.
Table 10.
Within-cluster coefficients as multiples of the pooled two-way fixed-effects coefficient.
The remaining two dimensions are stable for opposite reasons. Liquidity is insignificant in three groups of four, so the pooled estimate is right that it matters nowhere. The labour-share coefficient varies by a factor of only 1.1, between −0.132 and −0.140, and invariance of that kind invites an objection; return on assets and the labour share are consecutive lines of the same income statement, and a constant coefficient may record a construction rather than a relationship. The identity fixes the slope at −VA/A; so, it requires value added over total assets to be nearly constant across the archetypes as well.
However, this is not the case. Value added over assets ranges from 0.217 in the micro-service cluster to 0.602 in the labour-intensive one, a factor of 2.8, against a factor of 1.07 in the coefficient. The invariance survives the test that would have exposed it as arithmetic, on a partition built from the very variables that generate the arithmetic. Of the eight dimensions of the pooled vector, one is faithful because the relationship is common to all groups, one because the variable is inert everywhere, and on the remaining six, the pooled estimate averages quantities that differ by factors of two to four.
The equity-ratio coefficient, which was not determined in Section 4, is positive in every cluster but ranges from 0.102 in the materials-intensive group of larger firms to 0.231 in the labour-intensive group of smaller, thinly capitalised ones, which is the pattern that a financing-constraint reading predicts. It is a pattern rather than an identification, since the identity operates inside each cluster as it does in the pooled sample, but it shows that the pooled coefficient of 0.177 is heterogeneous in magnitude as well as uncertain in sign.
The regulatory partition of Section 4 and the operating partition recovered here are therefore both real, and neither is the other. This section has not asked whether the relationship between each regressor and profitability is linear at all, which Section 6 addresses via the same observations.
In comparison with related studies, the recovery of a small number of stable archetypes from accounting data alone is in line with Linares-Mustarós et al. (2018), Ljungkvist and Andersén (2021), Juntunen et al. (2022) and Kristóf and Virág (2022), who also found that firms group into stable financial and operational types. The present results depart from that literature in two respects. First, the selection protocol shows that the number of groups is not a property of the data alone; because silhouette falls monotonically in the number of clusters, studies that select on that index, the practice discussed in Section 2.4 and followed by Bayaraa et al. (2019) and Salina et al. (2020) among others, obtain coarse partitions partly by construction. Second, those studies describe the groups without re-estimating a model inside them, whereas Table 10 shows that the coefficients of the profitability equation differ across archetypes by factors of two to four, so that a taxonomy is also a test of the specification. The correspondence between archetypes and the register, with a Cramér’s V of 0.478, qualifies the designs by Aiello et al. (2024) and Anderloni and Harasheh (2025), who compared certified firms with conventional peers as distinct populations; certification tracks the operating model, but not closely enough for regulatory status to substitute for it. The within-cluster ordering of the equity coefficient, strongest where capitalisation is scarcest, is consistent with the financing-constraint view of small firms in Berger and Udell (1998), although, as noted above, it is a pattern rather than an identification.
6. Machine-Learning Regression as Validation
The panel specification also assumes that each regressor enters linearly and additively, and testing that assumption requires estimators that impose no functional form. The purpose here is validation rather than prediction: no learner replaces the equation and no coefficient is revised on the strength of a fit. The questions are how large the gap between the linear form and an unrestricted one is, what kind of structure accounts for it, and whether the ordering of variables implied by the panel coefficients survives an independent measure of predictive content.
Thirteen algorithms were fitted to the same 91,756 observations on the same eight regressors, with five-fold cross-validation grouped by firm so that no firm contributed to both the training and the test partition, and compared on out-of-sample R2, its cross-fold standard deviation, root mean squared error, mean absolute error and fitting time (Table S10). Histogram gradient boosting attained the highest accuracy at 0.7978, the lowest errors at 5.932 and 3.476 and a cross-fold standard deviation of 0.0070, among the lowest in the battery, in 3.3 s against 120.5 for the random forest, and it was used for every result that follows. The algorithms fall into three bands: tree ensembles and the neural network above 0.72, k-nearest neighbours and the single decision tree between 0.64 and 0.70, and the whole linear family, including the linear support-vector machine, below 0.48.
Neverthless, this is not the comparison that matters, because it is the comparison most often made incorrectly. The fixed-effects estimator explains variation within firms, after firm means have been removed; a learner fitted to raw levels also has the between-firm variation available to it. Setting a within R2 of 0.42 against a levels R2 of 0.80 therefore attributes to functional form what mostly reflects a different decomposition of the variance. The comparison is made three times instead, under three treatments of the between-firm information, and Table 11 reports the three comparisons.
Table 11.
Like-for-like comparison of linear and non-linear fits.
The first row gives the learner access to differences between firms as well as within them; the second removes firm means, exactly as the fixed-effects estimator does; the third restores the between-firm information to the linear model in the form of firm means, following Mundlak. Comparing the first row with the third isolates unmodelled firm heterogeneity, and comparing the second with either isolates what remains attributable to functional form.
On raw levels, the non-linear model is 1.69 times more accurate. On firm-demeaned data, which is what the fixed-effects estimator uses, the ratio falls to 1.29 and the absolute gap from 0.325 to 0.121: the linear specification recovers 0.415 of within-firm variance against 0.536 attainable. Supplying the linear model with firm means in the manner of Mundlak raises it only from 0.473 to 0.480, which locates the source of the remaining difference. On levels, the learner’s advantage is mostly firm heterogeneity that fixed effects already absorb, and what survives the demeaning is functional form. The honest statement of the gap is therefore 0.121 rather than 0.325, and everything that follows concerns those twelve points of R2.
The next question is what kind of structure they represent, and the first candidate is one the linear model can be given directly. If the missing structure were polynomial, adding squares and interactions to the equation would recover it, at a cost in parameters that can be counted. Table 12 reports how much of the gap each enrichment recovers.
Table 12.
How much of the gap parametric terms recover.
Sixteen terms buy 13.7 per cent of the gap and forty-four buy 20.6, while the full cubic expansion, with one hundred and sixty-four terms, performs worse than the original eight-regressor model because it overfits the tails of a heavy-tailed dependent variable, as its cross-fold standard deviation of 0.189 against 0.013 shows. Roughly four-fifths of what the learner captures is therefore not polynomial, and it is not interaction either. Friedman H-statistics are small throughout, the strongest pair, the equity ratio with capital turnover, reaching 0.042. The linear form omits local structure, including thresholds, saturation, and regions of a variable’s range where it matters against regions where it does not.
Partial dependence makes those shapes explicit. The labour share declines steeply over its lower range and then flattens, capital turnover rises and saturates, purchased services bend only at the upper end, and the equity ratio is close to monotone and mild, consistent with the modest positive fixed-effects coefficient rather than with the negative instrumental-variable estimates. A low-order polynomial must curve everywhere in order to curve anywhere, whereas the surface the learner recovers is flat in some regions and steep in others.
Permutation importance, computed on held-out data, ranks the variables by their contribution to out-of-sample accuracy rather than by coefficient magnitude or significance. The labour share alone accounts for 63.5 per cent of predictive content, capital turnover for 13.3 and purchased services for 9.6; so, the operating block carries roughly ninety per cent of the information, against 6.5 per cent for the equity ratio and 1.1 for liquidity (Supplementary Section S5). The leading entry requires the qualification developed in Section 7; a learner recovers an accounting relation almost perfectly, so that part of the 63.5 per cent measures a construction rather than a behaviour, and the agreement with the panel and clustering results partly reflects shared arithmetic rather than three independent confirmations. Two entries are informative on their own: capital turnover, which enters no identity and ranks second, and the equity ratio, whose low share is a statement about explanatory content because capitalisation is not mechanically tied to the outcome.
The two models differ mainly in the tails. In the bottom decile of demeaned ROA, where the realised mean is −16.5 points, the linear model predicts −7.9, and in the top decile, realised at +16.6, it predicts +6.6; gradient boosting compresses the extremes by a factor of 1.8 against about 2 for the linear model, and in the middle six deciles, both are accurate, with biases below 1.7 points (Table S15). A study that trimmed the tails would find the two specifications nearly equivalent and would be silent about the firms it discarded.
Three conclusions follow for the panel estimates, about interpretation rather than validity. The coefficients of Section 4 are local linear approximations to a mildly curved surface and should be read as average slopes, with the approximation weakest in the extreme deciles. The ranking of variables they imply is corroborated, by a wider margin than the coefficients suggest, by an independent measure of predictive content. The residual gap is not a matter of sample size; the linear model’s test score rises only from 0.4005 to 0.4153 over a twenty-fold increase in training data (Supplementary Section S5); so, what it lacks is form rather than information, and twelve points of R2 set a realistic ceiling for any equation of this kind estimated on these variables.
In comparison with related studies, the accuracy ordering obtained here, with tree ensembles ahead of the linear family, linear support vector regression being weak and AdaBoost appearing unstable, is in line with the comparisons of machine-learning methods on accounting data reported by Shetty et al. (2022), Pap et al. (2022), Gavurova et al. (2022), Giudici et al. (2023) and Papíková and Papík (2024). The results depart from that literature with regard to the size and the meaning of the advantage. On raw levels, the basis of the comparisons in Pap et al. (2022), Vajjhala and Strang (2024) and Mahmood et al. (2025), the learner is 1.69 times as accurate as the linear model; on the firm-demeaned data that a fixed-effects estimator uses, the ratio falls to 1.29 and the gap from 0.325 to 0.121 of R2. Much of the advantage usually attributed to functional form is therefore firm heterogeneity that fixed effects already absorb. The variable-importance results extend the use of explainability tools in Ariza-Garzón et al. (2024) and Antar and Tayachi (2025) from prediction to the validation of an econometric specification. They add a qualification those applications do not need to make; part of the importance assigned to the labour share reflects an accounting relation that any flexible learner reproduces.
7. The Accounting Identity in the Operating Block
The argument of Section 4 against the capitalisation coefficient applies with greater force to the coefficient this paper reports as its main finding, and the objection is best raised here rather than answered defensively later. Net worth contains the current year’s profit, which is why the equity ratio stands in a partly mechanical relationship with return on assets. The labour share of value added stands in a relationship that is mechanical by construction, because the two quantities are consecutive lines of the same income statement (Figure 4).
Figure 4.
Where the regressors sit in the income statement that generates the dependent variable.
Under the Italian civil-code scheme, value added is the value of production less materials, purchased services, leased assets and other operating costs; EBITDA is value added less labour cost; and the operating result is EBITDA less depreciation and provisions. Writing s for the labour share and A for total assets, ROA = (VA/A)(1 − s) − D/A. The derivative of the dependent variable with respect to the regressor is therefore −VA/A exactly, before any estimation. Four of the eight regressors are ratios of items subtracted in that cascade with regard to the aggregate they are subtracted from, so that the operating block as a whole is exposed to the objection, and the labour share especially so.
Two readings advanced earlier must therefore be qualified. An accounting relation produces stability of the labour-share coefficient across estimators, since such a relation does not depend on the estimator, and its 63.5 per cent share of permutation importance measures in part a construction rather than a behaviour. A third reading, the near-invariance of the coefficient across the four clusters at −0.132 to −0.140, looks like the same point in another form, but Section 7.1 shows that it is not; the identity fixes not only the sign of the coefficient but its magnitude, and magnitude can be checked.
7.1. How Much of the Coefficient Is Mechanical
The identity predicts a slope of −VA/A, so the test requires one quantity the estimating equation does not report: the distribution of value added over total assets in the sample itself (Table 13).
Table 13.
Value added over total assets in the estimating sample.
The median is 0.353 and the middle half of the sample lies between 0.211 and 0.604. The identity therefore predicts a coefficient of about −0.355 for the median firm and between −0.21 and −0.60 for the interquartile range. The estimated coefficient is −0.1365.
The estimate is not the identity. It is roughly two-fifths of the magnitude predicted at the median and falls below the first quartile of the predicted range. For the coefficient to be mechanical in full, value added would have to be 13.7 per cent of total assets, and just under fourteen per cent of firm-years are at or below that level, concentrated among start-ups, whose median is 0.213 against 0.394 for conventional SMEs. The identity is unmistakably present in these data, and it over-predicts what is estimated by a factor of between two and three.
Two mechanisms account for the gap. The first is conditioning; the equation includes capital turnover, which absorbs much of the variation in value added over assets, so that the reported coefficient is a partial effect holding scale intensity fixed rather than the unconditional slope the identity describes. The second is the covariance between the labour share and value-added intensity within firms; allowing for this moves the total derivative implied by the identity from −0.355 to −0.375 at the median, and to −0.283 when firms are weighted by the within-firm variance of the labour share that the fixed-effects estimator exploits. Neither adjustment brings the prediction near −0.1365.
A second and independent comparison is already available in the estimates made in Section 4. Lagging every regressor by one year breaks the identity, because the labour share of t − 1 and the profit of t are computed from different statements. What survives the break bounds from below whatever part of the coefficient is not contemporaneous arithmetic.
The labour share retains a quarter of its magnitude at −0.0346 and remains significant at one per cent; leased assets retain 29 per cent, purchased services 8 per cent, and materials become insignificant. For the retained quarter to be mechanical in its turn, value added would have to be 3.5 per cent of total assets, a level reached by 3.2 per cent of firm-years. Lagging also changes the question, however, since it predicts next year’s profit rather than this year’s, so that part of the loss is dynamic rather than arithmetic.
A third comparison uses the partition of Section 5 rather than the time dimension. Because the identity fixes the slope at −VA/A, it predicts a different magnitude for every group of firms whose value-added intensity differs, and the four archetypes differ considerably. Median value added over total assets runs from 0.217 in the micro-service cluster to 0.602 in the labour-intensive one, a factor of 2.8. A mechanical coefficient would have to vary by the same factor, and Table 14 sets the two side by side.
Table 14.
Value added over total assets and the labour-share coefficient, by archetype.
Across the four archetypes the predicted slope ranges by a factor of 2.8 and the estimated coefficient by a factor of 1.07, from −0.132 to −0.140, with confidence intervals that overlap throughout. The ordering is partially preserved; the labour-intensive cluster carries the largest coefficient in absolute value, as the identity requires. However, the amplitude is not preserved, and amplitude is what the identity fixes. The ratio of estimate to prediction falls from 0.62 in the micro-service cluster to 0.23 in the labour-intensive one, so that the attenuation is itself systematic and largest exactly where the mechanical component should be strongest.
This is the decisive comparison, because it holds the identity fixed and varies the quantity the identity says the coefficient must track. A relation that is arithmetic cannot be near-constant across groups whose multiplier differs threefold. Taken together, the three comparisons show that the identity is present in these data and accounts for part of the level of the coefficient, but neither for its stability nor for the whole of its magnitude.
7.2. What the Contribution Becomes
This paper’s claim changes wording rather than value, stated as follows. A large share of the observed variation in return on assets is fixed once the composition of the cost base is known, and part of that share is arithmetic rather than behavioural. This is a measurement the literature reviewed in Section 2 has not reported, and policy has proceeded as though it did not exist. It is sharper for being bounded on both sides; the identity over-predicts the coefficient by a factor of two to three, and a quarter of the association survives the breaking of the identity altogether.
Two of the five tests that would separate identity from relationship remain open, and both require re-estimation on the present sample rather than new data. They are listed for completeness and because the direction each would have to take is already specified (Table 15).
Table 15.
Five tests that separate identity from relationship.
7.3. A Worked Example for Replication
The procedure of Section 7.1 and Section 7.2 can be applied to any coefficient on a ratio whose numerator is subtracted in the cascade that defines the dependent variable, and Appendix B sets it out in eight steps. The identity is written down and differentiated to obtain the slope it implies, here, −VA/A. That slope is evaluated on the distribution of the multiplier in the estimating sample and compared with the estimate, which gives a ratio of 0.39 at the median. The ratio is recomputed after allowing for co-movement between the regressor and the multiplier, which leaves it between 0.36 and 0.48. The identity is then broken by lagging, and a quarter of the coefficient survives. Finally, the coefficient and the multiplier are compared across groups that differ in the multiplier. Across archetypes, the multiplier varies 2.8 times and the coefficient 1.07 times. Table A8 reports each step with the values obtained here, and Table S16 repeats the comparison across the regulatory populations, the archetypes and four sub-periods. The ratio of estimate to identity lies between 0.22 and 0.65 in every case, and in no partition does the coefficient vary in the way the identity would require.
In comparison with related studies, the operating-side studies reviewed in Section 2.2, Campisi et al. (2019), Grau and Reig (2021), Bhattu-Babajee and Seetanah (2022), Chadha et al. (2023) and Tripathi et al. (2024) relate efficiency, cost or value-added measures to profitability without asking whether part of the association is produced by the way the variables are constructed. The results of this section show that it is, and by how much. Identity predicts a slope of −0.355 at the median firm against an estimate of −0.1365; coefficients of this kind are best read as attenuated identities rather than as behavioural effects. The same concern applies, in weaker form, to capital structure, since net worth contains current profit, a feature that the identification strategies reviewed in Section 2.3 rarely address. The two positive findings have no counterpart in the corpus reviewed; a quarter of the labour-share coefficient survives when the identity is broken by lagging, and its stability across archetypes survives a test the identity fails. To our knowledge, these are the first estimates of the non-mechanical component of a cost-share coefficient.
8. Discussion
Three methods applied to one sample are informative where they agree and where they do not. On the operating block, they agree; the labour share carries the largest standardised coefficient after capital turnover, varies by a factor of only 1.1 across the four clusters and accounts for 63.5 per cent of out-of-sample predictive content. Section 7 shows that the accounting identity explains part of the level of that coefficient and none of its stability. The three methods converge on a relationship that is partly arithmetic in magnitude and not arithmetic in its constancy.
On capital structure, the methods disagree, and the disagreement is informative. The static estimates reproduce the positive sign reported by Matias and Serrasqueiro (2017), Dalci (2018), Kalash (2023) and Youssef et al. (2023); lagging the regressors reverses it, the dynamic specification restores it, and every instrument set contradicts both. Because net worth contains the current year’s profit and profitability persists at 0.271, no lag length escapes the problem, which is why the internal instruments used by Vijayakumaran and Vijayakumaran (2019), Dsouza et al. (2025) and Saiz-Sepulveda et al. (2026) fail. The persistence documented by Hirsch and Hartmann (2014) and Hirsch et al. (2021) and the identification practice of the capital-structure literature are, on this evidence, incompatible.
Set side-by-side, the two blocks support a claim that requires no causal interpretation. The equity ratio is not mechanically determined by the cost base, yet its sign is unstable across fourteen specifications; the labour share is mechanically related to profitability, yet its coefficient is more stable than that relation alone would produce. The literature organised around the first variable has chosen the weaker and less reliably signed of the two, while the operating-side studies authored by Campisi et al. (2019), Grau and Reig (2021), Bhattu-Babajee and Seetanah (2022) and Chadha et al. (2023) do not place the two blocks in competition.
The clustering and machine-learning results qualify the panel estimates without overturning them. Capital turnover, which enters no identity, varies by a factor of 4.3 across archetypes, providing the strongest evidence that one coefficient vector does not describe every firm, and the partition is also what makes the identity testable. The 0.536 ceiling on within-firm predictive accuracy is partly an artefact of the same arithmetic, since a learner approaches an accounting relation closely. This use of machine learning for validation rather than replacement is one that the prediction-oriented applications by Pap et al. (2022), Vajjhala and Strang (2024) and Mahmood et al. (2025) do not attempt.
Two implications for practice follow. An unstable coefficient should be reported as unstable rather than resolved by selecting the treatment that preserves the expected sign, and a stable one should be tested against its accounting identity before being read as structure; the corpus reviewed in Section 2 contains no instance of either check. With regard to policy, the certification regimes evaluated by Manaresi et al. (2021) and Scandurra et al. (2025) relieve a financing constraint whose association with profitability cannot be signed on this population, while the cost margin that does carry the association receives no instrument.
With regard to external validity, the finding most likely to generalise beyond the certification regime is the one that might appear most specific to it: the non-identification of the capital-structure coefficient. This rests on two features, neither of which is Italian or regulatory. Under accrual accounting, net worth includes retained profit, so that any equity ratio built from book values embeds past profitability, in every jurisdiction and for every legal form; and profitability persists, as documented for listed firms by Mueller (1977), Geroski and Jacquemin (1988) and Fama and French (2000), and for European unlisted firms by Hirsch and Hartmann (2014) and Hirsch et al. (2021). Wherever it persists, a lagged equity ratio carries past profit into the current error and fails as an instrument, and since persistence among listed firms is, if anything, higher than the 0.271 estimated here, the failure should be at least as severe in the listed and bank-financed samples on which most of the literature rests. Nor does the result depend on the certified firms; conventional SMEs supply almost two thirds of the observations, and the static coefficient on capitalisation has the same sign in all three populations (Table 7).
The present claim has a limitation. It concerns instruments constructed from the firm’s own accounts, not designs that exploit variation external to the firm, such as the institutional changes used by Rastogi and Kumar (2024) and Talamas Marcos (2025), which can identify the coefficient where lagged ratios cannot; the one such source available here, the tax deduction for investors in certified firms, proves too weak to do so (Supplementary Section S8). The diagnosis is also portable. Any study can estimate the persistence of its own outcome and check whether its instruments embed the outcome’s past, and that check, rather than the strength of the first stage, should precede the reporting of an instrumented estimate.
Other findings travel less well. The magnitudes of the operating coefficients reflect Italian institutions: labour-market rules that make personnel costs relatively rigid, a financial system in which small firms depend predominantly on banks, and a control group drawn from North-West Italy. The eligibility rules of Decree Laws 179/2012 and 3/2015 shape the certified populations, so that the operating archetypes and the concentration of start-ups in the micro-service profile partly reflect the arithmetic of eligibility discussed in Section 9. The heterogeneity across regimes is therefore evidence that certification schemes of this type select firms with a distinct structure of profit determination, not an estimate of that structure for innovative firms in general, and applying the same design to comparable European schemes would establish which magnitudes are institutional and which are general.
Comparison with related studies is made at the end of each empirical section and summarised in Table S17. Three points of contact concern magnitudes rather than signs and deserve emphasis. Profitability is less persistent among these unlisted small firms, at 0.271, than among the listed firms studied by Fama and French (2000), which implies that any lagged ratio loses its information about past profit faster here but not fast enough to serve as an instrument. The advantage of machine learning over linear models is smaller by a factor of almost three once the comparison is made on the variance a fixed-effects estimator uses, which qualifies the accuracy gains reported by Pap et al. (2022), Vajjhala and Strang (2024) and Mahmood et al. (2025). The labour-share coefficient is about two-fifths of the magnitude the accounting identity predicts, a benchmark that the operating-side literature has not computed and against which its own estimates can now be read.
9. Policy Implications
Italy’s productive structure is dominated by firms that do not grow, a condition habitually treated as a financing problem and addressed with instruments built accordingly. The evidence assembled here bears on that diagnosis directly, and four implications follow.
The first concerns what certification schemes are for. The Italian Start-up Act, like most European equivalents, presumes that innovative firms are constrained by access to capital and responds with tax relief on equity investment, free access to a public credit guarantee and relief from company-law rules on capital maintenance. Evaluations by Manaresi et al. (2021), Aiello et al. (2024), Anderloni and Harasheh (2025) and Scandurra et al. (2025) establish that these instruments reach their targets and improve financing outcomes. The present results suggest that the constraint they relieve is not the one that binds on profitability. Capitalisation accounts for 6.5 per cent of out-of-sample predictive content and cannot be signed reliably, while the share of value added absorbed by labour accounts for 63.5 per cent. A firm whose cost structure leaves no margin does not become profitable because equity is cheaper.
The second concerns the sixty-month horizon. Certification expires by statute five years after incorporation, which presumes that firms reach a stable operating configuration within that window. The partition described in Section 5 suggests otherwise; 53.1 per cent of certified start-ups sit in a micro-service configuration of small scale and low labour intensity, whose coefficient vector differs significantly from that of established operating firms. Migliaccio and Pavone (2021) and Vannoni (2019) document the same internal heterogeneity from the financial side, and H. T. Tran and Santarelli (2014) and Amoa-Gyarteng and Dhliwayo (2023) report comparable patterns for young firms elsewhere. A fixed horizon applied to a population this heterogeneous withdraws support from firms at very different stages of development.
The third concerns instruments that act on the price of capital. Italian small firms remain predominantly bank-financed, and policy has lowered the cost of equity through fiscal channels. If profitability is determined mainly by operating structure, the price of external capital is not the margin on which the growth decision turns, and Benkraiem (2016), S. Kumar and Rao (2016), Tong and Serrasqueiro (2020) and Garcia-Martinez et al. (2023) reach compatible conclusions from the financing side, finding access effects on investment that do not translate into performance. Capital-cost instruments should therefore be complemented by instruments acting on operating capability, including managerial capacity, workforce composition and the productivity of labour employed. This is the margin that Campisi et al. (2019), Grau and Reig (2021), Chadha et al. (2023) and Tripathi et al. (2024) identify from a different direction.
The fourth concerns eligibility. Certification thresholds on research spending, graduate employment or intellectual property are expressed as ratios to output or to total costs, and ratios of this form are met most easily where the denominator is smallest, so firms with negligible operating activity qualify readily; this is why the restriction imposed in Section 3 removes 29.3 per cent of start-up observations against 1.0 per cent of conventional ones. Thresholds expressed as ratios should be paired with an absolute floor on operating activity, and registers should collect the cost-structure indicators used here, which statutory accounts already report.
A final implication is evaluative. Since a common coefficient vector is rejected across the three regulatory populations, evaluations that estimate only average effects on growth or survival miss that the populations differ in how profit is determined, not only in how much they earn; designs that also test for differences in coefficient structure would recover that information.
10. Limitations
The most consequential limitation is that none of the designs identifies a causal effect. There is no valid exogenous variation in capital structure in these data; firms choose their capitalisation, and certification is voluntary and conditional on criteria correlated with unobserved characteristics. Lagging the regressors, modelling persistence and instrumenting all attenuate simultaneity without removing it, so that the results are conditional associations rather than causal magnitudes, a limitation shared by most of the literature reviewed in Section 2; Talamas Marcos (2025), Rastogi and Kumar (2024) and Camuffo and Poletto (2024) show the alternative of exploiting institutional or experimental variation. The one institutional source available here, the step increases in the tax deduction for investors in certified firms, was tested and did not supply identification (Supplementary Section S8). Credible identification requires firm-level records of equity rounds, with their dates and amounts, or a design that addresses the sixty-month limit on start-up status.
A second limitation concerns sample composition. Innovative start-ups file meaningful accounts in roughly one year in three against more than nine in ten for conventional SMEs, and the restriction imposed to obtain interpretable cost ratios removes a further 29.3 per cent of start-up observations against 1.0 per cent of conventional ones. Both selections remove firms at the pre-operating end of the distribution, so that the estimates describe firms with genuine operating activity and are silent about the population the scheme most distinctively contains. In addition, the conventional SMEs of the control group are drawn from North-West Italy, whereas the certified populations cover the whole country; so, comparisons between regimes are also, in part, comparisons between regions.
Third, sector codes are available for the certified populations but for only a small minority of the control group, so that specifications with sector-by-year effects rest almost entirely on certified firms. Coefficients are stable across those specifications, but the possibility that the operating coefficients partly capture sectoral composition cannot be excluded, a sensitivity shown by Costa et al. (2017) and Yousaf (2025).
Fourth, ratios to the value of production are fragile where production approaches zero, and rescaling on total assets would place them in an accounting identity with the dependent variable. Thus, measurement error is concentrated in the firms of greatest policy interest; sectoral studies such as Grau and Reig (2021) and Prakash and Nauriyal (2020) avoid the problem by aggregating, at the cost of the heterogeneity exploited here.
Fifth, the error term is neither homoskedastic nor independent across firms (Appendix Diagnostic Tests: Heteroskedasticity, Cross-Section Dependence and Coefficient Stability). Driscoll–Kraay standard errors, robust to both departures, are up to five times larger than the firm-clustered ones used throughout, but they leave every coefficient significant at the one per cent level. The diagnostics were computed on the estimating sample rebuilt from the source extractions, which was 0.5 per cent larger than that described in Table 2. These results show that the coefficients, for the labour share in particular, are not constant over time.
Sixth, the unsupervised results are descriptive. The partition shows that firms occupy distinguishable and stable regions of the accounting space, not why, and its selection involves discretion in the weighting of the eleven indices and in the five per cent floor on cluster size, as in the taxonomies of Linares-Mustarós et al. (2018), Juntunen et al. (2022) and Salles-Filho et al. (2023).
Finally, the machine-learning comparison addresses only the variables in the accounts, so that the 0.536 ceiling is a property of the data as much as of the method, and both models are poorly calibrated in the extreme deciles, as Balzano and Magrini (2026) and Cheraghali and Molnár (2026) also found for Italian and Nordic accounting data. The present analysis is confined to one country and one certification regime; whether the dominance of the operating model over capital structure generalises to economies with different size distributions and financing systems is open, and Section 8 discusses which findings are likely to hold beyond this setting.
11. Conclusions
This study asked which of two explanations of small-firm profitability carries more weight: the way a firm is financed, i.e., its capital structure, or the way it operates, i.e., the composition of its costs. Unlike previous studies that estimated the effect of capital structure and treated cost composition as a background control, the present work places both in one equation and measures them on the same scale. The evidence was obtained from 91,756 firm-year observations on 14,913 unlisted Italian firms in three legally defined populations—innovative start-ups and innovative SMEs registered under Decree Laws 179/2012 and 3/2015, and conventional SMEs—and every result was obtained from the same observations by panel econometrics, clustering and machine-learning regression.
The first conclusion is that the operating model matters more than capital structure. A one-standard-deviation increase in the labour share of value added lowered return on assets by about 3.9 percentage points, an effect of the same size as capital turnover and larger than that of capitalisation (Table 5), and the operating block carried about ninety per cent of out-of-sample predictive content against 6.5 per cent for the equity ratio. Part of this association is arithmetic, because return on assets and the labour share are consecutive lines of the same income statement, but this is only part the case. The estimated coefficient is about two-fifths of what the accounting identity predicts, a quarter of it survives when the identity is broken by lagging, and its stability across operating archetypes survives a test the identity fails. That stability is cross-sectional rather than temporal; estimated by sub-period, the coefficient remains negative and significant but falls in magnitude as young certified firms gain weight in the panel.
The second conclusion concerns the variable on which the literature has concentrated. The static association between capitalisation and profitability, between +0.12 and +0.18, reflects previous studies of small and medium enterprises, but it reverses when the regressors are lagged and under every instrument that these data allow. The instruments fail because profitability is persistent, at 0.271 a year, lower than for listed firms but high enough for any lagged ratio to carry past profit into the current error. The sign of the capital-structure effect is therefore not identified by accounting data of this kind, and the pattern is more consistent with profitable firms accumulating equity, as the pecking-order view predicts, than with equity generating profit.
The third conclusion concerns heterogeneity. The three regulatory populations differ in the structure through which profitability is determined, not only in its level, and equality of their coefficient vectors is rejected in every pairwise comparison. A partition built from accounting data alone recovers four operating archetypes that correspond to the regulatory classification without coinciding with it, and within them, the coefficient on capital turnover, which enters no identity, varies by a factor of 4.3. A single coefficient vector, the standard assumption of the literature, does not describe these firms.
Two methodological conclusions follow. Comparisons between machine-learning and econometric models should be made on the variance the econometric estimator uses. On firm-demeaned data, the advantage of the best learner falls from a ratio of 1.69 to 1.29, and most of what remains is local structure that polynomial terms do not capture. The statistical conclusions are robust to the properties of the error term; heteroskedasticity and cross-sectional dependence are both present, but every coefficient of the reference specification remains significant at the one per cent level under standard errors robust to both.
For policy, the results suggest that support schemes for innovative firms, which act mainly on access to finance and on the cost of equity, address a constraint whose association with profitability cannot be signed on this population, while the cost margin that does carry the association receives no instrument. Registers could collect the cost-structure indicators used here, which statutory accounts already report, and evaluations could test for differences in the structure of profit determination as well as in average outcomes.
The study cannot claim causality. There is no valid exogenous variation in capital structure in these data, certification was self-selected, the control group was drawn from North-West Italy, and the estimates describe firms with genuine operating activity. Two continuations follow. The two tests described in Table 15 that remain outstanding require no new data and would more sharply separate arithmetic from behaviour in the cost coefficients; and the statutory expiry of certification after sixty months and the eligibility thresholds offer discontinuities that could support the causal reading this design withholds, whereas the changes in investor tax incentives, tested in Supplementary Section S8, do not. The non-identification of the capital-structure coefficient, by contrast, rests on the construction of the accounts and on the persistence of profitability, and this is likely to hold well beyond the Italian certification regime.
Supplementary Materials
The following supporting information can be downloaded at: https://www.mdpi.com/article/10.3390/jrfm19110840/s1, Table S1: Studies reviewed, by theme; Figure S1: Weighting sensitivity, rescaled to one-standard-deviation effects; Figure S2: Coefficient stability across nine estimators; Table S2: Two-stage least squares with firm and year fixed effects. Coefficient on the equity ratio; Figure S3: Instrument strength and overidentification; Figure S4: The equity coefficient under five instrument sets; Table S3: Assessment of each instrument set against the two requirements; Table S4: Validity battery across algorithms and numbers of clusters; Figure S5: Validity indices across algorithms and number of clusters; Figure S6: Composite ranking of the retained configurations; Table S5: Composite ranking (mean rank across nine directional indices; lower is better); Table S6: Cluster profiles, medians and standardised means; Table S7: Contingency of partition with regulatory status (row percentages); Figure S7: Equation coefficients re-estimated within each cluster; Table S8: Equation re-estimated within each cluster. Dependent variable: ROA (%); Table S9: Pairwise Wald tests of coefficient equality across clusters; Figure S8: Out-of-sample accuracy under three transformations; Figure S9: Parametric enrichment against gradient boosting, firm-demeaned data; Figure S10: Permutation importance, firm-demeaned data; Figure S11: Calibration by decile of realised profitability; Table S10: Algorithm comparison, raw levels; Figure S12: Out-of-sample accuracy by algorithm, and accuracy against fitting time; Figure S13: Learning curves, firm-demeaned data; Table S11: Learning curve values; Figure S14: Interaction strength by pair; Table S12: Friedman H-statistic by pair; Table S13: Permutation importance, firm-demeaned data; Figure S15: Out-of-sample accuracy by subgroup, firm-demeaned data; Table S14: Out-of-sample accuracy by subgroup, firm-demeaned data; Table S15: Prediction bias by decile of realised profitability; Figure S16: The distribution of value added over total assets, and the slope the identity implies; Figure S17: What survives when the identity is broken by lagging; Figure S18: The identity prediction against the estimate, by archetype; Table S16: Robustness of the identity diagnostic across partitions and specifications; Table S17: Results by method and their relation to the existing literature; Table S18: Policy-intensity instrument: statutory investor deduction rate interacted with registration; Figure S19: Equity ratio and ROA around registration as an innovative SME; Table S19: Event-study coefficients around registration as an innovative SME, in percentage points. References cited in the Supplementary Materials: (Abbate et al., 2023; Abdalla et al., 2025; Al-Eitan et al., 2022; Al-Homaidi et al., 2020; Al-Khazaleh et al., 2025; Albaity et al., 2019; Ali, 2026; Aliakbari et al., 2025; Amarhyouz & Azegagh, 2025; Antenozio et al., 2026; Artica et al., 2019; Bai & Harith, 2023; Banna & Alam, 2025; Barlatier et al., 2023; Bednarek et al., 2025; Bolarinwa et al., 2026; Boshnak, 2024; Cantabene & Grassi, 2024; Ceylan, 2021; Charity et al., 2019; Chino, 2016; Coronell et al., 2026; Damira et al., 2022; Das et al., 2022; Davcik & Grigoriou, 2020; Deepak Kumar et al., 2024; Ernesto Martínez Avella & Andrés Hernández Salazar, 2026; Feng et al., 2025; Forradellas et al., 2026; Gao, 2022; Ghasemi & Ab Razak, 2017; Godley et al., 2021; Goh et al., 2018; Gotti et al., 2025; Govindan et al., 2023; Gupta et al., 2025; Gutiérrez-Ponce, 2024; Habib, 2026; Hin et al., 2026; Houssaini & Miloud, 2025; Hussain et al., 2024; Jolly Cyril & Singla, 2020; Jouida, 2018; Kahlen et al., 2024; Kanyepe et al., 2025; Karim et al., 2021; Kayani et al., 2025; Khan et al., 2025; Khayer et al., 2020; Kohtamäki et al., 2024; S. S. Kumar et al., 2024; S. Kumar & Verma, 2025; Lan et al., 2026; Le et al., 2025; Lee & Hallak, 2020; H. Li & Tong, 2023; P. Li et al., 2025; Lou et al., 2025; Mansour et al., 2023; Mantzari et al., 2024; Martínez et al., 2021; Maside-Sanfiz et al., 2024; Meena et al., 2023; Mikram et al., 2025; Minola et al., 2026; Mladenova et al., 2025; Morais Francisco, 2026; Mousa et al., 2025; Nazarova et al., 2021; Neha et al., 2025; Neves et al., 2026; V. C. Nguyen & Huynh, 2023; N. Q. Nguyen & Nguyen, 2026; Novaković et al., 2025; Nyeadi et al., 2018; Pagaddut, 2021; Pant et al., 2026; N. A. Pham & Ngo, 2025; H. S. T. Pham & Nguyen, 2020; Phothong et al., 2026; Phuensane et al., 2026; Rahman & Harun, 2025; Rios-Vazquez & Portela-Maseda, 2026; Risberg et al., 2023; Rodríguez Valencia, 2025; Rokhayati et al., 2019; Sari et al., 2026; Sehgal et al., 2021; Sehgal et al., 2023; Sengar et al., 2026; Shakri et al., 2025; Shchyrba et al., 2026; Shyu, 2013; Sigalas & Gerakoudi, 2025; Sodnomdavaa & Lkhagvadorj, 2026; Somya & Saripalle, 2023; Soni et al., 2023; Spicka et al., 2017; Sultana & Zeya, 2026; Sura & Ventura, 2026; Surjanto & Ariefianto, 2025; Thomä & Bizer, 2013; Tons & Serrasqueiro, 2020; D. L. Tran & Nguyen, 2025; Tran Minh Hung et al., 2026; Vengesai & Kwenda, 2018; Vieira, 2017; Vu Thi & Phung, 2021; Waheed & Bagh, 2025; Wei et al., 2024; Xiao et al., 2025; Xie & Yuan, 2025; Xu & Sam, 2025; Yadav et al., 2022; K. Yang et al., 2023; Youssef et al., 2022; Zhan et al., 2022; Zheng et al., 2016; Zhu et al., 2022.)
Author Contributions
Conceptualization, A.L., M.D.M., V.N., M.G.T. and A.V.P.; methodology, A.L., M.D.M., V.N., M.G.T. and A.V.P.; software, A.L., M.D.M., V.N., M.G.T. and A.V.P.; validation, A.L., M.D.M., V.N., M.G.T. and A.V.P.; formal analysis, A.L., M.D.M., V.N., M.G.T. and A.V.P.; investigation, A.L., M.D.M., V.N., M.G.T. and A.V.P.; resources, A.L., M.D.M., V.N., M.G.T. and A.V.P.; data curation, A.L., M.D.M., V.N., M.G.T. and A.V.P.; writing—original draft preparation, A.L., M.D.M., V.N., M.G.T. and A.V.P.; writing—review and editing, A.L., M.D.M., V.N., M.G.T. and A.V.P.; visualization, A.L., M.D.M., V.N., M.G.T. and A.V.P.; supervision, A.L., M.D.M., V.N., M.G.T. and A.V.P.; project administration, A.L., M.D.M., V.N., M.G.T. and A.V.P.; funding acquisition, A.L., M.D.M., V.N., M.G.T. and A.V.P. All authors have read and agreed to the published version of the manuscript.
Funding
This research was funded by the project “LUtech Campus Ecosystem—LUCE” (Project Code: 22ROJB5), under a subsidized financing scheme of the Puglia Region within the framework of a Program Agreement (Contratto di Programma).
Data Availability Statement
The firm-level financial statement data used in this study were obtained from AIDA (Bureau van Dijk, a Moody’s Analytics company) under a licence and are not publicly available; restrictions apply to their redistribution, and researchers with an AIDA subscription can rebuild the estimating sample following the construction described in Section 3. The registration dates of innovative start-ups and innovative SMEs were obtained from the special sections of the Italian Business Register published by the Ministry of Enterprises and Made in Italy (MIMIT) and InfoCamere, which are publicly available at https://startup.registroimprese.it (extractions of 27 July 2026). The statutory rates of the investor tax deductions are taken from the laws cited in Supplementary Section S8.
Conflicts of Interest
The authors are employed by LUM Enterprise s.r.l. They declare that the research was conducted in the absence of any other commercial or financial relationships that could be construed as a potential conflict of interest.
Appendix A. Panel Estimation, Full Results
Table A1 sets the five estimators side by side. Reading across a row shows how much of each coefficient survives the choice of estimator, and the contrast between the two blocks is the point of the table. The labour share ranges only between −0.137 and −0.147 across all five columns, purchased services between −0.108 and −0.184, and materials between −0.085 and −0.114. The equity ratio ranges from 0.121 to 0.177, and size changes sign between the between and the within columns, from −0.136 to +0.646. The R2 row is not comparable across columns and should not be read as a ranking of fit. The between figure refers to cross-firm variance and the within figures to over-time variance.
Table A1.
Estimator comparison. Dependent variable: ROA (%).
Table A2 collects the four robustness specifications. Columns 1 and 2 differ only in weighting, and the comparison identifies who each estimate is about. Weighting firms equally describes the typical firm, weighting by assets describes the typical capital. Column 3 shows the sign reversal on capitalisation and on size under lagging, while the labour share retains its sign; column 4 shows the recovery once persistence is modelled. The autoregressive coefficient of 0.2710 in column 4 is worth reporting in its own right. Profitability in this population reverts towards its firm-specific mean at roughly twenty-seven per cent per year, which is the same feature that nullifies the internal instruments as described in Supplementary Section S3.
Table A2.
Robustness: weighting, lags, dynamic specification.
Plotted on the common standardised scale, the weighting choice is visibly not a technicality. Figure S1 sets the two weighted estimates against the unweighted reference.
Under asset weights capital turnover gains and capitalisation loses roughly half its magnitude, while the operating cost shares are almost unmoved. A referee asking which weighting is correct is asking the wrong question, since the two answer different questions, and a paper about small-firm performance needs both. Figure S2 generalises the exercise from three specifications to nine, plotting for each regressor the full spread of standardised effects with the reference two-way estimate marked hollow.
The two blocks separate cleanly. Among the financial variables the spread reaches 7.9 points of ROA for size and 5.0 for capitalisation, so the answer one obtains depends materially on the estimator chosen. Among the operating variables, the spread is 3.5 points for the labour share, 2.3 for purchased services and 1.0 for leased assets, and in every case, the whole spread is generated by the single lagged specification; dropping it collapses the labour share to a range of 0.4 points and materials to 0.2. The operating coefficients are therefore stable in a sense the financial coefficients are not, and this is the empirical basis for the reading advanced in Section 7.
The regime-specific estimates below are the input to the Wald tests reported in the text and reported in Table 7. Two patterns stand out beyond the tests themselves. Capital turnover carries a substantially larger coefficient among the two certified populations than among conventional SMEs, consistent with turnover being the binding margin for firms that have not reached scale. Liquidity is insignificant or marginal in all three populations, which is worth stating explicitly because it is frequently included in this literature as a control and rarely reported as inert.
Table A3.
Separate estimation by regulatory regime. Two-way fixed effects.
The Wald statistics test equality of the full eight-element coefficient vector between each pair of populations, with variance equal to the sum of the two clustered covariance matrices. They are reported separately from Table A3 because a reader who inspects the three columns and sees overlapping standard errors on individual coefficients may conclude that the vectors are indistinguishable, which the joint test contradicts.
Table A4.
Wald tests of coefficient equality between regulatory regimes.
Diagnostic Tests: Heteroskedasticity, Cross-Section Dependence and Coefficient Stability
The inference reported in Section 4 rests on assumptions about the error term that are tested here. All tests are computed on the residuals of the two-way fixed-effects specification of Table 4. Table A5 reports tests for heteroskedasticity, for cross-sectional dependence and for the stability of the coefficients over time.
Table A5.
Diagnostic tests on the two-way fixed-effects residuals.
Heteroskedasticity and cross-sectional dependence affect the standard errors rather than the point estimates. Table A6 therefore sets the firm-clustered standard errors used throughout the paper against two alternatives: heteroskedasticity-robust standard errors, and the Driscoll–Kraay estimator, which is robust to heteroskedasticity, serial correlation and cross-sectional dependence together.
Table A6.
Standard errors under alternative covariance estimators. Dependent variable: ROA (%).
The stability tests of Table A5 are unpacked in Table A7, which re-estimates the equation in four three-year sub-periods and tests, for each regressor separately, whether its coefficient is the same in all four.
Table A7.
Coefficient stability across four sub-periods. Dependent variable: ROA (%).
Appendix B. The Identity Diagnostic: Worked Example
This appendix sets out the diagnostic of Section 7 as a procedure that can be applied to other samples and to other ratios. Table A8 lists the steps in order, with the quantity to compute at each step, how to compute it, the value obtained in this paper and how to read it. Table S16 then applies the central comparison, the ratio of the estimated coefficient to the slope the identity implies, to every partition and specification in this paper, to show how far the conclusion depends on the choice made in the main text.
Table A8.
Worked example: separating arithmetic from structural stability in the labour-share coefficient.
References
- Abbate, S., Centobelli, P., & Cerchione, R. (2023). The digital and sustainable transition of the agri-food sector. Technological Forecasting and Social Change, 187, 122222. [Google Scholar] [CrossRef] [Scilit]
- Abdalla, Y. A., Ahmed, I. E., & Jafeel, A. Y. (2025). Family businesses in the GCC: What drives their capital structure? Borsa Istanbul Review, 25(6), 1128–1136. [Google Scholar] [CrossRef] [Scilit]
- Abdeljawad, I., & Farhood, H. (2025). The trade-off behavior of capital structure in firms within politically unstable emerging countries. Management & Sustainability: An Arab Review, 1–22. [Google Scholar] [CrossRef] [Scilit]
- Aiello, F., Errico, L., & Rondinella, S. (2024). Innovative SMEs in Italy. Explaining profitability patterns in inner areas. Journal of Economic Studies, 51(9), 306–322. [Google Scholar] [CrossRef] [Scilit]
- Albaity, M., Mallek, R. S., & Noman, A. H. M. (2019). Competition and bank stability in the MENA region: The moderating effect of Islamic versus conventional banks. Emerging Markets Review, 38, 310–325. [Google Scholar] [CrossRef] [Scilit]
- Al Barakat, I. Q. M., & Ali, A. (2026). Speed of adjustment to target leverage among airlines in developing countries: The role of accrual quality. Management and Accounting Review, 25(1), 210–229. [Google Scholar] [CrossRef] [Scilit]
- Al-Eitan, G. N., Al-Own, B., & Bani-Khalid, T. (2022). Financial inclusion indicators affect profitability of Jordanian commercial banks: Panel data analysis. Economies, 10(2), 38. [Google Scholar] [CrossRef] [Scilit]
- Alhassan, A. L., & Ohene-Asare, K. (2016). Competition and bank efficiency in emerging markets: Empirical evidence from Ghana. African Journal of Economic and Management Studies, 7(2), 268–288. [Google Scholar] [CrossRef] [Scilit]
- Al-Homaidi, E. A., Tabash, M. I., Al-Ahdal, W. M., Farhan, N. H. S., & Khan, S. H. (2020). The liquidity of indian firms: Empirical evidence of 2154 firms. Journal of Asian Finance, Economics and Business, 7(1), 19–27. [Google Scholar] [CrossRef] [Scilit]
- Ali, G. M. (2026). Enhancing project financial performance prediction: An explainable machine learning framework integrating frontier efficiency and super learner. Journal of Project Management (Canada), 11(1), 151–168. [Google Scholar] [CrossRef] [Scilit]
- Aliakbari, A., Crick, J. M., Chen, W. F., & Crick, D. (2025). Unpacking the relationship between entrepreneurial marketing activities and small firm performance. International Journal of Entrepreneurial Behaviour and Research, 31(4), 999–1018. [Google Scholar] [CrossRef] [Scilit]
- Al-Khazaleh, S., Badwan, N., Qubbaj, I., & Almashaqbeh, M. (2025). Level of financial disclosures for listed insurance companies using ISO 31000: Empirical evidence from Jordan and Palestine. Asian Review of Accounting, 33(2), 386–407. [Google Scholar] [CrossRef] [Scilit]
- Amarhyouz, A., & Azegagh, J. (2025). Financial performance of Moroccan listed companies: A multidimensional analysis of internal, macroeconomic, and institutional determinants using dynamic panel data. Qubahan Academic Journal, 5(2), 402–419. [Google Scholar] [CrossRef] [Scilit]
- Amoa-Gyarteng, K., & Dhliwayo, S. (2023). Capital structure, profitability, and short-term solvency of nascent SMEs in Ghana: An empirical study. Journal of Entrepreneurship, Management and Innovation, 19(4), 83–110. [Google Scholar] [CrossRef] [Scilit]
- Anderloni, L., & Harasheh, M. (2025). Innovative startups and their traditional peers: Further evidence using performance and survival analysis. Review of Financial Economics, 43(3), 317–335. [Google Scholar] [CrossRef] [Scilit]
- Anderson, T. W., & Hsiao, C. (1981). Estimation of dynamic models with error components. Journal of the American Statistical Association, 76(375), 598–606. [Google Scholar] [CrossRef]
- Angilella, S., Mazzù, S., & Pappalardo, M. R. (2023). Corporate governance’s characteristics and financial performance in the innovative SMEs. In Governance and financial performance: Current trends and perspectives (pp. 3–31). WSPC. [Google Scholar] [CrossRef] [Scilit]
- Antar, M., & Tayachi, T. (2025). Partial dependence analysis of financial ratios in predicting company defaults: Random forest vs XGBoost models. Digital Finance, 7(4), 997–1012. [Google Scholar] [CrossRef] [Scilit]
- Antenozio, L., Marques, P., & Bikfalvi, A. (2026). Digital orientation and performance in innovative SMEs: Exploring the (curvi)linear effects. Technovation, 151, 103478. [Google Scholar] [CrossRef] [Scilit]
- Anton, E., Oesterreich, T. D., Schuir, J., Protz, L., & Teuteberg, F. (2021). A business model taxonomy for start-ups in the electric power industry-the electrifying effect of artificial intelligence on business model innovation. International Journal of Innovation and Technology Management, 18(3), 2150004. [Google Scholar] [CrossRef] [Scilit]
- Arellano, M., & Bond, S. (1991). Some tests of specification for panel data: Monte Carlo evidence and an application to employment equations. The Review of Economic Studies, 58(2), 277–297. [Google Scholar] [CrossRef] [Scilit]
- Ariza-Garzón, M. J., Arroyo, J., Segovia-Vargas, M. J., & Caparrini, A. (2024). Profit-sensitive machine learning classification with explanations in credit risk: The case of small businesses in peer-to-peer lending. Electronic Commerce Research and Applications, 67, 101428. [Google Scholar] [CrossRef] [Scilit]
- Artica, R. P., Brufman, L., & Saguí, N. (2019). Why do Latin American firms hold so much more cash than they used to? Revista Contabilidade e Financas, 30(79), 73–90. [Google Scholar] [CrossRef] [Scilit]
- Bai, M., & Harith, S. (2023). Measuring SMEs risk—Evidence from Malaysia. SN Business and Economics, 3(7), 126. [Google Scholar] [CrossRef] [Scilit]
- Balzano, M., & Magrini, A. (2026). No easy way out: Dissecting firm heterogeneity to enhance default risk prediction. Sinergie, 43(3), 161–183. [Google Scholar] [CrossRef] [Scilit]
- Banna, H., & Alam, A. (2025). The value of AI on entrepreneurship: Evidence from the European Union. International Journal of Entrepreneurial Behaviour and Research, 1–28. [Google Scholar] [CrossRef] [Scilit]
- Barlatier, P. J., Josserand, E., Hohberger, J., & Mention, A. L. (2023). Configurations of social media-enabled strategies for open innovation, firm performance, and their barriers to adoption. Journal of Product Innovation Management, 40(1), 30–57. [Google Scholar] [CrossRef] [Scilit]
- Bayaraa, B., Tarnoczi, T., & Fenyves, V. (2019). Measuring performance by integrating k-medoids with dea: Mongolian case. Journal of Business Economics and Management, 20(6), 1238–1257. [Google Scholar] [CrossRef] [Scilit]
- Bednarek, M., Luściński, S., Jabłoński, M., & Schaffeld Graniffo, G. J. (2025). Harnessing Industry 4.0 technologies: A novel predictive maintenance method for advanced production systems. Management and Production Engineering Review, 16(1), 1–13. [Google Scholar] [CrossRef] [Scilit]
- Benkraiem, R. (2016). Small business access to bank leverage under crisis circumstances. International Journal of Entrepreneurship and Small Business, 29(3), 390–397. [Google Scholar] [CrossRef] [Scilit]
- Berger, A. N., & Udell, G. F. (1998). The economics of small business finance: The roles of private equity and debt markets in the financial growth cycle. Journal of Banking & Finance, 22(6–8), 613–673. [Google Scholar] [CrossRef] [Scilit]
- Bezdek, J. C. (1981). Pattern recognition with fuzzy objective function algorithms. Plenum Press. [Google Scholar]
- Bhattu-Babajee, R., & Seetanah, B. (2022). Value-added intellectual capital and financial performance: Evidence from Mauritian companies. Journal of Accounting in Emerging Economies, 12(3), 486–506. [Google Scholar] [CrossRef] [Scilit]
- Bhawna, & Sahay, N. (2025). Impact of financing on the firm’s performance: An evidence from Indian small and medium enterprises (SMEs). International Journal of System Assurance Engineering and Management. [Google Scholar] [CrossRef] [Scilit]
- Bijoy, K., Sehgal, S., & Jaiswal, A. (2026). Differential predictors of financial distress in listed versus unlisted Indian firms: A machine learning approach. Journal of Corporate Finance Research, 20(2), 5–18. [Google Scholar] [CrossRef] [Scilit]
- Blundell, R., & Bond, S. (1998). Initial conditions and moment restrictions in dynamic panel data models. Journal of Econometrics, 87(1), 115–143. [Google Scholar] [CrossRef] [Scilit]
- Bolarinwa, S. T., Onyekwelu, U. L., Ojiakor, I., Orga, J. I., Nwakaego, D. A., & Ekwutosi, O. C. (2026). Leverage and firm performance: Threshold evidence from the role of firm size. Global Business Review, 27(3), 559–576. [Google Scholar] [CrossRef] [Scilit]
- Boshnak, H. A. (2024). Ownership concentration, managerial ownership, and firm performance in Saudi listed firms. International Journal of Disclosure and Governance, 21(3), 462–475. [Google Scholar] [CrossRef] [Scilit]
- Bound, J., Jaeger, D. A., & Baker, R. M. (1995). Problems with instrumental variables estimation when the correlation between the instruments and the endogenous explanatory variable is weak. Journal of the American Statistical Association, 90(430), 443–450. [Google Scholar] [CrossRef] [Scilit]
- Breiman, L. (2001). Random forests. Machine Learning, 45(1), 5–32. [Google Scholar] [CrossRef] [Scilit]
- Breusch, T. S., & Pagan, A. R. (1980). The Lagrange multiplier test and its applications to model specification in econometrics. The Review of Economic Studies, 47(1), 239–253. [Google Scholar] [CrossRef] [Scilit]
- Caliński, T., & Harabasz, J. (1974). A dendrite method for cluster analysis. Communications in Statistics, 3(1), 1–27. [Google Scholar] [CrossRef] [Scilit]
- Cameron, A. C., Gelbach, J. B., & Miller, D. L. (2011). Robust inference with multiway clustering. Journal of Business & Economic Statistics, 29(2), 238–249. [Google Scholar] [CrossRef] [Scilit]
- Campisi, D., Mancuso, P., Mastrodonato, S. L., & Morea, D. (2019). Efficiency assessment of knowledge intensive business services industry in Italy: Data envelopment analysis (DEA) and financial ratio analysis. Measuring Business Excellence, 23(4), 484–495. [Google Scholar] [CrossRef] [Scilit]
- Camuffo, A., & Poletto, A. (2024). Enterprise-wide lean management systems: A test of the abnormal profitability hypothesis. International Journal of Operations and Production Management, 44(2), 483–514. [Google Scholar] [CrossRef] [Scilit]
- Canarella, G., & Miller, S. M. (2018). The determinants of growth in the U.S. information and communication technology (ICT) industry: A firm-level analysis. Economic Modelling, 70, 259–271. [Google Scholar] [CrossRef] [Scilit]
- Cantabene, C., & Grassi, I. (2024). Firm performance and R&D cooperation: What matters? Economics of Innovation and New Technology, 33(1), 142–165. [Google Scholar] [CrossRef] [Scilit]
- Ceylan, I. E. (2021). The impact of firm-specific and macroeconomic factors on financial distress risk: A case study from Turkey. Universal Journal of Accounting and Finance, 9(3), 506–517. [Google Scholar] [CrossRef] [Scilit]
- Chadha, S., Tripathi, D. K., & Tripathi, A. (2023). What determines the efficiency of working capital among Rajasthan MSMEs? Indian Journal of Finance, 17(6), 45–62. [Google Scholar] [CrossRef] [Scilit]
- Charity, E., Austin, O. C., Orji, O. C., Steve, E. E., & Okechukwu, A. J. (2019). Capital structure determinants and performance of startup firms in developing economies: A conceptual review. Academy of Entrepreneurship Journal, 25(3), 1–9. [Google Scholar]
- Cheraghali, H., & Molnár, P. (2026). Predictors of financial distress: Differences between financial and non-financial small and medium-sized enterprises. Research in International Business and Finance, 84, 103334. [Google Scholar] [CrossRef] [Scilit]
- Chino, A. (2016). Do labor unions affect firm payout policy?: Operating leverage and rent extraction effects. Journal of Corporate Finance, 41, 156–178. [Google Scholar] [CrossRef] [Scilit]
- Choi, S. B., Sauka, K., & Lee, M. (2024). Dynamic capital structure adjustment: An integrated analysis of firm-specific and macroeconomic factors in Korean firms. International Journal of Financial Studies, 12(1), 26. [Google Scholar] [CrossRef] [Scilit]
- Coronell, L. H. P., Herrera, T. J. F., Africano, G. N., De-La-Hoz-Franco, E., Escorcia-Gutierrez, J., & Crissien Borrero, T. J. (2026). Unsupervised machine learning for financial behavior profiling of tourism firms in Barranquilla, Colombia. Journal of Risk and Financial Management, 19(4), 281. [Google Scholar] [CrossRef] [Scilit]
- Costa, S., Pappalardo, C., & Vicarelli, C. (2017). Internationalization choices and Italian firm performance during the crisis. Small Business Economics, 48(3), 753–769. [Google Scholar] [CrossRef] [Scilit]
- Dalci, I. (2018). Impact of financial leverage on profitability of listed manufacturing firms in China. Pacific Accounting Review, 30(4), 410–432. [Google Scholar] [CrossRef] [Scilit]
- Damira, A., Narimanovna, J. G., Lyazzat, Y., Rustamov, B., Faizulayev, A., & Bekun, F. V. (2022). Competition determinants of Eurasian economic union oil and gas companies. International Journal of Energy Economics and Policy, 12(2), 336–341. [Google Scholar] [CrossRef] [Scilit]
- Das, N. C., Chowdhury, M. A. F., & Islam, M. N. (2022). The heterogeneous impact of leverage on firm performance: Empirical evidence from Bangladesh. South Asian Journal of Business Studies, 11(2), 235–252. [Google Scholar] [CrossRef] [Scilit]
- Davcik, N., & Grigoriou, N. (2020). How an unequal intra-firm resources distribution affect market share. Marketing Intelligence and Planning, 38(2), 167–180. [Google Scholar] [CrossRef] [Scilit]
- Davies, D. L., & Bouldin, D. W. (1979). A cluster separation measure. IEEE Transactions on Pattern Analysis and Machine Intelligence, PAMI-1(2), 224–227. [Google Scholar] [CrossRef] [Scilit]
- Deepak Kumar, K., Senthil Pandi, S., Monisha, T. V., & Nikesh, K. (2024, March 15–16). Optimizing inventory using ensemble learning algorithms in manufacturing environment [Conference session]. 2024 International Conference on Recent Innovation in Smart and Sustainable Technology, ICRISST 2024, Bengaluru, India. [Google Scholar] [CrossRef] [Scilit]
- Demiraj, R., Labadze, L., Dsouza, S., Demiraj, E., & Grigolia, M. (2025). The quest for an optimal capital structure: An empirical analysis of European firms using GMM regression analysis. EuroMed Journal of Business, 20(2), 529–551. [Google Scholar] [CrossRef] [Scilit]
- Dempster, A. P., Laird, N. M., & Rubin, D. B. (1977). Maximum likelihood from incomplete data via the EM algorithm. Journal of the Royal Statistical Society: Series B, 39(1), 1–38. [Google Scholar] [CrossRef] [Scilit]
- Di Berardino, D., & Antenozio, L. (2026). Driving financial performance in innovative SMEs: Does gender matter? Management Research Review, 49(13), 1–26. [Google Scholar] [CrossRef] [Scilit]
- Domma, F., & Errico, L. (2023). The impact of social media adoption on innovative SMEs’ performance. International Review of Applied Economics, 37(3), 324–356. [Google Scholar] [CrossRef] [Scilit]
- Doyran, M. A., & Santamaria, Z. R. (2019). A comparative analysis of banking institutions: Examining quiet life. Managerial Finance, 45(6), 726–743. [Google Scholar] [CrossRef] [Scilit]
- Driscoll, J. C., & Kraay, A. C. (1998). Consistent covariance matrix estimation with spatially dependent panel data. The Review of Economics and Statistics, 80(4), 549–560. [Google Scholar] [CrossRef] [Scilit]
- Dsouza, S., Kathavarayan, K., Mathias, F., Bhatia, D., & AlKhawaja, A. (2025). Leveraging success: The hidden peak in debt and firm performance. Econometrics, 13(2), 23. [Google Scholar] [CrossRef] [Scilit]
- Dunn, J. C. (1974). Well-separated clusters and optimal fuzzy partitions. Journal of Cybernetics, 4(1), 95–104. [Google Scholar] [CrossRef] [Scilit]
- Ernesto Martínez Avella, M., & Andrés Hernández Salazar, G. (2026). Legal persons in cooperative governance: Financial effects on cooperatives in Colombia [Personas jurídicas en el gobierno cooperativo: Efectos sobre las finanzas de las cooperativas en Colombia]. CIRIEC-Espana Revista de Economia Publica, Social y Cooperativa, (116), 307–338. [Google Scholar] [CrossRef] [Scilit]
- Ester, M., Kriegel, H.-P., Sander, J., & Xu, X. (1996). A density-based algorithm for discovering clusters in large spatial databases with noise. In Proceedings of the second international conference on knowledge discovery and data mining (pp. 226–231). AAAI Press. [Google Scholar]
- Fama, E. F., & French, K. R. (2000). Forecasting profitability and earnings. The Journal of Business, 73(2), 161–175. [Google Scholar] [CrossRef] [Scilit] [PubMed]
- Feng, Y., Wang, Z., Chen, Y., & Zhao, H. (2025). LLM agent driven online auction mechanism for agricultural products. Kybernetes, 1–21. [Google Scholar] [CrossRef] [Scilit]
- Forradellas, R. R., Cabrera, D. S., Garay Gallastegui, L. M., & Náñez Alonso, S. L. (2026). Characterization of S&P 500 companies by sector using artificial intelligence: Statistical evidence and machine learning application. Journal of Finance and Data Science, 12, 100193. [Google Scholar] [CrossRef] [Scilit]
- Friedman, J. H. (2001). Greedy function approximation: A gradient boosting machine. The Annals of Statistics, 29(5), 1189–1232. [Google Scholar] [CrossRef] [Scilit]
- Friedman, J. H., & Popescu, B. E. (2008). Predictive learning via rule ensembles. The Annals of Applied Statistics, 2(3), 916–954. [Google Scholar] [CrossRef] [Scilit]
- Gao, B. (2022). The use of machine learning combined with data mining technology in financial risk prevention. Computational Economics, 59(4), 1385–1405. [Google Scholar] [CrossRef] [Scilit]
- Garcia-Martinez, L. J., Kraus, S., Breier, M., & Kallmuenzer, A. (2023). Untangling the relationship between small and medium-sized enterprises and growth: A review of extant literature. International Entrepreneurship and Management Journal, 19(2), 455–479. [Google Scholar] [CrossRef] [Scilit]
- Garg, V., Gabaldon, J., Niranjan, S., & Hawkins, T. G. (2025). Impact of strategic performance measures on performance: The role of artificial intelligence and machine learning. Transportation Research Part E: Logistics and Transportation Review, 198, 104073. [Google Scholar] [CrossRef] [Scilit]
- Gavurova, B., Jencova, S., Bacik, R., Miskufova, M., & Letkovsky, S. (2022). Artificial intelligence in predicting the bankruptcy of non-financial corporations. Oeconomia Copernicana, 13(4), 1215–1251. [Google Scholar] [CrossRef] [Scilit]
- Geroski, P. A., & Jacquemin, A. (1988). The persistence of profits: A European comparison. The Economic Journal, 98(391), 375–389. [Google Scholar] [CrossRef] [Scilit]
- Ghasemi, M., & Ab Razak, N. H. (2017). Determinants of profitability in ACE market Bursa Malaysia: Evidence from panel models. International Journal of Economics and Management, 11(3), 847–869. [Google Scholar]
- Giudici, P., Gramegna, A., & Raffinetti, E. (2023). Machine learning classification model comparison. Socio-Economic Planning Sciences, 87, 101560. [Google Scholar] [CrossRef] [Scilit]
- Godley, A., Morawetz, N., & Soga, L. (2021). The complementarity perspective to the entrepreneurial ecosystem taxonomy. Small Business Economics, 56(2), 723–738. [Google Scholar] [CrossRef] [Scilit]
- Goh, C. F., Tai, W. Y., Rasli, A., Tan, O. K., & Zakuan, N. (2018). The determinants of capital structure: Evidence from Malaysian companies. International Journal of Supply Chain Management, 7(3), 225–230. [Google Scholar]
- Gonçalves, M. P., Reis, P. M. N., & Pinto, A. P. (2024). Bank market power, firm performance, financing costs and capital structure. International Journal of Financial Studies, 12(1), 7. [Google Scholar] [CrossRef] [Scilit]
- Gotti, G., Morrone, C., & Ferri, S. (2025). Innovative smes: The role of intellectual capital and board size in shaping financial performance. Piccola Impresa, 2025(2), 171–191. [Google Scholar] [CrossRef]
- Govindan, K., Karaman, A. S., Uyar, A., & Kilic, M. (2023). Board structure and financial performance in the logistics sector: Do contingencies matter? Transportation Research Part E: Logistics and Transportation Review, 176, 103187. [Google Scholar] [CrossRef] [Scilit]
- Grau, A., & Reig, A. (2021). Operating leverage and profitability of SMEs: Agri-food industry in Europe. Small Business Economics, 57(1), 221–242. [Google Scholar] [CrossRef] [Scilit]
- Greene, W. H. (2018). Econometric analysis (8th ed.). Pearson. [Google Scholar]
- Gupta, N., Puri, J., & Setia, G. (2025). Profit efficiency estimation and prediction of banks with mixed structure: A unified DDF-based network DEA and ML approach. Operational Research, 25(3), 63. [Google Scholar] [CrossRef] [Scilit]
- Gutiérrez-Ponce, H. (2024). Determinants of corporate leverage and sustainability of small and medium-sized enterprises: The case of commercial companies in Ecuador. Business Strategy and the Environment, 33(8), 8319–8331. [Google Scholar] [CrossRef] [Scilit]
- Habib, F. A. B. (2026). Exploring the impact of capital structure on non-banking financial institution (NBFI) profitability: Evidence from Bangladesh. SN Business and Economics, 6(2), 58. [Google Scholar] [CrossRef] [Scilit]
- Hansen, L. P. (1982). Large sample properties of generalized method of moments estimators. Econometrica, 50(4), 1029–1054. [Google Scholar] [CrossRef] [Scilit]
- Hausman, J. A. (1978). Specification tests in econometrics. Econometrica, 46(6), 1251–1271. [Google Scholar] [CrossRef] [Scilit]
- Hin, K., Hor, B., & Lim, S. (2026). The Effect of IFRS 9 Implementation on Credit Risk in Commercial Banks in Cambodia. Journal of Risk and Financial Management, 19(6), 420. [Google Scholar] [CrossRef] [Scilit]
- Hirsch, S., & Hartmann, M. (2014). Persistence of firm-level profitability in the European dairy processing industry. Agricultural Economics (United Kingdom), 45(S1), 53–63. [Google Scholar] [CrossRef] [Scilit]
- Hirsch, S., Lanter, D., & Finger, R. (2021). Profitability and profit persistence in EU food retailing: Differences between top competitors and fringe firms. Agribusiness, 37(2), 235–263. [Google Scholar] [CrossRef] [Scilit]
- Hoang, K., Tran, S., & Nguyen, D. (2026). Does market structure affect the sensitivity of bank profitability to the business cycle? Studies in Economics and Finance, 1–27. [Google Scholar] [CrossRef] [Scilit]
- Houssaini, I. S., & Miloud, D. (2025). AI-driven customer segmentation for enhanced loyalty programs. In Lecture notes in information systems and organisation (81 LNISO, pp. 209–221). Springer. [Google Scholar] [CrossRef] [Scilit]
- Hubert, L., & Arabie, P. (1985). Comparing partitions. Journal of Classification, 2(1), 193–218. [Google Scholar] [CrossRef] [Scilit]
- Hussain, S., Ali, R., Abdul Latiff, A. R., Fahlevi, M., Aljuaid, M., & Saniuk, S. (2024). Moderating effects of net export and exchange rate on profitability of firms: A two-step system generalized method of moments approach. Cogent Economics and Finance, 12(1), 2302638. [Google Scholar] [CrossRef] [Scilit]
- Jaisinghani, D. (2016). Impact of R&D on profitability in the pharma sector: An empirical study from India. Journal of Asia Business Studies, 10(2), 194–210. [Google Scholar] [CrossRef] [Scilit]
- Jensen, M. C., & Meckling, W. H. (1976). Theory of the firm: Managerial behavior, agency costs and ownership structure. Journal of Financial Economics, 3(4), 305–360. [Google Scholar] [CrossRef] [Scilit]
- Jolly Cyril, E., & Singla, H. K. (2020). Comparative analysis of profitability of real estate, industrial construction and infrastructure firms: Evidence from India. Journal of Financial Management of Property and Construction, 25(2), 273–291. [Google Scholar] [CrossRef] [Scilit]
- Jouida, S. (2018). Diversification, capital structure and profitability: A panel VAR approach. Research in International Business and Finance, 45, 243–256. [Google Scholar] [CrossRef] [Scilit]
- Juntunen, J., Lepistö, S., & Juntunen, M. (2022). Latent classes of accounting outsourcing firms. Journal of Global Operations and Strategic Sourcing, 15(1), 115–141. [Google Scholar] [CrossRef] [Scilit]
- Kahlen, M., Schroer, K., Ketter, W., & Gupta, A. (2024). Smart markets for real-time allocation of multiproduct resources: The case of shared electric vehicles. Information Systems Research, 35(2), 871–889. [Google Scholar] [CrossRef] [Scilit]
- Kalash, I. (2023). The financial leverage–financial performance relationship in the emerging market of Turkey: The role of financial distress risk and currency crisis. EuroMed Journal of Business, 18(1), 1–20. [Google Scholar] [CrossRef] [Scilit]
- Kanyepe, J., Musasa, T., & Wilbert, M. (2025). Supply chain risk factors, technological capabilities, and firm performance of small to medium enterprises (SMEs). Journal of Small Business Strategy, 35(1), 115–128. [Google Scholar] [CrossRef] [Scilit]
- Karim, S., Rabbani, M. R., & Khan, M. A. (2021). Determining the key factors of corporate leverage in malaysian service sector firms using dynamic modeling. Journal of Economic Cooperation and Development, 42(3), 213–238. [Google Scholar]
- Kayani, U., Dsouza, S., Husain, Z., Nawaz, F., & Hasan, F. (2025). Does the performance of financial technology (fintech) firms matter: Evidence from North American and European fintech firms. Cogent Economics and Finance, 13(1), 2451050. [Google Scholar] [CrossRef] [Scilit]
- Khan, R. U., Javed, U., & Ahmad, M. A. (2025). The nexus between socioemotional wealth, entrepreneurial bricolage, and family-owned SME’s international performance, firm type as moderator, analysis through multi-group. Journal of Open Innovation: Technology, Market, and Complexity, 11(4), 100668. [Google Scholar] [CrossRef] [Scilit]
- Khayer, A., Talukder, M. S., Bao, Y., & Hossain, M. N. (2020). Cloud computing adoption and its impact on SMEs’ performance for cloud supported operations: A dual-stage analytical approach. Technology in Society, 60, 101225. [Google Scholar] [CrossRef] [Scilit]
- Killins, R. N. (2020). Firm-specific, industry-specific and macroeconomic factors of life insurers’ profitability: Evidence from Canada. North American Journal of Economics and Finance, 51, 101068. [Google Scholar] [CrossRef] [Scilit]
- Koenker, R. (1981). A note on studentizing a test for heteroscedasticity. Journal of Econometrics, 17(1), 107–112. [Google Scholar] [CrossRef] [Scilit]
- Kohtamäki, M., Bhandari, K. R., Rabetino, R., & Ranta, M. (2024). Sustainable servitization in product manufacturing companies: The relationship between firm’s sustainability emphasis and profitability and the moderating role of servitization. Technovation, 129, 102907. [Google Scholar] [CrossRef] [Scilit]
- Kristóf, T., & Virág, M. (2022). What drives financial competitiveness of industrial sectors in Visegrad Four countries? Evidence by use of machine learning techniques. Journal of Competitiveness, 14(4), 117–136. [Google Scholar] [CrossRef] [Scilit]
- Kumar, S., & Rao, P. (2016). Financing patterns of SMEs in India during 2006 to 2013—An empirical analysis. Journal of Small Business and Entrepreneurship, 28(2), 97–131. [Google Scholar] [CrossRef] [Scilit]
- Kumar, S., & Verma, A. (2025). Evaluating the financial performance of payment banks in India since COVID-19 pandemic: Using the GMM and dynamic OLS approach. Millennial Asia. [Google Scholar] [CrossRef] [Scilit]
- Kumar, S. S., Sawarni, K. S., Roy, S., & G, N. (2024). Influence of working capital efficiency on firm’s composite financial performance: Evidence from India. International Journal of Productivity and Performance Management, 73(9), 2787–2806. [Google Scholar] [CrossRef] [Scilit]
- Lan, T. T., Ha, H. T. B., Nguyet, N. A., & Hai, T. (2026). The impact of capital structure, operational efficiency, and non-interest income on bank profitability in Vietnam. Archives for Technical Sciences, 2026(35), 763–778. [Google Scholar] [CrossRef] [Scilit]
- Le, H. A., Nguyen, T. T., & Tran, T. T. (2025). Factors affecting business performance of non-life insurance companies: Empirical evidence from Vietnam. Global Business and Finance Review, 30(12), 88–103. [Google Scholar] [CrossRef] [Scilit]
- Lee, C., & Hallak, R. (2020). Investigating the effects of offline and online social capital on tourism SME performance: A mixed-methods study of New Zealand entrepreneurs. Tourism Management, 80, 104128. [Google Scholar] [CrossRef] [Scilit]
- Li, H., & Tong, X. (2023). When does a female leadership advantage exist? Evidence from SOEs in China. Corporate Governance: An International Review, 31(6), 945–970. [Google Scholar] [CrossRef] [Scilit]
- Li, P., Guo, X., Wang, F., & Zhang, Q. (2025). Digital transformation and corporate innovation boundaries: Role of supply chain concentration and transparency. International Review of Financial Analysis, 98, 103922. [Google Scholar] [CrossRef] [Scilit]
- Linares-Mustarós, S., Coenders, G., & Vives-Mestres, M. (2018). Financial performance and distress profiles. From classification according to financial ratios to compositional classification. Advances in Accounting, 40, 1–10. [Google Scholar] [CrossRef] [Scilit]
- Ljungkvist, T., & Andersén, J. (2021). A taxonomy of ecopreneurship in small manufacturing firms: A multidimensional cluster analysis. Business Strategy and the Environment, 30(2), 1374–1388. [Google Scholar] [CrossRef] [Scilit]
- Lou, Y., Zhu, Q., & Liang, C. (2025). Financial technology and firm operational resilience: The roles of supply chain resilience and marketing capability. International Review of Economics and Finance, 104, 104744. [Google Scholar] [CrossRef] [Scilit]
- MacQueen, J. (1967). Some methods for classification and analysis of multivariate observations. In Proceedings of the fifth berkeley symposium on mathematical statistics and probability (Vol. 1, pp. 281–297). University of California Press. [Google Scholar]
- Mahmood, F., Ahmed, Z., Hussain, N., & Ben-Zaied, Y. (2025). Working capital financing and firm performance: A machine learning approach. Review of Quantitative Finance and Accounting, 65(1), 71–106. [Google Scholar] [CrossRef] [Scilit]
- Manaresi, F., Menon, C., & Santoleri, P. (2021). Supporting innovative entrepreneurship: An evaluation of the Italian “Start-up Act”. Industrial and Corporate Change, 30(6), 1591–1614. [Google Scholar] [CrossRef] [Scilit]
- Mansour, M., Al Zobi, M. K., Al-Naimi, A., & Daoud, L. (2023). The connection between capital structure and performance: Does firm size matter? Investment Management and Financial Innovations, 20(1), 195–206. [Google Scholar] [CrossRef] [Scilit]
- Mantzari, E., Merika, A., & Sigalas, C. (2024). Determinants and effects of trade credit financing: Evidence from the maritime shipping industry. European Financial Management, 30(3), 1385–1421. [Google Scholar] [CrossRef] [Scilit]
- Martínez, M. R., Ibáñez, P. C., & Campillo, J. P. (2021). La predicción del fracaso empresarial de las cooperativas españolas. Aplicación del algoritmo extreme gradient boosting. CIRIEC-Espana Revista de Economia Publica, Social y Cooperativa, 101, 255–288. [Google Scholar] [CrossRef] [Scilit]
- Maside-Sanfiz, J. M., López-Penabad, M. C., Iglesias-Casal, A., & Torrelles Manent, J. (2024). Determinants of the profitability of sheltered workshops: Efficiency and effects of the COVID-19 crisis. Humanities and Social Sciences Communications, 11(1), 936. [Google Scholar] [CrossRef] [Scilit]
- Matias, F., & Serrasqueiro, Z. (2017). Are there reliable determinant factors of capital structure decisions? Empirical study of SMEs in different regions of Portugal. Research in International Business and Finance, 40, 19–33. [Google Scholar] [CrossRef] [Scilit]
- Meena, A., Dhir, S., & Sushil, S. (2023). A review of coopetition and future research agenda. Journal of Business and Industrial Marketing, 38(1), 118–136. [Google Scholar] [CrossRef] [Scilit]
- Migliaccio, G., & Pavone, P. (2021). Innovative small start-ups in Italy: A successful business model? International Journal of Management and Enterprise Development, 20(4), 405–455. [Google Scholar] [CrossRef] [Scilit]
- Mikram, M., Moujahdi, C., & Rhanoui, M. (2025). Deep learning and machine learning approaches for data-driven risk management and decision support in precision agriculture. International Journal of Sustainable Agricultural Management and Informatics, 11(2), 226–247. [Google Scholar] [CrossRef] [Scilit]
- Minola, T., Sieger, P., Baù, M., Campopiano, G., De Massis, A., & Chirico, F. (2026). When does financial slack matter? Family ownership, CEO family status, and SME performance. Family Business Review, 39(2), 149–172. [Google Scholar] [CrossRef] [Scilit]
- Mladenova, I., Vladimirov, Z., & Harizanova, O. (2025). Digital transformation, organisational capabilities, and SME performance—Size matters. Eastern Journal of European Studies, 16(1), 216–238. [Google Scholar] [CrossRef] [Scilit]
- Modigliani, F., & Miller, M. H. (1958). The cost of capital, corporation finance and the theory of investment. The American Economic Review, 48(3), 261–297. [Google Scholar]
- Morais Francisco, P. (2026). Institutional ownership, free float, and systematic risk. Applied Economics, 1–20. [Google Scholar] [CrossRef] [Scilit]
- Mousa, R., Nabil, J., Safty, A., Hassan, I., & Ibrahim, Y. (2025). Liquidity–credit risk dynamics and bank profitability: Hybrid econometric and machine learning evidence from MENA. Journal of Financial Reporting and Accounting, 1–27. [Google Scholar] [CrossRef] [Scilit]
- Mueller, D. C. (1977). The persistence of profits above the norm. Economica, 44(176), 369–380. [Google Scholar] [CrossRef] [Scilit] [PubMed]
- Mundlak, Y. (1978). On the pooling of time series and cross section data. Econometrica, 46(1), 69–85. [Google Scholar] [CrossRef] [Scilit]
- Myers, S. C. (1984). The capital structure puzzle. The Journal of Finance, 39(3), 574–592. [Google Scholar] [CrossRef] [Scilit]
- Myers, S. C., & Majluf, N. S. (1984). Corporate financing and investment decisions when firms have information that investors do not have. Journal of Financial Economics, 13(2), 187–221. [Google Scholar] [CrossRef] [Scilit]
- Nazarova, K., Bezverkhyi, K., Hordopolov, V., Melnyk, T., & Poddubna, N. (2021). Risk analysis of companies’ activities on the basis of non-financial and financial statements. Agricultural and Resource Economics, 7(4), 180–199. [Google Scholar] [CrossRef] [Scilit]
- Neha, D., Ameesha, M., Dheeraj, M., & Sangeeta, K. (2025). Optimizing telecom operations with segmentation and churn prediction. In 3rd international conference on intelligent data communication technologies and internet of things, IDCIoT 2025 (pp. 185–191). IEEE. [Google Scholar] [CrossRef] [Scilit]
- Neves, M. E., Carvalho, V., Dias, A. G., Guedes, R., & Serrasqueiro, Z. (2026). Benchmarking strategic trade-offs: Financial and sustainability performance in the Portuguese metal wholesale sector. Benchmarking, 1–24. [Google Scholar] [CrossRef] [Scilit]
- Nguyen, N. Q., & Nguyen, T. D. (2026). Financial leverage and firm performance: Empirical evidence from vietnam’s listed real estate companies [Dźwignia finansowa a wyniki firm: Dane empiryczne z wietnamskich spółek nieruchomościowych notowanych na giełdzie]. Polish Journal of Management Studies, 33(1), 179–197. [Google Scholar]
- Nguyen, V. C., & Huynh, T. N. T. (2023). Characteristics of the board of directors and corporate financial performance—Empirical evidence. Economies, 11(2), 53. [Google Scholar] [CrossRef] [Scilit]
- Nickell, S. (1981). Biases in dynamic models with fixed effects. Econometrica, 49(6), 1417–1426. [Google Scholar] [CrossRef] [Scilit]
- Nkosi, S. N., Simo-Kengne, B. D., & Bonga-Bonga, L. (2026). A comparative analysis of capital structure and firm performance: Financial versus non-financial firms in South Africa. African Finance Journal, 28(1), 15–31. [Google Scholar]
- Novaković, D., Novaković, T., Milić, D., Tomaš Simin, M., Nikolić, S., Knežević, M., Radišić, M., Radišić, M., & Pevac, D. (2025). Circular economy and resource efficiency in the Serbian agri-food sector: Evidence from dynamic panel Analysis. Economies, 13(12), 346. [Google Scholar] [CrossRef] [Scilit]
- Nyeadi, J. D., Sare, Y. A., & Aawaar, G. (2018). Determinants of working capital requirement in listed firms: Empirical evidence using a dynamic system GMM. Cogent Economics and Finance, 6(1), 1–14. [Google Scholar] [CrossRef] [Scilit]
- Opstad, L., Idsø, J., & Valenta, R. (2022). The dynamics of the profitability and growth of restaurants; The case of Norway. Economies, 10(2), 53. [Google Scholar] [CrossRef] [Scilit]
- Pagaddut, J. G. (2021). The financial factors affecting the financial performance of philippine msmes. Universal Journal of Accounting and Finance, 9(6), 1524–1532. [Google Scholar] [CrossRef] [Scilit]
- Pant, P., Yadav, R., & Dadsena, K. (2026). Benchmarking working capital risk and operational efficiency: Evidence from manufacturing industry. Benchmarking, 1–30. [Google Scholar] [CrossRef] [Scilit]
- Pap, J., Mako, C., Illessy, M., Kis, N., & Mosavi, A. (2022). Modeling organizational performance with machine learning. Journal of Open Innovation: Technology, Market, and Complexity, 8(4), 177. [Google Scholar] [CrossRef] [Scilit]
- Papíková, L., & Papík, M. (2024). Application of intellectual capital in SME bankruptcy. Applied Economics, 56(55), 7317–7338. [Google Scholar] [CrossRef] [Scilit]
- Pesaran, M. H. (2021). General diagnostic tests for cross-sectional dependence in panels. Empirical Economics, 60(1), 13–50. [Google Scholar] [CrossRef] [Scilit]
- Petersen, M. A. (2009). Estimating standard errors in finance panel data sets: Comparing approaches. The Review of Financial Studies, 22(1), 435–480. [Google Scholar] [CrossRef] [Scilit]
- Pham, H. S. T., & Nguyen, D. T. (2020). The effects of corporate governance mechanisms on the financial leverage–profitability relation: Evidence from Vietnam. Management Research Review, 43(4), 387–409. [Google Scholar] [CrossRef] [Scilit]
- Pham, N. A., & Ngo, T. Q. (2025). Foreign currency debt financing and firm profitability: Evidence from an emerging market. Asian Economic and Financial Review, 15(3), 331–344. [Google Scholar] [CrossRef] [Scilit]
- Phothong, L., Sukprasert, A., Boonlua, S., Chubsuwan, P., Seetha, N., & Kunsrison, R. (2026). An explainable voting ensemble framework for early-warning forecasting of corporate financial distress. Forecasting, 8(1), 10. [Google Scholar] [CrossRef] [Scilit]
- Phuensane, P., Boonpong, N., & Apichottanakul, A. (2026). Financial and entrepreneurial capability configurations: An exploratory study of the selective international integration among Thai SMEs. Journal of Risk and Financial Management, 19(7), 518. [Google Scholar] [CrossRef] [Scilit]
- Prakash, J. V., & Nauriyal, D. K. (2020). Automotive components industry and profitability factors: Evidence from India. Vision, 25(2), 209–223. [Google Scholar] [CrossRef] [Scilit]
- Prasad, R., & Mondal, A. (2025). Determinants of SMEs’ financial performance in an emerging economy: An econometric view. SN Business and Economics, 5(9), 122. [Google Scholar] [CrossRef] [Scilit]
- Quoc Trung, N. K. (2021). Determinants of small and medium-sized enterprises performance: The evidence from Vietnam. Cogent Business and Management, 8(1), 1984626. [Google Scholar] [CrossRef] [Scilit]
- Rahman, N., & Harun, Y. (2025). Interest rate reforms and firm performance in Bangladesh’s manufacturing sector. Asian Economic and Financial Review, 15(11), 1714–1730. [Google Scholar] [CrossRef] [Scilit]
- Rajan, R. G., & Zingales, L. (1995). What do we know about capital structure? Some evidence from international data. The Journal of Finance, 50(5), 1421–1460. [Google Scholar] [CrossRef] [Scilit]
- Rastogi, N., & Kumar, S. (2024). Does bankruptcy law affect the relation between leverage and firm performance? Indian Growth and Development Review, 17(1), 63–85. [Google Scholar] [CrossRef] [Scilit]
- Rios-Vazquez, S., & Portela-Maseda, M. (2026). Structural determinants of working capital management in fintech firms: Evidence from a fixed-effects panel analysis. International Review of Economics and Finance, 110, 105586. [Google Scholar] [CrossRef] [Scilit]
- Risberg, A., Jafari, H., & Sandberg, E. (2023). A configurational approach to last mile logistics practices and omni-channel firm characteristics for competitive advantage: A fuzzy-set qualitative comparative analysis. International Journal of Physical Distribution and Logistics Management, 53(11), 53–70. [Google Scholar] [CrossRef] [Scilit]
- Rodríguez Valencia, L. (2025). Financial performance and corporate governance on firm value: Evidence from Spain. International Journal of Financial Studies, 13(3), 123. [Google Scholar] [CrossRef] [Scilit]
- Rokhayati, I., Pramuka, B. A., & Sudarto. (2019). Optimal financial leverage determinants for smes capital structure decision making: Empirical evidence from Indonesia. International Journal of Scientific and Technology Research, 8(11), 1155–1161. [Google Scholar]
- Rousseeuw, P. J. (1987). Silhouettes: A graphical aid to the interpretation and validation of cluster analysis. Journal of Computational and Applied Mathematics, 20, 53–65. [Google Scholar] [CrossRef] [Scilit]
- Saiz-Sepulveda, Moreno-Adalid, A. M., Rodríguez-Iglesias, I. M., & Estrada-López, H. E. (2026). High-quality capital and financial performance: A dynamic panel analysis of Spanish systemic banks after Basel III. Journal of Risk Finance, 27(4), 541–570. [Google Scholar] [CrossRef] [Scilit]
- Salina, A. P., Zhang, X., & Hassan, O. A. G. (2020). An assessment of the financial soundness of the Kazakh banks. Asian Journal of Accounting Research, 6(1), 23–37. [Google Scholar] [CrossRef] [Scilit]
- Salles-Filho, S., Fischer, B., Juk, Y., Feitosa, P., & Colugnati, F. A. B. (2023). Acknowledging diversity in knowledge-intensive entrepreneurship: Assessing the Brazilian small business innovation research. Journal of Technology Transfer, 48(4), 1446–1465. [Google Scholar] [CrossRef] [Scilit]
- Samal, D., & Yadav, I. S. (2025). Agency conflicts, corporate ownership and capital structure decisions of Indian firms: Evidence from new governance laws. Journal of Accounting Literature. [Google Scholar] [CrossRef] [Scilit]
- Sari, M., Netti Siska, N., Nizar, N., Roslan, A., & Quadratov, I. (2026). Why very low leverage varies across ASEAN: A dynamic panel perspective. Daengku, 6(2), 286–303. [Google Scholar] [CrossRef] [Scilit]
- Scandurra, G., Thomas, A., & Appolloni, A. (2025). Supporting the diffusion of innovative SMEs: The Italian experience. International Journal of Entrepreneurship and Small Business, 55(4), 439–463. [Google Scholar] [CrossRef] [Scilit]
- Schifilliti, V., & La Rocca, E. T. (2024). Board gender diversity in innovative SMEs: An investigation across industrial sectors. European Journal of Innovation Management, 27(9), 461–486. [Google Scholar] [CrossRef] [Scilit]
- Sehgal, S., Mishra, R. K., Deisting, F., & Vashisht, R. (2021). On the determinants and prediction of corporate financial distress in India. Managerial Finance, 47(10), 1428–1447. [Google Scholar] [CrossRef] [Scilit]
- Sehgal, S., Vasishth, V., & Agrawal, T. J. (2023). Bond rating determinants and modeling: Evidence from India. Managerial Finance, 49(3), 529–554. [Google Scholar] [CrossRef] [Scilit]
- Sengar, P., Tiwary, D., & Bose, A. (2026). Impact of public listing on the profitability of emerging market SME: Counterfactual evidence from India. Journal of Economic Studies, 1–17. [Google Scholar] [CrossRef] [Scilit]
- Shakri, I. H., Yong, J., & Xiang, E. (2025). Does capital structure mediate the relationship between corporate governance compliance and firm performance? Empirical evidence from Pakistan. Journal of Asia Business Studies, 19(2), 408–428. [Google Scholar] [CrossRef] [Scilit]
- Shchyrba, I., Khmeliuk, A., Budko, O., Bobyl, V., & Salo, Y. (2026). Internal control system as a factor of reliability in management reporting under conditions of economic turbulence. Journal of Applied Economic Sciences, 21(2), 565–578. [Google Scholar] [CrossRef] [Scilit] [PubMed]
- Shetty, S., Musa, M., & Brédart, X. (2022). Bankruptcy prediction using machine learning techniques. Journal of Risk and Financial Management, 15(1), 35. [Google Scholar] [CrossRef] [Scilit]
- Shyu, J. (2013). Ownership structure, capital structure, and performance of group affiliation: Evidence from Taiwanese group-affiliated firms. Managerial Finance, 39(4), 404–420. [Google Scholar] [CrossRef] [Scilit]
- Sigalas, C., & Gerakoudi, K. (2025). Idiosyncratic factors that shape shareholder reward policies in capital intensive companies. European Journal of Finance, 31(6), 725–748. [Google Scholar] [CrossRef] [Scilit]
- Singh, K., Pillai, D., & Rastogi, S. (2025). Pecking order theory of capital structure: Empirical evidence for listed SMEs in India. Vision, 29(1), 35–47. [Google Scholar] [CrossRef] [Scilit]
- Sinha, P., & Vodwal, S. (2022). Impact of size and earnings on speed of partial adjustment to target leverage: A study of Indian companies using two-step system GMM. International Journal of System Assurance Engineering and Management, 13(2), 957–977. [Google Scholar] [CrossRef] [Scilit]
- Sodnomdavaa, T., & Lkhagvadorj, G. (2026). Financial statement fraud detection through an integrated machine learning and explainable AI framework. Journal of Risk and Financial Management, 19(1), 13. [Google Scholar] [CrossRef] [Scilit]
- Somya, S., & Saripalle, M. (2023). The Determinants of firm’s growth in the telecommunication services industry: Empirical evidence from India. Journal of Quantitative Economics, 21(1), 193–211. [Google Scholar] [CrossRef] [Scilit]
- Soni, T. K., Singh, A., & Kaushal, V. (2023). Capital investments and firm characteristics: The moderating role of economic policy uncertainty in the hospitality sector. International Journal of Hospitality Management, 114, 103562. [Google Scholar] [CrossRef] [Scilit]
- Spicka, J., Naglova, Z., & Gurtler, M. (2017). Effects of the investment support in the Czech meat processing industry. Agricultural Economics (Czech Republic), 63(8), 356–369. [Google Scholar] [CrossRef] [Scilit]
- Staiger, D., & Stock, J. H. (1997). Instrumental variables regression with weak instruments. Econometrica, 65(3), 557–586. [Google Scholar] [CrossRef] [Scilit]
- Stock, J. H., & Yogo, M. (2005). Testing for weak instruments in linear IV regression. In D. W. K. Andrews, & J. H. Stock (Eds.), Identification and inference for econometric models (pp. 80–108). Cambridge University Press. [Google Scholar]
- Sultana, N., & Zeya, F. (2026). Innovation trade-offs and profitability in knowledge firms. Journal of the Knowledge Economy, 17(3), 8702–8731. [Google Scholar] [CrossRef] [Scilit]
- Sultana, N., Zeya, F., Islam, K. M. Z., & Rodriguez, A. J. (2026). The role of total assets in financial performance: Evaluating econometrics and machine learning approaches. Journal of Corporate Accounting and Finance, 37(1), 204–215. [Google Scholar] [CrossRef] [Scilit]
- Sura, A., & Ventura, E. D. (2026). Digitalisation and performance of public companies: A panel analysis with machine learning and causal methods [Digitalizzazione e performance delle aziende pubbliche: Un’analisi panel con machine learning e metodi causali]. Azienda Pubblica, 39(2), 465–488. [Google Scholar] [CrossRef]
- Surjanto, V., & Ariefianto, M. D. (2025). Rent-seeking in sugar industry: Evidence from financial accounting data. Research on World Agricultural Economy, 6(2), 211–224. [Google Scholar] [CrossRef] [Scilit]
- Talamas Marcos, M. (2025). Surviving competition: Neighbourhood shops versus convenience chains. Review of Economic Studies, 92(1), 553–585. [Google Scholar] [CrossRef] [Scilit]
- Thomä, J., & Bizer, K. (2013). To protect or not to protect? Modes of appropriability in the small enterprise sector. Research Policy, 42(1), 35–49. [Google Scholar] [CrossRef] [Scilit]
- Titman, S., & Wessels, R. (1988). The determinants of capital structure choice. The Journal of Finance, 43(1), 1–19. [Google Scholar] [CrossRef] [Scilit]
- Tong, Y., & Serrasqueiro, Z. (2020). A study on the influence of financial factors on the growth of small and medium-sized enterprises in portuguese high technology and medium-high technology sectors. WSEAS Transactions on Business and Economics, 17, 703–716. [Google Scholar] [CrossRef] [Scilit]
- Tons, Y., & Serrasqueiro, Z. (2020). The influential factors on capital structure: A study on portuguese high technology and medium-high technology small and medium-sized enterprises. International Journal of Financial Research, 11(4), 23–35. [Google Scholar] [CrossRef] [Scilit]
- Tran, D. L., & Nguyen, Q. K. (2025). The effect of CEO power on firm performance: Are corporate governance and country risk relevant? Eurasian Economic Review, 16, 583–608. [Google Scholar] [CrossRef] [Scilit]
- Tran, H. T., & Santarelli, E. (2014). Capital constraints and the performance of entrepreneurial firms in Vietnam. Industrial and Corporate Change, 23(3), 827–864. [Google Scholar] [CrossRef] [Scilit]
- Tran Minh Hung, P., Ngoc Tuong Vi, V., Hoang Diem Trinh, V., Hong Tam, V., & Kim Nguyen, T. (2026). Institutional quality and cash holdings: Empirical evidence from an emerging market. International Journal of Business Innovation and Research, 40(12), 1–38. [Google Scholar] [CrossRef] [Scilit]
- Tripathi, D. K., Chadha, S., & Tripathi, A. (2024). Uncovering the hidden roots: The tapestry of working capital efficiency in Indian MSMEs. Journal of Global Operations and Strategic Sourcing, 17(1), 53–73. [Google Scholar] [CrossRef] [Scilit]
- Vajjhala, N. R., & Strang, K. D. (2024). Profitability, effectiveness, operational efficiency, and market growth of SMEs in Albania after piloting data analytics. International Journal of Services and Standards, 14(1), 51–64. [Google Scholar] [CrossRef] [Scilit]
- Vannoni, V. (2019). Financial structure and profitability of innovative SMEs in Italy. Advances in Business Related Scientific Research Journal, 10(1), 29–41. [Google Scholar]
- Vašaničová, P., Košíková, M., Jenčová, S., Miškufová, M., & Korečko, J. (2025). Financial performance-based clustering of SPA enterprises in Slovakia. Journal of Risk and Financial Management, 18(9), 482. [Google Scholar] [CrossRef] [Scilit]
- Vengesai, E., & Kwenda, F. (2018). The impact of leverage on discretionary investment: African evidence. African Journal of Economic and Management Studies, 9(1), 108–125. [Google Scholar] [CrossRef] [Scilit]
- Vieira, E. S. (2017). Debt policy and firm performance of family firms: The impact of economic adversity. International Journal of Managerial Finance, 13(3), 267–286. [Google Scholar] [CrossRef] [Scilit]
- Vijayakumaran, R., & Vijayakumaran, S. (2019). Leverage, debt maturity and corporate performance: Evidence from Chinese listed companies. Asian Economic and Financial Review, 9(4), 491–506. [Google Scholar] [CrossRef] [Scilit]
- Vu Thi, A. H., & Phung, T. D. (2021). Capital structure, working capital, and governance quality affect the financial performance of small and medium enterprises in Taiwan. Journal of Risk and Financial Management, 14(8), 381. [Google Scholar] [CrossRef] [Scilit]
- Waheed, A., & Bagh, T. (2025). Litigation risk, green innovation and corporate reputation: Empirical evidence from China. Journal of Asia Business Studies, 19(4), 1152–1174. [Google Scholar] [CrossRef] [Scilit]
- Ward, J. H. (1963). Hierarchical grouping to optimize an objective function. Journal of the American Statistical Association, 58(301), 236–244. [Google Scholar] [CrossRef] [Scilit]
- Wei, R., Cheung Wong, E. Y., Sun, M., & Wang, Z. (2024). Multidimensional financial metrics for corporate financial risk assessment and early warning mechanisms. Journal of Organizational and End User Computing, 36(1), 1–23. [Google Scholar] [CrossRef] [Scilit]
- Williams, R., Seipel, S., Gilbert, J., & Aaron, J. (2025). Strategic groups’ path to the efficiency frontier. Journal of Small Business Strategy, 35(2), 1–19. [Google Scholar] [CrossRef] [Scilit]
- Xiao, L., Mokhtar, N. A., & Sulaiman, M. K. A. M. (2025). Enhancing profitability and cost efficiency in China’s construction industry. Construction Economics and Building, 25(3–4), 1–21. [Google Scholar] [CrossRef] [Scilit]
- Xie, J., & Yuan, S. (2025). The cultural origins of family firms. Journal of Comparative Economics, 53(1), 1–24. [Google Scholar] [CrossRef] [Scilit]
- Xu, X., & Sam, A. (2025). Environmental sustainability and business profitability: Profiling winners and losers with machine learning. Business Strategy and the Environment, 34(5), 5205–5239. [Google Scholar] [CrossRef] [Scilit]
- Yadav, I. S., Pahi, D., & Gangakhedkar, R. (2022). The nexus between firm size, growth and profitability: New panel data evidence from Asia–Pacific markets. European Journal of Management and Business Economics, 31(1), 115–140. [Google Scholar] [CrossRef] [Scilit]
- Yang, K., Lau, R. Y. K., & Abbasi, A. (2023). Getting personal: A deep learning artifact for text-based measurement of personality. Information Systems Research, 34(1), 194–222. [Google Scholar] [CrossRef] [Scilit]
- Yang, Y., Albaity, M., & Hassan, C. H. B. (2015). Dynamic capital structure in China: Determinants and adjustment speed. Investment Management and Financial Innovations, 12(2), 195–204. [Google Scholar]
- Yousaf, M. (2025). Determinants of firm performance: How to choose the best model among panel data models? Central European Management Journal, 33(3), 504–521. [Google Scholar] [CrossRef] [Scilit]
- Youssef, I. S., Al Alam, A. F., & Salloum, C. (2022). Determinants of firm liquidity in central and eastern Europe SMEs. International Journal of Globalisation and Small Business, 13(2), 127–146. [Google Scholar] [CrossRef] [Scilit]
- Youssef, I. S., Salloum, C., & Al Sayah, M. (2023). The determinants of profitability in non-financial UK SMEs. European Business Review, 35(5), 652–671. [Google Scholar] [CrossRef] [Scilit]
- Zhan, B., Zhang, S., Du, H. S., & Yang, X. (2022). Exploring statistical arbitrage opportunities using machine learning strategy. Computational Economics, 60(3), 861–882. [Google Scholar] [CrossRef] [Scilit]
- Zhang, Z., Wang, Z., & Cai, L. (2025). Predicting financial fraud in Chinese listed companies: An enterprise portrait and machine learning approach. Pacific Basin Finance Journal, 90, 102665. [Google Scholar] [CrossRef] [Scilit]
- Zheng, Y., Devaughn, M. L., & Zellmer-Bruhn, M. (2016). Shared and shared alike? Founders’ prior shared experience and performance of newly founded banks. Strategic Management Journal, 37(12), 2503–2520. [Google Scholar] [CrossRef] [Scilit]
- Zhu, W., Zhang, T., Wu, Y., Li, S., & Li, Z. (2022). Research on optimization of an enterprise financial risk early warning method based on the DS-RF model. International Review of Financial Analysis, 81, 102140. [Google Scholar] [CrossRef] [Scilit]
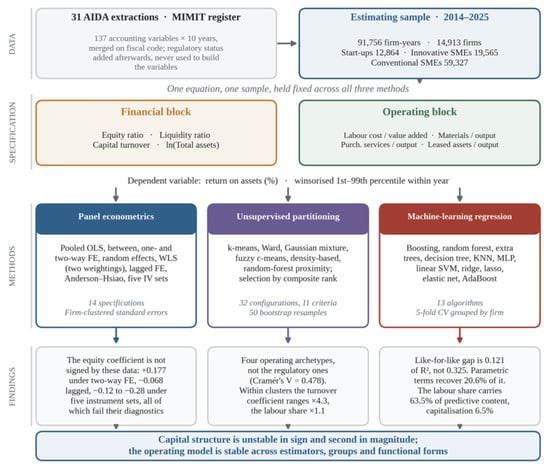
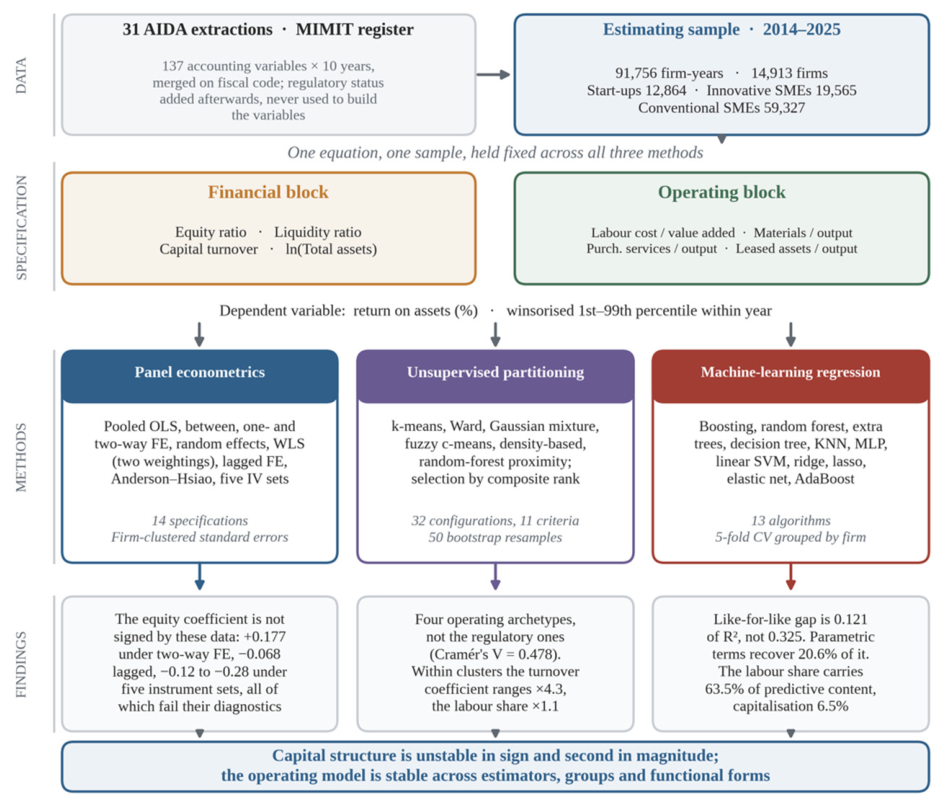
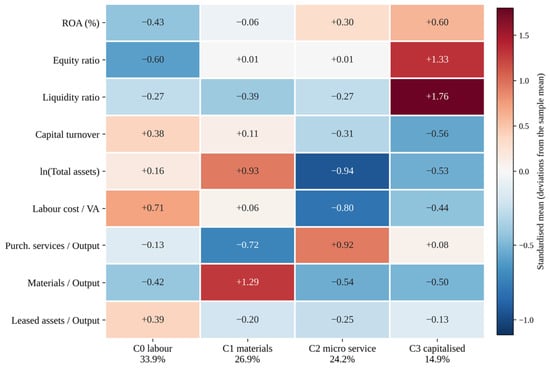
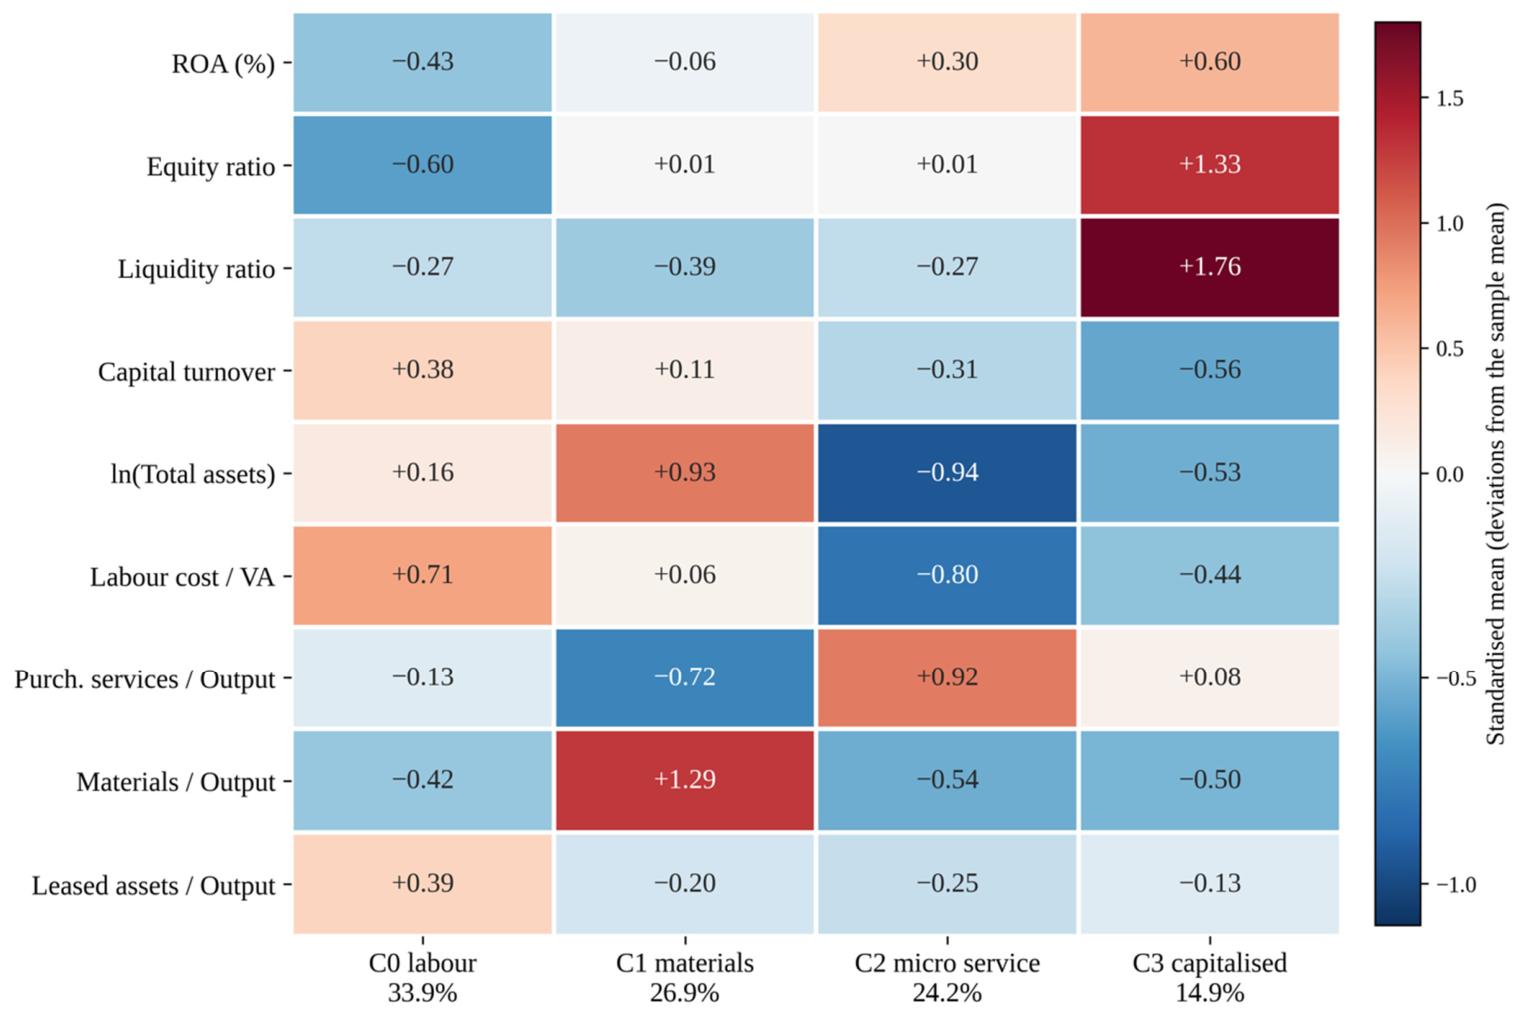
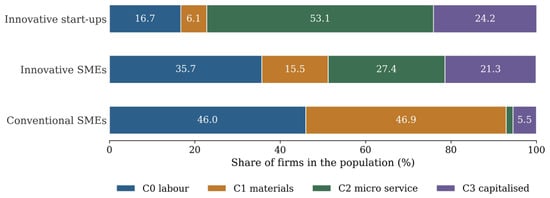
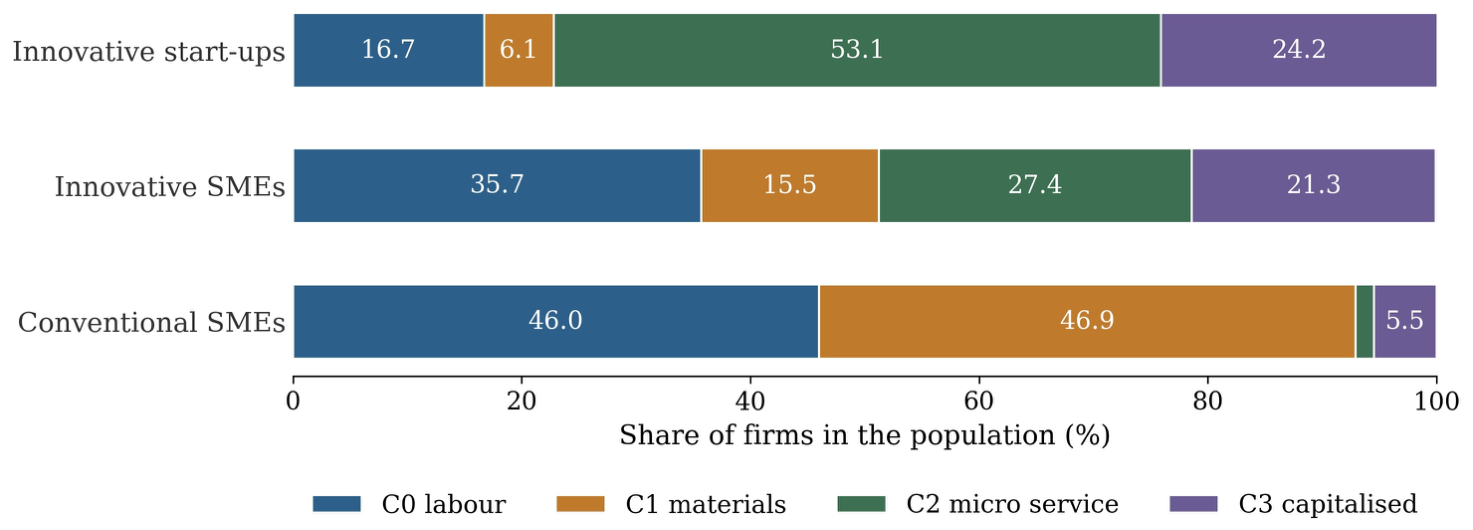
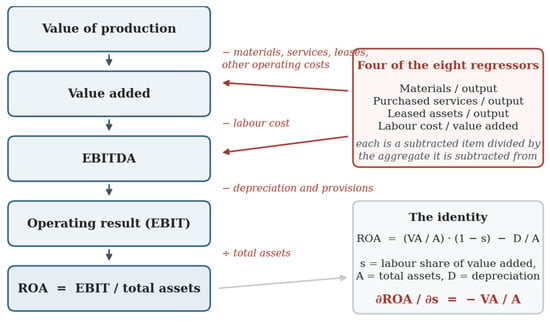
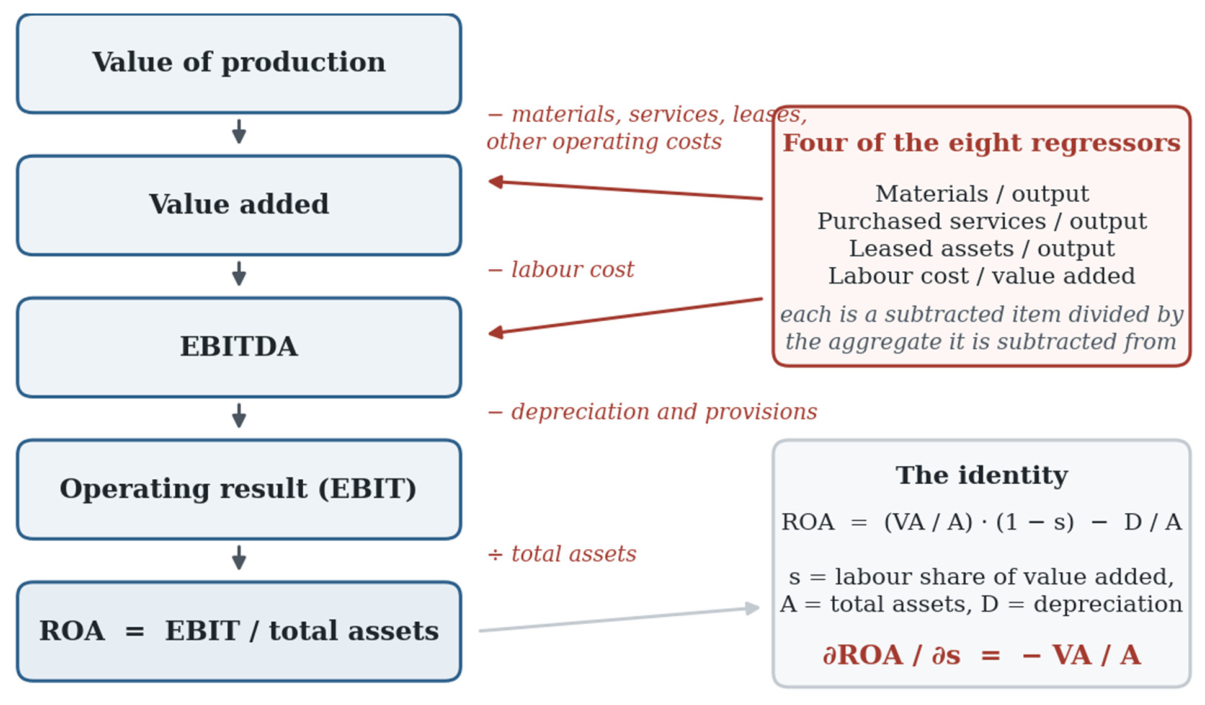

Disclaimer/Publisher’s Note: The statements, opinions and data contained in all publications are solely those of the individual author(s) and contributor(s) and not of MDPI and/or the editor(s). MDPI and/or the editor(s) disclaim responsibility for any injury to people or property resulting from any ideas, methods, instructions or products referred to in the content. |
© 2026 by the authors. Licensee MDPI, Basel, Switzerland. This article is an open access article distributed under the terms and conditions of the Creative Commons Attribution (CC BY) license.