


Abstract
Financial-account access and digital merchant-payment use are distinct dimensions of inclusion. Combining Global Findex historical subgroup series with the 2024 cross-section, we prioritize a common-sample analysis of 62,480 phone-owning adults across 74 economies. Weighted economy-fixed-effects logistic models show positive associations of smartphone ownership (OR 1.25), recent internet use (OR 1.77), basic messaging capability (OR 1.89), and secure device control (OR 1.93) with digital merchant-payment use. A three-category device-security specification distinguishes device locking from autonomous credential management; the latter is associated with greater merchant-payment use than locking without autonomy (OR 1.55, 95% economy-cluster bootstrap percentile interval 1.35–1.77; standardized difference 5.71 percentage points, 95% interval 3.87–7.51; 1999 resamples). Positive internet, messaging, and security associations persist for a narrower digitally paid online-purchase outcome, with module-routed samples of 40,678 and 42,529. Results for all four digital predictors remain positive across four weighting specifications; exploratory device-security interactions with gender and Latin America and the Caribbean survive Benjamini–Hochberg adjustment. Historical changes in gender and income disparities vary across balanced-economy sets and weighting assumptions; economy-resampling intervals do not establish universal faster convergence of account access than payment use. The observational design, questionnaire routing, and nonrandom module coverage prohibit causal and global-population interpretations.
1. Introduction
Digital finance has moved from the periphery of financial inclusion policy to the center of everyday economic exchange. Mobile money, app-based bank accounts, card-linked wallets, and internet-enabled payments have reduced geographic and transactional frictions and created new ways for households to receive income, transfer funds, save, borrow, and pay merchants. The welfare potential is substantial: digital–financial services can lower transaction costs, support risk sharing, and widen the practical reach of formal finance (Jack & Suri, 2014; Suri & Jack, 2016; Aron, 2018). The central policy question, however, is changing. As account ownership expands, the relevant margin is increasingly not whether people can enter the financial system, but whether they can use digital finance effectively and safely once connected.
Earlier Global Findex flagship publications establish the distinction between account ownership and the use of payments, saving, and borrowing (Demirgüç-Kunt et al., 2018, 2022). The Global Findex Database 2025 documents connectivity, device ownership, and related digital-finance measures (Klapper et al., 2025).
The present study uses this new measurement environment to separate device access, basic messaging capability, and device-level security within a common individual-level model of merchant-payment use, while anchoring the 2024 analysis in balanced historical trends. This positioning complements the descriptive Global Findex report and recent studies of institutions, literacy, and inequality without treating connectivity as synonymous with realized financial inclusion.
Recent research reinforces the need to separate financial inclusion’s extensive and intensive margins. Allen et al. (2016) show that individual and country characteristics jointly shape formal account ownership and use. Grohmann et al. (2018) further demonstrate that financial literacy is especially relevant for using financial services, not simply accessing infrastructure. More recently, Peng et al. (2026) distinguish the uptake of accounts from the use of saving, borrowing, and digital payments across 144 economies and show that institutional barriers condition financial inclusion. Cao et al. (2026) show that digital finance can coexist with cross-country inequality, while Trotta et al. (2026) characterize the barriers that sit inside the ‘black box’ of digital–financial inclusion. Recent JRFM evidence likewise shows that coverage breadth, usage depth, and digitisation capture distinct dimensions of digital–financial inclusion (Hu et al., 2026), and that trust and perceived risk are relevant to actual digital-payment use (Jagrič et al., 2026). Together, these studies suggest that aggregate expansion does not guarantee distributional convergence.
The parallel literature on digital inequality provides a useful theoretical lens. Research has moved from a first-level divide in physical access to a second-level divide in skills and patterns of use, and then to a third-level divide in tangible outcomes obtained from being online (van Deursen & Helsper, 2015; Lythreatis et al., 2022). Applied to finance, connectivity is therefore better viewed as an enabling resource than as financial inclusion itself. A smartphone or internet connection can create the possibility of digital finance, but capabilities are needed to navigate interfaces, and security or autonomy may be necessary to transact with confidence and control. This interpretation is consistent with evidence linking financial literacy to inclusion (Grohmann et al., 2018), digital–financial literacy to service use (Ferilli et al., 2024; Pak et al., 2026), and trust and security to FinTech adoption (Jafri et al., 2024).
This study combines two distinct empirical layers. Historical Findex indicators from 2011 to 2024 describe changes in financial access and use within each series-specific balanced set of economies; cross-indicator comparisons additionally require a common-economy restriction. The central analysis uses 2024 individual microdata to estimate associations of smartphone status, recent internet use, basic messaging capability, and secure device control with digital merchant-payment behavior after conditioning on observed socioeconomic characteristics and economy fixed effects. Because detailed device-safety items were collected only among phone owners and in a subset of economies, this individual analysis covers 62,480 phone-owning adults in 74 economies, not all respondents or all Findex economies.
The paper makes three contributions. First, it distinguishes financial-account access from merchant-payment behavior, documenting indicator-specific historical trends while explicitly recognizing their different coverage. Second, it examines basic messaging capability and secure device control alongside connectivity within the same 2024 individual-level model, reporting adjusted associations rather than effects of interventions. Third, it describes how education, income, rural–urban, and gender contrasts differ across sequentially conditioned specifications, while assessing robustness to alternative weighting, security coding, and geographical restrictions. These comparisons do not identify mediation or causal contributions.
The remainder of the paper is organized as follows. Section 2 develops the conceptual framework and hypotheses. Section 3 describes the data and empirical strategy. Section 4 presents the historical and individual-level results. Section 5 discusses their implications for international finance, digital inclusion, and policy. Section 6 concludes.
2. Conceptual Framework and Hypotheses
2.1. Historical Access and Use Gaps
Owning an account is an extensive margin of financial inclusion, whereas making or receiving digital payments represents observed use. Financial inclusion policies and digitized transfers can broaden account ownership without ensuring acceptance infrastructure, affordable connectivity, or transactional skills. Previous work differentiates account adoption from account use (Allen et al., 2016; Peng et al., 2026). A cross-indicator historical comparison must hold the set of economies and subgroup definitions fixed, so a common-economy 2014–2024 assessment is the appropriate test rather than a comparison between differently composed series.
H1 (descriptive, with indicator-specific direction).
Over the available common-economy periods, changes in gender and income gaps differ between account ownership and digital-payment use. The hypothesis is evaluated separately by indicator, historical window, and weighting scheme; its direction is not assumed to generalize to every economy.
2.2. Connectivity and Merchant-Payment Behavior
The first level of digital inequality concerns connectivity. Devices and internet connections enable a wider range of transaction channels, although the Global Findex merchant-payment indicator also includes in-store card purchases that do not require personal smartphone use. Digital inequality theory treats connectivity as a resource facilitating, but not guaranteeing, engagement (van Deursen & Helsper, 2015; Lythreatis et al., 2022).
H2a.
Among phone-owning adults in the 2024 analytical sample, smartphone ownership is positively associated with digital merchant-payment use after adjustment for structural characteristics and economy fixed effects.
H2b.
Within the same sample and adjustment set, recent internet use is positively associated with digital merchant-payment use.
2.3. Basic Messaging Capability
Operational skills may distinguish connectivity from actual transaction behavior. Reading and sending messages can facilitate receiving notifications and authentication codes, but this two-task indicator does not establish digital–financial literacy (Grohmann et al., 2018; Ferilli et al., 2024).
H3.
Conditional on connectivity and structural characteristics, basic messaging capability is positively associated with digital merchant-payment use.
2.4. Secure Device Control
Device locking and the ability to change credentials without help indicate observable control over device access, distinct from perceived security or financial welfare (Shaikh & Karjaluoto, 2015; Jafri et al., 2024; Afzal et al., 2025). Prior use of digital payments could itself encourage stronger device protection, so a positive coefficient would not establish the direction of influence.
H4.
Conditional on connectivity, basic messaging capability, structural characteristics, and economy fixed effects, secure device control is positively associated with digital merchant-payment use.
2.5. Structural Differences Across Nested Specifications
Income, education, gender, and residence may be correlated with connectivity, messaging capability, and device protection. Adding these characteristics changes the conditioning set and may change adjusted structural contrasts without demonstrating mediation.
H5.
The absolute model-standardized gender, education, income, and rural–urban differences in merchant-payment use are smaller in the full digital-characteristics specification than in the structural-only specification. The four contrasts are assessed separately.
3. Materials and Methods
3.1. Data Architecture
The analysis uses the World Bank Global Findex Database (World Bank, 2025). The 2025 edition is based on nationally representative surveys conducted during 2024 and covers approximately 148,000 adults in 141 economies; it is the first Findex wave with globally comparable measures of mobile-phone ownership, internet use, and digital safety (Klapper et al., 2025). The public world microdata file used here contains 144,090 individual records across 140 economies. The difference reflects the released microdata universe and does not affect the published global aggregates.
Two data layers are combined without pooling incompatible measures. The historical layer uses the Global Findex country/subgroup indicator file for 2011, 2014, 2017, 2021, and 2024. For each outcome, we construct a balanced set of economies observed in every available wave for that series and compute adult-population-weighted prevalence. This prevents changing country coverage from being mistaken for temporal change. The individual layer uses the 2024 world microdata for multivariable inference. Because the financial and detailed safety modules were not administered identically in every economy, analytical universes are explicitly reported rather than treating structural missingness as random nonresponse. Table 1 summarizes the resulting analytical universes and sample sizes.
Table 1.
Analytical universes and sample sizes.
3.2. Outcomes and Explanatory Variables
The primary outcome is digital merchant-payment use (merchantpay_dig), coded as reported use of a digital-payment channel when purchasing from a merchant during the preceding year. The published Findex indicator includes both in-store payments using a bank card or mobile phone and online payments for internet purchases. The outcome is therefore deliberately interpreted as digital merchant-payment behavior—not mobile-only transactions, payment frequency, safety, or welfare. Merchant payments are selected because they reflect an observed transaction behavior distinct from account ownership. Because the in-store question combines card and mobile channels, a mobile-only in-store series cannot be identified from this measure.
Connectivity is represented by smartphone status and internet use in the preceding three months. Basic messaging capability denotes reporting the ability to both read and send text or application messages; this is a low-threshold task indicator rather than a validated literacy scale. Secure device control combines device locking through a PIN, password, or biometric function with independent credential change. These questions are routed to phone owners. Consequently, the fully adjusted sample is a selected set of phone-owning respondents, not all adults in the 2024 Findex universe. In the complete-case sample, 68.8% met this two-task criterion (survey weighted; n = 62,480). The corresponding rates were 84.1% in the 1 high-income economy (n = 831) and 68.6% in the other 73 covered economies (n = 61,649). This descriptive difference calls for attention to potential ceiling effects rather than assuming that message skills discriminate equally in every economy.
Structural covariates are gender, age and age squared, education (primary or less, secondary, tertiary or more), within-economy household income quintile, labor-force participation, and rural residence. Economy fixed effects absorb economy-level characteristics common to respondents within each 2024 economy, including regulatory, macroeconomic, institutional, and infrastructure conditions.
Secondary descriptive indicators are ownership of a digitally enabled account (dig_account) and any digital-payment use (anydigpayment). Their observed weighted prevalence is assessed within the main complete-case sample; these measures are not interchangeable with the primary merchant-payment behavior. The emergency-fund outcome is not reported as a confirmatory secondary estimate because its full operational coding, eligible denominator, and estimation were not revalidated for this revision. Scam exposure and cash-only payment distrust remain contextual and cannot be generalized from selected respondent groups.
3.3. Empirical Strategy
The main specifications are weighted logistic regressions with economy fixed effects and inference clustered at the economy level. All nested models S0–S3 use the same complete-case sample of 62,480 respondents in 74 economies. The original Findex survey weights are normalized within economies. Accordingly, pooled estimates reflect the relative contributions of surveyed respondents under the supplied weights rather than either an exactly equal-economy target or a population-weighted estimate for all adults worldwide. Economy fixed effects condition on shared economy-level characteristics but cannot eliminate individual-level selection or endogeneity. Population-scaled-weight estimates are presented as a sensitivity analysis; they must not be interpreted as a full correction for nonrandom country-module coverage.
- S0: merchant payment = structural covariates + economy fixed effects;
- S1: S0 + smartphone + internet use;
- S2: S1 + basic messaging capability;
- S3: S2 + secure device control.
The sequential models describe changes in associations and adjusted probabilities when the conditioning set expands; they are not a causal mediation design. Logistic coefficients across nested models can also change because of non-collapsibility. For this reason, reductions in adjusted group contrasts are reported as descriptive model differences, not as percentages of inequality causally explained by connectivity, messaging capability, or device control.
For each binary focal covariate, standardized probability contrasts are estimated by predicting the merchant-payment probability with that covariate set first to 0 and then to 1 for the analytic observations, holding all other recorded covariates at their values, and averaging the two sets of predictions using the model weights. The difference is expressed in percentage points. Education and income contrasts similarly compare tertiary with primary education and quintile 5 with quintile 1. Reported confidence intervals were obtained using 499 economy-cluster bootstrap resamples. Historical prevalence and subgroup gaps are calculated within series-specific balanced-economy sets; as those sets differ across indicators, the series should not be interpreted as cross-indicator comparisons for an identical country population.
3.4. Robustness and Finite-Cluster Inference
The primary S0–S3 models use economy-clustered sandwich standard errors (Cameron & Miller, 2015). Additional R1 checks comprise four weighting schemes, all six entry orders for connectivity, messaging and security, an online-payment outcome restricted by questionnaire routing, four exploratory interactions with Benjamini–Hochberg correction, and 1999 economy-resampling replications for the three-state-security contrasts. Legacy wild-cluster and CR2/Satterthwaite procedures are not relied upon as independently replicated R1 findings. Neither economy bootstrap nor country fixed effects recreate complete original within-economy survey design uncertainty.
Additional checks re-estimate the core model using population-scaled weights, restrict the sample to lower- and middle-income economies, redefine security using device lock/PIN alone, and sequentially omit each World Bank region. Heterogeneity in the association of security with gender and Latin America and the Caribbean (LAC) is treated as exploratory and adjusted for multiple testing using the Benjamini–Hochberg false-discovery-rate procedure.
3.5. Research Ethics and Reproducibility
The analysis is a secondary use of publicly available, de-identified Global Findex data without direct contact with participants. Original survey consent and field procedures were overseen by the implementing institutions. Models, plots, and main results originate from the submitted replication materials, with analysis reported as performed in R 4.6.0. The included code and output files support inspection of the submitted analyses but do not themselves replace the original individual-level data for running new sensitivity specifications.
4. Results
4.1. Historical Trends: Indicator-Specific Coverage and Heterogeneous Gap Trajectories
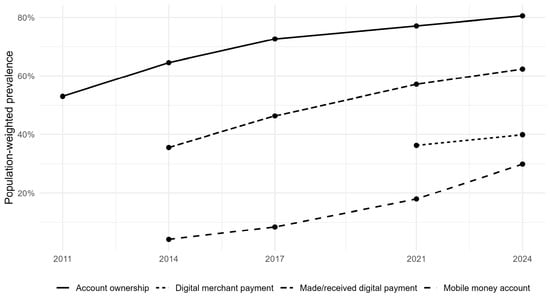
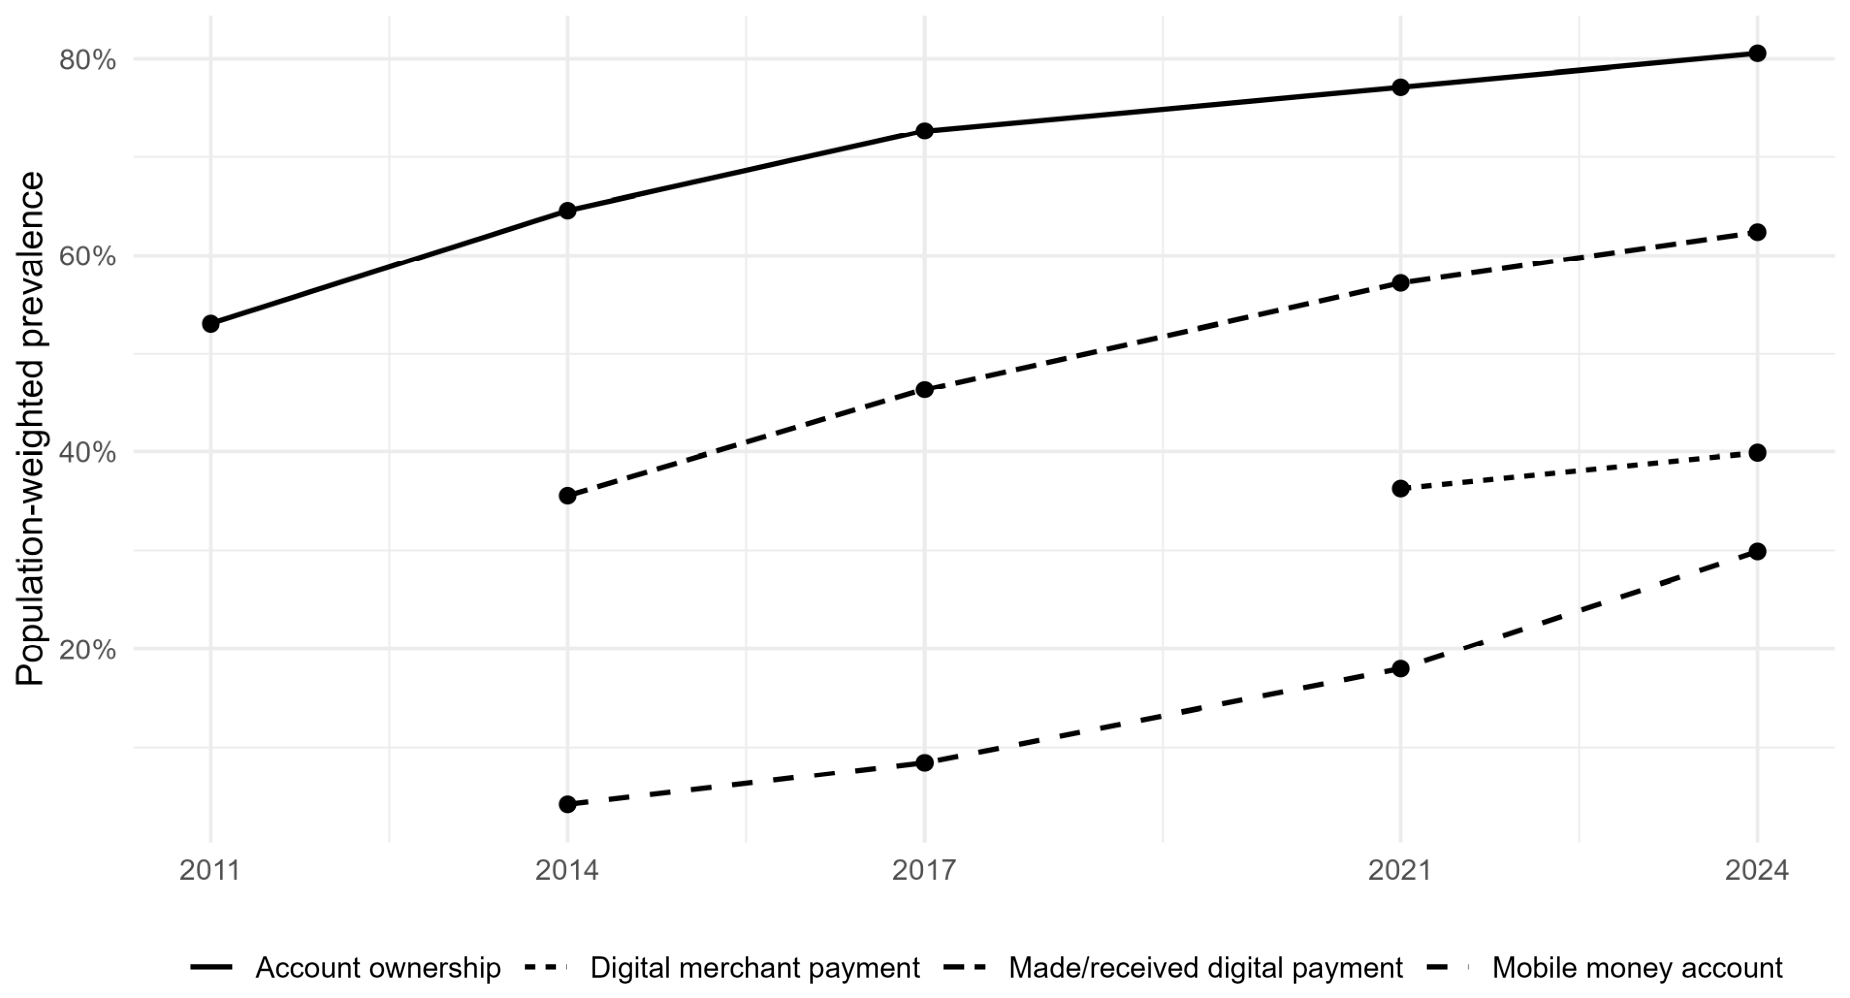
Figure 1 shows the long-run transition in balanced-economy sets. Account ownership rises from 53.0% in 2011 to 64.6% in 2014, 72.7% in 2017, 77.2% in 2021, and 80.6% in 2024 across 108 economies observed in every account-ownership wave. In the 74 economies with comparable digital-payment data, the prevalence of making or receiving a digital payment increases from 35.6% in 2014 to 62.4% in 2024. Mobile-money account ownership rises even more sharply—from 4.1% in 2014 to 29.9% in 2024 across 50 balanced economies. Digital merchant payment increases from 36.3% in 2021 to 39.9% in 2024. The indicator-specific levels and subgroup gaps, with their respective balanced-economy counts, are summarized in Table 2.
Figure 1.
Long-run transition in financial inclusion using balanced-economy sets. Notes: Each series includes only economies observed in every available wave for that indicator; prevalence is adult-population weighted.
Table 2.
Balanced-economy trends and structural gaps.
Common-economy reanalysis (62 economies for gender and 61 for income, 2014–2024) reveals descriptive differences between access and digital-payment gaps, but direction and magnitude depend on whether each economy or adult population receives greater weight. In paired economy-resampling tests (1999 repetitions), the population-weighted gender account-gap change is −7.10 percentage points (interval −13.54, 0.38) versus −2.65 (−3.62, 0.12) for any digital payment; the contrast in changes is −4.45 (−10.49, 1.24), including zero. Equal-economy results are different. Thus the evidence supports heterogeneous gap trajectories under H1, while it does not support the earlier, stronger proposition of universally faster account-gap convergence. These uncertainty bounds describe variation under economy resampling and are not survey-design-based confidence intervals.
4.2. Connectivity Is Strongly Associated with Merchant-Payment Use
The broader connectivity specification uses 96,939 adults from 96 economies and yields odds ratios of 2.97 for mobile-phone ownership and 3.46 for recent internet use. Because this population differs from the phone-owner safety-module sample, these coefficients should not be interpreted as directly comparable to estimates from S1–S3. Restriction to module-participating economies and phone-owning complete cases may affect both the covariate distribution and the magnitudes of estimated associations. The broad specification is accordingly presented as contextual evidence.
In the common 62,480-person sample, sequential model fit improves at every stage. Adding smartphone and internet access to the structural model reduces AIC by 1186 points; adding basic messaging capability reduces it by a further 409 points; and adding secure device control reduces AIC by another 534 points. Pseudo-R2 rises from 0.308 in S0 to 0.339 in S3. Joint Wald tests reject the null contribution of the connectivity, capability, and security blocks at p < 0.001. Table 3 reports the full sequence of economy-fixed-effects estimates.
Table 3.
Sequential economy-fixed-effects logit models for digital merchant payment.
4.3. Capability and Secure Device Control Add Beyond Connectivity
In the common sample of 62,480 phone-owning adults, the adjusted S3 odds ratios are 1.25 for smartphone status, 1.77 for internet use, 1.89 for basic messaging capability, and 1.93 for secure device control. Corresponding standardized differences in predicted merchant-payment probability are 2.8 percentage points (95% bootstrap CI 0.9–4.7), 6.9 (4.9–8.9), 7.7 (6.0–9.2), and 8.3 (6.7–9.8). These are conditional comparisons between covariate profiles, not effects that could be expected from providing a smartphone, training, or device-locking intervention. Reverse causality is particularly plausible for device security, since prior payment experience may motivate users to lock their phones.
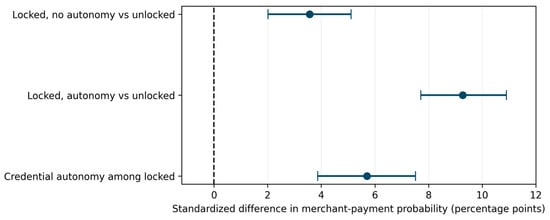
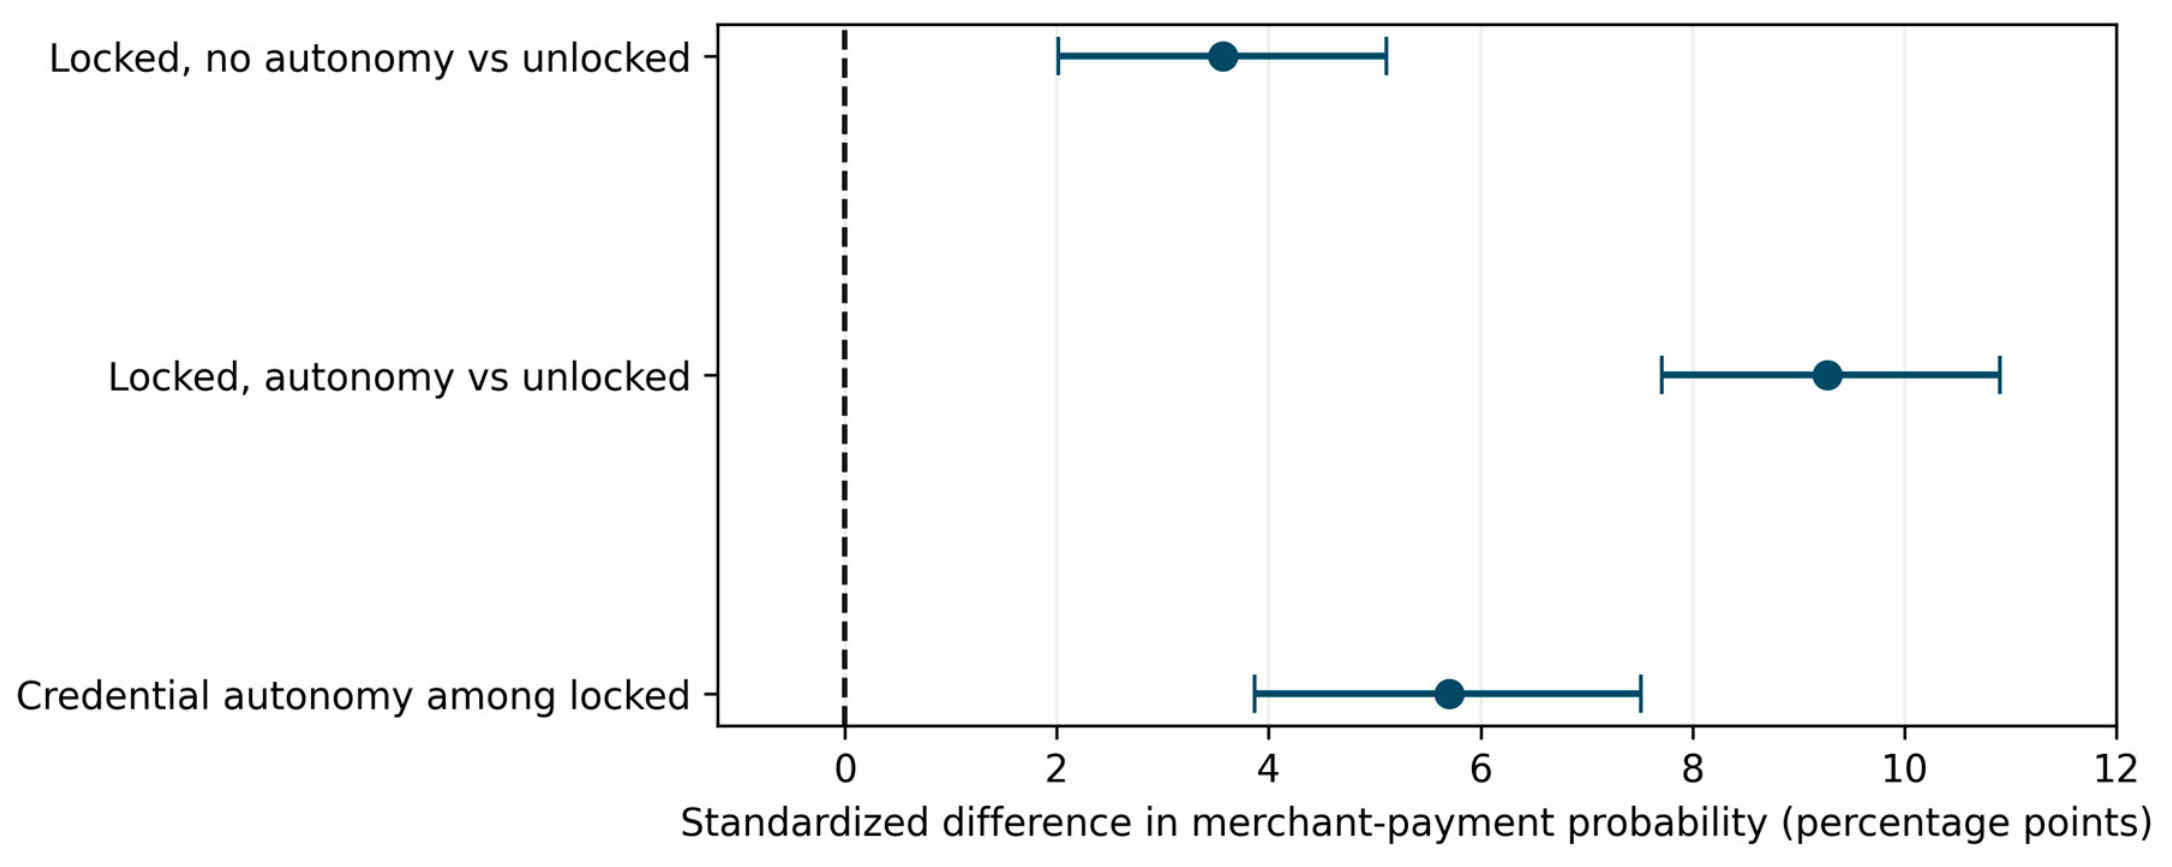
The security estimate is similar under an alternative lock-only definition. When device lock/PIN alone replaces secure autonomous control, the odds ratio is 1.92 compared with 1.93 in the core specification. Moreover, excluding one World Bank region at a time leaves the secure-device-control OR between 1.83 and 2.12, significant in all seven runs. Internet and capability are similarly stable across region exclusions; smartphone ownership is positive but less geographically stable. Figure 2 displays the standardized probability contrasts, and Table 4 reports their numerical estimates and 95% confidence intervals.
Figure 2.
Standardized merchant-payment probability differences for three states of device protection and credential autonomy. Dots denote adjusted differences in percentage points; error bars show 95% percentile intervals from 1999 economy-cluster bootstrap resamples. The vertical dashed line explicitly marks zero. Associations are not causal effects.
Table 4.
Model-standardized probability differences by device-security status (B = 1999 economy resamples).
4.4. Differences in Structural Contrasts Across Conditional Specifications
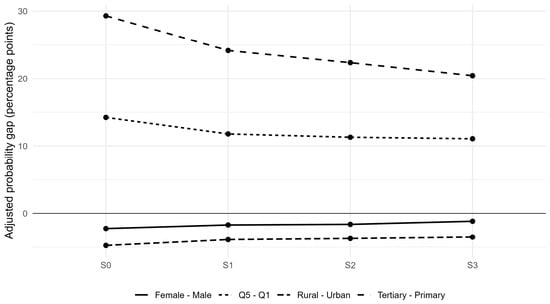
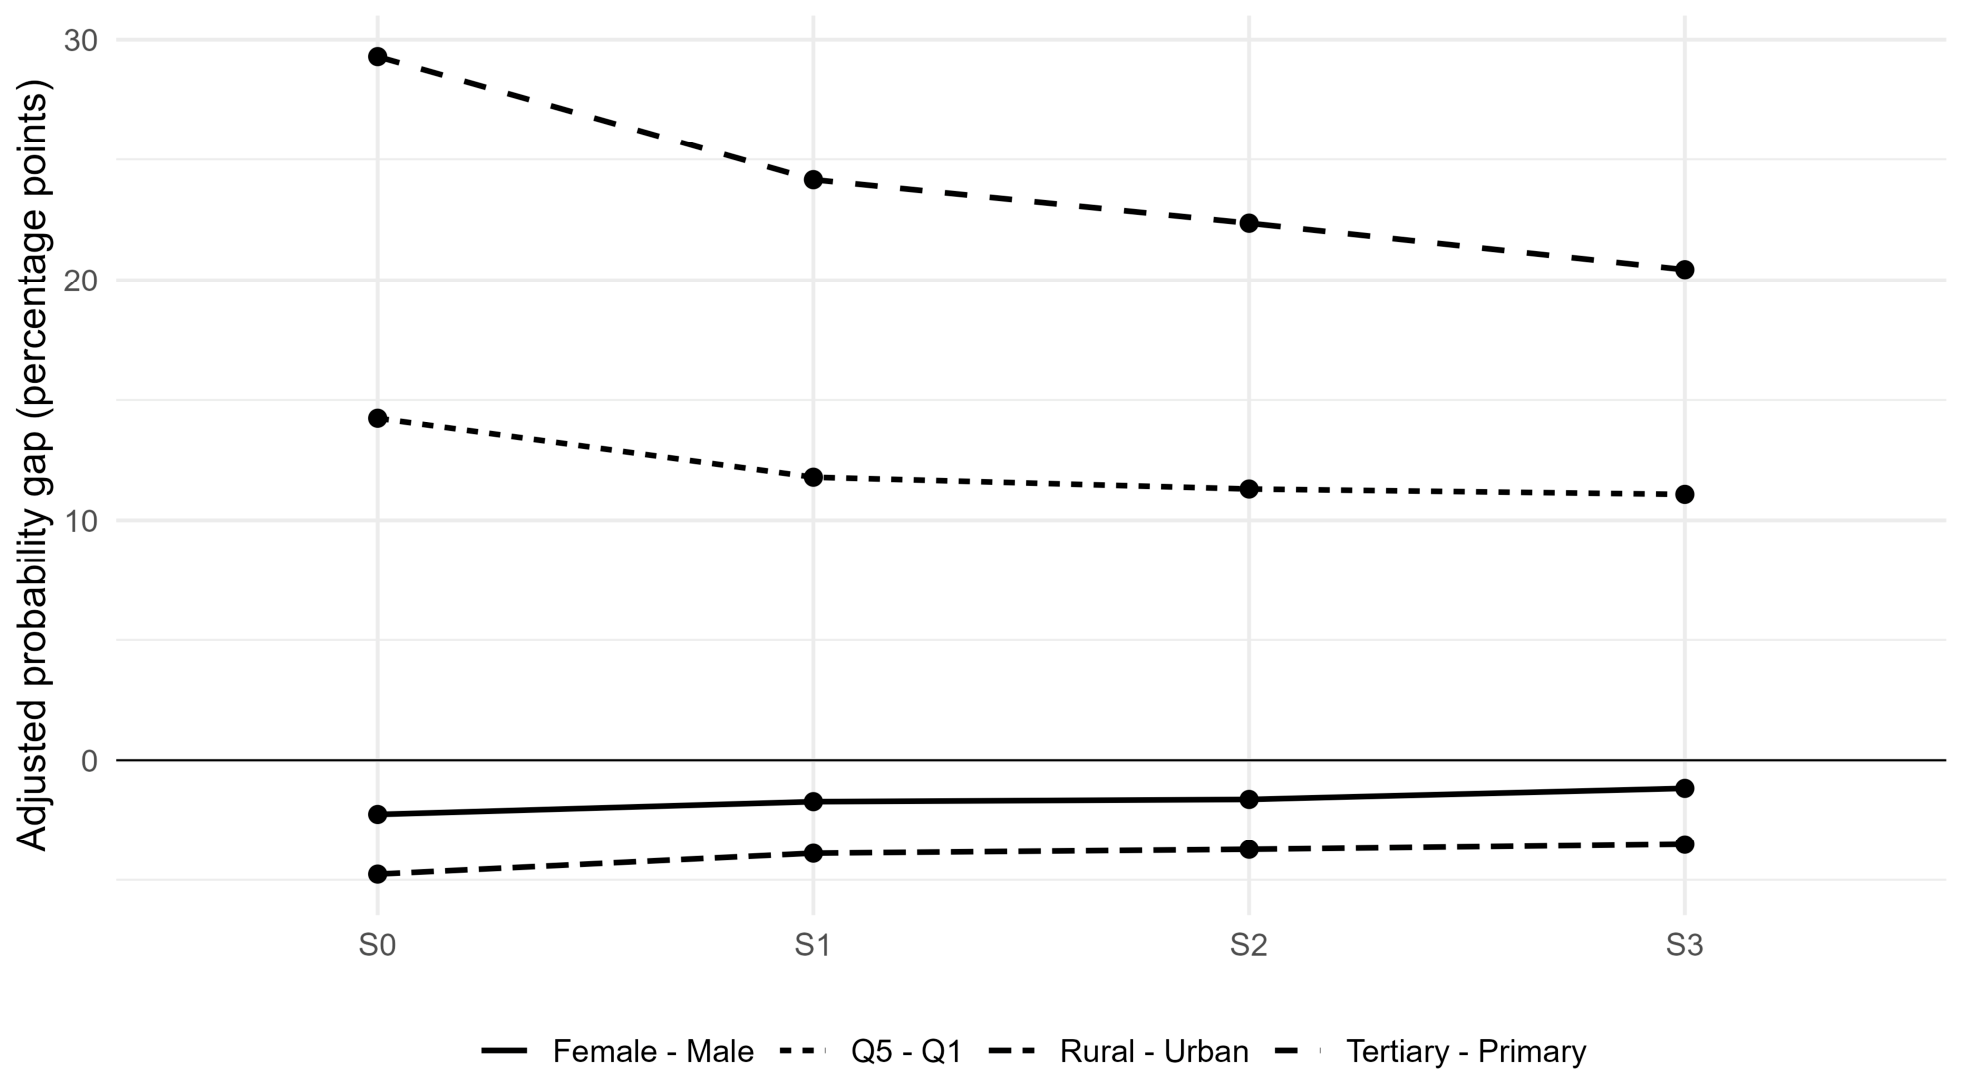
The residual inequalities are economically large. In S3, the standardized probability of merchant-payment use is 19.6% for adults with primary education or less, 27.0% with secondary education, and 40.1% with tertiary education. The tertiary–primary adjusted gap is therefore 20.4 percentage points (95% CI 17.9–23.0). Across income quintiles, adjusted probabilities rise monotonically from 20.5% in Q1 to 31.5% in Q5, leaving an 11.1-point Q5–Q1 gap (8.6–13.3). Rural residence remains associated with a 3.5-point disadvantage, while the residual female–male difference is 1.2 points.
We additionally evaluated all six permutations of connectivity, basic messaging capability, and secure device control. Intermediate model fit and standardized contrasts varied with entry order, while all permutations yielded the same final S3 specification (AIC = 46,094.57). These descriptive changes do not identify mediation or causal contributions. Figure 3 visualizes the sequence-specific adjusted structural gaps and illustrates why changes across nested specifications are descriptive rather than causal.
Figure 3.
Sequential attenuation of adjusted structural gaps. S0 = structural covariates; S1 = +connectivity; S2 = +digital capability; S3 = +secure device control.
4.5. Boundary of the Primary Behavioral Endpoint
The primary outcome includes card-present merchant payments, which need not involve personal mobile-device operation. Therefore, Section 4.9 uses separately identified paid online purchases digitally as a more specific sensitivity outcome, estimates the full S0–S3 sequence on each fixed eligible subsample, and contrasts each model with merchant payments on the same subsample. AIC is compared only within a common outcome and sample. The primary claims concern the merchant-payment outcome and reproducible online, security, weighting, and historical sensitivity analyses. Unverified auxiliary financial-welfare outcomes are not treated as confirmatory results. The scope and observed prevalence of additional account and digital-payment measures are summarized descriptively; neither is used to claim downstream resilience.
4.6. Exploratory Interaction Heterogeneity
Four exploratory interaction terms were estimated in separate otherwise identical S3 models and evaluated with a Benjamini–Hochberg adjustment across four tests (Table S7). Secure device control interacted positively with female gender (ratio of ORs 1.136, 95% CI 1.022–1.262; q = 0.0357) and with the World Bank Latin America and Caribbean region excluding high-income economies (ratio 1.385, 95% CI 1.091–1.759; q = 0.0300). The internet-by-region and messaging-by-region interactions did not pass the same threshold (q = 0.3375 and 0.1937). These are exploratory heterogeneities on a conditional log-odds scale rather than causal or marginal interaction effects.
4.7. Robustness
Table 5 summarizes the verified weighting, sequence-order, three-state device-security and interaction sensitivity analyses. Inference is based on economy-clustered standard errors or the explicitly identified 1999-repetition economy bootstrap; legacy finite-cluster procedures are not used for additional R1 conclusions.
Table 5.
Robustness summary.
The main reported inference uses economy-clustered sandwich standard errors for S0–S3, while the three-state-security comparisons were subjected to 1999 economy-cluster bootstrap replications with no failures. Earlier wild-cluster and CR2/Satterthwaite estimates appeared in the initial replication archive; because their exact implementation has not been rerun as part of the R1 audit, we do not make additional confirmatory claims based on those outputs.
4.8. Three-State Device Security and Economy-Cluster Bootstrap
To distinguish device protection from credential autonomy, we re-estimated the full model on the same 62,480 complete cases, coding unlocked phones (n = 24,461), locked phones without independent credential change (n = 6045), and locked phones with independent credential change (n = 31,974). Relative to unlocked phones, the locked-without-autonomy category had an adjusted OR of 1.36 (95% confidence interval 1.20–1.54), and the locked-with-autonomy category an OR of 2.10 (1.89–2.33). Direct comparison within locked-phone categories yielded an OR of 1.55 (1.35–1.77). The three-state model improved AIC from 46,094.57 to 46,054.05 without changing the sample. Table 6 reports the corresponding odds-ratio comparisons and bootstrap interval for the incremental autonomy contrast.
Table 6.
Three-state device security: adjusted contrasts and bootstrap intervals.
Economy-cluster bootstrap inference with 1999 valid of 1999 requested resamples yielded a percentile interval of 1.35–1.77 for the autonomy OR. Weighted model-standardized payment probabilities were 20.18% (unlocked), 23.75% (locked without autonomy), and 29.46% (locked with autonomy). The autonomy contrast was 5.71 percentage points (95% percentile interval 3.87–7.51). Bootstrap standardization uses the resampled economy distribution; it does not emulate the complex survey design. These contrasts reflect association, not the effect of changing passwords.
4.9. Narrower Online-Payment Outcome Sensitivity
To address the breadth of the merchant-payment measure, we reconstruct online-purchase payment behavior using fin26b (online purchase of delivered goods) and fin27 (usual payment mode). Respondents with fin26b = 2 are coded zero only when the question was administered. Those with fin26b = 1 and fin27 = 1 are coded one; fin27 = 2 is coded zero; fin27 = 3 is excluded from the strict definition but coded one in the inclusive definition. Non-administered items, responses 3/4 on fin26b, and fin27 responses 4/5 (do not know/refused) are not converted to zeros. Strict and inclusive complete cases comprise 40,678 and 42,529 respondents, respectively, in 74 economies. Within each of those two fixed samples, we estimated all four nested models S0–S3 for both the online result and the original merchant-payment indicator, resulting in 16 models. Each online S3 estimate reproduces the independently audited Stage 2D result. The adjusted associations under both online outcome definitions are reported in Table 7. Table 8 presents the sequential S0–S3 model fit statistics for both the online-payment and merchant-payment outcomes, estimated on the same strict and inclusive eligible samples.
Table 7.
Online-payment outcome sensitivity (adjusted OR, economy-cluster 95% CI).
Table 8.
Sequential online- and merchant-payment models on matched eligible samples (AIC; n = 40,678 strict/42,529 inclusive).
The S0–S3 sequences improve within-outcome fit on both fixed online-analysis samples (Table 8). In the strict online specification, the AIC falls from 19,455.35 (S0) to 18,972.54 (S3); in the inclusive version, it falls from 24,403.79 to 23,749.46. On the respective matched subsamples, the merchant-payment models also improve as each digital block enters. The strict online S3 adjusted ORs are 3.07 (95% CI 2.17–4.34) for recent internet use, 1.71 (1.32–2.23) for messaging capability, and 1.71 (1.48–1.98) for secure device control; smartphone status does not reach conventional significance (OR 1.15, 0.89–1.48). Inclusive online results show the same qualitative pattern. AIC across different outcomes is not compared as evidence that one outcome is better explained. These results remain conditional on questionnaire eligibility and cannot establish causation.
4.10. Weighting, Sequential-Entry, and Historical Uncertainty Checks
We compared original Findex weights, equal total economy weights, population-scaled economy weights, and unweighted models, retaining the 62,480-observation analysis set. All four focal digital ORs remained above one with 95% cluster-robust intervals excluding one; population-scaled results place appreciably greater influence on large included economies and do not correct for phone/module selection. Six permutations of connectivity, messaging, and security blocks yielded the identical S3 model (AIC 46,094.57), while intermediate AIC improvements depended on entry order. Model-standardized tertiary-versus-primary and income-Q5-versus-Q1 contrasts declined descriptively from 29.30 to 20.44 and 14.24 to 11.08 percentage points, respectively, between structural-only S0 and fully adjusted S3. These shifts are not identified mediation effects. The four weighting schemes and their focal adjusted odds ratios are summarized in Table 9.
Table 9.
Weighting-scheme sensitivity (adjusted OR; all corresponding 95% CIs exclude 1).
The historical sensitivity uses matched economies per indicator and window: 62 gender/61 income economies in 2014–2024 and 43 economies per subgroup in 2021–2024. Paired economy-level resampling over 1999 iterations preserves the country draw across years and indicators. Out of 32 calculated historical intervals, many include zero, particularly comparisons of changes between account and payment gaps. These are economy-resampling sensitivity intervals, not sampling-design confidence intervals. Table 10 presents the selected population-weighted gender-gap changes and their economy-resampling intervals. Finally, Table 11 summarizes the weighted prevalence of digitally enabled account ownership, any digital-payment use, and the primary merchant-payment outcome within the common analytical sample of 62,480 adults across 74 economies.
Table 10.
Selected matched-economy historical changes: population-weighted gender gap, 2014–2024.
Table 11.
Descriptive secondary financial-service outcomes in the 2024 core analytical sample.
5. Discussion
5.1. Financial Access and Digital Use: Heterogeneous Historical Trajectories
Growth in account ownership is substantial, but historical gender and income gaps do not follow identical trajectories for every financial-use measure and economy subset. Because balanced series involve different country groups, our primary historical inference is cautious: levels of access and payment use are distinct, while the direction and magnitude of convergence depend on the indicator, interval, and common-economy weighting. This distinction is consistent with the broader literature on extensive versus intensive margins (Allen et al., 2016; Peng et al., 2026).
The result complements Peng et al. (2026), who show that institutions and financial barriers shape different dimensions of inclusion; Cao et al. (2026), who document cross-country inequality in digital finance; and Hu et al. (2026), who demonstrate that coverage breadth and usage depth can have distinct economic implications. Our contribution is at the individual behavioral-use margin: once finance becomes digitally available, merchant-payment use is patterned by capability, device security, education, income, and place. Consequently, headline account-ownership targets may increasingly overstate practical inclusion if they are not paired with measures of active use.
5.2. Connectivity, Messaging Capability, and Secure Device Control
The results suggest that an infrastructure-only view of digital–financial inclusion is incomplete. Connectivity is strongly associated with merchant-payment use, but its explanatory contribution is incomplete. Basic messaging capability adds substantial information after smartphone and internet access are controlled, consistent with evidence that skills determine whether users can translate access into outcomes (Lythreatis et al., 2022) and with findings that financial literacy is particularly relevant for service use (Grohmann et al., 2018). Recent evidence on digital–financial literacy similarly links knowledge and skills to the use and benefits of digital–financial services (Ferilli et al., 2024; Pak et al., 2026).
The operationalization of secure device control provides a useful cross-country behavioral measure: a phone protected by a lock and credentials the respondent can change without help. In the adjusted 2024 model, it is associated with an 8.3-percentage-point higher predicted probability of merchant-payment use. This measure is also especially vulnerable to reverse causality and selection: people who already use payments may adopt locking practices, and those with more digital experience may both secure their devices and transact. Its association should not be described as the effect of a security intervention. The similarity of lock-only and composite estimates also warrants separating locking from autonomous credential management before claiming the latter provides incremental evidence.
5.3. Structural Inequality Remains After Conditioning on Digital Characteristics
The largest remaining divide is educational. Even in the fully adjusted model, tertiary education corresponds to a predicted merchant-payment probability about 20 points higher than primary education or less. The income gradient is also monotonic and substantial. These results imply that digital finance does not mechanically decouple financial participation from accumulated human and economic capital. Rather, it can reproduce advantages through differences in skills, device quality, confidence, opportunity, and merchant environments.
This persistence is consistent with evidence from other financial-access domains showing that expanded formal access can coexist with selective inclusion and socioeconomic exclusion when eligibility and resource constraints remain unevenly distributed (Castro Hernández et al., 2026).
Rural disadvantage is smaller than the education and income gaps but unusually stable across regional sensitivity analyses. This is consistent with the continued importance of acceptance infrastructure and local market ecosystems. By contrast, the adjusted gender gap is smaller and less geographically stable. This does not imply that gender is unimportant; the historical gender gap in account ownership remains visible, and the security interaction is stronger for women. Instead, the results suggest that a considerable portion of the contemporary gender difference in merchant payment overlaps with measured digital and socioeconomic resources.
5.4. International and Policy Implications
The results motivate testable policy priorities rather than identified intervention effects. Connectivity programs can measure actual transaction uptake alongside coverage; digital-skills programs can include basic messaging, authentication, and fraud recognition; providers can evaluate accessible credential recovery and secure default settings; and payment-system authorities can test merchant-acceptance incentives, particularly in underserved areas. These measures should be evaluated prospectively because cross-sectional Findex associations do not estimate program impacts.
The LAC heterogeneity result is particularly relevant for the region’s rapidly expanding digital-finance ecosystem. The security association is materially larger in LAC, while the internet and capability interactions are not distinguishable from other regions. This pattern is exploratory, but it suggests that improving perceived and practical control over devices may be especially consequential where digital-payment ecosystems are growing amid high fraud awareness and uneven trust. The result warrants dedicated regional research rather than a universal policy claim.
The opportunity–risk tension also argues against evaluating digital inclusion solely by uptake. Fraud exposure is more common among digitally active users, and exposure is associated with distrust among cash-only consumers. Expansion and protection therefore need to advance together. A system that rapidly increases transaction opportunities without improving user security may generate adoption and distrust simultaneously.
5.5. Limitations and Future Research
Several limitations constrain interpretation. Observations are cross-sectional, with reverse causality and residual confounding especially plausible for device security. The analysis conditions on phone ownership and complete responses to a module available in 74 economies; it does not represent all adults or the entire Findex country universe. The primary merchant outcome includes in-store card payments; a separately routed online-purchase sensitivity provides a narrower behavioral test but has its own selection restrictions. The online survey item asks about usual payment mode and is not transaction-level validation. Standardized model contrasts, and changes across nested logits are noncausal. Within-economy survey weights do not automatically produce a world-population estimand. Historical economy-resampling intervals omit each source survey’s design uncertainty. The interpretation of auxiliary outcomes is restricted to measures with transparent coding and verified eligible samples.
Basic messaging capability is a narrow, two-task proxy rather than a validated financial-literacy scale; its meaning may differ across settings. Phone locking and credential autonomy may proxy prior payment use or unobserved proficiency. Economy fixed effects do not identify subnational merchant acceptance, transaction costs, consumer protection, or local infrastructure. Further longitudinal and experimental research is needed to test causal mechanisms.
6. Conclusions
Global financial inclusion is entering a new phase. The first phase was dominated by the extensive margin: whether adults could obtain an account. On that dimension, progress has been substantial, and several traditional gaps have narrowed. The next phase is more demanding: whether people can translate connectivity into safe, routine, economically meaningful use.
Global Findex evidence distinguishes account access from observed use. Among 62,480 phone owners across 74 economies, connectivity, basic messaging capability, and secure device control are positively associated with digital merchant-payment use. Both a three-state analysis and a 1999-repetition economy bootstrap identify an additional, noncausal association for autonomous credential management. Narrower online-payment definitions and weighting sensitivities support the key internet, messaging, and security findings, while smartphone significance is weaker in online models. Historical differences in gap trajectories are heterogeneous; claims of universal access convergence versus use stratification are not warranted. The results support future measurement and evaluation separating access, payment behavior, device security, and financial well-being.
Supplementary Materials
The following supporting information can be downloaded at: https://www.mdpi.com/article/10.3390/jrfm19100817/s1. Revised Tables S1–S12 document selection, constructs, security contrasts, bootstrap uncertainty, questionnaire routing, model sensitivities, interactions, historical panels, and the complete online S0–S3 sensitivity. The machine-readable replication archive includes all 16 Stage 2H model summaries and coefficient estimates; original raw microdata are not redistributed.
Author Contributions
Conceptualization, C.A.E.M., C.R.E. and I.C.A.L.; methodology, C.A.E.M. and C.R.M.A.; software, C.A.E.M. and C.R.M.A.; validation, C.R.E., C.R.M.A. and I.C.A.L.; formal analysis, C.A.E.M.; investigation, I.C.A.L.; data curation, C.A.E.M.; writing—original draft preparation, C.A.E.M.; writing—review and editing, C.A.E.M., C.R.E., C.R.M.A. and I.C.A.L.; visualization, C.A.E.M.; supervision, C.R.E.; project administration, C.A.E.M. All authors have read and agreed to the published version of the manuscript.
Funding
This research received no external funding.
Institutional Review Board Statement
Not applicable.
Informed Consent Statement
Not applicable.
Data Availability Statement
The underlying Global Findex data are publicly available through the World Bank Global Findex Database and Microdata Library. The analytical R code, variable-construction documentation, and machine-readable output tables used to reproduce the reported results are supplied as supplementary replication materials with this submission. The raw Global Findex microdata are not redistributed.
Acknowledgments
The authors acknowledge the World Bank Global Findex team for making the Global Findex data and documentation publicly available.
Conflicts of Interest
The authors declare no conflicts of interest.
References
- Afzal, M., Meraj, M., Kaur, M., & Ansari, M. S. (2025). How does cybersecurity awareness help in achieving digital financial inclusion in rural India under escalating cyber fraud scenario? Journal of Cyber Security Technology, 9(2), 88–126. [Google Scholar] [CrossRef] [Scilit]
- Allen, F., Demirgüç-Kunt, A., Klapper, L., & Martinez Peria, M. S. (2016). The foundations of financial inclusion: Understanding ownership and use of formal accounts. Journal of Financial Intermediation, 27, 1–30. [Google Scholar] [CrossRef] [Scilit]
- Aron, J. (2018). Mobile money and the economy: A review of the evidence. World Bank Research Observer, 33(2), 135–188. [Google Scholar] [CrossRef] [Scilit]
- Cameron, A. C., & Miller, D. L. (2015). A practitioner’s guide to cluster-robust inference. Journal of Human Resources, 50(2), 317–372. [Google Scholar] [CrossRef] [Scilit]
- Cao, H., Shen, Y., & Zheng, A. (2026). Digital finance, economic development, and global inequality: A decomposition approach. Research in International Business and Finance, 90, 103532. [Google Scholar] [CrossRef] [Scilit]
- Castro Hernández, J. E., Rodríguez Cruz, S., & Echeverría Mayorga, C. A. (2026). Frontiers of housing financialization in El Salvador: State, mortgage credit and residential exclusion. Frontiers in Sustainable Cities, 8, 1850950. [Google Scholar] [CrossRef] [Scilit]
- Demirgüç-Kunt, A., Klapper, L., Singer, D., & Ansar, S. (2022). The global findex database 2021: Financial inclusion, digital payments, and resilience in the age of COVID-19. World Bank. [Google Scholar] [CrossRef] [Scilit]
- Demirgüç-Kunt, A., Klapper, L., Singer, D., Ansar, S., & Hess, J. (2018). The global findex database 2017: Measuring financial inclusion and the fintech revolution. World Bank. [Google Scholar] [CrossRef] [Scilit]
- Ferilli, G. B., Palmieri, E., Miani, S., & Stefanelli, V. (2024). The impact of FinTech innovation on digital financial literacy in Europe: Insights from the banking industry. Research in International Business and Finance, 69, 102218. [Google Scholar] [CrossRef] [Scilit]
- Grohmann, A., Klühs, T., & Menkhoff, L. (2018). Does financial literacy improve financial inclusion? Cross-country evidence. World Development, 111, 84–96. [Google Scholar] [CrossRef] [Scilit]
- Hu, S., Xiang, W., & Wan, Y. (2026). Digital financial inclusion and economic growth: Multi-dimensional evidence from coverage, depth, and digitisation. Journal of Risk and Financial Management, 19(4), 284. [Google Scholar] [CrossRef] [Scilit]
- Jack, W., & Suri, T. (2014). Risk sharing and transactions costs: Evidence from Kenya’s mobile money revolution. American Economic Review, 104(1), 183–223. [Google Scholar] [CrossRef] [Scilit]
- Jafri, J. A., Mohd Amin, S. I., Abdul Rahman, A., & Mohd Nor, S. (2024). A systematic literature review of the role of trust and security on FinTech adoption in banking. Heliyon, 10(1), e22980. [Google Scholar] [CrossRef] [Scilit] [PubMed]
- Jagrič, V., Tominc, P., & Rožman, M. (2026). Explaining behavioral intention and actual use of digital payment systems: A structural equation modeling approach among university students. Journal of Risk and Financial Management, 19(8), 556. [Google Scholar] [CrossRef] [Scilit]
- Klapper, L., Singer, D., Starita, L., & Norris, A. (2025). The global findex database 2025: Connectivity and financial inclusion in the digital economy. World Bank. [Google Scholar] [CrossRef] [Scilit]
- Lythreatis, S., Singh, S. K., & El-Kassar, A.-N. (2022). The digital divide: A review and future research agenda. Technological Forecasting and Social Change, 175, 121359. [Google Scholar] [CrossRef] [Scilit]
- Pak, T.-Y., Chatterjee, S., & Choung, Y. (2026). Navigating digital finance: How digital financial literacy influences digital financial services use and benefits in Korea. Financial Innovation, 12, 42. [Google Scholar] [CrossRef] [Scilit]
- Peng, Y., Hermes, N., & Lensink, R. (2026). Formal institutions and financial inclusion: Evidence from cross-country analysis. Research in International Business and Finance, 87, 103407. [Google Scholar] [CrossRef] [Scilit]
- Shaikh, A. A., & Karjaluoto, H. (2015). Mobile banking adoption: A literature review. Telematics and Informatics, 32(1), 129–142. [Google Scholar] [CrossRef] [Scilit]
- Suri, T., & Jack, W. (2016). The long-run poverty and gender impacts of mobile money. Science, 354(6317), 1288–1292. [Google Scholar] [CrossRef] [Scilit] [PubMed]
- Trotta, A., Gallucci, C., Rania, F., Strano, E., & Tipaldi, R. (2026). The ‘black box’ of digital finance: An umbrella review of the challenges and drawbacks in advancing financial inclusion. Research in International Business and Finance, 81, 103188. [Google Scholar] [CrossRef] [Scilit]
- van Deursen, A. J. A. M., & Helsper, E. J. (2015). The third-level digital divide: Who benefits most from being online? In L. Robinson, S. R. Cotten, & J. Schulz (Eds.), Communication and information technologies annual (pp. 29–52). Emerald. [Google Scholar] [CrossRef] [Scilit]
- World Bank. (2025). The global findex database 2025: Data download and documentation. World Bank. Available online: https://www.worldbank.org/en/publication/globalfindex/download-data (accessed on 3 September 2026).

Disclaimer/Publisher’s Note: The statements, opinions and data contained in all publications are solely those of the individual author(s) and contributor(s) and not of MDPI and/or the editor(s). MDPI and/or the editor(s) disclaim responsibility for any injury to people or property resulting from any ideas, methods, instructions or products referred to in the content. |
© 2026 by the authors. Licensee MDPI, Basel, Switzerland. This article is an open access article distributed under the terms and conditions of the Creative Commons Attribution (CC BY) license.