


Abstract
The supervision of inclusive financial institutions in emerging economies represents a critical challenge for financial stability. While cooperatives and mutualists are pillars of financial inclusion, there is a lack of explainable early warning models adapted to their structural risk profiles. This study evaluates an explainable machine learning framework for early supervision, utilizing a longitudinal dataset covering 584 unique financial institutions (cooperatives and mutualists) with 24,232 monthly observations across the 2018–2024 predictor observation window (yielding 17,799 healthy transition candidate observations and 74 evaluated distress episodes: 68 in the training set and 6 in the out-of-time validation set). Adhering to ISO/IEC 25012 data quality standards and a six-month forecast horizon (T + 6), the performance of an XGBoost-based model was evaluated against traditional logistic regression benchmarks. Given the extreme class imbalance (0.1556% event rate in the out-of-time test set), model utility was assessed primarily through the precision–recall AUC (PR-AUC). The results demonstrate that XGBoost achieved a higher PR-AUC point estimate (0.2466) than the logistic regression benchmark (0.0931) in the 2024 out-of-time validation sample. The use of SHAP explainability revealed distinct risk drivers for cooperatives and mutualists, providing exploratory support for segmented supervisory monitoring. This study proposes an interpretable decision support framework that enables proactive, risk-based prioritization in a dollarized emerging economy.
1. Introduction
The Popular and Solidarity Financial Sector (SFPS) represents a critical pillar of financial inclusion and social stability in Ecuador’s dollarized economy. Comprising a diverse array of entities, from large cooperatives comparable to commercial banks to small communal funds, the SFPS facilitates access to credit for marginalized populations and micro-enterprises. However, this heterogeneity poses significant challenges for uniform and effective supervision. Traditional early warning systems (EWSs) employed by regulators have historically relied on linear econometric models and static CAMEL ratios (Capital, Assets, Management, Earnings, Liquidity), which are often reactive and fail to capture the complex, non-linear dynamics that characterize financial distress in volatile emerging markets. The urgency for robust predictive tools is further highlighted by recent global events, such as the collapse of the Silicon Valley Bank (SVB), which demonstrated how rapid liquidity shifts can overwhelm traditional supervisory snapshots (Bacon et al., 2024). Furthermore, the increasing frequency of climate-induced and exogenous shocks underscores the need for systemic resilience frameworks that can anticipate multi-faceted risks.
The necessity for more sophisticated predictive tools is amplified by the unique constraints of dollarization, where the absence of a lender of last resort places a premium on preventive supervisory mechanisms, which could potentially inform macroprudential oversight when institution-level signals are aggregated (Jácome, 2004). Recent research has highlighted the potential of machine learning (ML) to enhance the predictive accuracy of EWSs by identifying subtle interactions among financial indicators that traditional models overlook (Purnell et al., 2024). Beyond insolvency, ML frameworks are also being increasingly deployed for detecting complex patterns in financial statement fraud and operational risks (Petratos et al., 2025). Despite these advancements, a gap remains between high-performance “black-box” models and the practical needs of supervisors who require interpretable signals to justify regulatory interventions (Wang et al., 2025). The “performance-interpretability trade-off” has been a central debate in FinTech regulation (Kruschel et al., 2024). While deep learning and ensemble methods offer improved point-estimate performance, their opacity poses legal and operational risks (Fritz-Morgenthal et al., 2022). Recent frameworks propose “trustworthy AI” approaches that mandate post hoc explainability as a prerequisite for deployment in high-stakes environments like banking supervision (Basel Committee on Banking Supervision, 2017; Perez-Cruz et al., 2025).
1.1. Literature Review
Practitioners and regulators must interpret these results and practical proposals (such as the risk-based supervision matrix and segmented regulatory concepts) strictly as exploratory decision support tools, given the small-sample caveat (74 independent distress episodes, with only 6 in the out-of-time validation set) inherent to well-capitalized financial sectors.
In the context of cooperative and solidarity finance, the literature emphasizes the importance of governance and social mission alongside financial stability (K. A. Carrera-Silva, 2024). Beyond traditional metrics, the “social balance” provides a standardized framework to evaluate how credit unions fulfill their cooperative principles, serving as a critical indicator of institutional identity and member-based resilience (K. A. Carrera-Silva, 2024). Recent empirical evidence from Ecuador supports this link, demonstrating that repayment performance depends significantly on internal cohesion and accumulated savings, proving that the stability of solidarity assets is tied to the behavioral attributes behind them (López-Sánchez et al., 2021). Furthermore, initiatives such as financial education programs—specifically documented in networks like UPROCACH—have emerged as effective tools for improving credit behavior and reducing the baseline probability of default among marginalized populations (K. A. Carrera-Silva et al., 2024). This qualitative dimension suggests that a truly effective EWS must eventually integrate social responsibility metrics to capture the full spectrum of risk and resilience in Latin American credit unions (K. Carrera-Silva et al., 2024).
Empirical studies specifically focused on the SFPS in dollarized economies remain scarce. Some authors argue that credit unions in emerging markets exhibit distinct risk transmission mechanisms compared to commercial banks, often characterized by higher persistence in delinquency and sensitivity to local economics (López-Sánchez et al., 2021; K. Carrera-Silva et al., 2024). Additionally, the impact of exogenous shocks, such as organized crime and energy vulnerability, has gained attention as a determinant of institutional resilience in Latin America (Detotto & Otranto, 2010; Khattak et al., 2023; Perez-Vincent et al., 2024).
The emergence of explainable AI (XAI) frameworks, such as SHAP (SHapley Additive exPlanations), has provided a bridge between model complexity and interpretability. By decomposing individual predictions into the contributions of each feature, XAI allows regulators to move from “what” is predicted to “why” it is predicted, facilitating the transition from risk signals to economic meaning. This is particularly relevant for the implementation of decision support systems (DSSs) in financial supervision, where transparency and accountability are paramount (Basel Committee on Banking Supervision, 2017; Yao et al., 2025).
1.2. Theoretical Background: Resilience in Solidarity Finance
The development of early warning systems (EWSs) for financial institutions has evolved through several distinct paradigms (Acharya et al., 2017; Altman, 1968; Ohlson, 1980; Shumway, 2001). Subsequent research integrated market-based indicators and structural models derived from option pricing theory (Leland, 1994; Merton, 1974), though these are often inapplicable to the non-traded solidarity financial sector (SFPS).
Unlike commercial banks that can issue external equity to absorb shocks, cooperatives rely entirely on retained earnings and member contributions. Consequently, capital erosion is often the terminal symptom of a much earlier, slow-moving crisis in member trust or common bond stability. Furthermore, treating the SFPS as a monolith ignores profound internal heterogeneity. Standard cooperatives, which primarily offer short-term unsecured consumer credit, face immediate delinquency risk. In contrast, mutualists specialize in long-term, illiquid housing finance. This structural difference challenges ‘one-size-fits-all’ Basel regulations and necessitates a segmented supervisory framework capable of identifying idiosyncratic risk signals as a primary defense against systemic contagion in dollarized contexts (Diamond & Dybvig, 1983; Emmons & Schmid, 1999; Holmstrom & Tirole, 1997; Jensen & Meckling, 1976; Kyle, 1985; Malkiel & Fama, 1970; McKillop et al., 2020; Modigliani & Miller, 1958; Myers, 1977; Stiglitz & Weiss, 1981).
The contemporary “algorithmic” era leverages the high dimensionality of regulatory reporting through machine learning (Petropoulos et al., 2022). However, as noted previously (Fritz-Morgenthal et al., 2022; Kruschel et al., 2024), the adoption of these models by regulators is contingent upon resolving the tension between predictive power and transparency (Fritz-Morgenthal et al., 2022; Kruschel et al., 2024). In dollarized contexts like Ecuador, where the monetary authority lacks an autonomous monetary policy and standard lender-of-last-resort facilities, the accuracy of idiosyncratic risk signals becomes the primary defense against systemic contagion (Basdekis et al., 2022; Jácome, 2004).
1.3. Research Hypotheses
Based on the theoretical background and the distinct structural characteristics of the solidarity financial sector, this study formally tests the following hypotheses:
H1.
In a rare-event prediction setting characterized by extreme class imbalance, a non-linear machine learning framework (XGBoost) that captures complex, multi-dimensional financial relationships achieves higher point-estimate performance than traditional linear econometric benchmarks in this rare-event validation setting in terms of Precision–Recall Area Under the Curve (PR-AUC) and Lift.
Exploratory Proposition 1. Due to differences in asset structure and business models, cooperative institutions and mutualists may exhibit distinct descriptive risk driver profiles. This proposition is examined through subgroup SHAP analysis and is not treated as a formally validated predictive hypothesis because the mutualist out-of-time test subsample contains no distress events.
To systematically address the structural differences between inclusive financial entities prior to empirical model estimation, Table 1 details the theoretically expected risk channels, transmission mechanisms, and candidate financial indicators mapped by institutional type.
Table 1.
Risk channels.
1.4. Objectives and Contribution
This paper addresses the gap between predictive power and supervisory usefulness in the SFPS of Ecuador. The primary objective is to develop an explainable machine learning EWS that not only achieves improved point-estimate performance but also provides actionable insights for regulators. This study contributes to the literature in three ways: 1. An XGBoost-based EWS is implemented, benchmarked against traditional logistic regression, utilizing a six-month forecast horizon (T + 6) to ensure operational lead time for interventions. 2. A mitigation strategy against target leakage is provided through a distress transition protocol and precision–recall metrics are reported to address data imbalance. 3. An exploratory heterogeneity analysis is conducted, suggesting how risk driver profiles may differ between cooperatives and mutualists, and an operational DSS framework for aggregated institution-level risk monitoring is proposed.
2. Methodology
To ensure academic rigor and operational reproducibility, the CRISP-DM (Cross-Industry Standard Process for Data Mining) framework was adopted, structured into six distinct phases (Wirth & Hipp, 2000).
2.1. Data Acquisition and Understanding
To ensure total empirical transparency and allow for exact reconstruction of the dataset, the sample construction and data purging workflow is structured as follows. The initial raw panel dataset compiled from official SEPS reporting over the longitudinal observation window across 584 financial institutions comprised 24,232 institution-month records. Sequential filtering was applied: (i) 6369 records were lost due to initial historical lag windowing (t − 1, t − 3, t − 6) and forward target alignment (T + 6), yielding a processed panel of 17,863 institution-month observations; (ii) 64 records corresponding to entities already in financial distress at baseline T were excluded to strictly enforce the distress transition protocol (modeling the transition from a healthy baseline state Y_T = 0 to distress Y_{T + 6} = 1). This yielded a final operational analytical sample of 17,799 healthy institution-month observations. In the walk-forward time-series partition, this sample was divided into a training set of 12,738 observations (July 2018–June 2023; 12,670 healthy and 68 distress transition episodes); a mandatory 6-month lead-time gap set of 1204 observations (July 2023–December 2023) to strictly prevent temporal target leakage under the T + 6 horizon; and an out-of-time testing set of 3857 observations (January–December 2024 predictor observations, with 6-month-ahead forward outcome evaluation over July 2024–June 2025 at T + 6; 3851 healthy and 6 distress transition episodes). Because the distress transition design retains only institution-months satisfying the healthy-at-baseline and complete-feature criteria, the six-month lead-time gap contains 1204 eligible institution-month observations, rather than the full universe of supervised institutions. The sum of these walk-forward subsets exactly reconciles the baseline pool: 12,738 + 1204 + 3857 = 17,799 observations.
The primary data source consisted of monthly regulatory financial statements (B11 structures) and granular portfolio reports (B12/C02 structures) provided by the Superintendencia de Economía Popular y Solidaria (SEPS) of Ecuador (https://estadisticas.seps.gob.ec/, accessed on 15 January 2025). The predictor dataset covers January 2018 to December 2024, with monthly financial statements from January 2025 to June 2025 used strictly to construct the six-month-ahead distress outcome labels (T + 6). A total of 24,232 initial monthly observations across 584 unique institutions were processed, yielding 17,863 feature-engineered observations and 17,799 healthy transition candidates after lag construction and target alignment. Raw account codes were mapped to a harmonized relational structure (ROLAP over Parquet), ensuring adherence to the official Catálogo Único de Cuentas (CUC).
2.2. Data Preparation and Quality (International Organization for Standardization, 2008)
Adhering to the ISO/IEC 25012 data quality standard, a multi-stage cleaning and profiling pipeline was implemented (Basel Committee on Banking Supervision, 2017; SEPS: Superintendencia de Economía Popular y Solidaria, 2024; Wirth & Hipp, 2000). Regulators require complete and logical accounts prior to feature engineering:
Finally, to eliminate tautological dependencies and reduce the risk of target leakage, all variables directly representing profitability (e.g., ROA, ROE, net margins) and capital adequacy (e.g., solvency ratios, capital buffers) were purged from the predictor feature space, ensuring that the model learns genuine predictive structural relationships rather than trivial mathematical identities.
Construction of Official Indicators
A total of 49 candidate variables were initially operationalized based on the official SEPS technical note (SEPS: Superintendencia de Economía Popular y Solidaria, 2024). To ensure methodological rigor and eliminate target leakage, a strict feature purging protocol was applied. Specifically, 6 variables were excluded: (i) the dependent target variable ‘distress state’ (T + 6); (ii) 3 constitutive target-defining ratios [Return on Assets (ROA), Return on Equity (ROE), and Accounting Capital Ratio (Equity/Total Assets)] to eliminate direct target leakage; (iii) the calendar artifact ‘year’ to prevent temporal overfitting; and (iv) Margin Absorption due to extreme collinearity and missingness. This yielded a final active predictor space of 43 features (comprising 12 core financial level ratios, 16 temporal lags at t − 1, t − 3, and t − 6, 10 derived volatility/delta ratios, 4 institutional segment dummies [Segment 2, Segment 3, Segment 4, and Segment 5, with Segment 1 serving as the baseline reference category], and 1 seasonal ‘month’ indicator). (see Appendix A, Table A1 for the complete predictor inventory).
- Delinquency (Morosidad):
These indicators provide a comprehensive view of the entity’s risk profile, spanning from credit risk to operational resilience (McKillop et al., 2020).
2.3. Modeling Strategy and Experimental Design
The early warning system was formulated as a binary classification task. An entity was defined as being in financial stress at horizon T + 6 if it met either of the following empirical conditions: (i) negative Return On Assets (ROA < 0, indicating operational insolvency and net operating losses), or (ii) severe capital depletion. Specifically, the capital-based distress criterion is operationalized as an accounting capital buffer threshold, defined as Equity/Total Assets < 0.09. This measure is used as an empirical supervisory risk proxy rather than as a formal risk-weighted regulatory capital adequacy ratio. To prevent mechanical tautologies and target leakage, ROA, ROE, and the accounting capital buffer ratio (operationalized in reporting data under the field names ratio_capital and ind_solvencia, both defined as Equity/Total Assets) were strictly excluded from the predictor space X_T, ensuring that the model learns genuine structural lead indicators rather than contemporaneous accounting identities.
2.3.1. Forecast Horizon (T + 6)
To address the ‘triviality’ critique of short-term nowcasting, the forecast horizon was set to six months (T + 6) (Beutel et al., 2019; Petropoulos et al., 2022). This strategic window provides sufficient lead time for regulators to request a corrective action plan prior to formal capital depletion. While financial ratios exhibit high persistence, the model aimed to capture the structural deterioration that precedes a terminal breach of the empirical distress criteria (Basel Committee on Banking Supervision, 2017; Perez-Cruz et al., 2025).
2.3.2. Algorithms and Validation
Primary Model: XGBoost (eXtreme Gradient Boosting), chosen for its ability to capture non-linearities and handle imbalanced data via the scale_pos_weight parameter (Chen & Guestrin, 2016; Gunnarsson et al., 2021). XGBoost is a widely used algorithm for tabular data in financial modeling. While the seasonal indicator ‘month’ is included to account for intra-year liquidity cycles (such as March tax drains and December lending spikes), the chronological indicator ‘year’ is strictly excluded from the predictor space to prevent the model from learning spurious temporal trends or overfitting to period proximity. To verify that predictive power stems from fundamental financial signals rather than temporal artifacts, a Calendar Feature Ablation Test was performed. Eliminating all calendar variables (both month and year) resulted in a virtually identical PR-AUC of 0.2452 (vs. 0.2466 in the baseline model), confirming that the framework’s predictive utility is anchored entirely in financial fundamentals.
Benchmark: Logistic Regression (Logit), representing the traditional econometric approach widely used in regulatory stress testing (Basel Committee on Banking Supervision, 2017; Price & Counsel, 2020).
Methodologically, the temporal dataset is structured into two distinct operational windows: (i) Predictor Observation Window (X_T): January 2018–December 2024, containing all baseline financial ratios, historical lags (t − 1, t − 3, t − 6), and derived features; and (ii) Outcome-Label Construction Window (Y_{T + 6}): July 2018–June 2025. The inclusion of data through June 2025 is strictly restricted to evaluating the forward T + 6 distress state for features observed up to December 2024, ensuring that no 2025 feature values enter the predictor space, thereby completely preventing look-ahead leakage. Historical trend figures (Figure 1, Figure 2 and Figure 3) depict the full descriptive balance sheet series through 2025 for contextual monitoring.
Validation and Statistical Inference: TimeSeriesSplit (walk-forward validation) was utilized to prevent temporal leakage and look-ahead bias (Petropoulos et al., 2022). To strictly enforce this, a mandatory six-month gap was introduced between the training and validation sets to reflect the T + 6 forecast horizon. Because the distress transition design retains only institution-months satisfying the healthy-at-baseline and complete-feature criteria, the six-month lead-time gap contains 1204 eligible institution-month observations, rather than the full universe of supervised institutions. To quantify estimation uncertainty under panel dependencies, 95% empirical confidence intervals for PR-AUC and ROC-AUC were constructed using a non-parametric clustered block bootstrap procedure (B = 1000 replications). Rather than resampling individual institution-month records independently (which would violate the longitudinal independence assumption due to within-institution panel autocorrelation), the resampling unit was defined at the financial institution level (clustered by entity RUC). In each bootstrap iteration b ∈ {1, …, 1000}, a pseudo-sample of institutions was drawn with replacement from the out-of-time test pool, retaining the full monthly time-series trajectory for each selected entity. The precision–recall curve and PR-AUC were re-estimated across the resampled pool. The 95% confidence intervals were obtained empirically from the 2.5th and 97.5th percentiles of the resulting bootstrap distribution ([0.0652, 0.7040] for XGBoost vs. [0.0271, 0.1916] for Logit). Because the validation set contains 6 observed distress transitions under severe class imbalance (test prevalence p_test = 0.0015556), the resulting empirical intervals are wide and overlapping. Consequently, the empirical findings are interpreted strictly as evidence of higher point-estimate performance rather than asymptotic statistical dominance.
2.3.3. Hyperparameter Tuning and Benchmark Specification
To ensure a robust, leakage-free evaluation, model hyperparameters were tuned using a temporal rolling-window cross-validation strategy on the historical training set (2018–2022). For the champion XGBoost model, tree depth (max_depth = 4), learning rate (eta = 0.03), class imbalance weighting (scale_pos_weight = 15.0), and feature/sample subsampling rates (subsample = 0.8, colsample_bytree = 0.8) were optimized to prevent overfitting to extreme class imbalance while maintaining sensitivity to rare distress transitions. Raw predicted probability scores are converted into percentile-based risk scores to rank institutions according to relative transition risk. The primary benchmark model is a Standard Logistic Regression (Logit) with L2 regularization (C = 1.0), representing traditional regulatory early warning standards. Table 2 details the model’s specifications and hyperparameter settings for the evaluated algorithms.
Table 2.
Benchmark models and hyperparameter settings.
2.3.4. Uncertainty Estimation: Clustered Block Bootstrap for PR-AUC Confidence Intervals
To quantify estimation uncertainty under longitudinal panel dependencies, 95% empirical confidence intervals for the primary evaluation metric (PR-AUC) and the ROC-AUC benchmark were constructed using a non-parametric clustered block bootstrap procedure (B = 1000 replications):
- Resampling Unit and Panel Clustering: Rather than resampling individual institution-month records independently (which would violate the longitudinal independence assumption due to within-institution panel autocorrelation), the resampling unit is strictly defined at the financial institution level (clustered by entity RUC).
- Block Resampling Mechanism: In each bootstrap iteration b in {1, …, 1000}, a pseudo-sample of N = 485 active institutions is drawn with replacement from the out-of-time test pool. For each sampled entity, its entire longitudinal time series of monthly predictor vectors and forward outcome labels is retained intact.
- Interval Construction Method: The precision–recall curve and PR-AUC are re-estimated across each pseudo-sample. The 95% empirical confidence intervals are computed directly from the 2.5th and 97.5th percentiles of the resulting 1000 bootstrap estimates ([0.0652, 0.7040] for XGBoost vs. [0.0271, 0.1916] for Logit).
- Methodological Interpretation: Because the out-of-time validation set contains 6 observed distress transition events under extreme class imbalance (test prevalence p_test = 0.0015556), the resulting empirical intervals are wide and overlapping. Consequently, the empirical findings are interpreted strictly as evidence of higher point-estimate performance rather than claims of asymptotic statistical dominance.
2.4. Explainability (XAI)
SHAP (SHapley Additive exPlanations) values were integrated to decompose model predictions. This framework, grounded in cooperative game theory, ensures that feature attributions are consistent and locally accurate (Lundberg & Lee, 2017). This allows the supervisor to move beyond a single risk score and understand which specific financial ratios are driving the alert for each entity (Fritz-Morgenthal et al., 2022).
2.5. Software and Reproducibility
To guarantee the full computational reproducibility of the empirical findings, the entire modeling pipeline was executed within a unified Python environment (version 3.12). Core data engineering, Extract–Transform–Load (ETL) routines, and high-performance Parquet file management were conducted using Pandas (version 2.2.0) and PyArrow (version 15.0.0). Feature standardization, implementation of the regularized logistic regression benchmark, and validation of performance metrics were executed using Scikit-Learn (version 1.4.0). The primary non-linear early warning system was estimated via XGBoost (version 2.0.3) to optimize gradient-boosted decision trees under severe class imbalance, while local and global Shapley additive explanations were computed using the SHAP framework (version 0.44.1).
Regarding data access and transparency, a clear distinction is established between raw supervisory inputs and replication materials. First, raw monthly regulatory financial statements (B11 structures) and granular credit portfolio reports (B12/C02 structures) are freely accessible through the public open-data portal of the Superintendencia de Economía Popular y Solidaria (SEPS) of Ecuador (https://estadisticas.seps.gob.ec/). Second, to protect entity confidentiality while enabling scientific verification, the fully processed longitudinal panel dataset, the anonymized predictor feature space, Python replication scripts, and trained model weights are available from the corresponding author upon reasonable request.
3. Results
3.1. Descriptive Analysis and Stylized Facts
The SFPS in Ecuador exhibits structural heterogeneity that significantly influences risk profiles. Table 3 summarizes the core financial indicators by segment. It is observed that larger entities (Segment 1) operate with thinner capital buffers but a significantly higher ROE, whereas smaller entities (Segments 4 and 5) maintain higher solvency ratios as a precautionary measure against idiosyncratic shocks.
Table 3.
Descriptive statistics by financial segment.
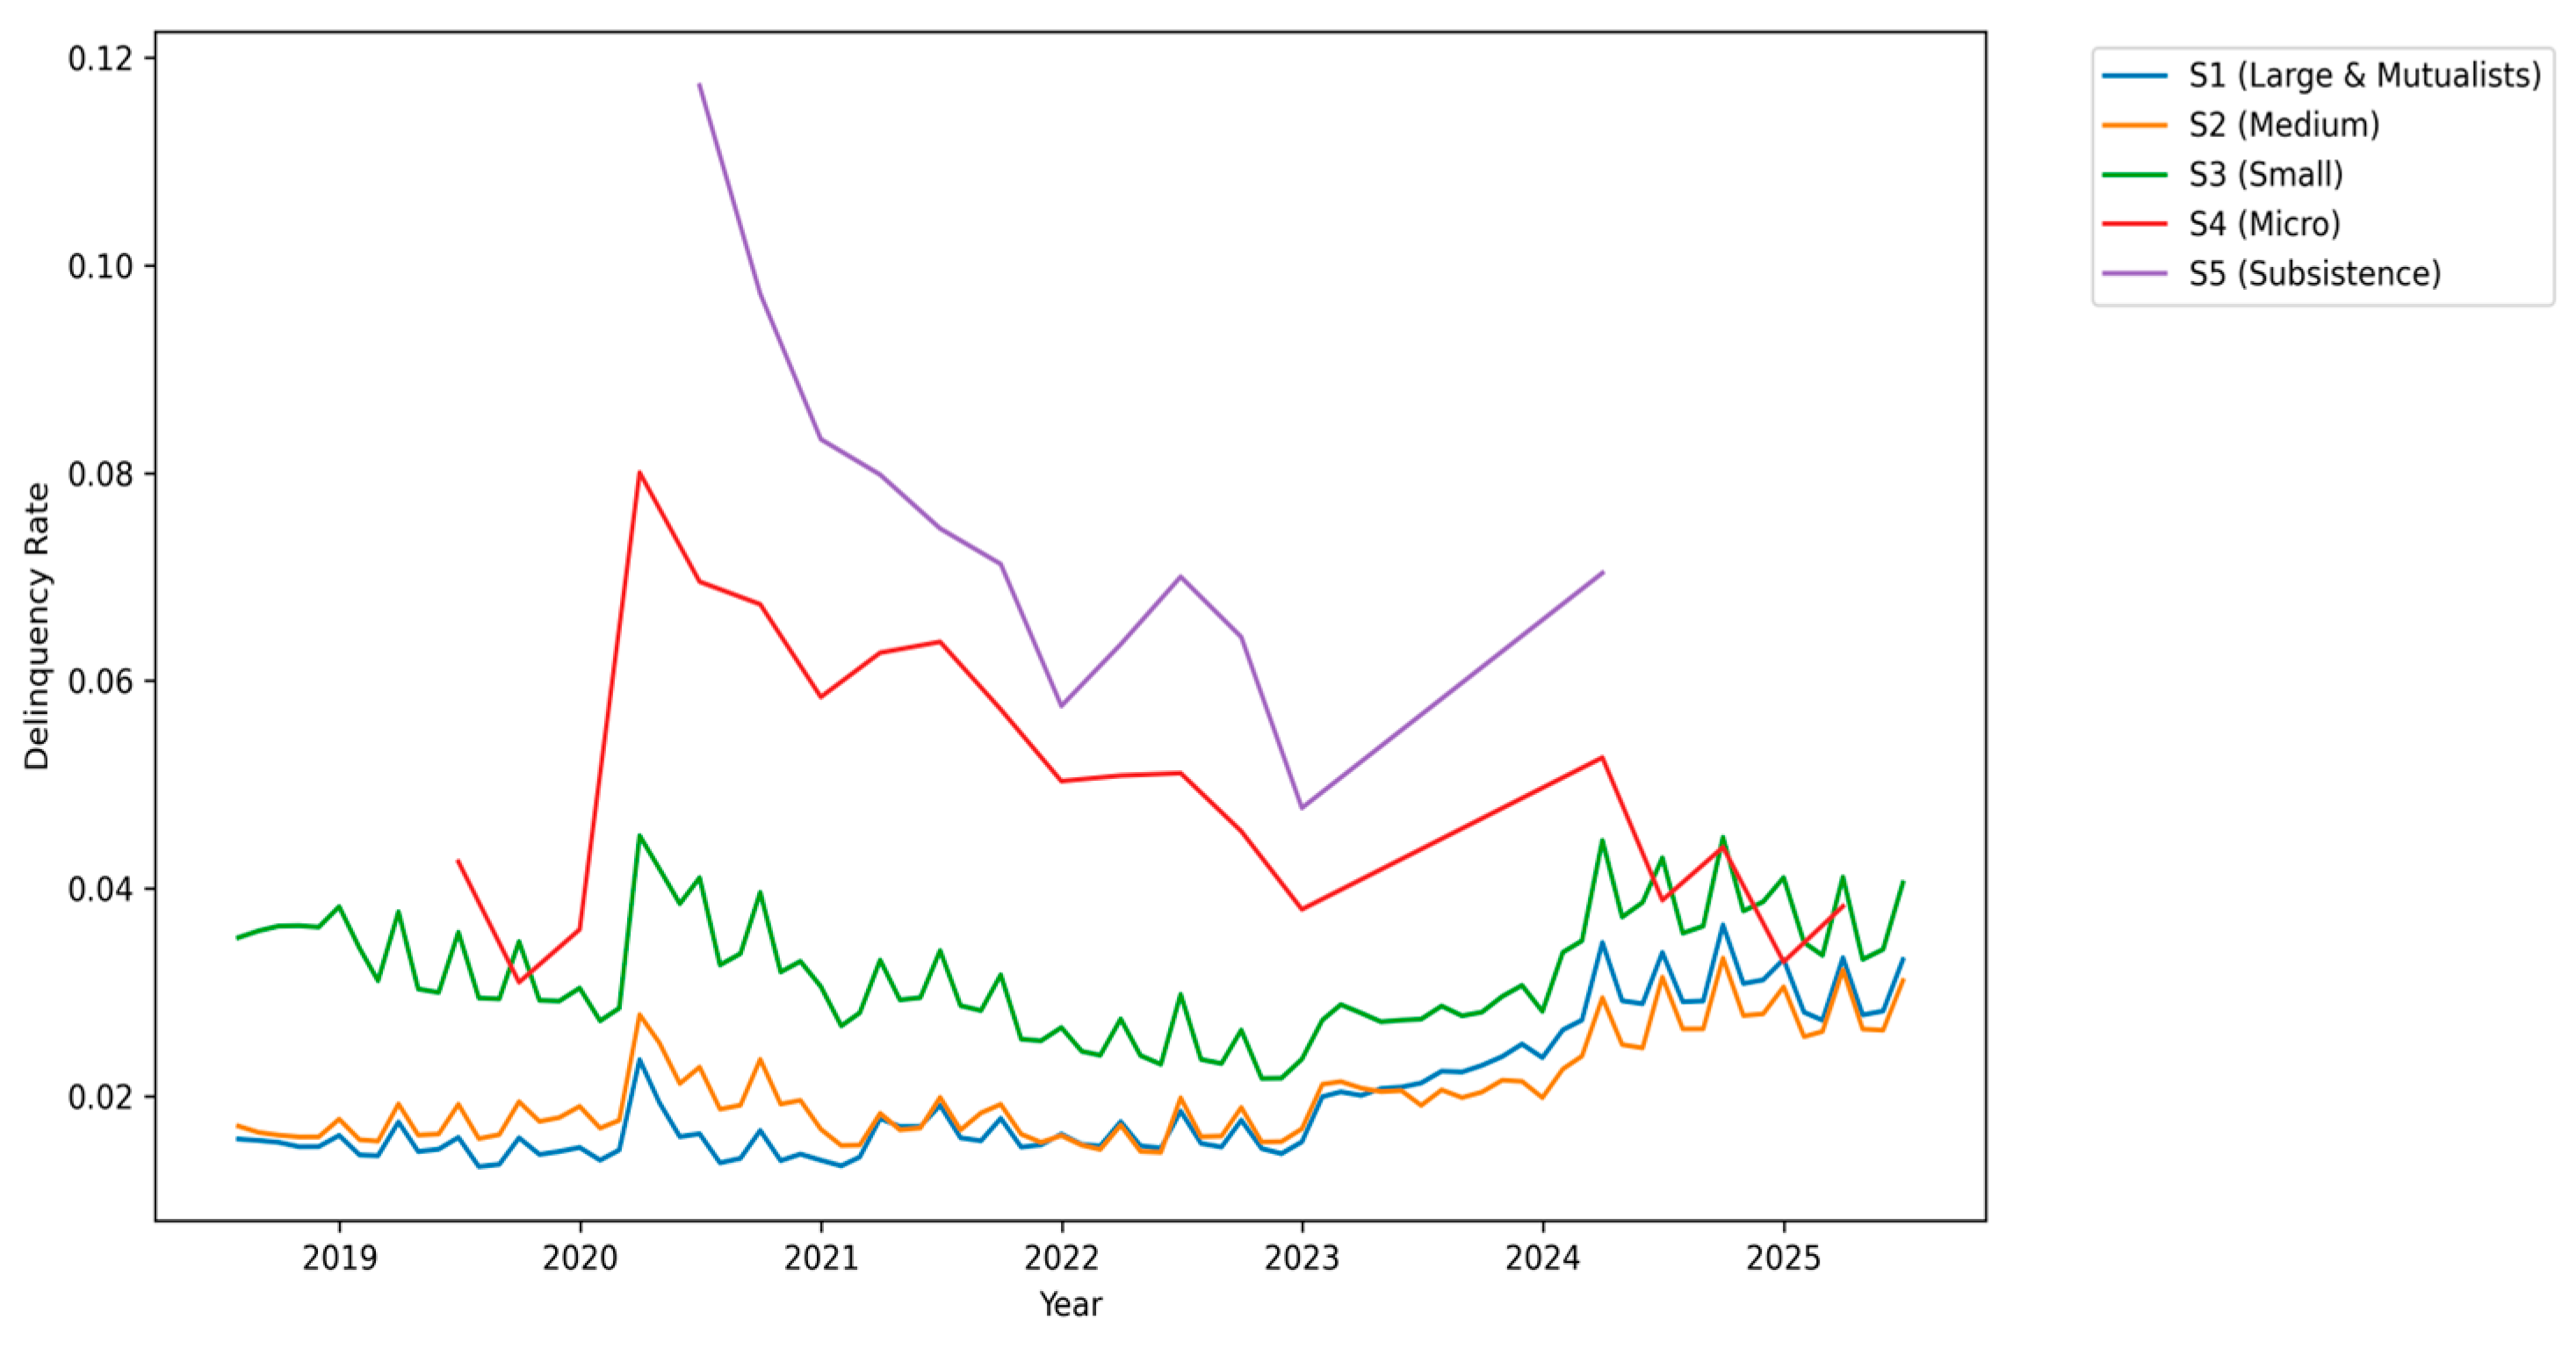
The historical evolution of these indicators reveals critical stylized facts. As shown in Figure 1, the delinquency rate remained relatively stable until early 2023, after which a systematic upward trend was observed across all segments. This structural break likely reflects the deterioration of the macroeconomic environment and security situation in Ecuador, affecting repayment capacity across the board (Basdekis et al., 2022).
Figure 1.
The historical trend of delinquency rate by financial segment (2018–2025). Note: Based on longitudinal monthly data covering 584 unique financial institutions (24,232 total institution-month observations). Aggregation method: Monthly median values per segment (S1–S5).
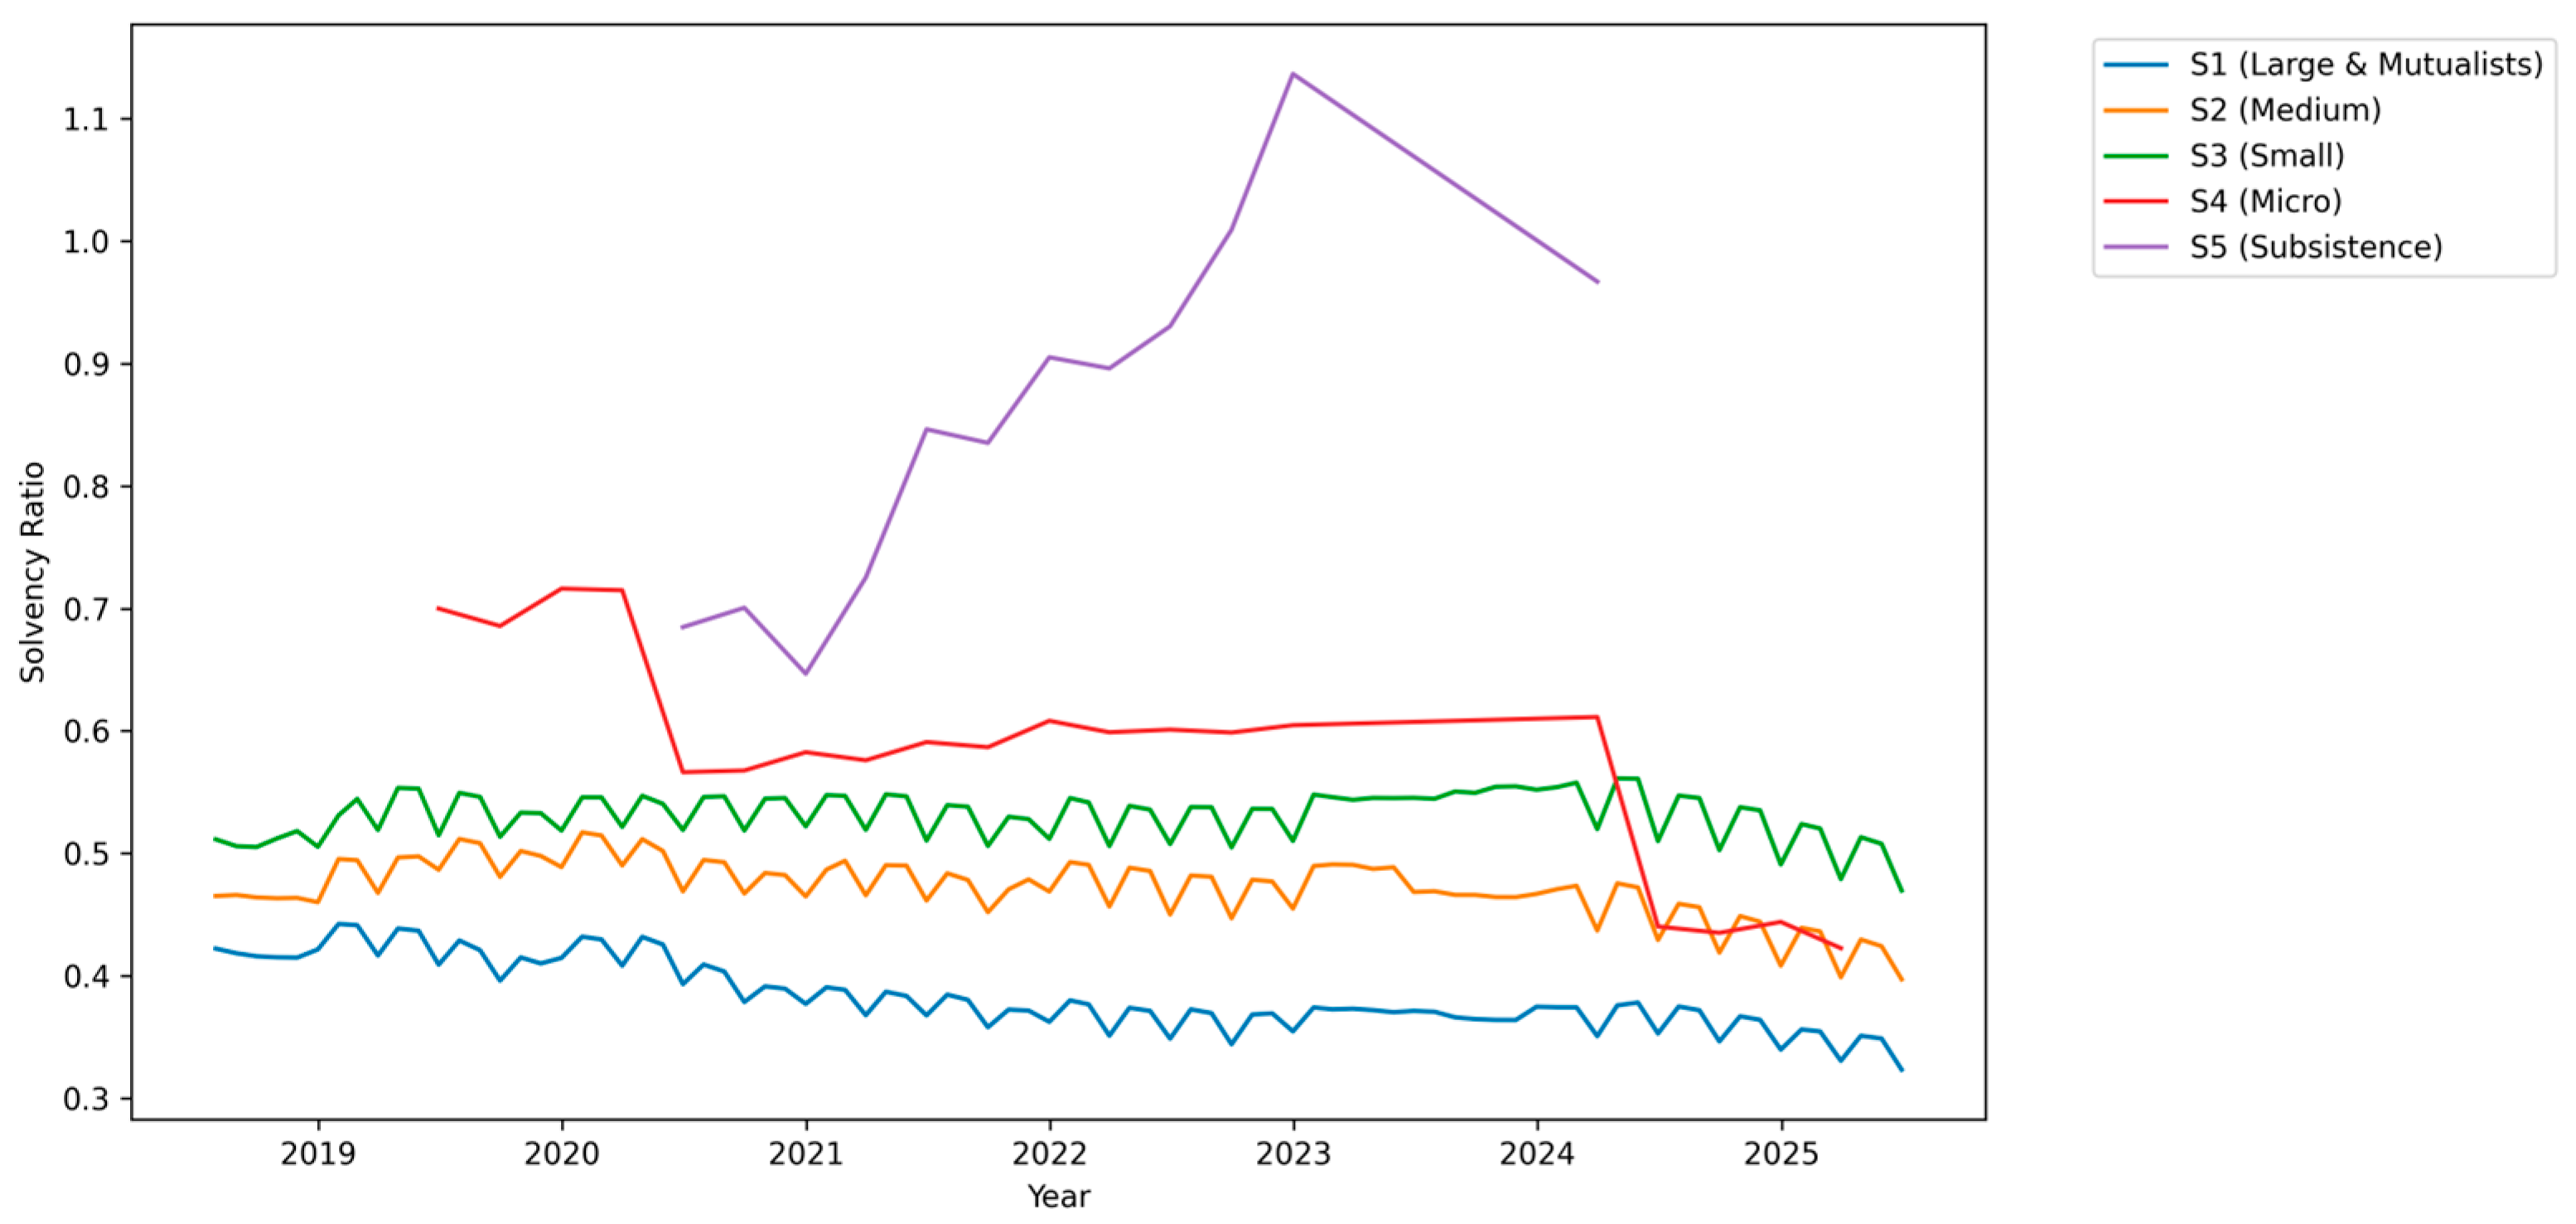
Correspondingly, the solvency ratio (Figure 2) showed a differentiated pattern. While large cooperatives maintained stable leverage, smaller segments showed higher volatility. The gradual erosion of capital buffers in Segment 1 was identified as a warning signal, given their systemic importance (Acharya et al., 2017; Basel Committee on Banking Supervision, 2017).
Figure 2.
The historical trend of solvency ratio by financial segment (2018–2025). Note: Based on longitudinal monthly data covering 584 unique financial institutions (24,232 total institution-month observations). Aggregation method: Monthly median values per segment (S1–S5).
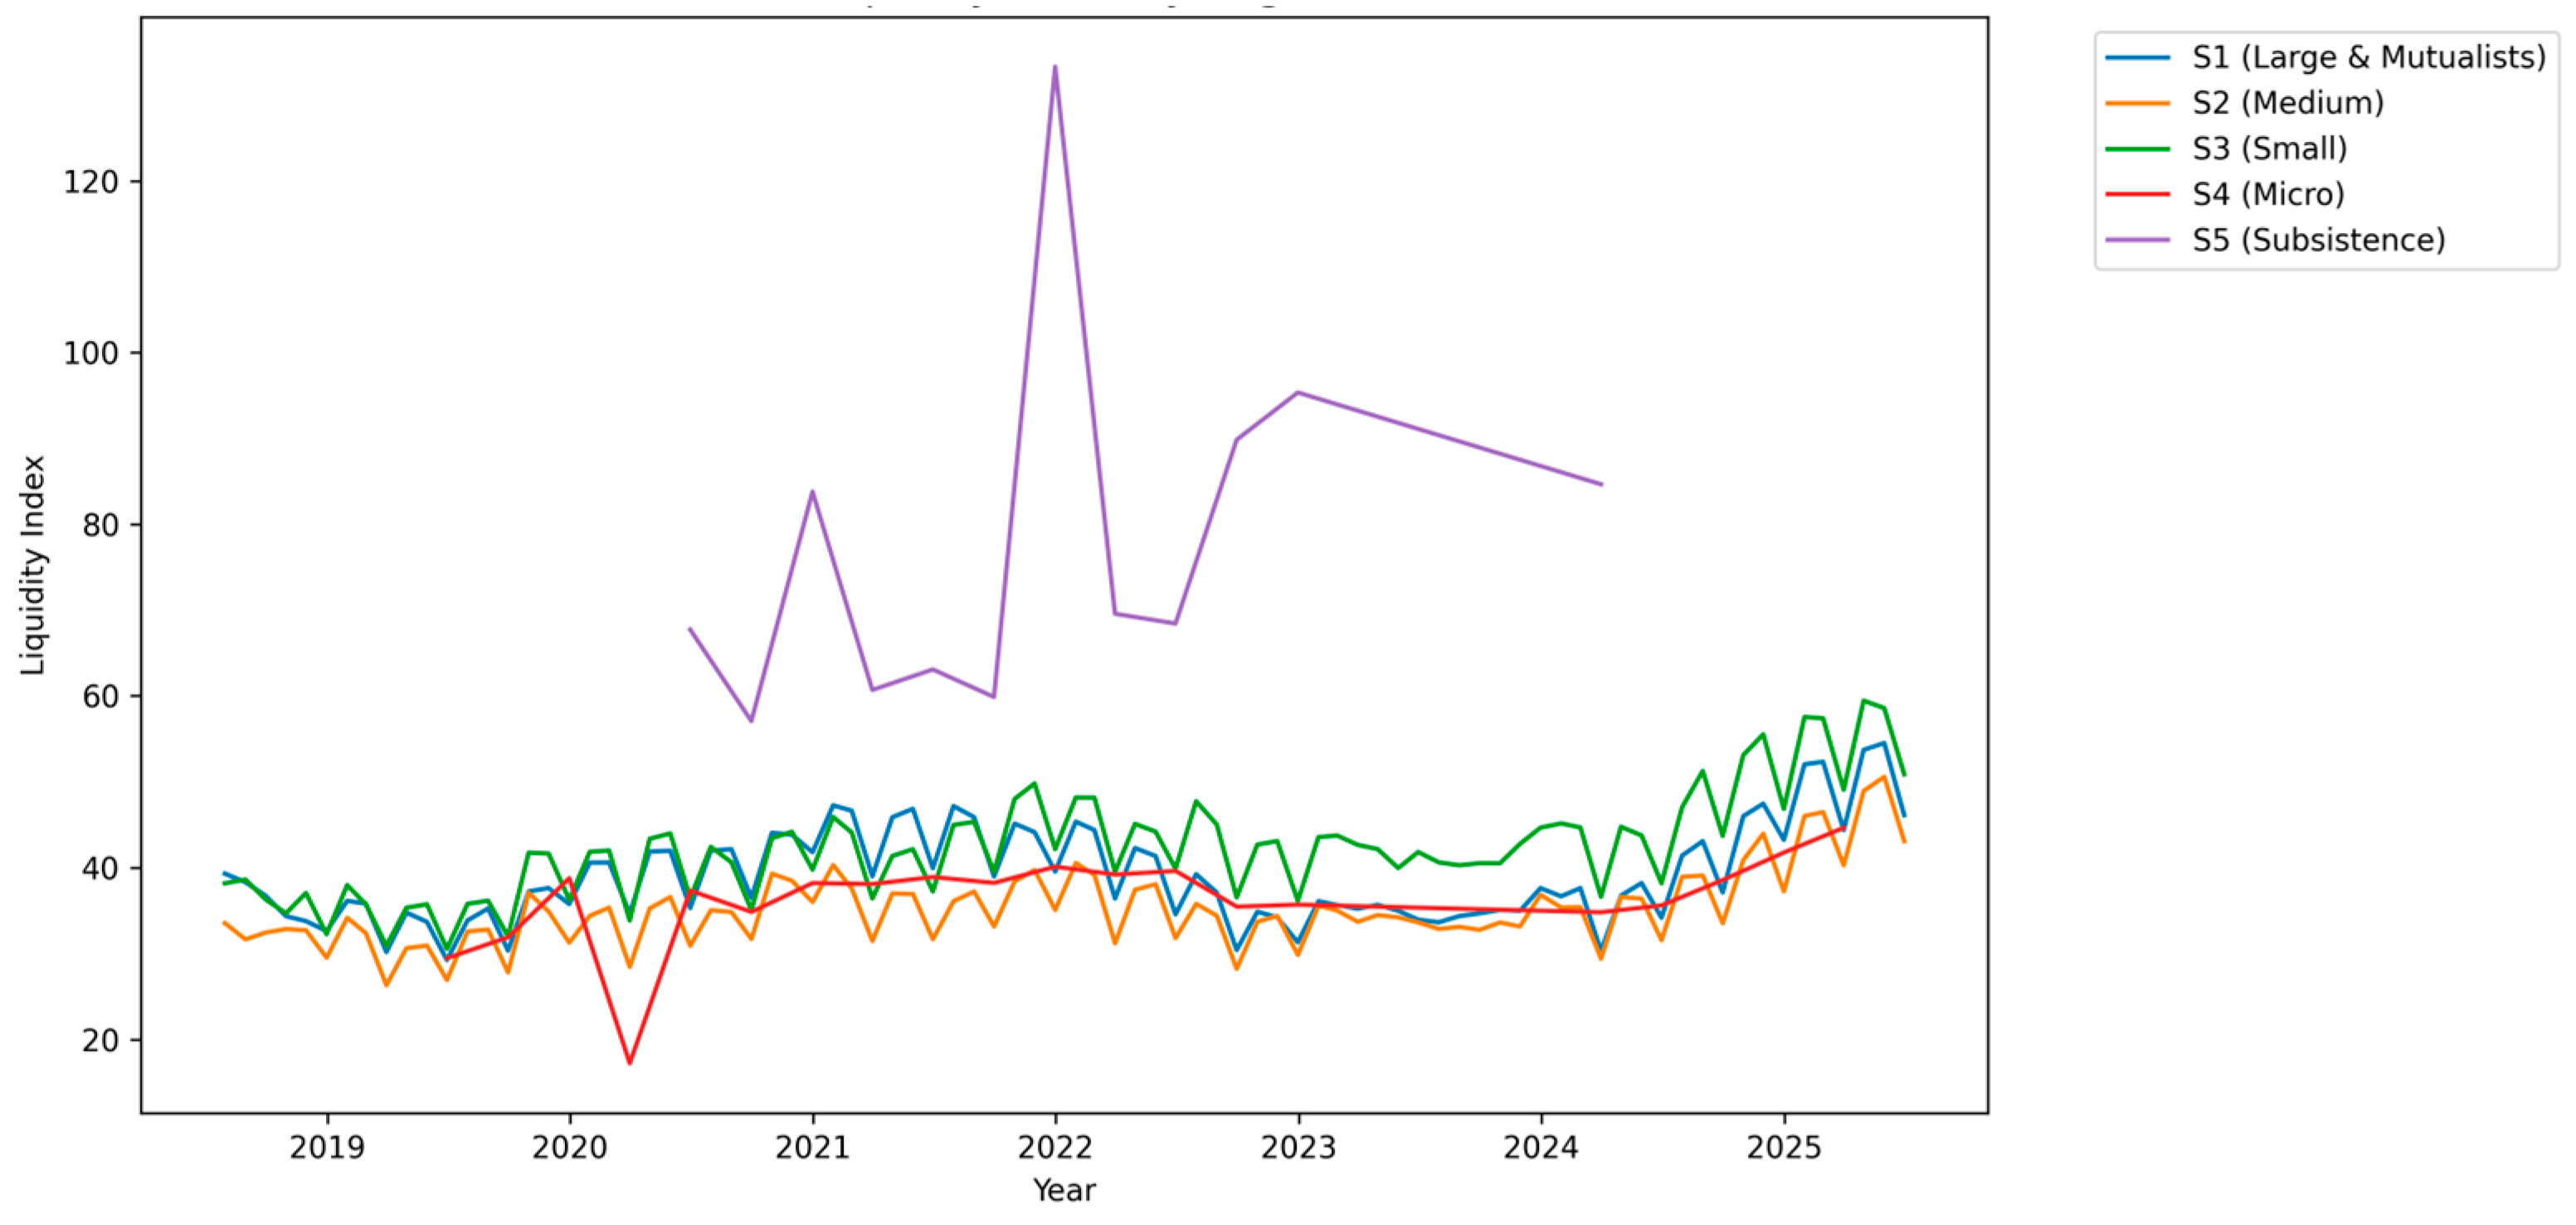
The liquidity index (Figure 3) showed high seasonality, with spikes in December and contractions in the first quarter, validating the need for dynamic early warning models. The extreme liquidity index value of nearly 140 observed in the subsistence segment (S5) reflects precautionary liquid assets and demand deposits held in commercial banks by micro-entities as a shield against their very low local credit placement capacity.
Figure 3.
The historical trend of liquidity index by financial segment (2018–2025). Note: Based on longitudinal monthly data covering 584 unique financial institutions (24,232 total institution-month observations). Aggregation method: Monthly median values per segment (S1–S5).
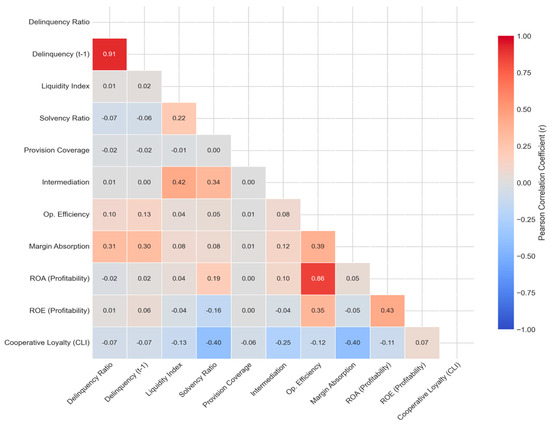
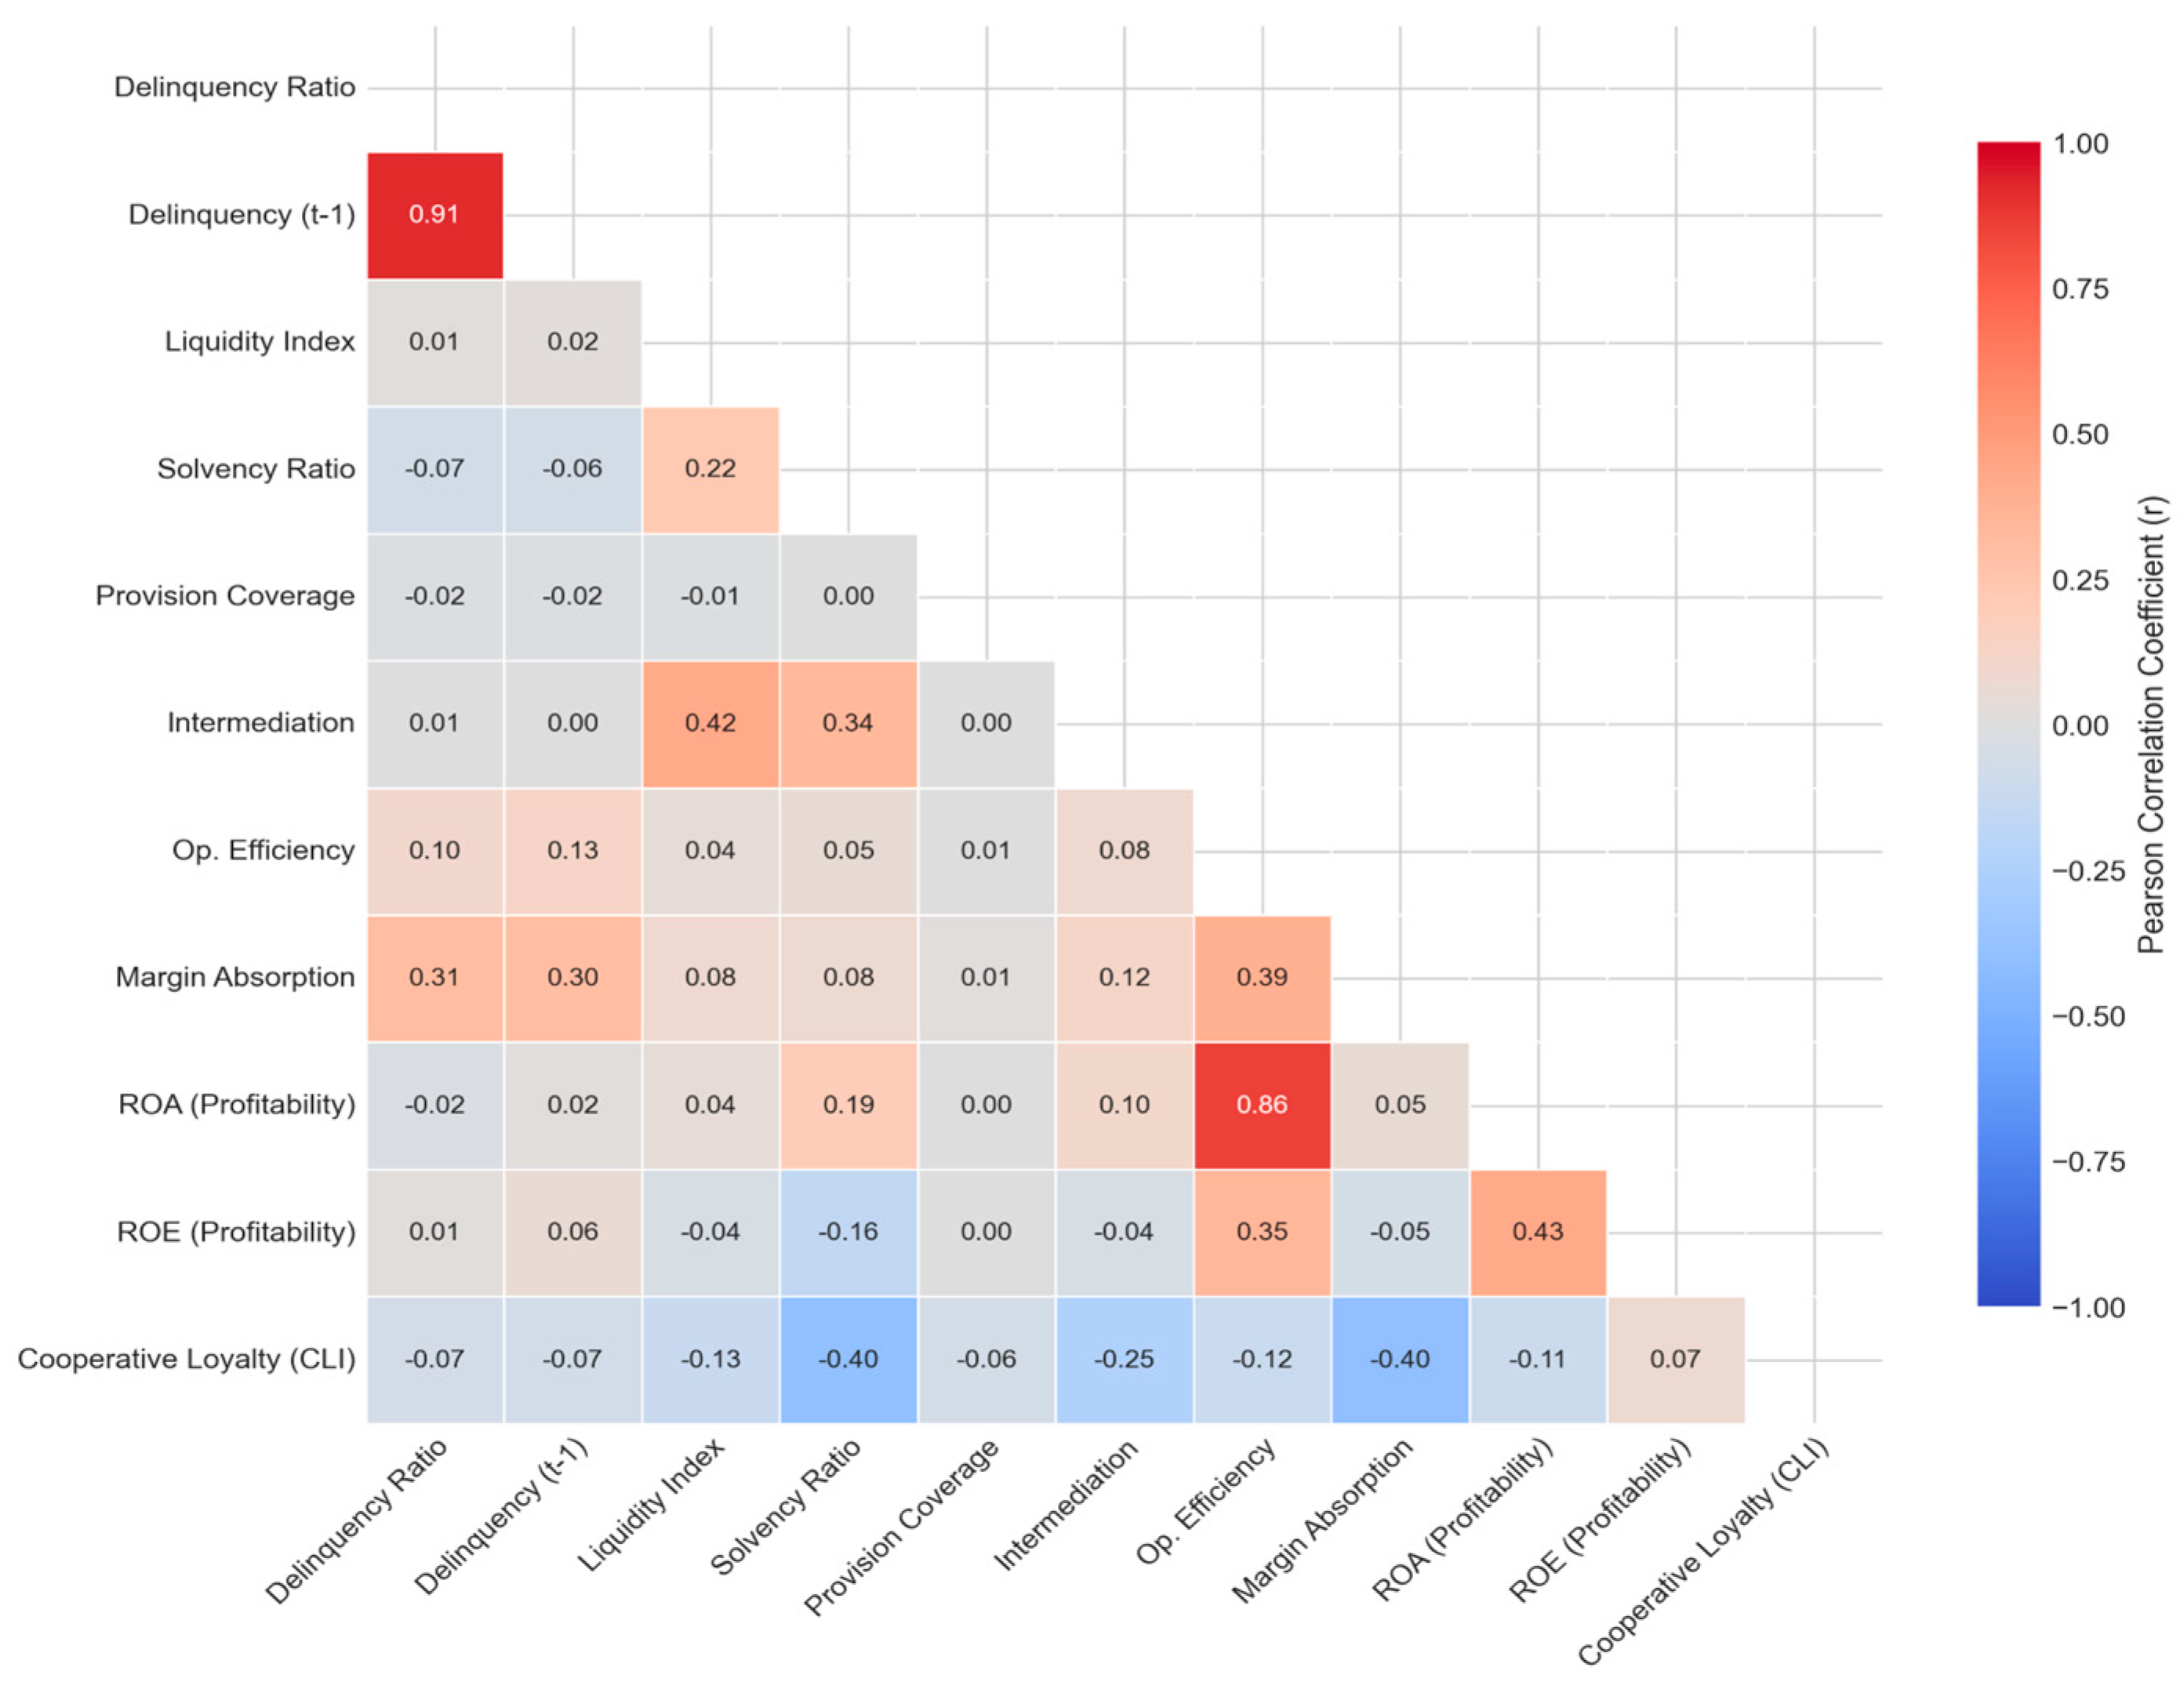
Finally, the correlation matrix (Figure 4) highlighted the strong linear relationship between profitability (ROE) and capital adequacy, justifying the use of non-linear algorithms like XGBoost to disentangle these dependencies and exhibit robustness to multicollinearity in predictive performance, a common limitation in traditional linear models (Chen & Guestrin, 2016).
Figure 4.
A correlation matrix of selected candidate financial indicators (2018–2025). Note: Computed across 24,232 institution-month observations covering 584 unique financial institutions to evaluate multicollinearity and candidate predictor relationships prior to feature purging. Note: The historical trend figures display the monthly balance sheet series through 2025 for descriptive contextual monitoring. Predictor model features X_T are strictly restricted to January 2018–December 2024, while 2025 data are utilized exclusively for descriptive tracking and evaluating forward T + 6 target distress labels.
3.2. Model Performance: EWS Validation
The XGBoost primary model was evaluated against a traditional logistic regression benchmark using a rigorous distress transition protocol. This methodology focused exclusively on institutions that were in a “healthy” state at time T (capital > 9% and ROA > 0), predicting the onset of distress at T + 6. Furthermore, to eliminate temporal “look-ahead bias,” the training set was strictly truncated six months prior to the test set initialization. This approach addressed the “state persistence” critique by ensuring the model learned dynamic transitions rather than merely observing existing insolvency.
As summarized in Table 4, the confusion matrix on the out-of-time evaluation sample demonstrates the classifi-cation distribution across decision thresholds.
Table 4.
Confusion matrix.
As shown in Table 5, the XGBoost model achieved a ROC-AUC of 0.9961. However, given the extreme class imbalance (0.1556% event rate), the precision–recall AUC (PR-AUC) provided a more rigorous assessment of model utility. XGBoost achieved a higher PR-AUC point estimate (0.2466) than the logistic regression benchmark (0.0931). As detailed in Section 2.3.4, ninety-five percent confidence intervals were constructed using non-parametric block bootstrapping (B = 1000 replications clustered by financial institution RUC) to account for panel serial autocorrelation across monthly observations. Because the resulting PR-AUC confidence intervals are wide and overlapping ([0.0652, 0.7040] for XGBoost vs. [0.0271, 0.1916] for Logit), the empirical findings are interpreted strictly as evidence of higher point-estimate performance rather than asymptotic statistical dominance, reflecting the finite rare-event validation constraint of six observed distress transitions.
Table 5.
Model performance metrics.
To evaluate the robustness of these threshold choices, Table 6 presents the sensitivity analysis under alternative distress definitions.
Table 6.
Stress definition sensitivity.
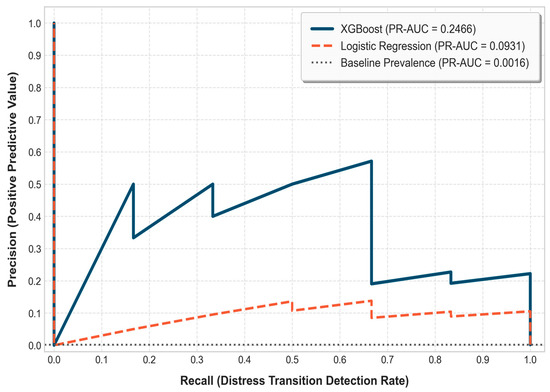
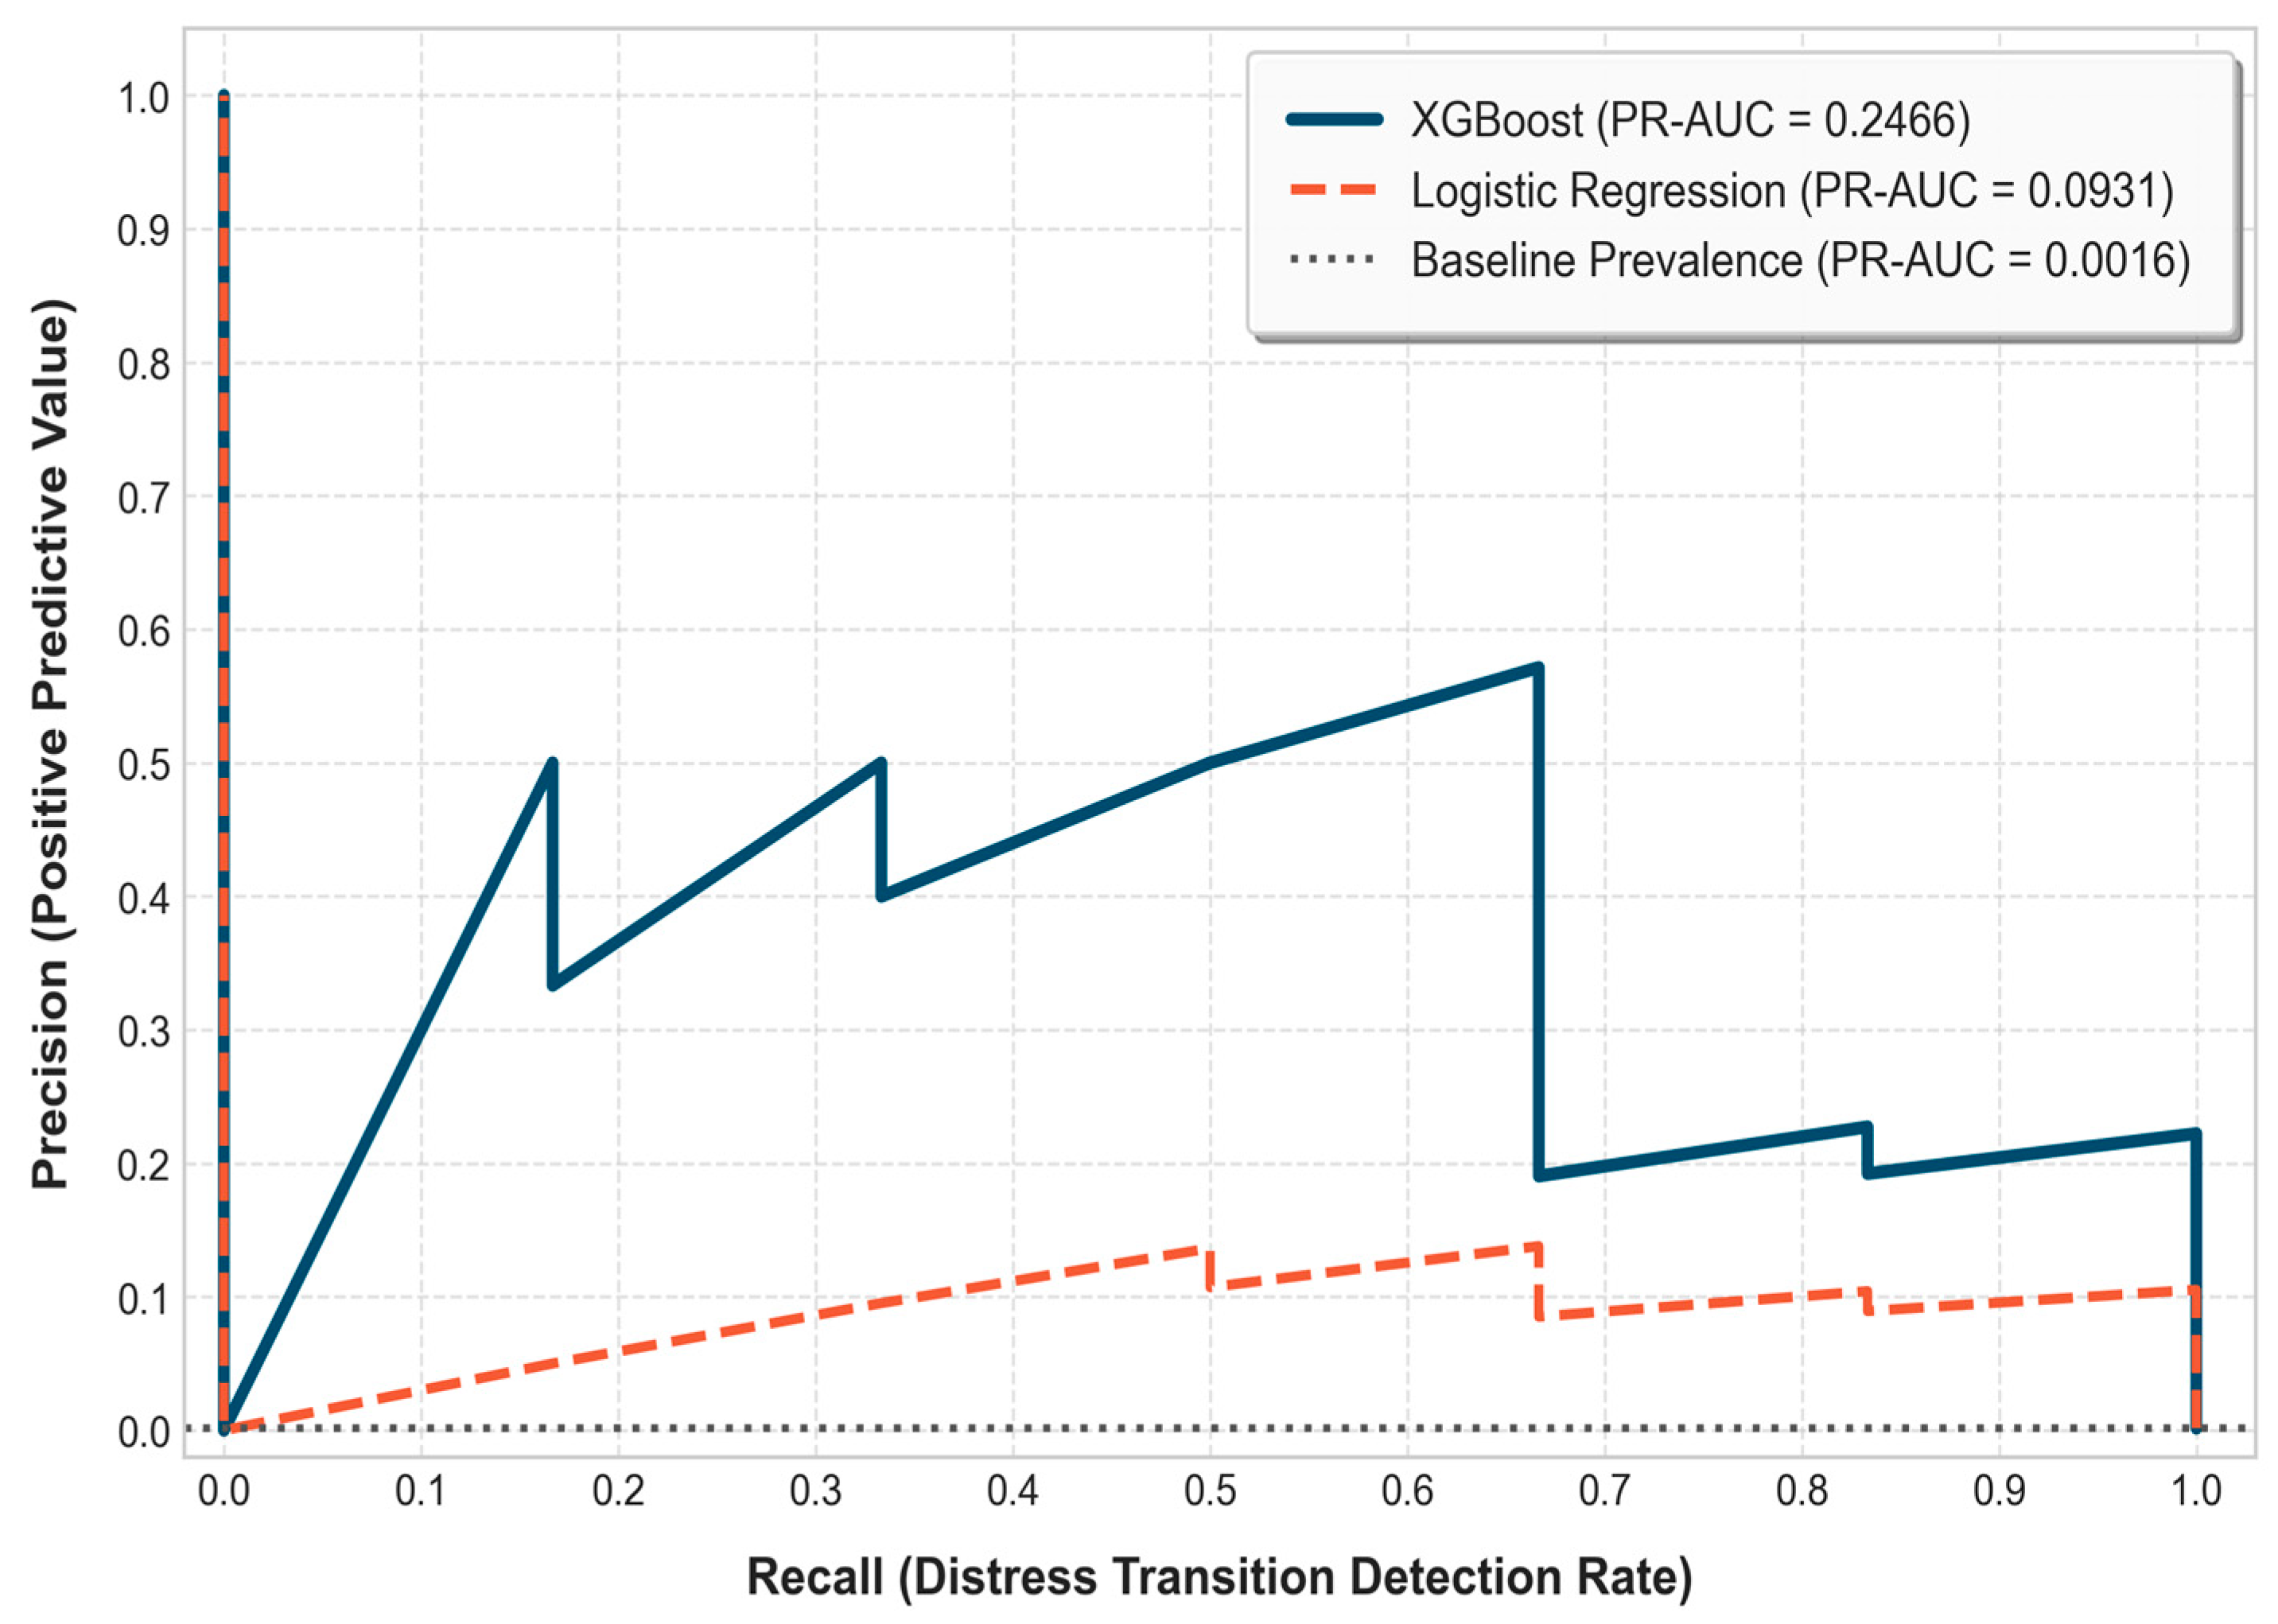
As visualized in Figure 5, the precision–recall curve illustrates XGBoost’s ability to sustain higher precision across key recall levels compared to the linear baseline. Notably, at the 1% risk threshold (corresponding to the 39 highest risk observations out of the 3857 total test set), the model achieved a precision of 0.128 (meaning five out of thirty-nine flagged alerts are true transition events) and a recall of 0.833, capturing five out of the six observed institutional distress transition events.
Figure 5.
Precision–recall curve comparison (T + 6) computed over the 2024 out-of-time validation sample. Note: Evaluation window January–December 2024 (N = 3857 total institution-month observations, 6 positive distress transition events, exact test prevalence p_test = 0.0015556).
While a precision of 12.8% may seem low in balanced settings, it represents a substantial 82.4-fold lift over the random baseline (0.0016), enabling the regulator to focus scarce resources by reviewing the highest risk 1% of institution-month alerts while identifying over 83% of observed institutional distress transitions. Conversely, the logit benchmark captures only four of the six events at the same top 1% threshold, yielding a precision of 0.103 and a lower recall of 0.667. At the top 5% threshold (193 observations), both models achieve a recall of 1.000 (capturing all six distress events), though with a diluted precision of 0.031.
The results remain directionally consistent across alternative distress definitions, although predictive performance is strongest under the baseline and composite distress specifications. Under severe distress, the absolute lack of distress events in the out-of-time test set prevents validation, illustrating the practical limitation of using overly restrictive default definitions for active early warning supervision. Conversely, persistent distress (three consecutive months of negative ROA) yields a PR-AUC of 0.0618 for the logit model, outperforming the XGBoost model’s 0.0267, as the persistent unprofitability channel behaves linearly.
3.3. Risk Drivers and Cooperative Identity
SHAP values provided the interpretable signals required for regulatory decision-making. However, it is crucial to emphasize that SHAP values reflect predictive associations and feature contributions within the model rather than direct causal relationships. Similarly, the Cooperative Loyalty Index (CLI), constructed as the ratio of term deposits to total deposits, acts as a financial proxy for funding stability and member alignment rather than a direct qualitative measure of loyalty. Nevertheless, this proxy captures vital funding characteristics beyond market interest rates.
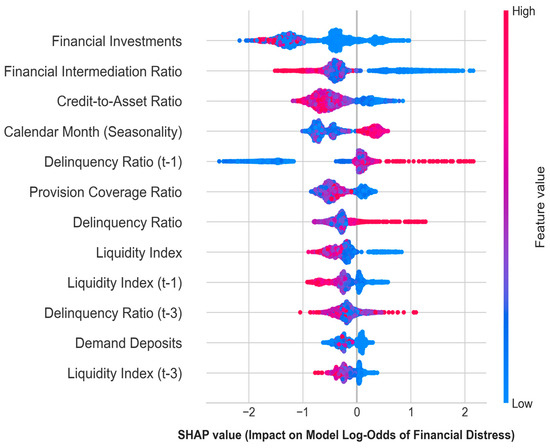
As detailed in Table 7, clear heterogeneity in risk driver profiles emerges across institutional segments. For standard credit cooperatives, financial stress is primarily driven by credit allocation structure (Credit-to-Asset Ratio, mean SHAP 0.7004), liquid securities allocation (Investment-to-Asset Ratio, mean SHAP 0.5668), and historical loan delinquency persistence (Delinquency Ratio T − 3, mean SHAP 0.5334). In contrast, for mutualists, distress risk is heavily dominated by investment portfolio sensitivity (Investment-to-Asset Ratio, mean SHAP 1.2474), lagged credit deterioration (Delinquency Ratio T − 3, mean SHAP 0.6721), and financial intermediation intensity (Intermediation Ratio, mean SHAP 0.6399), reflecting their specialized mortgage-lending asset structures.
Table 7.
SHAP global feature importance.
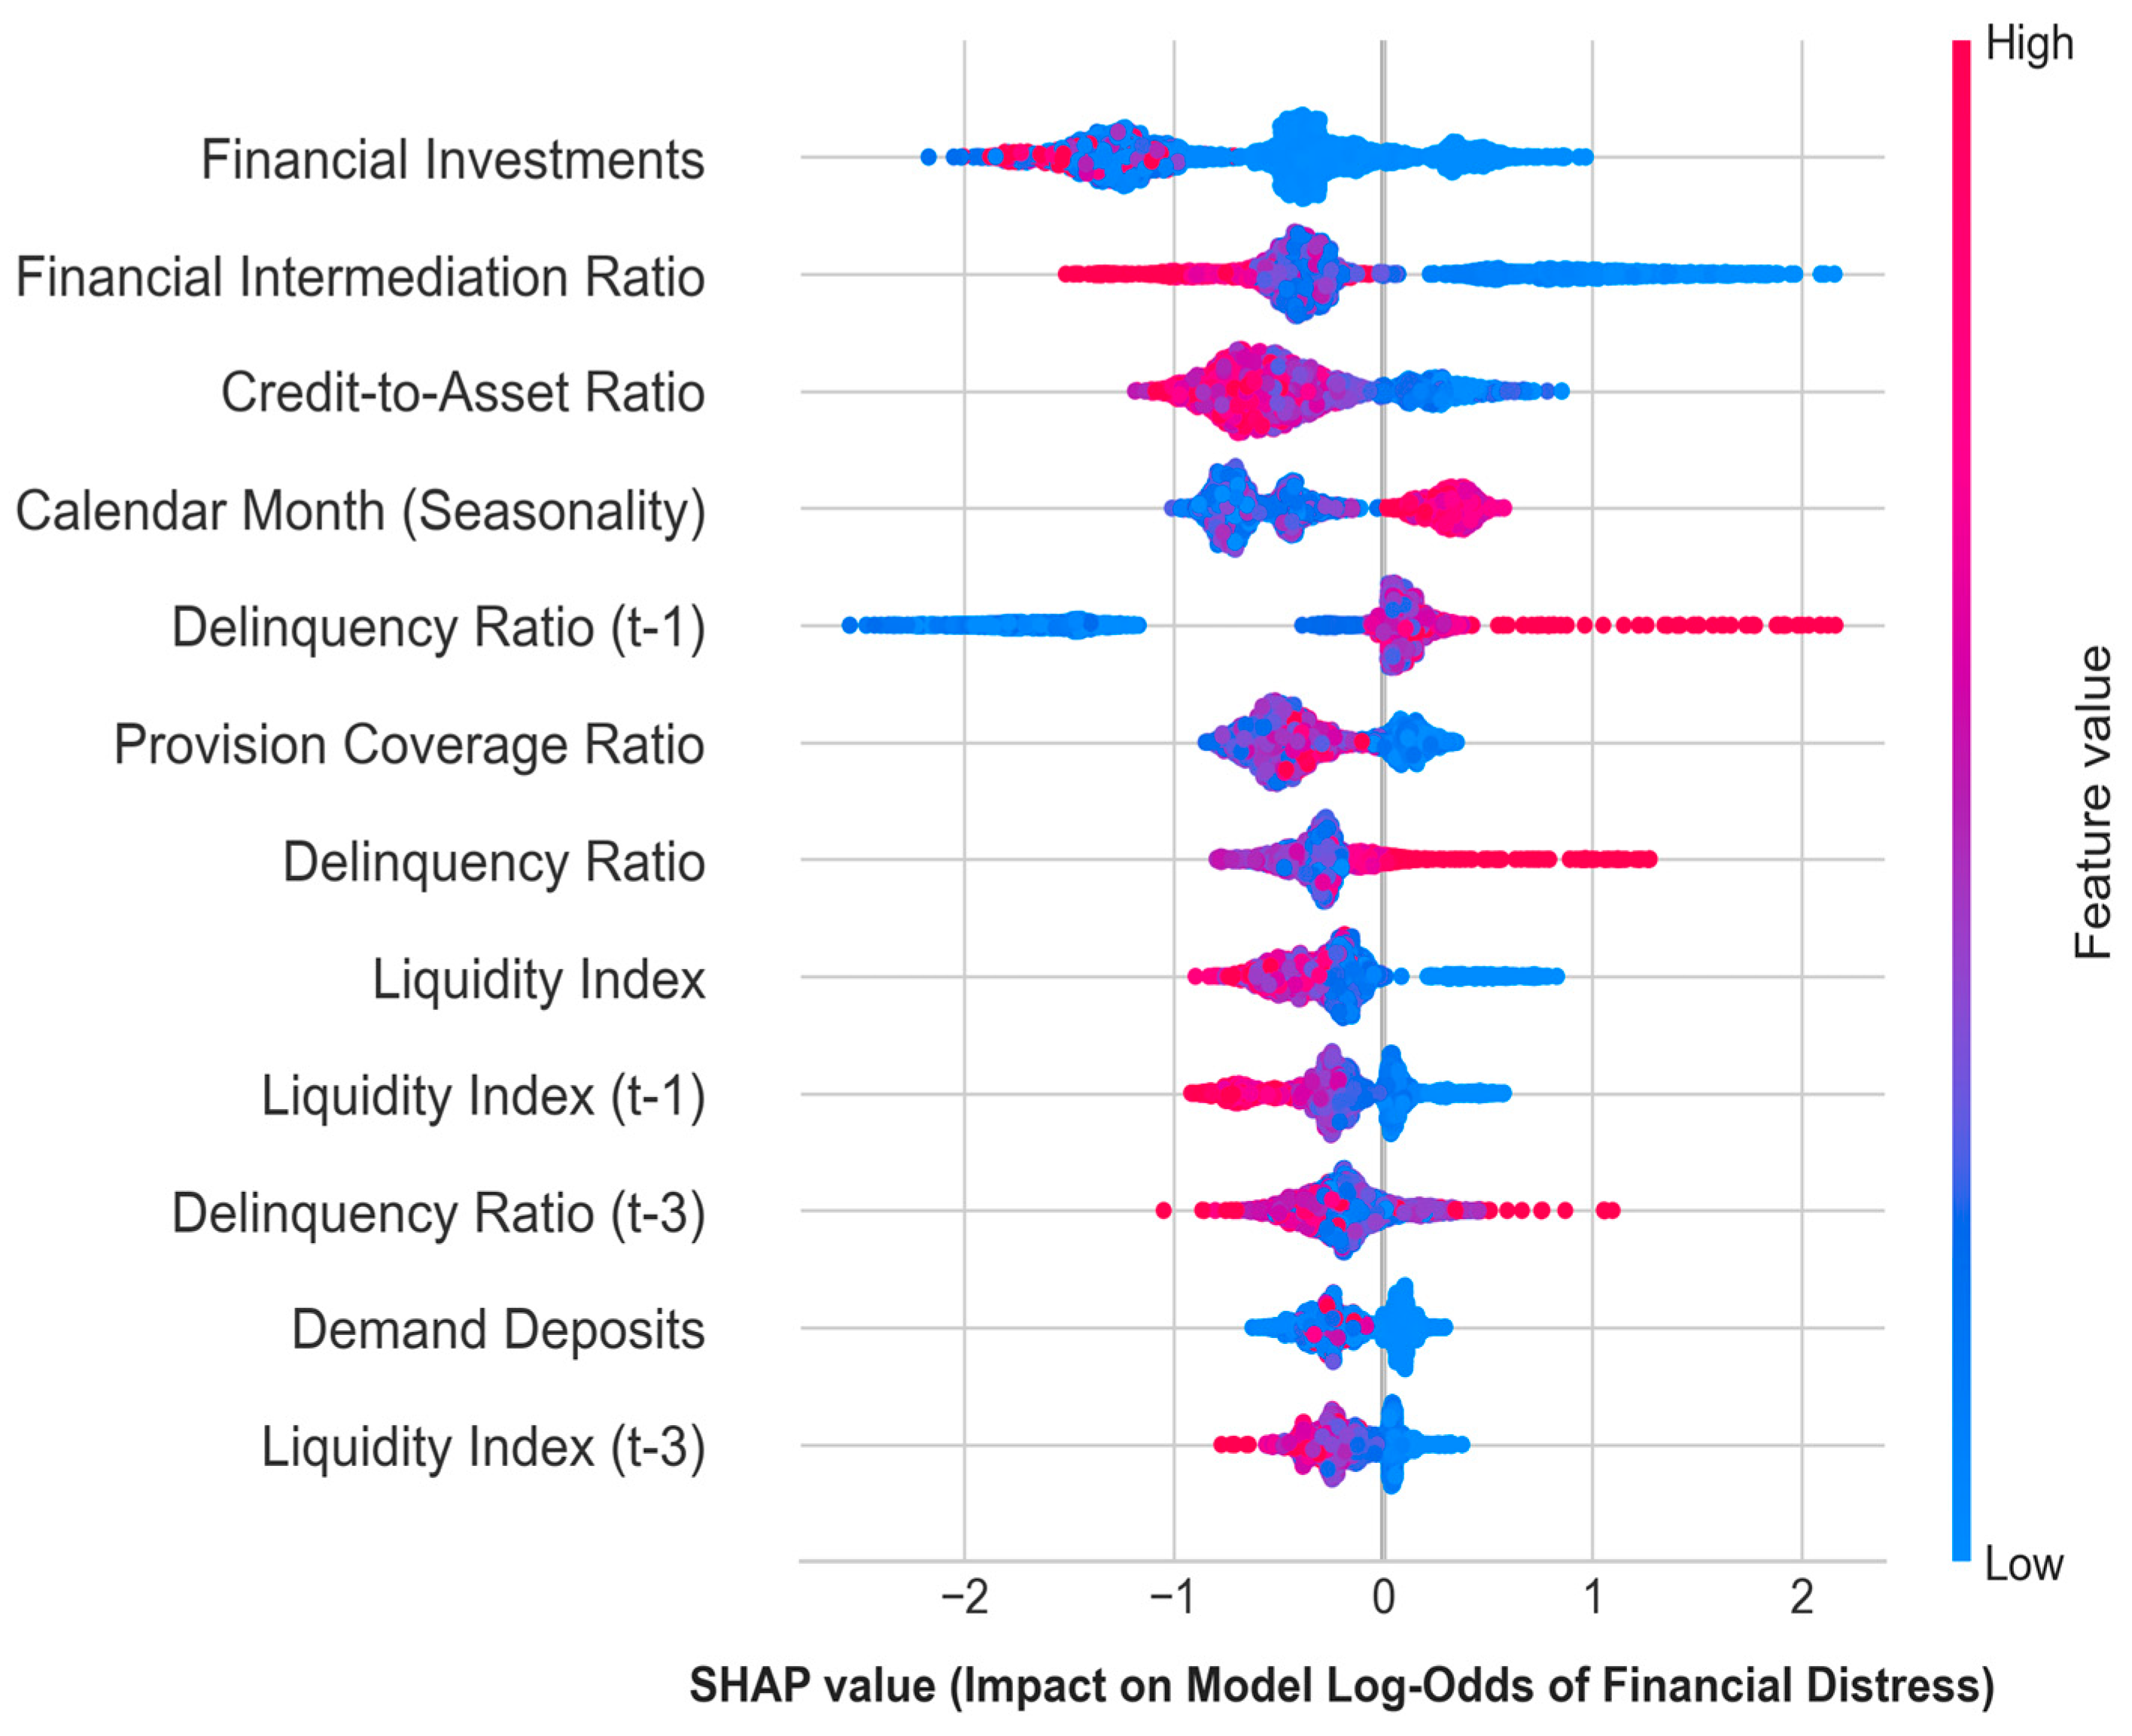
Figure 6 illustrates the global SHAP feature importance for standard cooperative institutions.
Figure 6.
SHAP summary: risk drivers for standard cooperative institutions. Note: Evaluated on 3786 cooperative institution-month observations (6 distress transition events) in the 2024 out-of-time test sample.
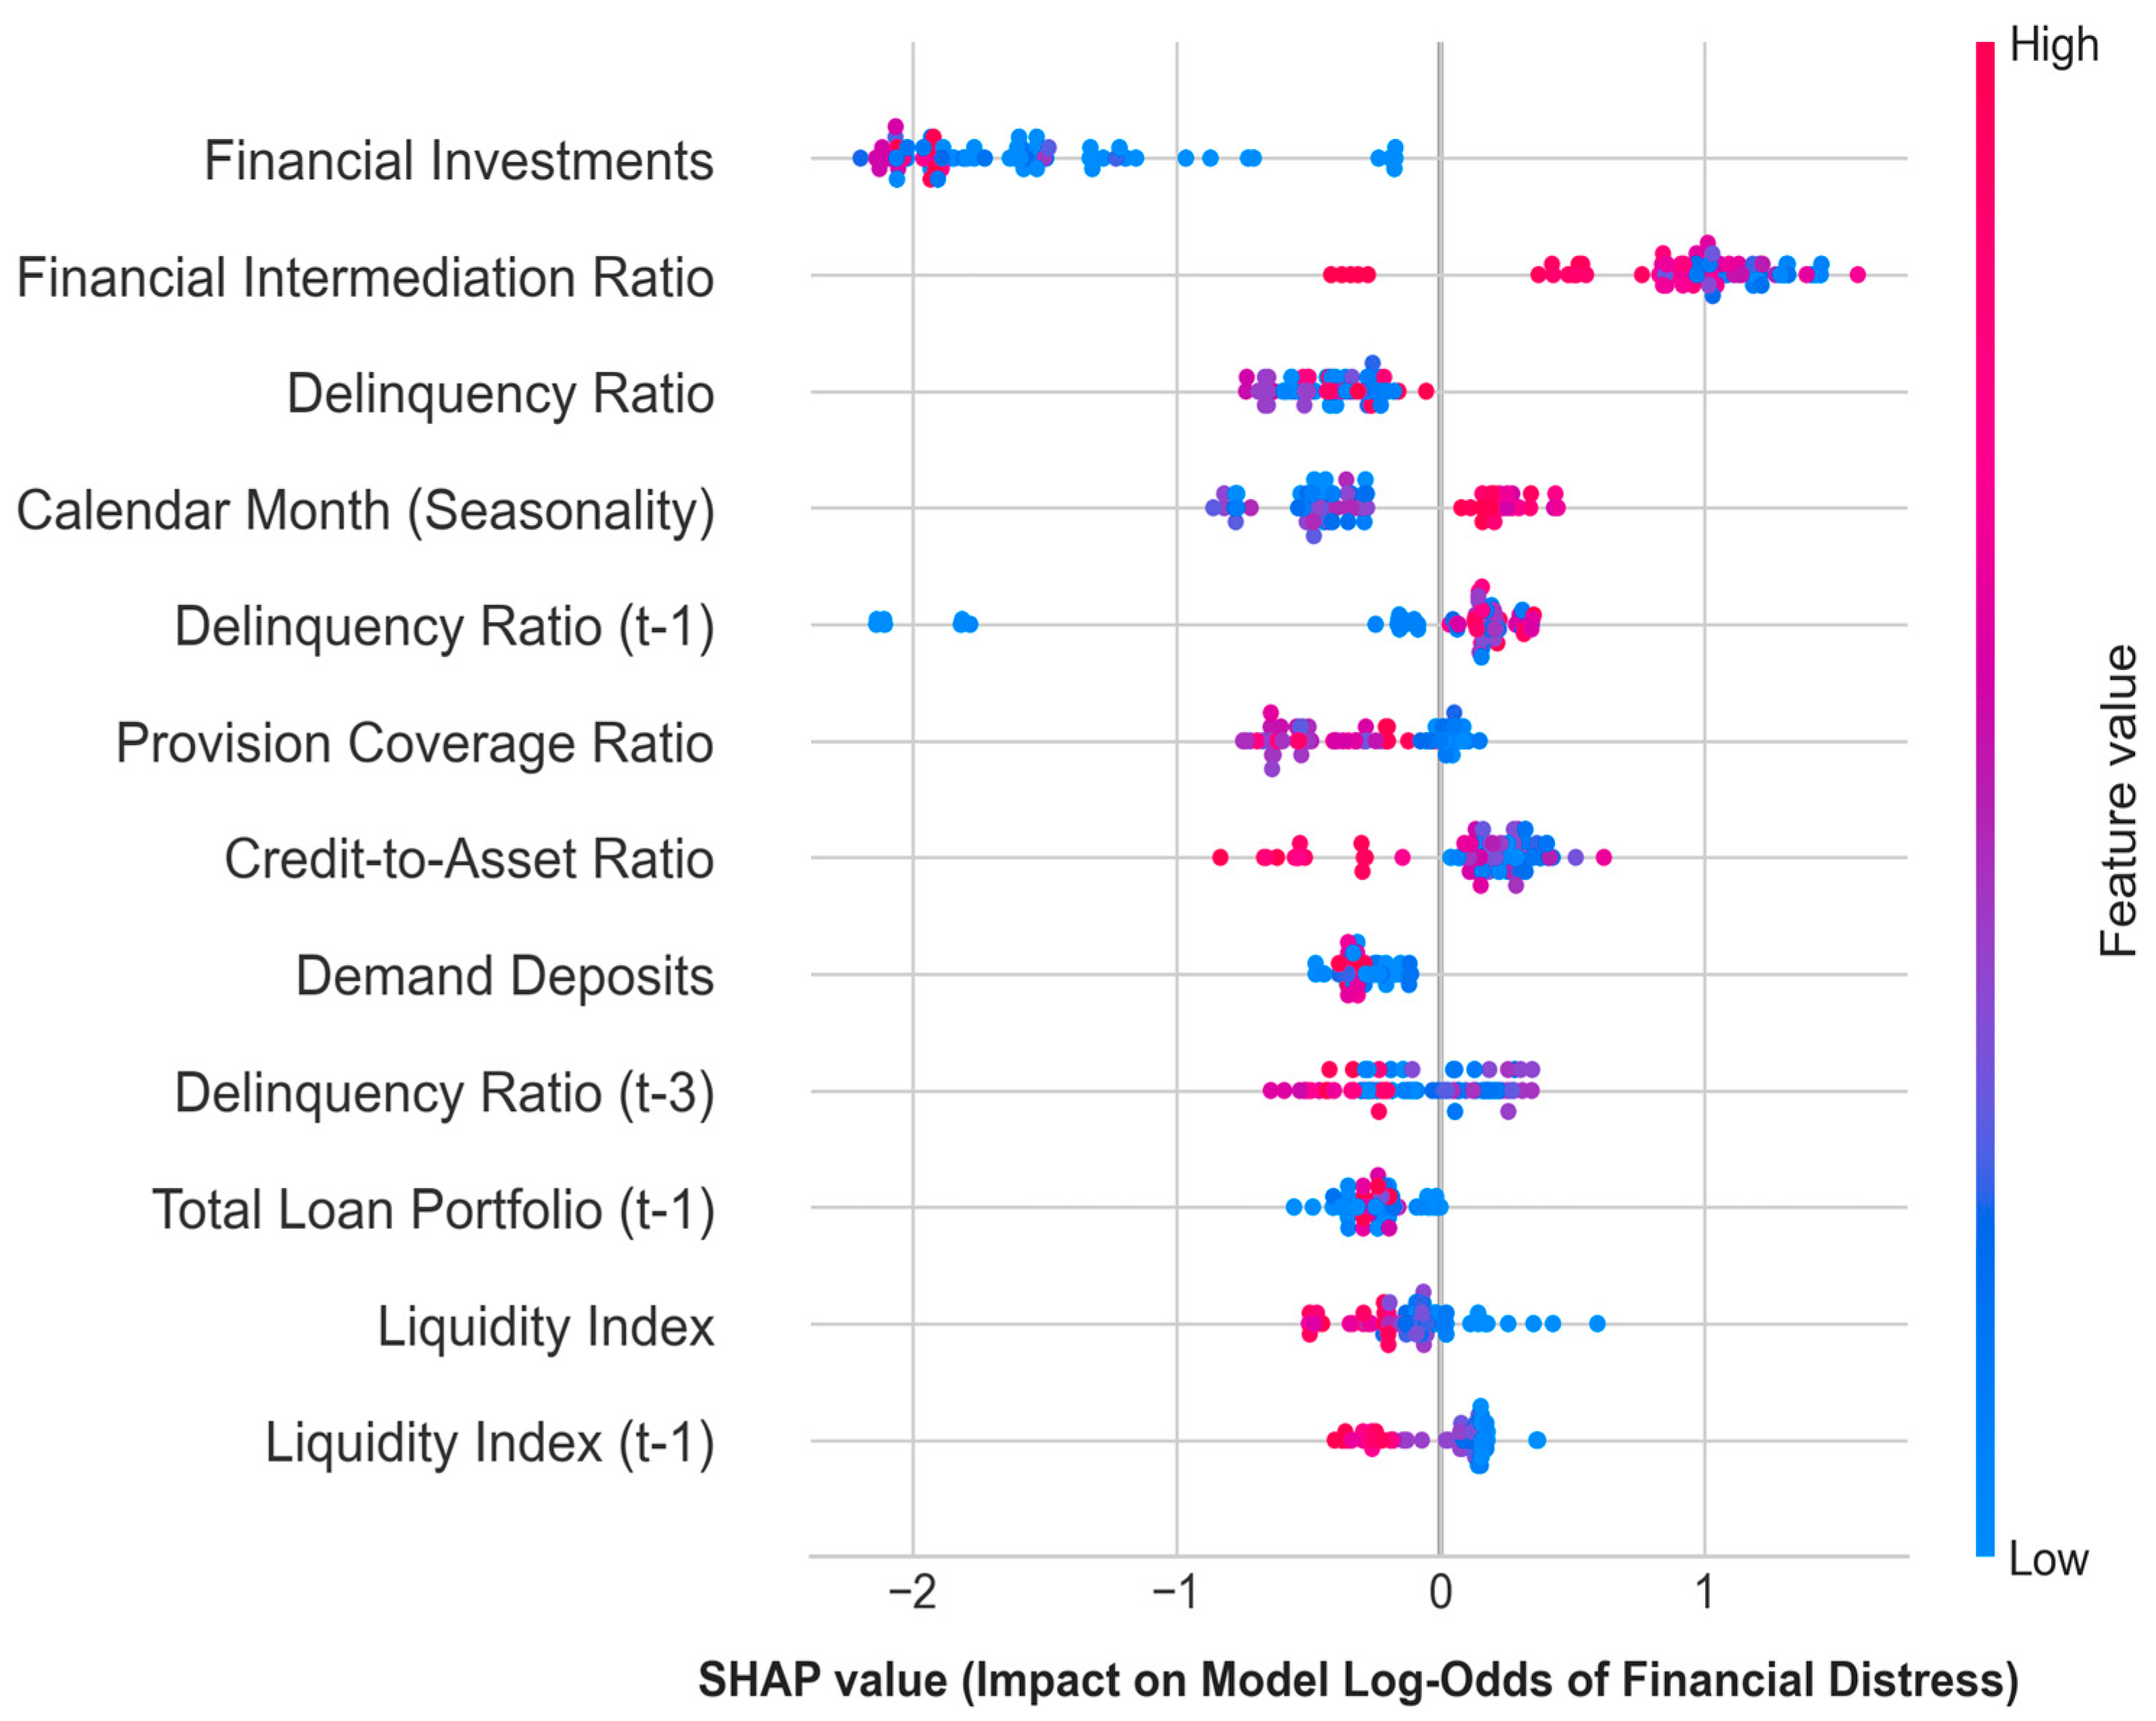
In contrast, Figure 7 displays the SHAP risk drivers for mutualist entities.
Figure 7.
SHAP summary: risk drivers for mutualist institutions. Note: Evaluated on 71 mutualist institution-month observations in the 2024 out-of-time test set. Due to the absolute absence of mutualist distress transition events in the test window (0 out-of-time test events), SHAP values reflect descriptive baseline feature importance from the training set rather than validated predictive signals.
Empirical evidence reveals a stark structural divergence in the out-of-time test set (2024), which comprises 3786 cooperative observations (with 6 distress transition events) and only 71 mutualist observations (with 0 distress transition events). Due to the absolute lack of mutualist failure events in the out-of-time sample, the SHAP risk drivers for mutualist institutions must be interpreted as descriptive baseline tendencies from the training period rather than active predictive signals, necessitating methodological caution.
4. Discussion
The results of this study provide empirical support for the integration of machine learning (ML) and explainable AI (XAI) into financial supervision frameworks. The point-estimate performance of XGBoost over the six-month forecast horizon (T + 6) suggests that non-linear models may help bridge the gap between reporting and anticipation.
4.1. From Prediction to Decision Support (DSS)
This study contributes to risk management innovation by showing how explainable machine learning can transform regulatory financial statements into early warning signals for credit, liquidity and institutional risk supervision. Unlike traditional CAMEL-based monitoring, the proposed framework prioritizes entities according to their predicted transition risk and provides SHAP-based explanations that support transparent supervisory intervention. In the out-of-time sample, this percentile-based approach would generate approximately 3.2 critical alerts (Top 1%) and 16.0 high-risk alerts (Top 5%) per month. This illustrative alert volume suggests that the proposed framework could produce an operationally manageable number of alerts while achieving an 82.4-fold lift over random baseline. A primary contribution of this research is the development of an operational decision support system (DSS). By combining percentile-based risk scores with SHAP-based explanations, a “risk-based supervision matrix” is proposed (Table 8).
Table 8.
Risk-based supervision matrix.
This matrix illustrates a possible transition from reactive microprudential monitoring toward more proactive, risk-based aggregated institution-level monitoring. A percentile-based supervision matrix is proposed to prioritize scarce supervisory resources, focusing on entities where the model detects structural deterioration that has not yet manifested in a breach of current-month thresholds. The decision thresholds (top 1% for critical, top 5% for high, and top 10% for moderate risk) were defined ex ante as workload-based supervisory capacity bands rather than optimized using the 2024 out-of-time test results. The precision–recall curve was used only to evaluate the performance of these pre-specified operational thresholds. In the context of the SFPS, where supervisory resources are strictly limited and false alarms carry high operational costs, this threshold selection prioritizes precision (confidence in the alert) while maintaining sufficient recall to capture true transition events.
4.2. Theoretical Implications: Credit Quality and Cooperative Identity
The findings provide empirical nuance to the “fragility through competition” literature (Demirgüç-Kunt & Huizinga, 1999). To explicitly address concerns of accounting determinism and functional tautology (i.e., the model simply reverse-engineering the regulatory calculation for capital erosion), all direct components of the target variable (solvency, ROE, ROA, and margin absorption metrics) were strictly purged from the predictor set. Consequently, the predictive power of the XGBoost model relies entirely on structural and behavioral indicators.
Within this purified feature space, the SHAP analysis identifies delinquency and asset size as the strongest signals of impending distress for standard cooperatives. The transmission mechanism in the Ecuadorian SFPS appears to follow a delayed “credit impairment” channel. In a dollarized economy with capped interest rates, entities facing rapid, unsecured portfolio expansion (scale) inevitably encounter a deterioration in asset quality. Because cooperatives lack the ability to quickly issue external equity, this deterioration in asset quality may contribute gradually to the erosion of internal capital buffers. Thus, delinquency serves as an early indicator of systemic vulnerability, signaling structural weakness that eventually manifests as capital shortages at T + 6.
The model provides exploratory evidence that the CLI may serve as a useful funding stability proxy, although this interpretation should be treated cautiously given the limited number of out-of-time distress events.
This challenges the traditional supervisory focus on static capital snapshots. The model suggests that by the time an entity breaches statutory capital adequacy requirements or the empirical 9% accounting capital buffer, it has likely been structurally compromised by delinquency and member funding flight for several quarters. Therefore, effective early warning must prioritize the sustainability of the business model over the present-day balance sheet.
4.3. Limitations and Future Work
While the inclusion of lags (t − 1, t − 3, t − 6) captures the persistence of financial states, the potential for attribution dilution in the XAI analysis due to high autocorrelation between ratios is acknowledged. However, the model’s ranking performance at T + 6 is consistent with the presence of persistent risk patterns, although this interpretation remains limited by the small number of validation events.
A limitation of the current study is the omission of explicit macroeconomic variables. In a fully dollarized emerging economy like Ecuador, systemic resilience is inherently linked to external shocks, including oil price volatility and fluctuations in U.S. interest rates (Basdekis et al., 2022; Jácome, 2004). Research indicates that exogenous shocks and energy crises can rapidly transmit to the financial sector through the credit channel, particularly in cooperative networks where liquidity pools are deeply interlinked. Future research should integrate these global indicators into the ML framework to enhance its robustness against systematic risk cycles. Additionally, the use of SHAP interaction values should be explored to further disentangle the synergistic effects of low capital and high delinquency.
5. Conclusions
This study evaluated an explainable machine learning framework for early risk prioritization in the solidarity financial sector of Ecuador. The empirical findings provide support for Hypothesis 1 in terms of higher point-estimate performance, but not statistical superiority. Under the six-month forecast horizon (T + 6), XGBoost achieved a higher PR-AUC point estimate (0.2466) and an 82.4-fold lift at the top 1% alert threshold compared to the logistic regression benchmark (PR-AUC 0.0931, Lift 59.8×) in the 2024 out-of-time validation sample. This result is theoretically consistent with the non-linear nature of financial distress in cooperative institutions, where delinquency, liquidity pressure, funding structure, and asset composition interact in ways that are unlikely to be fully captured by a linear specification. Because the PR-AUC confidence intervals are wide and overlapping, the comparison should be interpreted as evidence of higher point-estimate performance rather than statistically significant superiority.
Exploratory Proposition 1 is supported as a descriptive structural baseline derived from historical training SHAP profiles. SHAP feature attributions indicate distinct risk channels between institutional business models: standard cooperatives are driven primarily by delinquency and rapid credit expansion, whereas mutualists exhibit sensitivity to liquidity and member deposit structure due to longer asset liability duration mismatches. However, because the out-of-time evaluation test set contains zero mutualist distress events, Exploratory Proposition 1 is presented strictly as an exploratory structural baseline rather than a formally validated out-of-sample predictive claim.
Overall, the findings suggest that explainable machine learning models may improve early warning supervision by transforming regulatory financial statements into interpretable risk prioritization signals. The proposed risk-prioritization matrix and SHAP-based profiles should therefore be understood as exploratory decision support tools rather than validated operational mandates. Given the limited number of distress episodes, future research should extend the validation window, incorporate macroeconomic stress variables, and develop segment-specific models to further assess the robustness of these findings.
Author Contributions
Conceptualization, C.G.-P.; methodology, C.G.-P., K.C.-S., D.H.Á., P.X.M.-V., A.G.C.S. and V.G.A.P.; software, C.G.-P.; validation, K.C.-S., D.H.Á., P.X.M.-V.; formal analysis, C.G.-P., A.G.C.S.; investigation, K.C.-S., V.G.A.P.; data curation, C.G.-P.; writing—original draft preparation, C.G.-P.; writing—review and editing, K.C.-S., D.H.Á., P.X.M.-V., A.G.C.S. and V.G.A.P.; visualization, C.G.-P.; supervision, C.G.-P. All authors have read and agreed to the published version of the manuscript.
Funding
The research received no external funding.
Institutional Review Board Statement
Not applicable.
Informed Consent Statement
Not applicable.
Data Availability Statement
The raw monthly regulatory financial statements (B11 structures) and portfolio reports (B12/C02 structures) are publicly available from the official open-data portal of the Superintendencia de Economía Popular y Solidaria (SEPS) of Ecuador (https://estadisticas.seps.gob.ec/). The processed longitudinal panel dataset, anonymized candidate indicator space, Python replication scripts, and trained model parameters are available from the corresponding author upon reasonable request.
Conflicts of Interest
The authors declare no conflicts of interest.
Appendix A
Table A1 details the complete operational inventory of candidate financial indicators, historical lags, derived features, institutional dummies, and target/calendar variables.
Table A1.
Complete inventory of candidate variables and model predictors (49 total: 43 active predictors, 6 excluded variables).
Table A2.
Sample filtering and longitudinal dataset construction stages.
References
- Acharya, V. V., Pedersen, L. H., Philippon, T., & Richardson, M. (2017). Measuring systemic risk. The Review of Financial Studies, 30(1), 2–47. [Google Scholar] [CrossRef] [Scilit]
- Altman, E. I. (1968). Financial ratios, discriminant analysis and the prediction of corporate bankruptcy. The Journal of Finance, 23(4), 589–609. [Google Scholar] [CrossRef]
- Bacon, F., Fernando, L., & Reis, D. (2024). The failure of silicon valley bank: A test of market efficiency. Journal of Applied Business and Economics, 26(4), 75. [Google Scholar] [CrossRef] [Scilit]
- Basdekis, C., Christopoulos, A., Katsampoxakis, I., & Nastas, V. (2022). The impact of the Ukrainian War on stock and energy markets: A wavelet coherence analysis. Energies, 15(21), 8174. [Google Scholar] [CrossRef] [Scilit]
- Basel Committee on Banking Supervision. (2017). Basel committee on banking supervision Basel III: Finalising post-crisis reforms. Available online: https://www.bis.org/basel_framework/ (accessed on 10 January 2026).
- Beutel, J., List, S., & von Schweinitz, G. (2019). Does machine learning help us predict banking crises? Journal of Financial Stability, 45, 100693. [Google Scholar] [CrossRef] [Scilit]
- Carrera-Silva, K., Maritza Rodríguez Ulcuango, O., Abdo-Peralta, P., Gerardo Castelo Salazar, Á., Amelia Samaniego Erazo, C., & Haro Ávalos, D. (2024). Beyond the financial horizon: A critical review of social responsibility in Latin American credit unions. Sustainability, 16(18), 7908. [Google Scholar] [CrossRef] [Scilit]
- Carrera-Silva, K. A. (2024). Balance social para las cooperativas de ahorro y crédito del Ecuador. Available online: https://puertomaderoeditorial.com.ar/index.php/pmea/es/catalog/view/89/255/438 (accessed on 10 January 2026).
- Carrera-Silva, K. A., Ulcuango, O. M. R., Salazar, Á. G. C., Erazo, C. A. S., & Llamuca, K. J. P. (2024). Programas e iniciativas de educación financiera: Un estudio de las cooperativas de ahorro y crédito que conforman la UPROCACH, Ecuador. Green World Journal, 7(2), 1–20. [Google Scholar] [CrossRef] [Scilit]
- Chen, T., & Guestrin, C. (2016). XGBoost: A scalable tree boosting system. In Proceedings of the ACM SIGKDD international conference on knowledge discovery and data mining, 13–17 August 2016 (pp. 785–794). ACM. [Google Scholar] [CrossRef] [Scilit]
- Demirgüç-Kunt, A., & Huizinga, H. (1999). Determinants of commercial bank interest margins and profitability: Some international evidence. World Bank Economic Review, 13(2), 379–408. [Google Scholar] [CrossRef] [Scilit]
- Detotto, C., & Otranto, E. (2010). Does crime affect economic growth? Kyklos, 63(3), 330–345. [Google Scholar] [CrossRef] [Scilit]
- Diamond, D. W., & Dybvig, P. H. (1983). Bank runs, deposit insurance, and liquidity. Journal of Political Economy, 91(3), 401–419. [Google Scholar] [CrossRef] [Scilit]
- Emmons, W. R., & Schmid, F. A. (1999). Credit unions and the common bond. Review, 81, 41–64. [Google Scholar] [CrossRef] [Scilit][Green Version]
- Fritz-Morgenthal, S., Hein, B., & Papenbrock, J. (2022). Financial risk management and explainable, trustworthy, responsible AI. Frontiers in Artificial Intelligence, 5, 779799. [Google Scholar] [CrossRef] [Scilit] [PubMed]
- Gunnarsson, B. R., vanden Broucke, S., Baesens, B., Óskarsdóttir, M., & Lemahieu, W. (2021). Deep learning for credit scoring: Do or don’t? European Journal of Operational Research, 295(1), 292–305. [Google Scholar] [CrossRef] [Scilit]
- Holmstrom, B., & Tirole, J. (1997). Financial intermediation, loanable funds, and the real sector. The Quarterly Journal of Economics, 112(3), 663–691. [Google Scholar] [CrossRef] [Scilit]
- International Organization for Standardization. (2008). Software engineering—Software product quality requirements and evaluation (SQuaRE)—Data quality model (ISO/IEC 25012:2008). International Organization for Standardization.
- Jácome, L. I. (2004). The late 1990’s financial crisis in Ecuador: Institutional weaknesses, fiscal rigidities, and financial dollarization at work. IMF Working Papers. IMF. [Google Scholar] [CrossRef] [Scilit]
- Jensen, M. C., & Meckling, W. H. (1976). Theory of the firm: Managerial behavior, agency costs and ownership structure. Journal of Financial Economics (JFE), 3(4), 1–78. [Google Scholar] [CrossRef] [Scilit]
- Khattak, M. A., Ali, M., Azmi, W., & Rizvi, S. A. R. (2023). Digital transformation, diversification and stability: What do we know about banks? Economic Analysis and Policy, 78, 122–132. [Google Scholar] [CrossRef] [Scilit]
- Kruschel, S., Hambauer, N., Weinzierl, S., Zilker, S., Kraus, M., & Zschech, P. (2024). Challenging the performance-interpretability trade-off: An evaluation of interpretable machine learning models. Business and Information Systems Engineering, 68(1), 159–183. [Google Scholar] [CrossRef] [Scilit]
- Kyle, A. S. (1985). Continuous auctions and insider trading. Econometrica, 53(6), 1315. [Google Scholar] [CrossRef] [Scilit]
- Leland, H. E. (1994). Corporate debt value, bond covenants, and optimal capital structure. The Journal of Finance, 49(4), 1213. [Google Scholar] [CrossRef] [Scilit]
- López-Sánchez, P., Urquía-Grande, E., del Campo, C., & Cancer, A. L. (2021). Delving into the determinants of default risk in savings groups: Empirical evidence from Ecuador. The European Journal of Development Research, 34(6), 2625. [Google Scholar] [CrossRef] [Scilit] [PubMed]
- Lundberg, S. M., & Lee, S. I. (2017). A unified approach to interpreting model predictions. Advances in Neural Information Processing Systems, 30, 4766–4775. [Google Scholar]
- Malkiel, B. G., & Fama, E. F. (1970). Efficient capital markets: A review of theory and empirical work. The Journal of Finance, 25(2), 383–417. [Google Scholar] [CrossRef] [Scilit]
- McKillop, D., French, D., Quinn, B., Sobiech, A. L., & Wilson, J. O. S. (2020). Cooperative financial institutions: A review of the literature. International Review of Financial Analysis, 71, 101520. [Google Scholar] [CrossRef] [Scilit] [PubMed]
- Merton, R. C. (1974). On the pricing of corporate debt: The risk structure of interest rates. The Journal of Finance, 29(2), 449–470. [Google Scholar] [CrossRef] [Scilit]
- Modigliani, F., & Miller, M. H. (1958). The cost of capital, corporation finance and the theory of investment|JSTOR. The American Economic Review, 48, 261–297. [Google Scholar]
- Myers, S. C. (1977). Determinants of corporate borrowing. Journal of Financial Economics, 5(2), 147–175. [Google Scholar] [CrossRef] [Scilit]
- Ohlson, J. A. (1980). Financial ratios and the probabilistic prediction of bankruptcy. Journal of Accounting Research, 18(1), 109–131. [Google Scholar] [CrossRef] [Scilit]
- Perez-Cruz, F., Prenio, J., Restoy, F., & Yong, J. (2025). Managing explanations: How regulators can address AI explainability. Available online: https://www.bis.org/fsi/fsipapers24.htm (accessed on 9 July 2026).
- Perez-Vincent, S. M., Puebla, D., Alvarado, N., Mejía, L. F., Cadena, X., Higuera, S., & Niño, J. D. (2024). The costs of crime and and violence: Expansion and update of estimates for latin America and the Caribbean. Inter-American Development Bank. [Google Scholar] [CrossRef] [Scilit]
- Petratos, P., Hussainey, K., Sodnomdavaa, T., & Lkhagvadorj, G. (2025). Financial statement fraud detection through an integrated machine learning and explainable AI framework. Journal of Risk and Financial Management, 19(1), 13. [Google Scholar] [CrossRef] [Scilit]
- Petropoulos, F., Apiletti, D., Assimakopoulos, V., Babai, M. Z., Barrow, D. K., Ben Taieb, S., Bergmeir, C., Bessa, R. J., Bijak, J., Boylan, J. E., Browell, J., Carnevale, C., Castle, J. L., Cirillo, P., Clements, M. P., Cordeiro, C., Cyrino Oliveira, F. L., De Baets, S., Dokumentov, A., … Ziel, F. (2022). Forecasting: Theory and practice. International Journal of Forecasting, 38(3), 705–871. [Google Scholar] [CrossRef] [Scilit]
- Price, A. T., & Counsel, A. (2020). Global regulatory update world council of credit Unions 2020 edition Panya Monford, Esq. Available online: http://www.woccu.org/publications/statreport (accessed on 9 July 2026).
- Purnell, D., Etemadi, A., & Kamp, J. (2024). Developing an early warning system for financial networks: An explainable machine learning approach. Entropy, 26(9), 796. [Google Scholar] [CrossRef] [Scilit] [PubMed]
- SEPS: Superintendencia de Economía Popular y Solidaria. (2024). Fichas metodologicas de indicadores financieros—Portal estadístico. Available online: https://estadisticas.seps.gob.ec/index.php/sdm_downloads/fichas-metodologicas-de-indicadores-financieros/ (accessed on 9 July 2026).
- Shumway, T. (2001). Forecasting bankruptcy more accurately: A simple hazard model. Source: The Journal of Business, 74(1), 101–124. [Google Scholar] [CrossRef] [Scilit] [PubMed]
- Stiglitz, J. E., & Weiss, A. (1981). Credit rationing in markets with rationing credit information imperfect. The American Economic Review, 71(3), 393–410. [Google Scholar]
- Wang, M., Zhang, X., Yang, Y., & Wang, J. (2025). Explainable machine learning in risk management: Balancing accuracy and interpretability. Journal of Financial Risk Management, 14(3), 185–198. [Google Scholar] [CrossRef]
- Wirth, R., & Hipp, J. (2000). CRISP-DM: Towards a standard process model for data mining. Available online: https://www.cs.unibo.it/~montesi/CBD/Beatriz/10.1.1.198.5133.pdf (accessed on 9 July 2026).
- Yao, K. C., Hung, H. C., Wang, C. H., Huang, W. L., Liang, H. T., Chu, T. H., Chen, B. S., & Ho, W. S. (2025). Application of generative AI in financial risk prediction: Enhancing model accuracy and interpretability. Information, 16(10), 857. [Google Scholar] [CrossRef] [Scilit]

Disclaimer/Publisher’s Note: The statements, opinions and data contained in all publications are solely those of the individual author(s) and contributor(s) and not of MDPI and/or the editor(s). MDPI and/or the editor(s) disclaim responsibility for any injury to people or property resulting from any ideas, methods, instructions or products referred to in the content. |
© 2026 by the authors. Licensee MDPI, Basel, Switzerland. This article is an open access article distributed under the terms and conditions of the Creative Commons Attribution (CC BY) license.