


Summary
Recognition and severity assessment of valvular regurgitation is increasingly important and one of the main indications to order an echocardiographic examination. Clinical findings may be misleading. There are several methods to assess regurgitation by Doppler echocardiography. Jet area by color Doppler mapping is widely used but is influenced by a lot of factors and subject to many limitations. Vena contracta - which is the narrowest portion downstream of the orifice as the regurgitant jet downstream passes through the valve - is an appealing method. It correlates well with other quantitative measures for severity of mitral, aortic and tricuspid regurgitation; however, it needs a lot of practice. Proximal isovelocity surface area (PISA) is theoretically a very attractive method based on symmetrical acceleration of flow toward an orifice; by conservation of mass, flow through any isovelocity shell is equal to instantaneous orifice flow. For optimal results of PISA, however, the orifice of the regurgitant orifice should be circular and infinitely small which is not anatomic reality. Pulsed Doppler and 2D methods have been widely recommended and validated, however, these measurements are very difficult to obtain reliably and are controversial. Methods under evaluation are 3D reconstructions of color Doppler jets, and most promisingly, power Doppler based methods. However, even as of today, there is no single reliable method to quantify valvular regurgitation by echocardiography. Thus, quantitation of flow rate through regurgitant valves remains a challenging goal of research and clinical cardiology.
Zusammenfassung
Diagnose und Quantifizierung von Herzklappeninsuffizienzen sind zunehmend wichtig im klinischen Alltag und bleiben eine der Hauptindikationen, eine echokardiographische Untersuchung zu veranlassen. Klinische Befunde können irreführend sein. Es gibt mehrere mögliche Methoden, um Klappeninsuffizienzen mit der Echokardiographie abklären zu können. Die Fläche des Insuffizienz-Jets mittels Farb-Doppler-Echokardiographie wird am häufigsten verwendet; sie wird aber von so vielen Faktoren beeinflusst, dass sie nicht zuverlässig ist. Die Vena contracta entspricht der engsten Stelle des Insuffizienz-Jets im Bereich der Öffnung; dies ist eine attraktive Methode und korreliert sehr gut mit anderen Messungen zur Quantifizierung von Mitral-, Aorten- und Trikuspidalinsuffizienz. Die Messung der Vena contracta benötigt aber viel Erfahrung. Dies gilt auch für die sogenannte PISA(proximal isovelocity surface area)-Methode, welche theoretisch ebenfalls attraktiv ist. Diese Methode gilt aber nur bei einem zirkulären, unendlich kleinen Loch. Pulsed-Doppler und 2-dimensionale echokardiographische Methoden wurden immer wieder empfohlen und sind validiert; sie sind aber wegen des Aufwands und der Fehleranfälligkeit sehr umstritten. Geforscht wird zur Zeit vorwiegend an Methoden mit dem vielversprechenden Power-Doppler sowie an 3-dimensionalen Rekonstruktionen von Color-Doppler-Jets. Dennoch gibt es auch heutzutage noch keine zuverlässige Methode zur Quantifizierung von Klappeninsuffizienzen mit der Echokardiographie.
Introduction
Assessment and quantification of valvular regurgitation remains one of the major challenges of cardiology even at the beginning of the 21st century. Echocardiography is considered to be the most important and most frequently used method in this regard.
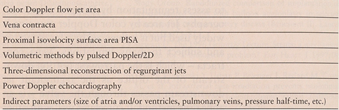
In the following, the various echocardiographic methods used for assessment of valvular regurgitation are summarized as shown in Table 1. The multitude of echocardiographic methods to assess regurgitation already implies that none is perfect. Then, some research methods are shortly described, and lastly, the echocardiographic signs typical of severe regurgitation of the different heart valves are summarized.
Table 1.
Summary of the different echocardiographic methods to assess valvular regurgitation.
Color Doppler flow jet area
With the introduction of Doppler color flow mapping, a spatial appreciation of intracardiac velocities became clinically practicable. Doppler color flow mapping became a fundamental technique for evaluation of regurgitant flow in valvular heart disease and was initially used like an “ultrasound angiogram” – a naive interpretation of this technology [1]. Although, “eyeball measurements” or manual tracing of the jet area seem to work in many clinical situations remarkably well [2,3], there are the following problems: the color Doppler jet area is influenced by blood pressure, jet eccentricity, instrumentation factors, and chamber constraint [4]. It has been shown that there is no correlation between jet area and angiographic grade of mitral regurgitation: conventional jet areas failed to separate groups of patients with different degrees of regurgitation [5]. Central jets due to ischemic or functional mitral regurgitation are overestimated by jet area [6]. An eccentric, wall adherent jet is generally underestimated as it loses its momentum rapidly and has a smaller jet area than a free jet with an identical flow rate with approximately 40% of the size of a corresponding free jet [7]. Visual grading of valvular regurgitant jets may correlate even better with quantitative measures of valvular incompetence than any simple jet area method [8]. Comparison of jet area or jet height by color Doppler to dimension of the left atrium or the left ventricular outflow tract has been described for mitral or aortic valve regurgitation [9,10].
Overall, the size of the color Doppler flow jet is only a rough guide.
Vena contracta (VC)
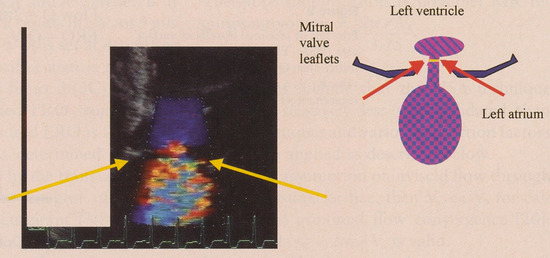
Measurement of VC is an effective and encouraging approach which builds on the work by Mele [11]. The VC is the narrowest extent of the regurgitant jet downstream from an orifice as it passes through the valve (Figure 1). The approach of direct visualization of VC jet width is so simple and the results so encouraging that it is amazing that it was not previously used as the standard to grade the severity of regurgitation [2,11,12]. VC width correlates well with other quantitative measures for severity of mitral, aortic and tricuspid regurgitation [12].
Figure 1.
Example of a color two-dimensional Doppler vena contracta of a mitral regurgitant jet.
Apart from VC width, VC area can be calculated. Defining the entire VC area perfectly is currently impossible but may be possible in the future with 3D reconstruction. The VC area corresponds to the effective regurgitant orifice area (ERO), which is the hemodynamic regurgitant area. ERO is smaller than the anatomical regurgitant area due to contraction of flow as it accelerates through the regurgitant orifice. Therefore as ERO, VC area is also smaller than the anatomic orifice area.
To optimize measurements of the VC width, it is essential to observe all three components of the regurgitant flow (flow convergence, vena contracta, regurgitant jet). Even so, sometimes it is not easy to have reproducible results. Biplane vena contracta width ≥ 0.5 cm (average of VC width from two apical planes [13] in mitral regurgitation correlates with severe regurgitation. VC is good to discriminate mild from severe mitral regurgitation; but there is a large middle ground with VC widths between 3-5 mm where we need other methods to quantify.
Methodology and limitations of the VC
Generally it is recommended to measure a biplane VC from two roughly orthogonal views [12]. Due to poor lateral resolution, one would anticipate that VC width obtained from the parasternal long-axis view would be superior to data obtained from an apical window [2]. The narrowest portion of the jet when it is still laminar just before it turns turbulent should be measured resulting in VC width (Figure 1). The short axis view is not recommended [12]. Despite the first impression of it being an easy method, considerable practice is needed. Color Doppler gain has to be adjusted carefully. To critically match the shape of an often irregular regurgitant orifice, and to account for the dynamic nature of the regurgitant jet throughout systole or diastole, multiple measurements would be necessary to fully describe it. There are problems with diffuse or multiple jets. It is still controversial, if VC is well suited for aortic regurgitation [14], but it performs well for mitral and tricuspid regurgitation.
Proximal isovelocity surface area (PISA)
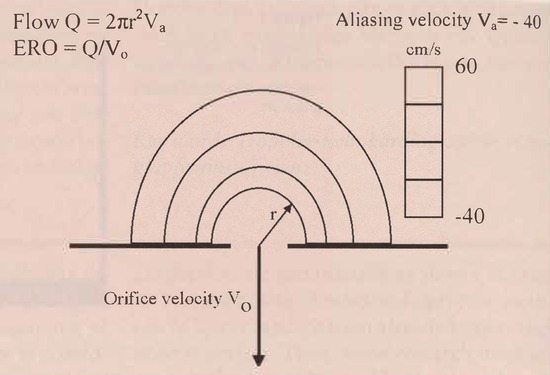
Hydrodynamic theory predicts that flow approaches a pointlike orifice in a flat plane as a series of concentric hemispheric shells of decreasing area and increasing velocity. There is symmetrical acceleration of flow from all angles to an infinitesimally small, round, single regurgitant orifice producing a hemispheric geometry of flow (Figure 2). By conservation of mass, flow rate should be calculable as velocity at any of these hemispheric shells multiplied by the area of that shell. Flow measured in this way appears to be relatively independent of technicạl factors that alter jet appearance such as gain, transmission, power and transducer frequency [15]. There has been considerable and justifiable interest in the flow convergence zone imaged by Doppler color flow mapping hoping that it will finally provide an accurate, quantitative estimation of the severity of regurgitation especially of mitral regurgitation. As an accelerating flow field, it is hydrodynamically more stable, and - with laminar flow-inherently more suited for quantitation by color Doppler than the decelerating jet spray of turbulent regurgitation flow [16]. The principle of proximal isovelocity surface area (PISA) was first used for quantitative purposes by Recusani et al. [15] and is based on the following: All flow passing through a flow convergence zone also passes through the regurgitant orifice; and flow through any isovelocity shell is equal to instantaneous orifice flow. The area of a hemisphere is 2πr2. R is the isovelocity hemisphere radius, which is measured in the centerline of the flow convergence region between the first aliasing contour (red-blue interface) of the flow convergence region and the regurgitant orifice. Flow Q is then calculated as 2πr² multiplied by the aliasing velocity Va. The calculations are shown in Figure 2. Effective regurgitant orifice area (ERO) is then calculated by dividing flow through regurgitant jet velocity Vo obtained with continuous wave Doppler (Figure 2 and Figure 3).
Figure 2.
Principle of proximal isovelocity surface area (PISA). ERO = effective regurgitant orifice area; Q = flow; Va = aliasing velocity; Vo = maximal velocity of regurgitant jet by CW Doppler.
Figure 3.
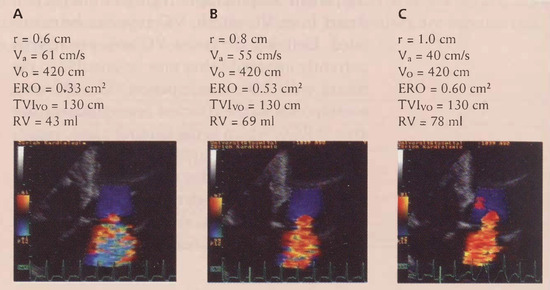
Example of PISA in a 78 year old woman with heart failure. R = radius; Va = aliasing velocity; ERO = effective regurgitant orifice; RV = regutgitanr volume; Vo = maximal velocity of regurgitant jet.
Methodology and limitations of PISA
Color-flow imaging of the regurgitant jet should be optimized from an apical window. The image of the regurgitant valve must be expanded by using zoom or RES. Then the color-flow zero baseline is shifted downward usually to 20-40 cm/s to enlarge the PISA hemisphere. Zero baseline shift of the color flow map is toward direction of desired color flow jet. With cine-mode one can scroll through several cardiac cycles to select the most satisfactory hemispheric PISA. Most commonly one choses midsystole for mitral and tricuspid regurgitation and early-diastole for aortic regurgitation [17].
The effective regurgitant orifice area (ERO) which is smaller than the anatomic orifice area is a major determinant of the severity of regurgitation [16] and reflects actual size of the regurgitant lesion. It is a fundamental parameter of valve integrity and its measurement is relatively load "independent".
A recent publication to simplify measurement of PISA described the following formula: Under the assumption that the pressure difference between the left ventricle and left atrium is always 100 mm Hg which results in a Vo of 5 m/s and the aliasing velocity Va is set at 40 cm/sec then the regurgitant orifice area is r2/2. If we look at the example in Figure 3 (3C), with this simplification, estimated ERO would be 0.5 cm2 (the actually measured ERO is 0.60 cm²). Regurgitant volume is determined by multiplying the size of ERO by the transvalvular regurgitant time velocity integral of the CW Doppler jet (ERO × regurgitant TVI = regurgitant volume). In PISA, all pitfalls associated with regurgitant volume determination may occur. The regurgitant orifice area is dynamic and variable throughout the cardiac cycle. Therefore it is recommended to make either multiple measurements, or some authors advocate to always measure at midsystole in mitral regurgitation. There might be overestimation of regurgitant volume in mitral valve prolapse or dilated cardiomyopathy.
Sometimes, it is really hard to identify the orifice, then the interaliasing distance method might be useful [18]. Occasionally, one can not obtain a complete CW regurgitant signal, especially in eccentric jets, then a simplification of PISA has to be used [19]: Usually the ratio of TVI and peak velocity of mitral regurgitation by continuous wave Doppler are relatively constant:
Limitations include that the PISA technique has been relatively less well validated than other techniques and various correction factors have to be applied as described below.
Under the assumption of inviscid flow through an infinitesimal orifice, then Va << Vo for calculation of proximal flow convergence [20]: the formula Q = 2π ra2 Va is valid.
For larger Vo, flow is underestimated, so Q should be multiplied by
When walls are close then flow may be overestimated due to distortion of contours. The solution is to measure the convergence angle α and to multiply flow by .
By combining these two correction factors, instantaneous regurgitant flow is calculated as:
Quantitative Doppler echocardiography
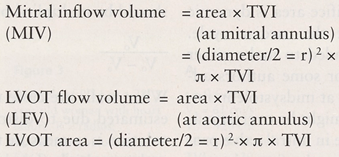
The accuracy of quantitative Doppler remains controversial despite validations studies [21]. The principle of it is that flow across a fixed orifice is equal to the product of the cross-sectional area (CSA) of the orifice and flow velocity: Flow rate = CSA × flow velocity. Because flow velocity varies during ejection in a pulsatile system, individual velocities of the Doppler spectrum should be integrated to measure the total volume of flow during a given ejection period. The sum of velocities is called the time velocity integral (TVI). It is equal to stroke distance (= the distance blood travels with each beat of the heart). Therefore stroke volume (SV) equals CSA (cm2) × TVI (cm). The location which is most frequently used to determine stroke volume is the left ventricular outflow tract (LVOT). Flow across other cardiac orifices can be calculated by using the same formula. The CSA of orifices in the heart is assumed to be a circle and is calculated as CSA = π r2 using the diameter divided by 2 as radius r. Therefore the stroke volume (SV) equals π r2 × TVI.
Quantitative Doppler echocardiographic measurements can give the following data: stroke volume and cardiac output, regurgitant volume and fraction, as well as pulmonary-systemic flow ratio (Qp/Qs) [22]. Total forward volume across a regurgitant valve (Q total) is the sum of systemic stroke volume (Qs) and of regurgitant volume. Hence, regurgitant volume can be obtained by calculating the difference between the total forward stroke volume and systemic stroke volume. Regurgitant volume and fraction can thus be calculated as follows [21]:
- −
- regurgitant volume = volume of blood that regurgitates through an incompetent valve
- −
- regurgitant fraction = fraction or percentage of total stroke volume that regurgitates through an incompetent valve
Measurements required to calculate regurgitant volume and fraction of aortic or mitral valve (assuming the orifices are circular) include mitral annulus diameter (cm), TVI of mitral annulus velocity (cm), aortic annulus diameter (cm), and TVI of aortic annulus velocity (cm).
Important is that the pulsed wave Doppler sample has to be at the annulus (!). The annulus measurement is inner edge to inner edge; mitral annulus is measured at mid-diastole, and the left ventricular outflow tract LVOT at end-systole [22].
Quantitative two-dimensional echocardiography
Left ventricular volumes are measured at endsystole and end-diastole by using the biapical Simpson's rule (method of disks), as recommended by the American Society of Echocardiography [23] or the biplane area length method [24]. The total left ventricular stroke volume is calculated as the difference between end-diastolic and end-systolic volumes. The regurgitant volume is calculated as the difference between the total left ventricular stroke volume and the aortic stroke volume measured with Doppler echocardiography [25]. This method is cumbersome, time-consuming and prone for errors.
Automated calculation of cardiac output
Recently, it has become possible to automatically measure flow through cardiac structures by automated integration of color Doppler velocities throughout the left ventricular outflow tract or mitral annulus [26]. ACOM uses automatic integration of numerical data on digital velocities from a color Doppler flow map by a multibeam Doppler to perform spatiotemporal integration across the LVOT throughout systole [26] which allows accurate, rapid and simple estimation of cardiac output in routine clinical practice with excellent correlations. In mitral regurgitation, it was experimentally and clinically validated [27]. Despite the demonstrated accuracy of these techniques, however, they are rarely applied in clinical practice, primarily because of the rigor with which they must be performed. A clear limitation is that it uses only one view (apical 5-chamber or long-axis view). There is clear gain dependency and image quality also affects accuracy. An error in any of these measurements is propagated throughout the calculations. Additionally, ACOM assumes that the velocity recorded at a certain point across the LVOT represents velocities in a hemicircular arc on the side, therefore ACOM measurements are not valid if there are marked distortions of LVOT (hypertrophic cardiomyopathy etc.). Also, ACOM is based on the assumption of a rotational symmetry of the velocity profile which is not fulfilled.
3D reconstruction of color Doppler flow
Two-dimensional-pulsed Doppler methods are not ideal for assessing blood flow since they require geometrical assumptions on flow area and flow profile. Therefore 3-dimensional methods might be advantageous but so far they are only useful for experimental purposes. Not surprisingly, assessment of regurgitation is better with 3D Doppler jet volumes than with 2-dimensional jet-areas and has some potential for becoming a reference method in the future [5,28]. Jet volumes obtained by 3D reconstruction may be more helpful and seem to correlate significantly with angiography [5]. However, we see velocity flow rather than volume flow, therefore, we are not truly imaging the volume also in 3D reconstructed jets [29]. Still 3D reconstruction can aid computational methods for evaluating valvular regurgitation [30]. Theoretically, useful 3D reconstructions would be of the left ventricular inflow and left ventricular outflow. Digital 3D color Doppler was also used in a physiological pulsatile model to assess flow volumes in the pulmonary artery [31].
Power Doppler
As Doppler measures velocity, but orifice area is unknown and often variable throughout regurgitation, another approach has been proposed based on backscattered acoustic power from the Doppler signal [32,33,34]. This corresponds to the formula: Velocity × power α flow rate. Backscattered power is a nonlinear function of the hematocrit, resulting from interference of sound waves returning from scatterers with the Doppler sample volume. For a given hematocrit, blood flow through a disk-like sample volume of fixed height, backscattered power is linearly proportional to the blood volume of scatterers, and therefore, will be linearly proportional to the cross sectional area of flow within the beam. As backscattered power depends on round-trip attenuation of sound and backscattering coefficient, these power measurements must be calibrated in the same individual against power returning from a beam of known CSA that lies at the same depth as the pathological flow of interest. As a correct result is dependent on laminar flow, the only possible approach in a regurgitant jet would be to quantify flow at the vena contracta where flow is still laminar [34]. Experimentally, the power-velocity integral at the vena contracta was accurate in comparison with MRI or 3D echocardiography [34]. More experience is lacking.
Mitral regurgitation
The most common etiologies of severe mitral regurgitation (MR) include mitral valve prolapse, flail mitral leaflet, ruptured chordae, annulus dilatation, papillary muscle dysfunction, papillary muscle rupture, rheumatic valve, drugs, endocarditis, cleft mitral valve, perforation of the leaflets and systemic diseases such as systemic lupus erythematosus.
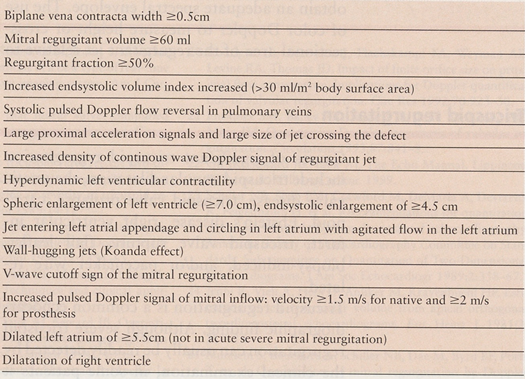
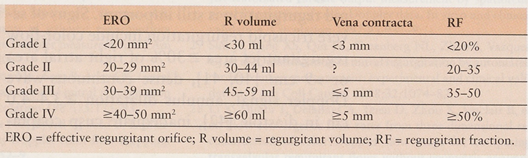
Some of the echocardiographic signs of severe MR are summarized in the Table 2 and Table 3 [35,36]. Generally, best assessments of valvular regurgitation are possible by integration of several parameters.
Table 2.
Echocardiographic signs of severe mitral regurgitation.
Table 3.
Echocardiographic grading of severity of mitral regurgitation.
The CW Doppler spectrum of the regurgitant jet is important: An asymmetrical MR shape characterized by an early peak of the maximal velocity and a steeper decline are the consequence of a large atrial v-wave. Reversed pulmonary venous flow in systole has been described as a highly specific and reliable marker of moderate or severe mitral regurgitation with an ERO of > 0.3 cm2, whereas the normal pattern accurately predicts not severe MR. However, blunted pulmonary venous flow can be seen in all grades of MR with low predictive value for severity of MR, especially in the presence of LV dysfunction [37]. For the diagnosis of severe MR, systolic flow reversal in the pulmonary veins has thus a relatively low sensitivity of 60% but a high specificity of 85-92% [38]. Generally, if interpreting a certain value of regurgitant volume, one has to take into account that it is also affected by heart rate (a higher heart rate decreases regurgitant volume), transformation into potential energy and body surface area.
Aortic regurgitation
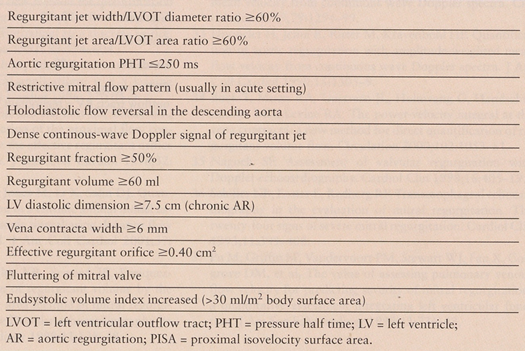
Causes of aortic regurgitation include degenerative aortic valve disease, dilated aortic root, congenitally abnormal valve, Marfan syndrome, endocarditis, aortic dissection, prosthetic valve dysfunction, and/or drug effects. Signs of severe aortic regurgitation are summarized in Table 4. Pulsed Doppler flow mapping has been abandoned. Although measurement of the pressure half-time of the aortic regurgitant jet is useful, it is influenced by left ventricular end-diastolic pressure, systemic vascular resistance, loading conditions and associated valvular lesions [39]. However, although overestimation of aortic regurgitation with pressure half-time is possible, underestimation rarely occurs. Sometimes it is hard to obtain an adequate spectral envelope. The use of color Doppler to measure height or cross-sectional area of the regurgitant jet relative to height or area of left ventricular outflow tract is both sensitive and specific and very helpful [10].
Table 4.
Echocardiographic signs of severe aortic regurgitation.
Tricuspid regurgitation
Causes of significant tricuspid regurgitation include tricuspid annular dilatation, rheumatic valve disease, tricuspid valve prolapse, carcinoid, Ebstein's disease, right ventricular infarct, tricuspid valve rupture, flail leaflet, biopsy-induced, and/or pacemaker wire related.
Tricuspid regurgitation is a common echocardiographic finding. Although severe tricuspid regurgitation can usually be readily detected by the clinical examination, in some patients it might be more difficult and therefore echocardiographic assessment of the severity of tricuspid regurgitation is still important. Signs of severe tricuspid regurgitation include color-flow regurgitant jet area ≥ 30% of right atrial area or > 9 cm² [40,41], dense continuous-wave Doppler signal, annulus dilatation ≥ 3.4–4.0 cm in diastole [42], inadequate cusp coaptation, late systolic concave configuration of continuous wave signal, early peaking of tricuspid regurgitation signal, increased tricuspid inflow velocity of ≥ 1.0 m/s, vena contracta ≥ 6.5 mm from an apical view at mid-systole [43], systolic flow reversals in the hepatic vein [41], inferior vena cava diameter of ≥ 2.1 cm, lack of respiratory variation of inferior vena cava size and/or laminar flow by pulse wave signal placed behind the cusps in systole [44]. Actually, systolic flow reversal in the hepatic vein is considered to be one of the best signals [41,45].
There are the previously mentioned limitations, additionally, the tricuspid regurgitant orifice shape is unknown. There is some underestimation of severity of tricuspid regurgitation by the jet area method and proximal isovelocity surface method [46].
Pulmonary regurgitation
The most common causes of significant pulmonary regurgitation include pulmonary hypertension, absent pulmonary valve or other congenital anomaly of the pulmonary valve, repaired tetralogy of Fallot, carcinoid, endocarditis, idiopathic dilatation of pulmonary artery, or the antiphospholipid syndrome [47].
Signs of severe pulmonary regurgitation include right ventricular and/or right atrial dilatation, right ventricular dysfunction, steep Doppler velocity decay slope, increased QRS duration, and an increased myocardial performance index [48,49].
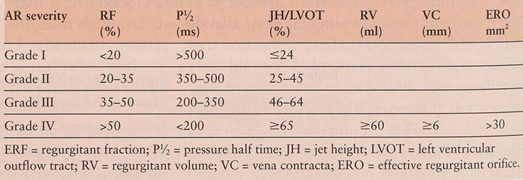
Table 5.
Echocardiographic signs of severe aortic regurgitation (grading).
References
- Miyatake, K.; Okamoto, M.; Kinoshita, N.; Izumi, S.; Owa, M.; Takao, S.; et al. Clinical applications of a new type of real-time two-dimensional Doppler flow imaging system. Am. J. Cardiol. 1984, 54, 857–68. [Google Scholar] [CrossRef] [Scilit] [PubMed]
- Thomas, J.D. How leaky is that mitral valve? Simplified Doppler methods to measure regurgitant orifice area. Circulation 1997, 95, 548–50. [Google Scholar] [CrossRef] [Scilit] [PubMed]
- Child, J.S. Improved guides to tricuspid valve repair: two-dimensional echocardiographic analysis of tricuspid annulus function and color flow imaging of severity of tricuspid regurgitation. J. Am. Coll. Cardiol. 1989, 14, 1275–7. [Google Scholar] [PubMed]
- Sahn, D.J. Instrumentation and physical factors related to visualization of stenotic and regurgitant jets by Doppler color flow mapping. J. Am. Coll. Cardiol. 1988, 12, 1344–65. [Google Scholar] [CrossRef] [Scilit]
- De Simone, R.; Glombitza, G.; Vahl, C.F.; Meinzer, H.P.; Hagl, S. Three-dimensional Doppler. Techniques and clinical applications. Eur. Heart J. 1999, 20, 619–27. [Google Scholar] [CrossRef] [Scilit] [PubMed]
- McCully, R.B.; Enriquez, S.M.; Tajik, A.J.; Seward, J.B. Overestimation of severity of ischemic/functional mitral regurgitation by color Doppler jet area. Am. J. Cardiol. 1994, 74, 790–3. [Google Scholar] [CrossRef] [Scilit] [PubMed]
- Chen, C.G.; Thomas, J.D.; Anconina, J.; Harrigan, P.; Mueller, L.; Picard, M.H.; et al. Impact of impinging wall jet on color Doppler quantification of mitral regurgitation. Circulation 1991, 84, 712–20. [Google Scholar] [CrossRef] [Scilit] [PubMed]
- Rivera, J.M.; Vandervoort, P.M.; Morris, E.; Weyman, A.E.; Thomas, J.D. Visual assessment of valvular regurgitation: comparison with quantitative Doppler measurements. J. Am. Soc. Echocardiogr. 1994, 7, 480–7. [Google Scholar] [CrossRef] [Scilit] [PubMed]
- Helmcke, F.; Nanda, N.C.; Hsiung, M.C.; Soto, B.; Adey, C.K.; Goyal, R.G.; et al. Color Doppler assessment of mitral regurgitation with orthogonal planes. Circulation 1987, 75, 175–83. [Google Scholar] [CrossRef] [Scilit] [PubMed]
- Perry, G.J.; Helmcke, F.; Nanda, N.C.; Byard, C.; Soto, B. Evaluation of aortic insufficiency by Doppler color flow mapping. J. Am. Coll. Cardiol. 1987, 9, 952–9. [Google Scholar] [CrossRef] [Scilit] [PubMed]
- Mele, D.; Vandervoort, P.; Palacios, I.; Rivera, J.M.; Dinsmore, R.E.; Schwammenthal, E.; et al. Proximal jet size by Doppler color flow mapping predicts severity of mitral regurgitation. Clin. Stud. Circ. 1995, 91, 746–54. [Google Scholar] [CrossRef] [Scilit]
- Hall, S.A.; Brickner, M.E.; Willett, D.L.; Irani, W.N.; Afridi, I.; Grayburn, P.A. Assessment of mitral regurgitation severity by Doppler color flow mapping of the vena contracta. Circulation 1997, 95, 636–42. [Google Scholar] [CrossRef] [Scilit] [PubMed]
- Heinle, S.K.; Hall, S.A.; Brickner, M.E.; Willett, D.L.; Grayburn, P.A. Comparison of vena contracta width by multiplane transesophageal echocardiography with quantitative Doppler assessment of mitral regurgitation. Am. J. Cardiol. 1998, 81, 175–9. [Google Scholar] [CrossRef] [Scilit] [PubMed]
- Yamachika, S.; Reid, C.L.; Savani, D.; Meckel, C.; Paynter, J.; Knoll, M.; et al. Usefulness of color Doppler proximal isovelocity surface area method in quantitating valvular regurgitation. J. Am. Soc. Echocardiogr. 1997, 10, 159–68. [Google Scholar] [CrossRef] [Scilit] [PubMed]
- Recusani, F.; Bargiggia, G.S.; Yoganathan, A.P.; Raisaro, A.; Valdes-Cruz, L.M.; Sung, H.W.; et al. A new method for quantification of regurgitant flow rate using color Doppler flow imaging of the flow convergence region proximal to a discrete orifice. An in vitro study. Circulation 1991, 83, 594–604. [Google Scholar] [CrossRef] [Scilit] [PubMed]
- Simpson, I.A.; Shiota, T.; Gharib, M.; Sahn, D.J. Current status of flow convergence for clinical applications: is it a leaning tower of "PISA"? J. Am. Coll. Cardiol. 1996, 27, 504–9. [Google Scholar] [CrossRef] [Scilit] [PubMed]
- Tribouilloy, C.M.; Enriquez-Sarano, M.; Fett, S.L.; Bailey, K.R.; Seward, J.B.; Tajik, A.J. Application of the proximal flow convergence method to calculate the effective regurgitant orifice area in aortic regurgitation. J. Am. Coll. Cardiol. 1998, 32, 1032–9. [Google Scholar] [CrossRef] [Scilit] [PubMed]
- El-Sedfy, G.O.M.; Davies, C.H.; Jones, M.; Li, X.; Sahn, D.J. Quantitation of aortic regurgitation in a chronic animal model using an automated color M-mode interaliasing distance flow convergence region method. J. Am. Coll. Cardiol. 2001, 37, A409. [Google Scholar]
- Rossi, A.; Dujardin, K.S.; Bailey, K.R.; Seward, J.B.; Enriquez-Sarano, M. Rapid estimation of regurgitant volume by the proximal isovelocity surface area method in mitral regurgitation: Can continuous-wave Doppler echocardiography be omitted? J. Am. Soc. Echocardiogr. 1998, 11, 138–48. [Google Scholar] [CrossRef] [Scilit] [PubMed]
- Rodriguez, L.; Anconina, J.; Flachskampf, F.A.; Weyman, A.E.; Levine, R.A.; Thomas, J.D. Impact of finite orifice size on proximal flow convergence. Implications for Doppler quantification of valvular regurgitation. Circ. Res. 1992, 70, 923–30. [Google Scholar] [CrossRef] [Scilit] [PubMed]
- Enriquez, S.M.; Bailey, K.R.; Seward, J.B.; Tajik, A.J.; Krohn, M.J.; Mays, J.M. Quantitative Doppler assessment of valvular regurgitation. Circulation 1993, 87, 841–8. [Google Scholar] [CrossRef] [Scilit]
- Oh, J.K.; Seward, J.B.; Tajik, A.J. The Echo Manual. Lippincott Williams & Williams, editor; 1999. [Google Scholar]
- Schiller, N.B.; Shah, P.M.; Crawford, M.; DeMaria, A.; Devereux, R.; Feigenbaum, H.; et al. Recommendations for quantitation of the left ventricle by two-dimensional echocardiography. American Society of Echocardiography Committee on Standards, Subcommittee on Quantitation of Two-Dimensional Echocardiograms. J. Am. Soc. Echocardiogr. 1989, 2, 358–67. [Google Scholar] [CrossRef] [Scilit] [PubMed]
- Jenni, R.; Vieli, A.; Hess, O.; Anliker, M.; Kraynenbeuhl, H.P. Estimation of left ventricular volume from apical orthogonal two-dimensional echocardiograms. Eur. Heart J. 1981, 2, 217–25. [Google Scholar] [CrossRef] [Scilit] [PubMed]
- Blumlein, S.; Bouchard, A.; Schiller, N.B.; Dae, M.; Byrd, B.F.; Ports, T.; et al. Quantitation of mitral regurgitation by Doppler echocardiography. Circulation 1986, 74, 306–14. [Google Scholar] [CrossRef] [Scilit] [PubMed]
- Sun, J.P.; Pu, M.; Fouad, F.M.; Christian, R.; Stewart, W.J.; Thomas, J.D. Automated cardiac output measurement by spatiotemporal integration of color Doppler data. In vitro and clinical validation. Circulation 1997, 95, 932–9. [Google Scholar] [CrossRef] [Scilit] [PubMed]
- Sun, J.P.; Yang, X.S.; Qin, J.X.; Greenberg, N.L.; Zhou, J.; Vazquez, C.J.; et al. Quantification of mitral regurgitation by automated cardiac output measurement: experimental and clinical validation. J. Am. Coll. Cardiol. 1998, 32, 1074–82. [Google Scholar] [CrossRef] [Scilit] [PubMed]
- Li, X.; Shiota, T.; Delabays, A.; Teien, D.; Zhou, X.; Sinclair, B.; et al. Flow convergence flow rates from three-dimensional reconstruction of color Doppler flow maps for computing transvalvular regurgitant flows without geometric assumptions: an in vitro quantitative flow study. J. Am. Soc. Echocardiogr. 1999, 12, 1035–44. [Google Scholar] [CrossRef] [Scilit] [PubMed]
- Losordo, D.W.; Pastore, J.O.; Coletta, D.; Kenny, D.; Isner, J.M. Limitations of color flow Doppler imaging in the quantification of valvular regurgitation: velocity of regurgitant jet, rather than volume, determines size of color Doppler image. Am. Heart J. 1993, 126, 168–76. [Google Scholar] [CrossRef] [Scilit] [PubMed]
- Shiota, T.; Sinclair, B.; Ishii, M.; Zhou, X.; Ge, S.; Teien, D.E.; et al. Three-dimensional reconstruction of color Doppler flow convergence regions and regurgitant jets: an in vitro quantitative study. J. Am. Coll. Cardiol. 1996, 27, 1511–8. [Google Scholar] [CrossRef] [Scilit] [PubMed]
- Sahn, D.J.; Strehlow, M.C.; Mehwald, P.S.; Totonchy, T.Z. Three-dimensional computations of digital flow profiles for assessing flow volumes through the main pulmonary artery and its branches: an in vitro physiological porcine pulmonary artery model. J. Am. Coll. Cardiol. 2001, 37, A408. [Google Scholar] [CrossRef] [Scilit]
- Jenni, R.; Ritter, M.; Eberli, F.; Grimm, J.; Krayenbuehl, H.P. Quantification of mitral regurgitation with amplitude-weighted mean velocity from continuous wave Doppler spectra. Circulation 1989, 79, 1294–99. [Google Scholar] [CrossRef] [Scilit] [PubMed]
- Hoppeler, H.; Jenni, R.; Ritter, M.; Kraynenbeuhl, H.P. Quantification of aortic regurgitation with amplitude-weighted mean flow velocity from continuous wave Doppler spectra. J. Am. Coll. Cardiol. 1990, 15, 1305–9. [Google Scholar] [CrossRef] [Scilit] [PubMed]
- Buck, T.; Mucci, R.A.; Guerrero, J.L.; Holmvang, G.; Handschumacher, M.D.; Levine, R.A. The power-velocity integral at the vena contracta: a new method for direct quantification of regurgitant volume flow. Circulation 2000, 102, 1053–61. [Google Scholar] [CrossRef] [Scilit] [PubMed]
- Nagueh, S.F. Assessment of valvular regurgitation with Doppler echocardiography. Cardiol. Clin. 1998, 16, 405–19. [Google Scholar] [CrossRef] [Scilit] [PubMed]
- Schiller, N.B.; Foster, E.; Redberg, R.F. Transesophageal echocardiography in the evaluation of mitral regurgitation. The twenty-four signs of severe mitral regurgitation. Cardiol. Clin. 1993, 11, 399–408. [Google Scholar] [CrossRef] [Scilit] [PubMed]
- Pu, M.; Griffin, B.P.; Vandervoort, P.M.; Stewart, W.J.; Fan, X.; Cosgrove, D.M.; et al. The value of assessing pulmonary venous flow velocity for predicting severity of mitral regurgitation: a quantitative assessment integrating left ventricular function. J. Am. Soc. Echocardiogr. 1999, 12, 736–43. [Google Scholar] [CrossRef] [Scilit] [PubMed]
- Enriquez, S.M.; Dujardin, K.S.; Tribouilloy, C.M.; Seward, J.B.; Yoganathan, A.P.; Bailey, K.R.; et al. Determinants of pulmonary venous flow reversal in mitral regurgitation and its usefulness in determining the severity of regurgitation. Am. J. Cardiol. 1999, 83, 535–41. [Google Scholar] [CrossRef] [Scilit]
- Ekery, D.L.; Davidoff, R. Aortic regurgitation: quantitative methods by echocardiography. Echocardiography 2000, 17, 293–302. [Google Scholar] [CrossRef] [Scilit] [PubMed]
- Chopra, H.K.; Nanda, N.C.; Fan, P.; Kapur, K.K.; Goyal, R.; Daruwalla, D.; et al. Can two-dimensional echocardiography and Doppler color flow mapping identify the need for tricuspid valve repair? J. Am. Coll. Cardiol. 1989, 14, 1266–74. [Google Scholar] [CrossRef] [Scilit] [PubMed]
- Shapira, Y.; Porter, A.; Wurzel, M.; Vaturi, M.; Sagie, A. Evaluation of tricuspid regurgitation severity: echocardiographic and clinical correlation. J. Am. Soc. Echocardiogr. 1998, 11, 652–9. [Google Scholar] [CrossRef] [Scilit] [PubMed]
- Fisher, E.A.; Goldman, M.E. Simple, rapid method for quantification of tricuspid regurgitation by two-dimensional echocardiography. Am. J. Cardiol. 1989, 63, 1375–8. [Google Scholar] [CrossRef] [Scilit] [PubMed]
- Tribouilloy, C.M.; Enriquez, S.M.; Bailey, K.R.; Tajik, A.J.; Seward, J.B. Quantification of tricuspid regurgitation by measuring the width of the vena contracta with Doppler color flow imaging: a clinical study. J. Am. Coll. Cardiol. 2000, 36, 472–8. [Google Scholar] [CrossRef] [Scilit] [PubMed]
- Minagoe, S.; Rahimtoola, S.H.; Chandraratna, P.A. Significance of laminar systolic regurgitant flow in patients with tricuspid regurgitation: a combined pulsed wave, continuous wave Doppler and two-dimensional echocardiographic study. Am. Heart J. 1990, 119, 627–35. [Google Scholar] [CrossRef] [Scilit] [PubMed]
- Rivera, J.M.; Vandervoort, P.M.; Vazquez-de-Prada, J.A.; Mele, D.; Karson, T.H.; Morehead, A.; et al. Which physical factors determine tricuspid regurgitation jet area in the clinical setting? Am. J. Cardiol. 1993, 72, 1305–9. [Google Scholar] [CrossRef] [Scilit] [PubMed]
- Grossmann, G.; Stein, M.; Kochs, M.; Hoher, M.; Koenig, W.; Hombach, V.; et al. Comparison of the proximal flow convergence method and the jet area method for the assessment of the severity of tricuspid regurgitation. Eur. Heart J. 1998, 19, 652–9. [Google Scholar] [CrossRef] [Scilit] [PubMed]
- Altrichter, P.M.; Olson, L.J.; Edwards, W.D.; Puga, F.J.; Danielson, G.K. Surgical pathology of the pulmonary valve: a study of 116 cases spanning 15 years. Mayo Clin. Proc. 1989, 64, 1352–60. [Google Scholar] [CrossRef] [Scilit] [PubMed]
- Abd-El-Rahman, M.Y.; Abdul, K.H.; Vogel, M.; Alexi, M.V.; Gutberlet, M.; Lange, P.E. Relation between right ventricular enlargement, QRS duration, and right ventricular function in patients with tetralogy of Fallot and pulmonary regurgitation after surgical repair. Heart 2000, 84, 416–20. [Google Scholar] [CrossRef] [Scilit] [PubMed]
- Lei, M.H.; Chen, J.J.; Ko, Y.L.; Kuan, P.; Lien, W.P. Reappraisal of quantitative evaluation of pulmonary regurgitation and estimation of pulmonary artery pressure by continuous wave Doppler echocardiography. Cardiology 1995, 86, 249–56. [Google Scholar] [CrossRef] [Scilit] [PubMed]

© 2001 by the author. Attribution - Non-Commercial - NoDerivatives 4.0.