


Abstract
Background and Objectives: Periprosthetic femoral fracture (PFF) after hip arthroplasty carries a high mortality rate and a substantial economic burden. National databases have modelled the determinants of hospital cost but cover the index admission alone, without post-discharge survival or an adjudicated fracture classification. We assessed the contributions of patient factors, fracture pattern, and surgical strategy to both outcomes, analysed separately, within a single cohort. Materials and Methods: We retrospectively analysed 74 consecutive patients treated surgically for a PFF at one tertiary centre between September 2017 and December 2023. All-cause mortality, the primary endpoint, was examined by Cox regression, with the Vancouver pattern and the surgical strategy entered as adjusted exposures, separately and together; in-hospital cost, the secondary endpoint, was modelled by gamma regression, with and without length of stay. Results: The mean age was 77.5 years. Forty-two patients (56.8%) died; median survival was 20.8 months and the Kaplan–Meier one-year mortality was 36.8%. Age (adjusted HR 1.06 per year, 95% CI 1.02–1.09, p = 0.001) and ASA class (adjusted HR 3.00 per grade, 1.30–6.96, p = 0.010) were independently associated with mortality, whereas an unstable-stem pattern was not (adjusted HR 0.95, 0.47–1.91). For revision versus osteosynthesis, the hazard was not proportional over time, so the averaged hazard ratio (1.67, 0.74–3.74) did not summarise the association, and exploratory period-specific estimates rested on few events; with only 15 revision procedures, comparisons between surgical strategies were imprecise. Cost was independently associated with ASA class (cost ratio 2.12, 1.44–3.11, p < 0.001) and revision surgery (1.98, 1.34–2.94, p < 0.001), with the latter attenuating to 1.53 (1.08–2.18) once length of stay was added; the revision estimate was robust to alternative distributional assumptions and to the exclusion of influential observations, whereas the magnitude of the ASA estimate depended on a few high-cost patients. Conclusions: Age and ASA class were associated with mortality, whereas ASA class, length of stay, and revision surgery were associated with in-hospital cost. Whether survival differs between revision and osteosynthesis could not be determined, because only 15 patients underwent revision, the hazard was time-varying, and allocation was subject to confounding by indication; the absence of a statistically significant difference does not indicate comparable survival. Within the limits of an observational cohort subject to confounding by indication, these associations support combining patient-based prognostic assessment with fracture-based surgical planning.
1. Introduction
Total hip arthroplasty (THA) and hemiarthroplasty are among the most frequently performed procedures in orthopaedics, and the number of procedures performed continues to rise as populations age and the indications widen [1]. This results in a growing population living with a femoral implant and at lifelong risk of periprosthetic femoral fracture (PFF), whose cumulative risk registries place at 0.4% to 3.5% [2,3]. These fractures are among the fastest growing modes of arthroplasty failure, with the proportion of revisions attributable to them nearly tripling over the past decade [4], and are now among the leading indications for revision surgery [5,6].
PFF typically occurs in elderly patients with multiple comorbidities after a low-energy fall [7]. Surgical management is technically demanding and carries high rates of reoperation and medical complications [8], and reported one-year mortality clusters between 16% and 24% [9,10], with some series exceeding 30% [11,12], the same prognostic territory as native fragility fracture of the hip [13,14]. The Vancouver classification, integrating fracture location, stem stability, and bone stock, reliably guides the choice between osteosynthesis and revision arthroplasty [15,16]. Management is nevertheless demanding in older patients with osteoporosis, reduced bone stock, multiple comorbidities, and limited physiological reserve, in whom the choice of operation must balance implant stability, fracture morphology, the feasibility of fixation, operative invasiveness, and the risk of postoperative complications [8,15,16]. In older adults with proximal femoral fractures treated in an orthogeriatric setting, pre-fracture functional autonomy and its loss in the months after discharge were associated with one-year mortality [17]; this suggests that functional status before the injury, recorded in the present cohort as pre-fracture dependence, may be as relevant to prognosis after a PFF as the fracture pattern itself.
Mortality and cost after PFF have each been reported, and hospital expenditure is consistently higher after revision arthroplasty than after fixation [18,19]. A single-centre registry study has already described both outcomes in the same patients, reporting mortality up to one year together with hospital charges and costs by treatment group; cost was compared between groups without multivariable adjustment, and mortality was analysed as a binary one-year outcome [18]. Large administrative-database analyses have modelled the determinants of expenditure, identifying revision surgery, comorbidity burden, blood product use, and length of stay as independent correlates of cost, and have examined in-hospital mortality in the same encounters [19,20]. Such datasets, however, capture the index admission only: they contain no survival after discharge and no clinically adjudicated Vancouver classification, index-implant designation, or frailty measure. The incremental contribution sought here is therefore specific: adjusted models of in-hospital cost combined with a time-to-event analysis of post-discharge survival and a clinical fracture classification in one patient-level cohort. The two outcomes are analysed separately in the same patients; no joint cost–survival model is fitted. Examining both outcomes in the same patients shows whether the characteristics that predict death also predict expenditure, which is relevant to preoperative counselling, to the allocation of perioperative and orthogeriatric resources, and to weighing the additional cost of revision against its clinical indication.
Therefore, we analysed a consecutive single-centre cohort with all-cause mortality as the primary endpoint and in-hospital cost as the secondary endpoint. The primary objective was to determine survival and identify independent predictors of death, testing the Vancouver pattern, surgical strategy, and index arthroplasty as adjusted exposures and quantifying frailty with a validated index; the secondary objective was to identify the determinants of in-hospital cost in the same admissions.
2. Materials and Methods
2.1. Study Design, Setting, and Ethics
We retrospectively analysed routinely collected clinical data from a single-centre observational cohort at a tertiary referral centre for complex arthroplasty and orthopaedic trauma. Consecutive patients treated surgically for PFF following hip arthroplasty between September 2017 and December 2023 were included; clinical and radiographic data were retrieved from the hospital information and picture archiving systems. The study was approved by the Non-Interventional Clinical Research Ethics Committee of Kayseri City Training and Research Hospital (protocol code 27, 28 March 2024), which waived the requirement for informed consent because of the retrospective design and the use of anonymised, routinely collected data. The study is reported in accordance with the STROBE statement for observational studies.
2.2. Participants
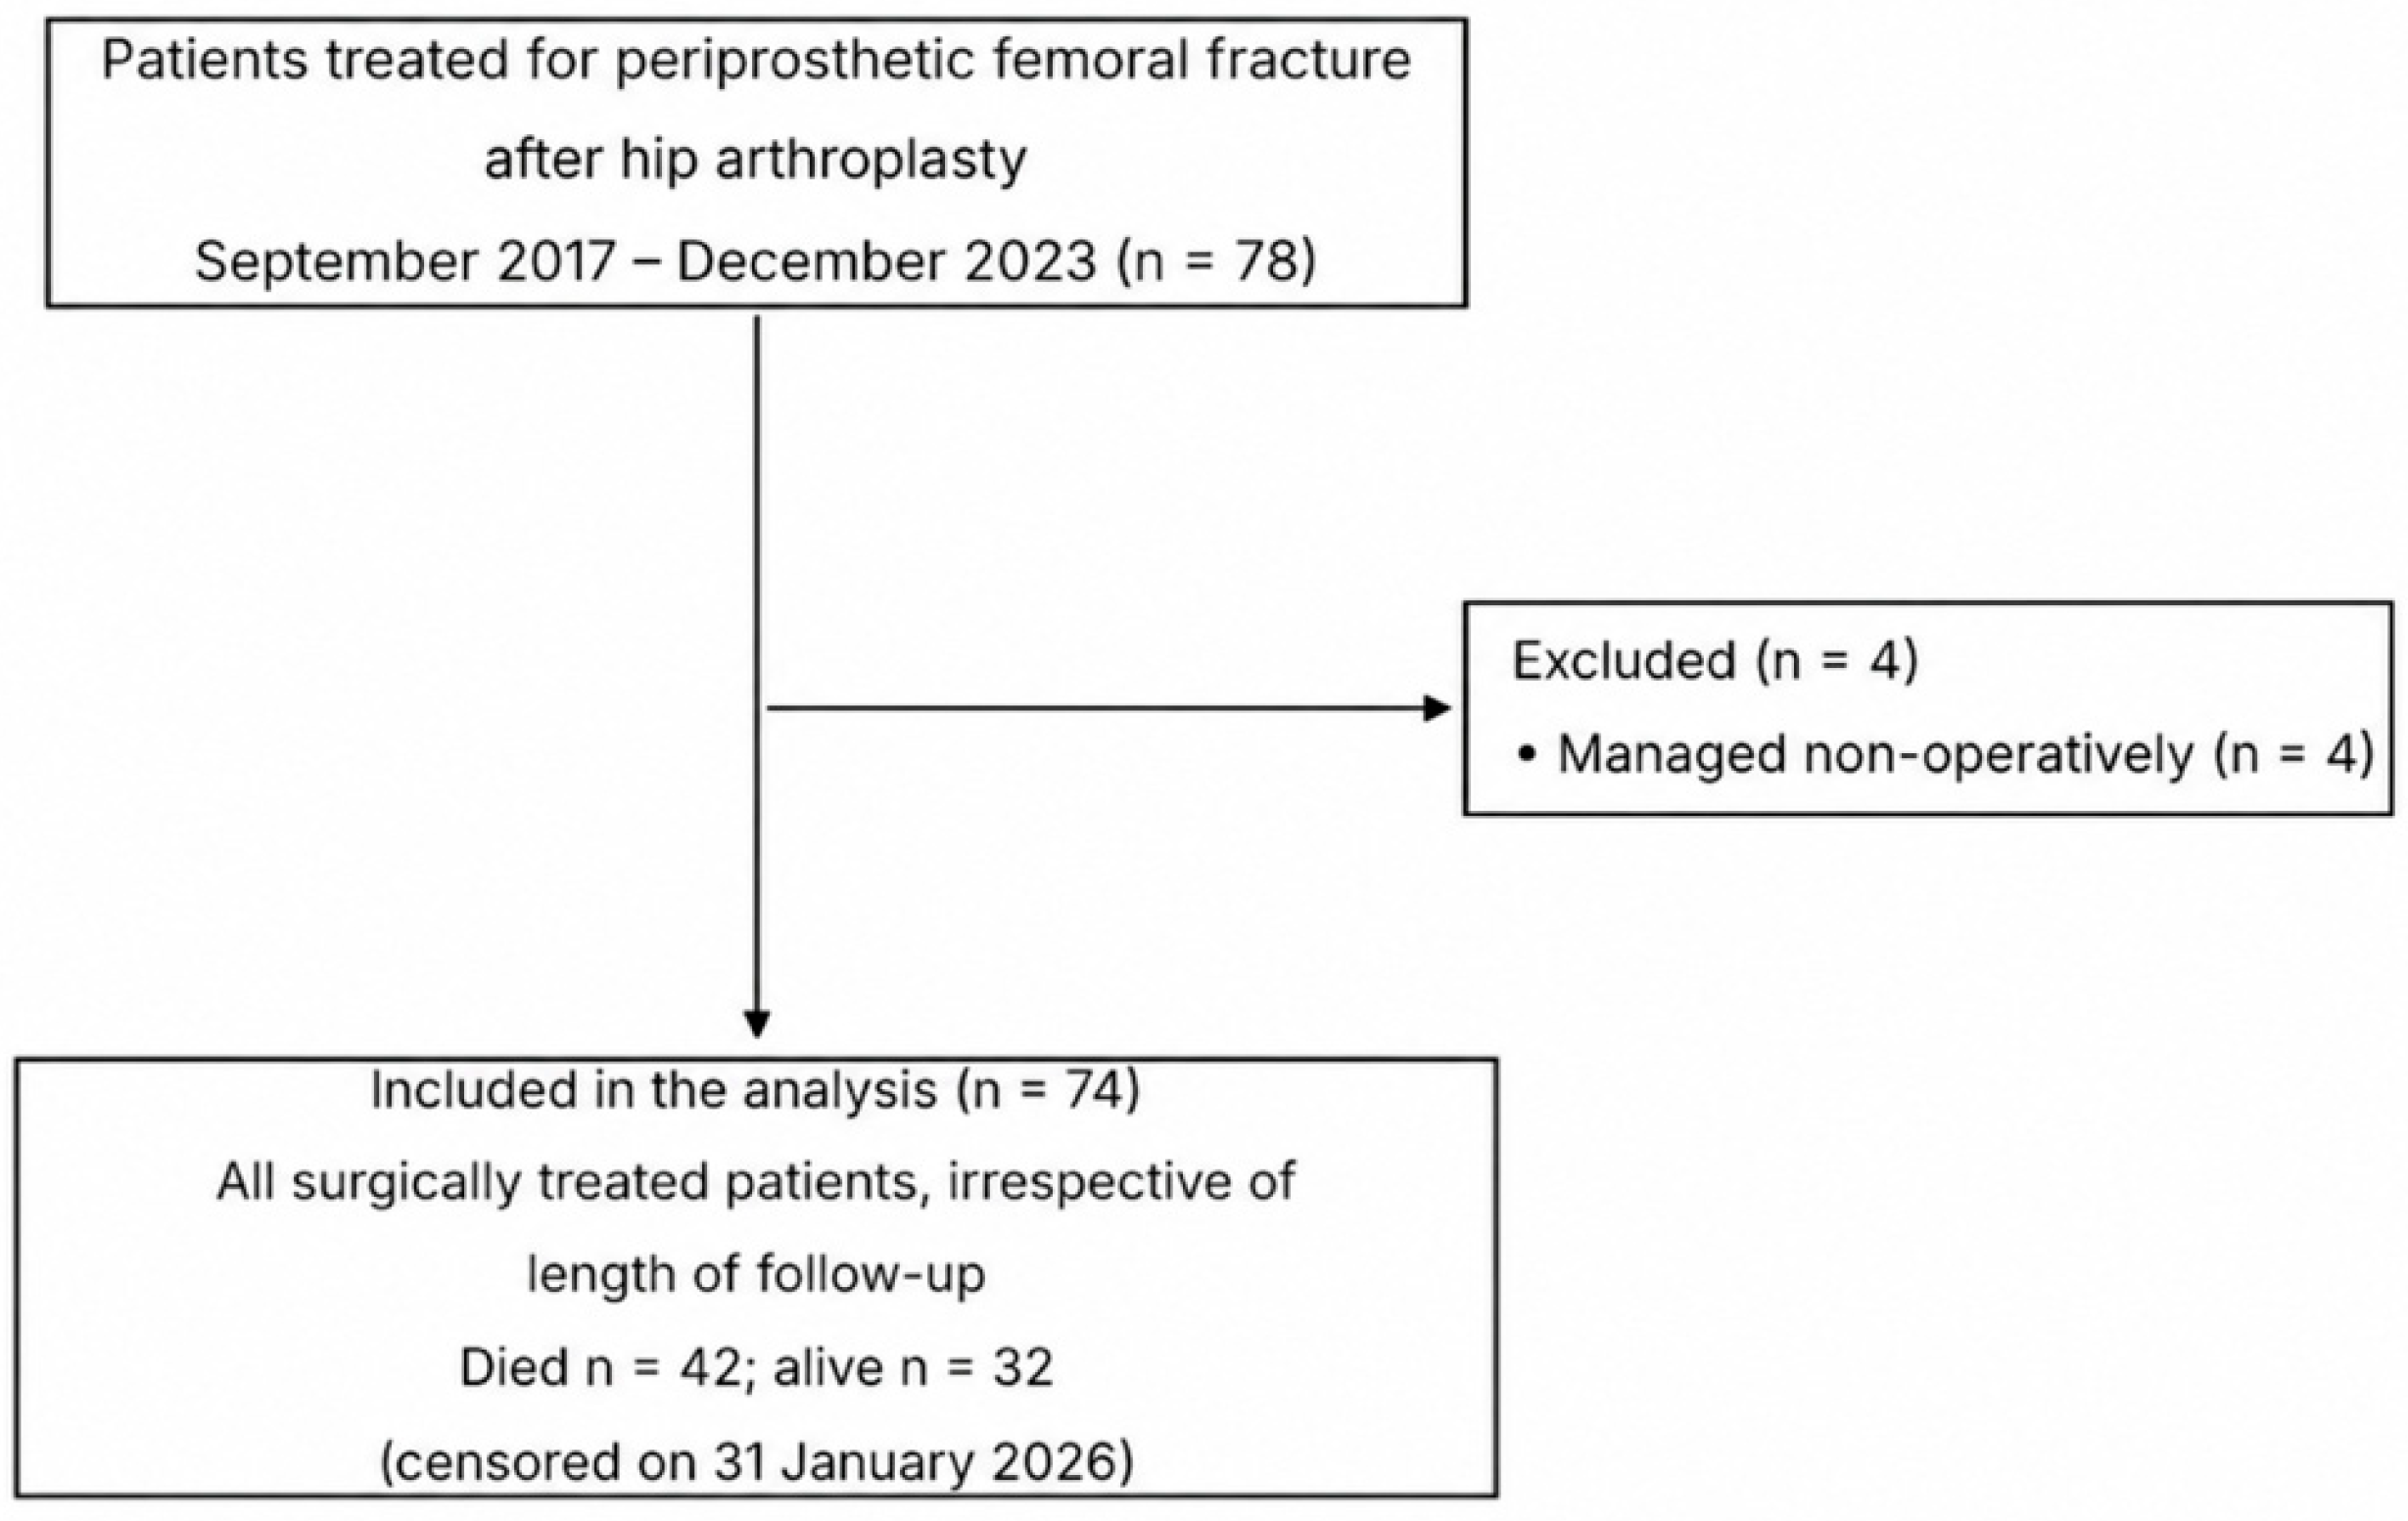
Eligible patients were adults who had undergone hemiarthroplasty or THA and subsequently sustained a surgically treated periprosthetic femoral fracture through a traumatic or intraoperative mechanism. An intraoperative index fracture was one that occurred during an arthroplasty procedure and was treated as a periprosthetic fracture, either in the same operation or after postoperative recognition; for these patients the interval from arthroplasty to fracture is zero by definition. For all patients, survival was measured from the date of the operation that treated the fracture. All eligible consecutive patients treated during the study period were included, irrespective of the length of follow-up. Patients with fractures around non-arthroplasty implants, those managed non-operatively, and those with insufficient clinical records for the planned analyses were to be excluded; no patient was excluded on this ground (Figure 1). Seventy-four patients met the eligibility criteria; the participant flow is reported in Section 3.1 and Figure 1. Survival status was verified through the national death registration database. No covariate included in the regression models had missing data, and all models were therefore fitted on the full cohort.
2.3. Variables and Assessment
The recorded variables included age, sex, body mass index, smoking status, Charlson Comorbidity Index [21], American Society of Anesthesiologists (ASA) physical status, fracture mechanism and side, time from arthroplasty to fracture, time to surgery, length of stay, admission haemoglobin, surgical treatment, complications, reoperation, mortality, and in-hospital cost. The Charlson Comorbidity Index was recorded in its age-adjusted form, which includes one point per decade of age from 50 years (maximum four) [21]; for models that also contained age, a comorbidity-only score was derived by subtracting these age points.
Figure 1.
Participant flow diagram. Of 78 patients treated for a periprosthetic femoral fracture after hip arthroplasty between September 2017 and December 2023, four managed non-operatively were excluded, leaving 74 patients for analysis. All surviving patients were retained irrespective of the length of follow-up and censored on 31 January 2026.
In-hospital cost comprised all treatment costs recorded for the index admission, from admission to discharge, including implants, the surgical procedure, inpatient care, and medication. It excludes rehabilitation after discharge and any subsequent readmission. Costs reflect national reimbursement tariffs and are therefore not directly comparable with charge-based figures from other health systems; they are used here to model relative determinants rather than to estimate societal cost. Costs were recorded in Turkish lira and converted to US dollars using the official selling rate published by the Central Bank of the Republic of Türkiye for the date of surgery. Because the study spanned a period of high domestic inflation, converted costs were not additionally deflated to a common price year; the year of surgery was therefore carried in the cost models as a covariate, and an inflation-adjusted sensitivity analysis is described in Section 2.5.
Fractures were classified according to the Vancouver system. A preoperative classification was made on anteroposterior pelvis and lateral femur radiographs by two orthopaedic surgeons who assessed the images independently, with disagreements resolved by a senior third surgeon. Because the radiographic distinction between a well-fixed and a loose stem is unreliable, the final assignment to type B1 or B2 was based on the intraoperative assessment of stem stability. Agreement between the two surgeons was not recorded, so interobserver reliability (Cohen’s kappa) could not be calculated.
A five-item modified Frailty Index (mFI-5) [22] was calculated, scoring one point each for diabetes mellitus, chronic obstructive pulmonary disease, congestive heart failure, hypertension requiring medication, and non-independent pre-fracture functional status. Functional dependence was defined as the need for another person’s assistance with activities of daily living (bathing, dressing, toileting, feeding, or transfer) before the fracture; it was abstracted from the nursing admission, anaesthetic, and emergency department records of the 30 days before surgery, and dependence caused by the fracture itself was not counted. Use of a walking aid without personal assistance was classified as independent. Patients scoring ≥ 2 were classified as frail. The mFI-5 was chosen because it was derived and validated in surgical populations and can be calculated retrospectively from routinely recorded comorbidities and functional status, whereas frailty instruments that require direct patient assessment could not be applied in a retrospective cohort. Pre-fracture functional status was abstracted from the records and was not independently verified by a second reviewer or by contact with patients or relatives.
2.4. Surgical Treatment
All procedures were performed by fellowship-trained surgeons using a posterolateral approach and treatment was intended to follow Vancouver principles, with osteosynthesis (plate or cable-plate with cerclage) for types A, B1, and C and stem revision, most commonly with a modular tapered fluted stem, for fractures around a loose stem (B2, B3); departures from this pathway are reported in the Results. The reasons for choosing osteosynthesis rather than revision in individual B2 or B3 fractures were not systematically documented; the characteristics of these patients are compared in Section 3.3. A procedure was classified as revision when the femoral component was exchanged and as osteosynthesis when the fracture was fixed around a retained implant.
2.5. Statistical Analysis
Statistical analyses were performed using IBM SPSS Statistics for Windows, version 22.0 (IBM Corp., Armonk, NY, USA) for descriptive statistics and group comparisons, and Python 3.12 with lifelines 0.30.3 and statsmodels 0.15.0 for the survival and cost models. Continuous variables are presented as mean ± standard deviation or median and range, and categorical variables as frequencies and percentages. Group comparisons were performed using Student’s t test, the Mann–Whitney U test, the chi-square test, or Fisher’s exact test, as appropriate.
Vital status was ascertained for every patient by querying the national death registration database on 31 January 2026. Overall survival was estimated with the Kaplan–Meier method from the date of surgery to death from any cause. Patients alive at the registry query were censored on 31 January 2026, the common administrative end of follow-up, and contributed all of their available follow-up. Survival estimates were derived from individual event and censoring times, and median follow-up was estimated with the reverse Kaplan–Meier method. Associations with all-cause mortality were examined using Cox proportional-hazards regression and are reported as hazard ratios with 95% confidence intervals. Given the number of observed deaths (42), multivariable models were restricted to two to four clinically relevant covariates, corresponding to 21 to 10.5 events per variable; ASA class was modelled as an ordinal variable and tested against a categorical parameterisation in a likelihood-ratio test, and a possible non-linear effect of age was examined by adding a quadratic term. Fracture pattern, surgical strategy, and index arthroplasty were evaluated separately after adjusting for age and ASA class, with models adjusted for age and the comorbidity-only Charlson score used as sensitivity analyses. Because stem stability is the guideline-based criterion for choosing between revision and osteosynthesis, the fracture pattern and the surgical strategy were additionally entered into a single model to assess confounding by indication. Model discrimination was assessed using Harrell’s c-index, multicollinearity using variance inflation factors, and the proportional-hazards assumption using scaled Schoenfeld residuals; because the assumption was violated for surgical strategy, follow-up was split at three months and period-specific hazard ratios were estimated. This cut-off was chosen after the violation had been identified and was not pre-specified; the period-specific analysis is therefore exploratory (post hoc) and hypothesis-generating, and it was not used to infer the presence or absence of a treatment effect. Model stability was assessed by internal validation with 1000 bootstrap resamples, from which percentile confidence intervals and an optimism-corrected c-index were obtained; the cost models were bootstrapped in the same way.
In-hospital cost was analysed using a generalised linear model with a gamma distribution and log link, chosen for the right-skewed, strictly positive cost distribution; results are reported as cost ratios with 95% confidence intervals, with average marginal effects expressed in US dollars. Marginal effects were computed as discrete changes rather than derivatives: the mean difference in predicted cost when each patient’s value of a covariate was increased by one unit, or a binary characteristic was set to present rather than absent, with all other covariates held at their observed values. Two nested specifications were pre-defined. The primary model contained only variables fixed at or before the index operation—ASA class and age as measures of physiological reserve, the Vancouver pattern as the anatomical determinant of the procedure required, the surgical strategy actually performed, and the year of surgery to absorb secular change in tariffs—so that every term is a potential determinant rather than a consequence of cost. Length of stay was deliberately excluded from that model because inpatient days are themselves a component of the expenditure being modelled. A secondary model added length of stay to examine whether the cost ratio for revision was attenuated after this adjustment; no formal mediation analysis was performed. Because costs were not deflated to a common price year, sensitivity analyses refitted both models with the year of surgery entered as a categorical rather than a continuous covariate and, separately, with lira costs adjusted to December 2023 prices using the monthly consumer price index of the Turkish Statistical Institute for the month of surgery. The distributional assumption was assessed with a modified Park test, in which a coefficient of 2 is consistent with the gamma variance function, and the log link with a Pregibon link test; both models were also refitted with an inverse Gaussian distribution and as ordinary least-squares regression of log-transformed cost and compared using the Akaike information criterion. Influence was assessed with Cook’s distance, and both models were refitted after excluding the patient with a 75-day admission and, separately, all observations with a Cook’s distance above 4/n; heteroscedasticity-robust standard errors were also computed. Converted costs were tested for a temporal trend using Spearman’s correlation. All tests were two-sided, and a p value < 0.05 was considered statistically significant.
3. Results
3.1. Cohort Characteristics
Of 78 patients treated for a PFF during the study period, four managed non-operatively were excluded, leaving 74 patients for analysis; all surviving patients were retained irrespective of the length of follow-up (Figure 1). The cohort comprised 43 women (58.1%) and 31 men (41.9%), with a mean age of 77.5 ± 13.6 years (median 80, range 22–100); 38 (51.4%) were aged 80 years or older. The index arthroplasty was a hemiarthroplasty in 53 patients (71.6%) and a THA in 21 (28.4%). The mean Charlson index was 5.5 ± 2.1 and the median ASA class was 3. The median mFI-5 was 2; 46 patients (62.2%) were frail and 38 (51.4%) were functionally dependent before the fracture. Among the 72 postoperative fractures, the mean interval from arthroplasty to fracture was 52.7 ± 58.5 months, longer after THA than after hemiarthroplasty (median 72 versus 12 months, p = 0.005). The fracture was trauma-related in 72 patients (97.3%) and intraoperative in two (2.7%). One of these occurred during a hemiarthroplasty, was recognised postoperatively, and was treated two days later by stem revision; the other occurred during a revision arthroplasty with a modular stem and was fixed with a cable plate in the same operation. These two index fractures are distinct from the three additional intraoperative fractures that occurred during the surgical treatment of a PFF (Section 3.4). Overall, 22 fractures (29.7%) were around a loose stem (Vancouver B2 or B3) (Table 1).
Table 1.
Demographic, clinical, fracture, and surgical characteristics (n = 74).
3.2. Mortality and Survival
Forty-two patients (56.8%) died. The median survival was 20.8 months (95% CI, 12.1–34.5) and the median follow-up was 32.1 months. Survival fell from 83.8% (73.2–90.4) at 30 days to 74.3% (62.8–82.8) at 90 days and 63.2% (51.1–73.1) at one year and to 46.0% (33.5–57.6) at two years. The three-year estimate of 35.6% (22.8–48.7) rests on only nine patients at risk and should be interpreted with caution (Figure 2). Twenty-seven patients died within the first year (crude proportion 27/74, 36.5%).
3.3. Predictors of Mortality
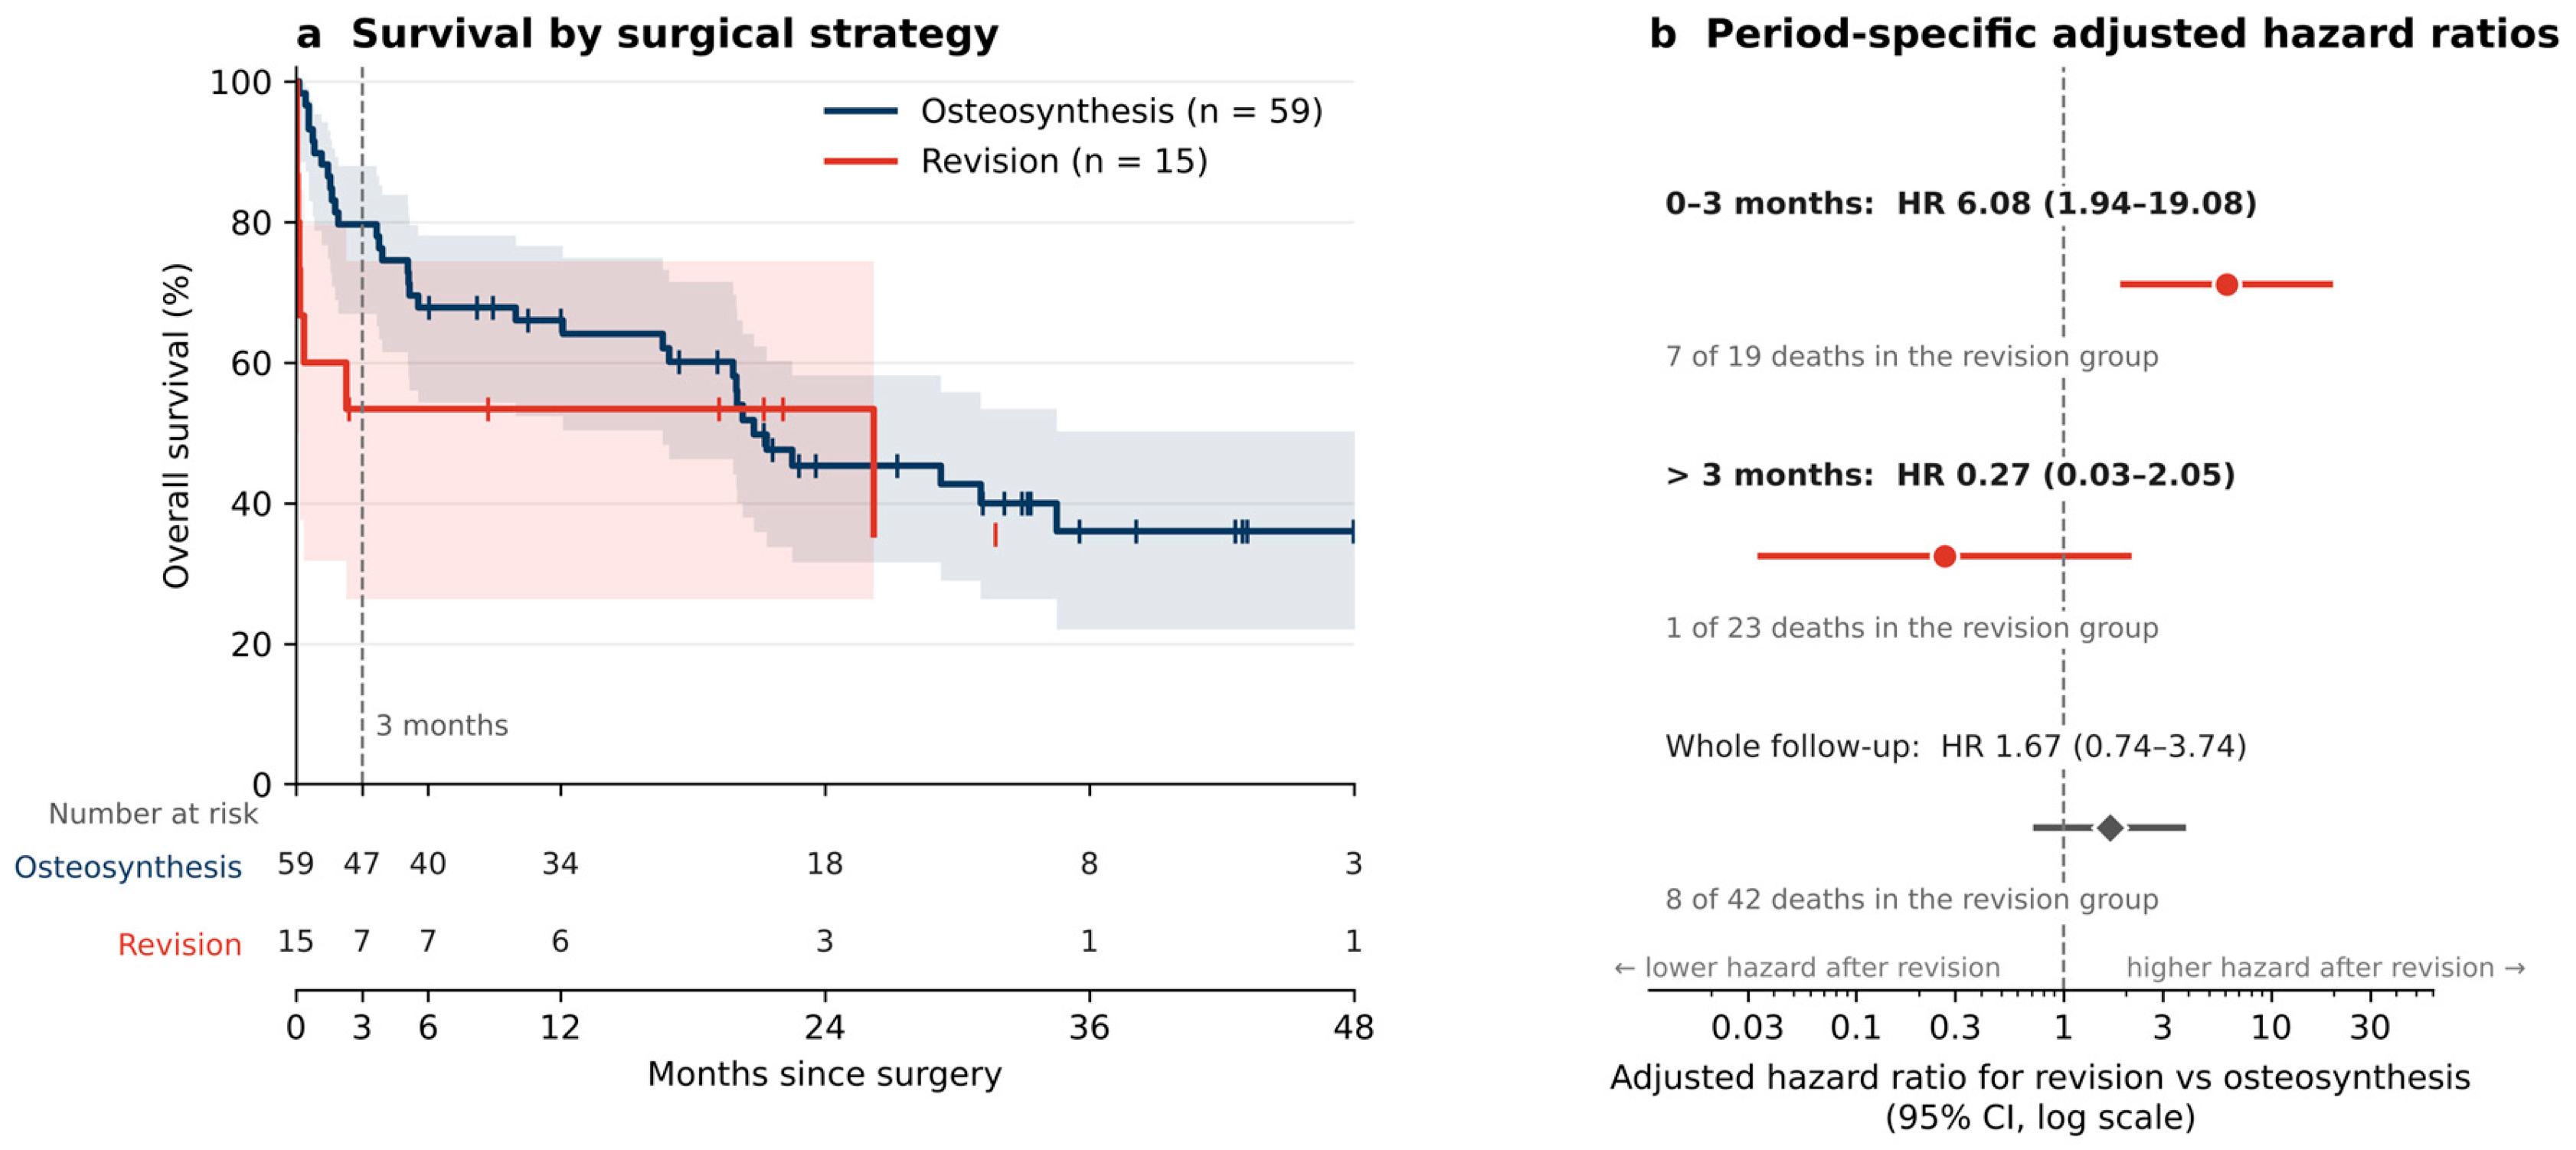
Univariable Cox regression showed that mortality was associated with increasing age, the age-adjusted Charlson index, ASA class, lower admission haemoglobin, mFI-5, a frail phenotype, and pre-fracture functional dependence, the strongest single component (Table 2). Crude mortality was 1/7, 36/62, and 5/5 across ASA grades 2 to 4, and 28/38 in dependent versus 14/36 in independent patients. Hemiarthroplasty was associated with higher mortality on univariable analysis (HR 2.29, 95% CI 1.09–4.82, p = 0.029). Neither an unstable-stem pattern (HR 0.93, p = 0.83), the operation performed (HR 1.34, p = 0.46), nor sex (p = 0.98) was associated with mortality. Survival according to surgical strategy is shown in Figure 3.
Table 2.
Cox regression for all-cause mortality.
Figure 2.
Kaplan–Meier curve of overall survival after surgery for periprosthetic femoral fracture. The shaded band is the 95% confidence interval; the dashed lines mark the median survival of 20.8 months, tick marks indicate censored patients, and the numbers at risk are shown below the axis.
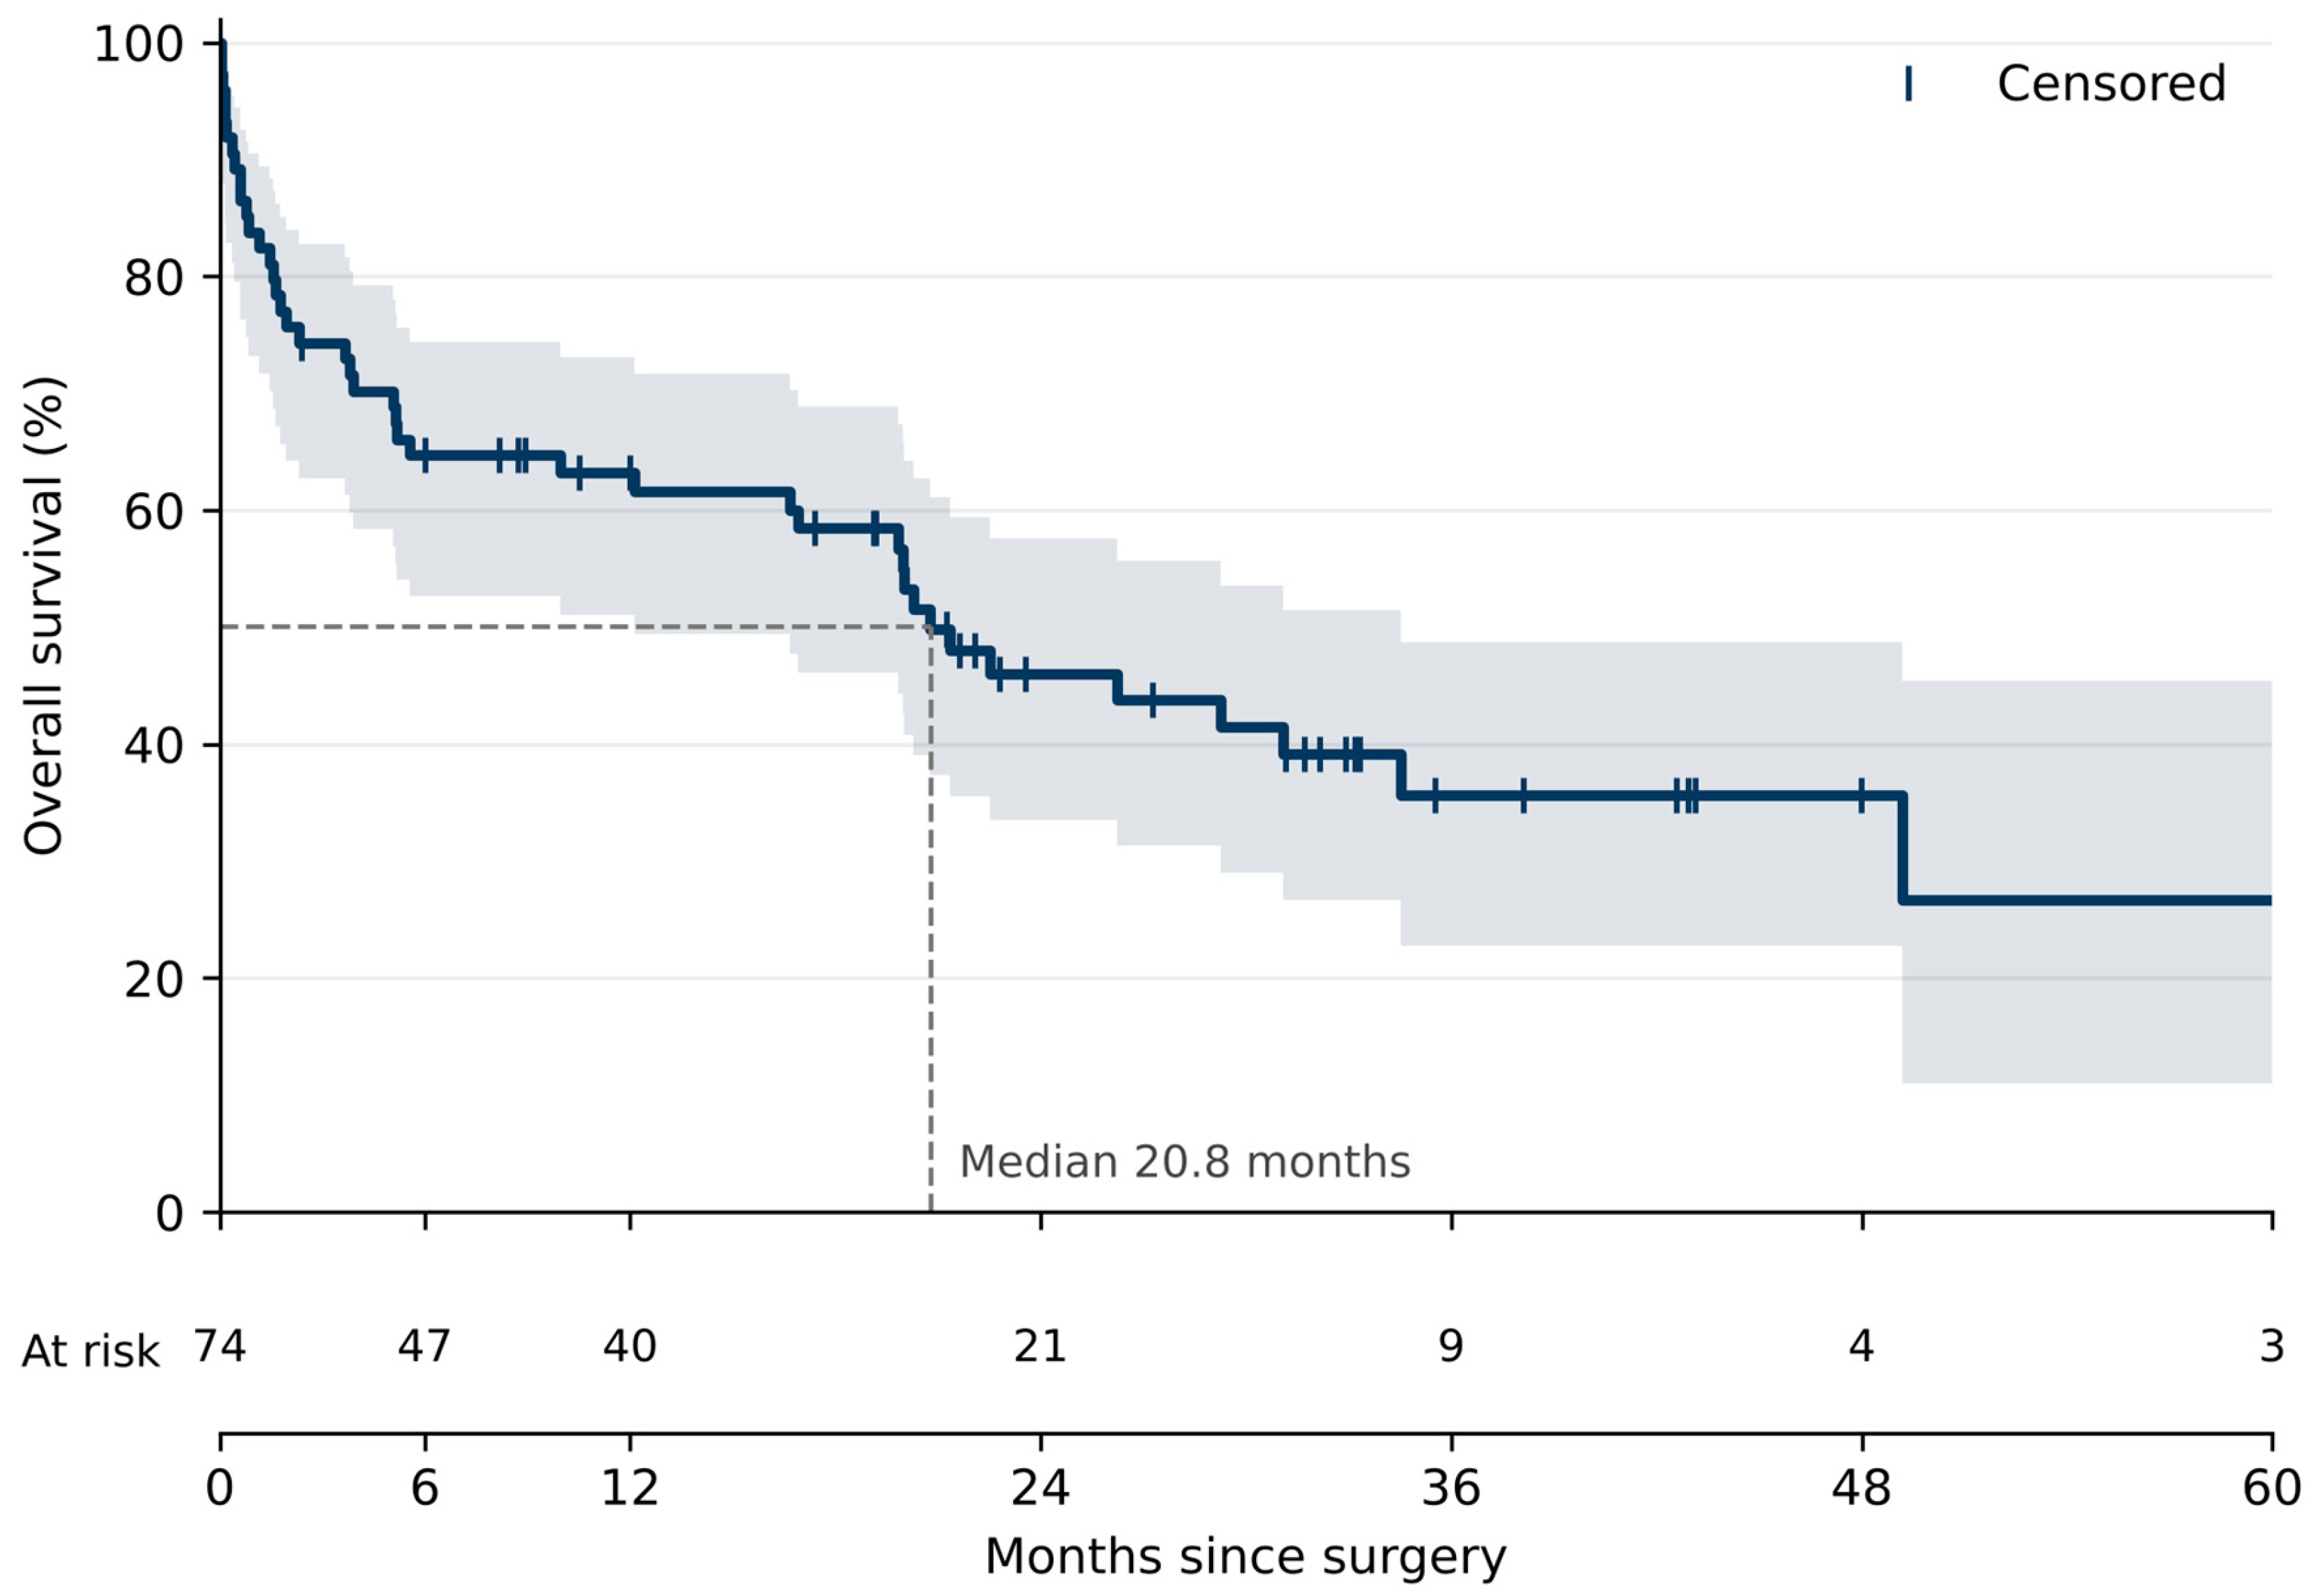
Figure 3.
Survival according to surgical strategy. (a) Kaplan–Meier curves of overall survival after revision and after osteosynthesis; the dashed vertical line marks the three-month cut-off, shaded bands are 95% confidence intervals, tick marks indicate censored patients, and the numbers at risk are shown below the axis. (b) Adjusted hazard ratios (95% confidence intervals) for revision versus osteosynthesis in the early (0–3 months) and late (>3 months) periods, from the exploratory, post hoc period-specific Cox model adjusted for age, ASA class, and fracture pattern, together with the estimate over the whole follow-up, with the number of deaths in the revision group shown for each period; the horizontal axis is logarithmic. The three-month cut-off was chosen after the proportional-hazards violation was identified, and the late-period estimate rests on a single death in the revision group. The univariable hazard ratios are given in Table 2.
In the parsimonious multivariable model, age (adjusted HR 1.06 per year, 95% CI 1.02–1.09, p = 0.001) and ASA class (adjusted HR 3.00 per grade, 1.30–6.96, p = 0.010) remained independent predictors (c-index 0.70), and the proportional-hazards assumption was satisfied (Table 2). In 1000 bootstrap resamples, the percentile intervals were 1.03–1.09 for age and 1.47–7.08 for ASA class, and the optimism-corrected c-index was 0.69 (apparent 0.70). Adding the mFI-5 abolished its association with survival (adjusted HR 1.18, 0.84–1.64, p = 0.34) without improving discrimination; functional dependence was likewise no longer significant (adjusted HR 1.83, 0.92–3.62, p = 0.085), although it gave the highest discrimination of the frailty measures (c-index 0.72). The comorbidity-only Charlson score retained an independent association (adjusted HR 1.23 per point, 1.06–1.44, p = 0.008) and modestly improved discrimination (c-index 0.71). Diagnostics were satisfactory (variance inflation factors < 1.7; no departure from log-linearity for ASA class, p = 0.95; Schoenfeld residuals non-significant; a quadratic age term did not improve fit, p = 0.70).
Each exposure of primary interest was then entered into the adjusted models (Table 3). An unstable-stem pattern was not associated with mortality after adjustment (adjusted HR 0.99, 0.50–1.99, p = 0.99), and the averaged hazard ratio for revision compared with osteosynthesis was 1.65 (0.74–3.69, p = 0.22), although the proportional-hazards assumption did not hold for this term (see below). The index implant behaved similarly: although hemiarthroplasty carried markedly worse crude survival than THA (one-year survival 55% versus 85%; median survival 16.7 versus 34.5 months), these patients were older (80.5 versus 69.9 years, p = 0.002) and more comorbid (Charlson 6.0 versus 4.1, p < 0.001), and the association was attenuated after adjustment for age and ASA class (adjusted HR 1.43, 0.66–3.12, p = 0.36) and further after adjustment for age and the comorbidity-only Charlson score (adjusted HR 1.13, p = 0.76). The findings remained unchanged when the comorbidity-only Charlson score replaced ASA class for every exposure (Table 3, footnote). The point estimate for revision increased after adjustment while remaining non-significant, and its confidence interval did not exclude a moderate excess hazard; these analyses therefore neither demonstrate nor exclude an independent effect.
Table 3.
Adjusted Cox models for the exposures of primary interest.
Because stem stability is the guideline-based criterion for the choice of operation, the two exposures were also entered together (model 4, Table 3); their cross-classification is shown in Table 4. Of the 22 fractures around a loose stem, nine (40.9%) were treated by revision and 13 (59.1%) by osteosynthesis, whereas six of the 52 fractures around a stable stem (11.5%) underwent revision. Patient-level reasons for these departures from the conventional pathway were not systematically documented. Factors such as anaesthetic fitness, bone stock, and surgeon preference may have contributed, but this remains a hypothesis that could not be verified from the records, and the selection criteria for each operation therefore cannot be reported. Among the fractures around a loose stem, the 13 patients treated by osteosynthesis and the nine treated by revision did not differ significantly in age (median 79 versus 81 years, p = 0.55), ASA class (median 3 in both, p = 0.46), age-adjusted Charlson index (median 4 versus 5, p = 0.093), frailty (6/13 versus 6/9, p = 0.42), or pre-fracture dependence (5/13 versus 6/9, p = 0.39); these small groups cannot, however, exclude clinically relevant differences. The two variables were only modestly correlated (phi = 0.33) and collinearity was absent (all variance inflation factors ≤ 1.13). In the joint model (model 4, Table 3), neither an unstable-stem pattern (adjusted HR 0.95, 0.47–1.91, p = 0.89) nor the averaged estimate for revision (adjusted HR 1.67, 0.74–3.74, p = 0.22) was statistically significant, and both point estimates were essentially unchanged from the separate models, indicating that adjustment for the recorded fracture pattern did not alter the averaged estimate for surgical strategy; because the choice of operation may have depended on patient and fracture characteristics that were not recorded, this comparison nevertheless remains subject to confounding by indication that multivariable adjustment cannot fully remove. Bootstrap percentile intervals for model 4 were wide (revision 0.51–8.38; unstable-stem pattern 0.32–2.10), and the optimism-corrected c-index was 0.69 (apparent 0.72), indicating limited stability of the exposure estimates. The proportional-hazards assumption held for age, ASA class, and fracture pattern (p ≥ 0.13) but was violated for surgical strategy (p = 0.001). In an exploratory, post hoc analysis with follow-up split at three months, a cut-off chosen after this violation was identified, revision was associated with a higher early postoperative hazard that was not apparent beyond three months (Figure 3): of the 19 deaths within three months, seven occurred in the 15 revision patients, and the adjusted hazard ratio for this period was 6.08 (1.94–19.08, p = 0.002), whereas among the 23 later deaths, only one of which occurred after revision, it was 0.27 (0.03–2.05, p = 0.20); this late estimate is particularly fragile because it rests on a single event in the revision group. The early estimate rests on seven events in the revision group, and its wide confidence interval indicates considerable imprecision. Kaplan–Meier survival was 53.3% at three months after revision against 79.7% after osteosynthesis and 53.3% against 66.0% at one year; two revision and five osteosynthesis patients were censored before 12 months, leaving six and 34 patients at risk at that point. The averaged hazard ratio of 1.67 (0.74–3.74), whose confidence interval does not exclude a moderate excess hazard, should therefore not be read as evidence of equivalence or of the absence of a survival association, and these data cannot distinguish an effect of the operation itself from the selection of patients for it.
Table 4.
Surgical strategy according to Vancouver fracture type.
3.4. Complications and Cost
Adverse events occurred in ten patients (13.5%) and are reported separately according to when they arose. Three patients (4.1%) sustained an additional intraoperative femoral fracture during the surgical treatment of the PFF; this was managed within the same operation in two and required a further procedure in one. Seven patients (9.5%) developed a complication during follow-up that led to reoperation: two implant failures, two recurrent dislocations, one deep infection, and two patients in whom a Girdlestone resection arthroplasty was performed as a salvage procedure, once for recurrent dislocation and once for deep infection. Girdlestone resection is recorded here as the salvage operation performed rather than as a complication in its own right. Because the surgical strategy of the patients with these events could not be retrieved reliably from the records, complications are not reported separately for revision and osteosynthesis.
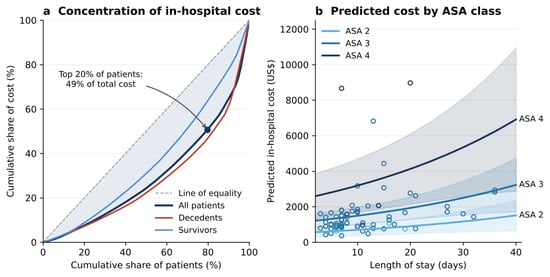
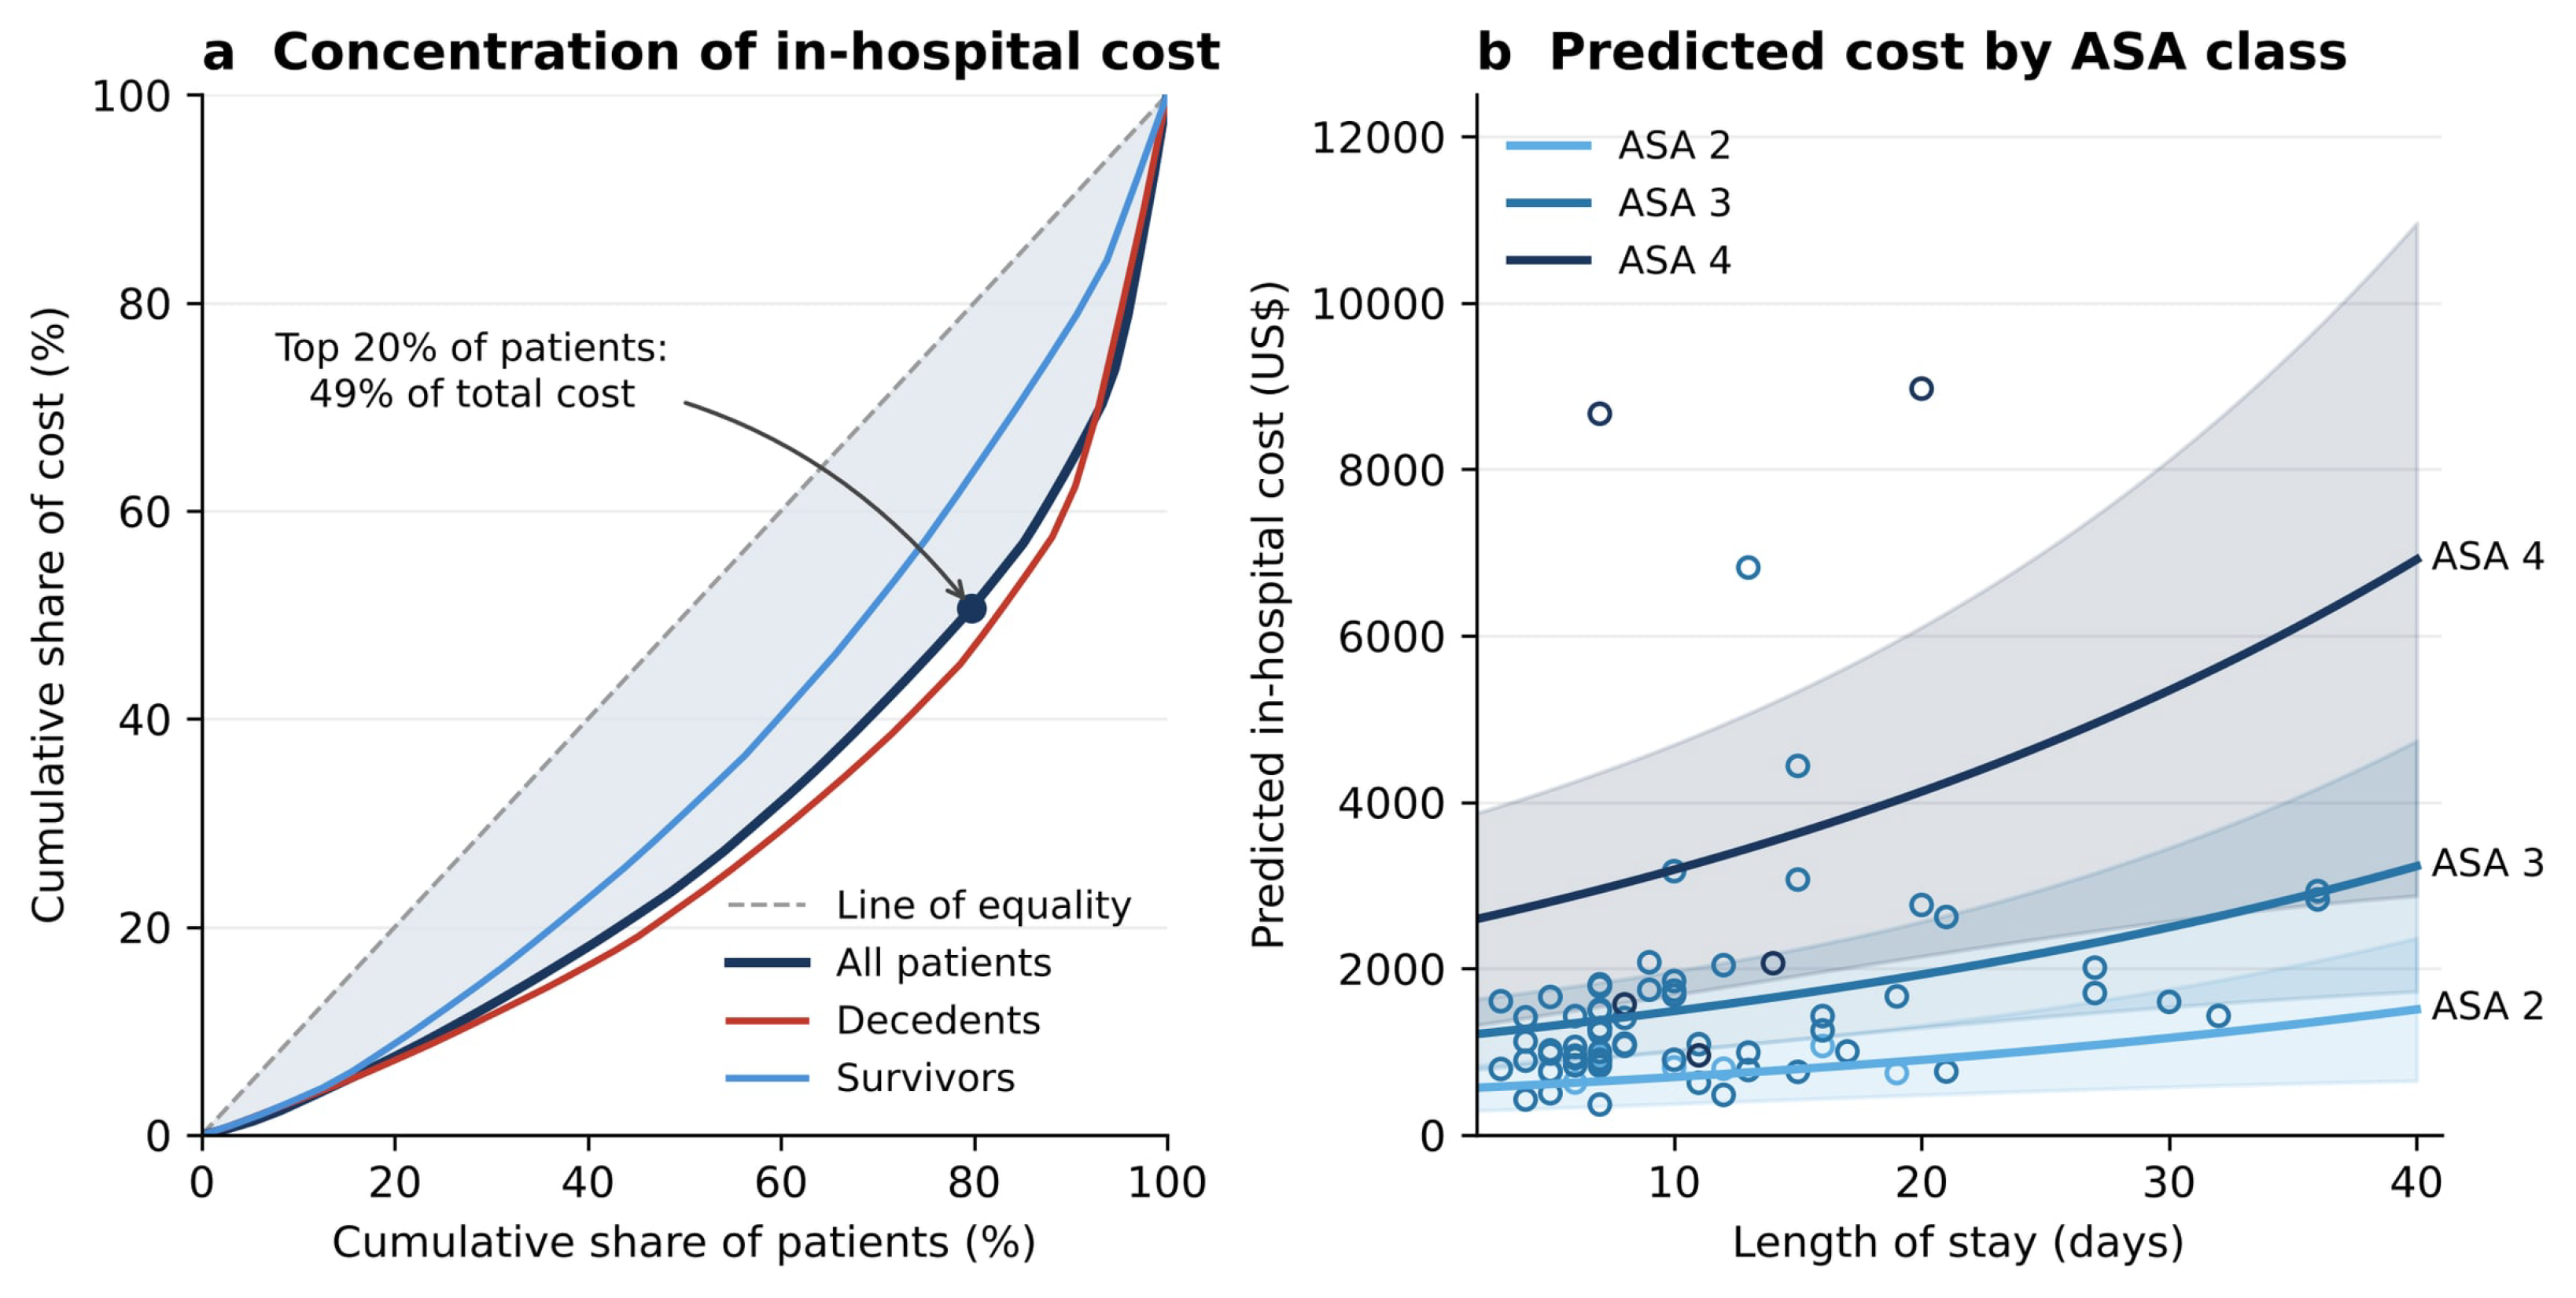
The mean in-hospital cost was US$ 1761 ± 1812 (median 1243, range 365–9874). Whereas lira costs rose across the study period (rho 0.66, p < 0.001), converted costs showed no association with year of surgery (rho 0.07, p = 0.55); this does not establish that converted costs represent constant purchasing power or that tariff-related variation was removed. Converted costs were higher after revision than after osteosynthesis (median 1664 versus 1057, p = 0.002) and in decedents than in survivors (1429 versus 1064, p = 0.037). In the primary gamma model (Table 5), cost was independently associated with ASA class (cost ratio 2.12, 95% CI 1.44–3.11, p < 0.001; average marginal effect US$ 1930 per grade) and with revision surgery (cost ratio 1.98, 1.34–2.94, p < 0.001; US$ 1431), whereas age, the Vancouver pattern, and the year of surgery were not. Adding length of stay to the model (secondary model) left ASA class unchanged (cost ratio 2.14, 1.54–2.98) and attenuated revision to a cost ratio of 1.53 (1.08–2.18, p = 0.018), with each additional inpatient day carrying a 1.03-fold increase (1.01–1.04, p < 0.001; US$ 46 per day). The revision cost ratio was thus attenuated from 1.98 to 1.53 after adjustment for length of stay, indicating that prolonged hospitalisation contributes to, but does not fully account for, the higher cost of revision; no formal mediation analysis was performed. With year of surgery entered as a categorical covariate, the revision cost ratio was 2.05 (1.37–3.07) in the primary model and 1.40 (0.996–1.964, p = 0.052) in the secondary model, against 1.98 and 1.53 with year as a continuous term. Cost was concentrated: the most expensive 20% of patients (15 patients) accounted for 49% of expenditure (Figure 4). Patients who died during follow-up accounted for 70% of total expenditure, a share that depends on the duration of observation. At a fixed one-year horizon, the 27 patients who died within twelve months accounted for 50% of the expenditure of all 74 patients; because seven patients operated on in 2023 were censored before their one-year status was known, this is not a fully observed one-year classification. Among the 67 patients whose one-year status was known (27 deaths and 40 survivors beyond twelve months), the corresponding share was 53%, and the seven patients with incomplete one-year follow-up accounted for 6% of total expenditure. The 15 most expensive patients were more often frail than the remainder (12/15, 80%, versus 34/59, 58%; p = 0.14) and had higher one-year mortality among those with known one-year status (9/15, 60%, versus 18/52, 35%; p = 0.13), but neither difference was statistically significant, so these data do not establish that the most expensive patients are the same frail patients who account for the excess mortality.
Table 5.
Gamma generalised linear models of in-hospital cost.
Figure 4.
Concentration and determinants of in-hospital cost. (a) Lorenz curves showing the cumulative share of total cost accounted for by the cumulative share of patients, for the whole cohort and separately for patients who died and those who survived; the dashed line denotes perfect equality. The share attributable to decedents reflects the duration of observation and should be read alongside the fixed one-year figure given in the text. (b) In-hospital cost predicted by the secondary gamma generalised linear model across length of stay, shown as separate curves for ASA classes 2, 3, and 4 with 95% confidence bands; circles represent the observed patients. Predicted costs are averaged over the observed distribution of the other covariates; one patient with a 75-day stay lies outside the plotted range. Costs relate to the index admission only, and most deaths occurred after discharge. The influence of the extreme observations on the cost models is examined in Section 3.4.
Model diagnostics did not alter the conclusions for revision. The modified Park test gave coefficients of 3.16 (95% CI 2.24–4.08) for the primary and 3.33 (2.50–4.16) for the secondary model, indicating that the variance rose more steeply with the mean than the gamma distribution assumes, and the link test suggested residual misspecification of the primary (p = 0.035) but not of the secondary model (p = 0.52). With an inverse Gaussian distribution, which corresponds to that variance function and gave the lowest Akaike information criterion, the revision cost ratio was 2.10 (1.34–3.31) in the primary and 1.61 (1.11–2.32) in the secondary model; with log-transformed ordinary least squares it was 1.79 (1.25–2.56) and 1.47 (1.06–2.03), and the ASA cost ratio ranged from 1.77 to 1.85 across these specifications. Excluding the patient with a 75-day admission left the estimates essentially unchanged (revision 1.69, 1.16–2.46, and 1.54, 1.08–2.18; ASA 2.13 and 2.14). Eight observations in the primary and six in the secondary model had a Cook’s distance above 4/n, the largest arising from two ASA 4 patients with costs of US$ 8667 and 8969 and, in the primary model, from the 75-day admission or, in the secondary model, from a revision patient with a cost of US$ 6819. After these observations were excluded, the revision cost ratio remained significant (1.66, 1.24–2.23, and 1.37, 1.07–1.74), whereas the ASA cost ratio fell to 1.36 (0.99–1.88, p = 0.057) and 1.31 (1.02–1.67). Heteroscedasticity-robust standard errors gave similar intervals (ASA 2.12, 1.47–3.05; revision 1.98, 1.30–3.04, primary model). The association of revision with cost was therefore robust to the distributional assumption and to influential observations, whereas the magnitude of the ASA estimate depended on a small number of high-cost ASA 4 patients.
Two further sensitivity analyses gave consistent results. After lira costs were adjusted to December 2023 prices with the consumer price index, they showed no temporal trend (rho −0.03, p = 0.82), and the revision cost ratio was 1.88 (1.27–2.80) in the primary and 1.41 (1.01–1.97) in the secondary model, with ASA cost ratios of 2.06 and 2.09. In 1000 bootstrap resamples, the percentile intervals for revision were 1.27–3.21 and 1.07–2.27, and those for ASA class were 1.20–2.92 and 1.21–2.90. These cost comparisons describe associations and do not estimate the causal effect of the surgical strategy.
4. Discussion
In this cohort, mortality was high and was more closely associated with age and ASA class than with the Vancouver fracture type. The mFI-5 predicted death on univariable analysis but not after adjustment for age and ASA class, so frailty is described here as a correlate of the same underlying risk rather than as an independent predictor. Cost was associated with ASA class, length of stay, and revision surgery; the revision estimate was robust in sensitivity analyses, whereas the magnitude of the ASA estimate depended on a few high-cost patients. Revision was therefore associated with higher in-hospital cost, but its association with survival could not be summarised by a single hazard ratio, and this study cannot establish whether revision confers a survival benefit or harm.
Our one-year mortality was at the upper end of the reported range. Single-centre series have described 10.7% [23] and 23.4% [10], and a meta-analysis of 35 cohorts estimated 13.4% [8], whereas frailer populations show higher figures: 30.1% in Vancouver C fractures [11], similarly high rates after THA [24], and 42.3% in a geriatric trauma centre [12]. Half of our patients were aged 80 years or older, the median age-adjusted Charlson index was 5, 62% were frail, half were functionally dependent before the fracture, and 72% had a hemiarthroplasty, an implant usually placed after a fragility fracture of the hip; our cohort therefore sits at the frail end of this spectrum, consistent with mortality varying with case-mix. The same meta-analysis identified age, comorbidity, and reoperation as the principal drivers of death [8], and registry data confirm an excess mortality attributable to the fracture event itself [25]. Whether these fractures are as lethal as native hip fractures is debated [13,14], but our data are consistent with their being fragility events in which prognosis relates more closely to the patient than to the implant.
The finding that age and ASA class were the most consistent independent predictors is echoed widely, and our mortality results should therefore be read as confirmatory rather than novel. An early study found the age-adjusted Charlson index and previous arthroplasty, rather than fracture configuration, to be associated with survival [26]; a multicentre registry subgroup reported 16.2% one-year mortality predicted by comorbidity burden, cognitive impairment, and postoperative complications [9]; the national PPF study of 1109 patients found that neither the Vancouver subtype nor the mode of management independently predicted mortality [27]; and a propensity-matched cohort found only ASA class and sex to be predictive [28]. Whether delay beyond 24 h increases mortality as well as morbidity remains unresolved [29,30]. In native proximal femoral fractures, an ASA grade of 3 or more and a Charlson index of 5 or more likewise predicted death [31], though some report the Charlson index to discriminate better than ASA [23].
Other series have not found an overall survival difference between revision and osteosynthesis. A systematic review concluded that fixation can match stem revision in selected Vancouver B2 and B3 fractures, although the constituent studies were heterogeneous and treatment was never allocated by a transparent algorithm; therefore, no outcome predictors could be identified [32]. Because stem stability is the guideline-based criterion for the choice of operation, the two were modelled together, and the averaged estimate for surgical strategy changed little when the fracture pattern was added, although confounding by unmeasured indications remains possible. Because the assumption of proportional hazards did not hold for revision, however, the averaged hazard ratio does not summarise its association with survival, and the data neither demonstrate nor exclude a difference. An exploratory time-dependent analysis, with a cut-off chosen after this violation was identified, suggested a higher early postoperative hazard after revision that was not apparent beyond three months. This estimate rests on seven deaths in the revision group and its confidence interval (1.94–19.08) is wide, whereas the late estimate rests on a single such death; both should therefore be regarded as hypothesis-generating rather than as evidence that any excess risk is limited to the early period. Such a pattern would be compatible with the physiological burden of a longer operation in patients with limited reserve, but it could equally reflect the selection of patients for revision. Allocation was not governed by a written algorithm, and the reasons for retaining a stem in the 13 B2 or B3 fractures treated by fixation were not recorded; any explanation for these choices is therefore speculative, so the comparison is subject to confounding by indication that multivariable adjustment cannot fully remove. The same pattern applied to the index implant: worse crude survival after hemiarthroplasty disappeared once age and comorbidity were accounted for, illustrating that an apparent implant effect may simply reflect the frailer population in whom hemiarthroplasty is performed. Hemiarthroplasty and THA patients thus represent clinically different populations, and pooling them adds heterogeneity that adjustment for age and comorbidity can address only in part. More generally, the absence of a statistically significant association for the Vancouver pattern or the surgical strategy should not be read as evidence that these factors are unimportant.
Existing work documents the financial burden of these injuries and their contribution to national costs and readmissions [18,33], and national database analyses have already modelled the determinants of that expenditure. In a National Inpatient Sample cohort of 932 periprosthetic femoral fractures, revision arthroplasty was the strongest single cost driver, raising cost by 39.0% around the hip and 68.6% around the knee, with comorbidity burden and blood product use as further independent correlates [19]; in 77,565 hip periprosthetic fracture encounters, procedure type again dominated, with revision and revision combined with fixation increasing cost by 35.0% and 40.6% [20]. Our cost ratio for revision of 1.53 after adjustment for length of stay (1.98 without it) is of the same order, suggesting that the relative economics of the operation are reproducible in a tariff-based, non-US health system. The higher cost of revision may reflect the price of the revision implant, longer and more complex surgery, longer hospitalisation, and the characteristics of the patients selected for revision rather than the strategy itself; the cost models describe associations and do not estimate a causal effect of the operation. What those datasets do not provide is survival after discharge, since they capture the index admission only, and they record neither the Vancouver pattern nor the index implant nor frailty—limitations acknowledged by their authors. A single-centre study has reported one-year mortality and cost in the same patients, but compared cost between treatment groups without adjustment [18]. The individual correlates of mortality and cost identified here are therefore not new; the contribution of this cohort lies in analysing adjusted in-hospital cost and post-discharge survival separately in the same patients, with a clinical fracture classification; no joint cost–survival model was fitted. Two observations follow. First, ASA class was associated with both outcomes, although its cost estimate was sensitive to a few high-cost ASA 4 patients; expenditure was concentrated, the most expensive fifth of the cohort accounting for half of it, but these patients were not significantly frailer or more likely to die within a year than the remainder, so the data do not show that the same patients drive both cost and mortality. Second, revision was consistently associated with higher in-hospital cost, whereas its association with survival was time-varying and imprecisely estimated; this study therefore cannot establish whether revision confers a survival benefit or harm, and its higher cost is best weighed against the technical indication for stem exchange rather than against any expected effect on survival. Multidisciplinary orthogeriatric management, early mobilisation, and individualised surgical planning are established principles of fragility fracture care [12,17] and may reduce complications and healthcare utilisation in this population, although our data cannot test this. Whether early identification of vulnerable patients and orthogeriatric co-management can improve outcomes or reduce expenditure remains to be established, and a formal integrated cost–outcome or cost-effectiveness analysis, which was beyond the scope of this retrospective cohort, is a natural direction for prospective work.
This study has several limitations. It was a retrospective, single-centre analysis, and fracture incidence could not be calculated because many index arthroplasties were performed elsewhere. Only surgically treated patients were included: the four managed non-operatively were excluded, which may introduce selection bias, so the findings apply only to patients treated surgically. The sample was small, only 15 patients underwent revision, and allocation to revision or osteosynthesis was not random, which limits both precision and generalisability. With 42 deaths, the power to exclude moderate differences between fracture patterns or surgical strategies was limited, and the null adjusted associations should be read as an absence of demonstrable effect rather than evidence of equivalence; the period-specific estimates rest on 19 early and 23 later deaths, the early estimate for revision on only seven events and the late estimate on one, and the three-month cut-off was selected post hoc, so these estimates are exploratory and correspondingly imprecise. Although stem stability was assessed intraoperatively, the rationale for fixation around a loose stem was not systematically recorded, so the comparison between surgical strategies remains susceptible to confounding by indication. Interobserver agreement for the preoperative Vancouver classification was not recorded, and pre-fracture functional status was abstracted from the records without independent verification. Intraoperative assessment of stem stability depends on surgeon judgement, so some residual misclassification between Vancouver B1 and B2 cannot be entirely excluded. Costs were converted at the exchange rate prevailing on the date of surgery but were not deflated to a common price year; over a period of high domestic inflation this leaves residual price-level variation that the year term in the models can only partly absorb. The absence of a temporal trend in converted costs does not establish constant purchasing power or remove tariff-related variation. Sensitivity analyses with year entered categorically gave similar revision cost ratios, but the absolute figures should be compared with those from other health systems only with caution. Functional and quality-of-life scores were collected in survivors alone and at heterogeneous intervals after surgery and are therefore not reported here. Cost reflects reimbursement for the index admission within a single national tariff and excludes post-discharge rehabilitation and readmission costs, so the absolute figures are specific to this health system even though the relative determinants may generalise. Larger prospective multicentre studies are needed to confirm these results.
5. Conclusions
Periprosthetic femoral fractures carry a high mortality rate, with half of the patients dying within approximately two years of surgery. Age and ASA class were the most consistent predictors of survival. The lack of a statistically significant association for the Vancouver fracture type does not show that fracture morphology is unimportant, and whether survival differs between revision and osteosynthesis could not be determined because only 15 patients underwent revision, the hazard was not proportional over time, and allocation was subject to confounding by indication; comparisons between surgical strategies therefore remain inconclusive. In-hospital cost was associated with ASA class, length of stay, and revision surgery, the association with revision being robust in sensitivity analyses. Within the limits of a retrospective observational cohort, these findings support combining patient-based prognostic assessment with fracture-based surgical planning and warrant further evaluation of orthogeriatric care pathways in larger multicentre studies.
Author Contributions
Conceptualization, A.Y.S. and F.O.; methodology, K.T.O. and A.Y.S.; software, K.T.O.; formal analysis, K.T.O.; investigation, A.Y.S., S.B., İ.A. and M.E.; data curation, A.Y.S., S.B., İ.A. and M.E.; writing—original draft preparation, K.T.O. and A.Y.S.; writing—review and editing, all authors; visualization, K.T.O.; supervision, F.O. All authors have read and agreed to the published version of the manuscript.
Funding
This research received no external funding.
Institutional Review Board Statement
The study was conducted in accordance with the Declaration of Helsinki and approved by the Non-Interventional Clinical Research Ethics Committee of Kayseri City Training and Research Hospital, University of Health Sciences (protocol code 27, 28 March 2024); the approval covers retrospective and prospective research using data obtained during routine examination and treatment.
Informed Consent Statement
Patient consent was waived by the ethics committee because of the retrospective, observational design and the exclusive use of anonymised, routinely collected clinical and radiographic records.
Data Availability Statement
The data supporting the findings of this study are available from the corresponding author upon reasonable request. The data are not publicly available because they contain information that could compromise the privacy of research participants.
Acknowledgments
This work is derived from the medical specialty thesis of the first author, completed at the Department of Orthopaedics and Traumatology, University of Health Sciences, Kayseri City Training and Research Hospital, in 2026. The thesis has not been published in a peer-reviewed journal. During the preparation of this manuscript, the authors used Claude (Anthropic, San Francisco, CA, USA; version Claude Opus 5.5, accessed) for English-language editing. The authors reviewed and edited all output and take full responsibility for the content of this publication.
Conflicts of Interest
The authors declare no conflicts of interest.
Abbreviations
The following abbreviations are used in this manuscript:
| ASA | American Society of Anesthesiologists |
| CI | Confidence interval |
| HR | Hazard ratio |
| mFI-5 | Five-item modified Frailty Index |
| PFF | Periprosthetic femoral fracture |
| THA | Total hip arthroplasty |
References
- Learmonth, I.D.; Young, C.; Rorabeck, C. The operation of the century: Total hip replacement. Lancet 2007, 370, 1508–1519. [Google Scholar] [CrossRef] [Scilit]
- Abdel, M.P.; Watts, C.D.; Houdek, M.T.; Lewallen, D.G.; Berry, D.J. Epidemiology of periprosthetic fracture of the femur in 32 644 primary total hip arthroplasties: A 40-year experience. Bone Jt. J. 2016, 98-B, 461–467. [Google Scholar] [CrossRef] [Scilit]
- Lindahl, H.; Malchau, H.; Herberts, P.; Garellick, G. Periprosthetic femoral fractures: Classification and demographics of 1049 periprosthetic femoral fractures from the Swedish National Hip Arthroplasty Register. J. Arthroplast. 2005, 20, 857–865. [Google Scholar]
- Sassoon, A.A.; Taylor, J.M.; Jimenez, E.; Stancil, R.; Cannady, D.; De, A. Periprosthetic fractures: A rising tide of hip arthroplasty failure noted in the American Joint Replacement Registry and the preventative role of cemented stems. J. Arthroplast. 2024, 39, S454–S458. [Google Scholar] [CrossRef] [Scilit]
- Della Rocca, G.J.; Leung, K.S.; Pape, H.C. Periprosthetic fractures: Epidemiology and future projections. J. Orthop. Trauma 2011, 25, S66–S70. [Google Scholar] [CrossRef] [Scilit]
- Minutillo, G.T.; Karnuta, J.M.; Koressel, J.; Dehghani, B.; DeAngelis, R.D.; Donegan, D.J.; Mehta, S. Fixation or revision for periprosthetic fractures: Epidemiology, new trends, and projections in the United States. J. Bone Jt. Surg. Am. 2024, 106, 1054–1061. [Google Scholar] [CrossRef] [Scilit]
- COMPOSE Study Team. Epidemiology and characteristics of femoral periprosthetic fractures: Data from the COMPOSE cohort study. Bone Jt. J. 2022, 104-B, 987–996. [Google Scholar] [CrossRef] [Scilit]
- Lamb, J.N.; Nix, O.; Al-Wizni, A.; West, R.; Pandit, H. Mortality after postoperative periprosthetic fracture of the femur after hip arthroplasty in the last decade: Meta-analysis of 35 cohort studies including 4841 patients. J. Arthroplast. 2022, 37, 398–405. [Google Scholar] [CrossRef] [Scilit]
- Andrés-Peiró, J.V.; Nomdedéu, J.; Aguado, H.J.; González-Morgado, D.; Minguell-Monyart, J.; Joshi-Jubert, N.; Teixidor-Serra, J.; Tomàs-Hernández, J.; Selga-Marsà, J.; García-Sánchez, Y.; et al. Predictors of outcomes after internal fixation of periprosthetic femoral hip fractures: Subgroup analysis of the PIPPAS registry. Injury 2024, 55, 111715. [Google Scholar] [CrossRef] [Scilit]
- Müller, K.; Zeynalova, S.; Fakler, J.K.M.; Kleber, C.; Roth, A.; Osterhoff, G. Risk factors for mortality in periprosthetic femur fractures about the hip: A retrospective analysis. Int. Orthop. 2025, 49, 211–217. [Google Scholar] [CrossRef] [Scilit]
- Aguado, H.J.; PIPPAS Study Group. Risk factors and predictors of 1-year mortality in 262 Vancouver type C periprosthetic femoral fractures: Insights from the PIPPAS prospective multicenter observational study. J. Clin. Med. 2025, 14, 5986. [Google Scholar] [CrossRef] [Scilit]
- Pankratz, C.; Risch, A.; Oxen, J.; Cintean, R.; Gebhard, F.; Schuetze, K.; Boehringer, A. Orthogeriatric co-management of fragility fractures: A retrospective cohort study on one-year mortality and functional outcomes across fracture types. BMC Geriatr. 2026, 26, 91. [Google Scholar] [CrossRef] [Scilit]
- Boylan, M.R.; Riesgo, A.M.; Paulino, C.B.; Slover, J.D.; Zuckerman, J.D.; Egol, K.A. Mortality following periprosthetic proximal femoral fractures versus native hip fractures. J. Bone Jt. Surg. Am. 2018, 100, 578–585. [Google Scholar] [CrossRef] [Scilit]
- Haughom, B.D.; Basques, B.A.; Hellman, M.D.; Brown, N.M.; Della Valle, C.J.; Levine, B.R. Do mortality and complication rates differ between periprosthetic and native hip fractures? J. Arthroplast. 2018, 33, 1914–1918. [Google Scholar] [CrossRef] [Scilit]
- Duncan, C.P.; Masri, B.A. Fractures of the femur after hip replacement. Instr. Course Lect. 1995, 44, 293–304. [Google Scholar]
- Brady, O.H.; Garbuz, D.S.; Masri, B.A.; Duncan, C.P. The reliability and validity of the Vancouver classification of femoral fractures after hip replacement. J. Arthroplast. 2000, 15, 59–62. [Google Scholar] [CrossRef] [Scilit]
- Ceolin, C.; Bano, G.; Biz, C.; Dianin, M.; Bedogni, M.; Guarnaccia, A.; Berizzi, A.; Ruggieri, P.; Coin, A.; Sergi, G. Functional autonomy and 12-month mortality in older adults with proximal femoral fractures in an orthogeriatric setting: Risk factors and gender differences. Aging Clin. Exp. Res. 2023, 35, 1063–1071. [Google Scholar] [CrossRef] [Scilit]
- Shields, E.; Behrend, C.; Bair, J.; Cram, P.; Kates, S. Mortality and financial burden of periprosthetic fractures of the femur. Geriatr. Orthop. Surg. Rehabil. 2014, 5, 147–153. [Google Scholar] [CrossRef] [Scilit]
- Ragland, K.; Reif, R.; Karim, S.; Sexton, K.W.; Cherney, S.M.; Stambough, J.B.; Mears, S.C. Demographics, treatment, and cost of periprosthetic femur fractures: Fixation versus revision. Geriatr. Orthop. Surg. Rehabil. 2020, 11, 2151459320939550. [Google Scholar] [CrossRef] [Scilit]
- Arza, R.A.; Potluri, A.S.; Thom, M.; Wera, G.D. Predictors of in-hospital mortality, cost, and length of stay following periprosthetic fracture of the hip. Hip Pelvis 2026, 38, 196–206. [Google Scholar] [CrossRef] [Scilit]
- Charlson, M.E.; Pompei, P.; Ales, K.L.; MacKenzie, C.R. A new method of classifying prognostic comorbidity in longitudinal studies: Development and validation. J. Chronic Dis. 1987, 40, 373–383. [Google Scholar] [CrossRef] [Scilit]
- Subramaniam, S.; Aalberg, J.J.; Soriano, R.P.; Divino, C.M. New 5-factor modified frailty index using American College of Surgeons NSQIP data. J. Am. Coll. Surg. 2018, 226, 173–181.e8. [Google Scholar] [CrossRef] [Scilit]
- El Khassawna, T.; Knapp, G.; Scheibler, N.; Malhan, D.; Walter, N.; Biehl, C.; Alt, V.; Heiss, C.; Rupp, M. Mortality, risk factors and risk assessment after periprosthetic femoral fractures: A retrospective cohort study. J. Clin. Med. 2021, 10, 4324. [Google Scholar] [CrossRef] [Scilit]
- Moreta, J.; Uriarte, I.; Bidea, I.; Foruria, X.; Legarreta, M.J.; Etxebarría-Foronda, I. High mortality rate following periprosthetic femoral fractures after total hip arthroplasty: A multicentre retrospective study. Injury 2021, 52, 3022–3027. [Google Scholar] [CrossRef] [Scilit]
- Lindahl, H.; Oden, A.; Garellick, G.; Malchau, H. The excess mortality due to periprosthetic femur fracture: A study from the Swedish National Hip Arthroplasty Register. Bone 2007, 40, 1294–1298. [Google Scholar] [CrossRef] [Scilit]
- Bhattacharyya, T.; Chang, D.; Meigs, J.B.; Estok, D.M., 2nd; Malchau, H. Mortality after periprosthetic fracture of the femur. J. Bone Jt. Surg. Am. 2007, 89, 2658–2662. [Google Scholar] [CrossRef] [Scilit]
- Nasser, A.A.H.H.; Prakash, R.; Handford, C.; Osman, K.; Chauhan, G.S.; Nandra, R.; Mahmood, A.; Dewan, V.; Davidson, J.; Al-Azzawi, M.; et al. Predictors of mortality in periprosthetic fractures of the hip: Results from the national PPF study. Injury 2023, 54, 111152. [Google Scholar] [CrossRef] [Scilit]
- Murphy, G.; Frangos Young, A.; Franks, D.; Symes, M.; Guzman, M.; Le, M. The impact of surgical timing on mortality and reoperation rates in periprosthetic proximal femoral fractures: A matched multicenter cohort study. J. Arthroplast. 2026, 41, 927–932. [Google Scholar] [CrossRef] [Scilit]
- Boddapati, V.; Grosso, M.J.; Sarpong, N.O.; Geller, J.A.; Cooper, H.J.; Shah, R.P. Early morbidity but not mortality increases with surgery delayed greater than 24 hours in patients with a periprosthetic fracture of the hip. J. Arthroplast. 2019, 34, 2789–2792.e1. [Google Scholar] [CrossRef] [Scilit]
- Wulbrand, C.; Füchtmeier, B.; Weber, M.; Eckstein, C.; Hanke, A.; Müller, F. Surgery within 24 hours reduces mortality and general complication rates in patients who have periprosthetic femoral fractures at the hip. J. Arthroplast. 2024, 39, 2104–2110.e1. [Google Scholar] [CrossRef] [Scilit]
- Seriacopi, L.S.; Falotico, G.G.; Durigon, T.S.; Cocco, L.F.; Dell’Aquila, A.M.; Dos Reis, F.B.; Salles, M.J.C. High Charlson Comorbidity Index is associated with infection and mortality following surgical treatment of elderly proximal femoral fractures. BMC Musculoskelet. Disord. 2025, 26, 618. [Google Scholar] [CrossRef] [Scilit]
- Stoffel, K.; Blauth, M.; Joeris, A.; Blumenthal, A.; Rometsch, E. Fracture fixation versus revision arthroplasty in Vancouver type B2 and B3 periprosthetic femoral fractures: A systematic review. Arch. Orthop. Trauma Surg. 2020, 140, 1381–1394. [Google Scholar] [CrossRef] [Scilit]
- Reeves, R.A.; Schairer, W.W.; Jevsevar, D.S. The national burden of periprosthetic hip fractures in the US: Costs and risk factors for hospital readmission. Hip Int. 2019, 29, 550–557. [Google Scholar] [CrossRef] [Scilit]

Disclaimer/Publisher’s Note: The statements, opinions and data contained in all publications are solely those of the individual author(s) and contributor(s) and not of MDPI and/or the editor(s). MDPI and/or the editor(s) disclaim responsibility for any injury to people or property resulting from any ideas, methods, instructions or products referred to in the content. |
© 2026 by the authors. Published by MDPI on behalf of the Lithuanian University of Health Sciences. Licensee MDPI, Basel, Switzerland. This article is an open access article distributed under the terms and conditions of the Creative Commons Attribution (CC BY) license.