


Abstract
Background and Objectives: The inflammatory burden index (IBI), C-reactive protein multiplied by the neutrophil-to-lymphocyte ratio, has not been evaluated in older critically ill adults. We examined its relationship with 28-day mortality and with time to death. Materials and Methods: We retrospectively studied 308 adults aged ≥65 years admitted to one ICU during 2025. IBI was derived from paired CRP and complete blood count drawn within 1 h of admission. Analyses used ROC methods, logistic regression and Cox models. Results: In total, 295 of 308 patients (95.8%) died in the ICU and only 6 (1.9%) were alive and out of the ICU at day 90; the analyses therefore separate earlier from later death rather than death from survival. Discrimination for 28-day mortality was poor (AUC 0.586, 95% CI 0.520–0.652) and inferior to APACHE II (0.723). After adjustment, ln(IBI) was unrelated to 28-day mortality (OR 1.11 per standard deviation, 95% CI 0.85–1.46) and added nothing to a model containing APACHE II (likelihood ratio χ2 = 1.19; p = 0.275). The Cox estimate across 90 days was also null (HR 1.10, 95% CI 0.96–1.26). A post hoc period-specific analysis placed an association only after day 28. Conclusions: Baseline IBI did not predict early death in this near-uniformly fatal cohort and added nothing to established severity scores. The later-death signal is post hoc and needs testing where survival is common.
1. Introduction
Older patients admitted to intensive care form a high-risk group with substantial clinical heterogeneity. Prognosis reflects more than age itself: the severity of the acute insult, the extent of organ dysfunction, coexisting disease, and remaining physiologic reserve all contribute. Aging also reshapes immune function. Changes in immune-cell abundance and activity, impaired proliferative responses, and altered inflammatory regulation can influence how an older host responds to infection or other acute stressors [1,2,3].
Aging may also be accompanied by chronic, low-intensity inflammation even when no obvious acute infection is present, a phenomenon often described as “inflammaging”. Proposed contributors include cellular senescence, metabolic and mitochondrial changes, and remodeling of both innate and adaptive immunity [1,2,3]. The magnitude of this background inflammatory state differs considerably between individuals. Thus, a biomarker obtained during critical illness can represent both the immediate response to acute disease and pre-existing influences related to aging, comorbidity, and physiologic reserve.
Routine blood tests have been combined into several indices intended to summarize systemic inflammatory activity. Examples include NLR, PLR, the monocyte-to-lymphocyte ratio, SII, the systemic inflammation response index, and the pan-immune-inflammation value. Their ability to separate patients by mortality risk has not been consistent across settings. In a multicenter retrospective study of 333 ICU patients aged at least 65 years, the CRP-to-albumin ratio yielded an AUC of 0.665 for 28-day mortality, while a number of alternative indices performed less well or were not statistically informative [4]. This illustrates why an observed association with death should not be equated with useful prognostic discrimination.
IBI is obtained by multiplying CRP by NLR [5], thereby combining an acute-phase protein with the relative balance between circulating neutrophils and lymphocytes. The index was first studied in a multicenter cancer cohort of 6359 patients, where higher values were related to unfavorable outcomes [5]. Its origin in oncology makes evaluation in other patient groups necessary before broader clinical interpretation.
Evidence outside oncology has begun to accumulate. Population analyses using National Health and Nutrition Examination Survey data reported relationships between elevated IBI and long-term all-cause mortality [6,7], but community cohorts differ fundamentally from patients with critical illness. ICU-specific evidence remains sparse. A retrospective MIMIC-IV study of 1828 patients with sepsis found associations between higher IBI and 28-day, ICU, and in-hospital mortality [8]. It is still unclear whether IBI contributes information beyond standard measures of disease severity in critically ill older adults meeting defined eligibility criteria.
This uncertainty is clinically relevant because IBI is simple to derive from CRP and a differential blood count, yet simplicity alone does not establish prognostic usefulness. A candidate marker should discriminate meaningfully in the population in which it is intended to be used and retain information after major confounding factors are taken into account. Our prespecified objective was therefore to determine how baseline IBI relates to 28-day all-cause mortality and how well it discriminates that outcome in geriatric ICU patients. We further examined whether any association remained after accounting for age, comorbidity, and acute disease severity. Mortality at 90 days was analyzed as an exploratory outcome.
2. Materials and Methods
2.1. Study Design, Setting, and Ethics
We performed a retrospective cohort analysis in the adult ICU of Balıkesir Atatürk City Hospital in Balıkesir, Türkiye. The study was conducted in a 51-bed tertiary (level 3) anesthesiology-run ICU, part of a 200-bed total intensive care capacity at the institution. The source population comprised patients aged ≥65 years admitted from 1 January through 31 December 2025, who were identified from electronic hospital and ICU follow-up records. The manuscript was prepared with reference to STROBE recommendations [9]. Ethical approval was granted by the Balıkesir Atatürk City Hospital Scientific Research Ethics Committee on 12 February 2026. The investigation followed the principles of the Declaration of Helsinki and used previously recorded clinical information without direct patient identifiers.
2.2. Study Population
Eligibility was assessed for every ICU admission of a patient aged ≥65 years within the study interval. When a patient had more than one ICU admission during the study period, the first admission was taken so that each patient contributed one observation. No patient had a first admission shorter than 24 h followed by a longer subsequent admission, so taking the first admission and taking the first admission that met the criteria yielded the same cohort. Patients with an ICU stay of less than 24 h were excluded. Calculation of IBI required CRP, absolute neutrophil count, and absolute lymphocyte count from the routine admission panel, which is drawn within 1 h of ICU admission. We also excluded patients lacking any of these measurements, those with a hematologic malignancy, and those receiving chronic systemic corticosteroid therapy before ICU admission or other chronic immunosuppressive treatment. Rheumatoid arthritis was not itself an exclusion criterion; records of the four included patients with rheumatoid arthritis confirmed that none were receiving such therapy before ICU admission. These chronic therapies were excluded because they may modify circulating inflammatory markers and leukocyte profiles, potentially affecting the calculation and interpretation of IBI. Rather than deriving a sample size from a retrospective power analysis, we analyzed the complete set of patients who satisfied these criteria during the defined period.
2.3. Data Collection and Variable Definitions
Clinical and laboratory data were collected retrospectively from the hospital information system and ICU records. Records were abstracted by two investigators working from the same hospital information system and the same predefined variable list. Agreement between abstractors was not formally quantified, and analyses were repeated with an indicator for abstractor as a robustness check. The dataset covered demographics, coexisting diseases, presentation characteristics, illness-severity measures, laboratory findings, organ-support therapies, and outcomes. For the calculation of IBI, CRP and the complete blood count were taken from the same blood draw, obtained within 1 h of ICU admission as part of the unit’s routine admission panel in all patients. APACHE II [10] and SOFA [11] scores were calculated using the worst physiologic and clinical values recorded during the first 24 h after ICU admission. Other laboratory variables were obtained from the baseline laboratory assessment performed after ICU admission. Comorbidity burden was expressed with the age-adjusted Charlson Comorbidity Index (CCI) [12,13], scored from the conditions documented at ICU admission with one additional point for each decade of age from 50 years onwards. The index was derived directly from the recorded comorbidity list so that it is reproducible from the study data. We additionally recorded invasive ventilation and its duration, vasopressor therapy, renal replacement therapy, and ICU length of stay. Vital status was assessed at 28 and 90 days after ICU admission. For patients discharged from the hospital before completion of follow-up, survival status was verified using both the hospital information management system and the national e-Nabız Personal Health Record system. Follow-up information was available for all included patients, with no loss to follow-up. Because patients admitted through 31 December 2025 were eligible, follow-up extended into 2026 to complete the 90-day outcome assessment; the final data cut-off date was 31 March 2026.
2.4. Calculation of the Inflammatory Burden Index
IBI was calculated from the paired CRP and complete blood count obtained within 1 h of ICU admission, as defined in Section 2.3. NLR was defined as the absolute neutrophil count divided by the absolute lymphocyte count, after which IBI was computed as CRP (mg/L) × NLR. For the main association models, IBI remained continuous to avoid the loss of information and instability introduced by outcome-driven categorization. Because its distribution showed pronounced positive skew, regression analyses used the natural logarithm of IBI. Quartiles and ROC-based thresholds were retained only as descriptive or exploratory summaries and were not interpreted as established decision limits.
2.5. Outcomes
Death from any cause within 28 days was named in the study protocol as the primary endpoint and was fixed before data extraction. Vital status was ascertained for deaths occurring after ICU discharge as well as during the ICU stay. The protocol also named ICU length of stay, the requirement for and duration of mechanical ventilation, the development of organ failure, as assessed by changes in the SOFA score, and the correlation of IBI with other laboratory indices as secondary outcomes. This study was framed as a prognostic-factor evaluation rather than the development or validation of a clinical prediction model. The primary analyses therefore addressed the association between baseline IBI and 28-day mortality after multivariable adjustment, with discrimination assessed as a complementary measure. Mortality at 90 days, the quartile analyses, and the time-to-event analyses were not part of the protocol and were carried out after the primary analysis was complete.
Time from ICU admission to death from any cause, administratively censored at 90 days, was analyzed as an additional outcome. This analysis was carried out after the primary 28-day analysis and is reported as secondary. Because almost all patients died, vital status was also tabulated at every transition point: ICU discharge, hospital discharge, day 28, day 90 and the final data cut-off.
2.6. Statistical Analysis
All analyses were performed in IBM SPSS Statistics 27.0 (IBM Corp., Armonk, NY, USA); pairwise comparison of AUCs used the ROC Analysis procedure. Distributional form was checked before continuous variables were summarized. Variables compatible with a normal distribution are expressed as mean ± standard deviation and were contrasted with the two-sample Student’s t test; skewed variables are given as the median (IQR) and were assessed with the Mann–Whitney U test. Counts and percentages describe categorical data, for which Pearson chi-square or, where sparse cells required it, Fisher exact testing was applied. Comparisons across the four IBI groups used Kruskal–Wallis testing for continuous measures and chi-square testing for categorical measures. Associations of IBI with clinical and biochemical variables were summarized using Spearman rank correlations.
For 28-day mortality, discrimination was quantified from ROC curves as AUCs with 95% CIs. Cut points were derived with the Youden statistic and are reported as sample-specific descriptive estimates, since each was derived and evaluated in the same cohort. AUCs of non-nested markers were contrasted pairwise with DeLong tests. Adjusted prognostic associations were estimated with multivariable logistic regression using ln(IBI) as the exposure of interest. Covariates were selected on clinical grounds rather than univariable significance: age and sex as demographic covariates; the Charlson Comorbidity Index (CCI) for comorbidity burden; APACHE II and SOFA for global illness severity and organ dysfunction; lactate as a marker of tissue hypoperfusion; albumin as a marker of nutritional and inflammatory status; and INR as a marker of coagulation and hepatic dysfunction. No formally prespecified causal adjustment set was available. APACHE II and SOFA assess overlapping aspects of acute illness severity but were retained because they capture partially distinct dimensions of physiologic derangement and organ dysfunction; variance inflation factors were reviewed, and low values do not exclude conceptual redundancy. The number of fitted terms was kept proportionate to the available mortality events. Effect estimates are presented as ORs with 95% CIs, both per unit of ln(IBI) and per standard deviation (SD) of ln(IBI), because a one-unit change on the log scale has no direct clinical reading. Whether IBI contributed information beyond APACHE II was assessed with the likelihood-ratio test and AIC. The DeLong test was not used for this comparison because the two models are nested, a setting in which the test does not retain its nominal properties [14]. Because admission diagnosis could plausibly confound the relationship between inflammatory burden and outcome, the logistic and Cox models were refitted with admission diagnosis, grouped from ICD-10 codes into respiratory, neurologic, sepsis or other infection, and all other causes, entered as indicator variables. In a further post hoc analysis prompted by review, patients were grouped into three age bands (65–74, 75–84 and ≥85 years) and the models were repeated with an age-by-ln(IBI) interaction term.
The 90-day endpoint was examined separately with ROC analysis and adjusted logistic regression. A non-significant DeLong result was not interpreted as evidence of equivalence or non-inferiority, neither of which was formally tested. Because only 29 patients were alive at 90 days, the 90-day logistic models were refitted with a parsimonious covariate set to check that the estimates were not an artefact of overfitting. Three sensitivity analyses were undertaken: one excluding the four patients with rheumatoid arthritis, despite confirmation from their records that they were not receiving chronic immunosuppressive therapy before ICU admission, another excluding deaths within 48 h of admission, and a third excluding the 38 patients with solid malignancy. All variables collected for the 308 included patients were complete, so no imputation was required. Statistical tests were two-sided with α = 0.05. The prespecified 28-day analysis was the primary analysis; analyses of 90-day mortality, IBI quartiles, correlations, and the sensitivity analyses were secondary. No formal adjustment for multiple comparisons was applied, so p values from these analyses are nominal.
Survival time was defined as the interval from ICU admission to death from any cause and was censored at 90 days. For the 295 patients who died in the ICU, ICU length of stay gave the exact day of death. Six patients died after ICU discharge at a date known only within an interval, and the midpoint of that interval was used; results were unchanged when the earliest and the latest possible dates were substituted (HR 1.060 and 1.054). Survival was summarized by the Kaplan–Meier method with the log-rank test across IBI quartiles, and Cox proportional hazards models, with ties handled by Breslow’s method, used the same covariate sequence as the logistic models. The proportional hazards assumption was examined with a diagnostic that requires no chosen cut point: a time-dependent covariate formed as each covariate in turn multiplied by the logarithm of risk-set time. Period-specific hazard ratios were then estimated by splitting follow-up at day 28, a division chosen because the prespecified 28-day analysis and the 90-day analysis had produced different results, not because any cut point was identified by the data.
The 28-day and 90-day multivariable models used the same covariate set. For the 90-day analysis, IBI quartiles were entered as an ordinal score rather than as individual contrasts, because only one patient in the highest quartile was alive at 90 days.
3. Results
3.1. Patient Characteristics and Outcomes
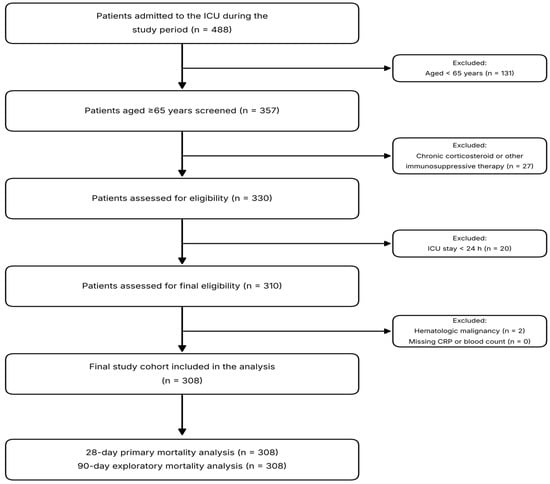
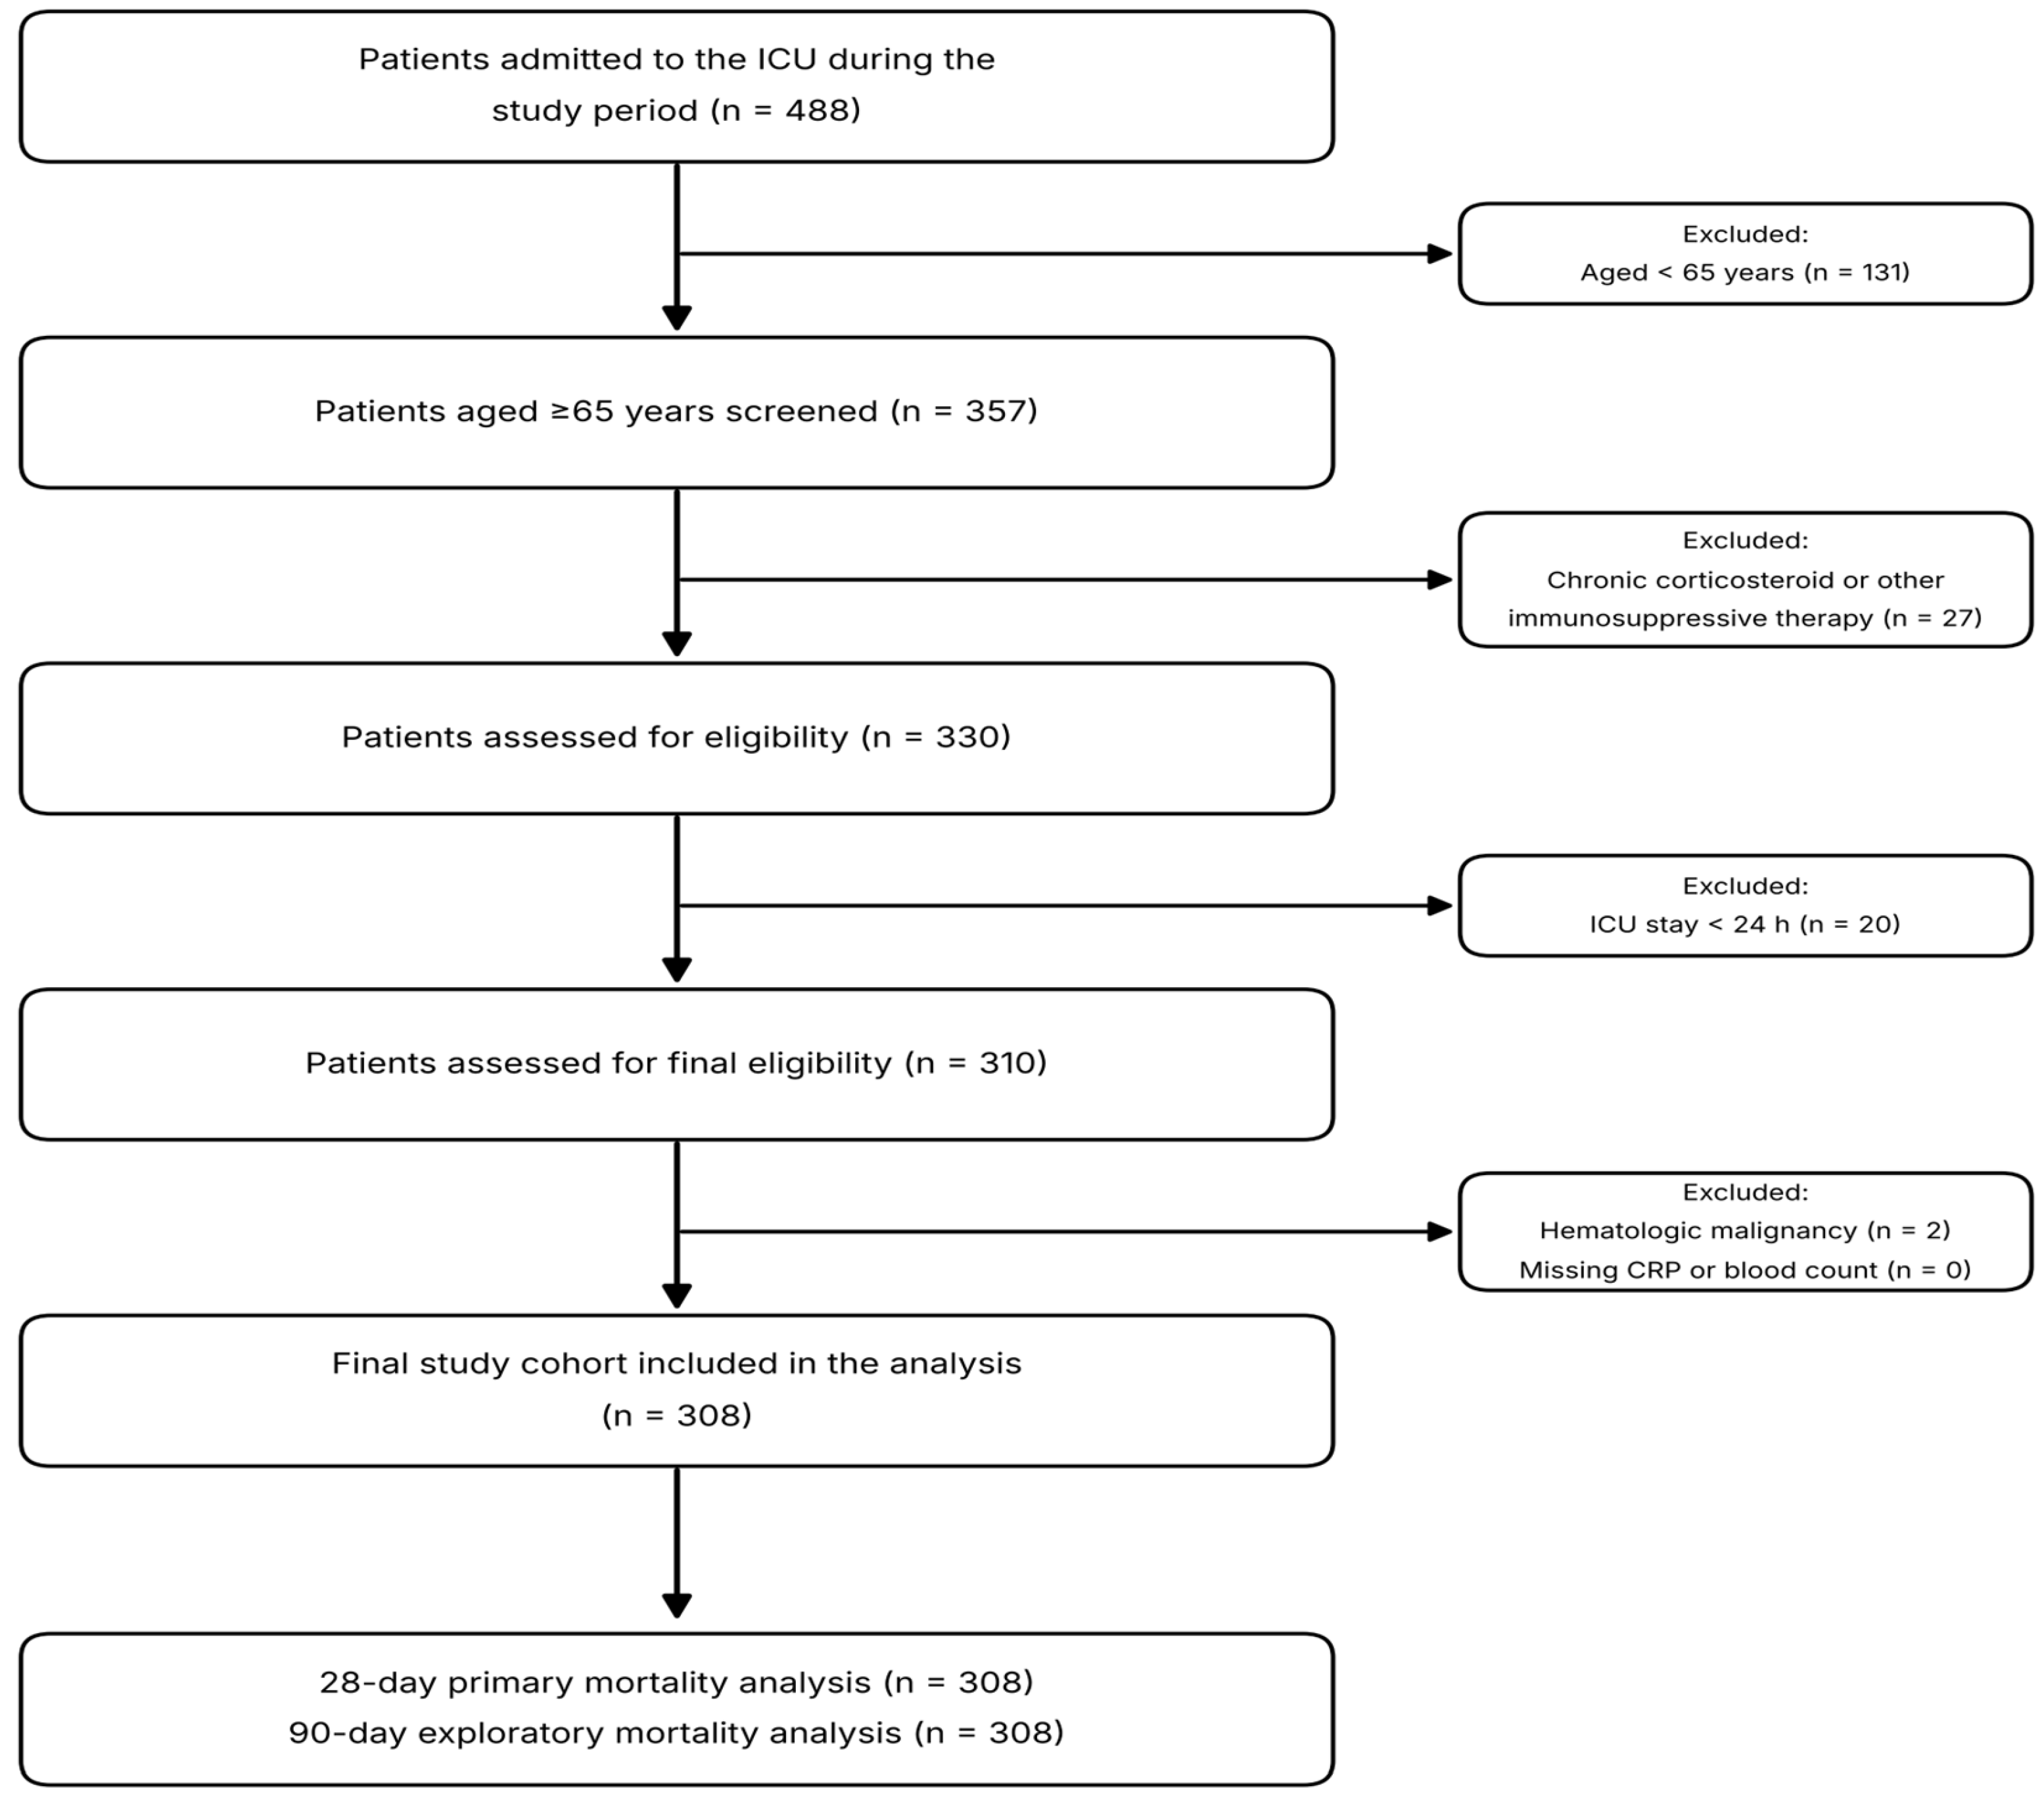
As shown in Figure 1, for patients with more than one ICU admission during the study period, the first admission was taken so that each patient was represented once; no patient had a first admission shorter than 24 h followed by a longer subsequent admission, so this rule and selection of the first admission meeting the criteria produced the same cohort. The unit admitted 488 patients during the study period, of whom 357 were aged ≥65 years and formed the screened population. Twenty-seven were excluded because they were receiving chronic systemic corticosteroid or other chronic immunosuppressive therapy before ICU admission, leaving 330 patients assessed for eligibility. Twenty patients were excluded because their ICU stay was shorter than 24 h. Outcomes for these 20 patients were not retained in the study dataset and could not be reconstructed retrospectively. Of the remaining 310 patients assessed for final eligibility, two were excluded because of hematologic malignancy (one acute myeloid leukemia and one myelodysplastic syndrome), resulting in a final study cohort of 308 patients. No patient was excluded for missing CRP, neutrophil, or lymphocyte measurements because this panel is obtained within 1 h of admission in all patients in this unit. Among the 308 included patients, all variables collected for the present study were complete. Admission source and the duration of hospital stay before ICU admission were not recorded in the study dataset and could not be reconstructed retrospectively.
Figure 1.
Participant flow through screening, eligibility assessment, and analysis.
Outcomes were accounted for at every transition point (Table 1). No patient died on the ward after ICU discharge, so ICU and hospital mortality were identical at 295 of 308 (95.8%). At day 28, 105 of the 113 patients still alive were in the ICU. At day 90, 279 patients had died, 23 were alive but still in the ICU and 6 were alive and out of the ICU. Of the 23 still in the ICU at day 90, 22 subsequently died there after a median ICU stay of 121 days (IQR 101–157) with 82% tracheostomized, and one was later discharged alive. By the end of available follow-up 301 patients (97.7%) had died. The comparison groups in this study are therefore defined by when death occurred, not by whether it occurred.
Table 1.
Outcome accounting for all 308 patients.
Median age was 77 years (IQR 71–83; range 65–96) and 155 patients (50.3%) were male. Admission APACHE II score was 25 (22–29), SOFA score was 8 (7–10), and the age-adjusted Charlson comorbidity index was 5 (4–6). Hypertension (61.0%) and diabetes mellitus (31.2%) were the most frequent comorbidities. Respiratory and neurologic conditions accounted for just over half of admissions (28.2% and 23.4%). Neurologic admissions were more frequent among patients alive at day 28 than among those who died (34.5% versus 16.9%), consistent with the prolonged ICU courses seen in that group.
Four patients arrived from home already tracheostomized and ventilator-dependent. During follow-up, 299 patients (97.1%) received mechanical ventilation, 241 (78.2%) required vasopressors, and 65 (21.1%) underwent renal replacement therapy. Median ICU length of stay was 13 days (5–34) and median duration of ventilation was 10 days (4–29). Mortality was 195/308 (63.3%) at 28 days, 279/308 (90.6%) at 90 days, and 295/308 (95.8%) in the ICU. Complete 90-day follow-up was available for all 308 patients, and there was no loss to follow-up. Of the 113 patients alive at day 28, 101 subsequently died in the ICU, so the comparison group is defined throughout as patients alive at 28 days rather than as survivors. This unusually high ICU mortality should be interpreted in the context of the local admission, discharge, and end-of-life care pathways described in the Discussion.
Two outcomes named in the study protocol could not be analyzed. Development of organ failure was to be assessed from the change in SOFA score, but only the admission score was available. The requirement for mechanical ventilation could not be modeled as a binary outcome because 299 of 308 patients (97.1%) were ventilated, leaving nine patients in the reference group.
The distribution of IBI was markedly right skewed (Shapiro–Wilk W = 0.609; p < 0.001), with a median of 357.09 (95.06–1233.14). It was entered into regression models after natural logarithmic transformation.
3.2. Comparison by 28-Day Mortality
Patients who died and those alive at day 28 were similar in age, sex, Charlson index, and comorbidity burden (Table 2). Those who died had higher APACHE II (26 vs. 23; p < 0.001) and SOFA scores (9 vs. 7; p < 0.001) and more often required vasopressors (88.7% vs. 60.2%; p < 0.001). Tracheostomy was far more common among patients alive at day 28 (50.4% vs. 2.1%; p < 0.001), reflecting progression to tracheostomy in those with prolonged ICU stay. Median ICU length of stay was 6 days in patients who died and 43 days in those alive at day 28 (p < 0.001).
Table 2.
Demographic and clinical characteristics of the study population by 28-day mortality.
Among laboratory parameters, patients who died had higher hemoglobin (10.30 vs. 9.00 g/dL; p < 0.001), lactate (2.40 vs. 1.60 mmol/L; p < 0.001), INR (1.21 vs. 1.09; p = 0.001), total bilirubin (0.78 vs. 0.59 mg/dL; p = 0.002), CRP (43.00 vs. 22.00 mg/L; p = 0.009), procalcitonin (1.03 vs. 0.60 ng/mL; p = 0.016), and creatinine (1.62 vs. 1.37 mg/dL; p = 0.022) (Table 3).
Table 3.
Laboratory parameters and systemic inflammatory indices by 28-day mortality.
Of the systemic inflammatory indices, IBI (559.48 vs. 199.53; p = 0.012) and CAR (1.44 vs. 0.75; p = 0.005) were higher in patients who died. NLR (p = 0.333), PLR (p = 0.182), and SII (p = 0.572) did not differ between groups. Neutrophil (p = 0.807) and lymphocyte counts (p = 0.104) were also not discriminative on their own.
3.3. Distribution Across IBI Quartiles
Patients were divided into four equal quartiles by IBI (n = 77 each; boundaries 95.1, 357.1, and 1233.1). Age, sex, Charlson index, and SOFA score did not differ across quartiles, and APACHE II was borderline (p = 0.055). CRP, neutrophil count, and NLR rose across quartiles while lymphocyte count and albumin fell (all p < 0.001). Lactate also increased (p = 0.009).
Mortality at 28 days was 55.8%, 54.5%, 72.7%, and 70.1% from Q1 to Q4 (p = 0.031). The gradient was steeper at 90 days: 84.4%, 83.1%, 96.1%, and 98.7% (p < 0.001). ICU mortality did not differ across quartiles (94.8% to 97.4%; p = 0.829) because almost the entire cohort died in the ICU. Renal replacement therapy increased from 11.7% in Q1 to 29.9% in Q4 (p = 0.035). ICU length of stay and duration of mechanical ventilation are reported descriptively in Table S1; between-quartile inferential comparisons were not emphasized because death may truncate both outcomes.
3.4. ROC Analysis
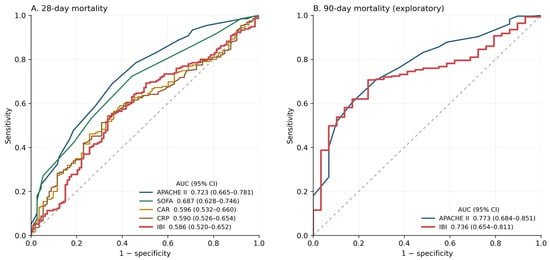
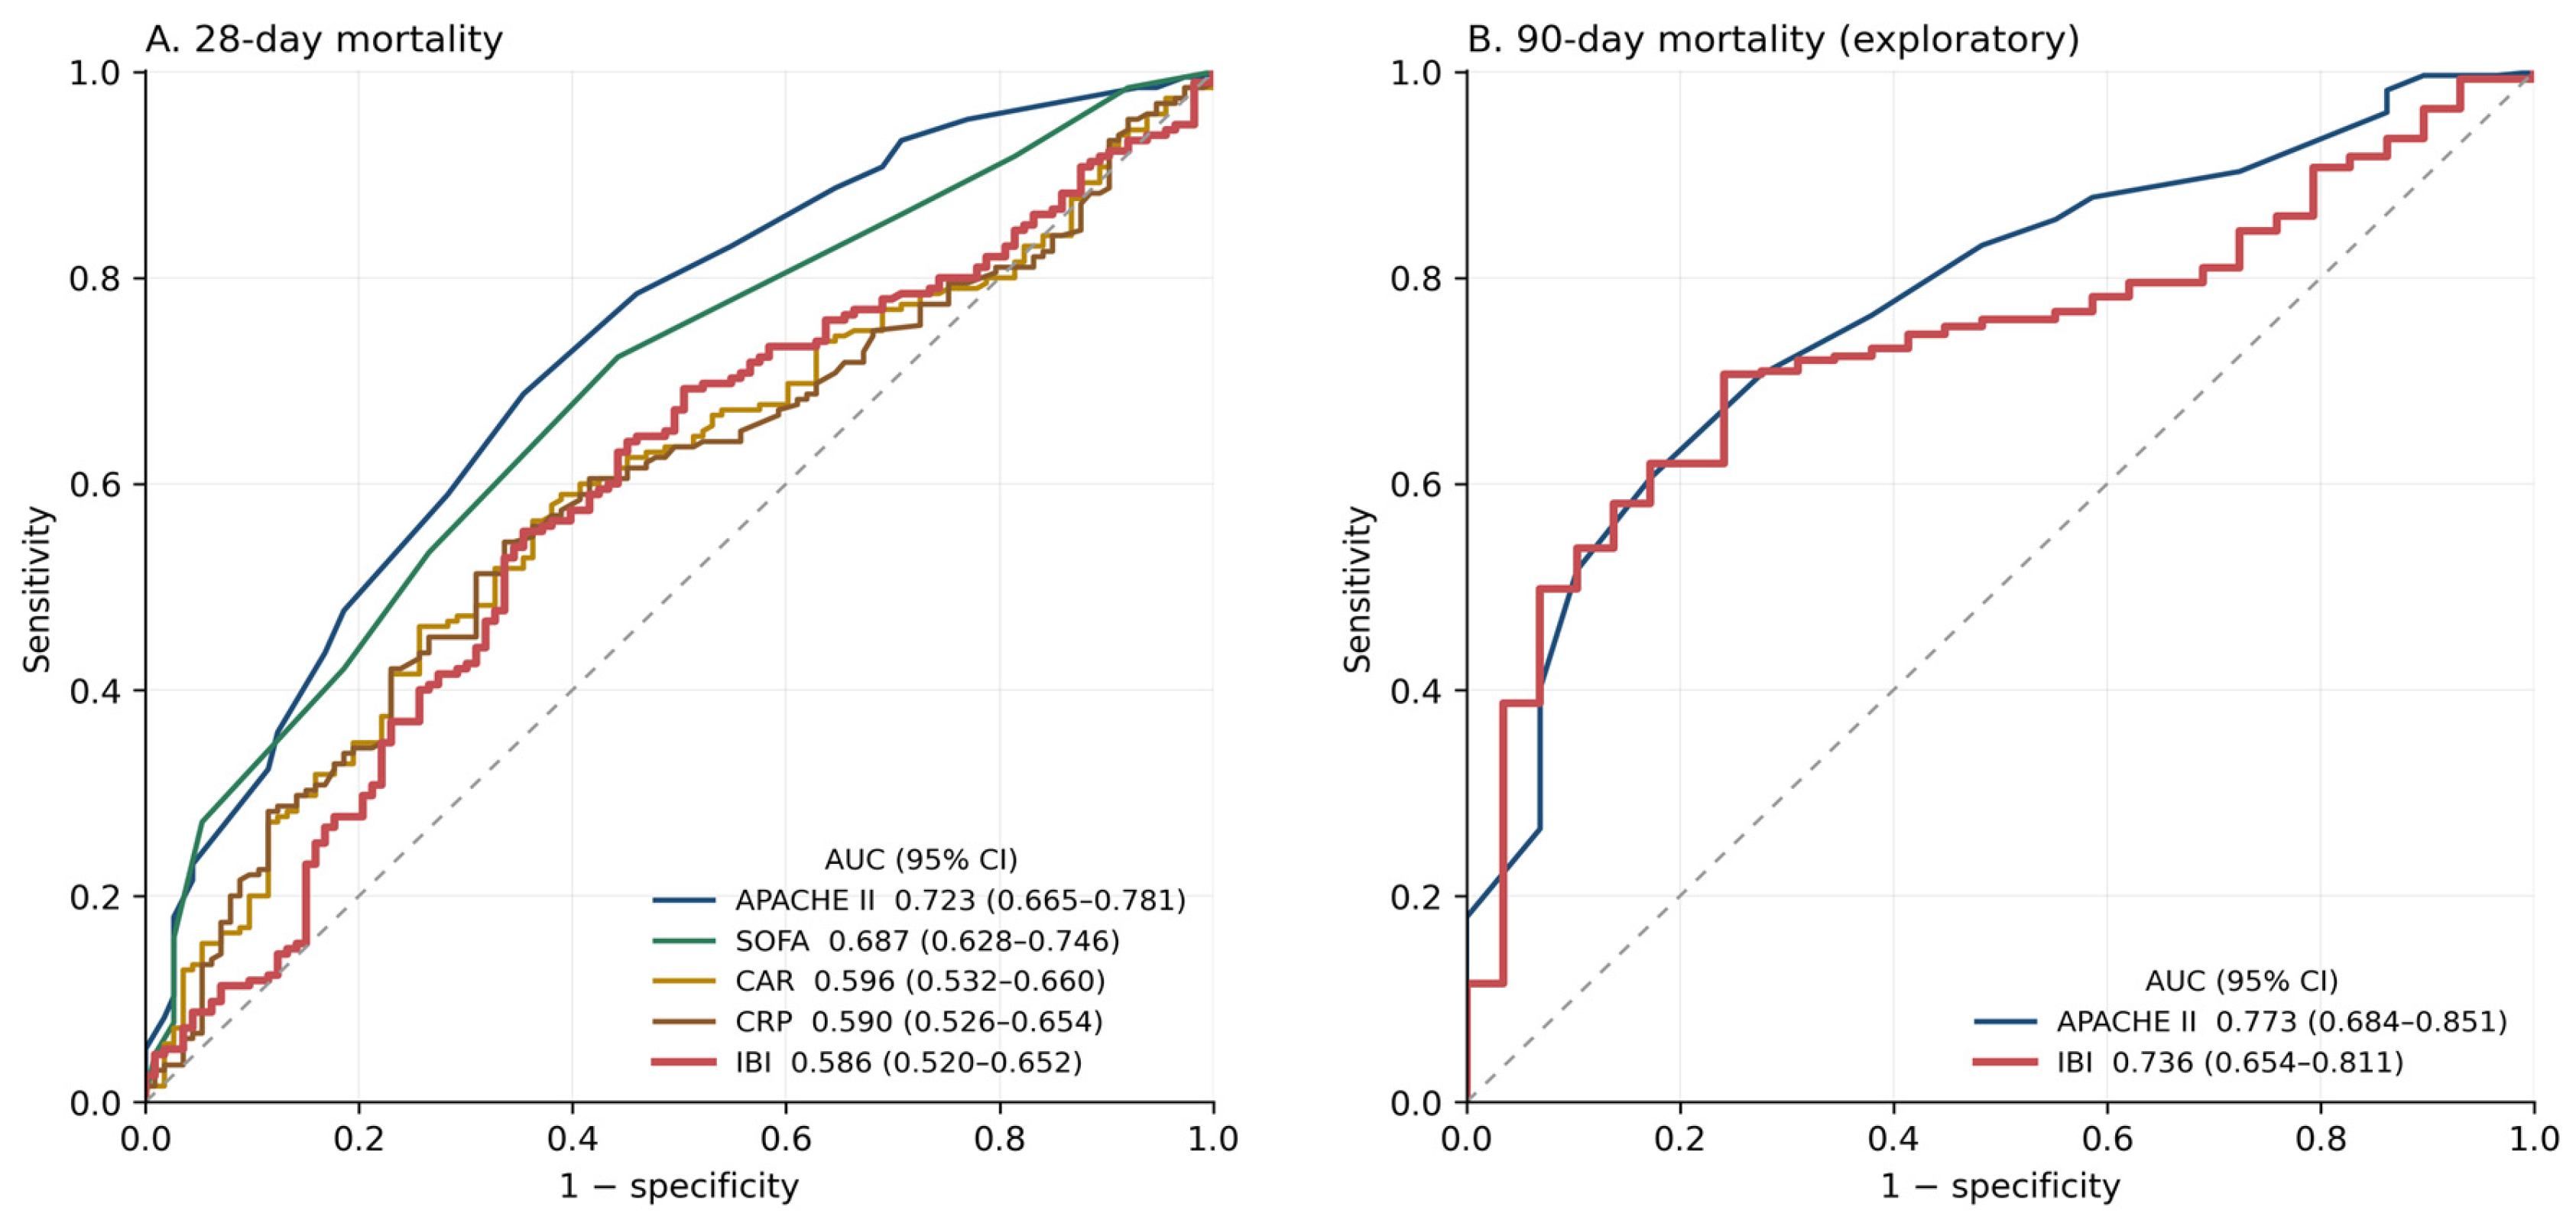
Because 295 of 308 patients (95.8%) died in the ICU, discrimination at 28 days separates earlier from later death rather than death from survival, and the areas below should be read in that light. APACHE II showed the highest discrimination for 28-day mortality (AUC 0.723; 95% CI 0.665–0.781), followed by SOFA (0.687; 0.628–0.746) and lactate (0.627; 0.564–0.691). IBI showed weak discrimination (AUC 0.586; 95% CI 0.520–0.652; p = 0.011); its sample-derived Youden cut point of 411 gave a sensitivity of 0.554 and a specificity of 0.646, which is not a usable classification (Table 4). NLR (AUC 0.533; p = 0.331), PLR (0.546; p = 0.177), and SII (0.519; p = 0.570) had AUCs close to 0.5. Hemoglobin had a higher AUC than any of the inflammatory markers (0.641 versus 0.586 for IBI), although the difference from IBI was not significant (difference 0.055, 95% CI −0.036 to 0.147; p = 0.237). ROC curves for the main comparators are shown in Figure 2.
Table 4.
ROC analysis of inflammatory markers and severity scores for 28-day mortality.
Figure 2.
Receiver operating characteristic curves for 28-day mortality (A) and for 90-day mortality (B). Panel A shows that IBI, CRP, and CAR are nearly superimposed and lie below SOFA and APACHE II; the differences from SOFA and APACHE II were significant on DeLong testing (p = 0.022 and p = 0.001). Panel B is exploratory and should be read together with the time-to-event analysis in Section 3.8.
In pairwise DeLong comparisons, the AUC for IBI did not differ from that of CRP (p = 0.820) or CAR (p = 0.581), and its advantage over NLR fell short of significance (p = 0.086). Only the comparison with SII reached nominal significance (p = 0.049), a value that is borderline and was not corrected for multiple comparisons. It performed significantly worse than both SOFA (difference −0.101; p = 0.022) and APACHE II (difference −0.137; p = 0.001) (Table 5).
Table 5.
Pairwise comparison of AUC values using the DeLong test.
3.5. Logistic Regression for 28-Day Mortality
On univariate analysis, ln(IBI) was associated with 28-day mortality (OR 1.138; 95% CI 1.007–1.286; p = 0.038). The association persisted after adjustment for age and sex (OR 1.146; 1.014–1.296; p = 0.029) but disappeared once APACHE II and SOFA entered the model (OR 1.083; 0.945–1.240; p = 0.251) and remained non-significant in the full model containing CCI, lactate, albumin, and INR (OR 1.056; 0.917–1.217; p = 0.448). Expressed per standard deviation of ln(IBI), the fully adjusted estimate was OR 1.11 (95% CI 0.85–1.46). Quartile analysis showed no dose–response (p for trend = 0.182). In the fully adjusted multivariable model, higher APACHE II and SOFA scores and higher lactate levels were associated with greater odds of 28-day mortality within Model 3 (APACHE II: OR 1.128; p < 0.001; SOFA: OR 1.163; p = 0.024; lactate: OR 1.165; p = 0.042) (Table 6). There was no evidence of substantial statistical multicollinearity (all variance inflation factors < 1.6).
Table 6.
Logistic regression analysis for 28-day mortality.
A post hoc model additionally incorporating hemoglobin is presented in the Supplementary Material. In that model, hemoglobin was associated with 28-day mortality (OR 1.342 per g/dL; 95% CI 1.171–1.538; p < 0.001) and the estimate for ln(IBI) remained null (OR 1.031; 95% CI 0.888–1.197; p = 0.688) (Table S2). Adding hemoglobin to a model containing APACHE II alone raised the AUC from 0.723 to 0.759 and lowered the AIC from 363.3 to 350.7 (likelihood ratio χ2 = 14.65; p < 0.001), in contrast to the negligible change produced by ln(IBI). Vasopressor use was not entered into the multivariable models because it is a treatment that reflects the cardiovascular component of the SOFA score rather than a distinct baseline covariate.
The incremental contribution of IBI to established scores was assessed separately. Because the two models are nested, this was assessed with the likelihood-ratio test rather than by comparing AUCs: adding ln(IBI) to a model containing APACHE II alone gave χ2 = 1.19 (p = 0.275), the AIC rose from 363.3 to 364.2, and the apparent AUC gain was 0.003. Because ln(IBI) is the sum of ln(CRP) and ln(NLR), asking whether IBI adds information to CRP is the same as asking whether NLR does. It did not: adding ln(IBI) to a model containing ln(CRP) gave a likelihood ratio χ2 of 0.14 (p = 0.712) and raised the AIC from 404.1 to 406.0.
3.6. Ninety-Day Mortality: Exploratory Analysis
Vital status at 90 days was available for all 308 patients. The 90-day AUC for IBI was 0.736 (0.659–0.812; p < 0.001). The DeLong comparison with APACHE II (AUC 0.773; 95% CI 0.692–0.854) did not provide evidence of a difference between the AUCs (p = 0.523). ln(IBI) was associated with 90-day mortality in unadjusted analysis (OR 1.452; 1.194–1.768; p < 0.001), after adjustment for APACHE II and SOFA (OR 1.409; 1.138–1.745; p = 0.002), and after further adjustment for CCI, lactate, albumin, and INR (OR 1.347; 1.076–1.686; p = 0.009). Quartile contrasts are not reported because only one of the 77 patients in the highest quartile was alive at 90 days. Entered as an ordinal score, each one-quartile increase in IBI was associated with higher 90-day mortality (OR 1.921, 95% CI 1.208–3.053; p for trend = 0.006) (Table 7). Only 29 of 308 patients were alive at 90 days, so all 90-day estimates rest on a small comparison group and the full model fits nine terms to that group. Refitting with a parsimonious covariate set containing only age and APACHE II gave a similar estimate (OR 1.416; 95% CI 1.147–1.748; p = 0.001), so the association does not appear to be an artefact of overfitting. Per standard deviation of ln(IBI) the fully adjusted estimate was OR 1.77 (95% CI 1.15–2.71).
Table 7.
Logistic regression analysis for 90-day mortality (exploratory).
3.7. Correlations
IBI correlated most strongly with its own components: CRP (rho = +0.866; p < 0.001) and NLR (rho = +0.564; p < 0.001). Correlation was moderate with procalcitonin (rho = +0.317) and inverse with albumin (rho = −0.253). Correlations with severity scores were weak, at rho = +0.165 for APACHE II (p = 0.004) and rho = +0.101 for SOFA (p = 0.077). There was no correlation with age (rho = +0.020; p = 0.726). Correlations with ICU length of stay and ventilation duration were not emphasized because these durations are truncated by death (Table S3).
3.8. Time to Death
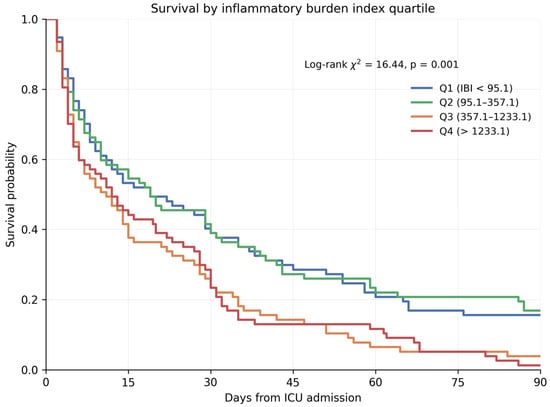
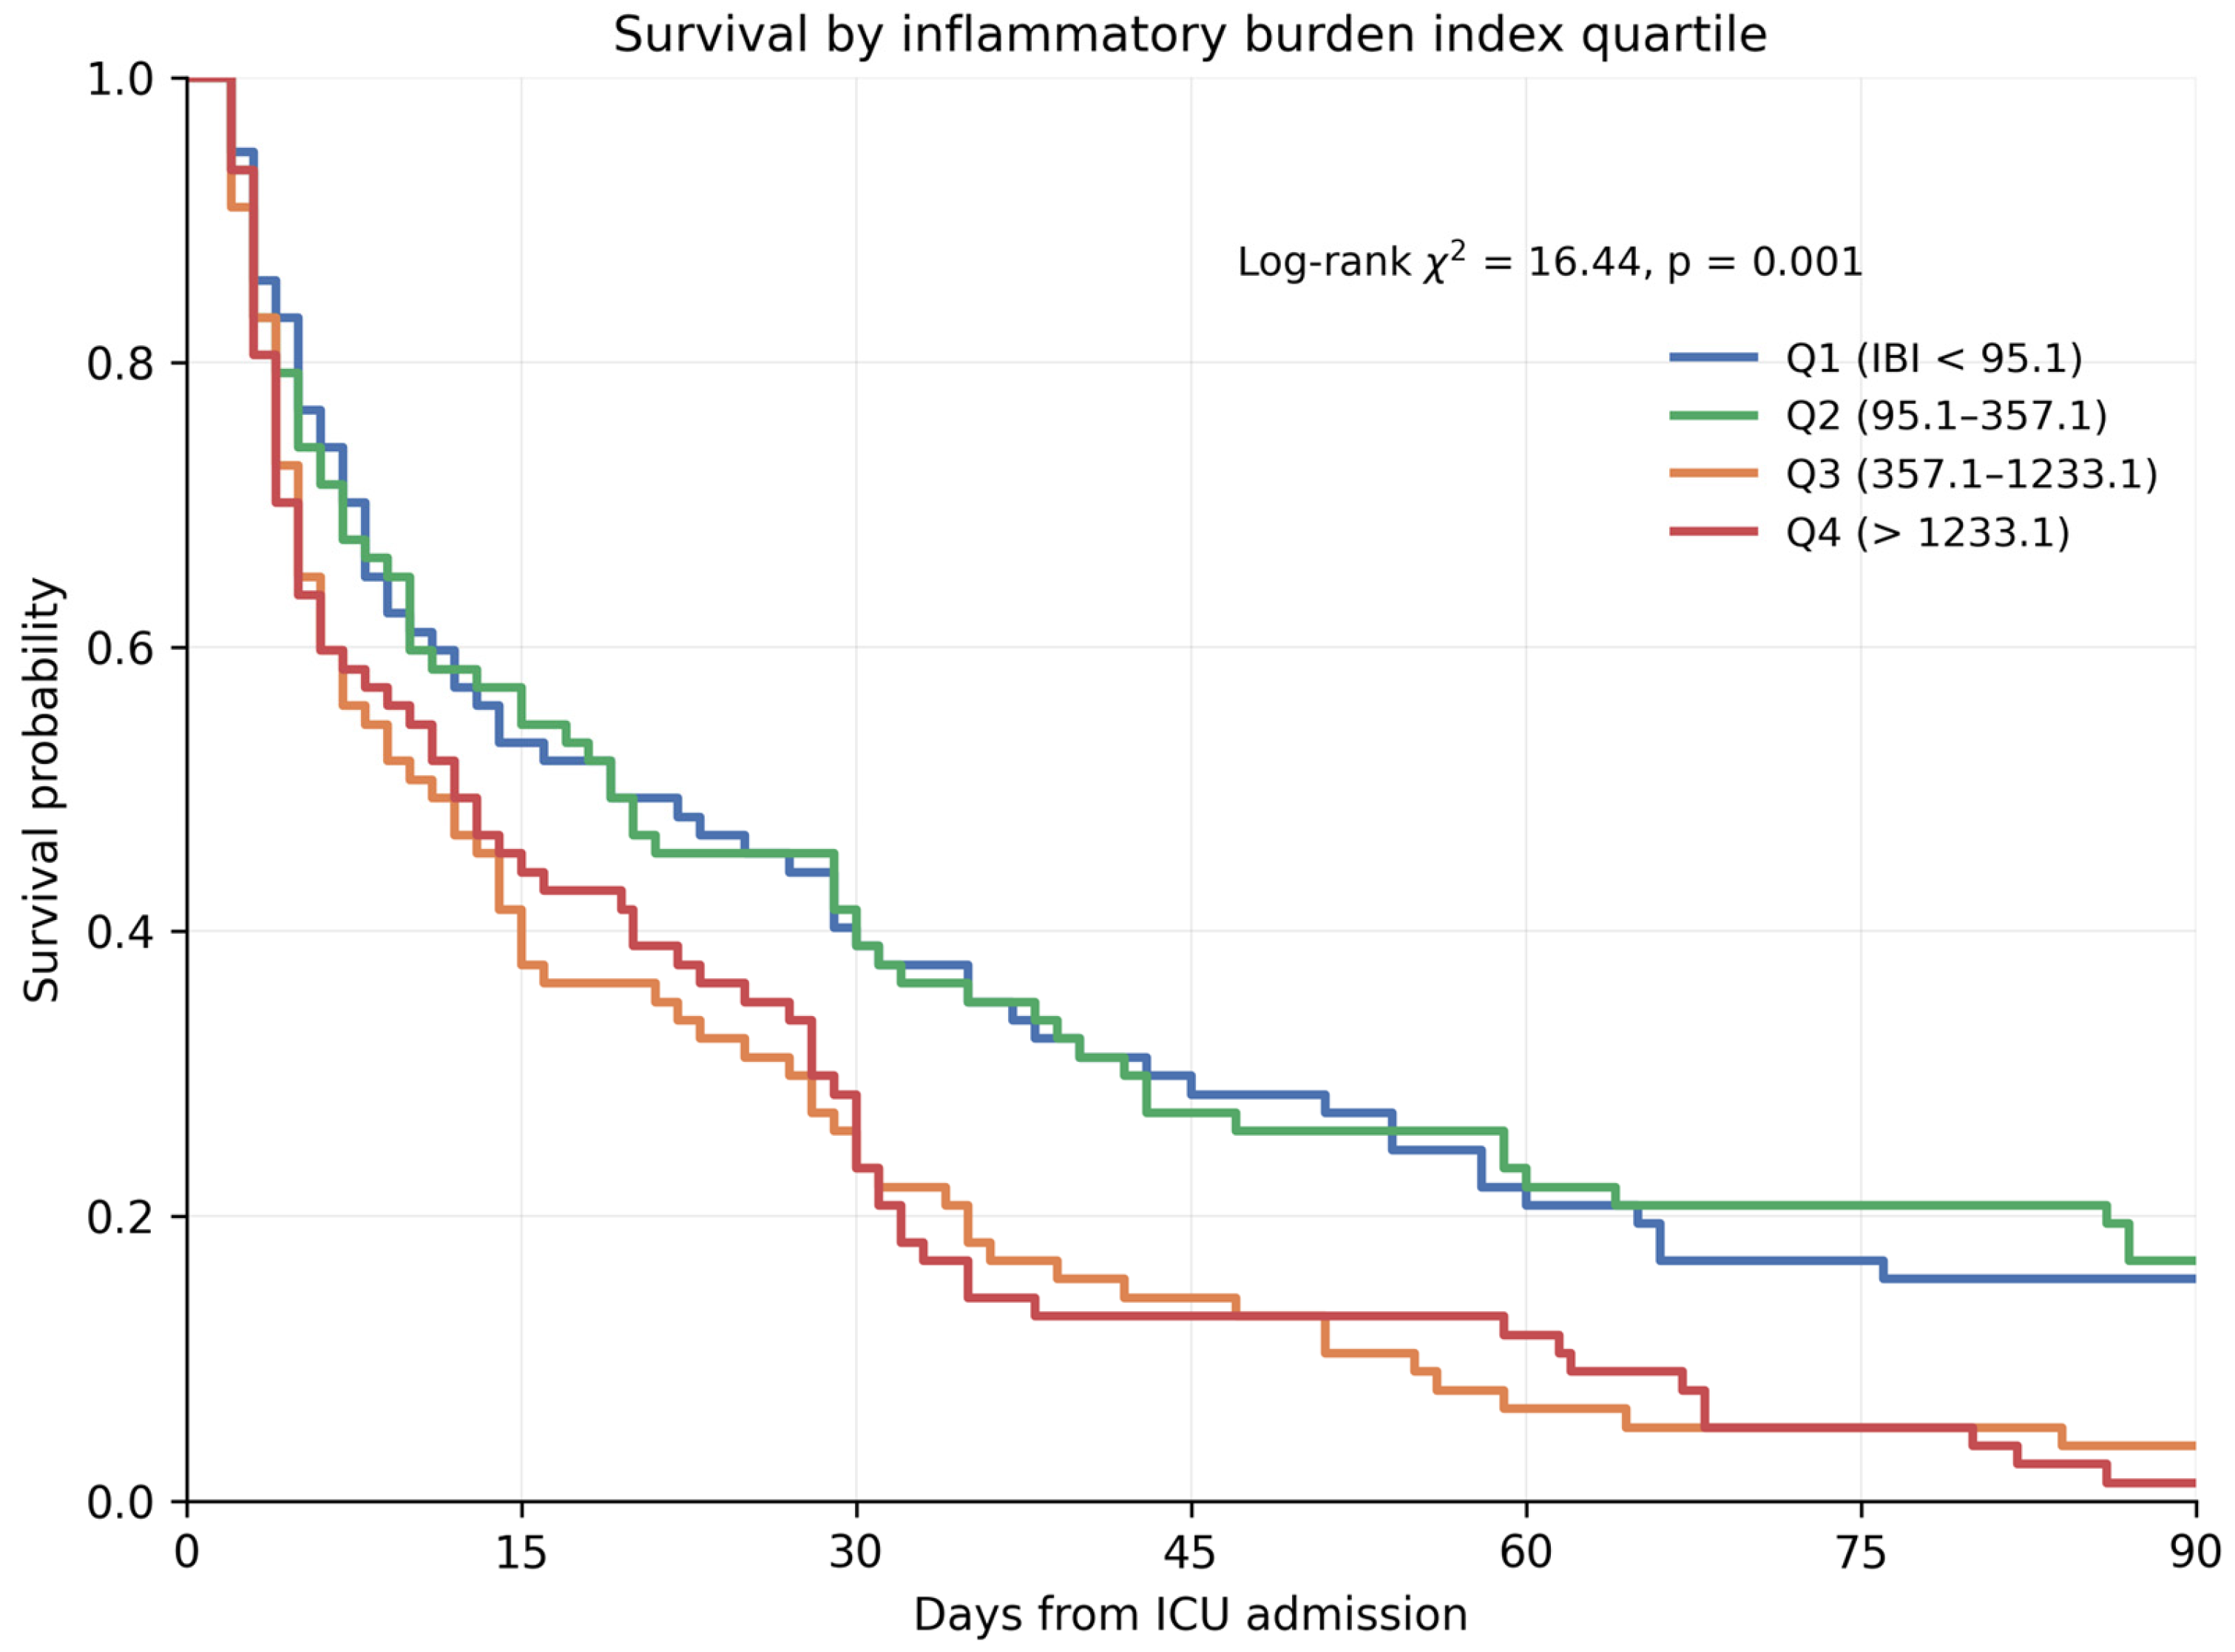
Over 90 days of follow-up there were 279 deaths and 29 patients censored alive. Median survival was 14 days overall (95% CI 9.8–18.2) and fell across IBI quartiles: 19 days in Q1 (5.6–32.4), 19 days in Q2 (7.5–30.5), 11 days in Q3 (5.5–16.5), and 12 days in Q4 (6.3–17.7) (log-rank χ2 = 16.44, df = 3, p = 0.001; Figure 3). Survival at day 28 fell from 44.2% in Q1 to 29.9% in Q4, and survival at day 90 from 15.6% to 1.3%.
Figure 3.
Kaplan–Meier survival curves by inflammatory burden index quartile, censored at 90 days. Numbers at risk at days 0, 15, 30, 45, 60, 75, and 90 were 77, 41, 31, 23, 17, 13, and 12 for Q1; 77, 44, 32, 21, 18, 16, and 13 for Q2; 77, 32, 20, 11, 5, 4, and 3 for Q3; and 77, 35, 22, 10, 9, 4, and 1 for Q4.
In Cox models, ln(IBI) was associated with death before adjustment (HR 1.118, 95% CI 1.047–1.194; p < 0.001) and after adjustment for age and sex (HR 1.124, 95% CI 1.053–1.201; p < 0.001). The estimate attenuated once APACHE II and SOFA entered the model (HR 1.080, 95% CI 1.010–1.155; p = 0.024) and was null in the full model (HR 1.053, 95% CI 0.981–1.129; p = 0.152) (Table 8). Adding an indicator for data abstractor did not change the estimate (HR 1.044, 95% CI 0.970–1.124).
Table 8.
Cox proportional hazards models for time to death within 90 days.
ln(IBI) was the only covariate to violate the proportional hazards assumption. A time-dependent covariate formed as ln(IBI) multiplied by the logarithm of risk-set time, which involves no cut point, was significant (p = 0.030), whereas the corresponding term formed from each of the other covariates was not (lowest p = 0.235). Follow-up was therefore split at day 28. During days 0–28 the adjusted hazard ratio was 1.008 (95% CI 0.928–1.094; p = 0.854, 195 events); during days 28–90 it was 1.160 (95% CI 1.016–1.325; p = 0.028, 84 events), or 1.33 (95% CI 1.03–1.71) per standard deviation of ln(IBI).
Because IBI differed by admission diagnosis (Supplementary Table S4), the models were refitted with diagnosis entered as indicator variables. This did not weaken the late association; if anything it strengthened slightly, to HR 1.179 (95% CI 1.025–1.357; p = 0.021) for days 28 to 90, while the estimate for days 0 to 28 remained null (HR 1.011; 95% CI 0.928–1.102) (Table 8).
3.9. Sensitivity Analyses
Excluding the four patients with rheumatoid arthritis, whose medical records confirmed no chronic systemic corticosteroid or other chronic immunosuppressive therapy before ICU admission, did not change the results (n = 304; IBI AUC 0.588; adjusted OR 1.058; p = 0.435). This analysis was performed as an additional robustness check rather than because these patients met the immunosuppressive-therapy exclusion criterion. Excluding the 21 patients who died within the first 48 h also left the findings unchanged (n = 287; IBI AUC 0.584; adjusted OR 1.050, 95% CI 0.910–1.210; p = 0.505). Excluding the 38 patients with solid malignancy, in whom IBI was higher (median 730 versus 330), also left the findings unchanged (n = 270; IBI AUC 0.582; adjusted OR 1.046, 95% CI 0.899–1.217; p = 0.561), and the association over days 28 to 90 persisted (HR 1.156; 95% CI 1.010–1.323; p = 0.035).
Age behaved as a null variable throughout. Across the three age bands (65–74, 75–84 and ≥85 years) neither illness severity, IBI, nor mortality differed (APACHE II p = 0.567; IBI p = 0.673; 28-day mortality 64.1%, 59.7% and 68.9%, p = 0.468; 90-day mortality 90.6%, 88.2% and 95.1%, p = 0.330; Supplementary Table S5). Age itself did not predict 28-day mortality (OR 1.000 per year; 95% CI 0.970–1.030; p = 0.981) and did not correlate with IBI (rho = +0.020; p = 0.726). The association between IBI and mortality did not vary by age: the interaction term was non-significant for 28-day mortality (p = 0.880), for 90-day mortality (p = 0.564) and in the Cox model for days 28 to 90 (p = 0.303). These analyses were post hoc and the oldest band contains only 61 patients, so they exclude only large effect modification.
4. Discussion
Two features of this cohort govern how every result should be read. First, 295 of 308 patients (95.8%) died in the ICU, and at day 90 only 6 were alive and out of the unit; 23 of the 29 patients counted as alive at that point were still receiving intensive care and 22 of them died there later. The analyses therefore compare patients who died earlier with patients who died later, not survivors with non-survivors, and the word survival should be read in that restricted sense throughout. Second, within that frame, baseline IBI did not provide clinically meaningful prognostic information for the prespecified primary outcome of 28-day mortality. Although the 28-day AUC differed from 0.50 (p = 0.011), its magnitude (0.586) indicated weak discrimination, the association did not survive multivariable adjustment (OR 1.11 per standard deviation; 95% CI 0.85–1.46), and adding IBI to a model containing APACHE II gave no improvement on the likelihood-ratio test.
The weak short-term performance is compatible with earlier work showing variable prognostic value for composite inflammatory markers in older ICU populations. Çakin et al. reported that, among several such markers, the CRP-to-albumin ratio had the best 28-day discrimination, although its AUC was only 0.665 [4]. In our data, NLR, PLR, and SII likewise provided little useful separation at 28 days; the AUCs of IBI and CAR were 0.586 and 0.596. Taken together, these observations indicate that one admission inflammatory index may be insufficient for reliable short-term risk classification in a clinically diverse geriatric ICU cohort.
An important feature of these results is the distinction between an unadjusted prognostic association and clinically useful discrimination. IBI was higher in the group that died by day 28, and ln(IBI) was significant when modeled alone. That signal disappeared after inclusion of APACHE II and SOFA and remained absent with broader adjustment. A reasonable interpretation is that IBI reflects inflammatory activity accompanying severe acute illness, while much of the same risk information is already represented by physiologic and organ-failure scores.
The head-to-head comparisons support that interpretation. IBI’s 28-day AUC of 0.586 was below the values for APACHE II (0.723) and SOFA (0.687), with both differences significant by DeLong testing. By contrast, IBI did not outperform CRP or CAR. Adding ln(IBI) to APACHE II gave no improvement on the likelihood-ratio test, the appropriate comparison for nested models, and the AIC rose. On these data, IBI should neither replace APACHE II or SOFA nor be routinely appended to them for short-term prognostic stratification.
Our 28-day findings are not identical to those of Zhong et al., who observed an adjusted association between IBI and 28-day mortality in the MIMIC-IV sepsis cohort [8]. The difference is plausibly related to case mix rather than a true conflict between studies. Our patients were older and exceptionally ill: median APACHE II and SOFA scores were 25 and 8, 97.1% underwent mechanical ventilation, and 78.2% received vasopressors. Moreover, Zhong et al. studied sepsis specifically, whereas our cohort encompassed multiple causes of critical illness. The incremental value of IBI may therefore depend on both diagnostic composition and baseline physiologic severity.
The construction of the index provides another perspective. By definition, IBI multiplies CRP by NLR, pairing an acute-phase marker with a measure of neutrophil–lymphocyte balance; its original prognostic evaluation was performed in cancer [5]. Combining two variables mathematically, however, does not necessarily create additional prognostic content. In the present cohort, IBI tracked CRP strongly and NLR moderately, while its correlations with APACHE II and SOFA were weak. Its AUC was also not superior to CRP or CAR. These findings offer little evidence that IBI carries substantial short-term information beyond simpler inflammatory measures.
The timing of the measurement is relevant to the weak short-term performance. CRP was drawn within 1 h of ICU admission, before the acute-phase response had fully developed; hepatic CRP synthesis peaks 24 to 48 h after the inflammatory stimulus. The median CRP of 31.4 mg/L in a cohort with a median APACHE II of 25 is consistent with this timing. A single admission measurement of IBI may therefore capture pre-existing inflammatory burden more than the response to the acute illness, which offers one explanation for its weak discrimination at 28 days and an argument for testing serial measurements. The same timing creates a mismatch within the models. IBI was fixed at the first hour, whereas APACHE II and SOFA were derived from the worst values over the first 24 h and therefore incorporate information that accrued after the biomarker was measured. Adjustment for these scores is thus conservative towards IBI, and part of what appears as redundancy may be the severity scores capturing deterioration that IBI could not yet reflect.
The quartile results also lacked the pattern expected from a stable dose–response relationship. Across Q1 through Q4, 28-day mortality was 55.8%, 54.5%, 72.7%, and 70.1%. After adjustment, no higher quartile differed independently from Q1, and the overall trend was not significant. Accordingly, the quartile analysis does not support treating IBI as a consistent dose-dependent indicator of 28-day mortality.
The time-to-event analysis offers a way to reconcile the 28-day and 90-day results. Ninety-day mortality rose from 84.4% in Q1 to 98.7% in Q4, whereas ICU mortality was flat across quartiles, from 94.8% to 97.4%. Almost every patient in the lowest quartile died during the ICU stay, but did so later: median survival was 19 days in Q1 against 12 days in Q4. The hazard ratio for ln(IBI) was 1.008 during the first 28 days and 1.160 thereafter. In period-specific models, baseline IBI was unrelated to death during the first 28 days and was associated with death only among patients who survived that period. A time-dependent covariate test, which requires no cut point, supported the departure from proportional hazards (p = 0.030) and identified ln(IBI) as the only covariate concerned. Because IBI differed by admission diagnosis, with the lowest values in neurologic admissions and the highest in sepsis (Supplementary Table S4), diagnosis is a plausible explanation for the late association; adjusting for it did not remove the association but strengthened it slightly (HR 1.179; 95% CI 1.025–1.357). The comparison group makes this intelligible: of the 113 patients alive at day 28, 101 later died in the ICU, their median ICU stay was 43 days, and half underwent tracheostomy. These are the features of chronic critical illness and of the persistent inflammation, immunosuppression, and catabolism phenotype [15,16], in which a sustained inflammatory state coexists with only moderate elevation of admission acute-phase markers. The late association rests on 84 events and a nominal p value of 0.028 without correction for multiplicity. It should also be read against what the day-28 comparison group actually was patients who were mostly still in the ICU, approaching tracheostomy and prolonged ventilation. The finding is post hoc and requires independent confirmation in a cohort where meaningful survival occurs.
Reports from community cohorts have also linked higher IBI with longer-term mortality [6,7], which is directionally compatible with our 90-day observation but does not validate it in critically ill older adults. Event imbalance was extreme in our study: 279 of 308 patients died by day 90, only 29 remained alive, and 76 of the 77 patients in the highest quartile died. Individual quartile contrasts were therefore uninformative and are not reported; the trend across quartiles is presented instead. The 90-day result should be considered a signal for further study, not confirmatory evidence.
Patients with solid malignancy were deliberately retained. Solid tumors raise CRP and are themselves associated with poor outcome, so excluding them would have removed a group in which inflammatory burden carries genuine prognostic meaning and would have narrowed an already selected population; the exclusion we did apply was aimed at treatments that distort the leukocyte profile, not at disease states that elevate it. IBI was indeed higher in these 38 patients (median 730 versus 330), but excluding them changed nothing: the 28-day estimate remained null (adjusted OR 1.046) and the association over days 28 to 90 persisted (HR 1.156).
The background mortality of the source population puts the observed event rate in perspective. Remaining life expectancy at age 65 in Türkiye is 18.4 years [17]. Within the cohort, age carried no prognostic signal at all: mortality did not differ across age bands, age did not predict 28-day death (OR 1.000 per year; 95% CI 0.970–1.030) and the effect of IBI did not vary with it (Supplementary Table S5). The 90.6% mortality observed at 90 days therefore reflects critical illness and the admission profile of the unit rather than age or the background mortality of the region, and the cohort should be read as a severity-selected sample rather than as geriatric intensive care in general.
The design and the setting followed from the question. Türkiye’s population is aging, and older adults account for a growing share of intensive care use, so prognostic markers that behave predictably in this group have practical value. The unit serves a province with a long Aegean coastline, a large retired population, and extensive seasonal settlement, in which 233,358 of 1,284,517 residents, or 18.2%, are aged 65 years and over, against 11.1% for Türkiye as a whole [18]. Patients in this age group consequently form a substantial part of the ICU caseload. A retrospective design was preferred for two reasons. IBI is calculated from CRP and the differential leukocyte count, both obtained within the first hour of admission as part of routine care, so a prospective protocol would have added no measurement that was not already available; and in a population in which absent family or social support is common, recruitment requiring surrogate consent would have excluded a meaningful part of the patients the unit actually treats. Examining a full calendar year of consecutive eligible admissions instead allowed the question to be addressed in the population as it presents, at the cost of generalizability set out below. The case mix of the unit was known to us in advance, and the analyses and the framing of the results were chosen accordingly: the comparisons made here are between earlier and later death rather than between survival and death.
One unexpected finding deserves mention. Higher admission hemoglobin was associated with higher 28-day mortality (10.30 versus 9.00 g/dL; p < 0.001; univariable OR 1.209 per g/dL), and its AUC of 0.641 was the highest of any single laboratory variable, although the difference from IBI did not reach significance. The direction is opposite to what anemia-focused ICU literature would predict. Two features constrain the interpretation. Hemoglobin was measured within 1 h of ICU admission, so events during the subsequent ICU stay cannot account for the value. The association also strengthened rather than attenuated with adjustment, reaching 1.342 per g/dL in the fully adjusted model (Table S2), which argues against simple confounding by illness severity. Hemoconcentration from volume depletion at presentation, and pre-existing anemia of chronic disease in patients who later followed a chronic critical illness course, are both compatible with this pattern, and neither can be tested in these data. We report the association because it produced the largest single-variable AUC in the cohort, but it was not part of the prespecified analysis and we do not interpret it as prognostic.
Strengths and Limitations
Several design features strengthen the analysis. We considered all eligible admissions within a fixed window, had complete data for the variables used, kept IBI continuous in the main models rather than relying on an optimized cutoff, and compared its discrimination directly with established severity scores. We also tested whether IBI added information beyond APACHE II, which separates prognostic association from incremental utility. Vital status was verified through the national e-Nabız Personal Health Record as well as hospital records, so 90-day follow-up was complete for all 308 patients with no loss to follow-up.
The study is retrospective and single-center, which leaves room for selection and information bias and limits transportability. The cohort was also exceptionally high-risk: 97.1% were mechanically ventilated, 78.2% received vasopressors, and 95.8% died in the ICU. Local practice explains part of this. The unit frequently admits patients with advanced or terminal illness, formal treatment-limitation and do-not-resuscitate practices are not routinely implemented, and transfer of stabilized patients is often delayed by limited palliative-care beds, difficulty arranging post-ICU care, and absent family or social support. Patients with prolonged or ultimately non-survivable critical illness therefore remain in the ICU for extended periods. Such an event distribution affects both biomarker values and discrimination metrics, so the mortality rates, AUCs, and sample-derived thresholds reported here should not be transferred to ICUs with different admission, discharge, or treatment-limitation practices.
IBI was measured once, within 1 h of admission, although inflammation changes throughout critical illness; serial measurements might carry different information. Admission source and pre-ICU hospital stay were not recorded, so we cannot distinguish patients admitted directly from the emergency department from those transferred after days of ward care. These two routes place the first-hour sample at quite different points on the inflammatory trajectory, and the resulting heterogeneity in what a single baseline IBI represents is not captured by any variable available to us. Frailty, functional status, baseline dependency, nutritional status, and treatment limitations were not routinely documented and could not be reconstructed retrospectively. This matters in a geriatric ICU population because frailty is a prognostic domain distinct from chronological age and comorbidity burden and is not captured by the Charlson index [19]. No prespecified causal adjustment set was available, and including both APACHE II and SOFA may introduce clinical redundancy even though multicollinearity was not statistically substantial. The adjusted estimates are therefore conditional associations within the measured covariate set, not evidence of an independent biological effect. Excluding the 27 patients receiving chronic corticosteroid or immunosuppressive therapy, 7.6% of those screened, reduced treatment-related distortion of the biomarker but narrowed the population. The exclusion of patients with an ICU stay of less than 24 h may have introduced selection bias by underrepresenting patients who died very early or were rapidly discharged from the ICU, and because outcomes were not retained for these 20 patients, the direction of that bias cannot be established. Therefore, the findings should be interpreted in the context of this eligibility criterion.
The 90-day endpoint was not prespecified and was examined after the primary analysis was complete, with only 29 patients alive at that point. It and the other secondary analyses were carried out without formal multiplicity adjustment, so their p values are nominal and should be treated as hypothesis-generating. The quartile boundaries and the Youden cut point were both derived from this dataset; categorizing a continuous measurement discards information and can produce sample-specific thresholds [20], and a cut point evaluated in the cohort that produced it carries optimism. The study was designed as a prognostic-factor evaluation rather than as development or validation of a prediction model, so calibration, Brier scores, optimism correction, and internal or external validation were not undertaken. ICU length of stay and duration of ventilation were interpreted descriptively because death truncates both. The cohort size was fixed by the study period rather than by a power calculation, and no post hoc power is reported because power computed from the observed result adds nothing to the confidence intervals already given.
Future work should define clinically relevant time points in advance, capture frailty and treatment-limitation variables, examine change in IBI over time, and test these findings prospectively in multiple centers.
5. Conclusions
In this near-uniformly fatal geriatric ICU cohort, where 95.8% of patients died in the ICU and the analyses therefore separate earlier from later death, baseline IBI did not predict 28-day mortality after adjustment and added no information to established severity measures. The adjusted time-to-event estimate across the full 90 days was also null. An association appeared only in post hoc period-specific models restricted to days 28 to 90, and it persisted after adjustment for admission diagnosis; whether it reflects anything beyond the particular composition of this cohort cannot be settled here. These findings do not establish that IBI is uninformative in older critically ill patients generally; they show that it added nothing to routine severity assessment in a population in which almost no one survived.
Supplementary Materials
The following supporting information can be downloaded at: https://www.mdpi.com/article/10.3390/medicina62112256/s1, Table S1, baseline characteristics and clinical outcomes across IBI quartiles; Table S2, post-hoc sensitivity model additionally incorporating hemoglobin for 28-day mortality; Table S3, Spearman correlations between IBI and clinical and laboratory parameters; Table S4, inflammatory burden index and mortality by admission diagnosis; Table S5, illness severity, inflammatory burden index and mortality by age band.
Author Contributions
Conceptualization, H.Y.; methodology, H.Y.; formal analysis, H.Y.; investigation, H.Y., M.G.B., V.Y. and G.K.; data curation, H.Y., M.G.B., V.Y. and G.K.; writing—original draft preparation, H.Y.; writing—review and editing, H.Y., M.G.B., V.Y. and G.K.; supervision, H.Y. All authors have read and agreed to the published version of the manuscript.
Funding
This research received no external funding.
Institutional Review Board Statement
The study was conducted in accordance with the Declaration of Helsinki and approved by the Balıkesir Atatürk City Hospital Scientific Research Ethics Committee (protocol code 2026/02/19; approval date: 12 February 2026).
Informed Consent Statement
The ethics committee waived individual informed consent because this retrospective study used previously collected, de-identified clinical data.
Data Availability Statement
Study data are not deposited in a public repository because privacy and ethics requirements restrict public sharing. De-identified data may be obtained from the corresponding author upon a reasonable request, subject to applicable approvals. The ethics committee application, which documents the analysis plan for the primary outcome, is available from the corresponding author on request.
Acknowledgments
ChatGPT (GPT-6, OpenAI; accessed in 2026) was used during manuscript preparation for translation, language refinement, and improvements in clarity and organization. All generated wording was subsequently reviewed and edited by the authors, who remain fully responsible for the final manuscript. Artificial intelligence tools were not used for data collection, statistical analysis, or interpretation of the results.
Conflicts of Interest
The authors report no conflicts of interest.
References
- Furman, D.; Campisi, J.; Verdin, E.; Carrera-Bastos, P.; Targ, S.; Franceschi, C.; Ferrucci, L.; Gilroy, D.W.; Fasano, A.; Miller, G.W.; et al. Chronic inflammation in the etiology of disease across the life span. Nat. Med. 2019, 25, 1822–1832. [Google Scholar] [CrossRef] [Scilit]
- Yousefzadeh, M.J.; Flores, R.R.; Zhu, Y.; Schmiechen, Z.C.; Brooks, R.W.; Trussoni, C.E.; Cui, Y.; Angelini, L.; Lee, K.A.; McGowan, S.J.; et al. An aged immune system drives senescence and ageing of solid organs. Nature 2021, 594, 100–105. [Google Scholar] [CrossRef] [Scilit]
- Bracken, O.V.; De Maeyer, R.P.H.; Akbar, A.N. Enhancing immunity during ageing by targeting interactions within the tissue environment. Nat. Rev. Drug Discov. 2025, 24, 300–315. [Google Scholar] [CrossRef] [Scilit]
- Çakin, Ö.; Karaveli, A.; Yüce Aktepe, M.; Gümüş, A.; Yildirim, Ö.E. Comparison of inflammatory marker scoring systems and conventional inflammatory markers in patients over 65 years of age admitted to the intensive care unit: A multicenter, retrospective, cohort study. J. Clin. Med. 2024, 13, 4011. [Google Scholar] [CrossRef] [Scilit]
- Xie, H.; Ruan, G.; Ge, Y.; Zhang, Q.; Zhang, H.; Lin, S.; Song, M.; Zhang, X.; Liu, X.; Li, X.; et al. Inflammatory burden as a prognostic biomarker for cancer. Clin. Nutr. 2022, 41, 1236–1243. [Google Scholar] [CrossRef] [Scilit]
- He, C.; Wu, D.; Wei, X.; Li, Y.; Liao, Y.; Yang, D. Association between inflammatory burden index and all-cause mortality in the general population aged over 45 years: Data from NHANES 2005–2017. Nutr. Metab. Cardiovasc. Dis. 2024, 34, 64–74. [Google Scholar] [CrossRef] [Scilit]
- Li, W.; Zhao, D.; Li, W. Inflammatory burden index predicts long term mortality in a nationally representative population from NHANES. Sci. Rep. 2025, 15, 25034. [Google Scholar] [CrossRef] [Scilit]
- Zhong, Z.; Fan, M.; Lv, L.; Long, Q.; Li, K.; Xu, P. Inflammatory burden index as a predictor of mortality in septic patients: A retrospective study using the MIMIC-IV database. BMC Infect. Dis. 2025, 25, 552. [Google Scholar] [CrossRef] [Scilit]
- von Elm, E.; Altman, D.G.; Egger, M.; Pocock, S.J.; Gøtzsche, P.C.; Vandenbroucke, J.P.; STROBE Initiative. The Strengthening the Reporting of Observational Studies in Epidemiology (STROBE) statement: Guidelines for reporting observational studies. Lancet 2007, 370, 1453–1457. [Google Scholar] [CrossRef] [Scilit]
- Knaus, W.A.; Draper, E.A.; Wagner, D.P.; Zimmerman, J.E. APACHE II: A severity of disease classification system. Crit. Care Med. 1985, 13, 818–829. [Google Scholar] [CrossRef] [Scilit]
- Vincent, J.L.; Moreno, R.; Takala, J.; Willatts, S.; De Mendonça, A.; Bruining, H.; Reinhart, C.K.; Suter, P.M.; Thijs, L.G. The SOFA (Sepsis-related Organ Failure Assessment) score to describe organ dysfunction/failure. Intensive Care Med. 1996, 22, 707–710. [Google Scholar] [CrossRef]
- Charlson, M.E.; Pompei, P.; Ales, K.L.; MacKenzie, C.R. A new method of classifying prognostic comorbidity in longitudinal studies: Development and validation. J. Chronic Dis. 1987, 40, 373–383. [Google Scholar] [CrossRef] [Scilit]
- Charlson, M.; Szatrowski, T.P.; Peterson, J.; Gold, J. Validation of a combined comorbidity index. J. Clin. Epidemiol. 1994, 47, 1245–1251. [Google Scholar] [CrossRef] [Scilit]
- Demler, O.V.; Pencina, M.J.; D’Agostino, R.B. Misuse of DeLong test to compare AUCs for nested models. Stat. Med. 2012, 31, 2577–2587. [Google Scholar] [CrossRef] [Scilit]
- Chadda, K.R.; Puthucheary, Z. Persistent inflammation, immunosuppression, and catabolism syndrome (PICS): A review of definitions, potential therapies, and research priorities. Br. J. Anaesth. 2024, 132, 507–518. [Google Scholar] [CrossRef] [Scilit]
- Hawkins, R.B.; Raymond, S.L.; Stortz, J.A.; Horiguchi, H.; Brakenridge, S.C.; Gardner, A.; Efron, P.A.; Bihorac, A.; Segal, M.; Moore, F.A.; et al. Chronic critical illness and the persistent inflammation, immunosuppression, and catabolism syndrome. Front. Immunol. 2018, 9, 1511. [Google Scholar] [CrossRef] [Scilit]
- Turkish Statistical Institute (TurkStat). Life Tables, 2023–2025; Bulletin No. 58232, released 29 July 2026; TurkStat Data Portal: Ankara, Türkiye, 2026. Available online: https://veriportali.tuik.gov.tr/tr/press/58232 (accessed on 9 November 2026).
- Turkish Statistical Institute (TurkStat). Provincial Populations by Age Group, 2025; Address Based Population Registration System; TurkStat Data Portal: Ankara, Türkiye, 2026. Available online: https://veriportali.tuik.gov.tr/tr/databrowser/tuik/categories/11/11_1/11_1_1/TR,DF_ADNKS_T35,1.1 (accessed on 9 November 2026).
- Moïsi, L.; Mino, J.C.; Guidet, B.; Vallet, H. Frailty assessment in critically ill older adults: A narrative review. Ann. Intensive Care 2024, 14, 93. [Google Scholar] [CrossRef] [Scilit]
- Altman, D.G.; Royston, P. The cost of dichotomising continuous variables. BMJ 2006, 332, 1080. [Google Scholar] [CrossRef] [Scilit]

Disclaimer/Publisher’s Note: The statements, opinions and data contained in all publications are solely those of the individual author(s) and contributor(s) and not of MDPI and/or the editor(s). MDPI and/or the editor(s) disclaim responsibility for any injury to people or property resulting from any ideas, methods, instructions or products referred to in the content. |
© 2026 by the authors. Published by MDPI on behalf of the Lithuanian University of Health Sciences. Licensee MDPI, Basel, Switzerland. This article is an open access article distributed under the terms and conditions of the Creative Commons Attribution (CC BY) license.