


Abstract
Bovine viral diarrhea virus (BVDV) is highly prevalent in yaks, yet the host regulatory landscape of its core virulence factor, Npro, remains obscure. Here, we employed a time-series (24, 48, 72 h) integrative transcriptomic and proteomic approach in MDBK cells expressing yak-derived Npro. Strikingly, compared to the empty vector control, Npro induced only 13 differentially expressed genes (DEGs) but 2466 differentially expressed proteins (DEPs), which may reflect both platform-specific sensitivities and a predominant post-transcriptional or post-translational regulatory mode of Npro. Temporal cross-omics comparisons demonstrated that Npro sequentially targets purine metabolism and nuclear receptor activity at the early stage (24 h), shifts to chemokine and Toll-like/NOD-like receptor signaling at the middle stage (48 h), and ultimately modulates ubiquitin-proteasome degradation and Th1/Th2 cell differentiation at the late stage (72 h). These pathways were consistently enriched at both transcript and protein levels, providing cross-omic mutual validation. Our study offers a systems-level resource for understanding Npro-mediated immune evasion and metabolic reprogramming, and highlights candidate pathways for future mechanistic dissection of BVDV pathogenesis in yaks.
1. Introduction
Yak (Bos grunniens) is a unique livestock species native to the Qinghai–Tibet Plateau and its surrounding areas, playing an irreplaceable role in the economic livelihood of local herders and the maintenance of the ecosystem [1,2]. Bovine viral diarrhea virus (BVDV) infection in yaks can cause abortion, calf diarrhea, and persistent infection, seriously restricting the sustainable growth of the yak breeding industry [3]. In recent years, as molecular epidemiological studies have advanced, the genetic subtype diversity of yak-derived BVDV has gradually been revealed. Studies have shown that BVDV is widely prevalent in yak herds on the Qinghai–Tibet Plateau, with the overall seroprevalence of BVDV antibodies in yaks reaching 59.82%, and with persistently infected animals comprising approximately 1.55% [3]. A comprehensive molecular epidemiological survey conducted in yaks from Qinghai Province reported an overall BVDV antibody positive rate as high as 84.52%, and genetic characterization identified two subtypes, BVDV-1a and BVDV-1u, with BVDV-1u being predominant in the Qinghai region [4]. In addition, other subtypes such as BVDV-1b, BVDV-1d, and BVDV-1q have also been detected in yak herds [3,5]. These findings indicate that yak-derived BVDV possesses rich genetic diversity, but studies on the host regulatory functions of the yak-derived BVDV Npro protein are limited. Previous transcriptomic and proteomic analyses of BVDV-infected MDBK cells have revealed that differentially expressed genes and proteins are significantly enriched in signaling pathways such as NOD-like receptor, Toll-like receptor, TNF, NF-κB, MAPK, and apoptosis [6]. However, those studies used the whole virus and could not distinguish the specific contribution of individual viral proteins, especially Npro.
In this study, we constructed a recombinant plasmid expressing yak-derived BVDV Npro and performed a time-series (24, 48, 72 h) integrative transcriptomic and proteomic analysis in MDBK cells. We hypothesized that Npro primarily exerts its effects at the protein level, potentially via post-transcriptional or post-translational mechanisms, to orchestrate stage-specific hijacking of host metabolic and immune networks to establish a persistent infection-favorable microenvironment. By systematically comparing Npro-expressing cells with empty-vector and mock controls, we aimed to delineate the genuine Npro-specific regulatory landscape, providing a comprehensive data foundation for antiviral strategy development.
2. Materials and Methods
2.1. Cells and Plasmid
MDBK cells (ATCC CCL-22) were obtained from the American Type Culture Collection (Manassas, VA, USA). The pcDNA3.1 (+) vector was purchased from Invitrogen/Thermo Fisher Scientific (Carlsbad, CA, USA; Cat. No. V790-20) and maintained in our laboratory. The cDNA of yak-derived BVDV strain XZ74 was kindly provided by the Key Laboratory for Prevention and Control of Hydatid Disease in Xizang, Xizang Agricultural and Animal Husbandry University. The complete genome sequence of strain XZ74 is available in GenBank under accession No. PX423613, and the Npro gene sequence was retrieved from this record.
2.2. Construction of the Recombinant Plasmid
Primers were designed using Snapgene software 8.2.3 based on the Npro gene sequence of strain XZ74. The primer sequences were as follows:
F: CCGGAATTCGCCACCATGGAGTTGATTTCA.
R: CCGCTCGAGTTACTTATCGTCGTCATCCTTGTAATCGCAGCTTGTAAC.
The forward primer contained an EcoRI restriction site (GAATTC), and the reverse primer contained an XhoI restriction site (CTCGAG) and the reverse-complement sequence of the FLAG tag (CTTATCGTCGTCATCCTTGTAATC). The primers were synthesized by Beijing Tsingke Biotechnology Co., Ltd. The Npro gene was amplified by PCR using the cDNA of XZ74 as a template. The PCR product was double-digested with EcoRI and XhoI and then ligated into the pcDNA3.1 (+) vector that had been digested with the same enzymes. The ligation product was transformed into DH5α Chemically competent cells (Beijing Tsingke Biotechnology Co., Ltd., Beijing, China; Cat. No. DLC114-100). Positive clones were selected and verified by PCR, double restriction digestion, and sequencing.
2.3. Transfection of MDBK Cells
MDBK cells were seeded into 6-well plates (2 mL/well). The next day, when cell confluence reached approximately 80%, the culture medium was removed, and the cells were washed twice with PBS. Then, 2 mL of fresh culture medium was added to each well, and the plate was placed back into the incubator. Transfection was performed using Lipofectamine 3000 (Invitrogen/Thermo Fisher Scientific, Carlsbad, CA, USA; Cat. No. L3000015) according to the manufacturer’s instructions. Two solutions were prepared using Opti-MEM reduced serum medium (Gibco/Thermo Fisher Scientific, Grand Island, NY, USA; Cat. No. 31985070). For each well of a 6-well plate, Solution A was prepared by diluting 4 μL of Lipofectamine 3000 in 125 μL of Opti-MEM, and Solution B was prepared by mixing 2500 ng of plasmid DNA, 5 μL of P3000 reagent, and 125 μL of Opti-MEM. Both solutions were mixed thoroughly, and incubated at room temperature for 5 min. The two solutions were then mixed at a 1:1 ratio and incubated at room temperature for 15 min. Subsequently, 250 μL of the mixture was added to each well. The plate was gently swirled to distribute the complexes evenly and returned to the incubator for further culture.
2.4. Indirect Immunofluorescence (IFA) Verification
At 24 h post-transfection, the culture medium was removed, and the cells were washed three times with PBS (5 min each). The cells were fixed with pre-chilled absolute ethanol at −20 °C for 10 min, followed by three PBS washes (5 min each). Permeabilization was performed with 0.1% Triton X-100 at room temperature for 5 min, followed by three PBS washes (5 min each). The cells were blocked with 5% BSA at room temperature for 2 h, then incubated with a mouse anti-FLAG monoclonal antibody (Proteintech, Wuhan, China; Cat. No. 66008-4-Ig; diluted 1:500) at 4 °C overnight. After three PBS washes (5 min each), the cells were incubated with an FITC-conjugated anti-mouse IgG secondary antibody (Proteintech, Wuhan, China; Cat. No. SA00003-1; diluted 1:500) at room temperature for 1 h, followed by three PBS washes (5 min each). Fluorescence images were observed and recorded under a fluorescence microscope.
2.5. Sample Preparation
2.5.1. Sample Preparation for Transcriptomics
At 24 h, 48 h, and 72 h post-transfection with the Npro recombinant plasmid, the corresponding 6-well plates were taken out, and the cells were washed twice with ice-cold PBS. Then, 1 mL of trypsin was added to moisten the cell surface and immediately discarded. The cells were allowed to detach at room temperature, and approximately 1 mL of complete culture medium was added to resuspend the cells evenly. The cell suspension was transferred to a centrifuge tube, mixed well, and counted. The cells were then centrifuged at 200× g for 5 min at 4 °C. The cell pellet was collected, and Total RNA Extractor (Trizol) (Sangon Biotech, Shanghai, China; Cat. No. B511311) was added at a ratio of 1 mL per 5 × 10⁶ cells, followed by gentle pipetting to homogenize. The homogenate was aliquoted into pre-cooled RNase-free cryotubes at 1 mL per tube, capped tightly, snap-frozen in liquid nitrogen for 0.5 h, and then stored at −80 °C for subsequent transcriptome sequencing. Three biological replicates were set for each time point.
2.5.2. Sample Preparation for Proteomics
At 24 h, 48 h, and 72 h post-transfection with the Npro recombinant plasmid, the corresponding 6-well plates were taken out, and the cells were scraped off directly using a cell scraper in the presence of complete culture medium. The entire cell suspension was transferred to a 50 mL centrifuge tube and washed three times with ice-cold PBS, each time centrifuged at 800× g for 5~10 min. After the last PBS wash, the cell suspension was transferred to a 1.5 mL centrifuge tube and centrifuged at 800× g. The supernatant was discarded, followed by a quick spin at 800× g for 5~10 s. Residual liquid at the bottom was completely removed with a pipette, and the volume of the cell pellet was kept at approximately 50 μL per tube. The pellet was snap-frozen in liquid nitrogen for at least 5 min and then stored at −80 °C for subsequent proteomic sequencing. Three biological replicates were set for each time point.
2.6. RNA-Seq Library Construction and Sequencing
Total RNA was extracted from frozen cell lysates according to the manufacturer’s instructions. Then, RNA quality was determined by 5300 Bioanalyser (Agilent, Santa Clara, CA, USA) and quantified using the ND-2000 (NanoDrop Technologies, Wilmington, DE, USA). Only high-quality RNA samples were used to construct sequencing libraries. RNA purification, reverse transcription, library construction and sequencing were performed at Shanghai Majorbio Bio-pharm Biotechnology Co., Ltd. (Shanghai, China). The RNA-seq transcriptome library was prepared followingthe Illumina® Stranded mRNA Prep, Ligation kit (Illumina, San Diego, CA, USA; Cat. No. 20040534) [7] using 1 μg of total RNA. Briefly, messenger RNA was isolated by polyA selection with oligo (dT) beads and fragmented. Double-stranded cDNA was synthesized with random hexamer primers using the reverse transcriptase provided in the kit. Then, the synthesized cDNA was subjected to end-repair, phosphorylation and adapter addition according to library construction protocol. Libraries were size selected for cDNA target fragments of 300–400 bp using magnetic beads followed by amplification via PCR for 10~15 PCR cycles. After quantification using a Qubit 4.0, the sequencing was performed on the NovaSeq X Plus platform (PE150) using NovaSeq Reagent Kit (NovaSeq) (Illumina, San Diego, California, USA).
2.7. RNA-Seq Data Analysis
The raw paired end reads were trimmed and quality controlled by fastp [8] with default parameters. Then, clean reads were separately aligned to the reference genome in strand-specific mode using HISAT2 software 2.2.3 [9].
Gene abundances were quantified by RSEM [10] using the same reference, producing expected counts and TPM values. Differential expression analysis was performed using DESeq2 [11] based on the expected counts. DEGs were defined as |log2FC| ≥ 1 and FDR < 0.05 (Benjamini–Hochberg adjusted p-value). TPM values were used only for expression visualization. In addition, functional-enrichment analyses including GO [12,13] and KEGG [14] were performed to identify which DEGs were significantly enriched in GO terms (version 2025.0211) and metabolic pathways (version 2025.02) at Bonferroni-corrected p < 0.05 compared with the whole-transcriptome background. GO functional enrichment and KEGG pathway analysis were carried out by Goatools (v1.4.4) and the SciPy library for Python 3.15.0, respectively.
2.8. Protein Extraction and Mass Spectrometry Analysis
Proteins were extracted from the cell pellets using the Majorbio SDC ProPrep Kit (Majorbio, Shanghai, China) according to the manufacturer’s instructions. Briefly, samples were homogenized with a tissue grinder, heated at 95 °C for 5 min, and centrifuged at 14,000× g for 10 min to collect the supernatant. The protein concentration was determined using a BCA Protein Assay Kit (Thermo Fisher Scientific, Waltham, MA, USA). Protein quality was evaluated by SDS-PAGE using Bolt™ 10% Bis-Tris gels (1.0 mm, Thermo Fisher Scientific) followed by Coomassie Brilliant Blue R-250 staining.
For digestion, proteins were reduced and alkylated, followed by digestion with modified trypsin (Yinjia Biotech, Shanghai, China) at 37 °C overnight. The resulting peptides were desalted using C18 StageTips (3M, St. Paul, MN, USA) and quantified using a NanoDrop One (Thermo Fisher Scientific).
Peptides were analyzed using a Vanquish Neo system coupled with an Orbitrap Astral mass spectrometer (Thermo Fisher Scientific). The separation was performed on a homemade C18 column (15 cm × 100 μm, 1.7 μm) using an 8-min gradient of solvent A (water with 2% acetonitrile and 0.1% formic acid) and solvent B (water with 80% acetonitrile and 0.1% formic acid). Data-independent acquisition (DIA) was performed in positive ion mode. The full MS scan range was set to 380~980 m/z, and the MS/MS scan range was 150~2000 m/z.
2.9. Proteomics Data Analysis
The DIA raw data were searched against the Bos taurus reference proteome (UniProt Proteome ID: UP000009136, v2025.02) [15] using Spectronaut software (version 19) [16]. The search parameters were as follows: peptide length range 7~52; enzyme = trypsin/P; maximum missed cleavages = 2; carbamidomethylation of cysteine as fixed modification; oxidation of methionine and N-terminal acetylation as variable modifications; protein FDR ≤ 0.01, peptide FDR ≤ 0.01, peptide confidence ≥99%, and XIC width ≤75 ppm. Protein quantification was performed using the MaxLFQ algorithm [17]. To ensure data quality, proteins with more than 50% missing values across all samples were filtered out. The quantitative data were then normalized using median normalization to correct for systematic variations across samples.
DEPs between the two groups were identified using a two-tailed Student′s t-test (R package “t-test”), with thresholds of |log2FC| ≥ 0.26 and p < 0.05. Given the exploratory nature of this study aiming to capture subtle coordinated network changes, a permissive unadjusted p-value was initially applied for DEP screening. To strictly control false positives, all subsequent GO and KEGG enrichment analyses were subjected to stringent Bonferroni correction, and terms with adjusted p < 0.05 were considered statistically significant. Functional annotation of all identified proteins was performed using the Majorbio Cloud Platform (https://cloud.majorbio.com/ (accessed on 12 October 2026)) [18,19].
3. Results
3.1. Verification of the Recombinant Plasmid
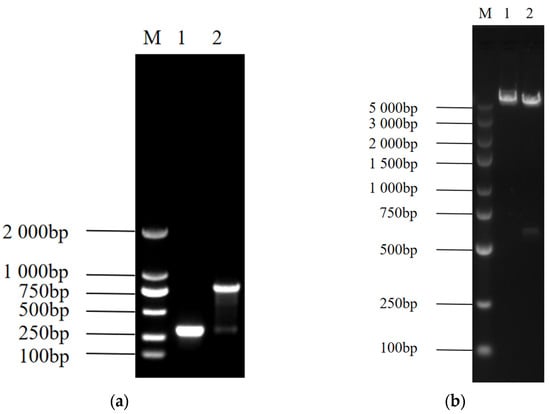
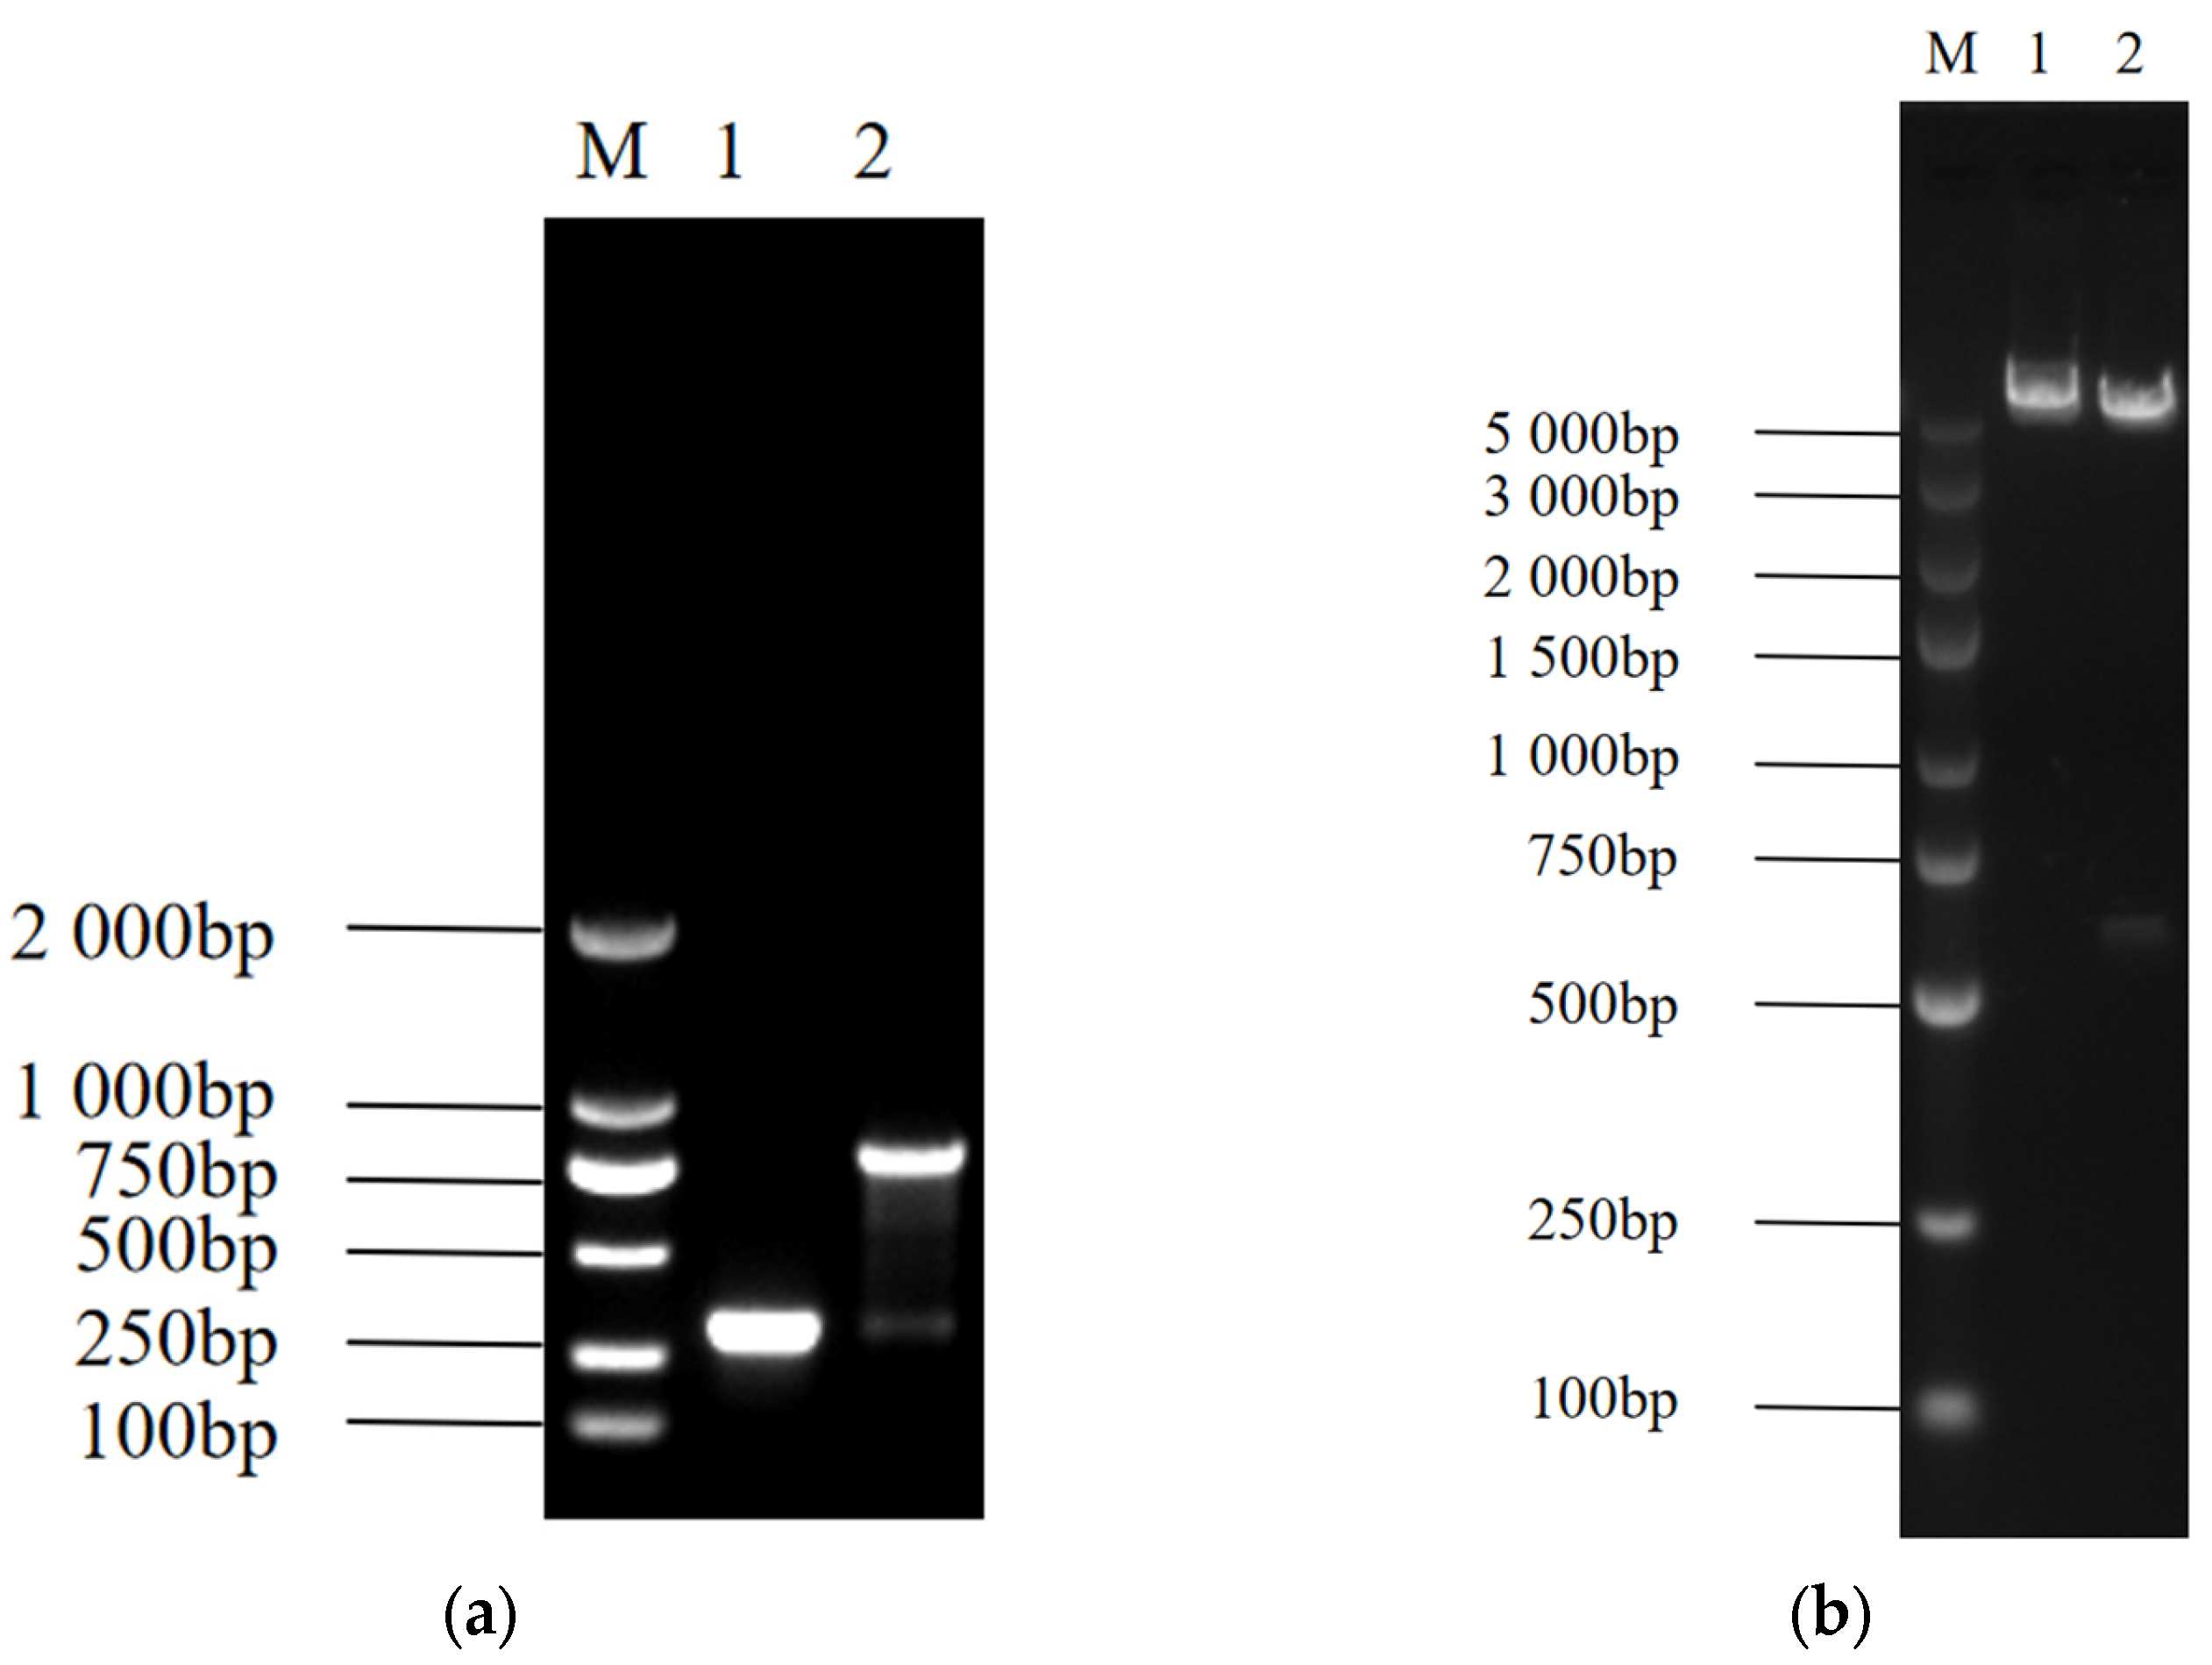
Using the plasmid DNA as a template, PCR amplification was performed with vector universal primers (Figure 1a). Agarose gel electrophoresis showed that the amplified product was of the expected size, indicating that the Npro gene had been initially integrated into the vector. The correctly identified positive plasmid was then subjected to double restriction enzyme digestion (Figure 1b), yielding fragments of the expected sizes. Further sequencing analysis of the recombinant plasmid confirmed that the inserted fragment sequence was identical to the target gene. These results demonstrated that the recombinant plasmid pcDNA3.1-Npro was correctly constructed.
Figure 1.
Verification of the recombinant plasmid. (a) PCR verification of the recombinant plasmid. M, DL 2000 Marker; 1, pcDNA3.1 (+) group; 2, pcDNA3.1-Npro group. (b) Double restriction enzyme digestion verification of the recombinant plasmid. M, DL 5000 Marker; 1, pcDNA3.1 (+) group; 2, pcDNA3.1-Npro group.
3.2. IFA Verification Results
As shown in Supplementary Figure S1, clear green fluorescence signals were observed under a fluorescence microscope in cells incubated with an anti-FLAG antibody after transfection with the recombinant plasmid, further confirming the successful expression of the target protein.
3.3. Transcriptomics
3.3.1. Sequencing Data
In this study, transcriptome sequencing was performed on a total of 27 libraries from three groups (Npro-transfected experimental group, empty vector-transfected control group, and mock-transfected control group) at three time points (24 h, 48 h, and 72 h). A total of 175.66 Gb of clean data were obtained, with each sample yielding at least 5.59 Gb of clean data. The clean reads from each sample were aligned to the reference genome (ARS-UCD2.0), achieving alignment rates ranging from 97.29% to 97.87%. The sequencing data statistics (Supplementary Table S1) showed that the percentage of Q20 bases was ≥99.4%, and the percentage of Q30 bases was ≥96.72%. The sequencing error rate for all samples was stable at 0.0114~0.0115%, and the GC content ranged from 50.49% to 52.13%, indicating high quality and good uniformity of the sequencing data.
3.3.2. Identification of Differentially Expressed Genes
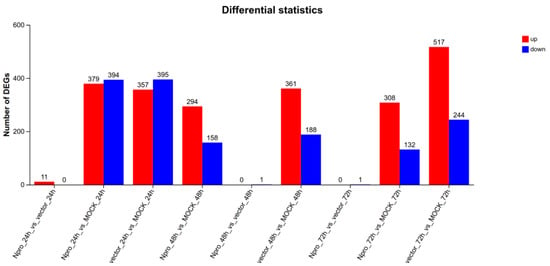
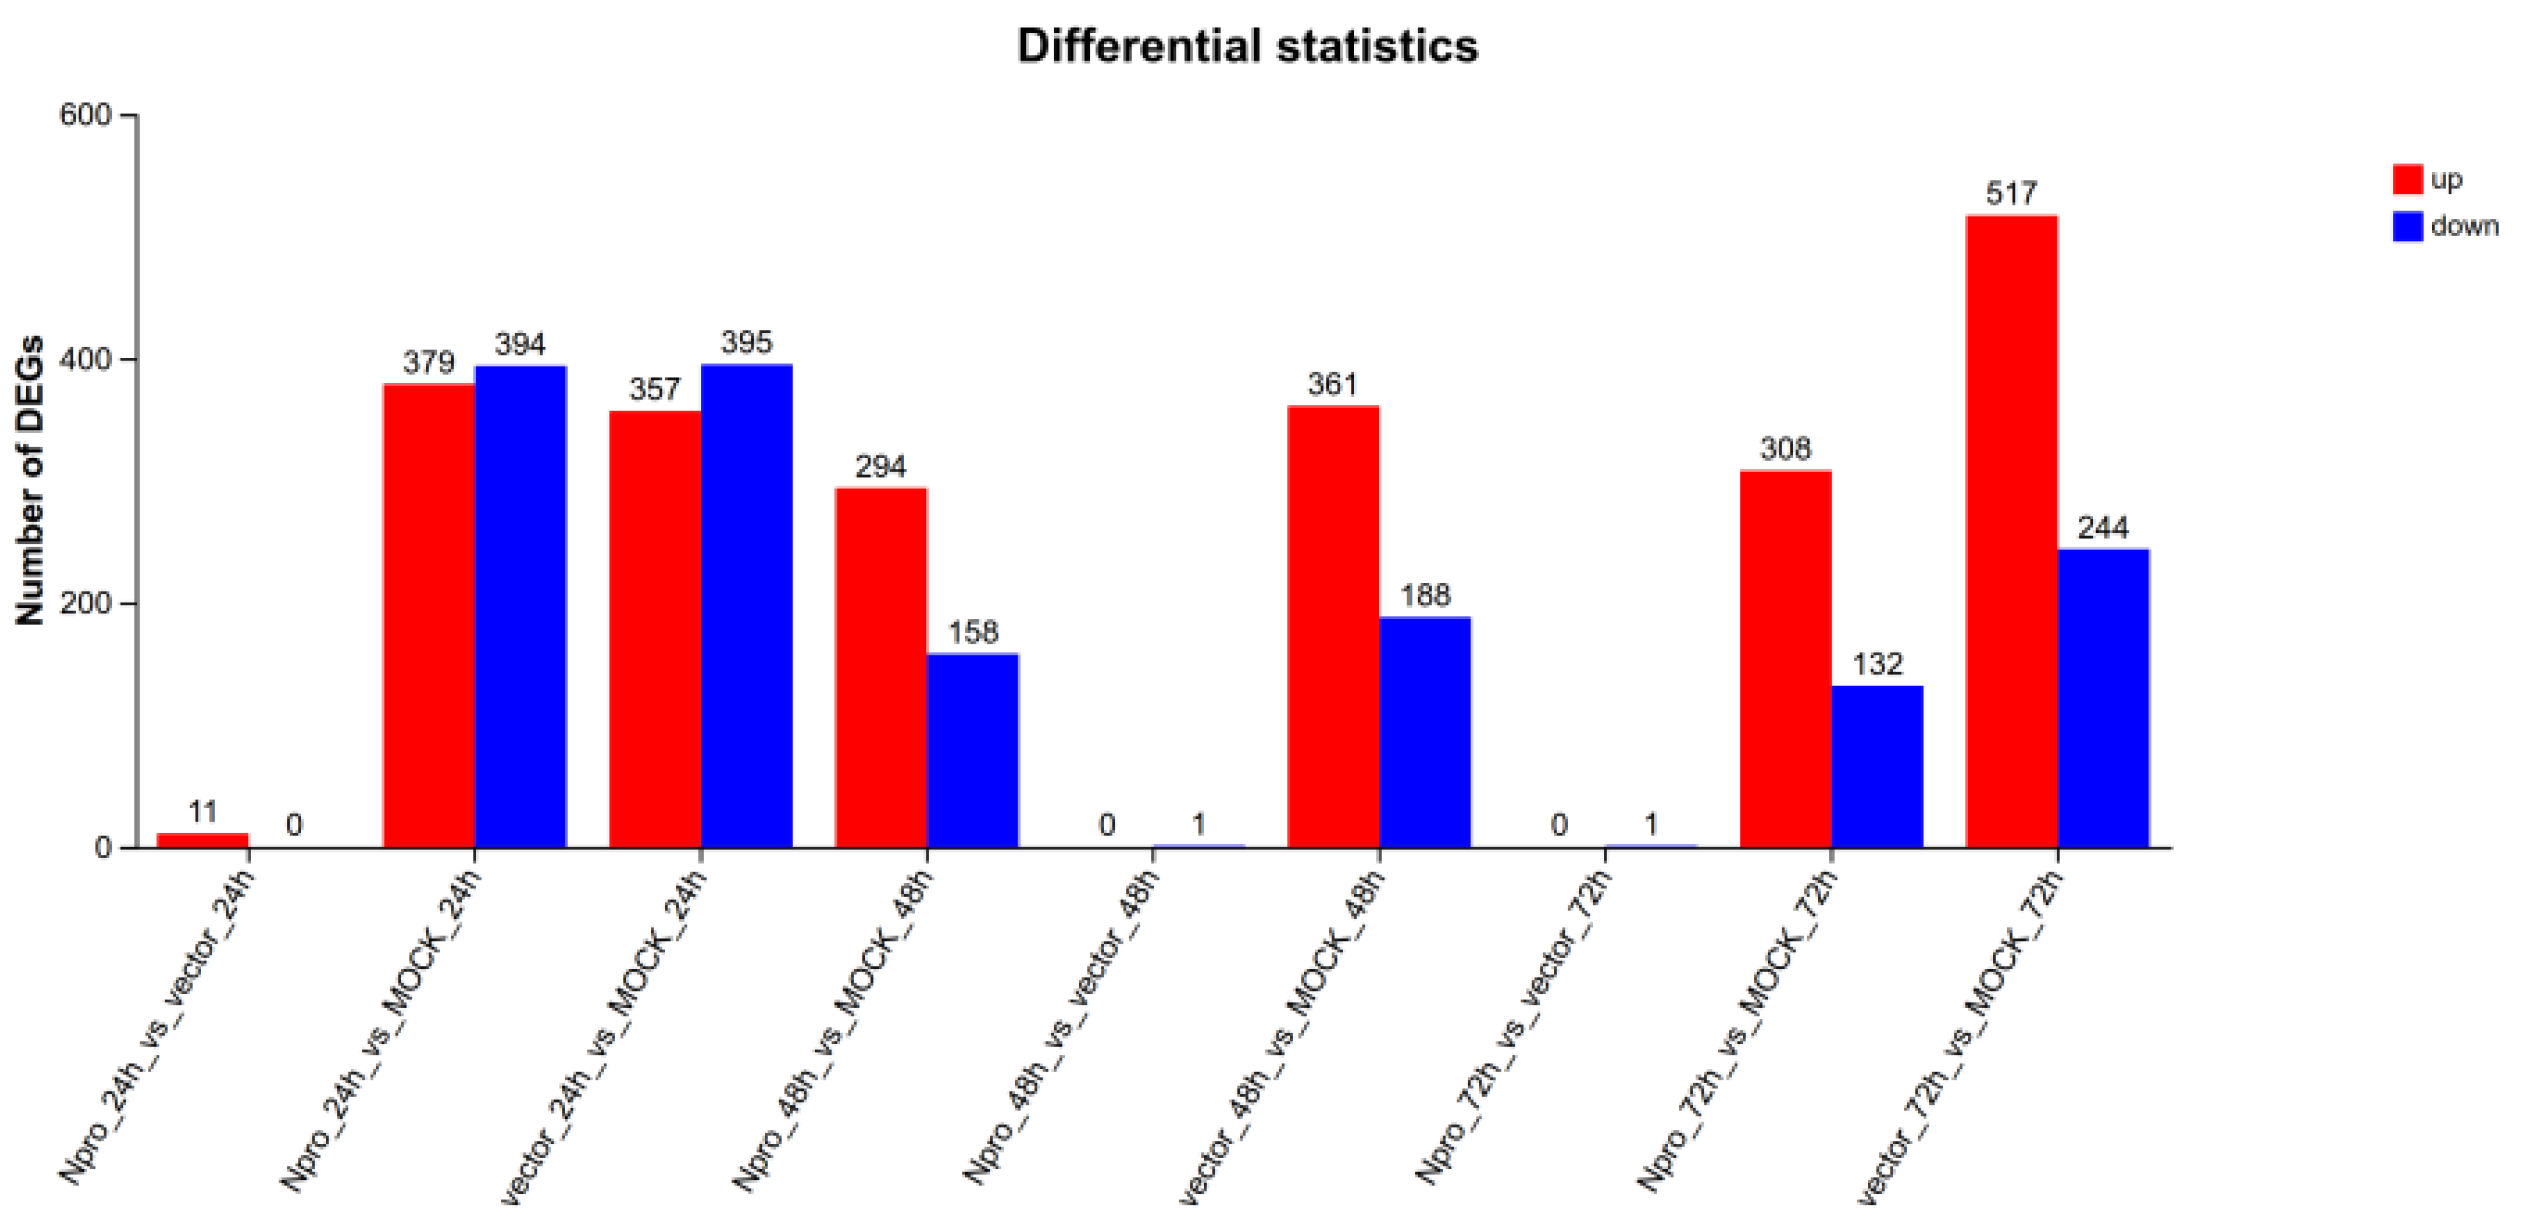
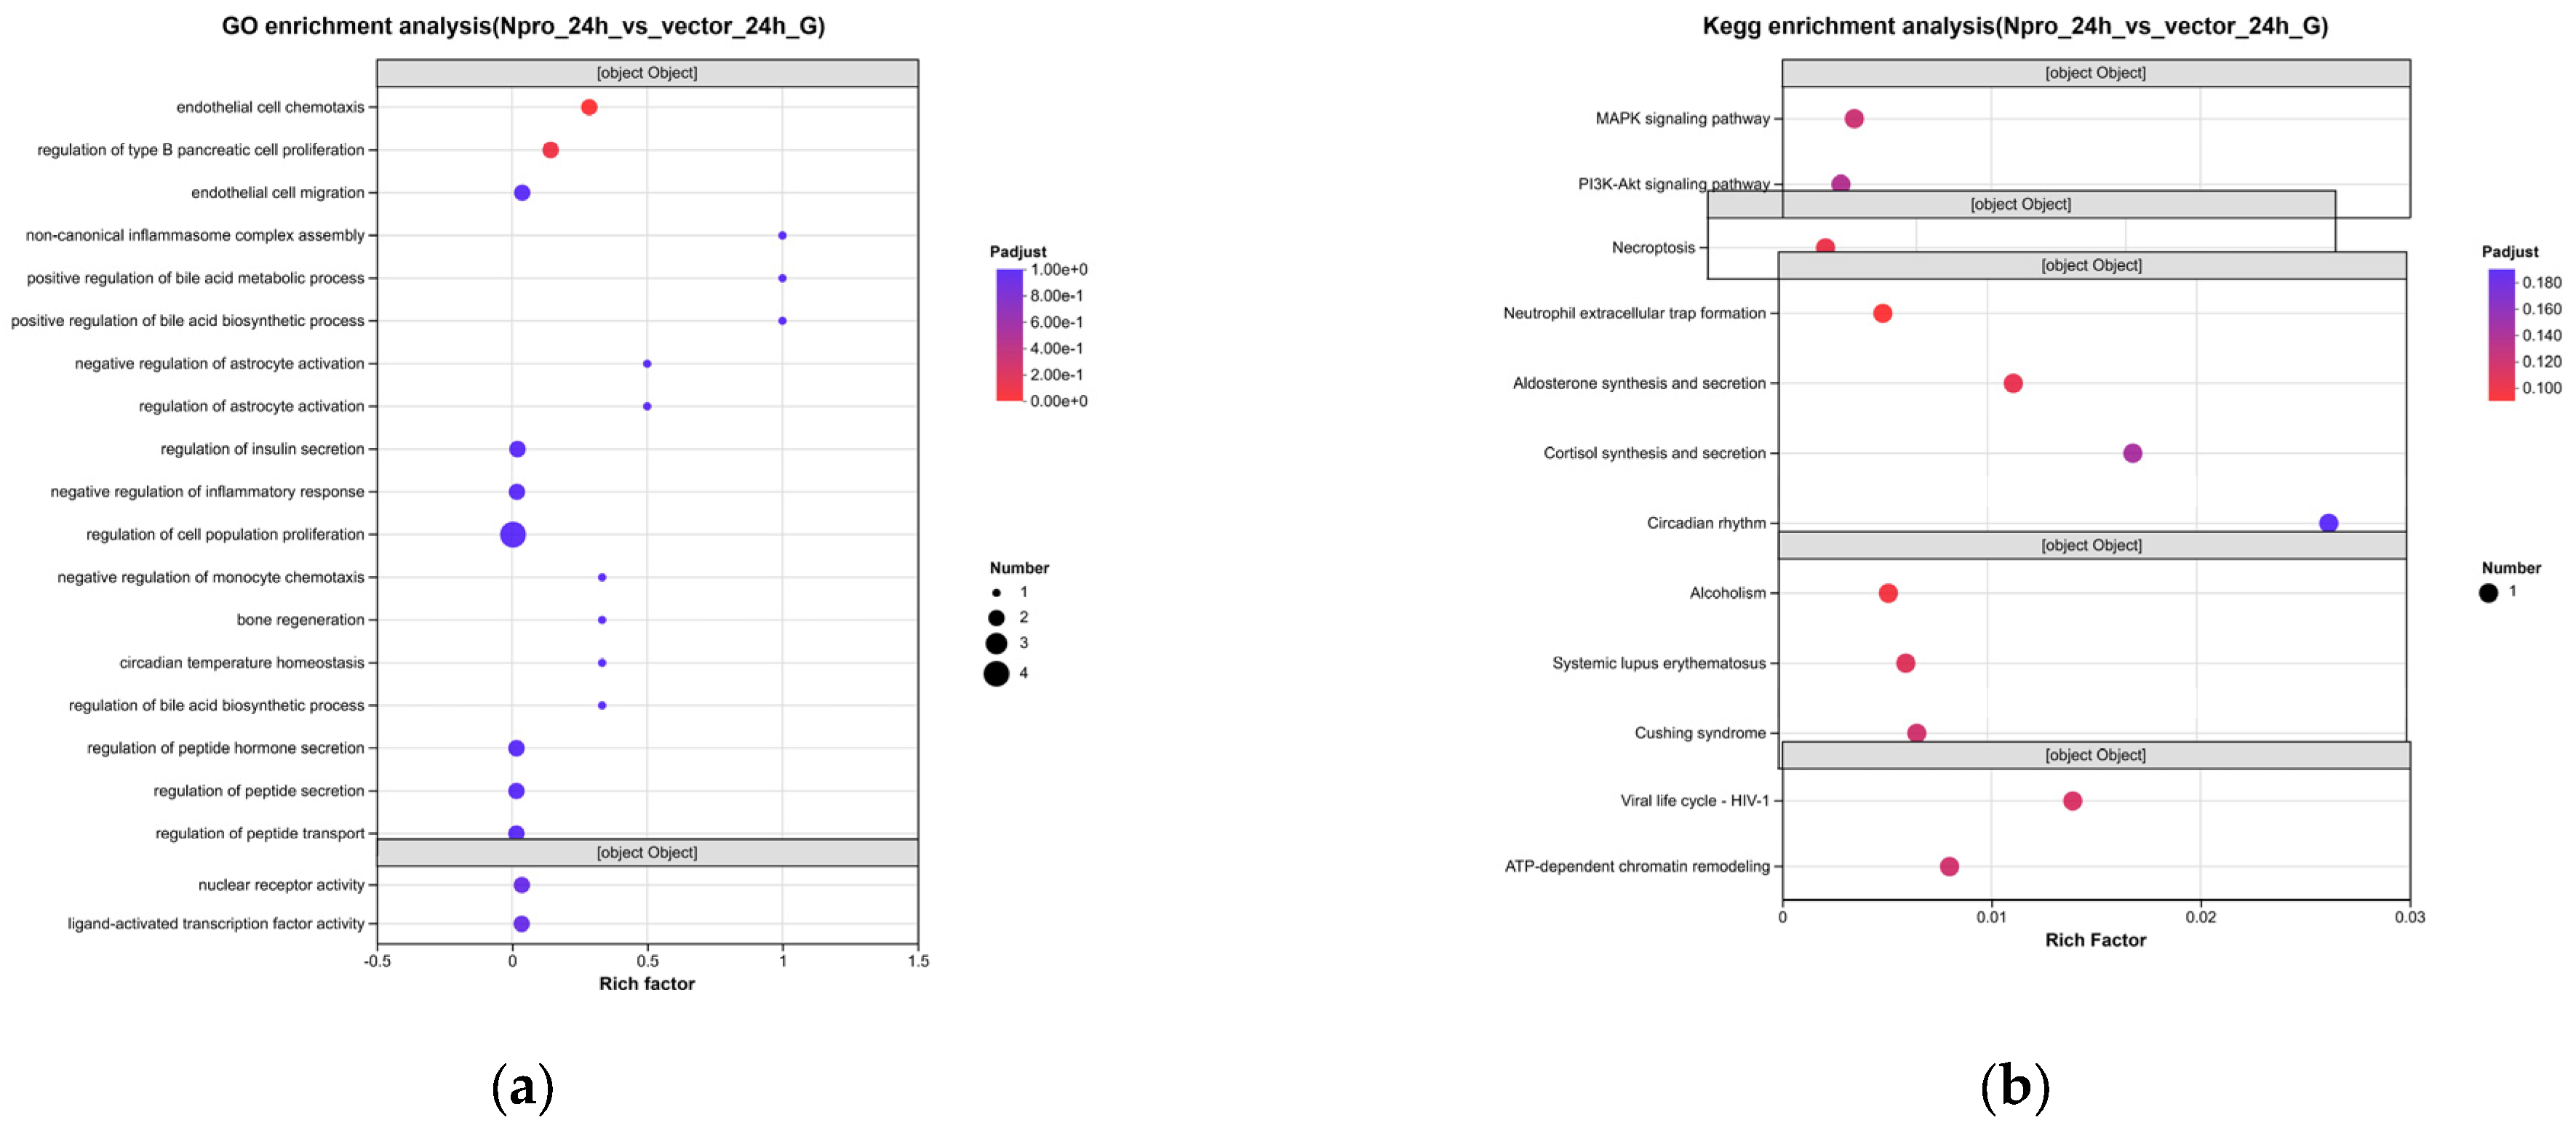
As shown in Figure 2, compared with the empty vector control group, a total of 13 DEGs were identified in MDBK cells after Npro transfection, including 11 upregulated genes and 2 downregulated genes. This result indicates that Npro does not cause large-scale transcriptional disturbance in host cells but rather exerts its biological functions by regulating a small number of key genes. Specifically, at the transcriptomic level, 11 upregulated genes were identified (including NR1D1, RBM3, RHOV, H2AC6, NR4A1, CCN3, and five unannotated Ensembl IDs), along with 2 downregulated genes (e.g., CCL5 and EGR1). Notably, the nuclear-receptor activity term at 24 h is entirely contributed by two genes (NR4A1 and NR1D1), while the chemokine signaling at 48 h is driven primarily by CCL5. This confirms that our stage-specific interpretation relies on the holistic pathway-level changes rather than a broad transcriptional disturbance.
Figure 2.
Statistics of DEGs across different time points and treatment groups. The bar chart displays the number of upregulated (red bars) and downregulated (blue bars) DEGs. The comparisons on the X-axis include both treatment effects (e.g., Npro vs. vector at 24 h, 48 h, and 72 h). DEGs were identified with the criteria of |log2FC| ≥ 1 and FDR < 0.05.
3.3.3. Functional Enrichment of Npro-Specific DEGs
To exclude transfection-related cellular stress (Supplementary Figures S2 and S3), we focused our analysis on the Npro vs. Vector comparison.
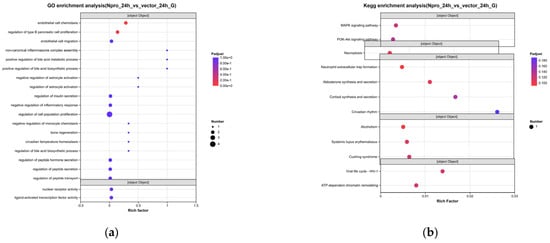
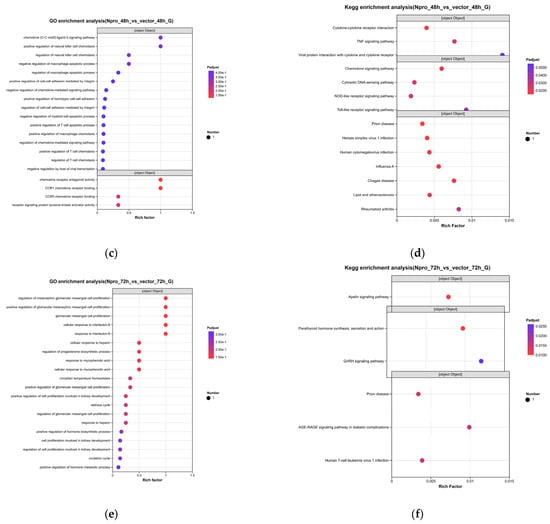
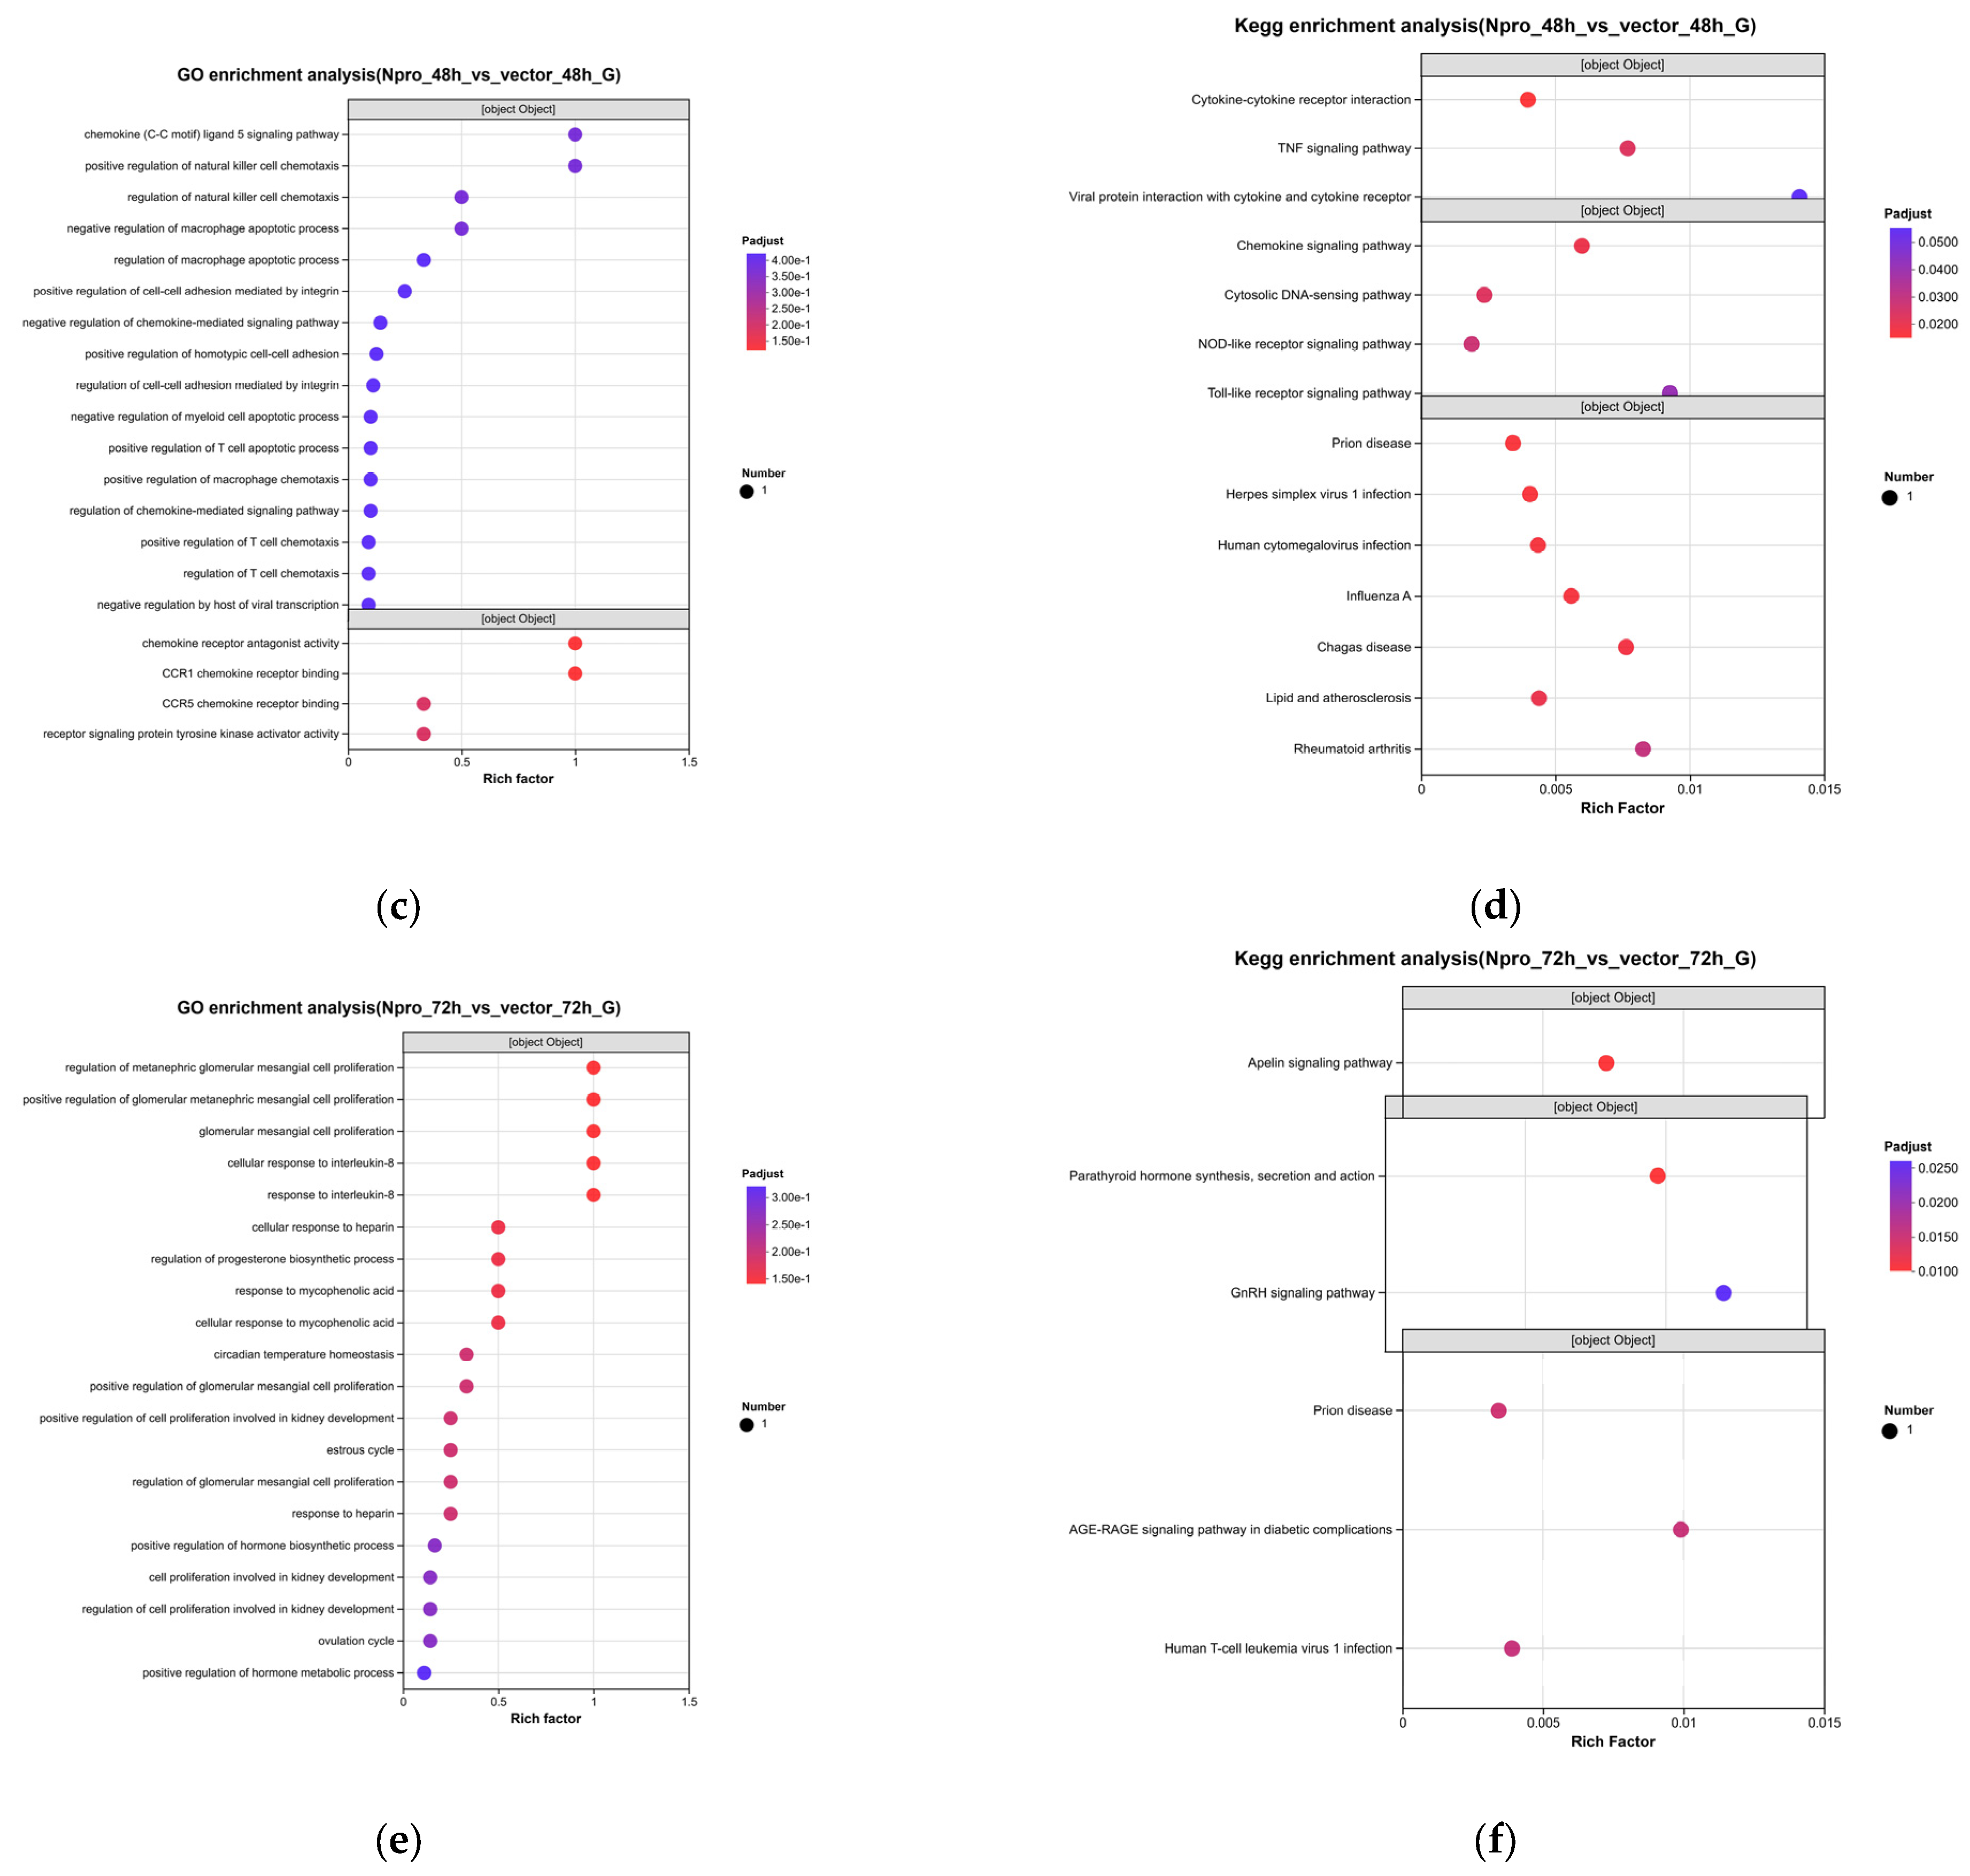
At 24 h post-transfection, the DEGs were specifically enriched in nucleobase-containing compound metabolic process and nuclear receptor activity (including NR4A1 and NR1D1 upregulation) (Figure 3a). KEGG analysis further revealed enrichment of the MAPK and PI3K-Akt signaling pathways (Figure 3b). At 48 h, GO enrichment highlighted chemokine signaling and T cell chemotaxis, with the downregulation of CCL5 being the most prominent event. KEGG analysis confirmed significant enrichment of the TNF signaling pathway, IL-17 pathway, and, notably, the Toll-like receptor and NOD-like receptor pathways (Figure 3c,d). At 72 h, DEGs were enriched in hormone biosynthetic processes and response to interleukin-8. KEGG analysis specifically identified the Apelin signaling pathway, GnRH signaling, and parathyroid hormone synthesis (Figure 3e,f).
Figure 3.
Functional enrichment of Npro-responsive DEGs (Npro vs. Vector). (a,c,e) GO enrichment at 24 h, 48 h, and 72 h, respectively; (b,d,f) KEGG enrichment at 24 h, 48 h, and 72 h, respectively. Bubble size represents gene count, and color gradient indicates the significance level. Statistical significance was determined using Bonferroni correction (adjusted p < 0.05).
3.4. Proteomics
3.4.1. Quality Control Results
The quality control results of the proteomics data showed that a total of 111 002 peptides were identified, corresponding to 8 873 non-redundant proteins. The peptide length distribution exhibited a typical pattern, with the vast majority of peptides ranging from 7 to 25 amino acids and peaking at 10~12 amino acids. The distribution of unique peptides per protein was right-skewed; most proteins were identified by only a few peptides, while a subset of high-confidence proteins was supported by multiple peptides. The molecular weight distribution of the identified proteins showed that most proteins fell within the 1~100 kDa range, with the highest number of proteins in the 21~41 kDa interval, consistent with the natural distribution of intracellular proteins. Analysis of protein sequence coverage indicated that more than 60% of the proteins had a sequence coverage ≥10%, with the highest proportion in the 20~40% coverage range, and only 0.89% of proteins had coverage <1%, reflecting the high reliability and detection depth of this proteomics dataset. The quality control of the proteomics data is summarized in Supplementary Figure S4.
3.4.2. Identification of Differentially Expressed Proteins
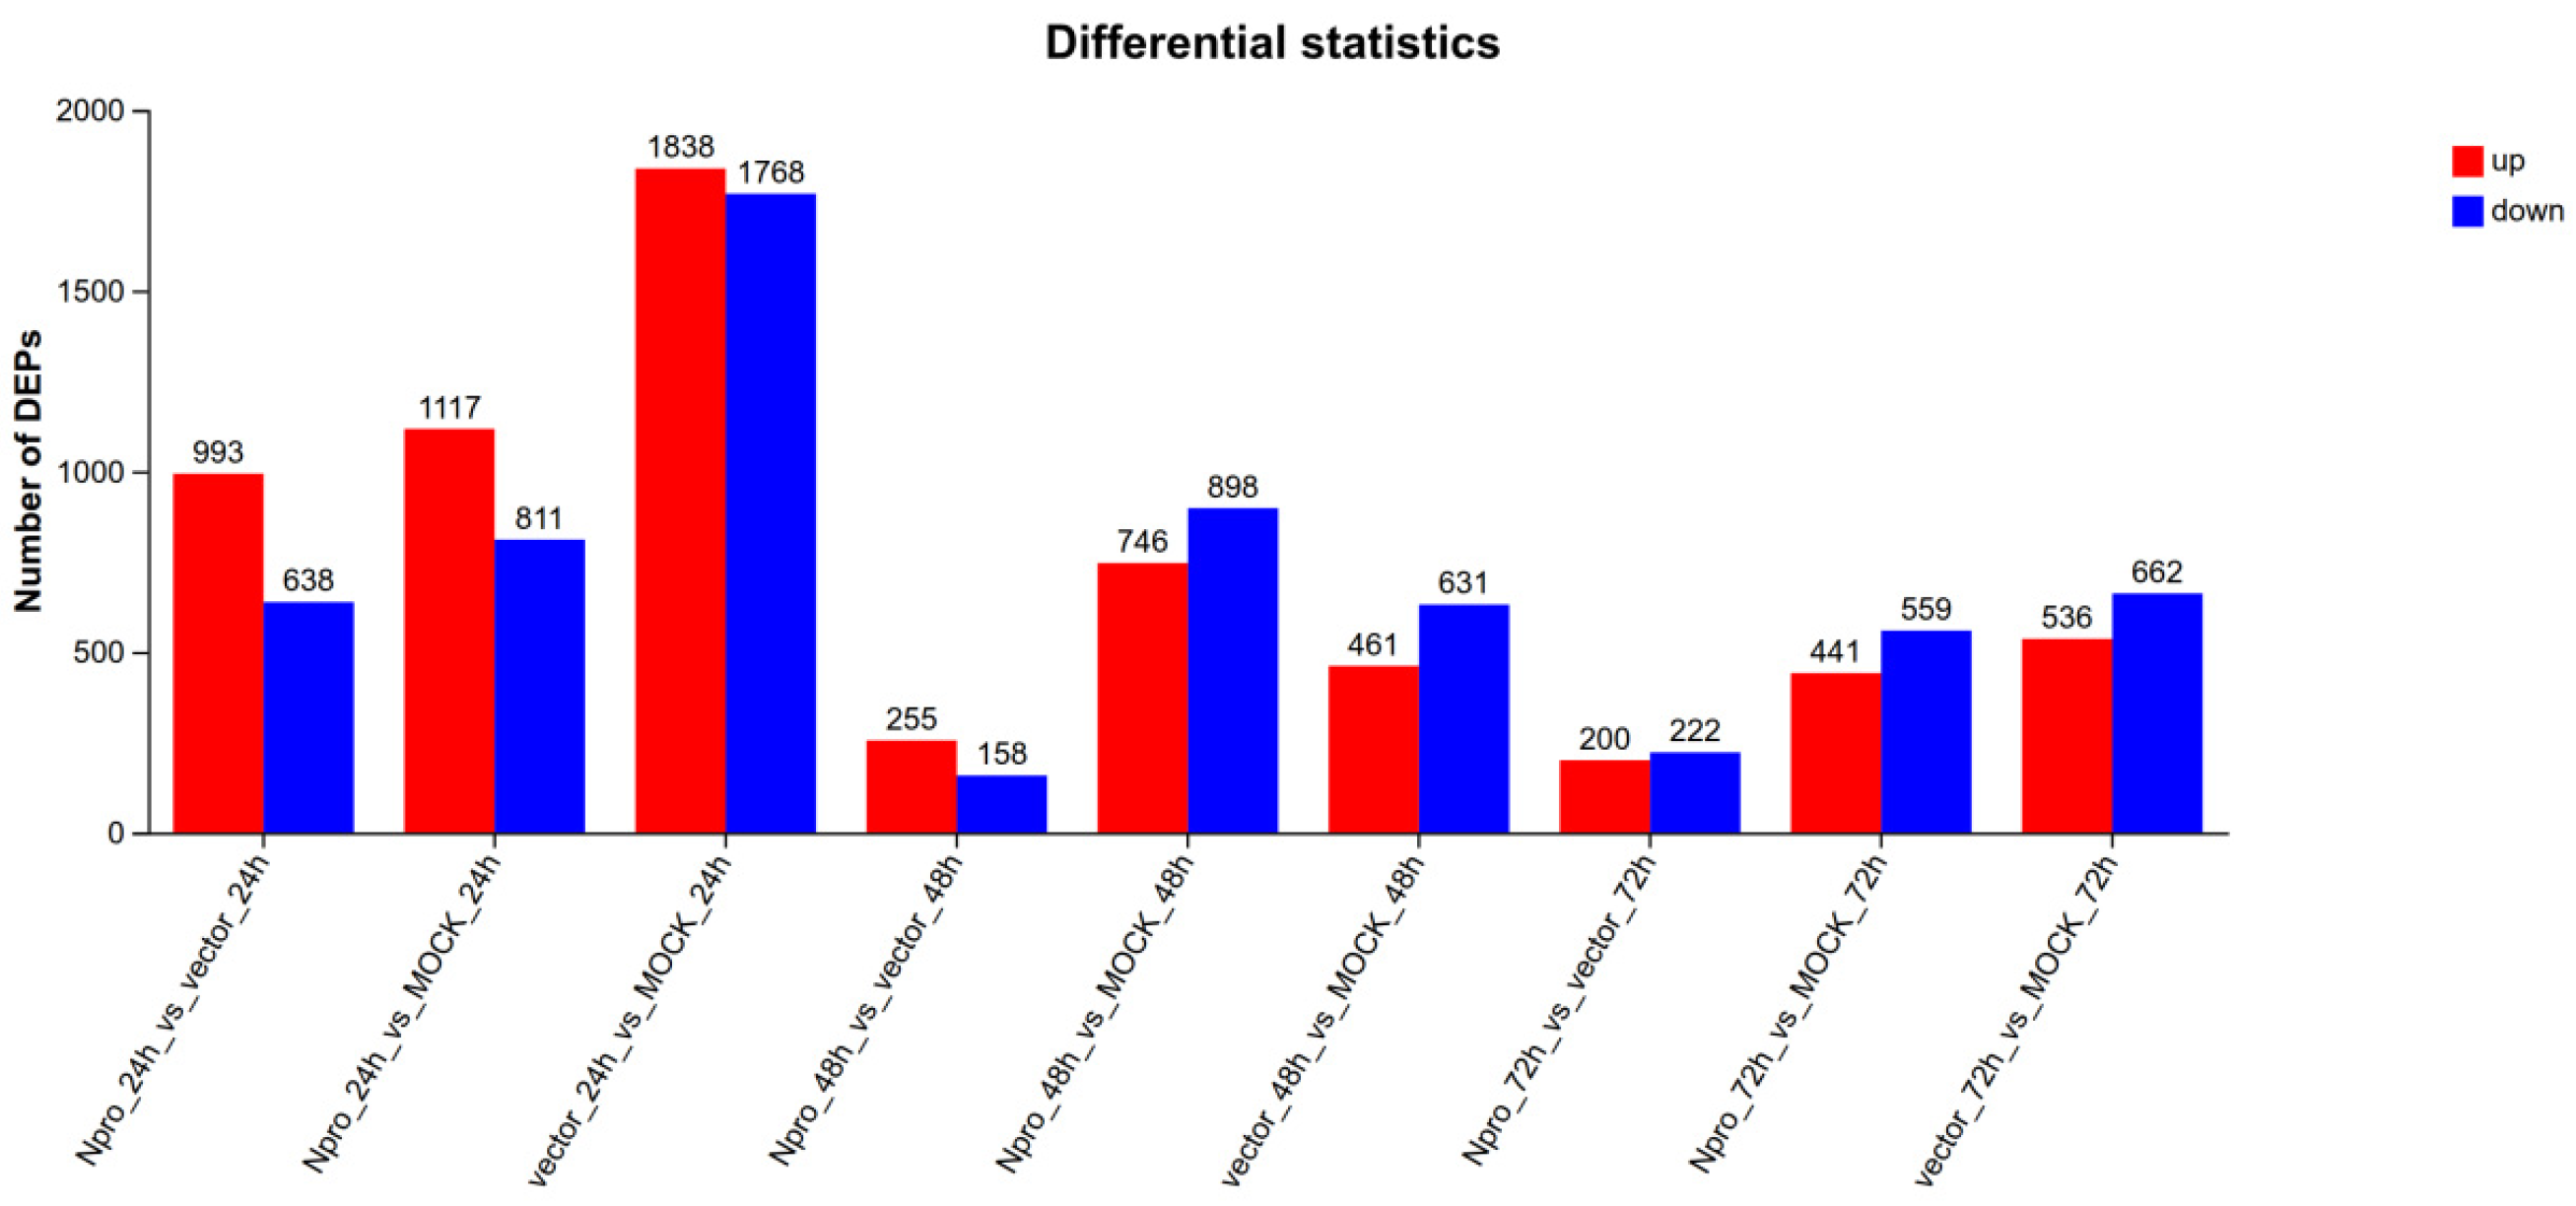
The results showed that (Figure 4), compared with the empty vector control group, a total of 1631 DEPs were identified in the Npro-transfected group at 24 h. At 48 h post-transfection, 413 DEPs were identified. At 72 h post-transfection, 422 DEPs were identified. It should be noted that the total number of 2466 DEPs represents the simple sum of pairwise comparisons across the three time points, rather than unique proteins. To evaluate the degree of overlap, a Venn diagram was constructed (Supplementary Figure S5). The vast majority of DEPs were time-point-specific: 1463 (65.02%) at 24 h, 277 (12.31%) at 48 h, and 303 (13.47%) at 72 h. Only 9 proteins were commonly shared across all three stages, while 88, 71, and 39 proteins overlapped between 24 h/48 h, 24 h/72 h, and 48 h/72 h, respectively. This high degree of time-point specificity strongly corroborates the stage-specific regulatory rewiring induced by Npro. It should be noted that given the relatively permissive threshold applied for initial DEP screening, individual protein changes should be interpreted with caution. The main conclusions of this study rely on the highly statistically controlled pathway-level signals (Bonferroni-corrected p < 0.05).
Figure 4.
Statistics of DEPs across different time points and treatment groups. The bar chart displays the number of upregulated (red bars) and downregulated (blue bars) DEPs. The comparisons on the X-axis include both treatment effects (e.g., Npro vs. vector at 24 h, 48 h, and 72 h). DEPs were identified with the criteria of |log2FC| ≥ 0.26 and p < 0.05.
3.4.3. Functional Enrichment of Npro-Specific DEPs
To exclude transfection-related cellular stress (Supplementary Figures S6 and S7), we focused our analysis on the Npro vs. Vector comparison.
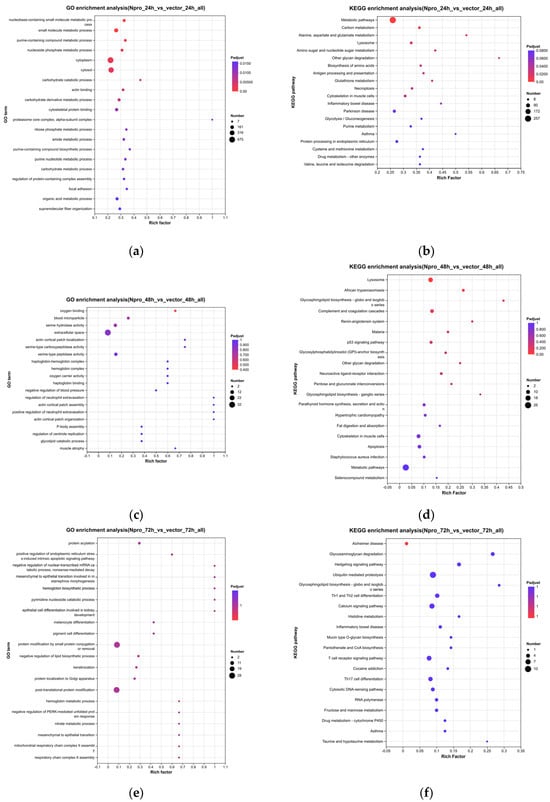
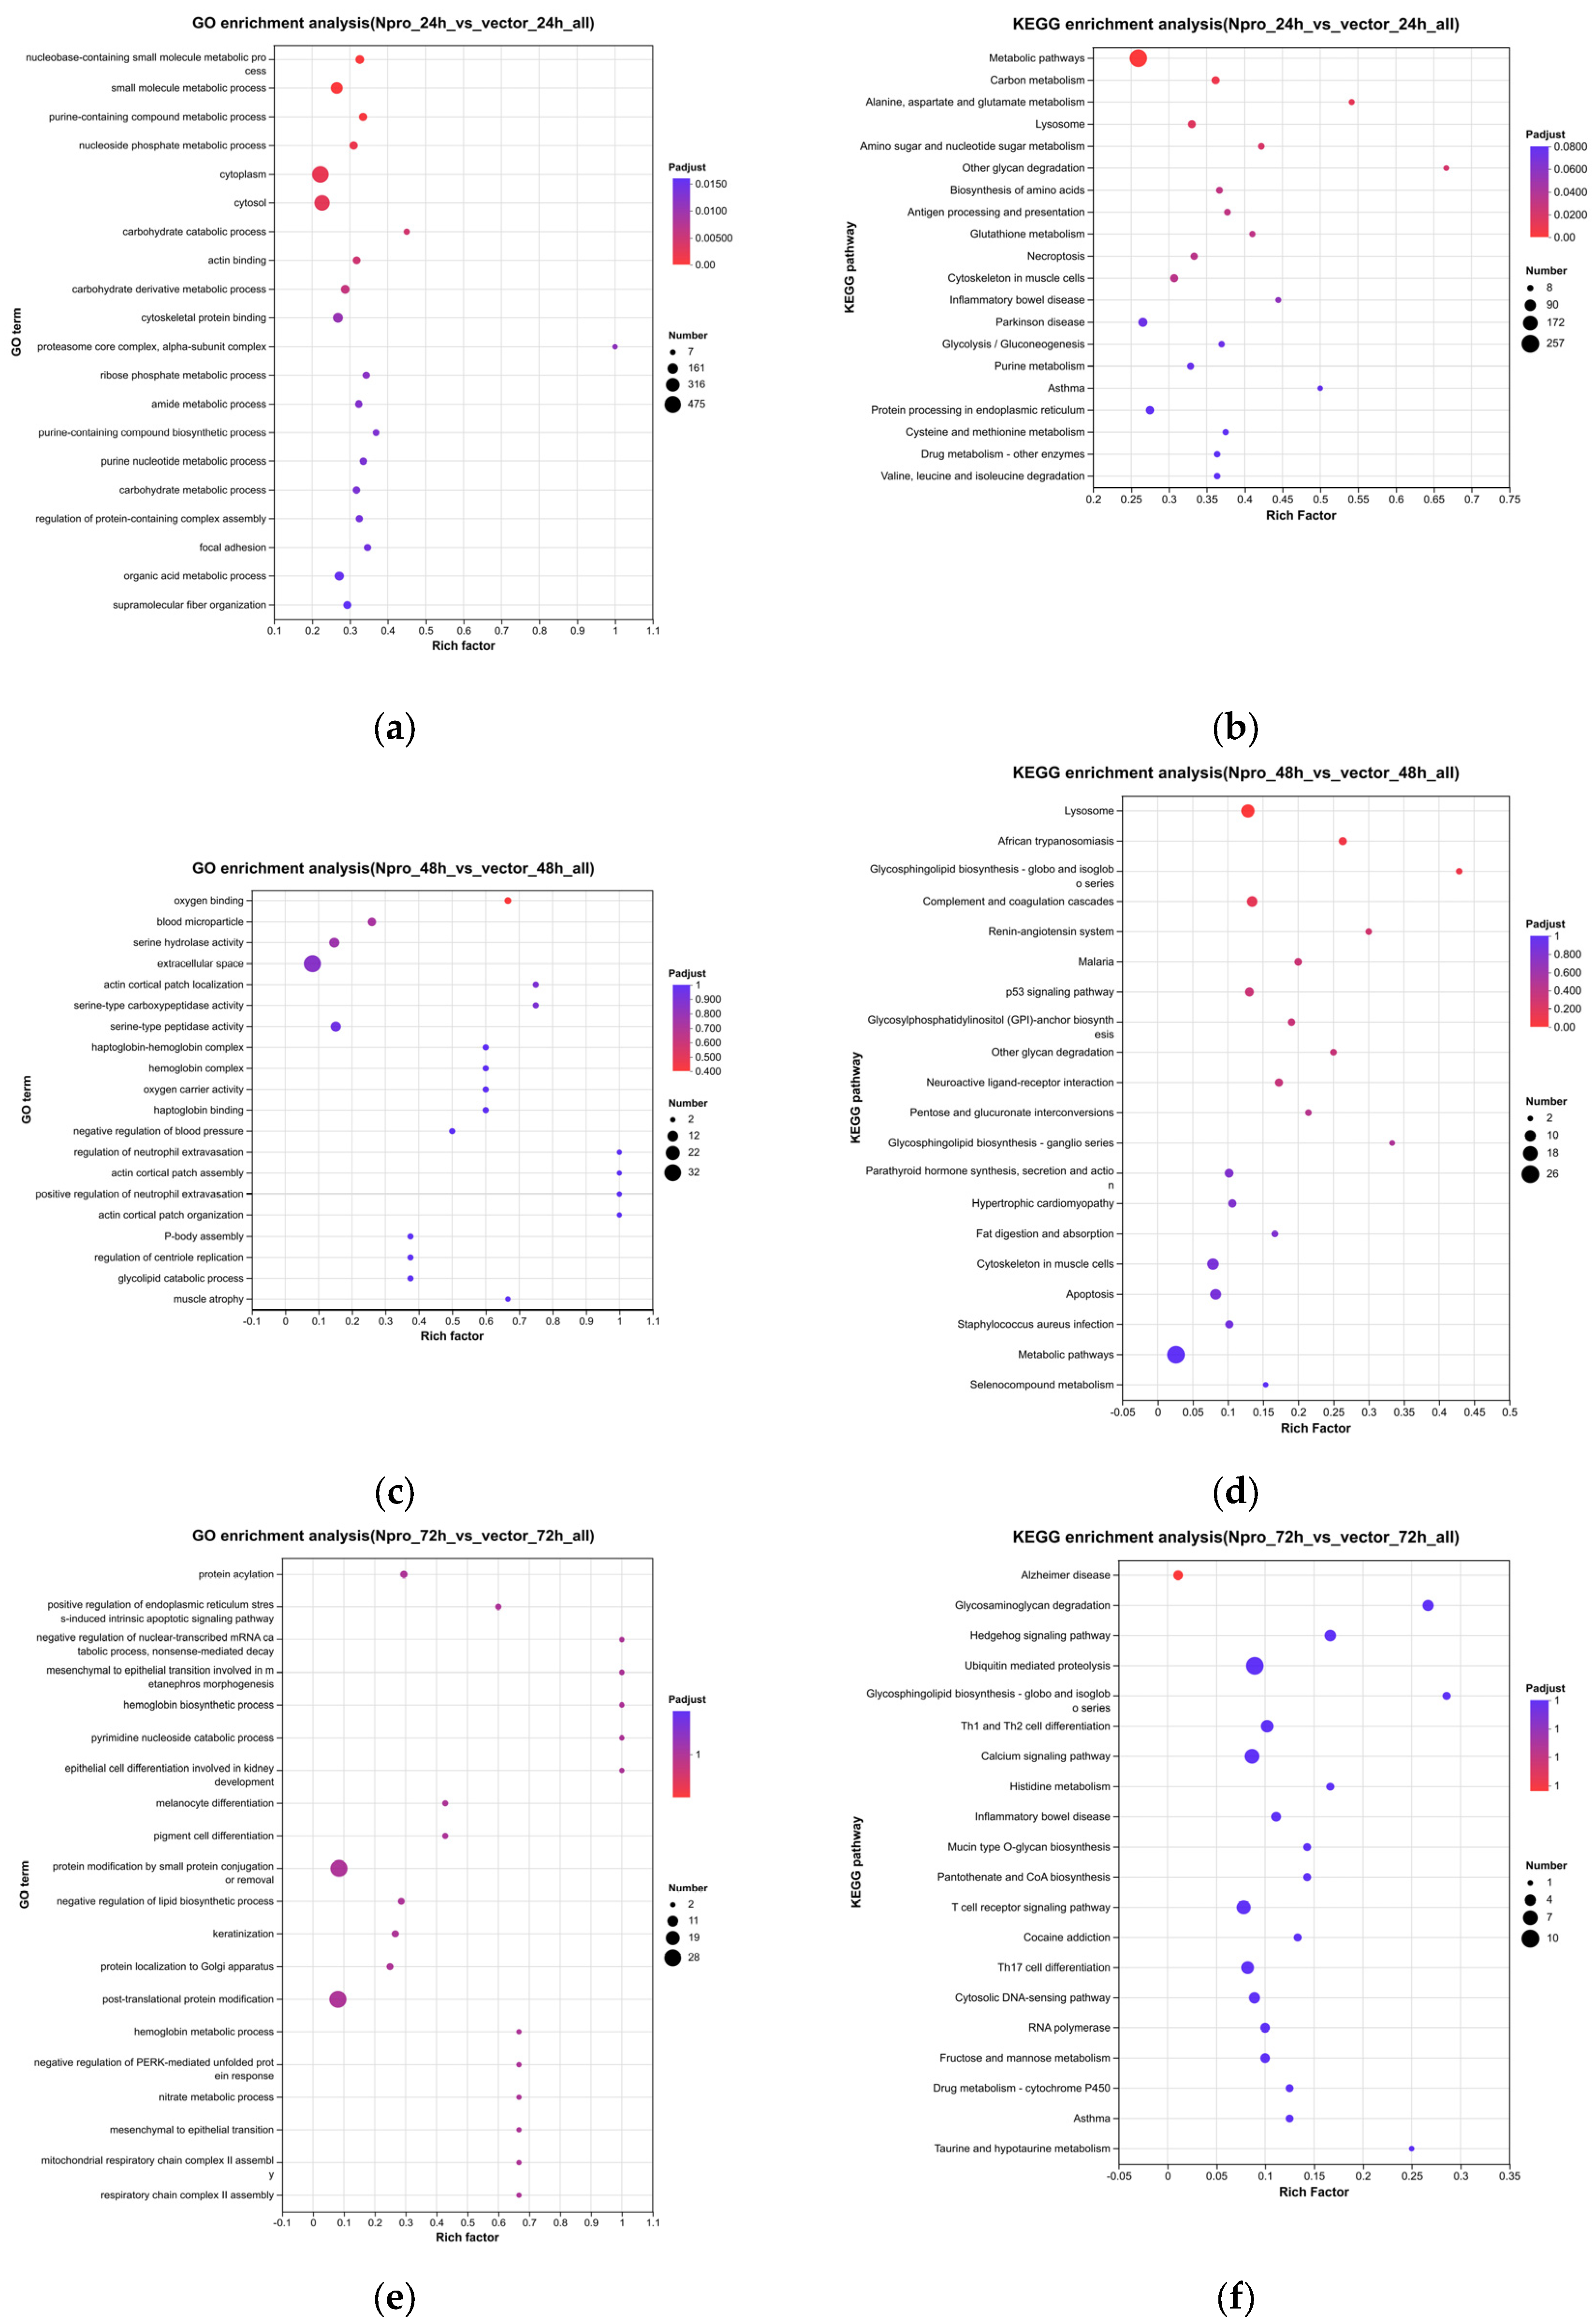
At 24 h, the DEPs were significantly enriched in purine metabolism, nucleotide metabolism, ribosome biogenesis, and proteasome pathways. GO analysis also highlighted histone binding and chromatin remodeling, indicating early intervention in nucleic acid metabolism and translational machinery (Figure 5a,b). At 48 h, the enrichment shifted dramatically towards immune regulation, with TNF signaling, IL-17 signaling, autophagy-animal, and the RIG-I-like receptor pathway being highly represented. Complement and coagulation cascades were also enriched at the protein level (Figure 5c,d). At 72 h, late-stage DEPs were enriched in oxidative phosphorylation, fatty acid metabolism, and critically, ubiquitin-mediated proteolysis and Th1 and Th2 cell differentiation, suggesting a transition towards adaptive immune modulation and metabolic exhaustion (Figure 5e,f).
Figure 5.
Functional enrichment of Npro-responsive DEPs (Npro vs. Vector). (a,c,e) GO enrichment at 24 h, 48 h, and 72 h, respectively; (b,d,f) KEGG enrichment at 24 h, 48 h, and 72 h, respectively. Bubble size represents protein count, and color gradient indicates the significance level. Statistical significance was determined using Bonferroni correction (adjusted p < 0.05).
4. Discussion
The main finding of this study is the striking quantitative discrepancy between the transcriptomic and proteomic responses to Npro expression: only 13 DEGs versus 2466 DEPs. While we initially hypothesized that this asynchrony suggests Npro exerts its regulatory effects predominantly at the post-transcriptional or protein level, technical and biological factors must also be considered. Therefore, rather than asserting that Npro acts exclusively at the post-translational level, we interpret this discrepancy as evidence that Npro’s biological impact is predominantly manifested at the protein and pathway levels. This is highly consistent with the established mechanism of action of Npro, which targets key innate immune signaling proteins—such as IRF3, ELF4, Sp1, and MAVS—whose functional regulation relies heavily on degradation, phosphorylation, and ubiquitination, rather than changes at the mRNA level [20,21,22,23,24]. This inference is biologically plausible, as Npro is an autoprotease with known capacity to interact with host ribonucleoprotein complexes [25] and to promote proteasomal degradation of key immune signaling molecules such as IRF3 [20]. Network analyses have similarly shown that BVDV Npro exhibits the highest number of interactions with host translation and metabolic pathways [26], further supporting a protein-level regulatory paradigm.
It is also important to note that our study was conducted in MDBK cells, a bovine kidney epithelial cell line. Although this introduces a species mismatch with yaks, the MDBK cell line is internationally recognized as the standard in vitro model for BVDV research, having been extensively used for virus propagation, multi-omics analyses (including transcriptomics, proteomics, and metabolomics), and antiviral drug screening [6,27,28,29]. Importantly, MDBK cells are a well-established system for validating Npro-mediated degradation of IRF3 and MAVS, as well as Npro-induced autophagy. Furthermore, BVDV exhibits cross-species infectivity, with both cattle and yaks serving as natural hosts [30]. Notably, strains isolated from yak outbreaks can be readily propagated using standard cell culture techniques and analyzed within established pestivirus frameworks [31]. Therefore, the MDBK model provides a technically feasible and scientifically validated platform for studying the virological characteristics and host interactions of yak-derived BVDV. The robust and progressive pathway-level changes observed at 48 h and 72 h strongly imply its sustained activity.
The temporal resolution of our multi-omics dataset reveals a clear stage-specific strategy adopted by Npro. At the early stage (24 h), the preferential enrichment of purine metabolism and nucleotide metabolism at the protein level suggests that Npro primes the host cell for high-energy-demanding viral replication. This is corroborated by previous metabolomic studies showing that BVDV infection activates purine biosynthesis and salvage pathways, and drives glycolytic reprogramming via the ROS-HIF-1α axis [32,33]. Concurrently, the upregulation of nuclear receptors NR4A1 and NR1D1 at the transcriptional level may reflect an early attempt to establish metabolic adaptation and inflammatory resolution, contributing to the establishment of immune tolerance prior to overt immune activation [34].
At the middle stage (48 h), the functional emphasis shifts from metabolic preparation to active immune suppression. The downregulation of CCL5 is particularly noteworthy, as this suppression likely impedes immune cell infiltration, a phenomenon previously observed in non-cytopathic BVDV-infected macrophages [35]. Moreover, the enrichment of Toll-like receptor and NOD-like receptor pathways suggests that Npro interferes with pathogen recognition receptor signaling. Mechanistically, Npro has been shown to recruit CALCOCO2 to promote K48-linked polyubiquitination and proteasomal degradation of IRF3, thereby blocking IFN-β production [20]. The proteasome-dependent degradation of IRF3 is considered a core immune evasion mechanism among pestiviruses [36], and Npro employs multiple strategies to block type I interferon production and maintain an immunosuppressive microenvironment [37]. The concurrent enrichment of autophagy-animal pathway at this time point is also noteworthy, as recent evidence indicates that BVDV activates autophagy via the ROS-endoplasmic reticulum stress axis to promote MAVS degradation and suppress type I IFN production [24]. Although our proteomic dataset did not directly quantify low-abundance targets like IRF3 or secreted chemokines like CCL5, our pathway-level enrichment provides a broader context for these targeted degradation mechanisms.
At the late stage (72 h), the enrichment of ubiquitin-mediated proteolysis and Th1/Th2 differentiation pathways points toward a transition towards adaptive immune modulation. The ubiquitin-proteasome system is a central hub for MHC class I antigen presentation and cytokine receptor turnover. Notably, Npro itself is an intrinsically unstable protein whose degradation is controlled by the K66 ubiquitination site [38], further highlighting the central role of the ubiquitin system in this stage. The significant enrichment of the Th1/Th2 differentiation pathway raises the possibility that Npro may contribute to or partially drive the polarization of the host response towards Th2. This is supported by evidence that non-cytopathic BVDV infection downregulates MHC class II molecules and impairs Th1-type antiviral defenses [39]. However, as this inference currently relies on pathway-level enrichment, further targeted experiments (e.g., cytokine profiling) are required to definitively confirm this mechanism. The concurrent enrichment of hormone-related pathways also provides molecular clues for the reproductive disorders commonly observed in BVDV-infected herds [40].
Collectively, these stage-specific signatures depict a coherent strategy: Npro first reprograms host metabolism to support viral replication, then actively suppresses innate immune detection, and finally skews adaptive immunity towards a non-sterilizing Th2-dominated response. This three-phase program likely serves to establish a persistent infection-friendly microenvironment, allowing the virus to evade clearance while maintaining host survival for continued transmission, consistent with the epidemiological observation that persistently infected yaks remain as reservoirs for BVDV transmission within herds [4].
Several methodological limitations should be acknowledged. First, although empty vector transfection alone induced inflammatory pathway enrichment; to mitigate this confounding effect, all our functional interpretations were based on the Npro vs. Vector comparison, effectively isolating Npro-specific effects. Second, the statistical threshold used for initial DEP screening (|log2FC| ≥ 0.26 and unadjusted p < 0.05) is relatively permissive. Given that 8873 non-redundant proteins were quantified, applying a per-test error rate of α = 0.05 under the null hypothesis would theoretically yield an expected false-positive count of approximately 444 proteins (8873 × 0.05). However, this threshold was deliberately chosen for exploratory screening to capture subtle coordinated shifts. To rigorously control false positives, all downstream GO and KEGG enrichment analyses were subjected to stringent Bonferroni correction (adjusted p < 0.05). This hierarchical strategy ensures that our core findings—the stage-specific rewiring of immune and metabolic networks—are drawn from highly statistically controlled pathway-level signals. Third, we acknowledge that variations in sample preparation (trypsinization vs. scraping) may bias against membrane proteins. Furthermore, the absence of orthogonal validation (e.g., qPCR/WB) remains a limitation. Although Npro expression was confirmed by immunofluorescence at 24 h, quantitative Western blotting over the full time course is required to verify its sustained expression. Nevertheless, the pathway-level concordance between our transcriptomic and proteomic datasets provides intrinsic cross-validation, reinforcing the reliability of our findings.
5. Conclusions
In summary, this multi-omics study reveals that yak-derived BVDV Npro predominantly acts at the protein level, inducing widespread proteomic changes with minimal transcriptional disturbance. The stage-specific reprogramming of purine metabolism, innate immune pathways, and Th1/Th2 differentiation illustrates a coordinated strategy for establishing persistent infection. These findings provide a valuable resource for future mechanistic and antiviral studies targeting yak BVDV.
Supplementary Materials
The following supporting information can be downloaded at: https://www.mdpi.com/article/10.3390/cimb48111257/s1.
Author Contributions
Y.Z. and R.L. contributed to investigation, methodology, conceptualization, formal analysis, writing—original draft, and visualization. K.L., N.L., J.H., K.H. and G.G. contributed to investigation and data curation. L.W. contributed to supervision, writing—review and editing, and methodology. Q.X. contributed to supervision, writing—review and editing, and resources. S.S. contributed to resources, funding acquisition, supervision, and project administration. All authors have read and agreed to the published version of the manuscript.
Funding
This research was funded by Science and Technology Projects of Xizang Autonomous Region, China (XZ202401ZY0025 and XZ202601ZY0136); National Beef Cattle Industrial Technology System project (CARS-37); Plateau Discipline Construction and Talent Training Project of Xizang Agricultural and Animal Husbandry University (YJSXK202614).
Institutional Review Board Statement
Not applicable.
Informed Consent Statement
Not applicable.
Data Availability Statement
The raw RNA-seq data generated in this study have been deposited in the NCBI Sequence Read Archive (SRA) under BioProject accession number PRJNA1506052. The mass spectrometry proteomics data have been deposited in the iProX database (https://www.iprox.cn accessed on 12 October 2026) with the ProteomeXchange identifier PXD082372.
Acknowledgments
The authors would like to thank the Key Laboratory for Prevention and Control of Hydatid Disease in Xizang for providing the experimental platform, resources, and technical support throughout this study.
Conflicts of Interest
The authors declare no conflicts of interest.
Abbreviations
The following abbreviations are used in this manuscript:
| BVDV | Bovine viral diarrhea virus |
| DEGs | Differentially expressed genes |
| DEPs | Differentially expressed proteins |
| IFA | Indirect immunofluorescence |
| DIA | Data-independent acquisition |
References
- Wang, K.; Hu, Q.; Ma, H.; Wang, L.; Yang, Y.; Luo, W.; Qiu, Q. Genome-wide variation within and between wild and domestic yak. Mol. Ecol. Resour. 2014, 14, 794–801. [Google Scholar] [CrossRef] [Scilit] [PubMed]
- Li, A.; Liu, C.; Han, X.; Zheng, J.; Zhang, G.; Qi, X.; Du, P.; Liu, L. Tibetan Plateau yak milk: A comprehensive review of nutritional values, health benefits, and processing technology. Food Chem. X 2023, 20, 100919. [Google Scholar] [CrossRef] [Scilit] [PubMed]
- Li, Z.; Han, Y.; Yuan, Q.; Wang, S.; Chen, C.; Gao, S.; Meng, R. The current epidemic status and prevention and control of bovine viral diarrhea virus in yaks in China. Front. Cell Infect. Mi 2025, 15, 1647328. [Google Scholar] [CrossRef] [Scilit] [PubMed]
- Li, Z.; Han, Y.; Fu, Y.; Yuan, Q.; Wang, S.; Pan, X.; Xue, W.; Yin, H.; Gao, S.; Meng, R. Comprehensive molecular epidemiology of BVDV in yaks (Bos gruniens) in Qinghai, China: High prevalence and dominance of BVDV-1u. Front. Cell Infect. Mi 2025, 15, 1652023. [Google Scholar] [CrossRef] [Scilit] [PubMed]
- Gong, X.; Liu, L.; Zheng, F.; Chen, Q.; Li, Z.; Cao, X.; Yin, H.; Zhou, J.; Cai, X. Molecular investigation of bovine viral diarrhea virus infection in yaks (Bos gruniens) from Qinghai, China. Virol. J. 2014, 11, 29. [Google Scholar] [CrossRef] [Scilit] [PubMed]
- Ma, Y.; Wang, L.; Jiang, X.; Yao, X.; Huang, X.; Zhou, K.; Yang, Y.; Wang, Y.; Sun, X.; Guan, X.; et al. Integrative Transcriptomics and Proteomics Analysis Provide a Deep Insight Into Bovine Viral Diarrhea Virus-Host Interactions During BVDV Infection. Front. Immunol. 2022, 13, 862828. [Google Scholar] [CrossRef] [Scilit] [PubMed]
- Illumina, Inc. Illumina Stranded mRNA Prep, Ligation Reference Guide; Document # 1000000124518 v03; Illumina: San Diego, CA, USA, 2022. [Google Scholar]
- Chen, S.; Zhou, Y.; Chen, Y.; Gu, J. fastp: An ultra-fast all-in-one FASTQ preprocessor. Bioinformatics 2018, 34, i884–i890. [Google Scholar] [CrossRef] [Scilit] [PubMed]
- Kim, D.; Paggi, J.M.; Park, C.; Bennett, C.; Salzberg, S.L. Graph-based genome alignment and genotyping with HISAT2 and HISAT-genotype. Nat. Biotechnol. 2019, 37, 907–915. [Google Scholar] [CrossRef] [Scilit] [PubMed]
- Li, B.; Dewey, C.N. RSEM: Accurate transcript quantification from RNA-Seq data with or without a reference genome. BMC Bioinform. 2011, 12, 323. [Google Scholar] [CrossRef] [Scilit] [PubMed]
- Love, M.I.; Huber, W.; Anders, S. Moderated estimation of fold change and dispersion for RNA-seq data with DESeq2. Genome Biol. 2014, 15, 550. [Google Scholar] [CrossRef] [Scilit] [PubMed]
- Ashburner, M.; Ball, C.A.; Blake, J.A.; Botstein, D.; Butler, H.; Cherry, J.M.; Davis, A.P.; Dolinski, K.; Dwight, S.S.; Eppig, J.T.; et al. Gene ontology: Tool for the unification of biology. Gene Ontol. Consortium. Nat. Genet. 2000, 25, 25–29. [Google Scholar] [CrossRef] [Scilit] [PubMed]
- Gene, O.C.; Aleksander, S.A.; Balhoff, J.; Carbon, S.; Cherry, J.M.; Drabkin, H.J.; Ebert, D.; Feuermann, M.; Gaudet, P.; Harris, N.L.; et al. The Gene Ontology knowledgebase in 2023. Genetics 2023, 224, iyad31. [Google Scholar] [CrossRef] [Scilit] [PubMed]
- Kanehisa, M.; Goto, S. KEGG: Kyoto encyclopedia of genes and genomes. Nucleic Acids Res. 2000, 28, 27–30. [Google Scholar] [CrossRef] [Scilit] [PubMed]
- UniProt, C. UniProt: The Universal Protein Knowledgebase in 2023. Nucleic Acids Res. 2023, 51, D523–D531. [Google Scholar] [CrossRef] [Scilit] [PubMed]
- Lou, R.; Shui, W. Acquisition and Analysis of DIA-Based Proteomic Data: A Comprehensive Survey in 2023. Mol. Cell Proteom. 2024, 23, 100712. [Google Scholar] [CrossRef] [Scilit] [PubMed]
- Cox, J.; Hein, M.Y.; Luber, C.A.; Paron, I.; Nagaraj, N.; Mann, M. Accurate proteome-wide label-free quantification by delayed normalization and maximal peptide ratio extraction, termed MaxLFQ. Mol. Cell. Proteom. Mcp 2014, 13, 2513–2526. [Google Scholar] [CrossRef] [Scilit] [PubMed]
- Han, C.; Shi, C.; Liu, L.; Han, J.; Yang, Q.; Wang, Y.; Li, X.; Fu, W.; Gao, H.; Huang, H.; et al. Majorbio Cloud 2024: Update single-cell and multiomics workflows. Imeta 2024, 3, e217. [Google Scholar] [CrossRef] [Scilit] [PubMed]
- Ren, Y.; Yu, G.; Shi, C.; Liu, L.; Guo, Q.; Han, C.; Zhang, D.; Zhang, L.; Liu, B.; Gao, H.; et al. Majorbio Cloud: A one-stop, comprehensive bioinformatic platform for multiomics analyses. Imeta 2022, 1, e12. [Google Scholar] [CrossRef] [Scilit]
- Wang, S.; Wei, R.; Ma, X.; Guo, J.; Aizaz, M.; Li, F.; Wang, J.; Wang, H.; He, H. The host protein CALCOCO2 interacts with bovine viral diarrhoea virus Npro, inhibiting type I interferon production and thereby promoting viral replication. Virulence 2024, 15, 2289764. [Google Scholar] [CrossRef] [Scilit] [PubMed]
- Liu, S.; Li, N.; Wang, L.; Yu, Y.; Liu, Y.; Zhou, Y.; Zhang, Z.; Wang, X.; Chen, Y.; Wen, S.; et al. Quercetin Restores Antiviral Innate Immunity by Blocking BVDV Npro-Hsp70-Mediated ELF4 Degradation. J. Agr. Food Chem. 2026, 74, 23543–23555. [Google Scholar] [CrossRef] [Scilit] [PubMed]
- Wen, S.; Li, X.; Lv, X.; Liu, K.; Ren, J.; Zhai, J.; Song, Y. Current progress on innate immune evasion mediated by N(pro) protein of pestiviruses. Front. Immunol. 2023, 14, 1136051. [Google Scholar] [CrossRef] [Scilit] [PubMed]
- Chen, R.; Han, X.; Xu, H.; Xu, J.; Cao, T.; Shan, Y.; He, F.; Fang, W.; Li, X. N-terminal domain of classical swine fever virus N(pro) induces proteasomal degradation of specificity protein 1 with reduced HDAC1 expression to evade from innate immune responses. J. Virol. 2023, 97, e111523. [Google Scholar] [CrossRef] [Scilit] [PubMed]
- Wang, J.; Zhou, J.; Wang, Y.; Fan, W.; Xia, X.; Chen, J.; Zhu, H.; Wang, Q.; Li, X.; Liu, Y.; et al. Bovine viral diarrhea virus suppresses type I IFN production by inducing MAVS degradation via autophagy mediated by the ROS-endoplasmic reticulum stress axis. J. Virol. 2026, 100, e164325. [Google Scholar] [CrossRef] [Scilit] [PubMed]
- Jefferson, M.; Donaszi-Ivanov, A.; Pollen, S.; Dalmay, T.; Saalbach, G.; Powell, P.P. Host factors that interact with the pestivirus N-terminal protease, Npro, are components of the ribonucleoprotein complex. J. Virol. 2014, 88, 10340–10353. [Google Scholar] [CrossRef] [Scilit] [PubMed]
- Rezatofighi, S.E. Exogenous interactome analysis of bovine viral diarrhea virus-host using network based-approach and identification of hub genes and important pathways involved in virus pathogenesis. Biochem. Biophys. Rep. 2024, 40, 101825. [Google Scholar] [CrossRef] [Scilit] [PubMed]
- Liu, C.; Liu, Y.; Liang, L.; Cui, S.; Zhang, Y. RNA-Seq based transcriptome analysis during bovine viral diarrhoea virus (BVDV) infection. BMC Genom. 2019, 20, 774. [Google Scholar] [CrossRef] [Scilit] [PubMed]
- Wang, J.; Yang, G.; Zhang, L.; Zhang, J.; Wang, J.; Zou, Y.; Wang, J. Berbamine hydrochloride inhibits bovine viral diarrhea virus replication via interfering in late-stage autophagy. Virus Res. 2022, 321, 198905. [Google Scholar] [CrossRef] [Scilit] [PubMed]
- Zhang, L.; Yang, G.; Wang, J.; Zhang, J.; Chen, K.; Xiong, X.; Zhu, Y.; Xu, C.; Wang, J. Ethyl Gallate Inhibits Bovine Viral Diarrhea Virus by Promoting IFITM3 Expression, Lysosomal Acidification and Protease Activity. Int. J. Mol. Sci. 2023, 24, 8637. [Google Scholar] [CrossRef] [Scilit] [PubMed]
- Ochirkhuu, N.; Konnai, S.; Odbileg, R.; Odzaya, B.; Gansukh, S.; Murata, S.; Ohashi, K. Molecular detection and characterization of bovine viral diarrhea virus in Mongolian cattle and yaks. Arch. Virol. 2016, 161, 2279–2283. [Google Scholar] [CrossRef] [Scilit] [PubMed]
- Ye, X.; Zhang, C.; Wang, Y.; Zhang, F.; Xu, J.; Chen, X.; Xu, L.; Yu, J.; Zeren, Y.; Tian, C.; et al. Isolation and identification of a potential new bovine viral diarrhea virus genotype associated with severe outbreaks in yaks (Bos grunniens) in China. Front. Microbiol. 2026, 17, 1908819. [Google Scholar] [CrossRef] [Scilit] [PubMed]
- Li, Y.; Zhou, J.; Wang, J.; Yan, K.; Guan, Y.; Wang, M.; Xiang, J.; Liu, Y.; Yu, H.; Jia, S.; et al. Pestivirus bovine viral diarrhea virus infection induces ROS-HIF-1a axis-driven glycolytic reprogramming, which increases viral replication by impairing RIG-I-dependent type I interferon response. J. Virol. 2026, 100, e32026. [Google Scholar] [CrossRef] [Scilit] [PubMed]
- Xiao, T.; Gao, S.; Zhang, X.; Teng, F.; Wei, Y.; Wu, W.; Zheng, C.; Qiao, X.; Zhang, W.; Ma, Y. Untargeted metabolomics reveals bovine viral diarrhea virus infection reprogram host nucleotide and amino acid metabolism in MDBK Cells. Res. Vet. Sci. 2026, 207, 106223. [Google Scholar] [CrossRef] [Scilit] [PubMed]
- Egarnes, B.; Blanchet, M.R.; Gosselin, J. Treatment with the NR4A1 agonist cytosporone B controls influenza virus infection and improves pulmonary function in infected mice. PLoS ONE 2017, 12, e186639. [Google Scholar] [CrossRef] [Scilit] [PubMed]
- Burr, S.; Thomas, C.; Brownlie, J.; Offord, V.; Coffey, T.J.; Werling, D. Potential evidence for biotype-specific chemokine profile following BVDV infection of bovine macrophages. Vet. Immunol. Immunop. 2012, 150, 123–127. [Google Scholar] [CrossRef] [Scilit] [PubMed]
- Lussi, C.; Schweizer, M. What can pestiviral endonucleases teach us about innate immunotolerance? Cytokine Growth F R 2016, 29, 53–62. [Google Scholar] [CrossRef] [Scilit] [PubMed]
- Hong, T.; Yang, Y.; Wang, P.; Zhu, G.; Zhu, C. Pestiviruses infection: Interferon-virus mutual regulation. Front. Cell Infect. Mi 2023, 13, 1146394. [Google Scholar] [CrossRef] [Scilit] [PubMed]
- Zhou, L.; Han, X.; Weng, Y.; Cao, T.; Xu, J.; Shao, Y.; Fang, W.; Li, X. N(pro) lysine 66 regulates ubiquitination-dependent degradation and innate immune evasion of classical swine fever virus. Vet. Microbiol. 2026, 323, 111261. [Google Scholar] [CrossRef] [Scilit] [PubMed]
- Choi, K.S. The effect of bovine viral diarrhea virus on bovine monocyte phenotype. Iran. J. Vet. Res. 2017, 18, 13–17. [Google Scholar] [PubMed]
- Gonzalez, A.E.; Kaiser, G.G.; Mucci, N.C.; Verna, A.E.; Campero, C.M.; Odeon, A.C. Effect of Bovine Viral Diarrhea Virus on the ovarian functionality and in vitro reproductive performance of persistently infected heifers. Vet. Microbiol. 2013, 165, 326–332. [Google Scholar] [CrossRef] [Scilit] [PubMed]
Disclaimer/Publisher’s Note: The statements, opinions and data contained in all publications are solely those of the individual author(s) and contributor(s) and not of MDPI and/or the editor(s). MDPI and/or the editor(s) disclaim responsibility for any injury to people or property resulting from any ideas, methods, instructions or products referred to in the content. |
© 2026 by the authors. Licensee MDPI, Basel, Switzerland. This article is an open access article distributed under the terms and conditions of the Creative Commons Attribution (CC BY) license.