


Abstract
Most transcriptomic studies of colorectal neoplasia contrast carcinoma with normal tissue, leaving it uncertain which changes are established in precancerous lesions and reproducible across cohorts. We used a sequential four-dataset framework to identify early-persistent tissue-expression changes while separating discovery from final validation. GSE41657 defined stage-resolved patterns; patient-matched GSE117606 and GSE232110 provided microarray and RNA-sequencing replication; and GSE20916 was reserved for final testing of a procedurally locked candidate list. Fixed rules identified 1407 early-persistent genes, 835 of which replicated in GSE117606 and 617 in GSE232110. Forty-nine candidates were locked before GSE20916 analysis; all retained the expected adenoma direction and candidate-family false discovery rate < 0.05 in the macrodissected primary analysis, and 43 retained support in the source-clustered carcinoma comparison. Results are reported for all 49 candidates and the 39-gene subset. Thirty-six of 49 candidates overlapped a published adenoma signature in the same direction. Marker-score analyses linked the expression signal to mature epithelial differentiation and stromal state. All 49 directions persisted in six tubular RNA-seq pairs, although none met exact-test candidate-family FDR < 0.05; discovery-stage interpretation remained limited by technical and tissue-source confounding. These findings identify recurrent adenoma-associated tissue-expression changes and provide a cross-cohort resource for biological prioritization and targeted follow-up.
1. Introduction
Colorectal cancer (CRC) is one of the most frequently diagnosed cancers and a leading cause of cancer death worldwide [1]. A substantial proportion of sporadic CRC develops through the conventional adenoma–carcinoma sequence, providing an opportunity to identify molecular alterations that arise before invasive carcinoma [2,3,4].
Many molecular-marker studies compare established CRC with normal tissue. Although these contrasts identify cancer-associated changes, they cannot distinguish alterations already present in adenoma or dysplasia from those that arise mainly during later progression. A second analytical challenge is that repeated candidate selection across multiple datasets can blur the boundary between discovery and validation. Stage-resolved analysis with sequential, non-reselecting validation is therefore useful for separating persistent early alterations from later progression-associated changes.
Previous transcriptomic studies have reported extensive expression remodeling during colorectal adenoma formation and have implicated immune regulation, tissue homeostasis, Wnt-related programs, and other processes [5,6,7,8,9]. Cell-cycle and DNA-replication programs have also been implicated in progression [10]. However, differences in tissue source, platform, pathology definitions and validation strategy can make it difficult to determine which early changes are reproducible rather than dataset-specific. Single-cell analyses of colorectal polyps and CRC show that both cell state and composition change during neoplastic transformation [11]. Regulatory studies provide complementary context: super-enhancers in digestive tumors [12], linc01615/miR-491-5p in CRC cells [13], and PI3K/AKT/mTOR modulation in CRC cells [14].
Here, we performed a sequential sample-level reanalysis of four public transcriptomic datasets to ask two questions: which expression changes are observed in low-grade dysplasia and persist through carcinoma, and which of these changes reproduce across independent cohorts and platforms when the final validation dataset is held back from candidate selection? GSE41657 defined stage-resolved patterns; GSE117606 provided patient-matched microarray validation; GSE232110 provided paired RNA-sequencing (RNA-seq) cross-platform replication; and GSE20916 was reserved for final testing of a procedurally locked candidate list. The study evaluated reproducibility of tissue-expression patterns. Additional analyses evaluated prior adenoma signatures, technical and tissue-source sensitivity, and associations with external-marker scores.
2. Materials and Methods
2.1. Study Design and Analytical Scope
We conducted a retrospective secondary analysis of de-identified, public transcriptomic data from the National Center for Biotechnology Information Gene Expression Omnibus (GEO). We analyzed sample-level data using a sequential discovery and validation framework: stage-pattern discovery in GSE41657, matched microarray validation in GSE117606, paired RNA-seq candidate selection in GSE232110, procedural candidate locking, and final validation in GSE20916 (Table 1). Candidates could be removed when they failed a validation rule, but no new genes were added after the discovery stage. The 49 prioritized candidates form the main comparison set; the 39-gene subset is reported separately, with its selection provenance and analytical role described in Section 2.11.
Table 1.
Public transcriptomic datasets and analytical roles.
2.2. Public Datasets, Pathology Terminology and Reference Tissues
GSE41657 served as the discovery dataset [5,15]. It contains 88 colorectal tissues profiled on Agilent GPL6480. These comprise 12 normal mucosa samples, 21 low-grade adenoma/mild-to-moderate atypical hyperplasia samples, 30 high-grade adenoma/severe atypical hyperplasia or carcinoma in situ samples, and 25 adenocarcinomas. We use low-grade dysplasia (LGD) and high-grade dysplasia (HGD) for the two precancerous categories, following the sample-level grade metadata. The HGD category includes carcinoma in situ (CIS) and follows the deposited histology rather than clinical advanced-adenoma criteria.
The GSE41657 source report states that specimens were obtained by colonoscopic resection or surgery and classified histologically [5]. Reinspection of raw-file headers identified 15 scan days and 24 physical slides. Separate scan-day and slide models included stage, age and sex. Normal and LGD tissues shared only one bridge day/slide, containing three normal samples and one LGD sample (GSM1021167). Removing this bridge made the normal–LGD contrast non-estimable. Normal tissue from hemorrhoid surgery and lesions from polypectomy were also inseparable by sampling source. Stage comparisons were therefore evaluated alongside this technical and sampling structure. Full model, leverage and leave-batch diagnostics are provided in Data S1.
GSE117606 served as the first validation dataset [16]. The primary analysis used 51 patient-matched pairs of adjacent mucosa and conventional adenoma. We excluded sessile serrated adenomas to focus on the conventional pathway. Tumor samples were also available for 48 of these patients. These samples were not used in the original sequential validation; a matched-triplet sensitivity analysis was performed separately. The deposited matrix had been processed to Entrez-gene level using robust multi-array average (RMA) normalization and BrainArray alternative chip definition files (CDFs), version 20.
GSE232110 contained 8 colorectal lesions and 8 paired adjacent unaffected mucosa samples sequenced on an Illumina NovaSeq 6000 (Illumina, San Diego, CA, USA) [17]. The lesions comprised six tubular adenomas, one traditional serrated adenoma (R03) and one sessile serrated lesion (R07). We analyzed the TPM matrix provided by GEO, retaining all eight pairs for candidate selection and examining the six tubular pairs separately. GSE20916 comprised 105 macrodissected arrays (24 normal, 45 adenoma and 36 CRC) and 40 microdissected arrays on Affymetrix GPL570 [10,18]. The macro arrays represented 103 inferred source-by-phenotype units after repeat-region averaging (24 normal, 44 adenoma and 35 CRC). The 40 microarrays were five dissections for each of eight morphology-by-region combinations from one female case; they were used descriptively only. The discovery reference was labeled normal mucosa. The paired validation datasets instead used adjacent or unaffected-appearing mucosa, which may contain field effects. Such effects can reduce differences between lesions and reference tissues. Absolute values of the area under the receiver operating characteristic curve (AUC) are therefore not directly comparable across datasets. We focus on the direction and reproducibility of expression changes across datasets.
2.3. GSE41657 Preprocessing and Gene Annotation
We downloaded the normalized GSE41657 Series Matrix and official GPL6480 annotation. GEO records describe background-subtracted, spatially detrended signals normalized with GeneSpring GX 11.5. We retained the supplied numerical scale without an additional log transformation. The matrix contained 41,076 probes across 88 samples, with no missing expression values. We removed probes without a valid gene symbol and those mapping ambiguously to multiple genes. When several valid probes mapped to one gene, we used their median value within each sample. The final discovery matrix contained 19,529 unique genes.
2.4. Principal Component Analysis
The 5000 most variable genes were standardized across samples and used for principal component analysis (PCA). PCA was used to explore sample structure and assess quality alongside the recovered technical metadata and sampling-source information.
2.5. Differential Expression and Stage Contrasts
For each GSE41657 gene, we fitted a linear model with disease stage as the factor of interest and age and sex as covariates, using normal mucosa as the reference. Contrasts estimated LGD versus normal, HGD versus LGD, CRC versus HGD, HGD versus normal, CRC versus normal and CRC versus LGD. P values were adjusted using the Benjamini–Hochberg (BH) method. The main thresholds were false discovery rate (FDR) < 0.01 and an absolute adjusted expression difference ≥ 1.0. This effect is measured on the deposited normalized microarray scale. BH correction covered 19,529 genes separately for each contrast or ordinal trend. The same thresholds were retained in separate scan-day and slide sensitivity models; their counts were reported as model-specific sensitivity results.
2.6. Definition of Stage-Resolved Expression Patterns
Early-persistent genes had to meet FDR < 0.01 and absolute effect ≥ 1.0 in each comparison of LGD, HGD and CRC with normal mucosa. The direction of change had to be consistent across all three comparisons. Monotonic-progression genes required ordinal-trend FDR < 0.01, absolute CRC-versus-normal effect ≥ 1.0 and strictly ordered group medians. Late/progression-specific genes required minimal or non-significant change in LGD (FDR ≥ 0.05 or absolute effect < 0.25). They also had to meet FDR < 0.01 and absolute effect ≥ 1.0 for CRC versus normal, and FDR < 0.01 and absolute effect ≥ 0.75 for CRC versus LGD (Table 2). These definitions classify group-level patterns under the original age/sex model; their sensitivity to technical adjustment is evaluated in Section 3.3.
Table 2.
Fixed definitions and sizes of stage-resolved expression patterns.
2.7. Functional Enrichment Analysis
We used g:Profiler [19] with GO Biological Process, Reactome and KEGG resources (build e114_eg62_p19_9dc92ac8; Ensembl 114; GRCh38.p14). Gene sets for each stage pattern and direction were fixed before enrichment. All 19,529 measured GSE41657 genes formed the custom background (18,293 mapped Ensembl identifiers). Enrichment required source-specific FDR < 0.05. Gene intersections were identified from nonempty evidence-code entries aligned to the query Ensembl identifiers and mapped to approved gene symbols. Representative terms were selected using gene-based Jaccard filtering (>0.6; at most eight terms per query/source), yielding 193 records. Section 3.4 shows selected terms from the 2758 significant records. Annotation did not alter candidate selection; resource versions, intersection checks and complete results are in Data S7.
2.8. First External Validation in GSE117606
We mapped the 1407 early-persistent genes to the 51 matched pairs of adjacent mucosa and conventional adenoma. For each measurable gene, we tested the paired adenoma-minus-mucosa difference using a paired t-test. BH correction was applied across the measurable candidates. A gene passed validation if its direction agreed with the GSE41657 normal-to-LGD change and its candidate-family FDR was < 0.05. The 48 available tumor samples were not analyzed in this pipeline. In a separate sensitivity analysis, mean absolute adenoma-minus-normal and CRC-minus-adenoma changes across 17,156 common genes were compared within these 48 patients using a paired t-test and 2000 patient bootstrap resamples. This sensitivity compared matched tissues cross-sectionally.
2.9. Cross-Platform RNA-Seq Validation in GSE232110
We mapped versioned Ensembl identifiers to gene symbols using GENCODE v36 [20] and transformed expression values as log2(TPM + 1). Only genes validated in GSE117606 were evaluated. We used paired t-tests for the 8 matched mucosa–lesion pairs and applied BH correction within the 812 measurable candidates. Validation required the discovery direction and FDR < 0.05. Genes were classified as having high consistency if they showed the expected direction in at least 7 of 8 pairs and median TPM > 1 in reference or lesion tissue. Sensitivity analyses used the six tubular pairs, exhaustive two-sided paired sign flips (28 or 26 assignments), leave-one-pair-out tests and exact BH recalculation within the stated gene families. The eight-pair RNA results contributed to candidate selection; GSE20916 provided the subsequent held-out cohort assessment.
2.10. Procedural Candidate Locking Before GSE20916
Before analyzing GSE20916, we applied a fixed rule to prioritize candidates with high consistency. Candidates required direction-oriented AUC ≥ 0.90 in all three comparisons: GSE41657 LGD versus normal, GSE117606 adenoma versus adjacent mucosa and GSE232110 lesion versus adjacent mucosa. They also required an absolute paired Cohen’s dz ≥ 1.0 in GSE117606. In GSE232110, the absolute mean lesion-minus-mucosa difference in log2(TPM + 1) had to be ≥ 1.0. A total of 49 genes met these criteria. This list and the expected directions were carried unchanged into GSE20916. These operational cutoffs favored consistent tissue separation and appreciable paired effects: |dz| ≥ 1 requires an absolute mean paired difference of at least one SD of the paired differences, while the RNA cutoff requires a one-unit difference on the log2(TPM + 1) scale. They are prioritization criteria rather than optimized clinical cutoffs.
The 49 prioritized candidates were fixed internally before GSE20916 analysis. The study was not preregistered. Additional retrospective sensitivity and explanatory analyses are distinguished from candidate selection in Section 2.11 and Section 2.12, with their chronology documented in Supplementary Methods. These analyses did not replace the original candidate-selection thresholds.
2.11. Final Validation in GSE20916
We mapped GPL570 probes to gene symbols and removed ambiguous mappings. When several unambiguous probes mapped to one gene, we used their median value within each sample. Source labels were inferred from CEL filenames and demographic metadata; repeated regions were averaged within inferred source and phenotype on the processed expression scale. A verified patient crosswalk was unavailable. The primary analysis compared 24 normal with 44 adenoma units using expression = group + age + sex (68 observations, residual df = 64), with BH correction across all 49 fixed candidates. Validation required the expected direction and FDR < 0.05; HC3 was a variance sensitivity. The secondary CRC comparison used 24 normal and 34 CRC units after excluding one CRC unit with missing age, with source-clustered CR1 variance and t inference across 48 inferred clusters (df = 47). A paired sensitivity analysis used 11 inferred normal/CRC matches. Source reconstruction and identity sensitivities are documented in Data S4.
The 39-gene subset was originally obtained by combining macrodissection criteria with significance filtering across repeated microdissections. All 40 microdissected arrays came from one case, so this filtering does not establish independent population-level validation. The unchanged subset is retained for gene-level description alongside the main comparison of all 49 prioritized candidates. Microdissection profiles are summarized by region and morphology as within-case means and SD and do not enter population tests or final candidate-selection criteria.
2.12. Sensitivity Analyses and Tissue-State Associations
BH correction used the actual measurable family at each step: 1307 candidates in GSE117606, 812 in RNA selection, and 12,813 mapped genes in macro sensitivity analyses. Additional RNA sensitivities used all 60,240 supplied rows and a fixed 17,597-gene expression-filtered universe (median TPM > 1 in either condition across all eight pairs). The expression-filtered universe was evaluated as an additional sensitivity after the all-row analysis. Candidate-family, platform-family and expressed-family results are reported separately to distinguish their multiplicity scope (Data S3).
We compared the fixed 49 candidates with the original adenoma lists of Sabates-Bellver et al. [6] and Pesson et al. [21], using probe/Entrez-to-symbol mapping, publication-specific measurable backgrounds (17,525 and 18,821 genes), one-sided Fisher tests, conditional odds ratios and exact 95% CIs. BH correction covered two publications separately within the 49- and 39-gene subsets; an early-persistent-background sensitivity was also reported (Data S5). External immune, fibroblast, endothelial and pan-epithelial markers and healthy-colon mature/cycling epithelial markers [22,23] were frozen before scoring; all 49 candidates were excluded. Within-cohort standardized mean-expression scores were used as tissue-state proxies. In 51 pairs, gene differences were modeled against successive uncentered marker-score differences; adjusted intercepts predict expression differences at zero marker change and differ in estimand from the baseline mean paired change. Macro explanatory models used age/sex and HC3. Each fixed model used BH49; within-adenoma correlations used BH294 across 49 genes and six modules (Data S6).
Threshold sensitivity rules were fixed before calculating alternative results. We crossed discovery FDR cutoffs 0.005, 0.01 and 0.02 with absolute effects 0.75, 1.00 and 1.25, retaining the same 19,529-gene BH families and fitted original, scan-day and slide models. For the unchanged 522 high-consistency genes, we crossed common AUC cutoffs 0.875, 0.900 and 0.925 with paired dz and RNA-effect cutoffs 0.9, 1.0 and 1.1 (27 combinations). We reported all memberships, overlap with the fixed 49- and 39-gene subset, and macro support using each measurable candidate family and the fixed 12,813-gene platform family. Original thresholds and memberships were unchanged; macro results were not used to choose an alternative rule (Data S9).
2.13. Receiver Operating Characteristic and Statistical Analysis
Receiver operating characteristic (ROC) curves described how well individual genes separated reference tissue from adenoma or other precancerous tissue. AUC was oriented using the discovery direction. Genes with inconsistent directions were counted as failures; their directions were not reversed after testing. We used AUC for descriptive ranking and for the priority rule applied before GSE20916. It was not used to tune thresholds in GSE20916. Analyses used Python 3.12.14 with pandas 2.2.3, NumPy 2.3.5, SciPy 1.17.0, scikit-learn 1.8.0 and Matplotlib 3.10.8.
3. Results
3.1. Discovery Dataset and Global Transcriptomic Structure
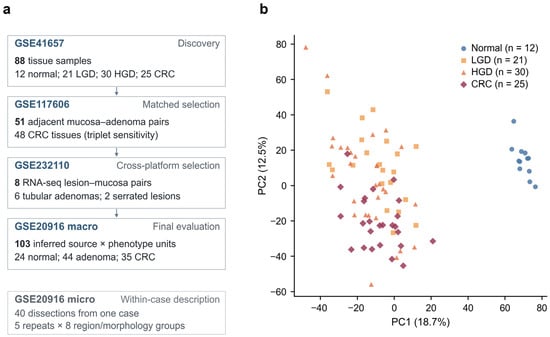
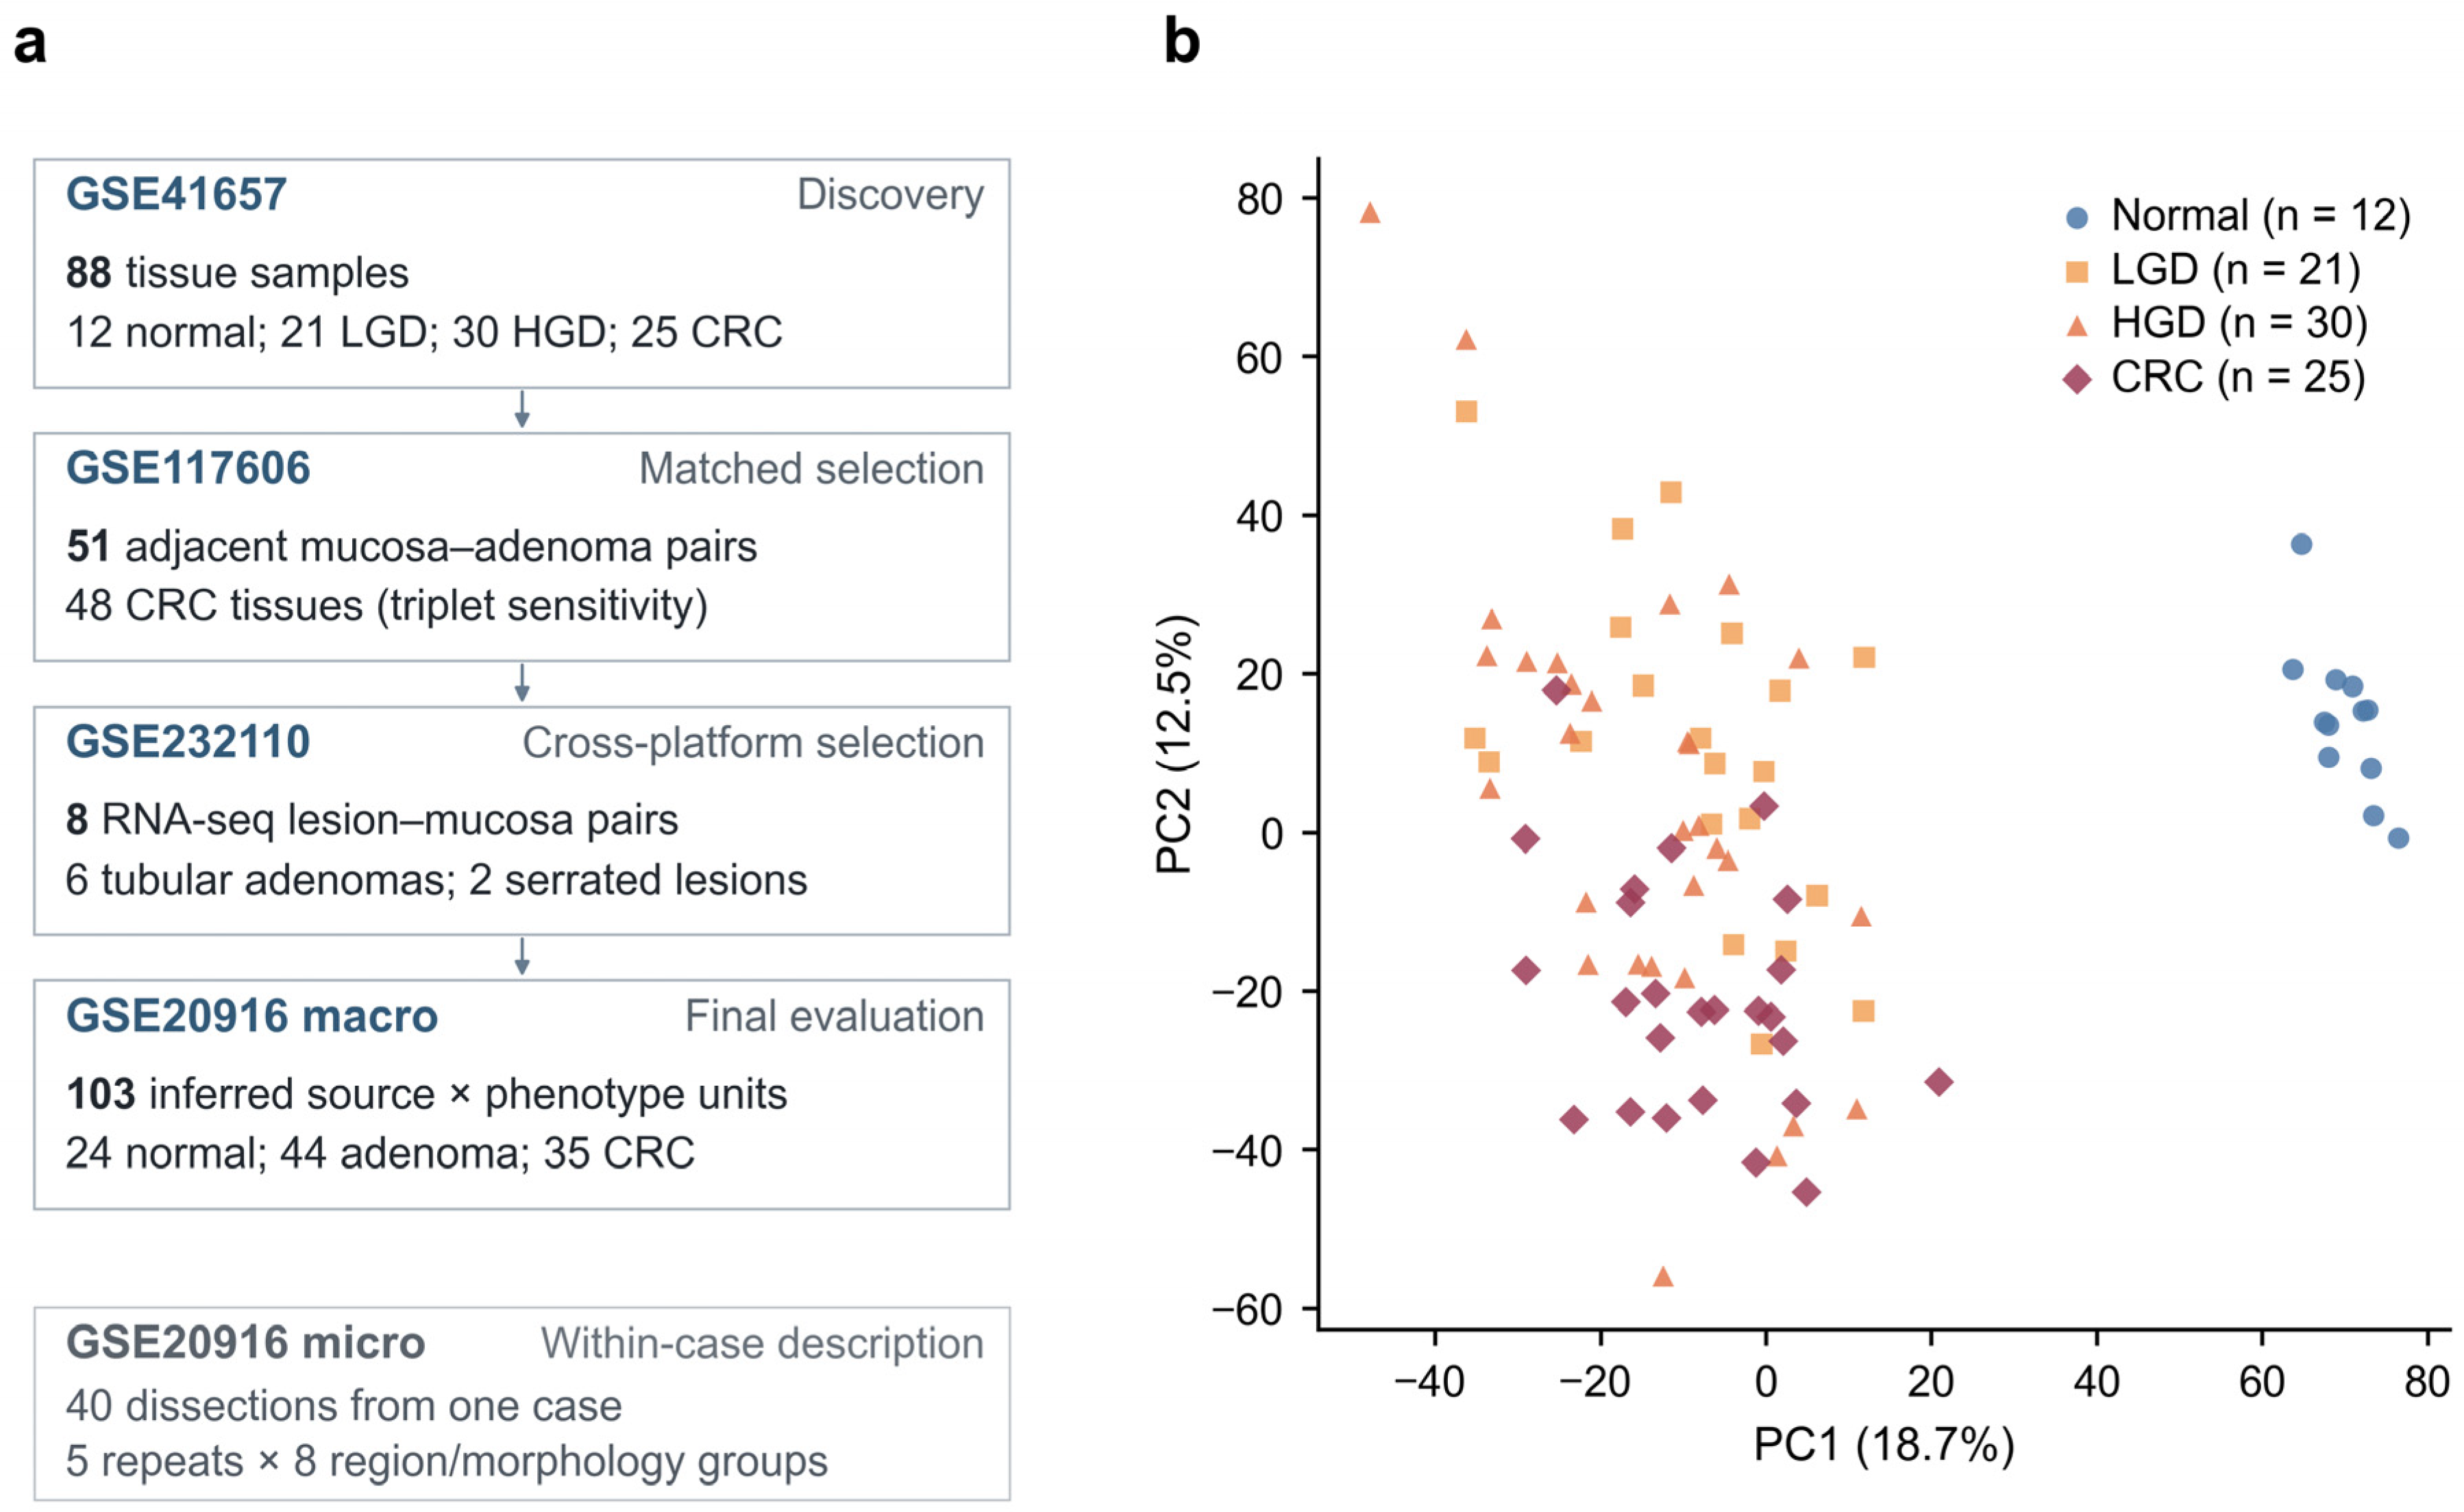
After annotation and combining probes by gene, we analyzed 19,529 genes across 88 GSE41657 samples. PCA of the 5000 most variable genes showed that the 12 normal mucosa samples clustered tightly. They were separated from most dysplasia and CRC samples (Figure 1). This sample structure was evaluated alongside the recovered technical metadata and source information (Figure S6).
Figure 1.
Study datasets and global transcriptomic structure. (a) Cohort overview with the analysis unit specified separately for each dataset. Arrows indicate the analytical sequence; microdissections are shown separately for within-case description. GSE117606 contributes 51 patient-matched adjacent mucosa–adenoma pairs and 48 available CRC tissues for the matched-triplet sensitivity. The eight GSE232110 RNA-seq pairs comprise six tubular adenomas and two serrated lesions. GSE20916 macro counts are inferred source-by-phenotype units after repeat-region averaging; the 35 CRC units include one with missing age, excluded from the age-adjusted CRC model. The 40 microdissections are repeated samples from one case. (b) PCA of the 5000 most variable GSE41657 genes, using the archived coordinates (PC1 18.7%; PC2 12.5%). Technical and sampling-source context is provided in Figure S6 and Data S1.
3.2. Adjacent-Stage Expression Differences and Technical Sensitivity
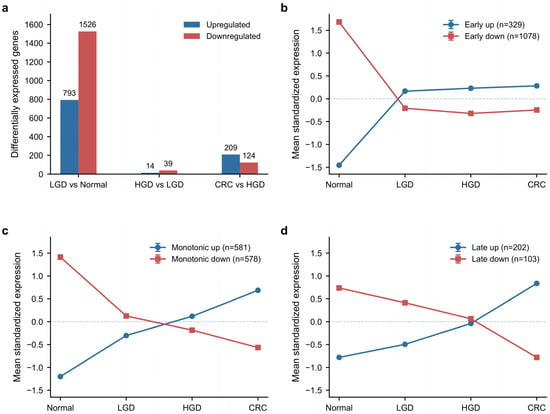
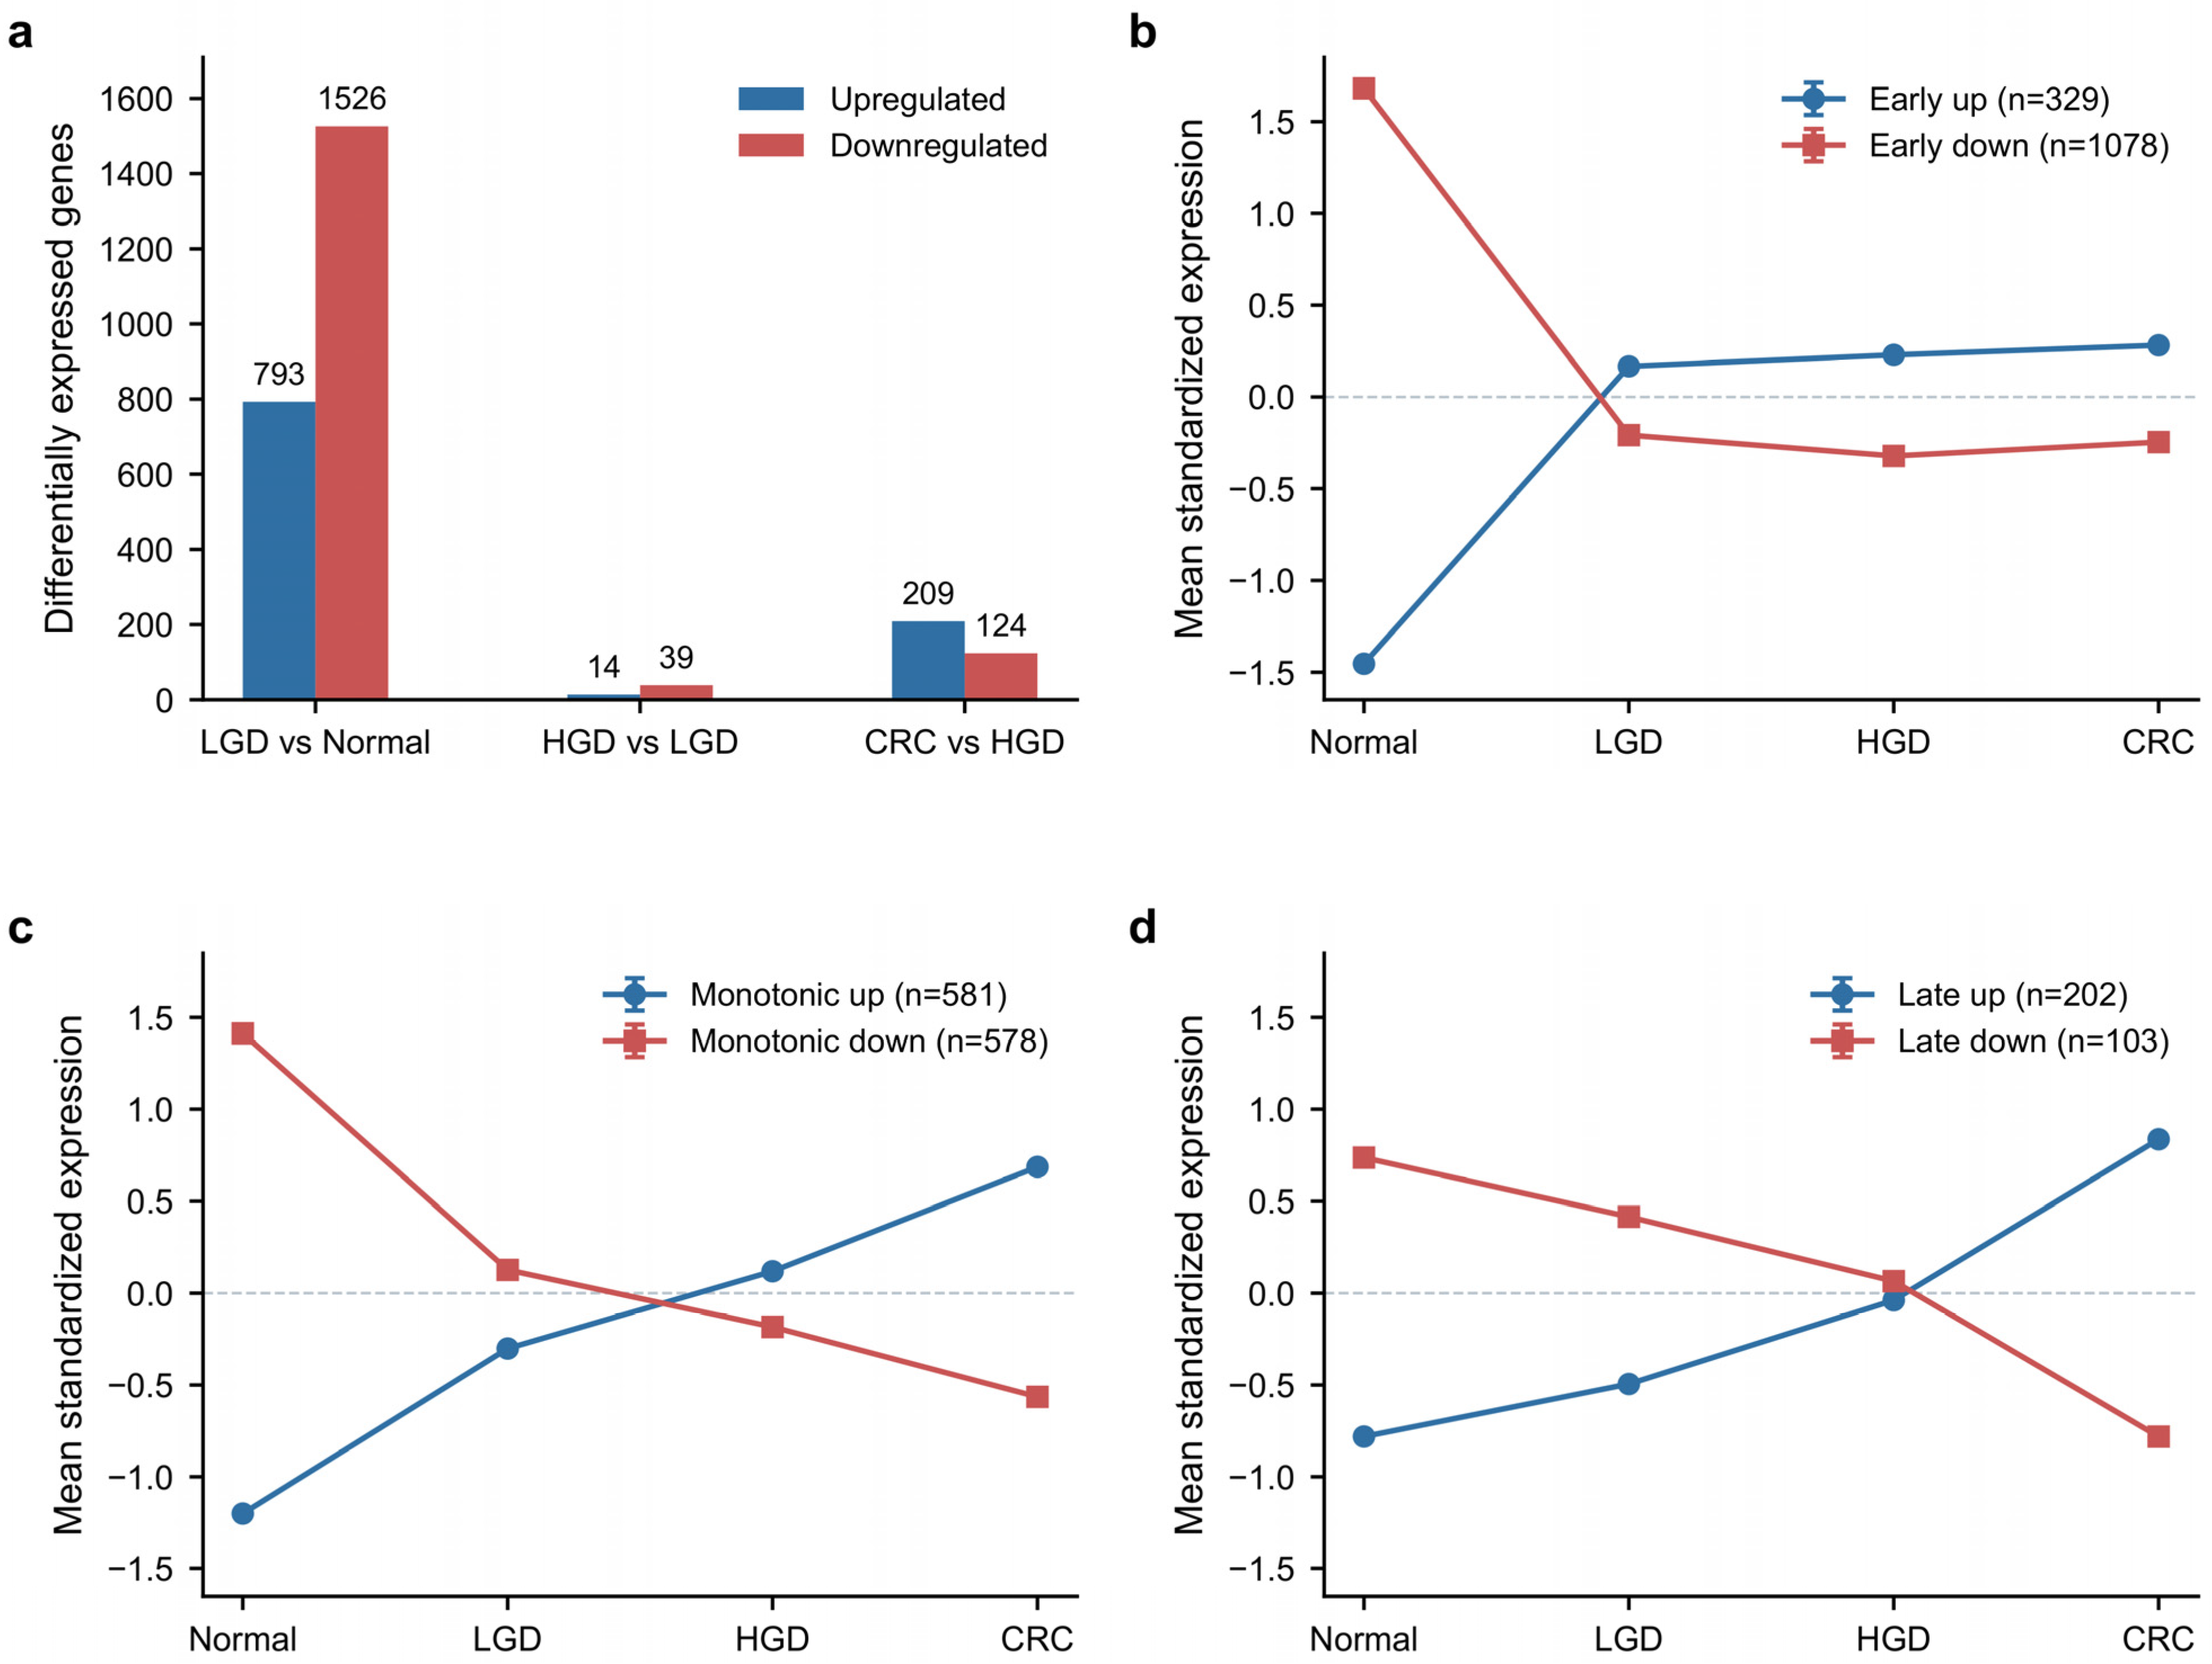
The LGD-versus-normal comparison identified 2319 genes meeting FDR < 0.01 and absolute effect ≥ 1.0 (793 up and 1526 down; Figure 2a), the largest adjacent-stage count under the original age/sex model. By the same criteria, 53 genes were identified for HGD versus LGD (14 up and 39 down) and 333 for CRC versus HGD (209 up and 124 down). Scan-day and slide models yielded 311 and 421 LGD-versus-normal genes, respectively, and depended on a single LGD bridge sample (maximum leverage = 1); sampling source remained confounded with normal-versus-lesion status. In 48 matched GSE117606 triplets, mean absolute changes were 0.534 for adenoma versus normal and 0.527 for CRC versus adenoma (late-minus-early difference −0.007, 95% patient-bootstrap CI −0.029 to 0.016; paired p = 0.541; Figure S5; Data S1). Across all nine FDR/effect threshold combinations in the original model, LGD versus normal retained the largest adjacent-stage count (1505–3863 genes; HGD versus LGD, 11–190; CRC versus HGD, 170–790). These are within-model count sensitivities; technical-model results are reported separately in Data S9.
Figure 2.
Stage-resolved transcriptomic changes in GSE41657 estimated using linear models adjusted for age and sex. (a) Adjacent-stage counts meeting FDR < 0.01 and absolute adjusted expression difference ≥ 1.0, with P values adjusted separately for each contrast using the Benjamini–Hochberg procedure across 19,529 genes. (b–d) Early-persistent, monotonic-progression and late/progression-specific trajectories: mean within-gene standardized expression and SEM across gene-specific group means. These plots are descriptive summaries of patterns defined within the original discovery model; scan-day, slide and sampling-source sensitivities are provided in Figure S5 and Data S1.
3.3. Stage-Pattern Analysis Separated Early-Persistent from Progression-Associated Programs
The fixed rules identified 1407 early-persistent genes (329 up and 1078 down), 1159 monotonic-progression genes (581 increasing and 578 decreasing), and 305 late/progression-specific genes (202 up and 103 down). The early-persistent and monotonic categories shared 382 genes. The average standardized expression trajectories followed the patterns specified by these definitions (Figure 2b–d). Under the unchanged full early-persistent rule, scan-day and slide models retained 221 and 59 genes overall, including 18/49 and 4/49 of the prioritized candidates (16/39 and 4/39 in the 39-gene subset). Direction of the normal–LGD effect was retained for all 49, but the slide-adjusted CRC-versus-normal direction reversed for ADH1B and TRIM29. Thus, normal–LGD direction was consistent across these models, while full stage classification was sensitive to technical adjustment (Data S1).
3.4. Functional Enrichment Identified Immune, Proliferative and Extracellular-Matrix Programs
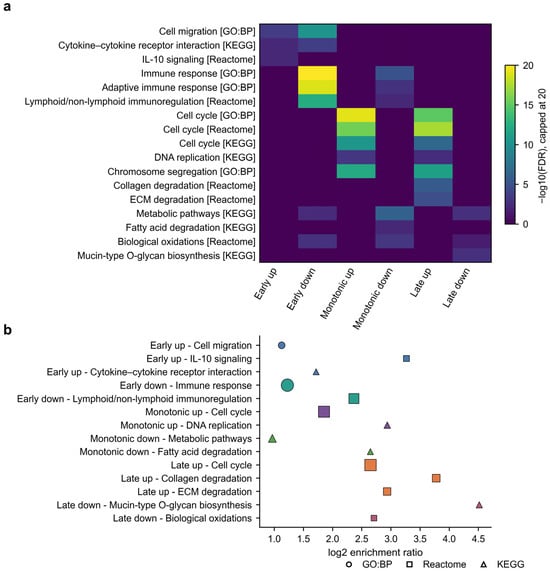
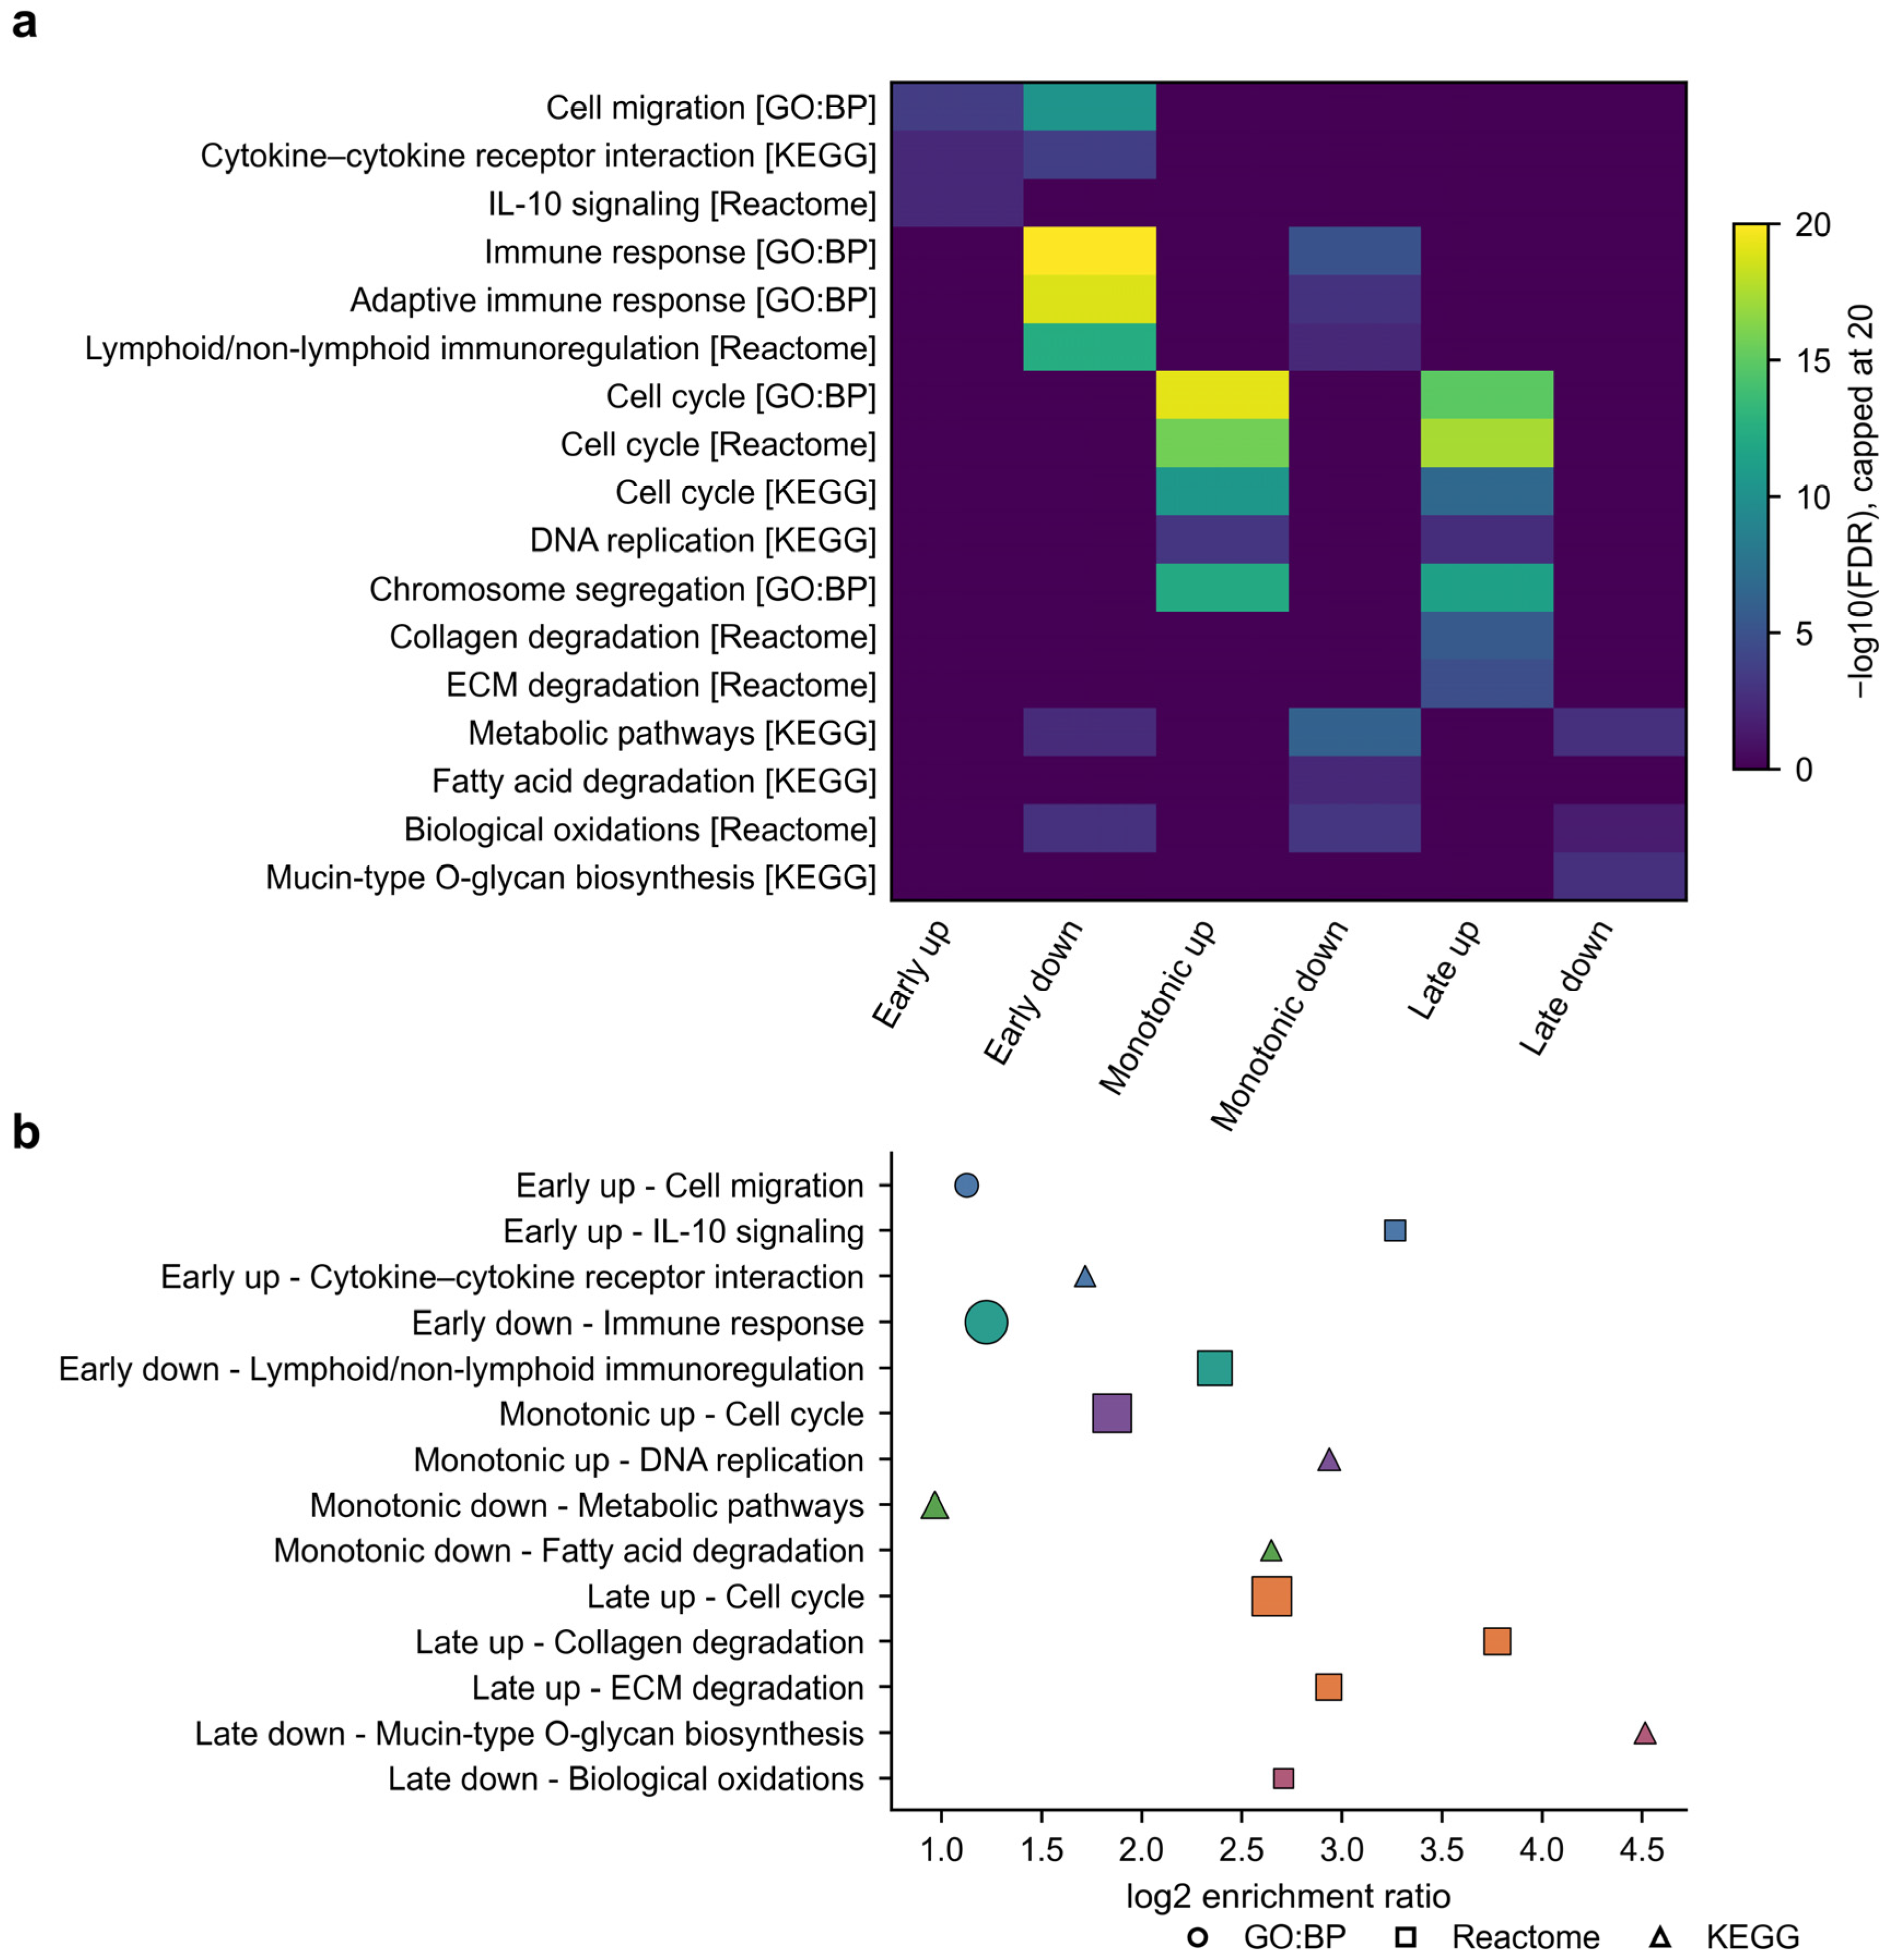
Early-up genes were enriched for cell migration, cytokine-receptor interaction and interleukin-10 signaling. The strongest early immune signal occurred among early-down genes. Enriched terms included immune response (FDR = 1.11 × 10⁻³¹) and immunoregulatory interactions between lymphoid and non-lymphoid cells (FDR = 3.84 × 10⁻¹³). Both monotonic-up and late-up genes were enriched for cell-cycle and DNA-replication programs. Late-up genes also showed enrichment for collagen and extracellular-matrix degradation. Monotonic-down and late-down genes were enriched for metabolic, oxidative and glycosylation-related programs (Figure 3; Data S7). These annotations connect the bulk-tissue patterns with immune-related functions, proliferation and extracellular-matrix remodeling.
Figure 3.
Functional enrichment of stage-resolved patterns. (a) Seventeen GO:BP, Reactome and KEGG terms. Quantitative colors show −log10(FDR) for FDR < 0.05, capped at 20; deep-purple background marks other combinations (nonsignificant or unreturned), not a uniform FDR = 1. (b) Fourteen terms; point area increases with −log10(FDR), capped at 20; shapes identify databases. Colors distinguish the expression patterns named on the y-axis. Full names, stable identifiers, verified gene intersections, and available FDR/background-status records are in Data S7. GO:BP, Gene Ontology Biological Process; ECM, extracellular matrix; IL-10, interleukin-10.
3.5. Patient-Matched GSE117606 Validation Retained 835 Early-Persistent Genes
Of the 1407 discovery genes, 1307 were measurable in GSE117606. Among these, 1182 (90.4%) showed the expected direction. In the 51 matched adjacent-mucosa/adenoma pairs, 835 genes also met paired candidate-family FDR < 0.05.
3.6. Paired RNA-Seq Provided Cross-Platform Replication and Enabled Candidate Locking
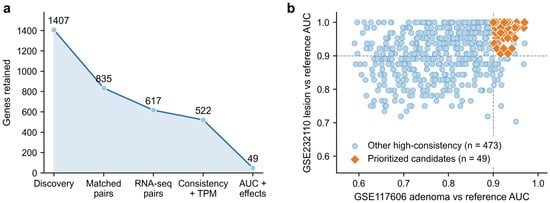
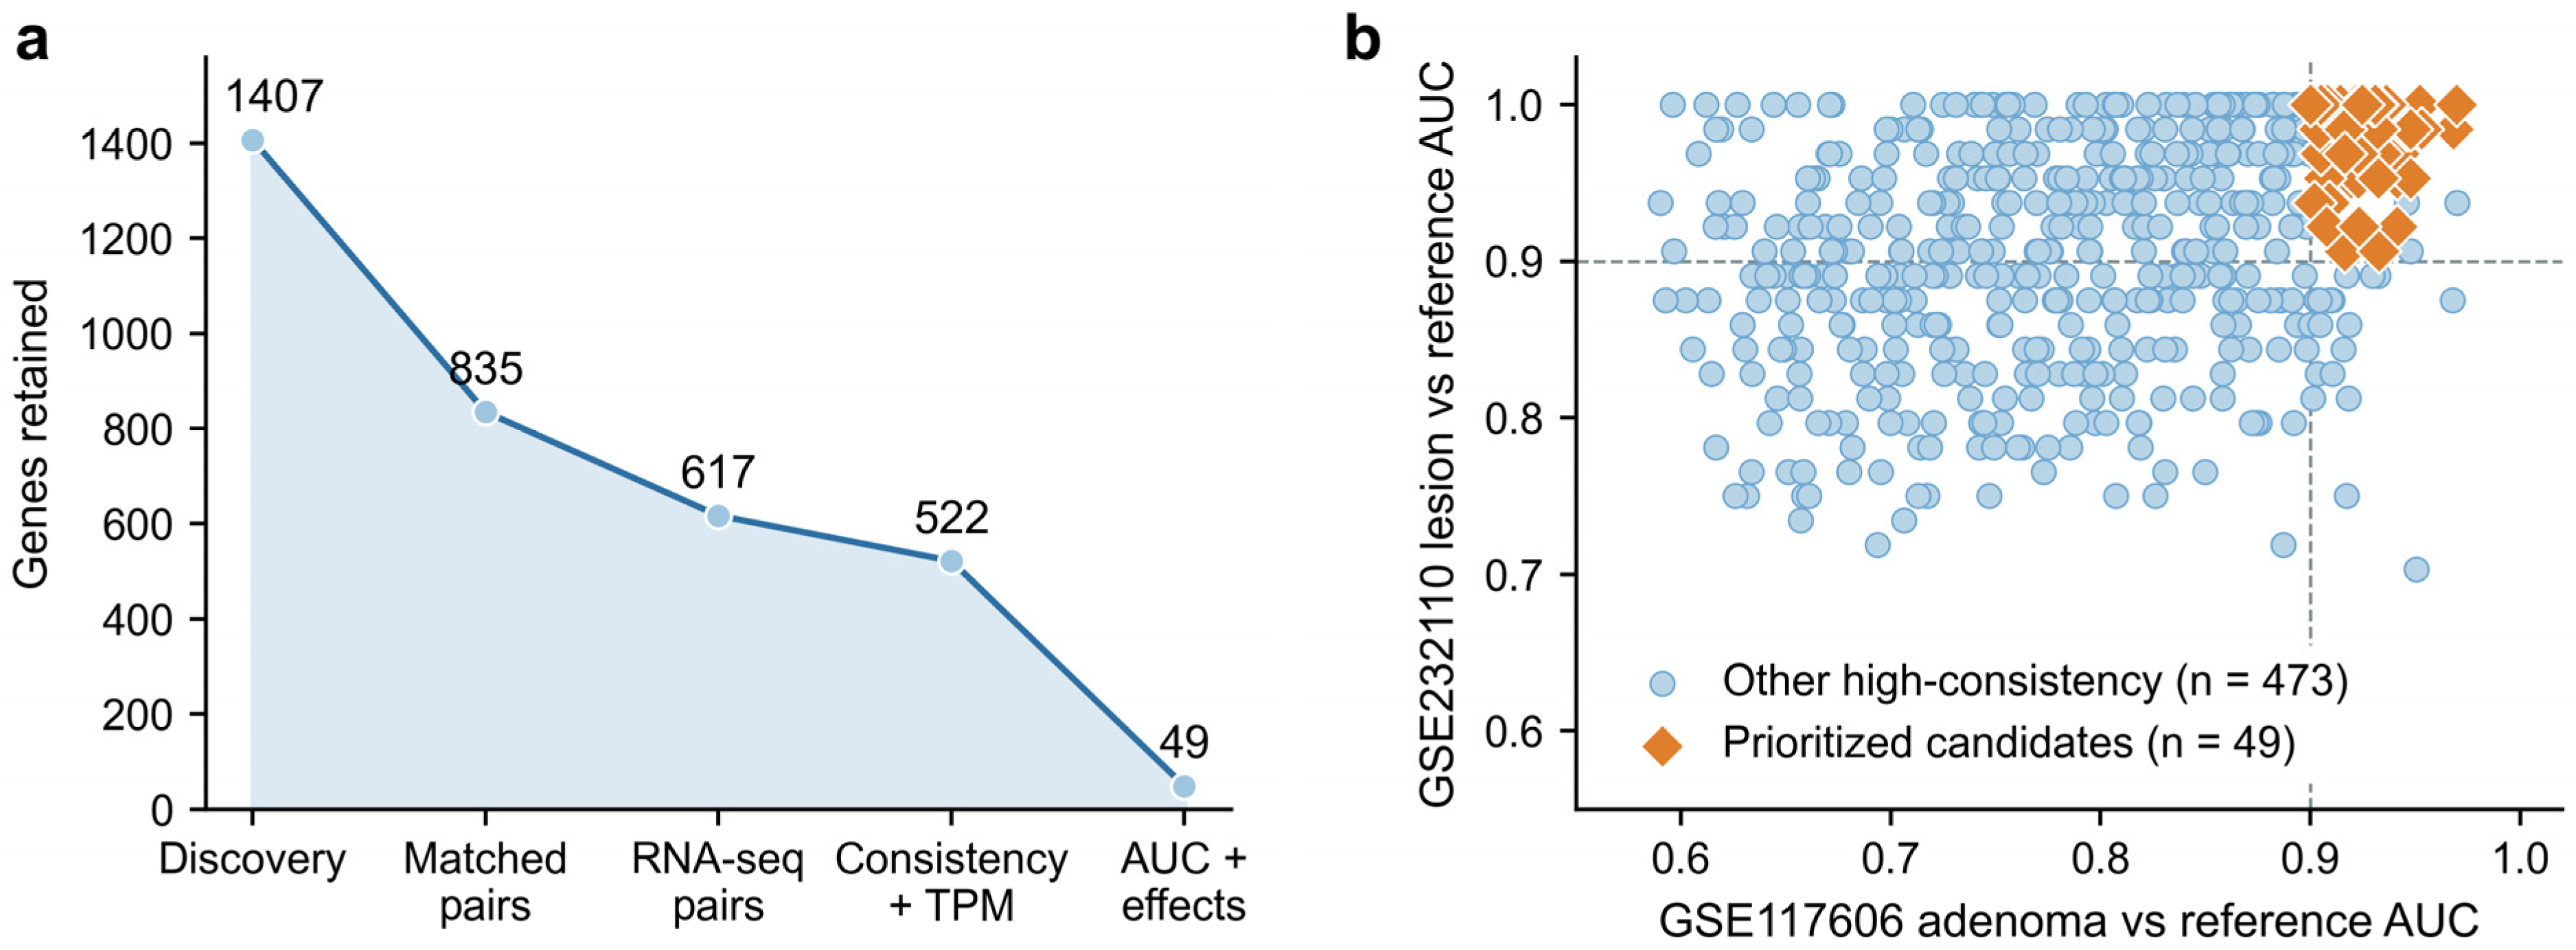
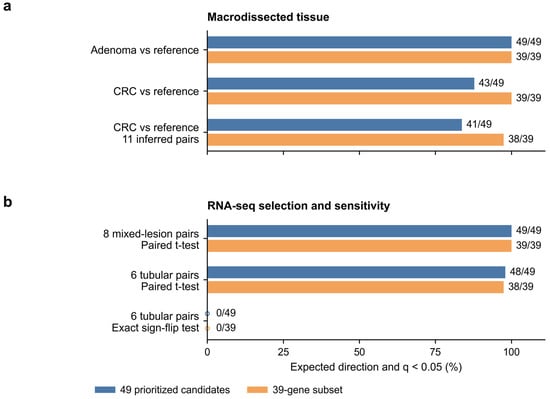
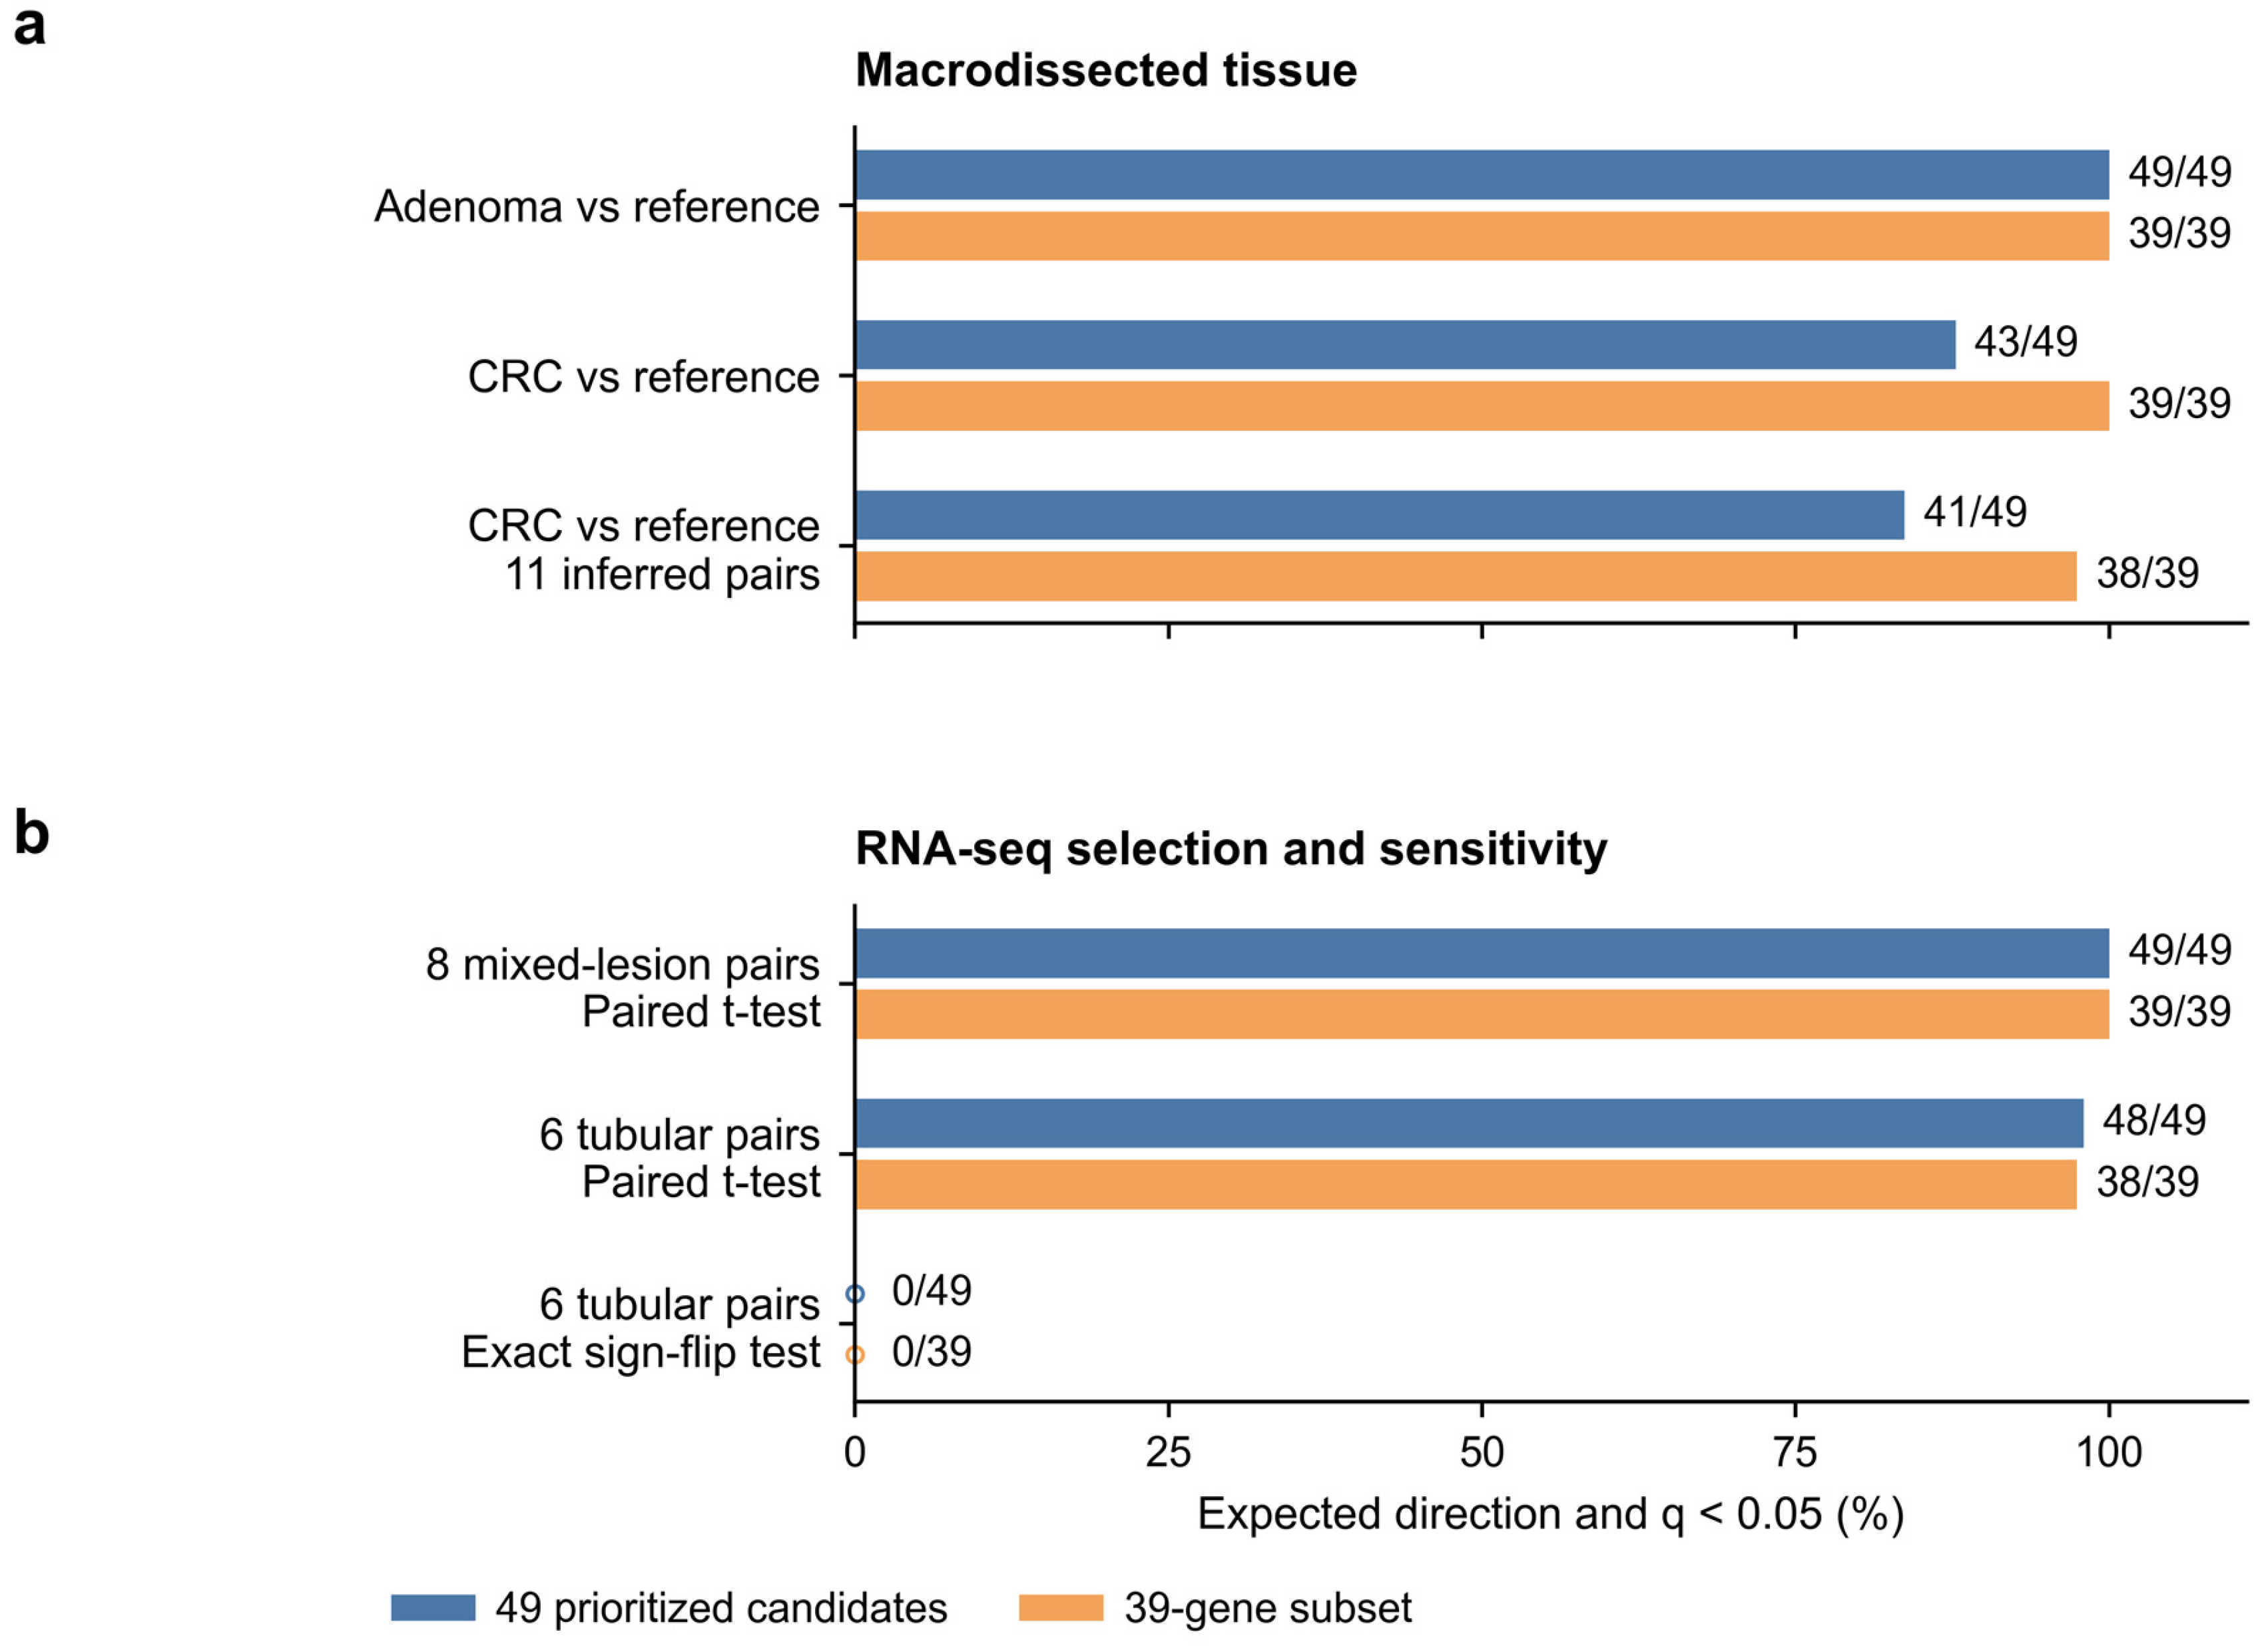
Of the 835 genes validated in GSE117606, 812 were unambiguously measurable in GSE232110. Of these, 803 retained the expected direction, and 617 also met candidate-family FDR < 0.05. Requiring direction agreement in at least seven of eight pairs and median TPM > 1 left 522 genes with high consistency. Applying the fixed AUC and effect-size criteria reduced this set to 49 genes before the GSE20916 analysis (Figure 4; Table 3). These eight-pair selection results include two serrated lesions. In the six tubular pairs, all 49 candidates retained direction, but 48/49 (38/39 in the subset) passed the paired t-test BH812; CLDN1 had an effect of 1.202 log2(TPM + 1) units (95% CI −0.018 to 2.422; q812 = 0.0698). Exact sign-flip BH812 supported 49/49 candidates in eight pairs and 0/49 in six pairs (minimum attainable two-sided raw P = 0.03125 in six pairs). Full-family BH60240 supported none of the 49 in either subset; the fixed expressed-family BH17597 supported 11/49 in eight pairs and none in six (Table 4; Figure S3; Data S3).
Figure 4.
Sequential candidate prioritization and cross-platform AUCs. (a) Numbers retained after five ordered, discrete steps: 1407 early-persistent discovery genes (GSE41657), 835 passing matched microarray selection (GSE117606), 617 passing RNA-seq selection (GSE232110), 522 meeting paired-direction agreement in at least 7/8 pairs and the TPM criterion, and 49 meeting AUC/effect-size criteria. Lines and fill emphasize this filtering sequence. (b) Tissue-expression AUCs for the 522 genes; orange diamonds identify the 49 prioritized candidates and blue circles the other 473. Dashed lines mark AUC = 0.90. Reference denotes adjacent mucosa in GSE117606 and adjacent/unaffected mucosa in GSE232110; the latter uses eight mixed-lesion pairs. Prioritization required AUC ≥ 0.90 in GSE41657 (LGD versus normal), GSE117606 and GSE232110; absolute paired Cohen’s dz ≥ 1 in GSE117606, and an absolute RNA-seq mean log2(TPM + 1) difference ≥ 1. The two plotted AUCs alone do not define membership. Prioritization preceded GSE20916 evaluation.
3.7. GSE20916 Macro Analysis Supported the 49 Candidate Adenoma Associations
All 49 fixed candidates retained the expected adenoma direction and met BH49 < 0.05 in the age/sex-adjusted macro analysis (24 normal and 44 adenoma source units); all also passed the 12,813-gene sensitivity analysis. In source-clustered CRC testing, 43/49 (39/39 in the subset) retained the expected direction and BH49 < 0.05; platform-family BH12813 supported 42/49 (38/39 in the subset). The 11 inferred paired CRC comparisons supported 41/49 (38/39 in the subset), with MEIS1 q49 = 0.175. Source labels were inferred from archived metadata. Microdissections provided complementary within-case profiles (Figure 5; Table 3; Figures S1, S2 and S6; Data S2, S4).
Figure 5.
Cross-cohort evidence for the 49 prioritized candidates and the 39-gene subset. Bars show the percentage within each set retaining the expected direction and q < 0.05; annotations give the passing count and denominator. The 39 genes are a subset of the 49, not a separate signature or independent validation sample. (a) GSE20916 macro: primary adenoma OLS (68 inferred source-by-phenotype units), secondary CRC source-clustered analysis (58 units; 48 inferred clusters), and paired CRC sensitivity (11 inferred pairs). All use BH correction across 49 candidates. (b) GSE232110 RNA-seq: eight mixed-lesion pairs used in selection, six tubular pairs tested by paired t-test, and six tubular pairs tested by exact sign flips; all use BH correction across 812 measurable candidates. With six pairs, the exact test comprises 64 sign assignments (minimum two-sided p = 0.03125); none of the 49 candidates passed BH correction across 812 measurable candidates. Microdissections are described separately in Figure S2; gene-level evidence is in Figure S1 and Data S2.
With the two effect cutoffs fixed at 1.0, changing the common AUC cutoff from 0.900 to 0.875 or 0.925 yielded 81 or 19 candidates, respectively, compared with the 49 prioritized candidates. Single effect-cutoff perturbations at AUC 0.900 yielded 42–51 candidates. Across all 27 combinations, counts ranged from 18 to 87, and Jaccard overlap with the fixed 49 ranged from 0.367 to 1.000. Every measurable alternative candidate retained the expected macro adenoma direction and passed both candidate-family and platform-family BH < 0.05; the 81-gene set contained one unmeasurable gene (RNF152), giving 80/80 measurable support. CRC candidate-family support ranged from 84.5% to 100%. These sensitivities distinguish membership stability from reproducibility of the expression changes (Data S9; Tables S3 and S4).
Table 3.
Candidate selection and macrodissection evaluation.
3.8. Published Adenoma Signatures and Tissue-State Associations Contextualized the Candidates
Thirty-six of 49 candidates (73.5%) overlapped the Sabates-Bellver adenoma list, all in the same direction (background 17,525 genes; conditional odds ratio 118.92, exact 95% CI 61.02–246.34; Fisher P = 6.32 × 10−48; two-publication q = 1.26 × 10−47). The corresponding subset overlap was 29/39 (q = 9.82 × 10−39). Pesson overlap comprised 5/49 and 2/39, also directionally concordant; the two-list unions were 37/49 and 29/39. These overlaps place the candidates within established adenoma expression programs (Figure S4; Data S5). In 48 matched triplets, mature epithelial scores decreased, and cycling scores increased in both adjacent contrasts; fibroblast scores decreased in adenoma and increased in CRC, whereas immune-score CIs included zero. Among 51 paired adenoma comparisons, four-score adjustment retained 49/49 significant candidates, while adding the mature epithelial score retained 30/49 (23/39 in the subset; BH49), all with the original direction. The median conditional-to-baseline effect ratio across the 49 was 0.354. The baseline and conditional effects target different estimands, as defined in Section 2.12 (Figure S7; Data S6). Within adenomas, 35/49 (25/39 in the subset) were associated with fibroblast scores at BH294 < 0.05 (Figure S8).
Table 4.
Selection evidence and sensitivity analyses for the 49 prioritized candidates.
3.9. Representative Candidates Illustrate Adenoma-Associated Expression Patterns
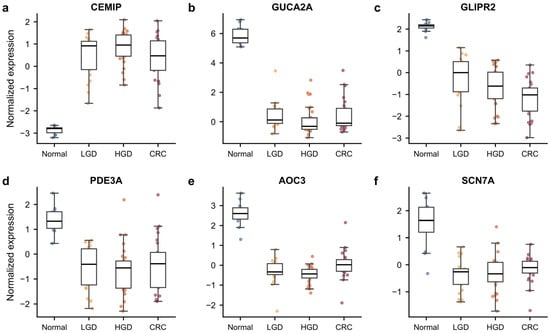
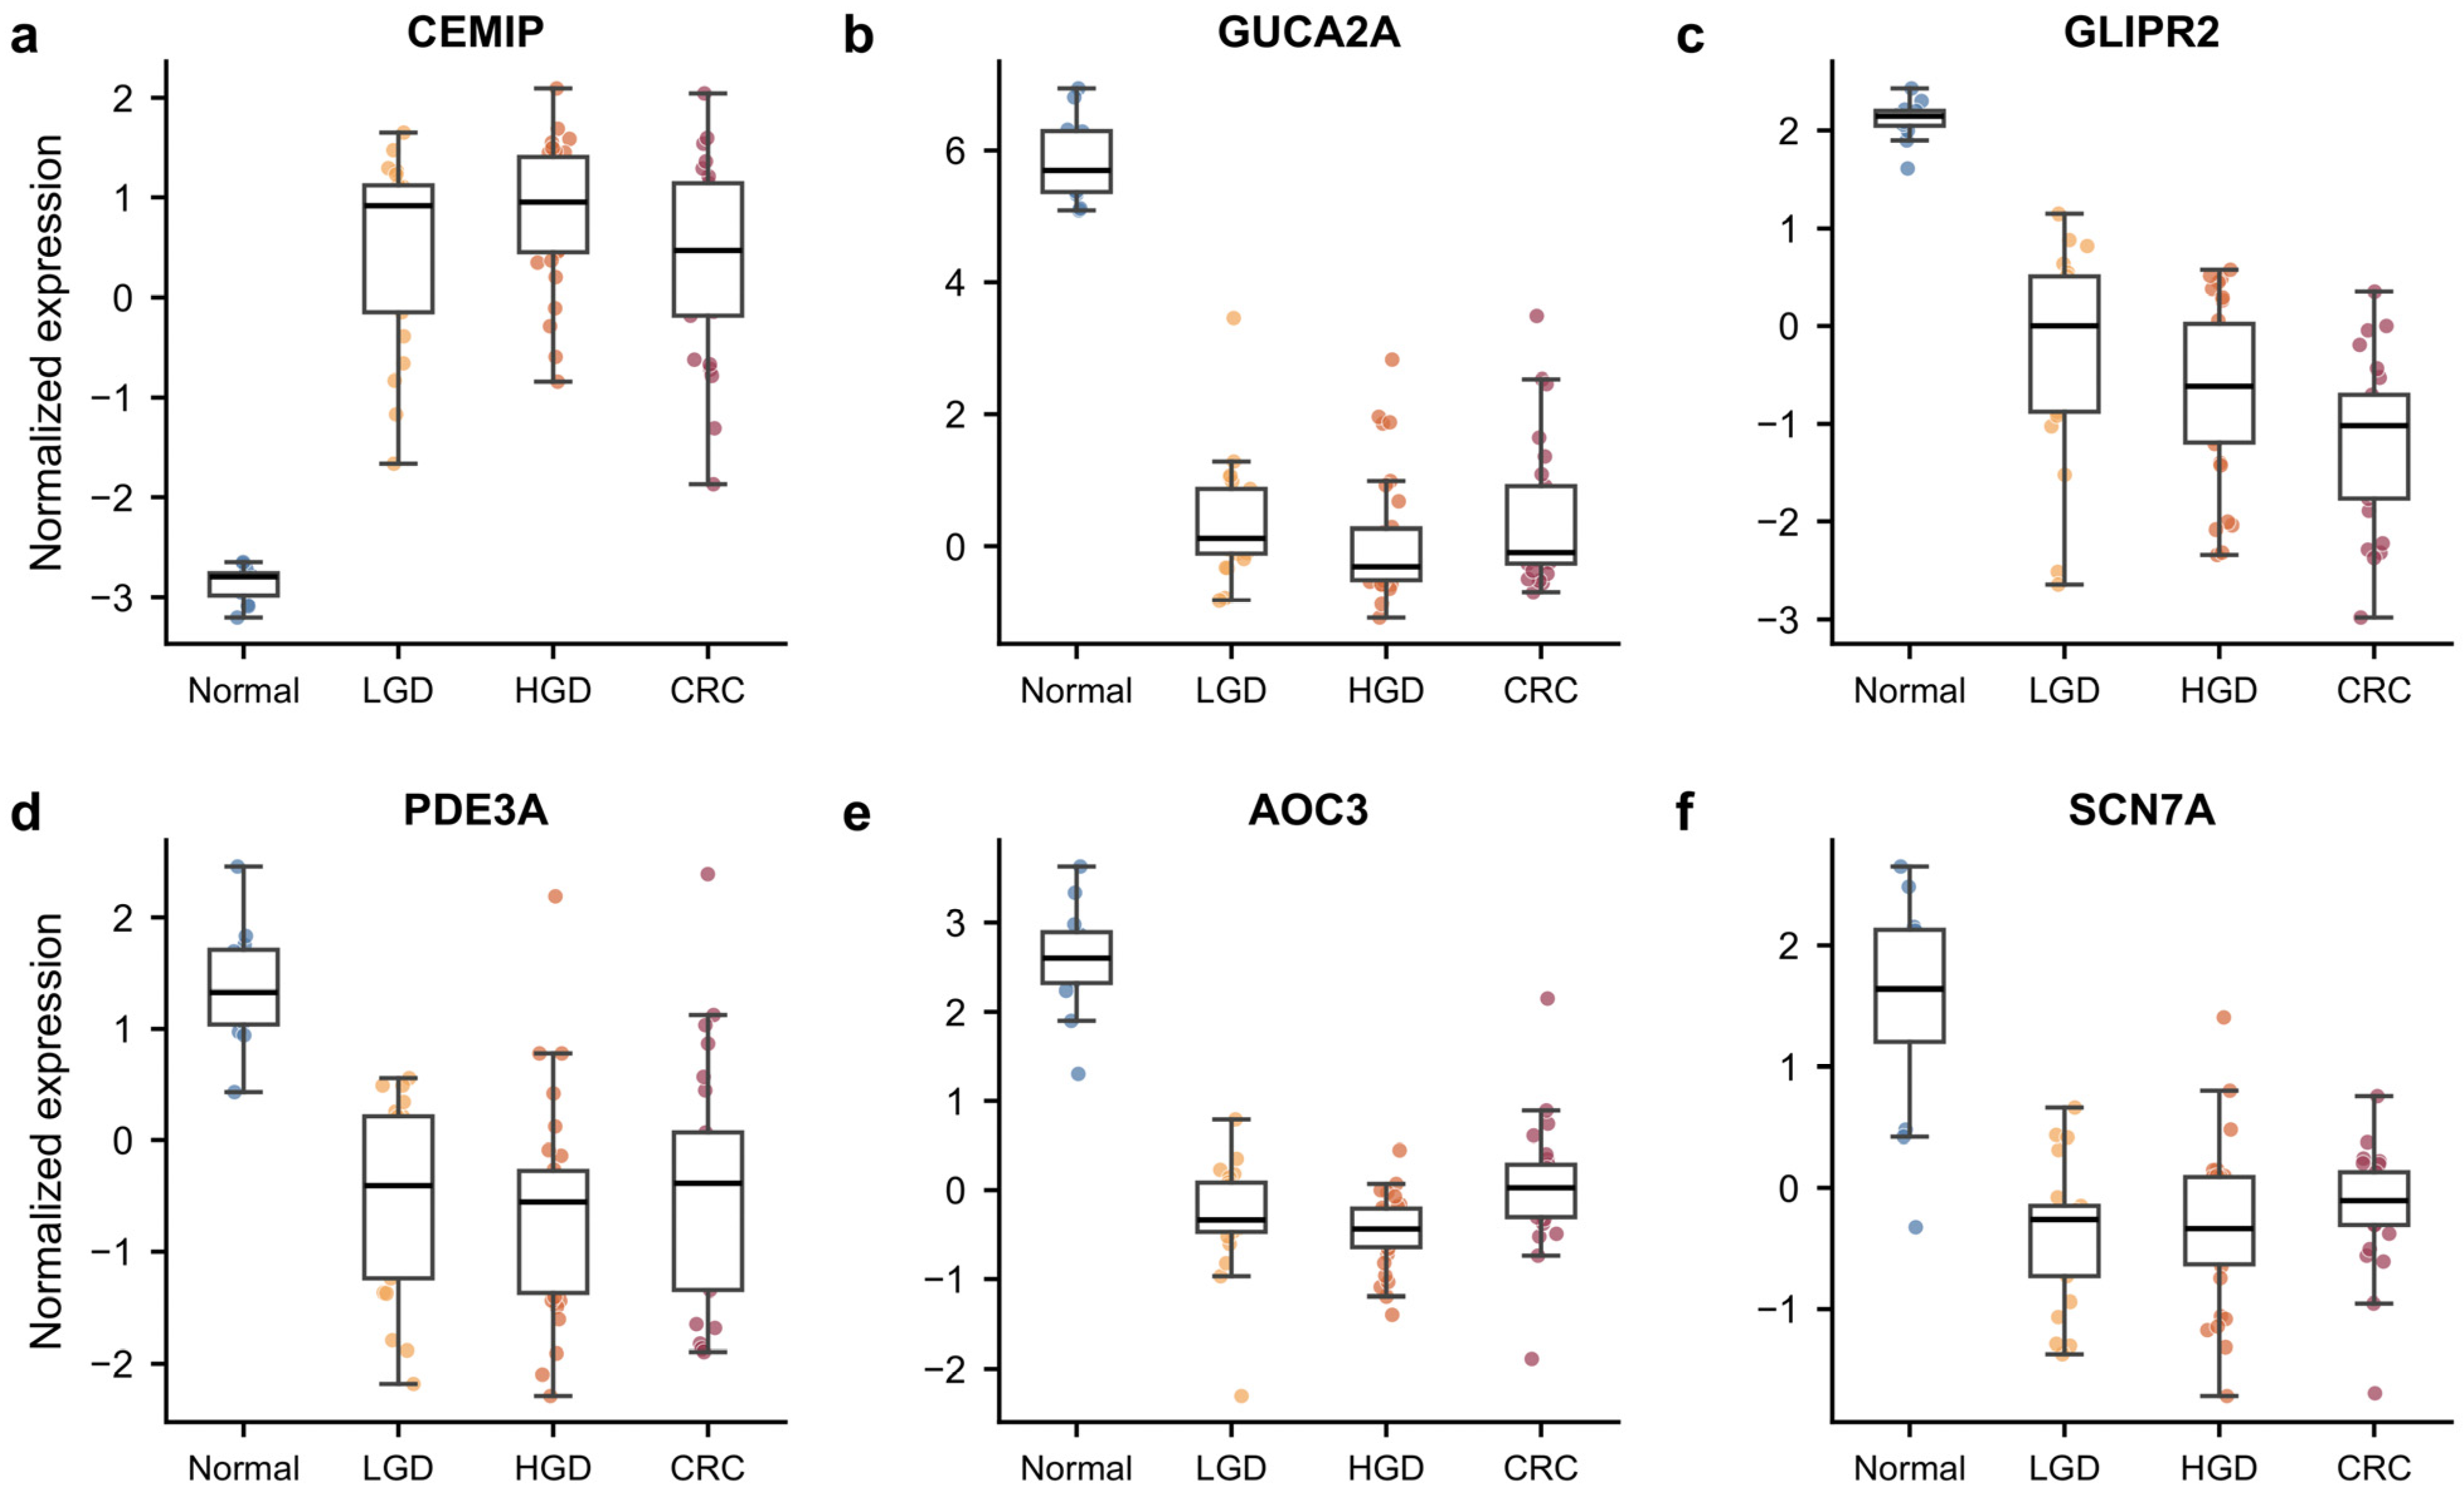
We plotted CEMIP and GUCA2A as examples with established biological relevance, alongside the less-studied candidates GLIPR2, PDE3A, AOC3 and SCN7A. Their discovery expression distributions and standardized trajectories illustrate the original tissue patterns (Figure 6; Figure S9), providing examples for the biological interpretation developed below. Table 5 summarizes the 39-gene subset using the common macro adenoma-versus-normal framework; full 49-gene evidence is provided in Supplementary Table S2 and Data S2.
Figure 6.
Representative early-persistent expression patterns in GSE41657. (a–f) Expression distributions for CEMIP, GUCA2A, GLIPR2, PDE3A, AOC3 and SCN7A (12 normal, 21 LGD, 30 HGD and 25 CRC tissues). Values are on the supplied GeneSpring GX 11.5 normalized microarray scale, using the within-sample median across probes mapped unambiguously to each gene, without an additional log or z transformation. Standardized trajectories are shown separately in Figure S9; model and sampling-source context is described in Section 2.2 and Section 3.3.
Table 5.
Expression and annotated functions of the 39-gene subset.
4. Discussion
4.1. Early Lesion-Associated Expression Changes Were Reproduced Across Datasets
The original GSE41657 threshold counts closely matched the source report of 2322 mRNA changes during the normal-to-adenoma transition [5]. The four-dataset framework extends this observation by separating stage-pattern discovery from sequential external replication and final assessment of a fixed candidate set. Our analysis asks whether early lesion-associated expression changes persist and reproduce across cohorts and platforms. Concordant expression directions, final macro adenoma support and extensive overlap with established adenoma signatures connect the 49 candidates to reproducible tissue programs. Their epithelial and stromal associations further provide biological context for candidate prioritization.
4.2. Interpretation of Discovery Samples and Validation Reference Tissues
The tight cluster of normal samples in GSE41657 coincided with processing and tissue-source structure. Recovered scan-day/slide covariates permitted sensitivity models, but normal–LGD estimation depended on a single LGD bridge sample, and normal/lesion sampling sources remained confounded. Consequently, the largest discovery DEG count should not be interpreted as the largest biological stage transition. External paired comparisons are most informative about the reproducibility of lesion-associated expression direction. The CRC direction reversals for ADH1B and TRIM29 in the slide model also show that stage-persistence classification is more model-sensitive than the normal–LGD direction.
GSE117606 and GSE232110 used adjacent or unaffected-appearing mucosa. Field effects may shift expression in these reference samples toward the lesion state [25,26]. This can reduce lesion-reference differences and lower apparent AUC compared with independent normal tissue. We therefore emphasize agreement in direction across datasets, rather than directly comparing AUC values. The heterogeneous GSE41657 HGD category includes severe atypia and carcinoma in situ. This may blur the HGD-LGD and CRC-HGD contrasts and contribute to the small number of genes identified between later adjacent categories.
4.3. Epithelial Differentiation and Stromal State Contextualize the Expression Patterns
The enrichment results linked early expression changes to tissue state and monotonic/late-up genes to cell cycle and DNA replication, with extracellular-matrix degradation also enriched among late-up genes. The strongest early immune annotation occurred among early-down genes. External-marker analyses linked the candidate signal to mature epithelial differentiation and stromal state: mature scores fell across both matched contrasts, while fibroblast scores decreased in adenoma and rebounded in carcinoma. This pattern is compatible with the cell-state/composition continuum described in colorectal single-cell studies [11] and the diversity of healthy colonic epithelium [23]. Together, the results place these bulk-expression changes in the context of epithelial differentiation and microenvironment remodeling. Early-down immune enrichment concerns the full 1078-gene discovery pattern rather than the 49 candidates alone. Immune-score change CIs included zero in the matched triplets, so the enrichment is best interpreted as a tissue-program annotation rather than evidence of generalized immune-cell depletion. Macro/micro differences can also reflect regional sampling and epithelial enrichment; the single-case micro profiles describe this sampling context without supplying independent patient replication.
After composition and mature-score adjustment, 23/39 genes in the 39-gene subset remained significant in 51 pairs. The median conditional-to-baseline effect ratio across all 49 was 0.354. The baseline is the mean paired difference, whereas the adjusted intercept predicts the difference at zero uncentered marker change. These different estimands and the use of expression-based proxies preclude interpreting the ratio as a cell-fraction change or mediated fraction. The macro explanatory model retained 40/49 (32/39 in the subset) after mature-score adjustment, indicating cohort dependence. The further cycling model required extrapolation beyond the joint observed zero-change support in the paired cohort (Data S6).
The digestive-tumor super-enhancer review [12], linc01615/miR-491-5p perturbation experiments in CRC cells [13], and liraglutide/PI3K/AKT/mTOR experiments in CRC cells [14] provide complementary examples of how regulatory activity alters cancer-cell behavior.
4.4. Candidate Prioritization and the Scope of Validation
The sequential design maintains a fixed candidate-selection history before final assessment in GSE20916. GSE117606 and GSE232110 contributed to prioritization, whereas GSE20916 was held back. Successive filtering for direction, significance, abundance, AUC and effect size favors large, consistent signals, so high subsequent pass rates should be interpreted in that context. The macro adenoma result was supported under both candidate-family and actual platform-family BH correction. RNA direction was consistent across all 49 candidates in six tubular pairs, while significance varied with pathology subset, test assumptions and FDR family. Exact BH812 supported 0/49 in six pairs, where the minimum attainable two-sided raw P was 0.03125. This combination of directional consistency and test-dependent significance defines the scope of the cross-platform evidence. Threshold perturbation showed that the exact candidate list depends especially on the common AUC requirement, while macro adenoma support persisted across the tested measurable sets. The 49 prioritized candidates provide a fixed comparison set; their exact membership is not unique or optimized, and the 39-gene subset is reported separately.
4.5. Known and Less-Studied Candidates Provide Biological Context
The candidates include genes already associated with early colorectal neoplasia. CEMIP was identified in colorectal adenoma [6], and functional work in BRAF-mutant colorectal cancer cells and intestinal organoids links it to Wnt-dependent MEK–ERK signaling [27]. Loss of GUCA2A protein has been demonstrated in tubular and serrated adenomas and MSI tumors [28]. ADH1B and CEACAM7 have prior links to colorectal stromal biology and early adenoma-related deregulation, respectively [29,30]. Reduced PDE3A expression has been observed in non-neoplastic-appearing mucosa from patients with colorectal neoplasia [26]. AOC3 has mechanistic links to colitis-associated tumorigenesis [31], and SCN7A downregulation has been reported in CRC tissue [32]. The 36/49 and 29/39 concordant Sabates-Bellver overlaps place much of the signal within established adenoma biology. Candidates outside these published lists provide additional targets for the literature assessment and functional follow-up; list non-overlap alone is not evidence of novelty.
4.6. Translational Relevance and Next Steps
Tissue-expression discrimination provides a starting point for biomarker prioritization. Translation to non-invasive detection depends on cellular shedding, lesion size and location, nucleic-acid stability, background material and assay limits. A recent tissue-to-stool mRNA study found that performance for advanced adenoma can be weaker than tissue comparisons suggest [33]. Targeted experimental confirmation and prospective testing in the intended specimen will therefore be needed to assess clinical utility.
4.7. Strengths and Limitations
Strengths of this study include fixed pattern definitions, a traceable candidate-selection history, paired comparisons and evaluation across four public datasets. GSE20916 provided final assessment without adding new candidates, and machine-readable results allow the reported associations and sensitivities to be examined at gene level. The retrospective cohorts differed in collection and preprocessing. Discovery batch and tissue source remained confounded, macro patient identities were inferred, and the single-case microdissections provided descriptive evidence. The RNA cohort comprised eight lesion pairs, including six tubular pairs, limiting precision and exact-test resolution. Marker scores describe bulk-expression states rather than measured cell fractions and leave cellular origin and lesion-intrinsic regulation unresolved. Prospective replication and functional studies will be needed to establish clinical utility and mechanisms.
5. Conclusions
The four-dataset analysis identifies recurrent adenoma-associated tissue-expression changes, with consistent candidate directions across microarray and RNA-seq data and support for all 49 candidates in the final macro adenoma comparison. Substantial overlap with published adenoma signatures and associations with mature epithelial and stromal states place these candidates within established biological programs of colorectal neoplasia. The 49-gene candidate set, with the 39-gene subset reported separately, provides a resource for biological prioritization and targeted follow-up. Stage-specific interpretation remains conditional on discovery batch and sampling structure; prospective and functional studies can assess the translational potential of individual candidates.
Supplementary Materials
The following supporting information can be downloaded at: https://www.mdpi.com/article/10.3390/cimb48111256/s1.
Author Contributions
Conceptualization: J.X., J.L. and L.W.; methodology, J.X. and L.W.; software, J.X.; formal analysis, J.X.; data curation, J.X.; visualization, J.X.; writing—original draft preparation, J.X.; writing—review and editing, J.X., J.L. and L.W.; supervision, J.L. and L.W. L.W. also contributed to project administration and funding acquisition. All authors have read and agreed to the published version of the manuscript.
Funding
This research was supported by the Clinical Research Innovation Plan of Shanghai General Hospital, grant number CTCCR-2021B06, the Shanghai Rising-Star Program, grant number 23QA1407900, and the Shanghai Oriental Talent Program (2023-24).
Institutional Review Board Statement
The study was conducted in accordance with the Declaration of Helsinki. As the data were obtained from publicly accessible databases and were fully de-identified, the research was exempt from ethics committee review in accordance with Article 32 of the Measures for Ethical Review of Life Science and Medical Research Involving Humans (2023) issued by the National Health Commission of the People’s Republic of China and relevant authorities.
Informed Consent Statement
An informed consent statement was not required for this study, as the data were obtained from publicly accessible databases and were fully de-identified, in accordance with Article 32 of the Measures for Ethical Review of Life Science and Medical Research Involving Humans (2023), issued by the National Health Commission and relevant authorities of the People’s Republic of China.
Data Availability Statement
The analyzed datasets are publicly available from NCBI GEO under accession numbers GSE41657, GSE117606, GSE232110 and GSE20916 [15,16,17,18] https://www.ncbi.nlm.nih.gov/geo (accessed on 29 August 2026). Data S1–S10 provide the corrected candidate evidence, sensitivity results, marker resources, enrichment intersections and provenance. Analysis code, input-version inventories and execution instructions are provided in Data S8. The candidate-selection specification in Data S8 documents the internal selection sequence.
Acknowledgments
During preparation of this manuscript, the authors used OpenAI ChatGPT (GPT-5.6 Sol) for language refinement, document organization and code review. The authors reviewed and edited the output, verified the analyses, numerical results, references and interpretations, and take full responsibility for the content of this publication.
Conflicts of Interest
The authors declare no conflicts of interest.
Abbreviations
AUC, area under the receiver operating characteristic curve; BH, Benjamini–Hochberg; CDF, chip definition file; CI, confidence interval; CIS, carcinoma in situ; CRC, colorectal cancer; ECM, extracellular matrix; FDR, false discovery rate; GEO, Gene Expression Omnibus; GO, Gene Ontology; HGD, high-grade dysplasia; KEGG, Kyoto Encyclopedia of Genes and Genomes; LGD, low-grade dysplasia; PCA, principal component analysis; RMA, robust multi-array average; ROC, receiver operating characteristic; RNA-seq, RNA sequencing; TPM, transcripts per million.
References
- Sung, H.; Filho, A.M.; Laversanne, M.; Ferlay, J.; Siegel, R.L.; Soerjomataram, I.; Jemal, A.; Bray, F. Global cancer statistics 2024: GLOBOCAN estimates of incidence and mortality worldwide for 34 cancers in 186 countries. CA Cancer J. Clin. 2026, 76, e70090. [Google Scholar] [CrossRef] [Scilit] [PubMed]
- Fearon, E.R.; Vogelstein, B. A genetic model for colorectal tumorigenesis. Cell 1990, 61, 759–767. [Google Scholar] [CrossRef] [Scilit] [PubMed]
- Winawer, S.J.; Zauber, A.G.; Ho, M.N.; O’Brien, M.J.; Gottlieb, L.S.; Sternberg, S.S.; Waye, J.D.; Schapiro, M.; Bond, J.H.; Panish, J.F.; et al. Prevention of colorectal cancer by colonoscopic polypectomy. N. Engl. J. Med. 1993, 329, 1977–1981. [Google Scholar] [CrossRef] [Scilit] [PubMed]
- Zauber, A.G.; Winawer, S.J.; O’Brien, M.J.; Lansdorp-Vogelaar, I.; van Ballegooijen, M.; Hankey, B.F.; Shi, W.; Bond, J.H.; Schapiro, M.; Panish, J.F.; et al. Colonoscopic polypectomy and long-term prevention of colorectal-cancer deaths. N. Engl. J. Med. 2012, 366, 687–696. [Google Scholar] [CrossRef] [Scilit] [PubMed]
- Shi, X.; Zhang, Y.; Cao, B.; Lu, N.; Feng, L.; Di, X.; Han, N.; Luo, C.; Wang, G.; Cheng, S.; et al. Genes involved in the transition from normal epithelium to intraepithelial neoplasia are associated with colorectal cancer patient survival. Biochem Biophys. Res. Commun. 2013, 435, 282–288. [Google Scholar] [CrossRef] [Scilit] [PubMed]
- Sabates-Bellver, J.; Van der Flier, L.G.; de Palo, M.; Cattaneo, E.; Maake, C.; Rehrauer, H.; Laczko, E.; Kurowski, M.A.; Bujnicki, J.M.; Menigatti, M.; et al. Transcriptome profile of human colorectal adenomas. Mol. Cancer Res. 2007, 5, 1263–1275. [Google Scholar] [CrossRef] [Scilit] [PubMed]
- Pan, Z.; He, Y.; Zhu, W.; Xu, T.; Hu, X.; Huang, P. A dynamic transcription factor signature along the colorectal adenoma-carcinoma sequence in patients with co-occurrent adenoma and carcinoma. Front. Oncol. 2021, 11, 597447. [Google Scholar] [CrossRef] [Scilit] [PubMed]
- Elsayed, I.; Li, L.; Sheahan, K.; Moran, B.; Bakheit, S.; Wang, X. Adenoma to carcinoma: A portrait of molecular and immunological profiles of colorectal sporadic tumors. Int. Immunopharmacol. 2021, 100, 108168. [Google Scholar] [CrossRef] [Scilit] [PubMed]
- Al Shboul, S.; Awad, H.; Abu-Humaidan, A.; Ababneh, N.A.; Khasawneh, A.I.; Saleh, T. Oncogene-induced senescence transcriptomes signify premalignant colorectal adenomas. Curr. Issues Mol. Biol. 2025, 47, 221. [Google Scholar] [CrossRef] [Scilit] [PubMed]
- Skrzypczak, M.; Goryca, K.; Rubel, T.; Paziewska, A.; Mikula, M.; Jarosz, D.; Pachlewski, J.; Oledzki, J.; Ostrowski, J. Modeling oncogenic signaling in colon tumors by multidirectional analyses of microarray data directed for maximization of analytical reliability. PLoS ONE 2010, 5, e13091, Correction in PLoS ONE 2010, 5. https://doi.org/10.1371/annotation/8c585739-a354-4fc9-a7d0-d5ae26fa06ca. [Google Scholar] [CrossRef] [Scilit] [PubMed]
- Becker, W.R.; Nevins, S.A.; Chen, D.C.; Chiu, R.; Horning, A.M.; Guha, T.K.; Laquindanum, R.; Mills, M.; Chaib, H.; Ladabaum, U.; et al. Single-cell analyses define a continuum of cell state and composition changes in the malignant transformation of polyps to colorectal cancer. Nat. Genet. 2022, 54, 985–995. [Google Scholar] [CrossRef] [Scilit] [PubMed]
- Li, X.-P.; Qu, J.; Teng, X.-Q.; Zhuang, H.-H.; Dai, Y.-H.; Yang, Z.; Qu, Q. The Emerging Role of Super-enhancers as Therapeutic Targets in The Digestive System Tumors. Int. J. Biol. Sci. 2023, 19, 1036–1048. [Google Scholar] [CrossRef] [Scilit] [PubMed]
- Xiao, Y.; Hu, F.; Li, M.; Mo, L.; Xu, C.; Wang, X.; Nie, J.; Yang, L.; Xie, B. Interaction between linc01615 and miR-491-5p regulates the survival and metastasis of colorectal cancer cells. Transl. Cancer Res. 2020, 9, 2638–2647. [Google Scholar] [CrossRef] [Scilit] [PubMed]
- Tong, G.; Peng, T.; Chen, Y.; Sha, L.; Dai, H.; Xiang, Y.; Zou, Z.; He, H.; Wang, S. Effects of GLP-1 Receptor Agonists on Biological Behavior of Colorectal Cancer Cells by Regulating PI3K/AKT/mTOR Signaling Pathway. Front. Pharmacol. 2022, 13, 901559. [Google Scholar] [CrossRef] [Scilit] [PubMed]
- NCBI Gene Expression Omnibus. GSE41657: Gene Expression Profiling of Colorectal Normal Mucosa, Adenoma and Adenocarcinoma Tissues. Available online: https://www.ncbi.nlm.nih.gov/geo/query/acc.cgi?acc=GSE41657 (accessed on 29 August 2026).
- NCBI Gene Expression Omnibus. GSE117606: Gene Expression Data of Patients with Concurrent Colorectal Adenomas and Colorectal Tumors, Including Adjacent Tissue. Available online: https://www.ncbi.nlm.nih.gov/geo/query/acc.cgi?acc=GSE117606 (accessed on 29 August 2026).
- NCBI Gene Expression Omnibus. GSE232110: Biomarkers of Colorectal Precancerous Lesions. Available online: https://www.ncbi.nlm.nih.gov/geo/query/acc.cgi?acc=GSE232110 (accessed on 29 August 2026).
- NCBI Gene Expression Omnibus. GSE20916: Modeling Oncogenic Signaling in Colon Tumors by Multidirectional Microarray Analyses. Available online: https://www.ncbi.nlm.nih.gov/geo/query/acc.cgi?acc=GSE20916 (accessed on 29 August 2026).
- Kolberg, L.; Raudvere, U.; Kuzmin, I.; Adler, P.; Vilo, J.; Peterson, H. G:Profiler—Interoperable web service for functional enrichment analysis and gene identifier mapping (2023 update). Nucleic Acids Res. 2023, 51, W207–W212. [Google Scholar] [CrossRef] [Scilit] [PubMed]
- Frankish, A.; Diekhans, M.; Jungreis, I.; Lagarde, J.; Loveland, J.E.; Mudge, J.M.; Sisu, C.; Wright, J.C.; Armstrong, J.; Barnes, I.; et al. GENCODE 2021. Nucleic Acids Res. 2021, 49, D916–D923. [Google Scholar] [CrossRef] [Scilit] [PubMed]
- Pesson, M.; Volant, A.; Uguen, A.; Trillet, K.; De La Grange, P.; Aubry, M.; Daoulas, M.; Robaszkiewicz, M.; Le Gac, G.; Morel, A.; et al. A Gene Expression and Pre-mRNA Splicing Signature That Marks the Adenoma-Adenocarcinoma Progression in Colorectal Cancer. PLoS ONE 2014, 9, e87761. [Google Scholar] [CrossRef] [Scilit] [PubMed]
- Becht, E.; Giraldo, N.A.; Lacroix, L.; Buttard, B.; Elarouci, N.; Petitprez, F.; Selves, J.; Laurent-Puig, P.; Sautès-Fridman, C.; Fridman, W.H.; et al. Estimating the population abundance of tissue-infiltrating immune and stromal cell populations using gene expression. Genome Biol. 2016, 17, 218, Erratum in Genome Biol. 2016, 17, 249. [Google Scholar] [CrossRef] [Scilit] [PubMed]
- Parikh, K.; Antanaviciute, A.; Fawkner-Corbett, D.; Jagielowicz, M.; Aulicino, A.; Lagerholm, C.; Davis, S.; Kinchen, J.; Chen, H.H.; Alham, N.K.; et al. Colonic epithelial cell diversity in health and inflammatory bowel disease. Nature 2019, 567, 49–55. [Google Scholar] [CrossRef] [Scilit] [PubMed]
- Brown, G.R.; Hem, V.; Katz, K.S.; Ovetsky, M.; Wallin, C.; Ermolaeva, O.; Tolstoy, I.; Tatusova, T.; Pruitt, K.D.; Maglott, D.R.; et al. Gene: A gene-centered information resource at NCBI. Nucleic Acids Res. 2015, 43, D36–D42. [Google Scholar] [CrossRef] [Scilit] [PubMed]
- Jaiswal, S.; The, S.; Chang, T.S.; Shi, J.; Wang, T.D. Identification of tumor initiating cells and early marker genes in histologically normal colonic mucosa that lead to neoplastic transformation. Neoplasia 2026, 75, 101300. [Google Scholar] [CrossRef] [Scilit] [PubMed]
- Mahmood, B.; Damm, M.M.B.; Jensen, T.S.R.; Backe, M.B.; Dahllöf, M.S.; Poulsen, S.S.; Bindslev, N.; Hansen, M.B. Phosphodiesterases in non-neoplastic appearing colonic mucosa from patients with colorectal neoplasia. BMC Cancer 2016, 16, 938. [Google Scholar] [CrossRef] [Scilit] [PubMed]
- Duong, H.Q.; Nemazanyy, I.; Rambow, F.; Tang, S.C.; Delaunay, S.; Tharun, L.; Florin, A.; Büttner, R.; Vandaele, D.; Close, P.; et al. The Endosomal Protein CEMIP Links WNT Signaling to MEK1-ERK1/2 Activation in Selumetinib-Resistant Intestinal Organoids. Cancer Res. 2018, 78, 4533–4548. [Google Scholar] [CrossRef] [Scilit] [PubMed]
- Bashir, B.; Merlino, D.J.; Rappaport, J.A.; Gnass, E.; Palazzo, J.P.; Feng, Y.; Fearon, E.R.; Snook, A.E.; Waldman, S.A. Silencing the GUCA2A-GUCY2C tumor suppressor axis in CIN, serrated, and MSI colorectal neoplasia. Hum. Pathol. 2019, 87, 103–114. [Google Scholar] [CrossRef] [Scilit] [PubMed]
- Villéger, R.; Chulkina, M.; Mifflin, R.C.; Markov, N.S.; Trieu, J.; Sinha, M.; Johnson, P.; Saada, J.I.; Adegboyega, P.A.; Luxon, B.A.; et al. Loss of alcohol dehydrogenase 1B in cancer-associated fibroblasts: Contribution to the increase of tumor-promoting IL-6 in colon cancer. Br. J. Cancer 2023, 128, 537–548. [Google Scholar] [CrossRef] [Scilit] [PubMed]
- Schölzel, S.; Zimmermann, W.; Schwarzkopf, G.; Grunert, F.; Rogaczewski, B.; Thompson, J. Carcinoembryonic antigen family members CEACAM6 and CEACAM7 are differentially expressed in normal tissues and oppositely deregulated in hyperplastic colorectal polyps and early adenomas. Am. J. Pathol. 2000, 156, 595–605. [Google Scholar] [CrossRef] [Scilit] [PubMed]
- Özcan, Ö.; Akyol, Ö.; Akyol, A. Amine oxidase, copper containing 3 (Aoc3) knockout mice are more prone to DSS-induced colitis and colonic tumorigenesis. In Vivo 2024, 38, 2300–2309. [Google Scholar] [CrossRef] [Scilit] [PubMed]
- Ostasiewicz, B.; Ostasiewicz, P.; Duś-Szachniewicz, K.; Ostasiewicz, K.; Ziółkowski, P. Quantitative analysis of gene expression in fixed colorectal carcinoma samples as a method for biomarker validation. Mol. Med. Rep. 2016, 13, 5084–5092. [Google Scholar] [CrossRef] [Scilit] [PubMed]
- Liu, H.; Hansen, L.; Song, C.; Lin, H.; Chen, D.; Chen, Z.; Zhou, H.; Yang, X.; Pan, W.; Du, J. Bioinformatic screen with clinical validation for the identification of novel stool based mRNA biomarkers for the detection of colorectal lesions including advanced adenoma. Sci. Rep. 2025, 15, 29397. [Google Scholar] [CrossRef] [Scilit] [PubMed]

Disclaimer/Publisher’s Note: The statements, opinions and data contained in all publications are solely those of the individual author(s) and contributor(s) and not of MDPI and/or the editor(s). MDPI and/or the editor(s) disclaim responsibility for any injury to people or property resulting from any ideas, methods, instructions or products referred to in the content. |
© 2026 by the authors. Licensee MDPI, Basel, Switzerland. This article is an open access article distributed under the terms and conditions of the Creative Commons Attribution (CC BY) license.