


Abstract
Schisandrin B (Sch B) is an active lignan derived from the Chinese herb Schisandra chinensis and exhibits multi-target anti-tumor activity. However, the mechanism and effect of Sch B in reversing temozolomide (TMZ) resistance in glioblastoma (GBM) remain unclear. In this study, through transcriptome screening, it was found that KCNB1 (Kv2.1) is the only common differentially expressed gene regulated by Sch B and TMZ alone or in combination. Database analysis revealed that its expression is downregulated in GBM and is closely related to poor prognosis and TMZ resistance in patients. In the TMZ-resistant cell line induced by U87, KCNB1 also shows a low expression level. The results of in vitro experiments indicated that the combined treatment of Sch B and TMZ can significantly upregulate KCNB1 and Kv2.1 expression and thereby regulate the AMPK/mTOR signaling axis (increased p-AMPK level and decreased p-mTOR level), induce lethal autophagy (increased LC3B-II/I ratio and increased p62 degradation), inhibit the proliferation of resistant cells, promote apoptosis, and restore TMZ sensitivity. Knockdown of KCNB1, the use of a Kv2.1-specific inhibitor, or the AMPK inhibitor Compound C can partially reverse these effects. The in vivo nude mouse xenograft tumor model further confirmed that the combined treatment can significantly inhibit tumor growth, upregulate the expression of KCNB1 in tumor tissues, activate the AMPK/mTOR pathway, and enhance autophagy levels. In summary, this study first reveals that Sch B upregulates KCNB1 to activate the AMPK/mTOR pathway and induces lethal autophagy, thereby reversing TMZ resistance in GBM, providing experimental evidence for the clinical application of Sch B as a TMZ sensitizer.
1. Introduction
Glioblastoma is the most common malignant primary brain tumor in adults, accounting for approximately 65% of adult central nervous system tumors [1]. The current standard treatment for this malignant tumor involves a combination of surgical resection, radiotherapy, and chemotherapy [2]. However, the prognosis for patients with glioblastoma is poor, with a median overall survival of less than 15 months [3]. Although temozolomide (TMZ) is widely used as a first-line chemotherapy drug in the treatment of GBM, 60–75% of patients will develop varying degrees of resistance during or after treatment, leading to tumor recurrence and poor prognosis [4,5,6,7]. Therefore, developing effective strategies to reverse TMZ resistance is of great significance for improving the clinical outcomes of patients with GBM.
Schisandrin B (Sch B) is a biphenylcyclooctadiene lignan compound isolated from the Chinese medicinal herb Schisandra chinensis, and it exhibits various pharmacological activities such as liver protection, antioxidation, and neuroprotection [8]. Sch B can induce cell cycle arrest and inhibit the proliferation of various tumor cells, including liver cancer [9], breast cancer [10], prostate cancer [11], and glioma [12,13]. In glioma, Sch B can induce apoptosis of U251 and U87 cells by reducing mitochondrial membrane potential and by downregulating HOTAIR expression, and it can inhibit cell migration and invasion [14]. Additionally, as a multidrug resistance reversal agent, Sch B can reverse tumor multidrug resistance by inhibiting P-gp and MRP1 efflux pumps and inducing cell cycle arrest and apoptosis [15]. Tan et al. reported that Sch B can inhibit the proliferation of liver cancer cells through ROS-mediated autophagy and Th1/Th2 immune imbalance [16]. In our previous research [17], it was also found that Sch B combined with TMZ can induce G2/M phase arrest in U87 cells by activating the p53/p21 pathway, and promote cell apoptosis through ROS-mediated mitochondrial dysfunction and caspase cascade reaction. However, the specific mechanism by which Sch B reverses TMZ resistance in glioblastoma has not been elucidated.
Autophagy is a conserved catabolic process that can break down damaged proteins and organelles, thereby maintaining cellular homeostasis [18]. It has a dual impact on oncogenic growth, depending on the type of tumor and the microenvironment [19]. In the early stages of tumor development, autophagy plays a protective role, inhibiting tumor progression and metastasis. However, in the advanced stage of tumors, autophagy supports the survival and spread of tumors and is upregulated under stress conditions such as nutrient deprivation and chemotherapy-induced cell damage [20]. Autophagy plays a crucial role in chemotherapy resistance, maintaining cancer cell survival and promoting proliferation, while inhibiting autophagy can reduce tumor metastasis by regulating reactive oxygen species (ROS) [21]. Studies have shown that TMZ treatment can induce protective autophagy in GBM cells, and autophagy inhibitors (such as 3-MA, CQ) can restore TMZ sensitivity by blocking autophagy [22]. The AMPK/mTOR signaling pathway is the core hub that integrates energy metabolism and autophagy regulation. Activation of AMPK can inhibit the activity of mTOR complex 1 (mTORC1), thereby relieving its negative regulation on ULK1 and initiating the autophagy cascade [23]. Previous studies have shown that Sch B can induce autophagy in vitro by inhibiting the mTOR signaling pathway [24]. Given that autophagy plays a crucial regulatory role in chemotherapy resistance of tumors, we hypothesize that the lethal autophagy induced by Sch B may participate in reversing TMZ resistance by regulating the KCNB1/Kv2.1-AMPK/mTOR signaling axis.
2. Materials and Methods
2.1. Cell Culture
The human glioblastoma U87 cell line and the TMZ-resistant U87 cell line (U87-TMZ) were purchased from Meisen CTCC (Hangzhou, Zhejiang Province, China). U87-TMZ was supplied as a TMZ-resistant derivative of U87; no additional selection was performed in our laboratory. Cells were cultured in DMEM supplemented with 10% FBS and 1% penicillin/streptomycin at 37 °C in a humidified incubator with 5% CO2. U87-TMZ cells were routinely maintained in medium containing 20 µmol/L TMZ to preserve the resistant phenotype, and were cultured in drug-free medium for 24 h before drug treatment in all experimental assays to eliminate residual drug interference.
In the inhibitor experiments, all inhibitors were dissolved in DMSO, while in the control experiments, the same volume of DMSO was used. The cells were treated at 37 °C for 6 h and were then treated with autophagy inhibitors 3-methyladenine (3-MA, 1 mmol/L), autophagy flow blocker chloroquine (CQ, 25 µmol/L), Kv2.1-specific inhibitor (50 nmol/L), and AMPK inhibitor Compound C (10 µmol/L), following the same procedure as the subsequent protocols.
2.2. Animal Experiments and Xenograft Tumor Models
Four- to six-week-old BALB/c-nu nude mice (purchased from Wukong Biotechnology, Jiangsu, China) and mice of the same strain (used as a baseline control for metabolomics) were raised in a specific pathogen-free (SPF) environment under isoflurane anesthesia for inoculation, with no unexpected adverse events observed, and humane endpoints (tumor volume > 2000 mm3, body weight loss > 20%, or severe distress) monitored daily for health and every 3 days for tumor volume and body weight. Logarithmic growth phase U87 cells were collected, adjusted to a density of 5 × 10⁷ cells/mL, and subcutaneously inoculated into the right axilla of the nude mice to establish a xenograft tumor model. When the tumor volume reached approximately 100 mm3, the nude mice were randomly divided into the following groups (n = 6 per group): control group, Sch B monotherapy group (100 mg/kg), TMZ monotherapy group (50 mg/kg), and Sch B + TMZ combination group (100 mg/kg + 50 mg/kg). Each group was treated with the corresponding drug. After the experiment, the nude mice were sacrificed, the tumor tissues were removed and weighed, some tissues were fixed in 4% paraformaldehyde for immunohistochemical detection, and the rest were frozen at −80 °C for Western blot analysis. To minimize potential confounders, mice were randomly assigned to groups, cage location and treatment order were kept consistent, and tumor volume and body weight were measured at fixed intervals by the same investigator. The investigators performing drug administration were aware of group allocation, whereas those responsible for tumor measurement and outcome assessment were blinded; data analysis was performed by an investigator blinded to group identity. No a priori inclusion or exclusion criteria were established, and no animals, experimental units, or data points were excluded from the analysis.
2.3. Total RNA Extraction and Transcriptome Analysis
Total RNA was extracted from mouse tumor tissues using TRIzol® reagent TRIzol® reagent (Invitrogen, Carlsbad, CA, USA), and the RNA concentration and integrity were evaluated using the Illumina TruSeq™ RNA Sample Preparation Kit (Illumina, San Diego, CA, USA). Three biological replicates were included per group (a total of 12 samples). The construction and sequencing of the RNA-seq libraries were performed on the Illumina NovaSeq 6000 platform at Shanghai Meiji Biomedical Technology Co., Ltd. (Shanghai, China). A total of 76.93 Gb of clean data was obtained, with each sample generating at least 5.94 Gb of clean data, and the percentage of Q30 bases was above 95.62%. The raw data were quality-controlled using the FASTP software (version 0.23.4), and the high-quality reads after filtering were aligned to the reference genome using the HISAT2 software (version 2.2.1). The reference genome was derived from the Ensembl genome database (Homo_sapiens, GRCh38.p14; https://mart.ensembl.org/Homo_sapiens/Info/Index, accessed on 3 March 2026), and the gene expression levels were quantified using the TPM (transcripts per million) method. Differentially expressed genes were identified using DESeq2 (version 1.42.0) with the screening criteria for differentially expressed genes were a corrected p value (padj) < 0.05, |log2 fold-change| > 1, and FDR-corrected p value < 0.05. A Venn diagram was constructed using Venny 2.1 to screen for DEGs common to different treatment groups.
2.4. Non-Targeted LC–MS Metabolomics Analysis
Serum samples from nude mice were taken, and protein precipitation was performed using a mixture of methanol and acetonitrile (1:1, v/v). The supernatant was then freeze-dried after centrifugation at 4 °C for 20 min. The metabolites in the samples were analyzed using the UHPLC-Q-TOF/MS system. Both positive and negative ion modes were detected using electrospray ionization (ESI) technology. The structure of the metabolites was determined through precise mass matching (<25 ppm) and secondary mass spectrometry analysis. After preprocessing the data with Pareto scaling, orthogonal partial least squares discriminant analysis (OPLS-DA) was performed using the R software (version 3.3.1) to identify the differentially expressed metabolites. Variables with a projection importance (VIP) > 1 and a p value < 0.05 were selected as the criteria for differentially expressed metabolites. Metabolic pathway enrichment analysis was completed using the KEGG database and the Meigebio Cloud platform.
2.5. Bioinformatics Analysis
The expression level of KCNB1 in glioblastoma (GBM) was analyzed using the TCGA (The Cancer Genome Atlas) database and the GEPIA (Gene Expression Profiling Interactive Analysis) database (http://gepia.cancer-pku.cn/, accessed on 10 March 2026). The expression differences in KCNB1 in tumor tissues and normal tissues were visualized using box plots. One-way ANOVA was used for inter-group comparisons, and a p value < 0.05 was considered statistically significant.
2.6. Survival Prognosis Analysis
The expression level of KCNB1 in GBM patients was evaluated using the Starbase database (http://starbase.sysu.edu.cn/, accessed on 15 March 2026). The patients were divided into a high-expression group and a low-expression group based on the median expression level of KCNB1. The Kaplan–Meier method was used to draw the overall survival (OS) curve, and the log-rank test was used to compare the survival differences between the two groups. A risk ratio (HR), 95% confidence interval (CI), and p < 0.05 were considered statistically significant.
2.7. Cell Viability Detection (CCK-8)
The parental U87 cells and U87-TMZ cells were seeded in 96-well plates at 5 × 10³ cells per well. After 24 h of cell attachment and culture, the corresponding drugs were administered (TMZ monotherapy group (200 μM); Sch B monotherapy group (200 μg/mL); combined-treatment group (200 μm TMZ + 200 μg/mL Sch B co-treatment)). For the functional rescue assays, U87-TMZ cells were pre-treated with the autophagy inhibitor 3-methyladenine (3-MA, 1 mmol/L; MedChemExpress, HY-19312) or the AMPK inhibitor Compound C (10 µmol/L; MedChemExpress, HY-13418) for 2 h prior to treatment with Sch B, TMZ, or their combination for 48 h. Parallel wells treated with 3-MA alone, Compound C alone, or vehicle DMSO (0.1% v/v) were included as controls. After the experiment, 10 µL of CCK-8 solution was added to each well, and the absorbance value at 450 nm wavelength was measured using a microplate reader. Cell viability was determined relative to the control group. IC50 values were calculated by non-linear regression using the [Inhibitor] vs. response—variable slope (four parameters) model in GraphPad Prism 8.0, with the bottom and top constrained to 0.0 and 100.0, respectively, and 95% confidence intervals were calculated using the profile likelihood method.
2.8. Cell Transfection and Gene Knockdown
Small interfering RNA targeting human KCNB1 (si-KCNB1) and non-targeting negative control siRNA (si-NC) were synthesized (GenePharma, Shanghai, China). The siRNA sequences were as follows: si-KCNB1 sense, 5′-CCAUUCUGCCAUACUAUGUCA-3′ and antisense, 5′-ACAUAGUAUGGCAGAAUGGCC-3′; si-NC sense, 5′-UUCUCCGAACGUGUCACGUTT-3′ and antisense, 5′-ACGUGACACGUUCGGAGAATT-3′. Logarithmic-phase U87 cells were seeded in 6-well plates. When the fusion rate reached 70–80%, Lipofectamine 3000 transfection reagent was used to transfect si-KCNB1 or si-NC into the cells. After 6 h of transfection, fresh culture medium was replaced, and the cells were cultured for 48 h before collection. The knockdown efficiency was verified by qPCR.
2.9. Cell Cloning Experiment
The transfected U87 cells were digested and counted, and 800 cells per well were inoculated into a 12-well plate. The culture medium was changed every 3 days and the culture was continued for 14 days. When the number of clones in each well reached approximately 50, the culture medium was discarded followed by washing twice with PBS, fixing for 20 min with 4% paraformaldehyde, and staining for 20 min with 0.1% crystal violet. The residual staining solution was washed off, cells were dried, and a photo was taken. ImageJ software (version 1.54g) was used to count the number of clones.
2.10. Cell Apoptosis Detection
The cells to be tested were collected and washed with PBS, then 5-100,000 cells were centrifuged and resuspended in 195 μL of Annexin V-FITC binding solution. Then, 5 μL of Annexin V-FITC and 10 μL of PI were added and gently mixed, followed by incubation at room temperature in the dark for 10–20 min, placing on ice, and then using the flow cytometer for detection.
2.11. Immunofluorescence
After fixation, permeabilization, and blocking of each group of U87 cells, the LC3B primary antibody (1:200; Cat. No. A7198, ABclonal, Wuhan, China) was added and incubated at 4 °C overnight. The cells were then incubated with Alexa Fluor 488-conjugated goat anti-rabbit IgG secondary antibody (1:500; Cat. No. ab150077, Abcam, Cambridge, UK) at room temperature in the dark for 1 h. After DAPI staining of cell nuclei, cells were observed and photographed under an inverted fluorescence microscope (IX73, Olympus, Tokyo, Japan) equipped with a 40× objective lens. To ensure unbiased quantitative comparison, all imaging parameters were kept strictly identical across all experimental groups, with a fixed exposure time of 200 ms for the green channel (Alexa Fluor 488), 50 ms for the blue channel (DAPI), and a constant detector gain of 1.0 for both channels. The fluorescence intensity was analyzed using ImageJ software.
2.12. Autophagy of Cells
The cells were inoculated on the culture plate and treated accordingly. The cells in the induction group were treated with Earle’s balanced salt solution (EBSS) and incubated at 37 °C, 5% CO2 in a culture box for 1–4 h to induce autophagy; the cells in the control group were cultured normally. Then, 1 mL of MDC staining solution was added to each well, and the cells were incubated at 37 °C in the dark for 30 min. The staining solution was removed, and the cells were washed 3 times with Assay Buffer at room temperature. A 1 mL volume of Assay Buffer was added to each well, and the cells were observed and photographed under a fluorescence microscope.
2.13. Immunohistochemistry
The paraffin sections of mouse tumors were dehydrated, hydrated, and subjected to antigen retrieval (citrate buffer, microwave heating) afterward. Then, 3% H2O2 was used to block endogenous peroxidase, and 3% BSA was used for blocking at room temperature for 30 min. The primary antibody anti-KCNB1 (1:200; Cat. No. 19963-1-AP, Proteintech, Wuhan, China) was added and incubated at 4 °C overnight, and the HRP-conjugated goat anti-rabbit IgG secondary antibody (1:1000; Cat. No. ab6721, Abcam, Cambridge, UK) was incubated at room temperature for 50 min. DAB was used for staining, and hematoxylin was used for counterstaining. The sections were dehydrated and sealed.
2.14. Real-Time Fluorescence Quantitative PCR (qPCR)
Cells were collected from each group, then RNA was extracted using the TRIzol method and reverse transcribed into cDNA. Then, qPCR amplification was performed using the SYBR Green method to detect the mRNA expression levels of KCNB1, MDR1, MRP5, and LRP1 genes. GAPDH was used as the internal reference, and the relative expression of the target genes was calculated using the 2−ΔΔCt method. The primer sequences are shown in Table 1.
Table 1.
Primers used in the study.
2.15. Western Blot Detection
Cell and clinical tumor tissue samples were collected from the mice, total protein was extracted using RIPA lysis buffer (containing protease inhibitors), and the protein concentration was determined using the BCA method. Equal amounts of protein were taken and separated via SDS-PAGE electrophoresis, then transferred to a PVDF membrane. After incubating with 5% skimmed milk at room temperature for 2 h, the following primary antibodies were added at 4 °C overnight: anti-KCNB1 (1:1000; Cat. No. 19963-1-AP, Proteintech, Wuhan, China), anti-AMPK (1:5000; Cat. No. 10929-2-AP, Proteintech), anti-p-AMPK (Thr172, 1:1000; Cat. No. 80209-6-RR, Proteintech), anti-mTOR (1:2000; Cat. No. A2445, ABclonal, Wuhan, China), anti-p-mTOR (Ser2448, 1:1000; Cat. No. AP0094, ABclonal), anti-LC3B (1:1000; Cat. No. A7198, ABclonal), anti-p62 (1:1000; Cat. No. A7758, ABclonal), and anti-GAPDH (1:10,000; Cat. No. AC001, ABclonal). The next day, membranes were washed with TBST 3 times and incubated with HRP-conjugated goat anti-rabbit IgG secondary antibody (1:5000; Cat. No. ab6721, Abcam, Cambridge, UK) at room temperature for 1 h. The ECL chemiluminescence method was used for imaging, and the gray value was analyzed using ImageJ software.
2.16. Statistical Analysis
All experiments were independently repeated at least 3 times. Data are expressed as mean ± standard deviation (mean ± SD). Statistical analysis was performed using GraphPad Prism 9.5. Two groups were compared using the two-tailed Student’s t-test, and multiple groups were compared using one-way ANOVA. A post hoc Tukey test was used. p < 0.05 was considered statistically significant.
3. Results
3.1. Screening and Identification of KCNB1, Expression Characteristics and Prognosis Analysis
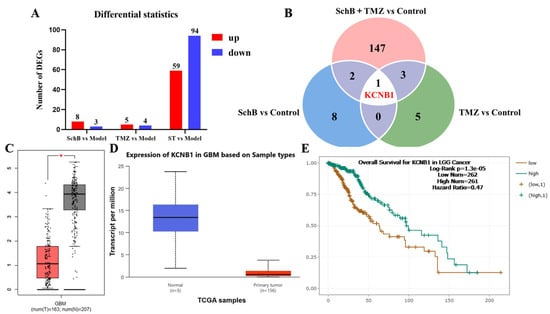
To investigate the regulatory effects of Sch B and TMZ alone and in combination on the differentially expressed genes (DEGs) in glioma cells, transcriptome analysis was conducted to compare the number of differentially expressed genes in each treatment group and the model group (Figure 1A). The results showed that, compared with the control group, the number of differentially expressed genes in the Sch B monotherapy group (100 mg/kg) was relatively small (eight upregulated, three downregulated); the number of differentially expressed genes in the TMZ monotherapy group (50 mg/kg) was also low (five upregulated, four downregulated). However, the number of differentially expressed genes in the Sch B and TMZ combination group (100 mg/kg Sch B + 50 mg/kg TMZ) significantly increased, with a total of 59 upregulated genes and 94 downregulated genes, suggesting that the combination regimen can more extensively regulate the expression of tumor-related genes.
Figure 1.
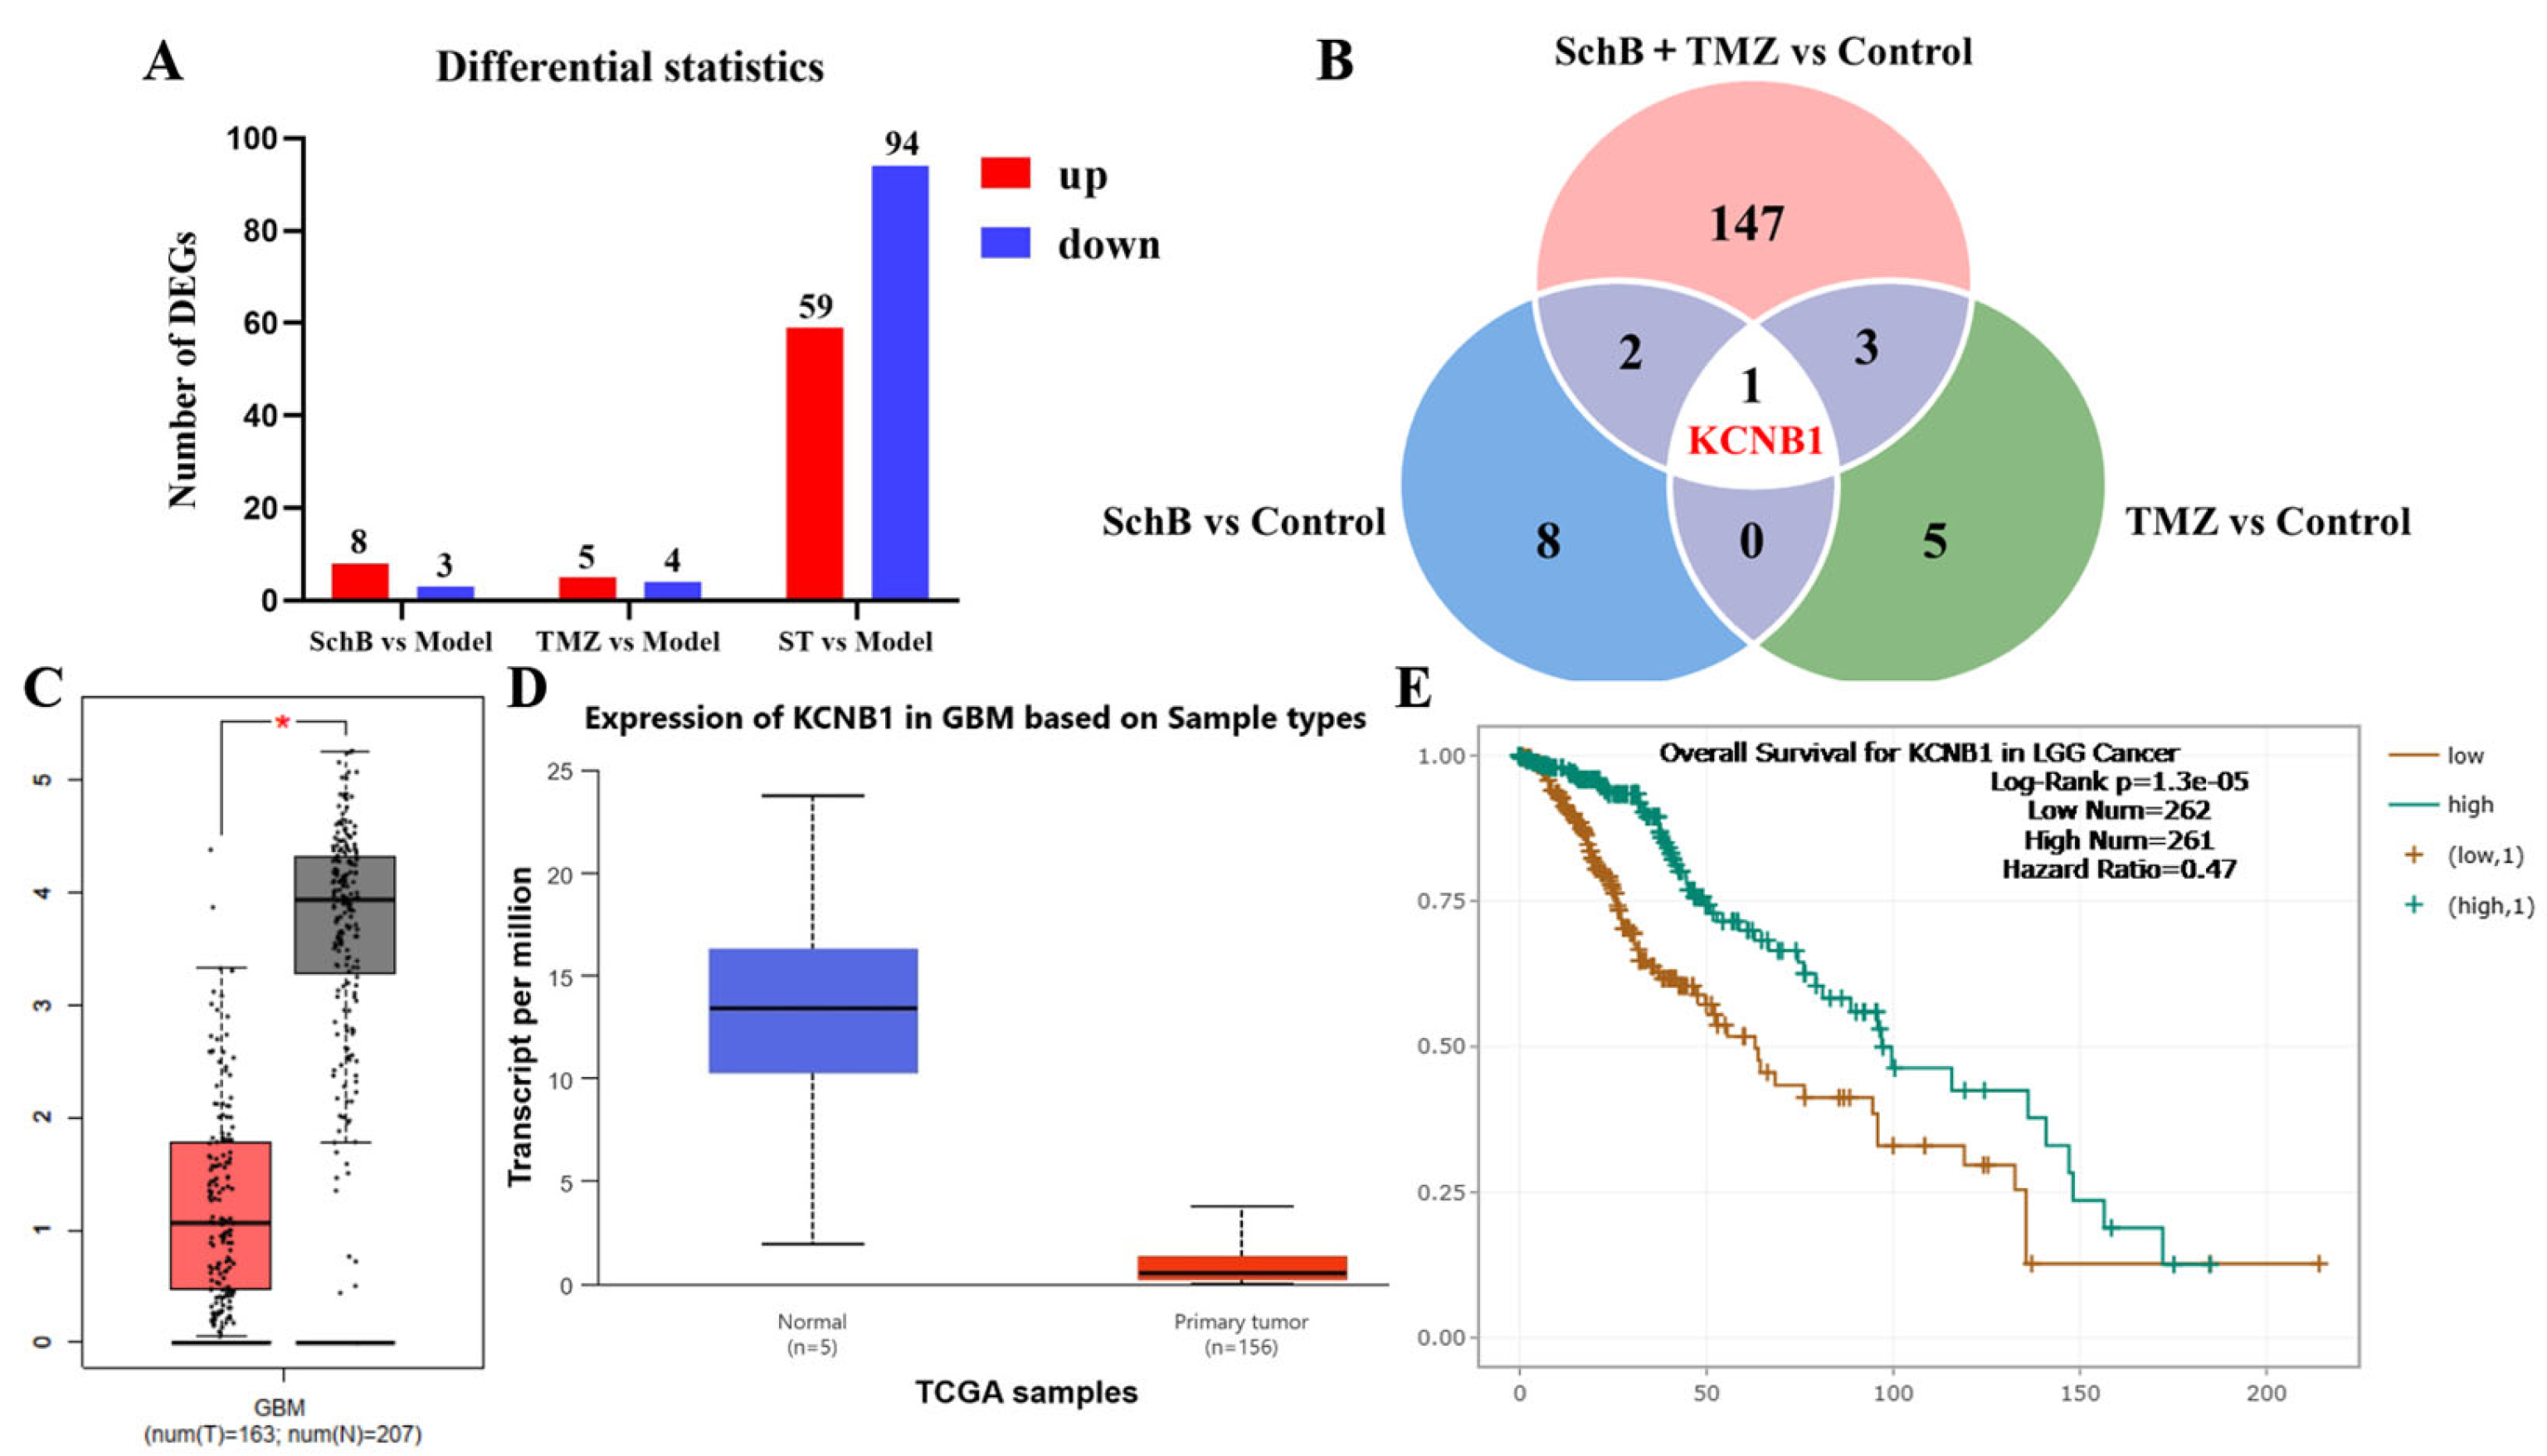
Transcriptome sequencing screening and KCNB1 expression and prognosis analysis. (A) Number of DEGs in each treatment group (|log2FC| ≥ 1, FDR < 0.05). (B) Intersection Venn diagram of DEGs. (C) Analysis of KCNB1 expression in GBM using GEPIA database (* p < 0.05). (D) Analysis of KCNB1 expression in GBM using TCGA database (p = 0.076381). (E) Kaplan–Meier survival analysis of KCNB1 in GBM using Starbase database (Log-rank p = 1.3 × 10⁻⁵, HR = 0.47).
To further screen the common key targets among the three groups, we constructed a Venn diagram (Figure 1B), comparing the intersections of the differentially expressed genes in the “Sch B vs. Control”, “TMZ vs. Control”, and “Sch B + TMZ vs. Control” groups. It was found that under the three intervention conditions, only one common differentially expressed gene, KCNB1, existed, suggesting that this gene is the only common differentially expressed gene regulated by Sch B and TMZ alone and in combination, and may play a key role in the regulation of drug sensitivity in glioma. This finding provides a clear target for us to further clarify the molecular mechanism of Sch B reversing TMZ resistance in glioma.
It is worth noting that GEPIA analysis (Figure 1C) showed that KCNB1 was significantly downregulated in glioblastoma, and TCGA analysis (Figure 1D) showed a consistent trend toward downregulation, although the difference did not reach statistical significance (p = 0.076381). Then, survival analysis was conducted using the Starbase database (Figure 1E), finding that patients with low expression of KCNB1 had a worse prognosis; this suggests that low KCNB1 expression is significantly associated with poor prognosis, indicating a direction for further in-depth research on the target of KCNB1 and its upstream and downstream signaling pathways.
3.2. Expression of KCNB1 in TMZ-Resistant Glioma Cells and in the Tissues of TMZ-Resistant Patients
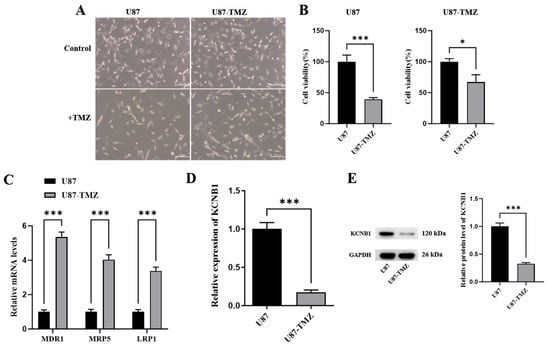
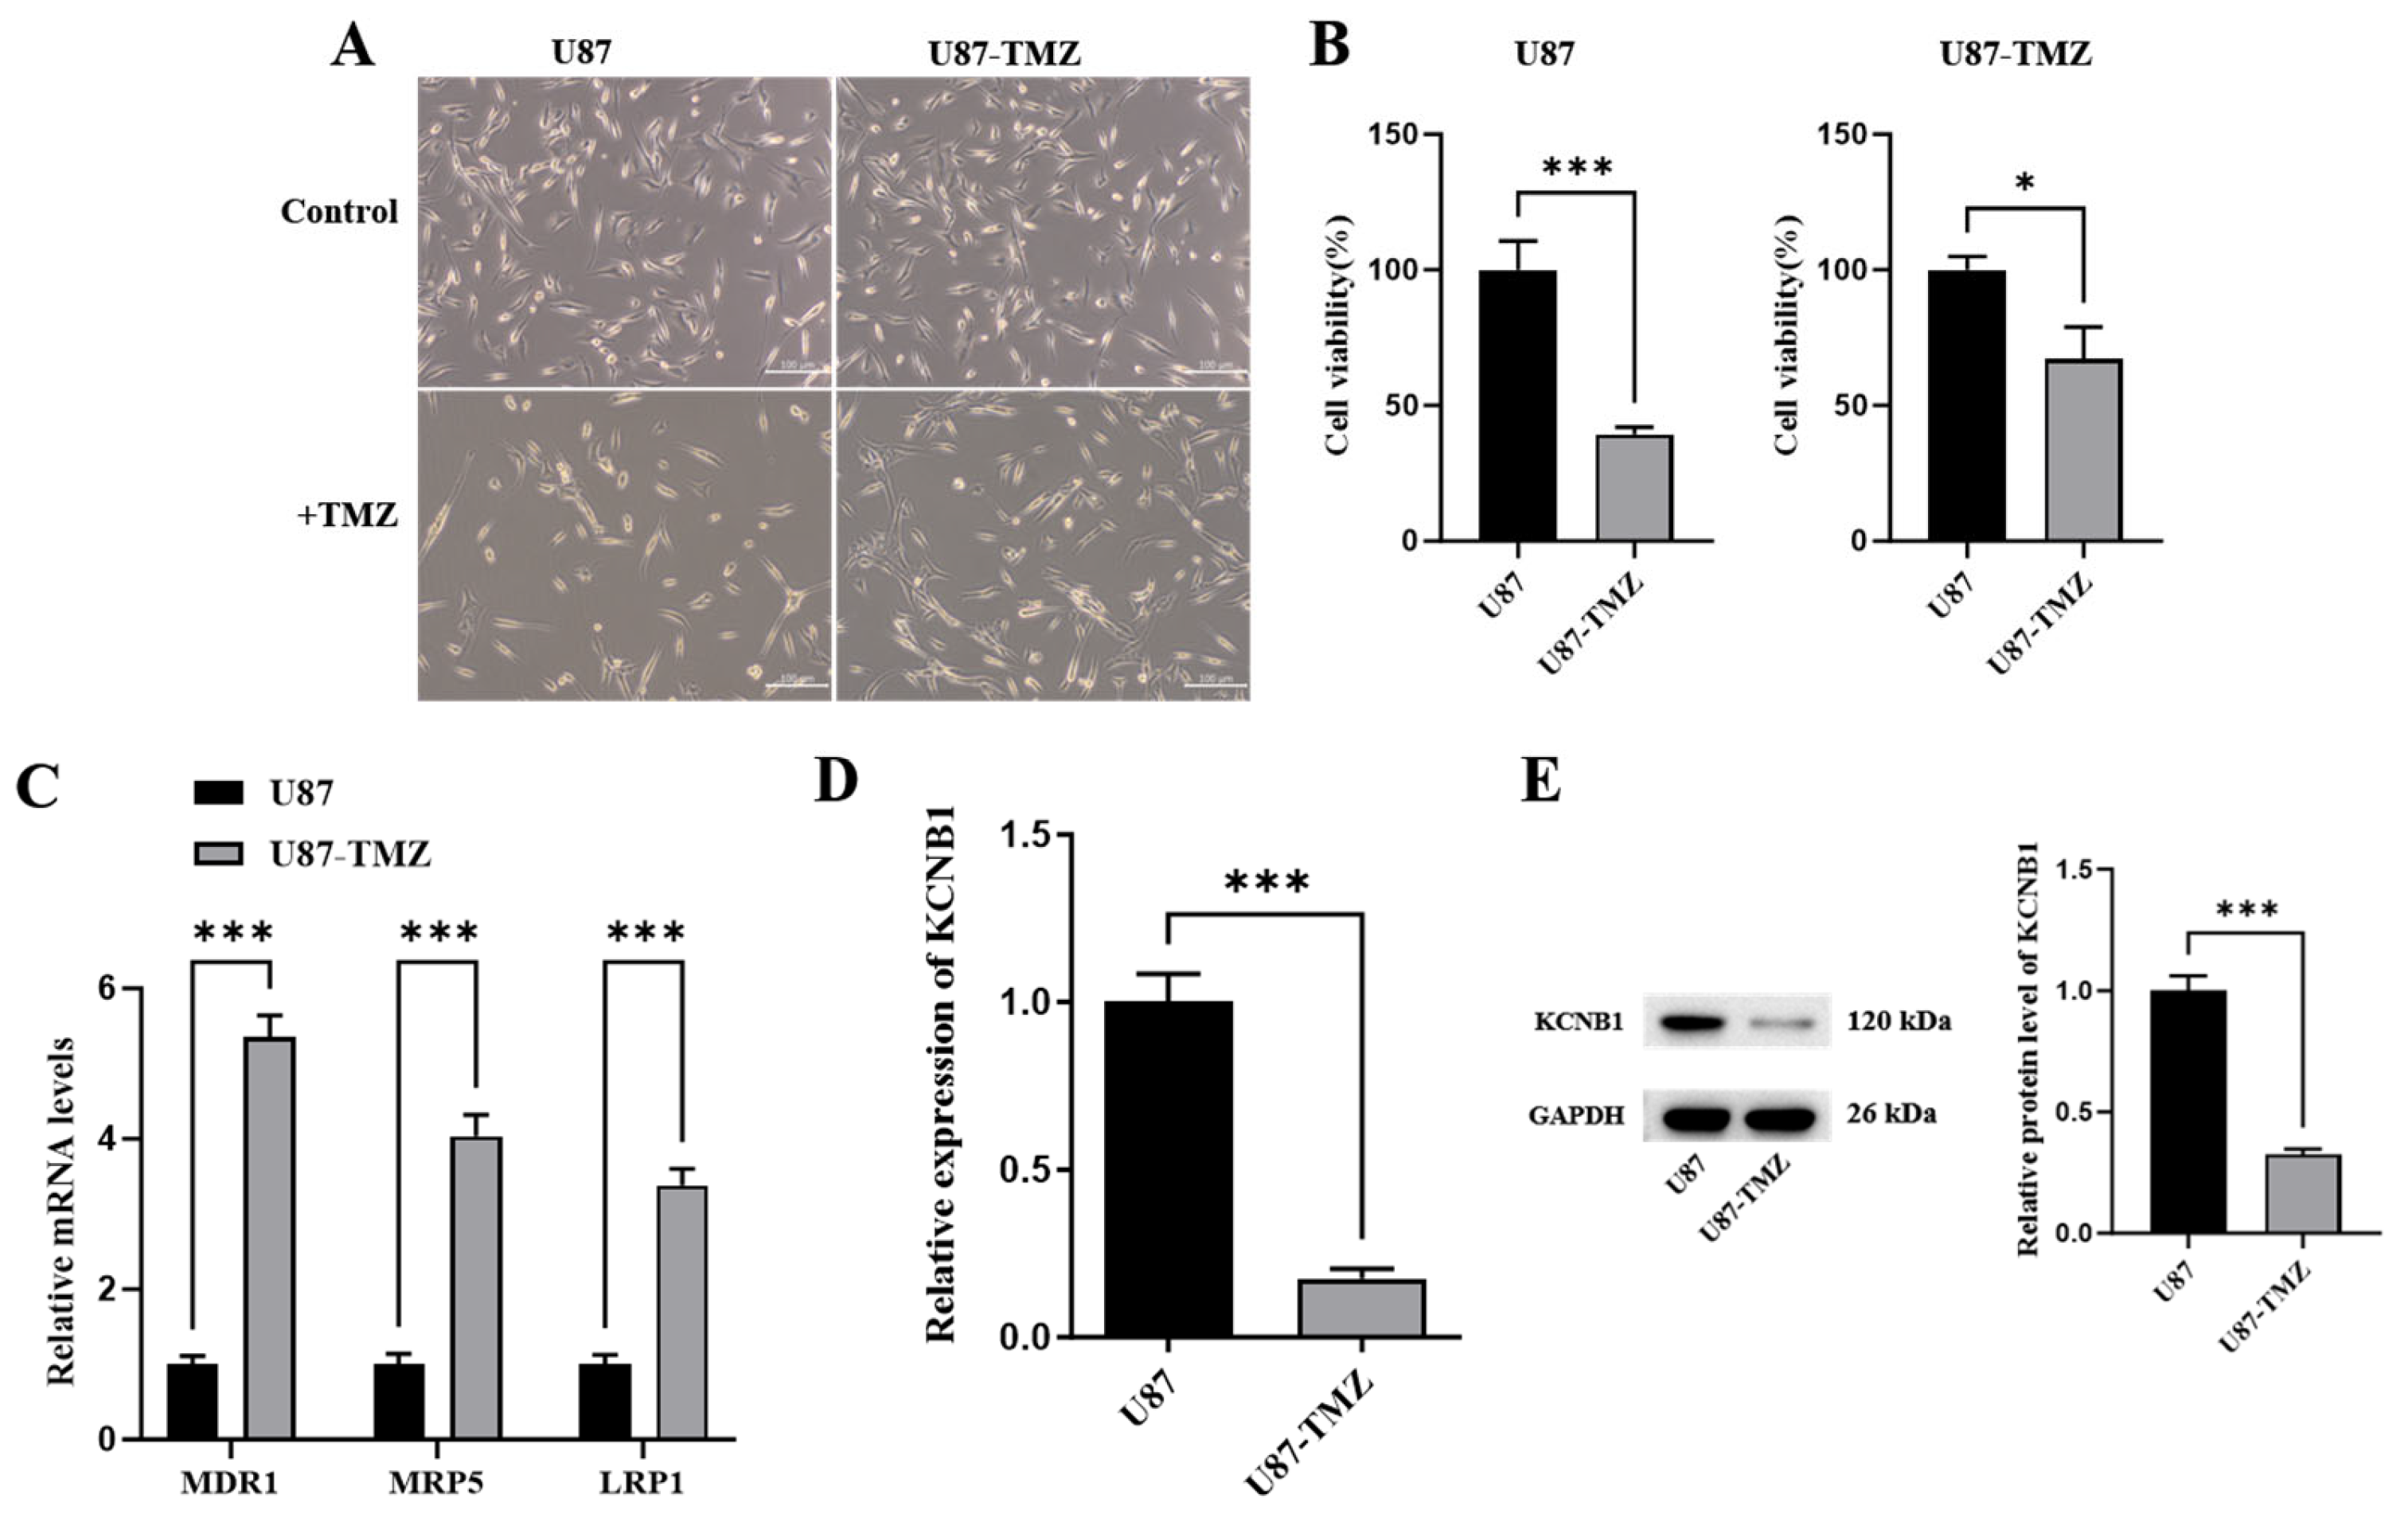
To verify the potential role of KCNB1 in TMZ resistance in GBM, we characterized the resistance phenotype and target gene expression profile of the U87-TMZ cell line (Figure 2A). The results showed that compared with the U87 parental strain, the cell viability of the U87-TMZ-resistant strain was significantly increased under TMZ treatment (200 µmol/L), demonstrating stronger resistance (Figure 2B). Additionally, the resistance-related genes MDR1, MRP5, and LRP1 were significantly upregulated in the TMZ-resistant strain, further confirming the successful establishment of the TMZ-resistant phenotype (Figure 2C). Based on this, we detected the expression level of the KCNB1 gene and found that both the mRNA (Figure 2D) and protein (Figure 2E) levels of KCNB1 were significantly downregulated in U87-TMZ cells relative to the parental strain. These results indicate that the downregulation of KCNB1 at both transcriptional and translational levels is closely associated with the TMZ-resistant phenotype of glioblastoma cells.
Figure 2.
Characterization of the TMZ-resistant phenotype and KCNB1 expression in U87 cells. (A) Morphology of U87 and U87-TMZ cells. (B) CCK-8 assay for cell viability under TMZ treatment (*** p < 0.001; * p < 0.05). (C) RT-qPCR for the expression of drug resistance genes MDR1, MRP5, and LRP1 (*** p < 0.001). (D) RT-qPCR for KCNB1 gene expression (*** p < 0.001). (E) Western blot analysis and quantitative densitometry of KCNB1 protein expression in parental U87 and U87-TMZ cells, with GAPDH as the loading control (*** p < 0.001).
3.3. Sch B Upregulates KCNB1, Restoring the Sensitivity of Drug-Resistant Cells to TMZ
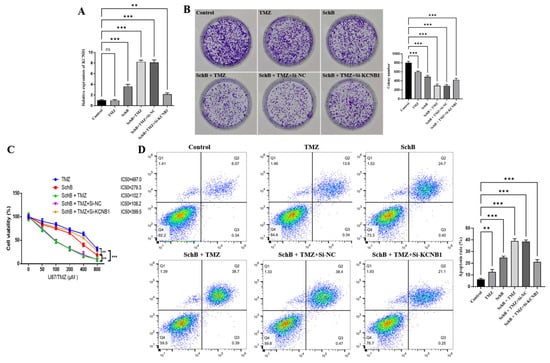
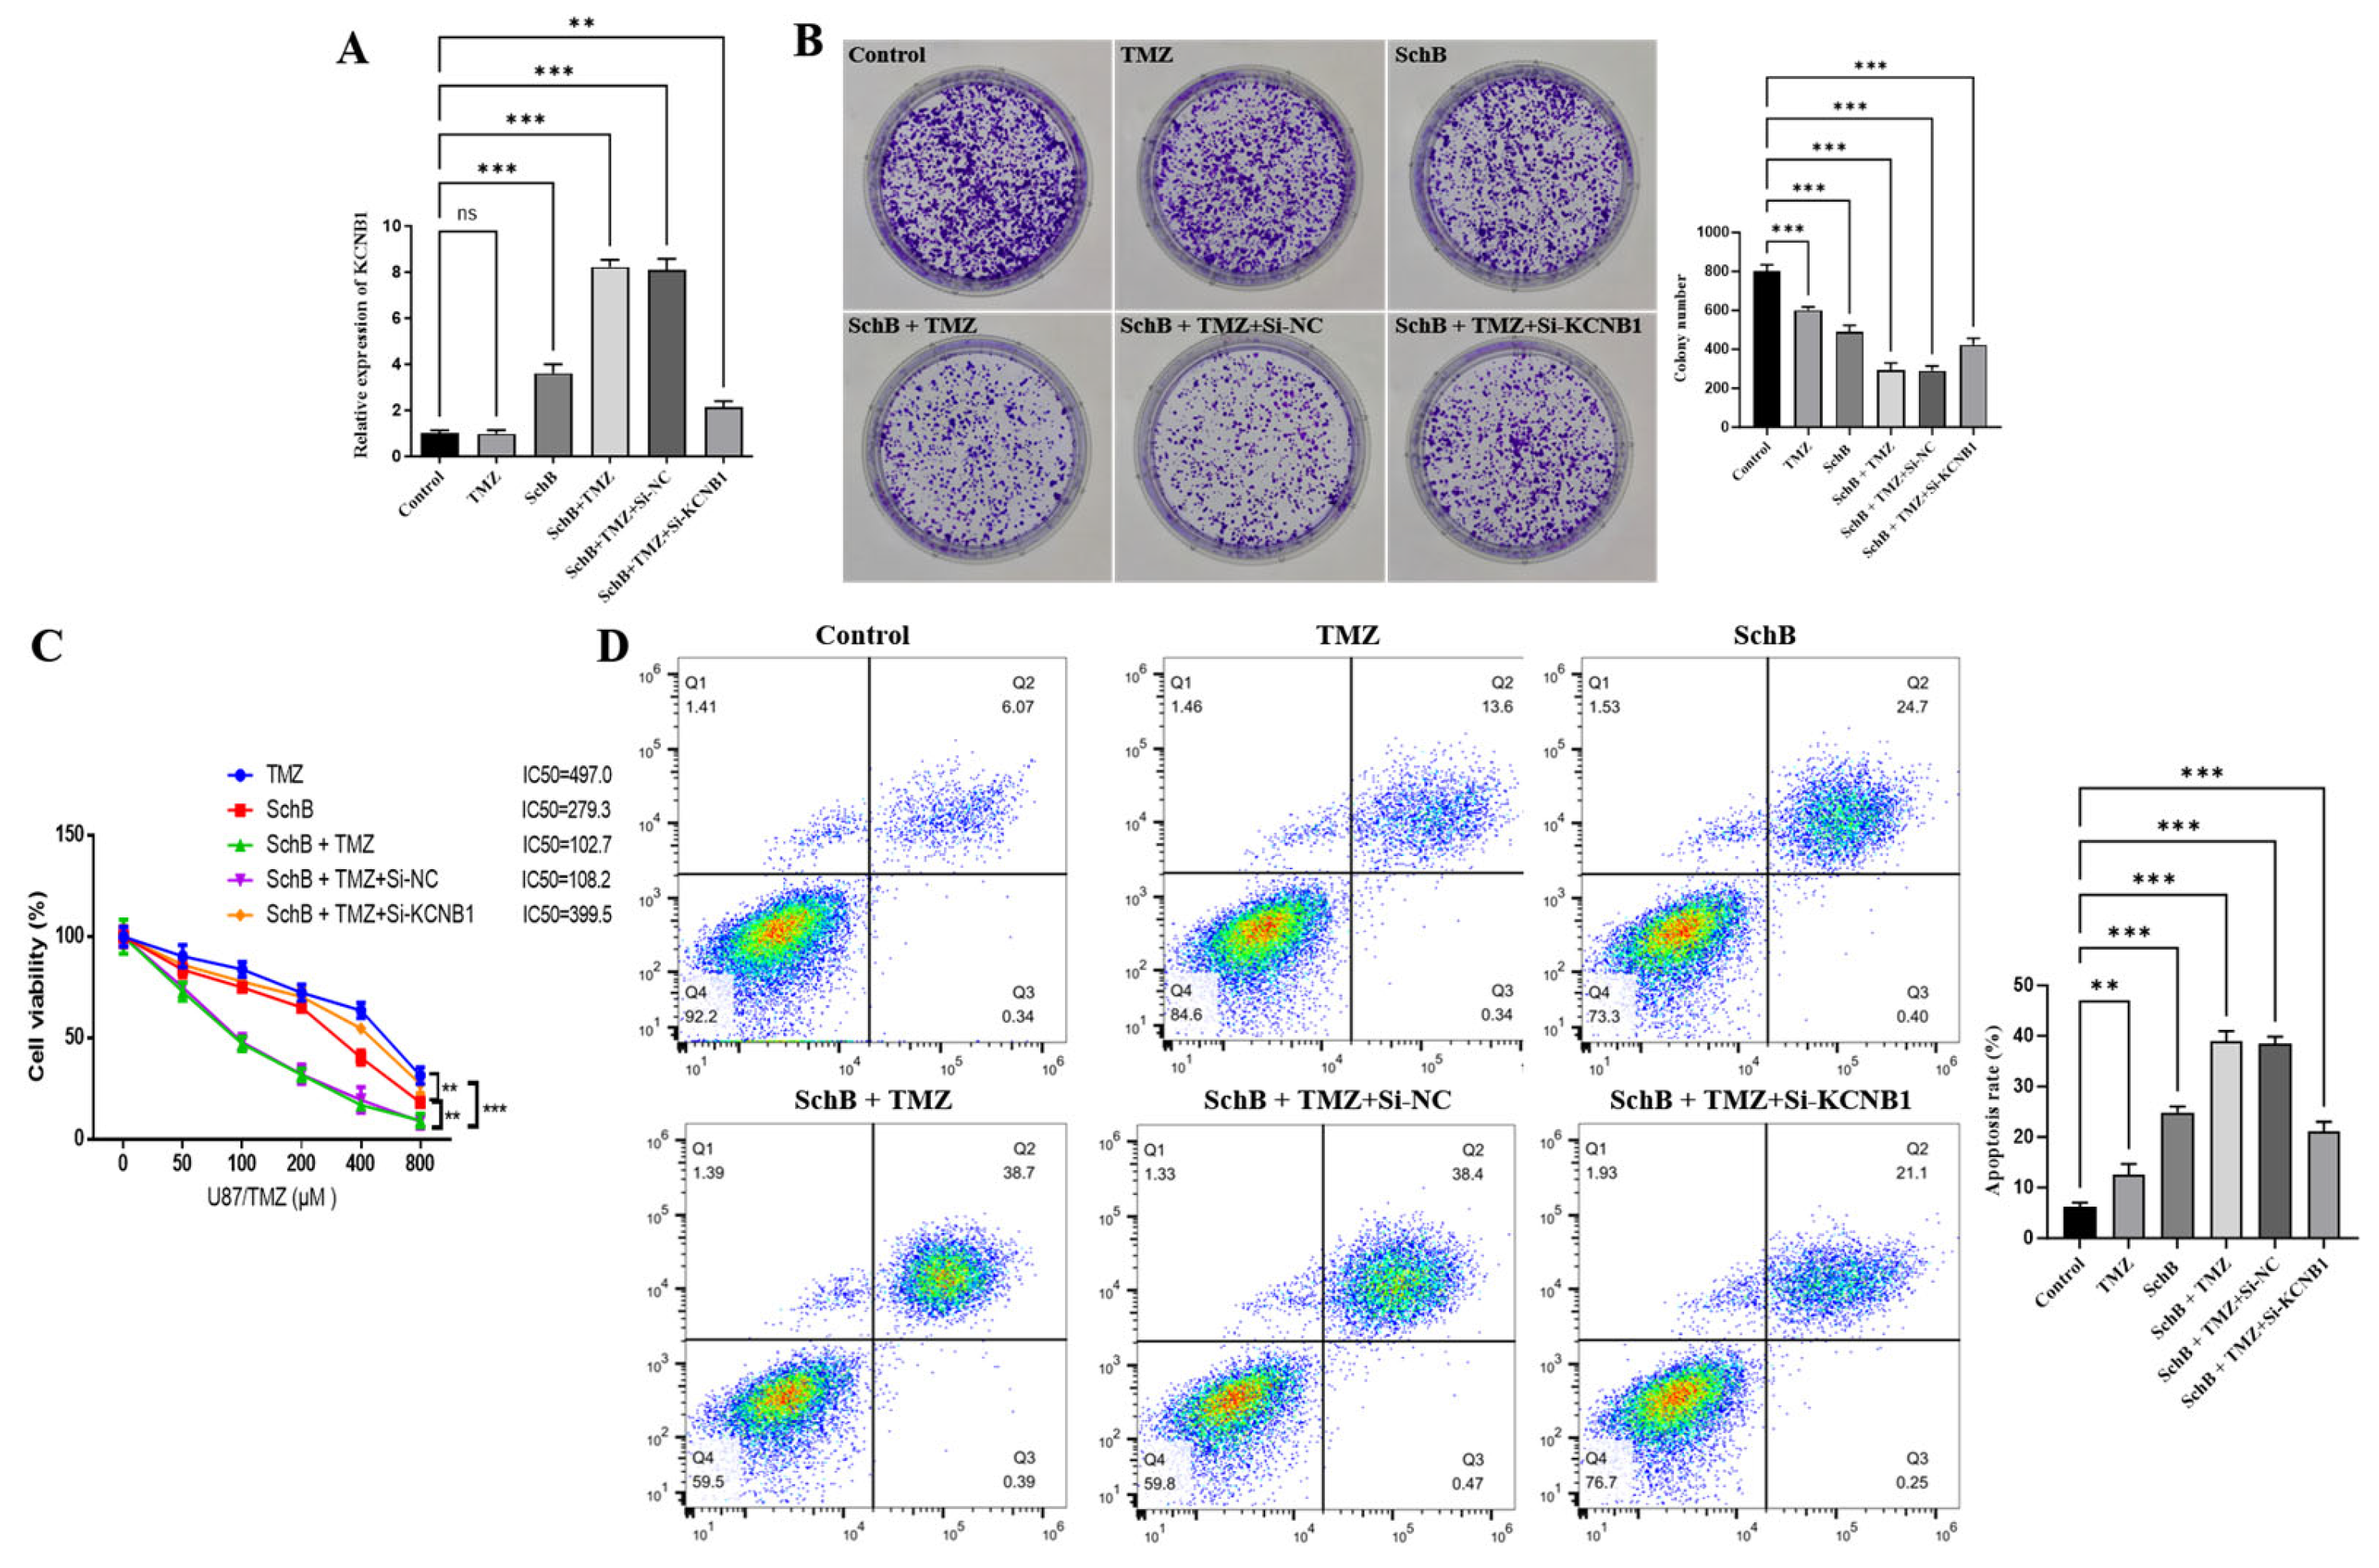
To verify whether the KCNB1 gene is involved in the effect of combined drug administration in improving TMZ resistance, we first detected the expression level of the KCNB1 gene. The results in Figure 3A showed that Sch B alone (200 µg/mL) could upregulate the expression of the KCNB1 gene, while the combined treatment of Sch B (200 µg/mL) and TMZ (200 µmol/L) further significantly upregulated the expression of this gene; when the KCNB1 gene was knocked down in the combined treatment, the upregulation level significantly decreased. The cloning experiment results in Figure 3B showed that the inhibitory effect of single-drug treatment (200 µg/mL Sch B or 200 µmol/L TMZ) on the proliferation of U87 cells was lower than that of the combined treatment (200 µg/mL Sch B + 200 µmol/L TMZ); while KCNB1 was simultaneously knocked down during the combined treatment, the previously inhibited proliferation ability was restored, and the cell proliferation level increased. Further evaluation of the sensitivity of U87 cells to TMZ through the CCK-8 experiment showed that the sensitivity of cells to TMZ significantly increased, and the resistance decreased after combined administration; while knocking down KCNB1 in the combined treatment, the previously improved drug sensitivity decreased again, and the cells regained a drug-resistant phenotype. In addition, the apoptosis detection results (Figure 3D) showed that the apoptosis rate of cells in the combined-treatment group (200 µg/mL Sch B + 200 µmol/L TMZ) was significantly higher than that in the single administration group; while knocking down KCNB1 in the combined treatment, the apoptosis ratio was significantly lower. In conclusion, the cell-level experiments preliminarily indicate that combined drug administration may upregulate the expression of KCNB1, inhibit the proliferation of U87 cells, and promote apoptosis, thereby improving TMZ resistance and increasing the sensitivity of cells to TMZ.
Figure 3.
The regulatory effects of KCNB1 on proliferation, apoptosis, and TMZ sensitivity in U87-TMZ cells. (A) RT-qPCR of KCNB1 mRNA (** p < 0.01, *** p < 0.001). (B) Colony formation assay (*** p < 0.001). (C) CCK-8 cell viability and IC50 curves under TMZ gradient (** p < 0.01, *** p < 0.001). (D) Flow cytometric apoptosis rate (** p < 0.01, *** p < 0.001).
3.4. Sch B Regulates the AMPK/mTOR Pathway in a Kv2.1-Dependent Manner
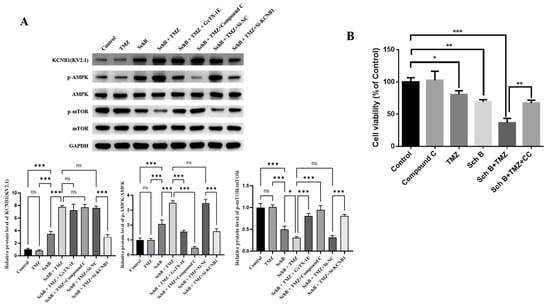
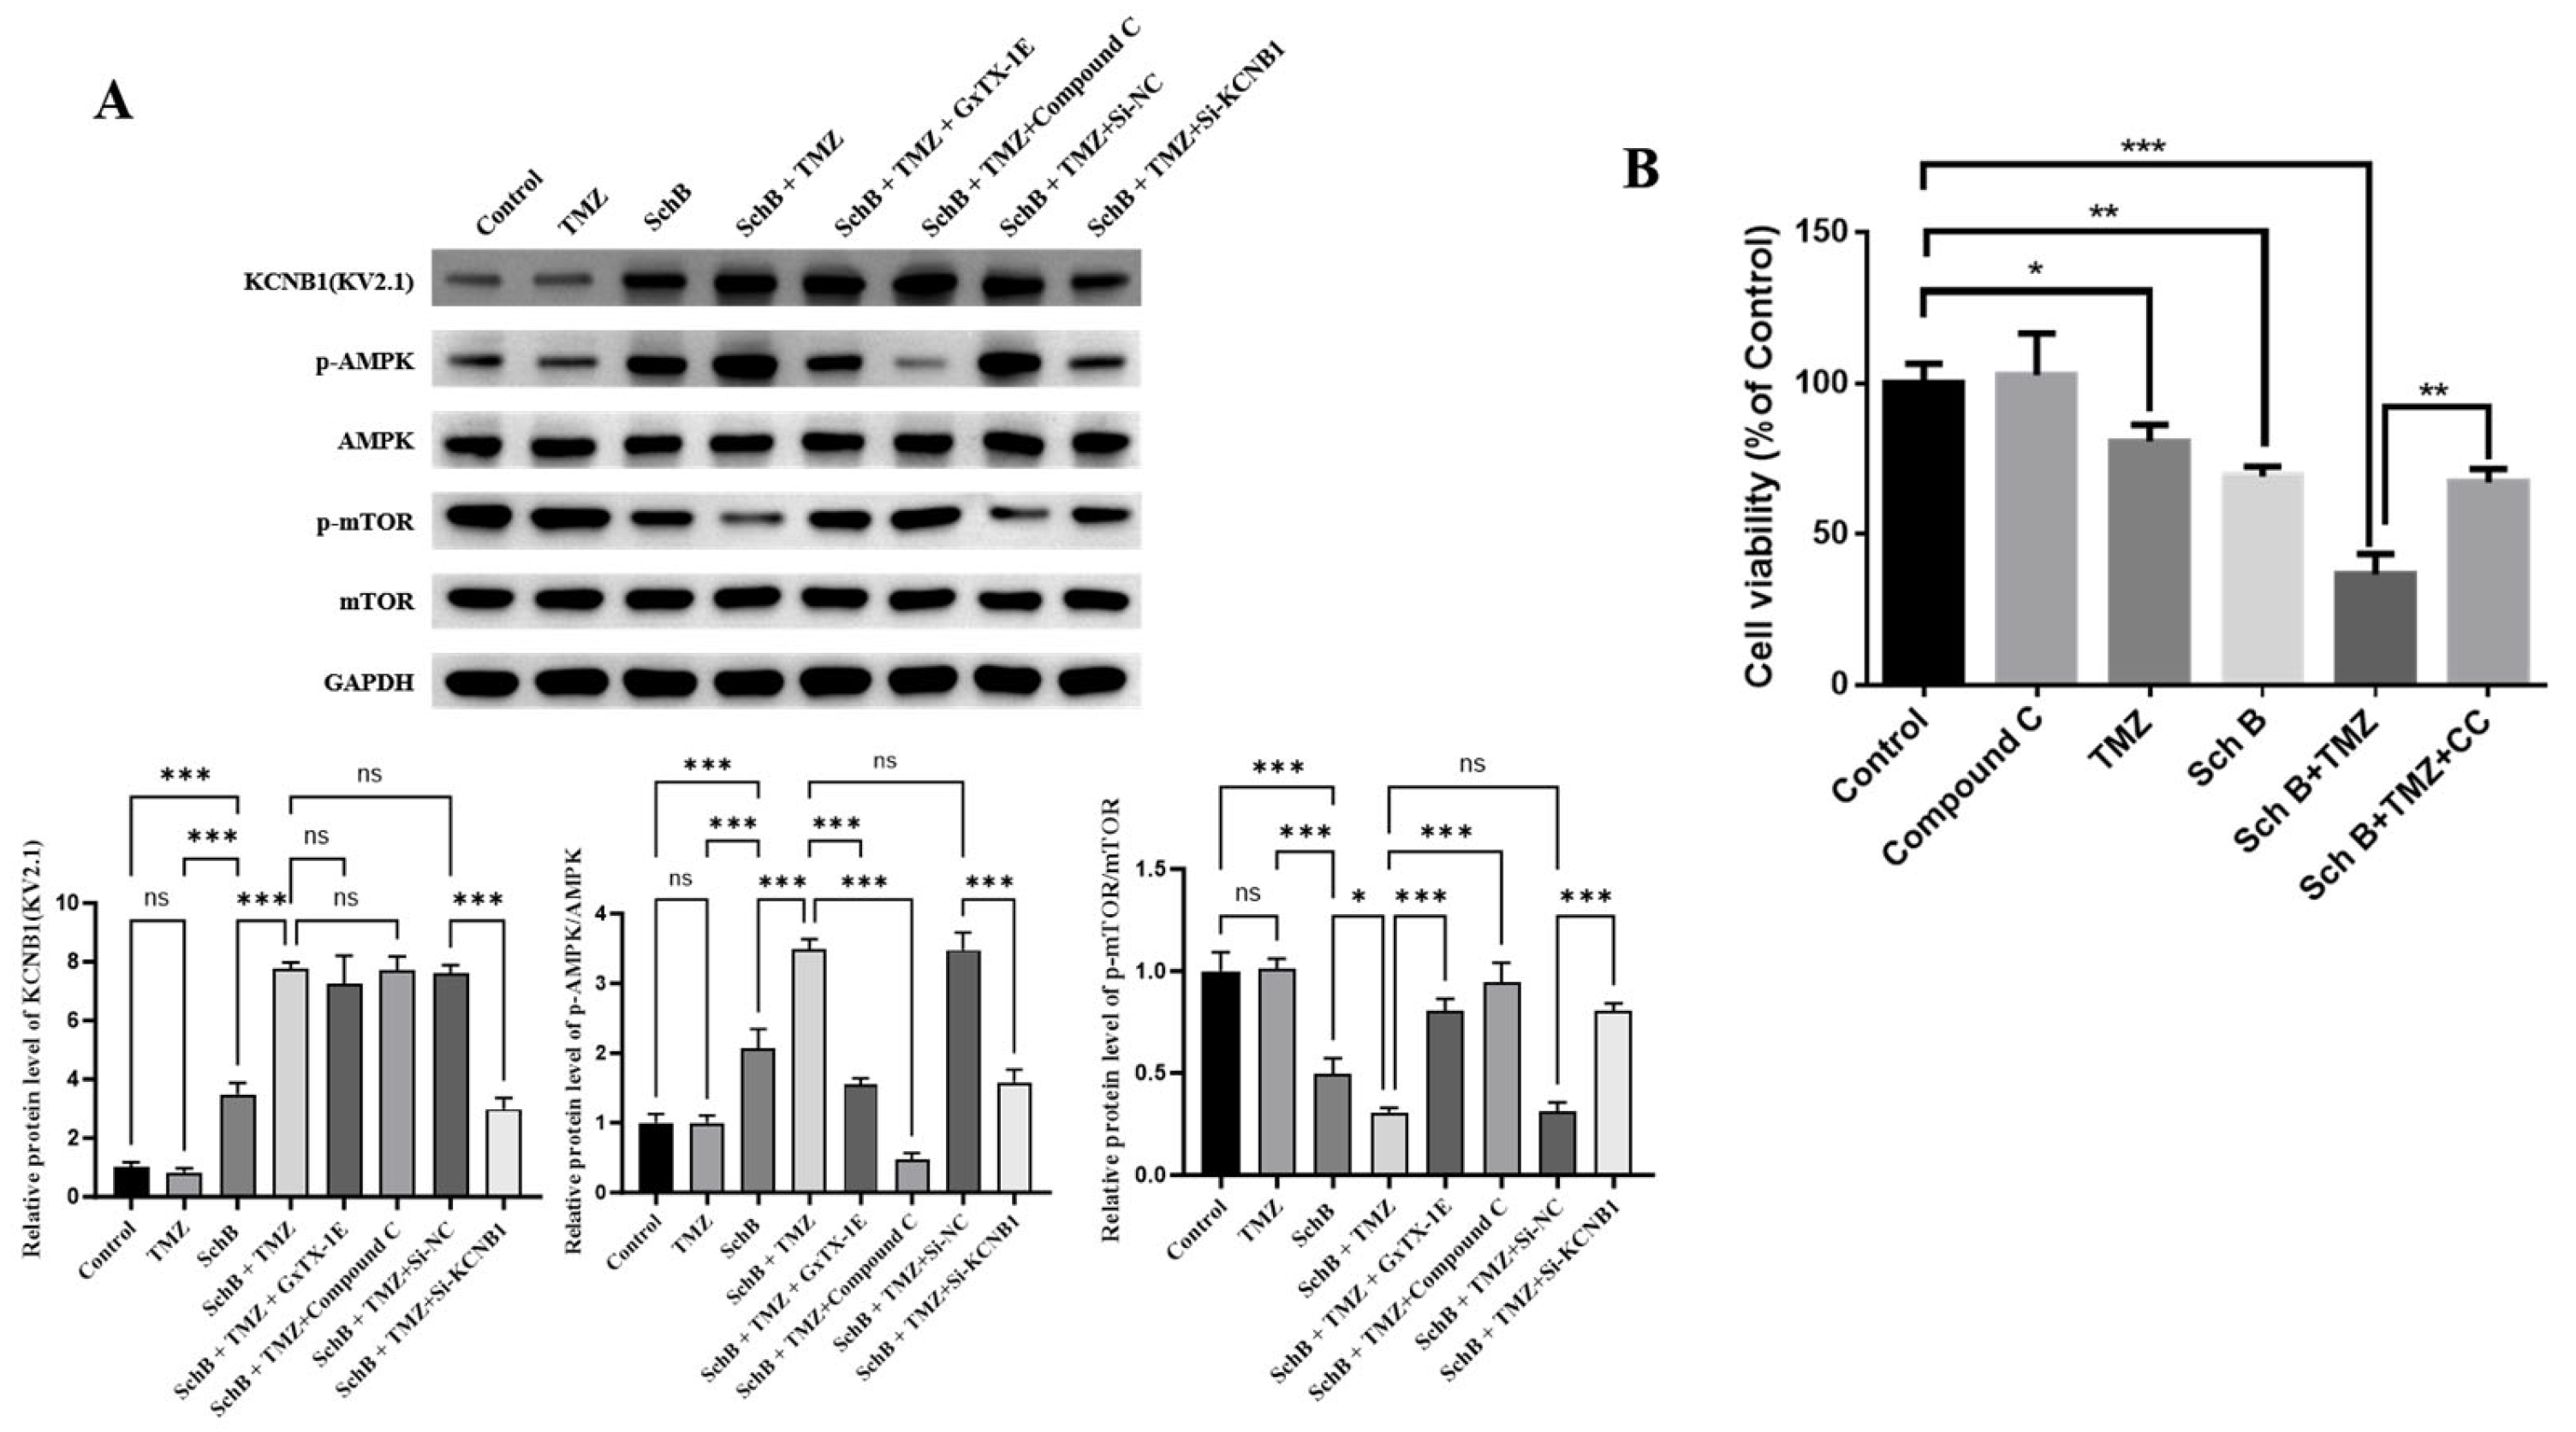
To explore the potential mechanism by which Sch B and TMZ work together, we examined the changes in key molecules within the relevant signaling pathways. As shown in Figure 4, compared to the control group, the expression level of Kv2.1 protein was significantly increased in the Sch B and TMZ combined-treatment group (200 µg/mL Sch B + 200 µmol/L TMZ). Given that Kv2.1 may regulate the AMPK/mTOR signaling axis, we further detected the phosphorylation levels of AMPK and mTOR. The results indicated that the combined treatment significantly upregulated the p-AMPK level and downregulated the p-mTOR level, suggesting that this pathway was activated.
Figure 4.
The molecular mechanism of combined drug use in regulating the AMPK/mTOR pathway in a Kv2.1-dependent manner. (A) Western blot analysis and quantitative densitometry of Kv2.1, p-AMPK/AMPK, and p-mTOR/mTOR in U87-TMZ cells. For Kv2.1: Control vs. TMZ (ns, not significant), Control vs. Sch B (*** p < 0.001), TMZ vs Sch B (*** p < 0.001), Sch B vs. Sch B + TMZ (* p < 0.05, *** p < 0.001), Sch B + TMZ vs. Sch B + TMZ + GxTX-1E (ns, not significant), Sch B + TMZ vs. Sch B + TMZ + Compound C (ns, not significant), Sch B + TMZ vs. Sch B + TMZ + si-NC (ns, not significant), and Sch B + TMZ vs. Sch B + TMZ + si-KCNB1 (*** p < 0.001). For p-AMPK/AMPK: Control vs. TMZ (ns, not significant), Control vs. Sch B (*** p < 0.001), TMZvs Sch B (*** p < 0.001), Sch B vs. Sch B + TMZ *** p < 0.001), Sch B + TMZ vs. Sch B + TMZ + GxTX-1E (*** p < 0.001), Sch B + TMZ vs. Sch B + TMZ + Compound C (*** p < 0.001), Sch B + TMZ vs. Sch B + TMZ + si-NC (ns, not significant), and Sch B + TMZ vs. Sch B + TMZ + si-KCNB1 (*** p < 0.001). For p-mTOR/mTOR: Control vs. TMZ (ns, not significant), Control vs. Sch B (*** p < 0.001), TMZvs Sch B (*** p < 0.001), Sch B vs. Sch B + TMZ (*** p < 0.001), Sch B + TMZ vs. Sch B + TMZ + GxTX-1E (*** p < 0.001), Sch B + TMZ vs. Sch B + TMZ + Compound C (*** p < 0.001), Sch B + TMZ vs. Sch B + TMZ + si-NC (ns, not significant), and Sch B + TMZ vs. Sch B + TMZ + si-KCNB1 (*** p < 0.001). (B) CCK-8 cell viability rescue assay with Compound C (Control vs. Compound C alone: ns, not significant; Control vs. TMZ: * p < 0.05; Control vs. Sch B: ** p < 0.01; Control vs. Sch B+ TMZ: *** p < 0.001; Sch B + TMZ vs. Sch B + TMZ + Compound C: ** p < 0.01).
To further clarify the role of KCNB1/Kv2.1 in this pathway, we used si-KCNB1 to knock down KCNB1 expression and detected the changes in key pathway proteins. The results showed that knocking down KCNB1 could significantly reverse the Kv2.1 upregulation, p-AMPK increase, and p-mTOR decrease induced by the combined treatment (Figure 4A). Additionally, using the Kv2.1-specific inhibitor GxTX-1E (50 nmol/L) to pre-treat the cells also inhibited the p-AMPK increase and p-mTOR decrease without altering Kv2.1 protein expression itself, while the AMPK inhibitor Compound C (10 µmol/L) had no significant effect on KCNB1 expression, confirming that Kv2.1 is located upstream of the AMPK/mTOR pathway. These results indicate that the combined treatment regulates the AMPK/mTOR signaling pathway in a Kv2.1-dependent manner.
To further examine whether AMPK activation functionally contributes to the sensitized anti-tumor efficacy, U87-TMZ cells were pre-treated with the AMPK inhibitor Compound C and assessed by CCK-8 assay. Treatment with Compound C alone did not markedly alter baseline cell viability compared with control cells. Importantly, while the combination of Sch B and TMZ substantially reduced cell viability, pre-treatment with Compound C partially rescued cell viability and attenuated the cytotoxic effect induced by the combination (Figure 4B). These pharmacological data, together with the genetic evidence that KCNB1 knockdown reverses p-AMPK upregulation, support a functional contribution of AMPK activation to the sensitizing effect of Sch B plus TMZ.
3.5. Sch B Upregulates the Expression of KCNB1, Inducing Lethal Autophagy in Drug-Resistant Cells
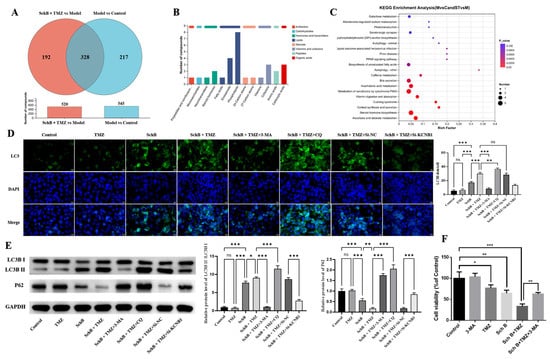
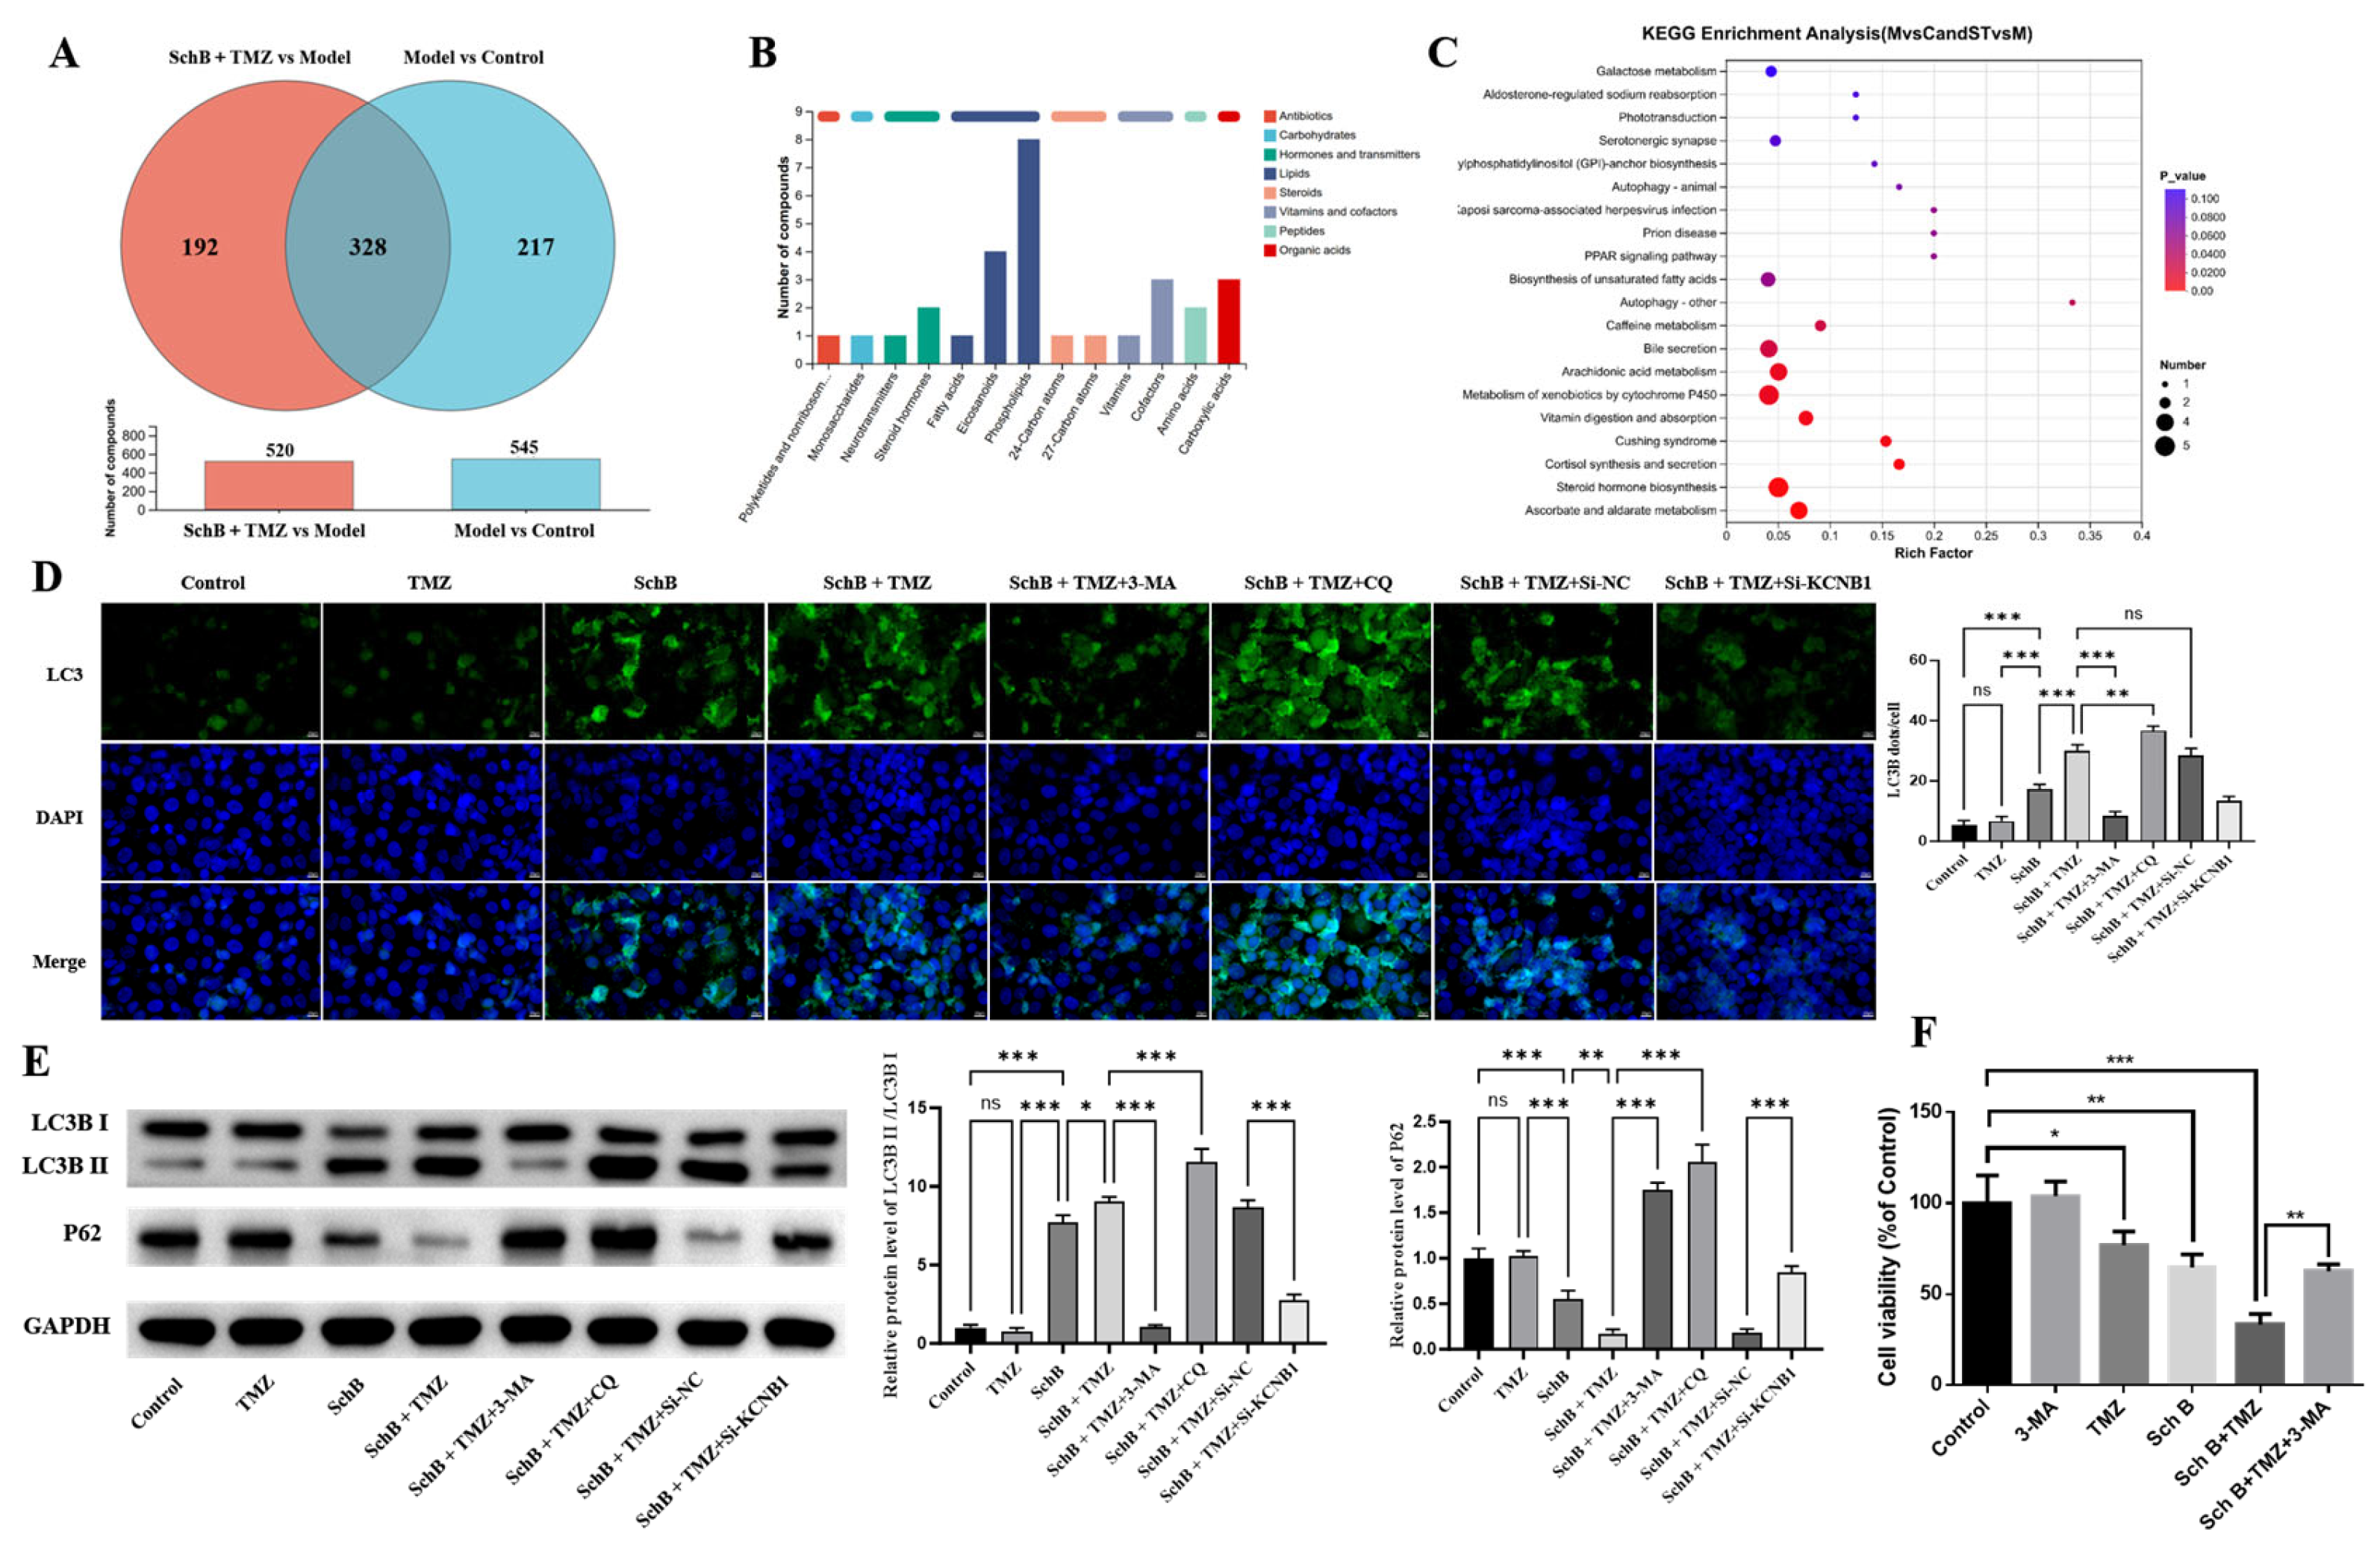
To explore the specific mechanism by which combined drug administration improves TMZ resistance, we conducted metabolomics analysis to screen for differentially accumulated metabolites (DAMs). Figure 5A shows that a total of 520 DAMs were identified between the combined-treatment group and the model group, while 545 DAMs were identified between the model group and the control group, with 328 common DAMs existing in both groups. Figure 5B presents the main categories of these common DAMs, and KEGG pathway enrichment analysis further indicates that the autophagy pathway is significantly enriched among them (Figure 5C).
Figure 5.
Metabolomics screening and autophagy verification. (A) Venn diagram for DAM screening. (B) Chemical classification of intersecting DAMs. (C) KEGG pathway enrichment analysis (autophagy pathway FDR < 0.05). (D) Quantitative analysis of LC3B immunofluorescence puncta (Control vs. Sch B: *** p < 0.001; Sch B vs. Sch B + TMZ: *** p < 0.001; Sch B + TMZ vs. Sch B + TMZ + 3-MA: p < 0.001; Sch B + TMZ vs. Sch B + TMZ + CQ: ** p < 0.01; Sch B + TMZ vs. Sch B + TMZ + si-NC: ns, not significant; Sch B + TMZ + si-NC vs. Sch B + TMZ + si-KCNB1: *** p < 0.001; Immunofluorescence quantification was performed from four random non-overlapping fields per biological replicate, with three independent biological replicates (N = 3)). (E) Western blot analysis and quantitative densitometry of LC3B-II/I and p62. For LC3B-II/I: (Control vs. TMZ: ns, not significant; Control vs. Sch B: *** p < 0.001; Sch B vs. Sch B + TMZ: * p < 0.05; Sch B + TMZ vs. Sch B + TMZ + 3-MA: p < 0.001; Sch B + TMZ vs. Sch B + TMZ + CQ: *** p < 0.001; Sch B + TMZ vs. Sch B + TMZ + si-NC: ns, not significant; Sch B + TMZ + si-NC vs. Sch B + TMZ + si-KCNB1: *** p < 0.001). For p62: (Control vs. TMZ: ns, not significant; Control vs. Sch B: *** p < 0.001; Sch B vs. Sch B + TMZ: ** p < 0.01; Sch B + TMZ vs. Sch B + TMZ + 3-MA: p < 0.001; Sch B + TMZ vs. Sch B + TMZ + CQ: *** p < 0.001; Sch B + TMZ vs. Sch B + TMZ + si-NC: ns, not significant; Sch B + TMZ + si-NC vs. Sch B + TMZ + si-KCNB1: *** p < 0.001). (F) CCK-8 cell viability rescue assay with 3-MA (Control vs. 3-MA alone: ns, not significant; Control vs. TMZ: * p < 0.05; Control vs. Sch B: ** p < 0.01; Control vs. Sch B + TMZ: *** p < 0.001; Sch B + TMZ vs. Sch B + TMZ + 3-MA: ** p < 0.01).
Based on the results of metabolomics screening, we used the autophagy inhibitor 3-methyladenine (3-MA, 1 mmol/L) and the autophagy flow blocker chloroquine (CQ, 25 µmol/L) to verify the involvement of autophagy. Immunofluorescence staining of LC3B (Figure 5D) showed that the fluorescence signal in the combined-treatment group (200 µg/mL Sch B + 200 µmol/L TMZ) was significantly stronger than that in the single-treatment group. The fluorescence signal was significantly weakened after 3-MA treatment, and further enhanced after CQ treatment. Knockdown of KCNB1 significantly reduced the signal intensity. The Western blot results (Figure 5E) showed that compared with the single-treatment group, the combined treatment significantly increased the LC3B-II/I ratio and decreased the p62 protein level; 3-MA could significantly reverse these changes, and the LC3-II/I ratio and p62 level both increased after CQ treatment, confirming that the combined treatment induced a complete autophagic flow. Importantly, knockdown of KCNB1 significantly weakened the autophagy level induced by the combined treatment, manifested as a decrease in the LC3B-II/I ratio, an increase in p62 level, and a weakening of the LC3B immunofluorescence signal, suggesting that the combined treatment activated lethal autophagy through KCNB1.
To functionally confirm whether the observed autophagy contributes to cell death rather than serving a cytoprotective survival mechanism, U87-TMZ cells were treated with the autophagy inhibitor 3-MA. Treatment with 3-MA alone did not markedly affect baseline cell viability compared with the control group. Combined treatment with Sch B and TMZ substantially decreased cell viability compared with the control group or single-agent treatments. Importantly, pre-treatment with 3-MA significantly rescued cell viability and attenuated the cytotoxic effect induced by the combination of Sch B and TMZ (Figure 5F). These functional rescue results directly indicate that the autophagy induced by Sch B and TMZ actively contributes to cell death rather than serving a cytoprotective function.
Previous studies have confirmed that p-AMPK can activate autophagy by inhibiting the expression of mTOR, which is consistent with the result observed in this study where the combined medication activated the AMPK/mTOR pathway and thereby induced autophagy [25]. In summary, the combined therapy activates lethal autophagy through the KCNB1/AMPK/mTOR axis, thereby improving TMZ resistance and enhancing the sensitivity of cells to the drug.
3.6. Sch B Regulates AMPK/mTOR-Induced Lethal Autophagy Through KCNB1, Thereby Inhibiting Tumor Growth
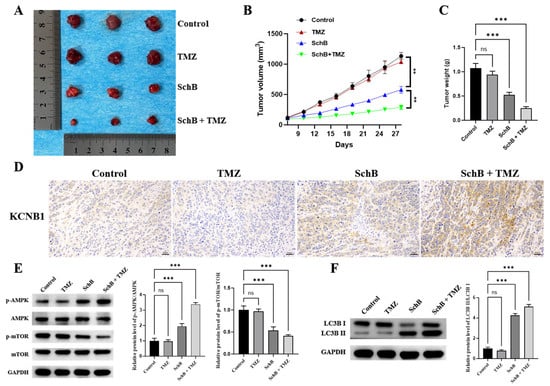
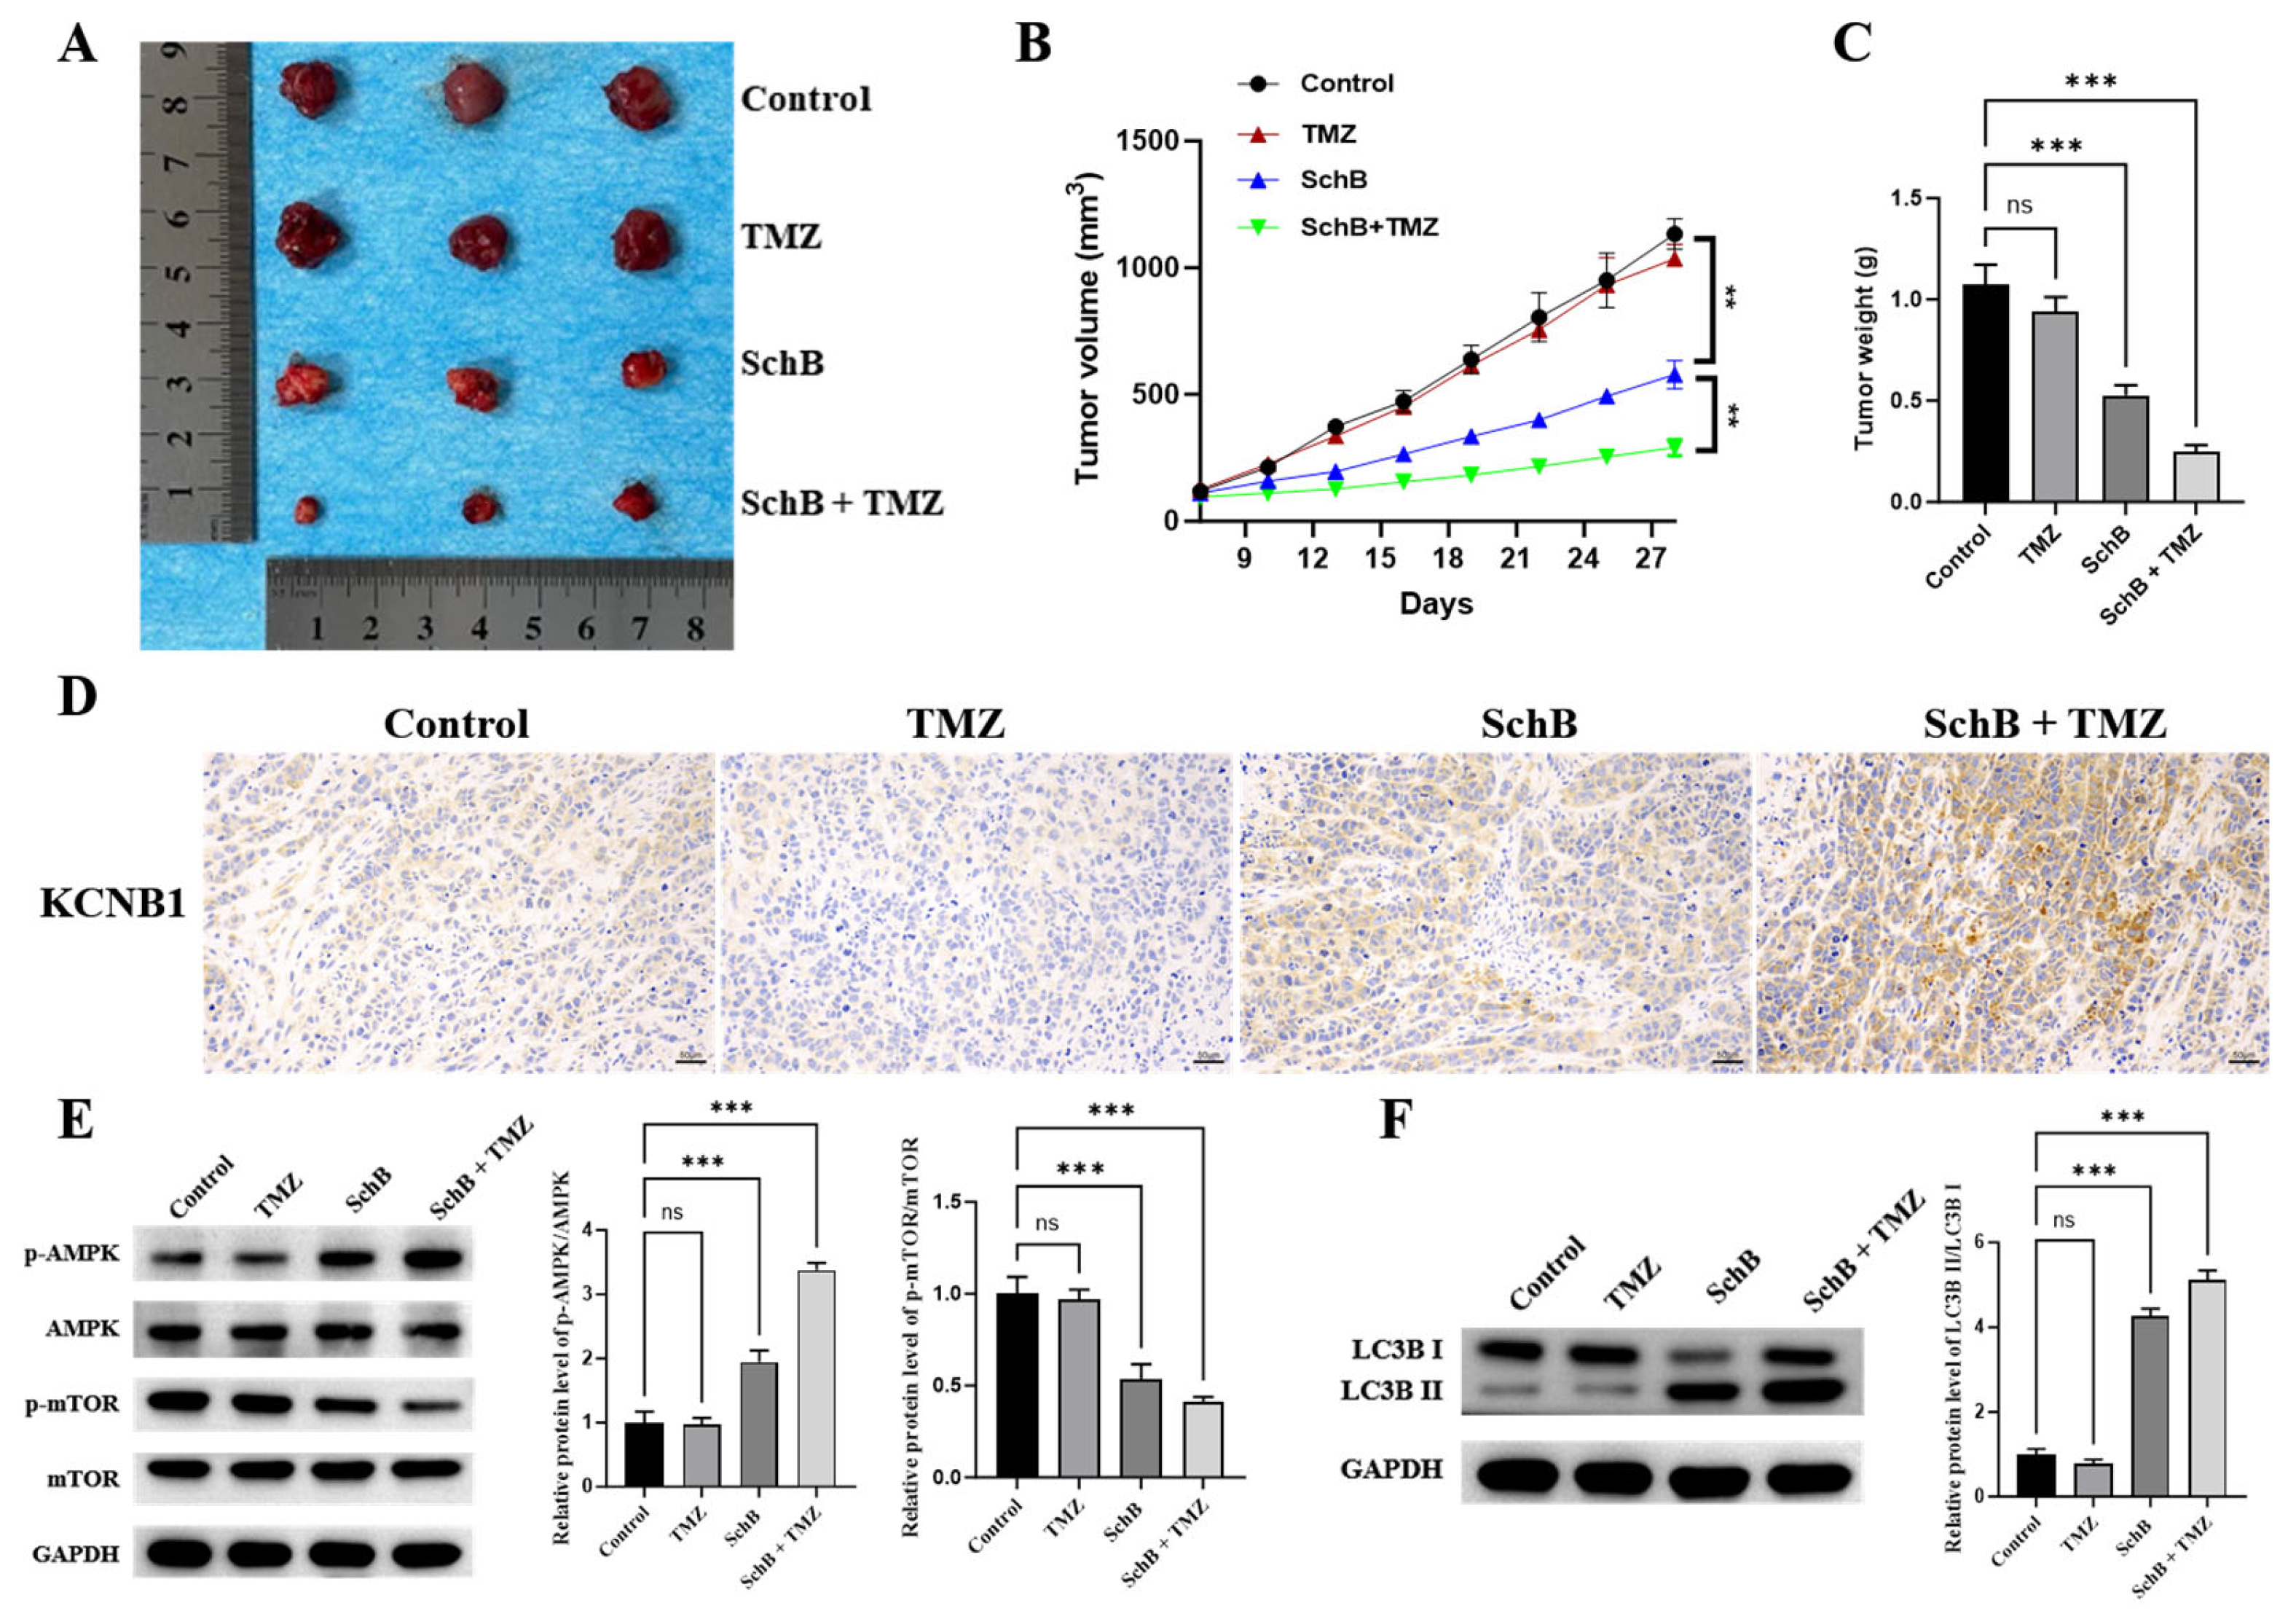
The results of the in vitro experiments indicated that the combined treatment (Sch B + TMZ) induced lethal autophagy in U87 drug-resistant cells by regulating the AMPK/mTOR pathway, thereby promoting the apoptosis of U87 cells and enhancing their sensitivity to TMZ. To further verify its in vivo effect, we constructed a nude mouse subcutaneous tumor model. The results showed that the anti-tumor effect of the combined treatment (100 mg/kg Sch B + 50 mg/kg TMZ) was more significant compared to the single-drug administration (100 mg/kg Sch B or 50 mg/kg TMZ) (Figure 6A–C). The immunohistochemical results in Figure 6D indicated that the expression level of KCNB1 in tumor tissues of the combined-treatment group was significantly increased. The Western blot results further confirmed (Figure 6E,F) that the combined treatment activated the AMPK signaling pathway and inhibited the mTOR pathway, subsequently significantly enhancing the level of autophagy. In conclusion, the in vivo experiments once again verified that the combined treatment could induce lethal autophagy through the AMPK/mTOR signaling pathway mediated by KCNB1, thereby inhibiting tumor growth and improving the sensitivity to TMZ.
Figure 6.
Verification of in vivo efficacy and mechanism of combined drug administration in inhibiting the growth of subcutaneous tumors in nude mice. (A) Subcutaneous tumors harvested from each group of nude mice at endpoint Day 28. (B) Tumor volume growth curves across 28 days (at Day 28: Control vs. TMZ: ns, not significant; Control vs. Sch B: ** p < 0.01; Sch B vs. Sch B + TMZ: ** p < 0.01). (C) Excised tumor weight at Day 28 (Control vs. TMZ: ns, not significant; Control vs. Sch B: *** p < 0.001; Control vs. Sch B + TMZ: *** p < 0.001). (D) Immunohistochemical staining of KCNB1 in tumor xenografts (Scale bar = 50 µm). (E) Western blot analysis and quantitative densitometry of p-AMPK/AMPK and p-mTOR/mTOR in tumor tissues. For p-AMPK/AMPK: Control vs. TMZ: ns, not significant; Control vs. Sch B: *** p < 0.001; Control vs. Sch B + TMZ: *** p < 0.001. For p-mTOR/mTOR: Control vs. TMZ: ns, not significant; Control vs. Sch B: *** p < 0.001; Control vs. Sch B + TMZ: *** p < 0.001. (F) Western blot analysis and quantitative densitometry of LC3B-II/I in tumor tissues (Control vs. TMZ: ns, not significant; Control vs. Sch B: *** p < 0.001; Control vs. Sch B + TMZ: *** p < 0.001).
4. Discussion
Although there are various treatment options available for glioblastoma (GBM), there is still much room for improvement in the survival rate of patients. As a first-line chemotherapy drug for treating glioblastoma, temozolomide (TMZ) still requires further research into its resistance mechanisms to enhance treatment efficacy for patients.
Voltage-gated potassium channels (Kv) constitute the largest subfamily of potassium channels [26]. Their functions are regulated by changes in membrane potential. Studies have shown that Kv channels are closely related to the occurrence and development of various tumors [27,28,29,30,31,32,33]. KCNB1 (Kv2.1) is the main voltage-gated potassium channel responsible for delayed rectifier potassium current (IDR) in mammalian brain neurons and regulates neuronal excitability during high-frequency discharges [34]. Although previous studies have confirmed that the regulation of KCNB1 is involved in neuronal apoptosis [35] and that KCNB1 mutations can cause early epileptic encephalopathy [36], the role of KCNB1 in glioblastoma remains unclear. This study, through transcriptomic analysis, discovered that the combined treatment of Sch B and TMZ significantly upregulated the expression of KCNB1 in U87 cells, and this gene was the only differentially regulated gene among all the treatment groups. The analysis based on the TCGA and GEPIA databases confirmed that KCNB1 was downregulated in GBM, and its low expression was significantly associated with poor prognosis of patients (indicating that KCNB1 might serve as a potential prognostic marker for GBM). Further research revealed that KCNB1 was also expressed at low levels in TMZ-resistant GBM cells and tumor tissues of resistant patients. More importantly, functional experiments demonstrated that knocking down KCNB1 could weaken the anti-tumor effect of Sch B combined with TMZ, manifested as increased cell proliferation, reduced apoptosis, and decreased sensitivity to TMZ, confirming that KCNB1 is the key target for Sch B to reverse TMZ resistance.
Previous studies have shown that the Kv2.1 potassium channel encoded by KCNB1 is functionally coupled with mitochondrial function and the AMPK signaling pathway [37]. To verify whether the combination of Sch B and TMZ acts through the KCNB1/Kv2.1-AMPK/mTOR pathway, we intervened in this pathway by using si-KCNB1 and pharmacological inhibitors. The results showed that knocking down KCNB1 could significantly inhibit the AMPK activation induced by the combination treatment while increasing the phosphorylation level of mTOR. Moreover, treatment with a Kv2.1-specific inhibitor or the AMPK inhibitor Compound C could partially reverse the anti-tumor effect of the combination treatment. It is worth noting that previous studies have reported that KCNB1 can inhibit the progression of glioma through the ERK pathway [38]. However, this study found that after Sch B upregulated KCNB1, it mainly activated the AMPK/mTOR pathway, suggesting that the downstream signaling pathway of KCNB1 may depend on the cell background and stimulating factors, and thereby participate in different biological regulatory processes.
The above results indicate that the combination of Sch B and TMZ can activate the KCNB1/AMPK/mTOR pathway. Given that this pathway is the core signaling axis regulating autophagy, we further investigated the role of autophagy in the anti-tumor effect of the combined treatment. In terms of the autophagy regulatory mechanism, mTOR negatively regulates autophagy by regulating the binding of the ULK1-ATG13-FIP200 complex [39]. AMPK, as an upstream molecule of mTOR, plays a positive regulatory role in autophagy activation [40]. During the chemotherapy of GBM, TMZ usually induces protective autophagy, thereby limiting its therapeutic effect, which makes autophagy a key factor for chemotherapy resistance. However, this study found that the combined treatment of Sch B and TMZ could significantly induce autophagy in GBM cells, but the nature was completely different. When pre-treated with the autophagy inhibitor 3-methyladenine (3-MA), the anti-proliferative and pro-apoptotic effects of the combined treatment were significantly weakened, confirming that this autophagy process was the cause of cell death rather than an adaptive survival response. Moreover, the autophagy inhibitor chloroquine (CQ) treatment led to further accumulation of LC3-II and p62, indicating that the combined treatment induced a complete autophagy process. Importantly, knocking down KCNB1 could significantly reduce the autophagy level and reverse the anti-tumor effect of the combined treatment, suggesting that KCNB1 is the key molecule mediating this lethal autophagy. This discovery is in line with the research that Dendrogenin A triggers lethal autophagy through LXRβ, indicating that natural-source compounds can induce lethal autophagy through different targets, providing a new strategy for tumor treatment.
The results of the in vivo experiments were highly consistent with those of the in vitro experiments. The growth of subcutaneous tumors in nude mice treated with the combined drug was significantly inhibited. The expression of KCNB1 in tumor tissues increased, the level of autophagy was enhanced, the AMPK pathway was activated, and the mTOR pathway was inhibited. These results not only confirmed the in vivo anti-tumor effect of Sch B combined with TMZ but also supported the functional conservation of the KCNB1/AMPK/mTOR/self-translation axis in the body, providing preliminary in vivo evidence for the clinical translation of this combined-treatment strategy.
In summary, this study first revealed the key regulatory role of KCNB1 in TMZ resistance in glioblastoma and further expanded the application value of Sch B in the treatment of GBM. It clarified the molecular mechanism by which the natural product Sch B upregulates KCNB1 to activate the AMPK/mTOR signaling pathway, induces lethal autophagy, and thereby reverses TMZ resistance. This discovery not only provided a new perspective for understanding chemotherapy resistance in GBM but also established KCNB1 as a potential therapeutic target for reversing TMZ resistance and laid an experimental foundation for the clinical application of Sch B as a TMZ sensitizer.
The findings are primarily based on the human U87 glioblastoma cell line, its TMZ-resistant derivative, and a BALB/c-nu nude mouse subcutaneous xenograft model. The low expression of KCNB1 in GBM and its association with poor prognosis were derived from human GBM datasets (TCGA and GEPIA), indicating some relevance to human biology. However, only a single cell line and subcutaneous xenograft model were used, without validation in orthotopic glioma models or patient-derived xenografts (PDXs). In addition, mice in the subcutaneous xenograft study were sacrificed at the predetermined endpoint for synchronized collection of tumor tissues for immunohistochemical and Western blot analyses, so long-term survival was not assessed. The conservation of the KCNB1/AMPK/mTOR axis across other tumor types or species remains unclear. Therefore, the translational potential of Sch B as a TMZ sensitizer requires further evaluation in additional preclinical models, including pharmacokinetic and toxicological studies.
Author Contributions
Methodology, Z.T.; writing—original draft, Z.T.; visualization, Z.T.; writing—review and editing, L.L.; data curation, L.L.; conceptualization, S.G.; investigation, S.G.; software, M.Y.; formal analysis, M.Y.; resources, N.W. and J.L.; supervision, N.W. and J.L.; project administration, N.W. All authors have read and agreed to the published version of the manuscript.
Funding
This research was funded by Jilin Provincial Education Department (No. JJKH20251348KJ), Development and Reform Commission of Jilin Province (Grant No. 2024C011-4), Student Provincial Innovation Project (No. S202513706004).
Institutional Review Board Statement
The animal study protocol was approved by the Ethical Committee of Jilin Medical University (2020-KJT056; dated: 03 September 2020).
Informed Consent Statement
Not applicable.
Data Availability Statement
The data used in this article can be obtained from the corresponding author.
Conflicts of Interest
The authors declare no conflicts of interest.
References
- Louis, D.N.; Perry, A.; Wesseling, P.; Brat, D.J.; Cree, I.A.; Figarella-Branger, D.; Hawkins, C.; Ng, H.K.; Pfister, S.M.; Reifenberger, G. The 2021 WHO Classification of Tumors of the Central Nervous System: A summary. Neuro Oncol. 2021, 23, 1231–1251. [Google Scholar] [CrossRef] [Scilit]
- Zou, Y.; Liu, Z.; Zhou, Y.; Wang, J.; Xu, Q.; Zhao, X.; Miao, Z. TRPC5 mediates TMZ resistance in TMZ-resistant glioblastoma cells via NFATc3-P-gp pathway. Transl. Oncol. 2021, 14, 101214. [Google Scholar] [CrossRef] [Scilit]
- Alexander, B.M.; Cloughesy, T.F. Adult Glioblastoma. J. Clin. Oncol. 2017, 35, 2402–2409. [Google Scholar] [CrossRef] [Scilit]
- Li, H.; Chen, L.; Li, J.J.; Zhou, Q.; Huang, A.; Liu, W.W.; Wang, K.; Gao, L.; Qi, S.T.; Lu, Y.T. miR-519a enhances chemosensitivity and promotes autophagy in glioblastoma by targeting STAT3/Bcl2 signaling pathway. J. Hematol. Oncol. 2018, 11, 70. [Google Scholar] [CrossRef] [Scilit]
- Narsinh, K.H.; Perez, E.; Haddad, A.F.; Young, J.S.; Savastano, L.; Villanueva-Meyer, J.E.; Winkler, E.; de Groot, J. Strategies to Improve Drug Delivery Across the Blood-Brain Barrier for Glioblastoma. Curr. Neurol. Neurosci. Rep. 2024, 24, 123–139. [Google Scholar] [CrossRef] [Scilit]
- Mou, Z.; Feng, Z.; Xu, Z.; Zhuang, F.; Zheng, X.; Li, X.; Qian, J.; Liang, G. Schisandrin B alleviates diabetic nephropathy through suppressing excessive inflammation and oxidative stress. Biochem. Biophys. Res. Commun. 2019, 508, 243–249, Erratum in Biochem. Biophys. Res. Commun. 2019, 511, 199-200. [Google Scholar] [CrossRef] [Scilit]
- Song, A.; Ding, T.; Wei, N.; Yang, J.; Ma, M.; Zheng, S.; Jin, H. Schisandrin B induces HepG2 cells pyroptosis by activating NK cells mediated anti-tumor immunity. Toxicol. Appl. Pharmacol. 2023, 472, 116574. [Google Scholar] [CrossRef] [Scilit]
- Li, W.; Fu, Y.; Sun, J.; Gong, H.; Yan, R.; Wang, Y. Construction and in vitro evaluation of pH-sensitive nanoparticles to reverse drug resistance of breast cancer stem cells. Discov. Oncol. 2024, 15, 21. [Google Scholar] [CrossRef] [Scilit]
- Nasser, M.I.; Han, T.; Adlat, S.; Tian, Y.; Jiang, N. Inhibitory effects of Schisandrin B on human prostate cancer cells. Oncol. Rep. 2019, 41, 677–685. [Google Scholar] [CrossRef] [Scilit]
- Fang, Y.; Pan, J.; Wang, P.; Wang, R.; Liang, S. A comprehensive review of Schisandrin B’s preclinical antitumor activity and mechanistic insights from network pharmacology. Front. Pharmacol. 2025, 16, 1528533. [Google Scholar] [CrossRef] [Scilit]
- Co, V.A.; El-Nezami, H.; Liu, Y.; Twum, B.; Dey, P.; Cox, P.A.; Joseph, S.; Agbodjan-Dossou, R.; Sabzichi, M.; Draheim, R. Schisandrin B Suppresses Colon Cancer Growth by Inducing Cell Cycle Arrest and Apoptosis: Molecular Mechanism and Therapeutic Potential. ACS Pharmacol. Transl. Sci. 2024, 7, 863–877, Erratum in ACS Pharmacol. Transl. Sci. 2024, 7, 3641–3642. [Google Scholar] [CrossRef] [Scilit]
- Jiang, Y.; Zhang, Q.; Bao, J.; Du, C.; Wang, J.; Tong, Q.; Liu, C. Schisandrin B suppresses glioma cell metastasis mediated by inhibition of mTOR/MMP-9 signal pathway. Biomed. Pharmacother. 2015, 74, 77–82. [Google Scholar] [CrossRef] [Scilit]
- Ahmed, Z.S.O.; Khan, E.; Elias, N.; Elshebiny, A.; Dou, Q. Updated Review on Natural Polyphenols: Molecular Mechanisms, Biological Effects, and Clinical Applications for Cancer Management. Biomolecules 2025, 15, 629. [Google Scholar] [CrossRef] [Scilit]
- Tan, S.; Zheng, Z.; Liu, T.; Yao, X.; Yu, M.; Ji, Y. Schisandrin B Induced ROS-Mediated Autophagy and Th1/Th2 Imbalance via Selenoproteins in Hepa1-6 Cells. Front. Immunol. 2022, 13, 857069. [Google Scholar] [CrossRef] [Scilit]
- Tang, Z.; Guo, C.; Wen, N.; Jin, H.; Dong, Y.; Xu, B.; Ma, X.; Han, L.; Liu, J. Combined Schisandrin B and Temozolomide Treatment Induces Mitochondrial Apoptosis in Glioma Cells. Front. Biosci. 2025, 30, 46410. [Google Scholar] [CrossRef] [Scilit]
- Lee, S.J.; Choi, Y.J.; Kim, H.I.; Moon, H.E.; Paek, S.H.; Kim, T.Y.; Ko, S.G. Platycodin D inhibits autophagy and increases glioblastoma cell death via LDLR upregulation. Mol. Oncol. 2022, 16, 250–268. [Google Scholar] [CrossRef] [Scilit]
- Li, Z.; Fu, W.J.; Chen, X.Q.; Deng, R.S.; Tang, X.P.; Niu, Q.; Zhou, H.; Li, S.S.; Ping, Y.F.; Bian, X.W. Autophagy-based unconventional secretion of HMGB1 in glioblastoma promotes chemosensitivity to temozolomide through macrophage M1-like polarization. J. Exp. Clin. Cancer Res. 2022, 41, 74. [Google Scholar] [CrossRef] [Scilit]
- Wang, M.; Liu, M.; Yang, C.; Hu, Y.; Liao, X.; Liu, Q. Autophagy Modulation in Therapeutic Strategy of Breast Cancer Drug Resistance. J. Cancer 2024, 15, 5462–5476. [Google Scholar] [CrossRef] [Scilit]
- Xing, Y.; Wei, X.; Liu, Y.; Wang, M.M.; Zhu, W.; Zhang, Y.; Guo, F.; Cao, J.L.; Qi, J.; Wang, W. Autophagy inhibition mediated by MCOLN1/TRPML1 suppresses cancer metastasis via regulating a ROS-driven TP53/p53 pathway. Autophagy 2022, 18, 1932–1954. [Google Scholar] [CrossRef] [Scilit]
- Hwang, Y.K.; Lee, D.H.; Lee, E.C.; Oh, J.S. Importance of Autophagy Regulation in Glioblastoma with Temozolomide Resistance. Cells 2024, 13, 1332. [Google Scholar] [CrossRef] [Scilit]
- Kazyken, D.; Dame, S.G.; Wang, C.; Wadley, M.; Fingar, D.C. Unexpected roles for AMPK in the suppression of autophagy and the reactivation of MTORC1 signaling during prolonged amino acid deprivation. Autophagy 2024, 20, 2017–2040. [Google Scholar] [CrossRef] [Scilit]
- Yan, L.S.; Zhang, S.F.; Luo, G.; Cheng, B.C.; Zhang, C.; Wang, Y.W.; Qiu, X.Y.; Zhou, X.H.; Wang, Q.G.; Song, X.L. Schisandrin B mitigates hepatic steatosis and promotes fatty acid oxidation by inducing autophagy through AMPK/mTOR signaling pathway. Metabolism 2022, 131, 155200. [Google Scholar] [CrossRef] [Scilit]
- Kim, J.; Kundu, M.; Viollet, B.; Guan, K.L. AMPK and mTOR regulate autophagy through direct phosphorylation of Ulk1. Nat. Cell Biol. 2011, 13, 132–141. [Google Scholar] [CrossRef] [Scilit]
- Bhoi, R.; Mitra, T.; Tejaswi, K.; Manoj, V.; Ghatak, S. Role of Ion Channels in Alzheimer’s Disease Pathophysiology. J. Membr. Biol. 2025, 258, 187–212. [Google Scholar] [CrossRef] [Scilit]
- Lallet-Daher, H.; Wiel, C.; Gitenay, D.; Navaratnam, N.; Augert, A.; Le Calvé, B.; Verbeke, S.; Carling, D.; Vindrieux, D.; Bernard, D. Potassium channel KCNA1 modulates oncogene-induced senescence and transformation. Cancer Res. 2013, 73, 5253–5265. [Google Scholar] [CrossRef] [Scilit]
- Ryland, K.E.; Svoboda, L.K.; Vesely, E.D.; McIntyre, J.C.; Zhang, L.; Martens, J.R.; Lawlor, E.R. Polycomb-dependent repression of the potassium channel-encoding gene KCNA5 promotes cancer cell survival under conditions of stress. Oncogene 2015, 34, 4591–4600. [Google Scholar] [CrossRef] [Scilit]
- Sun, H.; Luo, L.; Lal, B.; Ma, X.; Chen, L.; Hann, C.L.; Fulton, A.M.; Leahy, D.J.; Laterra, J.; Li, M. A monoclonal antibody against KCNK9 K(+) channel extracellular domain inhibits tumour growth and metastasis. Nat. Commun. 2016, 7, 10339. [Google Scholar] [CrossRef] [Scilit]
- Lee, I.; Lee, S.J.; Kang, T.M.; Kang, W.K.; Park, C. Unconventional role of the inwardly rectifying potassium channel Kir2.2 as a constitutive activator of RelA in cancer. Cancer Res. 2013, 73, 1056–1062. [Google Scholar] [CrossRef] [Scilit]
- Comes, N.; Bielanska, J.; Vallejo-Gracia, A.; Serrano-Albarrás, A.; Marruecos, L.; Gómez, D.; Soler, C.; Condom, E.; Ramón, Y.; Cajal, S.; et al. The voltage-dependent K(+) channels Kv1.3 and Kv1.5 in human cancer. Front. Physiol. 2013, 4, 283. [Google Scholar] [CrossRef] [Scilit]
- Jehle, J.; Schweizer, P.A.; Katus, H.A.; Thomas, D. Novel roles for hERG K(+) channels in cell proliferation and apoptosis. Cell Death Dis. 2011, 2, e193. [Google Scholar] [CrossRef] [Scilit]
- Taylor, M.D.; Northcott, P.A.; Korshunov, A.; Remke, M.; Clifford, S.C.; Eberhart, C.G.; Rutkowski, S.; Ellison, D.W.; Lichter, P.; Gilbertson, R.J. Molecular subgroups of medulloblastoma: The current consensus. Acta Neuropathol. 2012, 123, 465–472. [Google Scholar] [CrossRef] [Scilit]
- Fernández-Mariño, A.I.; Tan, X.F.; Bae, C.; Huffer, K.; Jiang, J.; Swartz, K.J. Inactivation of the Kv2.1 channel through electromechanical coupling. Nature 2023, 622, 410–417. [Google Scholar] [CrossRef] [Scilit]
- Redman, P.T.; He, K.; Hartnett, K.A.; Jefferson, B.S.; Hu, L.; Rosenberg, P.A.; Levitan, E.S.; Aizenman, E. Apoptotic surge of potassium currents is mediated by p38 phosphorylation of Kv2.1. Proc. Natl. Acad. Sci. USA 2007, 104, 3568–3573. [Google Scholar] [CrossRef] [Scilit]
- Torkamani, A.; Bersell, K.; Jorge, B.S.; Bjork, R.L.; Friedman, J.R.; Bloss, C.S.; Cohen, J.; Gupta, S.; Naidu, S.; Kearney, J.A. De novo KCNB1 mutations in epileptic encephalopathy. Ann. Neurol. 2014, 76, 529–540. [Google Scholar] [CrossRef] [Scilit]
- Zhu, X.; Chen, Y.; Xu, X.; Xu, X.; Lu, Y.; Huang, X.; Zhou, J.; Hu, L.; Wang, J.; Shen, X. SP6616 as a Kv2.1 inhibitor efficiently ameliorates peripheral neuropathy in diabetic mice. EBioMedicine 2020, 61, 103061. [Google Scholar] [CrossRef] [Scilit]
- Wang, H.Y.; Wang, W.; Liu, Y.W.; Li, M.Y.; Liang, T.Y.; Li, J.Y.; Hu, H.M.; Lu, Y.; Yao, C.; Ye, Y.Y.; et al. Role of KCNB1 in the prognosis of gliomas and autophagy modulation. Sci. Rep. 2017, 7, 14. [Google Scholar] [CrossRef] [Scilit]
- Hosokawa, N.; Hara, T.; Kaizuka, T.; Kishi, C.; Takamura, A.; Miura, Y.; Iemura, S.; Natsume, T.; Takehana, K.; Yamada, N.; et al. Nutrient- dependent mTORC1 association with the ULK1-Atg13-FIP200 complex required for autophagy. Mol. Biol. Cell 2009, 20, 1981–1991. [Google Scholar] [CrossRef] [Scilit]
- Behrends, C.; Sowa, M.E.; Gygi, S.P.; Harper, J.W. Network organization of the human autophagy system. Nature 2010, 466, 68–76. [Google Scholar] [CrossRef] [Scilit]
- Chen, Y.; Gibson, S.B. Tumor Suppressing Subtransferable Candidate 4 Expression Prevents Autophagy-Induced Cell Death Following Temozolomide Treatment in Glioblastoma Cells. Front. Cell Dev. Biol. 2022, 10, 823251. [Google Scholar] [CrossRef] [Scilit]
- Segala, G.; David, M.; Serhan, N.; Vergez, F.; Mougel, A.; Saland, E.; Carayon, K.; Leignadier, J.; Caron, N.; Voisin, M. Dendrogenin A drives LXR to trigger lethal autophagy in cancers. Dendrogenin A drives LXR to trigger lethal autophagy in cancers. Nat. Commun. 2017, 8, 1903. [Google Scholar] [CrossRef] [Scilit]

Disclaimer/Publisher’s Note: The statements, opinions and data contained in all publications are solely those of the individual author(s) and contributor(s) and not of MDPI and/or the editor(s). MDPI and/or the editor(s) disclaim responsibility for any injury to people or property resulting from any ideas, methods, instructions or products referred to in the content. |
© 2026 by the authors. Licensee MDPI, Basel, Switzerland. This article is an open access article distributed under the terms and conditions of the Creative Commons Attribution (CC BY) license.