


Abstract
Objective: It has been previously demonstrated that the development of numerous autoimmune and neurological diseases in humans, as well as in experimental autoimmune encephalomyelitis mice, results from a disruption in the differentiation profile of bone marrow stem cells (BMSCs). This disruption leads to inflammation and the emergence of antibodies with diverse catalytic activities. We hypothesized that the development of Alzheimer’s disease (AD), particularly at its early stages, may also be associated with an altered differentiation profile of BMSCs. Methods: One of the earliest and statistically reliable indicators of developing autoimmune reactions is the appearance of abzymes—catalytically active antibodies—in the blood of patients and mice, whereas they are absent in healthy donors. Immunoglobulin G (IgG) antibodies targeting five individual histones (H1, H2A, H2B, H3, and H4) were isolated from the blood of 5xFAD mice at various stages of AD progression. Results: It has been demonstrated that the development of AD in 5xFAD mice begins with an impairment of the BMSC differentiation profile. The isolated antibodies effectively hydrolyzed all five histones. The progression of AD over 10, 20, 40, and 100 days was associated with the development of autoimmune reactions, reflected by a steady increase in the number of cleavage sites across the five histones. Depending on the histone, this number rose from 1 to 9 cleavage sites at early time points to 16–18 sites by day 100, corresponding to advanced pathology. Conclusions: Potential reasons for the marked differences in the specific types and numbers of histone cleavage sites during the progression of Alzheimer’s disease are discussed.
1. Introduction
Histones are critically important for chromatin function. However, free extracellular histones present in various biological fluids typically act as highly damaging factors [1]. Administration of exogenous histones to mice leads to several toxic responses associated with inflammatory reactions, including activation of Toll-like receptors, which contributes to the development of various diseases [1].
Within nucleosome particles, specific protein tetramers contain two molecules of histones H3 and H4, around which two dimers of histones H2B and H2A interact with double-stranded DNA [2]. H3 histone is crucial for epigenetics. Histone H1 plays a vital role in the packing of higher-order chromatin substructures.
Systemic lupus erythematosus (SLE) is a diffuse systemic disease of connective tissue characterized by immune complex-mediated damage to the connective tissue of vessels in the microcirculatory bed [3]. Multiple sclerosis (MS) is an autoimmune neurological disease that affects the central nervous system [4,5,6]. In SLE, as well as in a large number of other autoimmune diseases (AIDs) and some neurodegenerative diseases (NDDs), including multiple sclerosis (MS), autoantibodies—both with and without catalytic activities—are formed against a variety of antigens.
Various artificial antibodies with catalytic activities (abzymes, ABZs) directed against stable analogs of chemical reaction transition states, as well as their applications [7,8,9,10], and natural catalytic antibodies are well described in the literature [11,12,13,14,15,16,17,18,19,20,21,22,23,24,25,26,27,28]. Natural auto-abzymes capable of hydrolyzing different oligopeptides, proteins, poly- and oligosaccharides, nucleotides, and various nucleic acids (DNAs, RNAs, and micro-RNAs) have been discovered in the biological fluids of patients with several autoimmune and neurological diseases [24,25,26,27,28,29,30,31,32,33,34]. Healthy humans and animals typically lack catalytic antibodies [25,26,27,28]. However, auto-abzymes with very low enzymatic activities degrading vasoactive neuropeptides [29], polysaccharides [30], and thyroglobulin [31,32] have been detected in the blood of some healthy individuals.
The biological fluids of patients with MS and SLE contain catalytic antibodies (abzymes) that degrade myelin basic protein (MBP), five histones, various DNAs, RNAs, and oligosaccharides [25,26,27,28]. Catalytic antibodies that hydrolyze beta-amyloid peptide in patients with Alzheimer’s disease have been obtained and characterized [35,36,37,38]. The authors suggest that such abzymes could potentially be used to treat patients with Alzheimer’s disease.
It seems very interesting to understand the similarities and/or differences in the mechanisms underlying the development of autoimmune and neurological diseases. It has been shown that 30–50% of patients with SLE exhibit inflammation and features characteristic of patients with MS, and vice versa [39,40,41]. Some specific markers of disease, including those related to brain damage, have been found to be similar in SLE, MS, and Alzheimer’s disease [42,43,44]. This suggests that despite the differences in the final clinical manifestations of various autoimmune and neurological pathologies, they may share some common mechanisms of development.
Autoimmune diseases were first proposed to potentially originate from intrinsic defects of bone marrow hematopoietic stem cells [45]. Later, it was shown that spontaneous and antigen-accelerated development of SLE and multiple sclerosis occurs as a result of specific, yet to some extent similar, reorganization of hematopoietic bone marrow stem cells (BMSCs) [25,26,27,28,46]. EAE-prone C57BL/6, Th, 2D2, and SLE-prone MRL-lpr/lpr mice were used to analyze possible mechanisms not only of spontaneous but also of antigen-accelerated development of these pathologies [46,47]. It was demonstrated that the development of these diseases over time occurs due to specific changes in the differentiation profiles of BMSCs, associated with the appearance of various catalytic antibodies that hydrolyze DNAs, RNAs, MBP, histones, polysaccharides, peptides, and proteins.
The detection of various auto-abzymes has been revealed as the earliest and statistically significant marker of the onset and progression of several AIDs and NDDs [25,26,27,28,46,47]. The enzymatic activities of antibodies can be easily detected even at the onset of several pathologies with autoimmune reactions (i.e., the pre-disease stage or the beginning of different diseases), before the discovery of specific, typical markers of various AIDs and NDDs [25,26,27,28,46,47]. Titers of auto-antibodies to auto-antigens at the beginning of many AIDs and NDDs often fall within the typical index ranges characteristic of healthy individuals [25,26,27,28,46,47]. The appearance of multiple catalytic antibodies clearly indicates the onset of autoimmune processes; an increase in the catalytic activities of antibodies is associated with the progression to profound pathology [25,26,27,28,46,47]. Although several parallel mechanisms may contribute to the development of different autoimmune and neurological diseases, in all cases, a breakdown of self-tolerance may be involved.
We hypothesized that, similar to SLE and MS, the initial stages of Alzheimer’s disease development may be associated with a disruption of the stem cell differentiation profile, development of autoimmune processes, and the emergence of specific B lymphocytes producing abzymes that are harmful to humans. Abzymes that cleave five individual histones are of particular interest for assessing possible mechanisms underlying the development of autoimmune and neurological pathologies. The main antigens in the development of SLE and some other AIDs are complexes of nuclear histones with DNA, which appear in biological fluids as a result of cell apoptosis [3]. Approximately 30–40% of auto-antibodies against DNA–histone complexes possess DNase and protease activities [28]. These antibodies are capable of penetrating through cellular and nuclear membranes and hydrolyzing nuclear DNA and histones, thereby stimulating cell death via apoptosis, which leads to an increase in the development of autoimmune reactions.
Abzymes hydrolyzing five histones (H1, H2A, H2B, H3, and H4) and DNA have been found in the sera of patients with SLE, HIV infection, schizophrenia, and two neurological diseases: multiple sclerosis (MS) and tick-borne encephalitis [24,25,26,27,28,46,47].
For a detailed analysis of the mechanisms of EAE development, we previously used C57BL/6 [25,26,27,28,47,48,49,50,51,52,53], Th [54], and 2D2 mouse lines [55]. It was shown that EAE development in these mouse lines begins with a change in the differentiation profile of BMSCs, paralleled by the appearance in the blood of abzymes hydrolyzing all five histones [49,50,51,52,53,54,55]. Moreover, similar to human MS, EAE development in mice occurred in several stages, each corresponding to the appearance of various abzymes that hydrolyze the five histones with different relative activities and at distinct sites along their protein sequences [49,50,51,52,53,54].
The brain’s response to injury includes the activation of intrinsic microglia and the influx of leukocytes, collectively constituting neuroinflammation. Although the details differ, the neuroinflammation that exacerbates neurodegeneration shares similarities across MS, AD, and other neurological diseases [56,57,58,59,60]. Alzheimer’s disease (AD) is a complex neurodegenerative disease associated with neuroinflammation and the pathological accumulation of insoluble forms of two proteins—amyloid β and hyperphosphorylated Tau protein [61,62,63,64]. Neuroinflammation in Alzheimer’s disease has been described in many articles, including [58,59,60]. Beta-amyloid deposition in Alzheimer’s disease stimulates a spectrum of neuroinflammation activated by microglia; the activation of microglia and astrocytes induces the expression of various inflammatory and anti-inflammatory cytokines. Neuroinflammation is considered one of the main cardinal hallmarks of Alzheimer’s disease [60]. Several pathways, including p38 MAPK/mTOR, MAPK, NFκB, nitric oxide, caspase, and COX, participate in triggering immune responses in brain astrocytes and microglia to secrete inflammatory cytokines such as interleukins, tumor necrosis factor, and chemokines in Alzheimer’s disease pathology [60].
Inflammation is a protective and adaptive process that occurs in response to injury or the action of a pathogenic irritant. Autoimmune processes are disorders in which the immune system attacks its own tissues, mistaking them for foreign ones. Immunization of healthy individuals with various external antigens can lead to inflammatory processes, but no disturbance in the differentiation profile of stem cells has been detected (Refs. [25,26,27,28] and references therein).
It is believed that the development of AIDs and neurological diseases, including MS, AD, and some other pathologies, may be stimulated by foreign antigens, including various bacteria or viruses [25,26,27,28]. Molecular mimicry, due to homology between human and viral or bacterial molecules, may participate in the autoimmune pathogenesis of neurological disease following antigen penetration through the blood–brain barrier, stimulating specific changes in the proliferation profile of bone marrow stem cells (BMSCs) that lead to the production of antibodies and abzymes against such antigens. Over long periods of illness, specific switching of the immune system toward the synthesis of B lymphocytes that produce antibodies against self-antigens may occur [25,26,27,28].
At present, Alzheimer’s disease is believed to be a multifactorial pathology involving a large number of mutations in various genes and proteins [65,66,67,68,69,70]. It was important to determine whether the development of Alzheimer’s disease is also, to some degree, similar to SLE and MS pathologies, which are associated with a change in the profile of stem cell differentiation and the production of Abs-abzymes.
Various mouse models of this disease are used to study the mechanisms of pathogenesis of the multifactorial nature of Alzheimer’s disease. These models include transgenic mice carrying human genes with one, two, or more mutations associated with human Alzheimer’s disease (APP, PS1, PS2, MAPT, and ApoE4) [71,72,73]. Knockout mouse lines for these genes have also been created [74].
Different mutations have various effects on the development of Alzheimer’s disease [75]. These mutations are named according to the geographic origin of the first identified family of mutation carriers. The Swedish APP mutation (KM670/671NL) is associated with increased formation of Aβ and increases its level in plasma by 2- to 3-fold [76]. Other discovered mutations include: Flemish (A692G) [77,78,79], Italian (E693K) [80], Dutch (E693Q) [81], Iowa (D694N) [82], Iranian (T714A) [83], Australian (T714I) [84,85], French (V715M) [86], German (V715I) [87], Florida (I716V) [88], London (V717I) [89], Indiana (V717L) [90], and Arctic (E693G) [91].
The mouse line 5xFAD is the earliest-onset mouse model. This model includes the Florida, Swedish, and London APP protein mutations and two additional mutations in the PSEN1 gene (M146V and L286V) [92]. All transgenes are efficiently expressed under the control of the murine Thy-1 promoter. The 5xFAD model is considered to represent an extreme pathology: mice aged 1.5–2.0 months exhibit extracellular accumulation of Aβ senile plaques and the absence of specific neuronal populations by 2 months of age. Moreover, these mice show cognitive impairment much earlier than other mouse models of ALS [93,94].
To analyze the mechanisms of the stage-by-stage development of Alzheimer’s disease, we used the 5xFAD mouse model of cerebral amyloidosis with early onset of the disease after birth. This transgenic mouse model demonstrates phenotypic features that reproduce some pathological signs of the human disease [95,96,97]. A clear shift in gene expression patterns was found in 5xFAD mice between 1 and 9 months of life [95,96,97,98].
According to studies [95,96,97], noticeable signs of disease onset in 5xFAD mice begin to appear at two months after birth, and after another 100 days, the animals reach the stage of deep pathology.
In this work, for the first time, an analysis was conducted to determine whether the pathogenesis and development of Alzheimer’s disease in 5xFAD mice over time may be somewhat similar to those in SLE and MS mice and associated with a change in the differentiation profile of bone marrow stem cells and the synthesis of highly harmful histone-degrading abzymes. The development of such a multifactorial disease may occur through several parallel, complex pathogenetic pathways, including a disruption of the immune system. In this study, we assessed the differentiation profile of bone marrow stem cells from 0 to 100 days (10, 20, 40, and 100 days) after the start of the experiment (2 months of age of mice after birth). In parallel, IgG antibodies were isolated from the blood plasma of 5xFAD mice and their catalytic activities in the cleavage of five histones were analyzed. The study of abzymes at different stages of Alzheimer’s disease progression in 5xFAD mice allowed us to reveal how the relative activity of catalytic antibodies and their sequence specificity with respect to histones may change depending on the stage of pathology development. It was shown that, as in the case of EAE-prone mice [25,26,27,98], both a change in the differentiation profile of bone marrow stem cells and the synthesis of abzymes with specific characteristics for each stage of AD development are observed over time.
2. Materials and Methods
2.1. Materials, Chemicals, and Experimental Animals
High-purity reagents (glycerol, NH4HCO3, urea, Tris, SDS, various salts, EDTA, DTT, HEPES, benzylpenicillin sodium salt, L-glutamine, gentamicin and some other compounds) were obtained from Sigma (St. Louis, MO, USA). RPMI-1640 medium (Biolot, Saint-Petersburg, Russia, 1.3.4.10); fetal bovine serum (Cat. #RM10832-500ML, HiMedia, Maharashtra, India) were also used.
An equimolar mixture of individual human histones (H1, H2A, H2B, H3, and H4) and homogeneous individual H1, H2B, H3, and H4 histones were obtained from Sigma (St. Louis, MO, USA). Columns of Protein G-Sepharose and Superdex 200 were purchased from GE Healthcare (New York, NY, USA). Two-month-old 5xFAD and control BALB/c and CBA mice (zero time of the experiment) were used to analyze possible mechanisms of spontaneous AD development. Key data from the analysis of control BALB/c and CBA mice have been published previously [25,26,27,28,46].
They were raised in the vivarium of the Institute of Cytology and Genetics (ICG) under specific pathogen-free conditions. All experiments with 5xFAD and control BALB/C and CBA mice were approved by the Bioethical Committee of the Institute of Chemical Biology and Fundamental Medicine (protocol document number 21-4, dated 7 August 2020) in accordance with the principles of the European Communities Council Directive 86/609/CEE concerning experiments with animals. The study was supported by the Institute’s Committee.
2.2. Bone Marrow Progenitor Cell Analysis
Bone marrow preparations from 5xFAD mouse femurs were obtained, and the ability of cells to form different colonies was assessed as described in [46,47,48]. Four dishes per mouse (2 × 10⁴ cells) corresponding to 0, 10, 20, 30, 40, 70, and 100 days (7 mice per group; in some cases, there are fewer time points) after the start of experiments (2-month-old mice; zero time) were cultured under standard conditions using methylcellulose-based M3434 medium (StemCell Technologies, Vancouver, BC, Canada), which is specific for mouse cells. The medium was prepared according to the manufacturer’s instructions and, in addition to methylcellulose, contained stem cell factor, IL-6, erythropoietin (EPO), and IL-3.
The relative number of CFU-GEMM, BFU-E, CFU-GM, and CFU-E cell colonies on four dishes was calculated after fourteen days of incubation at 37 °C (5% CO2) in a humidified incubator.
Figure 1 (see below) compares data on changes in the bone marrow stem cell differentiation profile in 5xFAD and C57BL/6 mice over 100 and 40 days, respectively. This is because data for C57BL/6 mice were obtained and published previously [47]. At that time, the literature data indicated that maximal changes in various parameters after immunization of C57BL/6 mice with MOG occur at approximately 20 days, followed by remission. Therefore, data for C57BL/6 mice were obtained for up to 40 days both before and after immunization of the mice. Figure 1 clearly demonstrates distinct differences in colony formation up to 40 days between C57BL/6 and 5xFAD mice.
Figure 1.
In time changes in the number of BFU-E (A), CFU-E (B), CFU-GM (C), and CFU-GEMM (D) colony-forming units during spontaneous Alzheimer’s disease development in 5xFAD (red curves) and EAE in C57BL/6 (black curves) mice. Each analyzed group consisted of 7 mice. The relative number of different colonies was calculated per 15,000 bone marrow cells. Data are presented as mean ± standard deviation. The same data are presented as mean ± standard error in Supplementary Data (Figure S1). For comparison, data for C57BL/6 mice are taken from [47], where the analysis of index changes was carried out only up to 40 days.
2.3. Evaluation of Different Lymphocytes
The content of total lymphocytes, as well as B and T cells, in various organs of 5xFAD mice was determined by flow cytometry. Different organs of mice were obtained after standard decapitation. Lymphocytes were isolated from the spleen, thymus, lymph nodes, and bone marrow of 7 mice per group. Bone marrow was obtained by washing the femoral cavity. Lymph nodes and thymus were thoroughly homogenized using a glass homogenizer. Particulate matter was then removed, and the resulting cells were resuspended by passing them through the needle of a disposable syringe. Spleen cells were obtained by washing the organs using a medium-filled syringe through punctures in the spleen stroma. This approach allowed the isolation of splenocytes without contamination from the organ stroma. Cells were washed three times by centrifugation with 5 mL of RPMI-1640 medium for 12 min at 1500 rpm. After the final centrifugation, 1.0 mL of RPMI-1640 medium containing 10.9 mM HEPES, 0.50 mM 2-mercaptoethanol, 10% fetal bovine serum, 100 μg/mL benzylpenicillin, 2.0 mM L-glutamine, and 80 μg/mL gentamicin was added to the cell pellets, and the lymphocytes were counted.
To study the relative cell content in extracts from various organs, 500,000 cells were used in 110 μL of PBS buffer containing 10% fetal bovine serum and various conjugates of specific monoclonal antibodies. To analyze the relative content of various lymphocytes, specific anti-CD45-BV510 (Biolegend cat. #103138), anti-CD4-PerCP (Biolegend cat. #100432), anti-CD3-FITC (Biolegend cat. #100204), anti-CD19-PE (Biolegend cat. #115508), and anti-CD8α-APC (Biolegend cat. #126614) antibodies were used. All cell staining was performed according to the manufacturer’s recommendations. Incubation was carried out in the dark at 4 °C for 20 min in accordance with the manufacturer’s instructions for fluorescent antibodies (https://www.biolegend.com/protocols/cell-surface-flow-cytometry-staining-protocol/4283/ accessed on 12 November 2026).
Samples were then washed by centrifugation after the addition of 500 μL of PBS buffer (0.02% EDTA and 1% sodium azide). After centrifugation, 50 μL of PBS buffer was added to the cell pellets, and all resulting samples were analyzed using a BD FacsVerse flow cytometer (BD Biosciences, San Jose, CA, USA). At least 100,000 events were collected per sample. Gating was performed as follows: the total lymphocyte population was distinguished based on granularity and cell size; leukocyte types were identified using the pan-leukocyte marker CD45+, and populations of CD3− and CD3+ cells were isolated. Within the CD3+ lymphocyte population (T cells), CD4+ and CD8+ T cells were enumerated, and within the CD3− cell population, the content of CD19+ B cells was also counted. For each group of cell samples, the percentage relative to the initial lymphocyte population was determined. The gating strategy diagram, using an example of cells isolated from lymph nodes, is provided in the Gating Strategy diagram on Supplementary Figure S6.
2.4. Antibody Purification
Electrophoretically homogeneous polyclonal IgG preparations from the blood plasma of 5xFAD mice (7 mice per group) were first isolated by affinity chromatography of plasma proteins on Protein G-Sepharose. IgG samples were then subjected to fast protein liquid chromatography (FPLC) gel filtration on a Superdex-200 HR 10/30 column as described previously [48,49,50,51,52,53,54,55]. The central portion of the antibody peaks after gel filtration was passed through filters (pore size 0.1 µm) and then used for various analyses.
2.5. Proteolytic Activity Assay
The proteolytic activity of all IgG abzymes was assayed by sodium dodecyl sulfate–polyacrylamide gel electrophoresis (SDS-PAGE). Reaction mixtures (10–17 µL) contained Tris-HCl buffer (20 mM; pH 7.5), a mixture of five individual histones (H1, H2A, H2B, H3, and H4), and IgG preparations (0.01–0.02 mg/mL) as described in [48,49,50,51,52,53]. The reaction mixtures were incubated at 37 °C for 3–20 h (mostly 10–12 h), depending on the relative activity of the antibodies, and then the reactions were stopped by the addition of SDS. The gels were stained using Coomassie Blue. Relative activities (RAs) were estimated from the decrease in protein band intensity compared to non-hydrolyzed histones from control experiments. All relative activities of antibodies were estimated using the linear portions of the curves relating IgG concentration and reaction time and were then recalculated to the same concentration and time.
2.6. MALDI-TOF Analysis of Histone Hydrolysis
Individual H1, H2A, H2B, H3, and H4 histones were hydrolyzed for 0–20 h in the presence of IgG samples using the standard conditions described above; IgG samples corresponded to different time points of AD pathology development. The identification of H1, H2B, H3, and H4 cleavage products was carried out using a nitrogen laser VSL-337 ND (337 nm; 3 ns pulse duration) on a Reflex III system (Bruker, Frankfurt, Germany). Aliquots (1–2 µL) of reaction mixtures after incubation at 37 °C for 0–20 h were used for MALDI-TOF mass spectrometry analysis. Two matrices were used: sinapinic acid and α-cyano-4-hydroxycinnamic acid. To 1.9 µL of the matrices and 1.9 µL of 0.2% trifluoroacetic acid, 1.9 µL of the solutions containing histones (0.75 mg/mL) were added, and 1.0–2.0 µL of the resulting mixtures were applied to MALDI iron plates. They were then air-dried. All spectra were calibrated using standard calibrant mixtures of proteins (I and II) or mixtures of oligopeptides (Bruker Daltonics, Bremen, Germany) using both external and internal calibration modes. The determination of molecular weights (in Daltons) and specific sites of histone cleavage by different IgG abzyme samples was carried out using Protein Calculator v3.3 (Scripps Research Institute).
2.7. Statistical Analysis
OriginPro 2019 software (https://www.originlab.com/2019, accessed on 6 November 2025; OriginLab Corporation, Northampton, MA, USA) was used for statistical analysis. The Shapiro–Wilk test was used to determine the distribution type of data in individual samples. Because the data were predominantly non-normally distributed, the Mann–Whitney test was used to calculate the significance of differences between groups at specific time points. Data are presented as mean ± standard deviation (in the text of the article) and mean ± standard error (in Supplementary Materials; Figures S1–S4). Differences were considered significant at p < 0.05.
3. Results
3.1. Hematopoietic Progenitor Colony Formation
As previously shown, the development of SLE and other AIDs, as well as MS in humans and EAE in mice, begins as a result of specific changes in the differentiation profile of bone marrow stem cells (BMSCs) and increased lymphocyte proliferation in various organs [25,26,27,28,47,48,49,50,51,52,53,54,55].
As indicated above, C57BL/6 mice were used to generate 5xFAD mice into which genes associated with the development of human Alzheimer’s disease were introduced. The C57BL/6 mouse line is not formally related to mice with spontaneous EAE development; it is designated as a model of antigen-induced disease development. However, a number of studies have shown that these mice are characterized by very slow development of autoimmune reactions due to changes in the differentiation profile of bone marrow stem cells and abzyme synthesis [47,48,49,50,51,52,53,54,55]. Taking this into account, it was important to understand how the introduction of specific genes associated with Alzheimer’s disease into mice alters the immunological indices in 5xFAD mice compared to C57BL/6 mice.
The temporal changes in the differentiation profile of BMSCs during spontaneous AD development in 5xFAD mice were analyzed and compared with those in C57BL/6 mice (Figure 1).
As can be seen from Figure 1A, the relative number of BFU-E cells in C57BL/6 mice at the beginning of the experiment is approximately 1.7 times greater than in 5xFAD mice (p < 0.05). Spontaneous development of EAE in 5xFAD mice by 40 days leads to an approximately 2-fold increase in the number of these colonies (p < 0.05), whereas in C57BL/6 mice, a strong increase in their number is observed after 20 days.
The relative number of CFU-E cells in the bone marrow of 5xFAD mice is approximately 4 times lower than in C57BL/6 mice at time zero of the experiment (p < 0.05). At the same time, the number of these cells increases in C57BL/6 mice by day 40 and becomes five times greater than in 5xFAD mice (p < 0.05).
It is interesting that the number of CFU-GM colonies in 5xFAD and C57BL/6 mice at time zero is almost the same, but the increase in these cells in 5xFAD mice occurs faster and by day 20 becomes 1.3 times greater than in C57BL/6 mice (p < 0.05). Notably, the relative number of CFU-GEMM cells in 5xFAD mice is 3 times greater than in C57BL/6 mice at time zero (p < 0.05). Moreover, in C57BL/6 mice, there is a decrease in the number of these cells over time, whereas in 5xFAD mice, there is a noticeable increase.
Thus, the introduction of genes that stimulate the development of Alzheimer’s disease in mice leads to significant or essential changes in the differentiation profile of stem cells in 5xFAD mice compared to C57BL/6 mice.
3.2. The Relative Content of Lymphocytes in Different Organs of 5xFAD Mice
Analysis of the relative content of total lymphocytes was previously estimated in C57BL/6 mice [47], whereas the assessment of T and B lymphocytes in different organs was previously carried out only in Th and 2D2 mice [54,55].
The relative content of total lymphocytes in the bone marrow of C57BL/6 mice gradually increased 2-fold over 40 days of spontaneous autoimmune reaction development [47]. Figure 2 demonstrates temporal changes in total lymphocytes as well as T and B cells in the bone marrow of 5xFAD mice.
Figure 2.
Temporal changes in the content of total lymphocytes (A), B cells (B), T cells (C), CD8+ T cells (D), and CD4+ T cells (E) in the bone marrow of 5xFAD mice. Each analyzed group consisted of 7 mice. Data are presented as mean ± standard deviation. The same data are presented as mean ± standard error in Supplementary Data (Figure S2).
In contrast to C57BL/6 mice, the content of total lymphocytes in the bone marrow of 5xFAD mice decreased up to 40 days and then began to increase (Figure 2A). Interestingly, the decrease in the total number of lymphocytes is associated with a decrease in B cells up to 40 days (Figure 2B), whereas the content of T lymphocytes increases (Figure 2C). The relative numbers of CD8+ T cells and CD4+ T cells at time zero are comparable, and their numbers increase up to 20–40 days (Figure 2D,E).
The relative average content characterizing B cells, total T cells, as well as CD8+ and CD4+ T cells in different organs of 5xFAD mice at two months of age and during spontaneous AD development was estimated (Figure 3).
Figure 3.
Changes in total T lymphocytes, as well as CD8+ and CD4+ T cell content in different organs of 5xFAD mice: lymph nodes (A), spleen (B), and thymus (C). Panel (D) shows temporal changes in B lymphocytes in various organs. Each analyzed group consisted of 7 mice. Data are presented as mean ± standard deviation. The same data are presented as mean ± standard error in Supplementary Data (Figure S3).
The total content of all types of T lymphocytes decreased in the following order (%): lymph nodes (69.5) > spleen (32.2) > thymus (20.0) (Figure 3; p < 0.05). In all organs during the development of pathology, the change in the content of total lymphocytes was relatively weak.
The content of B lymphocytes in these organs differed greatly. Most of the B lymphocytes were found in (%) the following: spleen (60.6), lymph nodes (27.6), and thymus (approximately 5.0) (p < 0.05). The relative number of B lymphocytes in the spleen changed slightly over time. In the lymph nodes, there was a temporary tendency toward a decrease in the number of B lymphocytes up to 20 days, followed by a slow increase. The number of B lymphocytes was higher than that of T lymphocytes (Figure 3).
In contrast to 5xFAD mice, C57BL/6 mice showed a time-dependent decrease in the relative number of lymphocytes in lymph nodes, a slight increase in the thymus, and a sharp increase in the spleen after 20 days from the beginning of experiments [47].
Thus, C57BL/6 and 5xFAD mice demonstrate significant differences both in the differentiation profiles of BMSCs and in the characteristics of lymphocyte proliferation in various organs.
3.3. Criteria Analysis of Protease Activities of IgGs
As mentioned above, the appearance of abzymes with various catalytic activities is a very specific and the earliest marker of various autoimmune reactions at the onset and during the progression of many pathologies [24,25,26,27,28,46,47,48,49,50,51,52,53,54,55]. Antibodies from healthy non-autoimmune BALB/c and CBA mice and conditionally healthy humans usually possess no activity in the hydrolysis of histones or other substrates [24,25,26,27,28,46,47,48,49,50,51,52,53,54,55]. The blood sera of diseased SLE and EAE mice contain abzymes that degrade DNA, RNA, ATP, MBP, five histones, and oligosaccharides [24,25,26,27,28,46,47,48,49,50,51,52,53,54,55].
Electrophoretically homogeneous IgGs from individual 5xFAD mice were isolated using affinity chromatography of blood serum components on Protein G-Sepharose under conditions that remove non-specifically bound proteins, similarly to [46,47,48,49,50,51,52,53,54,55]. These IgG samples were then additionally purified using FPLC gel filtration. The homogeneity of all IgG preparations was demonstrated by SDS-PAGE analysis using a mixture of 21 antibody preparations (IgGmix) (Figure 4).
Figure 4.
Homogeneity assay of IgGmix (21 µg) by SDS-PAGE under non-reducing conditions (in the absence of DTT). The top panel shows the relative activity (RA %) of IgG abzymes in the cleavage of five histones, estimated using eluates of 2–3 mm gel fragments. After incubation of the five-histone mixture for 17 h with the eluates, complete cleavage of all five histones was taken as 100%. Data are presented as mean ± standard deviation. The bottom panel shows the position of IgGs. Errors in RA estimation from 2 to 3 experiments did not exceed 9–10%.
SDS disrupts even the most robust protein associations, including immune complexes. Classical proteases typically have molecular masses (MWs) ranging from 20 to 30 kDa. After SDS-PAGE, the positions of proteolytic activities corresponded to small gel fragments containing only intact IgG antibodies (150 kDa), with no other protein bands or catalytic activities observed in other gel zones (Figure 4). Thus, using a stringent criterion similar to that in [46,47,48,49,50,51,52,53,54,55], it was shown that histone-splitting activity is intrinsic to the IgGmix from 5xFAD mice and is not due to co-purified classical enzymes.
3.4. Temporal Changes in Relative Protease Activity of IgGs
Here, we analyzed the relative protease activity of IgGs from the blood sera of 5xFAD mice in the hydrolysis of five histones during 100 days of AD development after the start of the experiment. Figure 5 shows a representative analysis of the relative hydrolysis of five histones by six IgG preparations with different activities using SDS-PAGE.
Figure 5.
SDS-PAGE assay of the hydrolysis of five histones by six individual IgG samples differing in their relative activities (RAs). Lane Cont corresponds to a mixture of five histones incubated without IgGs. The incubation time of the mixtures was 10 h. The arrows indicate the positions of molecular mass markers shown in the right lane of the gel.
Such SDS-PAGE analysis data were obtained for all IgG preparations corresponding to 10, 20, 40, 70, and 100 days of AD pathology development in two-month-old mice. Based on electrophoretic data from two independent experiments, the relative activity in the hydrolysis of five histones was evaluated for each IgG preparation. Figure 6 shows the change in the relative hydrolysis of each of the five individual histones by preparations corresponding to 0–100 days of AD development in two-month-old mice.
Figure 6.
Relative proteolytic activities of IgG abzymes in the cleavage of five individual histones corresponding to different stages of AD development. At each time point, seven antibody preparations were used. For each histone, the activity of its hydrolysis was assessed using IgGs corresponding to different time periods starting at zero time, and complete hydrolysis of each histone in all cases was taken as 100%. Data are presented as mean ± standard deviation of 3 independent experiments. The same data are presented as mean ± standard error in Supplementary Materials (Figure S4). Data for control BALB/c and CBA mice not predisposed to the development of AIDs or neurological diseases are not shown in Figure 6, since antibodies from these mice do not hydrolyze histones [46,47,48].
As noted above, the first signs of disease in 5xFAD mice appear at 2.0 months of life. From Figure 6, it is evident that at 2 months after birth, noticeable IgG-dependent hydrolysis is observed only for the H2A and H2B histones. The hydrolysis of the other three histones (H1, H3, and H4) at zero time is very weak and comparable. However, the efficiency of hydrolysis of all five histones increases sharply (2- to 58-fold) during 20–40 days after the start of the experiment (p < 0.05). A strong and approximately equal decrease in the hydrolysis efficiency of all five histones by antibodies is observed over the period from 20–40 to 70 days. It should be noted that the transition to deeper pathology from 70 to 100 days leads to a significant increase in the activity of antibody abzymes in the hydrolysis of all five histones. The activity of antibodies from the blood of non-autoimmune BALB/c and CBA mice over 100 days is close to zero within experimental error [46,47,48]. These data indicate that during AD development in 5xFAD mice, there may be an emergence of B lymphocytes producing abzymes with different activities toward each of the individual histones.
The progression of MS in humans and experimental EAE mice occurs in several stages. Taking this into account, we previously analyzed not only the relative activity of IgGs in C57BL/6 mice, but also the possibility of changes in the number and type of hydrolysis sites of the five histones during the progression of pathology [49,50,51,52,53]. It was found that simultaneously with the change in the relative activity of abzymes, the number and type of hydrolysis sites can vary greatly [49,50,51,52,53]. Considering this, we analyzed the hydrolysis sites of histones using IgGs from the blood sera of 5xFAD mice at 10, 20, 40, and 100 days after the start of the experiments.
3.5. MALDI-TOF Spectra Corresponding to Products of Histone Hydrolysis
IgG fractions corresponding to different days after the start of the experiments (10, 20, 40, and 100 days) were used to identify the cleavage sites of H1, H2B, H3, and H4 histones by MALDI-TOF mass spectrometry (Figure 7, Figure 8, Figure 9 and Figure 10).
Figure 7.
MALDI-TOF spectra corresponding to peptides of H1 (0.7 mg/mL) cleavage in the absence (A) and presence of Abs (0.02 mg/mL) corresponding to 10 (B), 20 (C), 40 (D), and 100 (E) days of AD pathology development after the start of the experiment (2-month-old mice). The inset to (E) (black spectrum) shows a more detailed spectrum corresponding to the main gray spectrum region from 11,109.0 to 11,773.4 Da. All designations of IgGs and m/z values are shown in the figure.
Figure 8.
MALDI-TOF spectra corresponding to peptides of H2B (0.7 mg/mL) cleavage in the absence (A) and presence of Abs (0.02 mg/mL) corresponding to 10 (B), 20 (C), 40 (D), and 100 (E) days of AD pathology development after the start of the experiment (2-month-old mice). All designations of IgGs and m/z values are shown in the figure.
Figure 9.
MALDI-TOF spectra corresponding to peptides of H3 (0.7 mg/mL) cleavage in the absence (A) and presence of Abs (0.02 mg/mL) corresponding to 10 (B), 20 (C), 40 (D), and 100 (E) days of AD pathology development after the start of the experiment (2-month-old mice). In some zones, there are numerous peaks, the m/z values of which are shown above the lines over the sets of peaks. All designations of IgGs and m/z values are shown in the figure.
Figure 10.
MALDI-TOF spectra corresponding to different peptides of H4 (0.7 mg/mL) resulting from its cleavage in the absence (A) and presence of antibodies (0.02 mg/mL) corresponding to 10 (B), 20 (C), 40 (D), and 100 (E) days of AD pathology development after the start of the experiment (2-month-old mice). All designations of IgG preparations and m/z values are shown in the figure.
Immediately after the addition of IgGs (Figure 7, Figure 8, Figure 9 and Figure 10), the four individual histones were nearly homogeneous, showing two signals corresponding to singly- and doubly-charged ions of the histones. Each IgG preparation exhibited a specific set of peaks corresponding to the products of H1, H2B, H3, and H4 histone hydrolysis. It can be observed that, compared to 10 days of the experiment, there are distinct changes in the number and types of cleavage sites for all four histones by IgGs corresponding to spontaneous AD development over 10, 20, 40, and 100 days.
3.6. Sites of Histone Hydrolysis
The types of cleavage sites for the four histones hydrolyzed by all IgG preparations were calculated using average data from 7 to 9 independent spectra. All sites of histone H1 cleavage by IgG abzymes are summarized in Figure 11.
Figure 11.
Sites of H1 histone hydrolysis by IgG preparations corresponding to 2-month-old 5xFAD mice (zero time) after spontaneous development of AD over 10 (A), 20 (B), 40 (C), and 100 (D) days. Major cleavage sites of H1 are shown using big stars (★), moderate ones by arrows (↓), and minor sites of hydrolysis by small stars (*).
It is interesting that after 10 days from the start of the experiment, antibodies hydrolyze the H1 histone at only one site (F106-K107). By 20 days, this site becomes the major site of H1 histone hydrolysis, but there is an expansion of the repertoire of abzymes that hydrolyze the H1 histone at nine additional minor sites. By 40 days of the experiment, the total number of hydrolysis sites decreases to eight. In this case, some of the sites characteristic of 10 days disappear and new minor hydrolysis sites appear. Maximal restructuring of the immune system with respect to the synthesis of antibodies capable of hydrolyzing the H1 histone occurs during the period from 70 to 100 days, the deep stage of AD development. When such a change in the differentiation profile of stem cells occurs, it leads to the development of deep pathology (100 days), producing lymphocytes that hydrolyze the H1 histone at 18 sites. In this case, five new major and six moderate hydrolysis sites appear. It is interesting that the main major and moderate sites of H1 histone hydrolysis are located in extended clusters of the H1 histone protein sequence (Figure 11D). The number of hydrolysis sites increases, predominantly within the sequences of antigenic determinants.
It was of interest to understand how the change in the differentiation profile of bone marrow stem cells during AD development affects the production of B lymphocytes synthesizing abzymes that hydrolyze other histones. Figure 12 demonstrates the change in H3 histone hydrolysis sites.
Figure 12.
Sites of H3 hydrolysis by IgG preparations corresponding to 2-month-old mice (zero time) after spontaneous development of AD over 10 (A), 20 (B), 40 (C), and 100 (D) days. Major sites of H3 histone hydrolysis are shown by big stars (★), moderate ones by arrows (↓), and minor sites of hydrolysis by small stars (*).
In contrast to the cleavage of H1 histone, already at 10 days after the start of the experiment, Abs hydrolyze the H3 histone at five sites. In this case, one of the sites is major and the others are moderate. By 20 days of AD development, the number of sites increases to eight, two of which coincide with those for abzymes corresponding to 10 days. A strong increase in the number and change in the type of sites in the case of H1 histone occur during the period from 70 to 100 days (Figure 11). A strong expansion of the repertoire of abzymes hydrolyzing H3 histones to 15 sites occurs already by 40 days of the experiment (Figure 12). By 100 days of deep pathology, the number (16) and type of H3 cleavage sites remain practically unchanged, but the rate of histone hydrolysis increases noticeably.
Nine cleavage sites at 10 days after the start of the experiment were detected in the case of histone H2B (Figure 13).
Figure 13.
Sites of H2B histone hydrolysis by IgG preparations corresponding to 2-month-old 5xFAD mice (zero time) after spontaneous development of AD over 10 (A), 20 (B), 40 (C), and 100 days (D). Major sites of H2B cleavage are indicated by big stars (★), moderate ones using arrows (↓), and minor sites of histone hydrolysis by small stars (*).
Interestingly, all nine cleavage sites of H2B histone corresponding to zero time are minor. By 20 days of pathology development, the number of sites decreases to three, but one of them is major. Specific changes in the immune system by 40 days of AD pathology development lead to the appearance of ten cleavage sites for H2B hydrolysis. By 100 days, corresponding to deep pathology, the number of splitting sites is only six. In this case, very effective hydrolysis of the histone occurs mainly at sites within one extended cluster of its protein sequence.
The largest number (nine) of cleavage sites produced by Abs-ABZs at 10 days after the start of the experiment was found for the hydrolysis of H4 histone (Figure 14).
Figure 14.
Sites of H4 histone hydrolysis by IgG preparations corresponding to 2-month-old 5xFAD mice (zero time) after spontaneous development of AD over 10 (A), 20 (B), 40 (C), and 100 (D) days. Major sites of H4 cleavage are shown by big stars (★),) moderate ones using arrows (↓), and minor sites of hydrolysis by small stars (*).
In this case, at 10 days, there are not only six minor and two moderate sites but also one major hydrolysis site. At 20 days, the number of sites increases to 11, which are located in the same clusters of H4 histone hydrolysis as at 10 days. By 40 days of AD development, the total number of hydrolysis sites remains equal to 11, though they do not completely coincide with those at 20 days of pathology development. By the time of deep pathology at 100 days, the number of hydrolysis sites increases to 17. Some of these sites coincide with those at 20 and 40 days, but other new sites are also present. Overall, there is an enlargement of the clusters of histone protein sequences in which hydrolysis occurs. In addition, more major sites of histone H4 hydrolysis appear.
4. Discussion
Alzheimer’s disease is known as a complex neurodegenerative pathology characterized by the specific accumulation of insoluble forms of two proteins—amyloid β and hyperphosphorylated Tau protein [61,62,63,64,65,66,67,68,69,70,71,72,73,74]. However, these processes characterize the late stages of the development of this pathology. At the same time, the molecular mechanisms of the initial and subsequent stages of Alzheimer’s disease development, until the achievement of deep pathology that clinicians observe, remain unknown.
Multiple sclerosis is also known as a very complex and multifunctional neurological pathology. At the same time, in the case of this pathology, the key cause has been shown to be associated with autoimmune processes leading to the hydrolysis of components of the sheath of nerve tissues, including myelin basic protein, by antibody abzymes against MBP and five histones [47,48,49,50,51,52,53,54,55]. In this regard, it should be noted that in the case of many AIDs, including SLE, catalytically active antibodies have been detected that are not present in healthy donors or mice not predisposed to autoimmune diseases. Using MRL-lpr/lpr mice, which are prone to spontaneous development of SLE, it was first shown that the onset of this pathology is associated with a disruption in the differentiation profile of BMSCs, which leads to the production of B lymphocytes that produce abzymes harmful to the body. Subsequently, it was shown that the cerebrospinal fluid and blood of MS patients also contain abzymes that hydrolyze DNA, proteins, peptides, and polysaccharides [98]. Using mouse models of EAE, it was demonstrated that, in the case of this pathology, the onset and development of deep pathology are also associated with a disruption in the differentiation profile of BMSCs, which is very similar to the process in SLE mice [47]. Taking these data into account, the idea arose that many other neurological diseases, including Alzheimer’s pathology, may also be associated at the initial stages of development with a disruption of the differentiation profile of bone marrow stem cells and the formation of harmful lymphocytes and the abzymes they produce. Normally, in healthy people, harmful lymphocytes are removed by apoptosis of such cells [25,26,27,28]. As shown in a number of studies, in people and mice with AIDs, apoptosis of harmful cells is suppressed, and they can undergo effective proliferation [24,25,26,27,28].
Taking these data into account, the present work analyzed possible changes in the differentiation profile of bone marrow stem cells and the production of abzymes during the development of Alzheimer’s disease in 5xFAD mice. In this case as well, a change in the differentiation profile of stem cells and the appearance of histone-hydrolyzing abzymes in the blood of mice were detected.
The development of multiple sclerosis proceeds in at least two stages [99,100,101]. Since the development of Alzheimer’s disease in 5xFAD mice also occurs in several stages, we analyzed the histone hydrolysis sites using antibodies from blood serum mainly corresponding to 10, 20, 40, 70, and 100 days after two months of life, when the development of this pathology begins.
It was shown that the relative activity of abzymes in histone hydrolysis increases up to 20 days of the experiment, then significantly decreases by 70 days, and again increases strongly by 100 days of deep pathology (Figure 6). Although obvious signs of the onset of Alzheimer’s disease in 5xFAD mice appear only at 2 months, it should be assumed that the not yet visible initial stages of immune status disruption in 5xFAD mice occur at an even earlier age. As indicated above, detection of abzymes in the blood of mammals is an unambiguous sign of the onset of development of various AIDs [25,26,27,28]. Moreover, in the case of various autoimmune and neurological diseases associated with autoimmune processes, the first abzymes may be antibodies hydrolyzing different antigens. For example, in patients with SLE, antibodies hydrolyzing DNA appear first, whereas in patients with MS, antibodies hydrolyzing myelin basic protein and histones appear first [25,26,27,28,46,47,48,49,50,51,52,53,54,55]. During disease development, the repertoire of abzymes hydrolyzing a wide variety of antigens is constantly expanding. At the same time, in mice with EAE, the change in the content of lymphocytes in the blood that synthesize abzymes hydrolyzing each of the five individual histones is of an individual nature [25,26,27,28,46,47,48,49,50,51,52,53,54,55].
A similar situation was found in the case of Alzheimer’s disease development in 5xFAD mice. At two months of life, antibodies from the blood of mice with Alzheimer’s disease do not have significant activity in the hydrolysis of H1 histone. At 10 days after the start of the experiment, abzymes appear that hydrolyze H1 histone at only one site (Figure 11A). However, the number of hydrolysis sites then constantly increases, and after development of pathology at 100 days of AD, it becomes equal to 18 (Figure 11D).
A somewhat different situation is observed in the case of H2B histone. Reliably detectable hydrolysis of H2B histone at different sites is found as early as two months of mouse life (Figure 6). At 10 days after the start of the experiment, antibodies hydrolyze this histone at 9 sites (Figure 13A). Then, some specific rearrangements of the stem cell differentiation profile occur with respect to the production of lymphocytes synthesizing abzymes that hydrolyze H2B histone, and by 20 days the number of hydrolysis sites decreases to three (Figure 13B). This means that the reorganization of the immune system can occur in such a way that it may lead either to an increase or, in some cases, to a decrease in the number of abzymes directed toward some of the individual histones.
At 10 days after the start of the experiment, antibodies hydrolyze H3 and H4 histones at 5 and 9 sites, respectively (Figure 13 and Figure 14). However, further changes in the number and type of hydrolysis sites during AD development occur differently. By 100 days, corresponding to the achievement of deep pathology, antibodies hydrolyze H4 histone at 17 sites and H3 at 16 sites.
Thus, during the development of AD, a specific pattern of changes in the number and type of B lymphocytes and their corresponding IgGs, demonstrating various histone hydrolysis sites, is observed for the cleavage of each individual histone. However, after achieving deep pathology (100 days), both the relative activity in the hydrolysis of each histone and the number and type of hydrolysis sites increase. Overall, it is clear that the accumulation of Alzheimer’s disease-specific proteins in 5xFAD mice occurs in parallel with the development of autoimmune reactions and the production of histone-hydrolyzing abzymes.
As stated above, C57BL/6 mice were used to generate 5xFAD mice into which genes associated with the development of Alzheimer’s disease in humans were introduced. The C57BL/6 mouse line initially was not formally related to mice with spontaneous development of EAE [102]. However, a number of subsequent studies have shown that these mice, in contrast to BALB/c and CBA mice, exhibit very slow development of autoimmune reactions due to a change in the differentiation profile of bone marrow stem cells and abzyme synthesis (Refs. [25,26,27,28,46,47,48,49,50,51,52,53] and references therein). Given this, it was of interest to understand how the introduction of specific genes associated with Alzheimer’s disease into C57BL/6 mice alters the immunological parameters in 5xFAD mice compared to C57BL/6 mice.
As can be seen from Figure 1, the differentiation profile of all BMSCs in C57BL/6 and 5xFAD mice occurs differently over time, with maximum differences in the case of CFU-E and CFU-GEMM cells. Moreover, whereas the number of CFU-GEMM specific colonies in C57BL/6 decreases during the spontaneous progression of autoimmune reactions, a significant increase in their number is observed in 5xFAD mice. Additionally, while in C57BL/6 mice the relative number of total lymphocytes in the bone marrow increases constantly over time after the start of the experiment [47], in 5xFAD mice it decreases until approximately 40 days and only then begins to increase (Figure 2A).
It was also of interest to compare the histone hydrolysis sites in these two mouse strains at time zero and during the development of spontaneous immune system changes. The first signs of the beginning of the change in the differentiation profile and the appearance of abzymes in C57BL/6 mice were detected by us at 3 months [47], whereas in 5xFAD mice at two months of life (zero time of the experiment). Most likely, in these mouse lines, the stages of immune system disruption occur earlier than 2 and 3 months, when they are not yet reliably detectable. It is interesting that at zero time of the experiment in the case of C57BL/6 mice, antibodies hydrolyze H1 histone at 16 sites (Supplementary Figure S5A,B), while in 5xFAD mice hydrolysis of this histone is not yet observed, and only after 10 days does one site of its cleavage appear (Figure 11). After spontaneous development of EAE, the number of histone H1 hydrolysis sites by antibodies in C57BL/6 mice is 15 at 60 days and 18 at 100 days after achieving AD in 5xFAD mice. These hydrolysis sites are located in approximately the same fragments of the H1 protein sequence, but only 5 of the 15 and 18 sites coincide.
Ten days after the start of the experiment, 9 sites of H2B hydrolysis were found in the case of 5xFAD mice (Figure 13), whereas at zero time in C57BL/6 mice, 6 sites of H2B hydrolysis were observed (Supplementary Figure S5C,D), and only three of them coincide. At 60 days and 100 days of the development of EAE and AD, 10 and 6 sites of H2B histone hydrolysis were found, respectively, but there are no coincident sites among them.
Already at 10 days after the start of the experiment, antibodies from 5xFAD mice hydrolyze H3 histone at five sites (Figure 12), while IgGs from C57BL/6 mice hydrolyze it at 11 sites. Only 3 of these sites are the same. By 100 days of deep pathology, the number and type of H3 cleavage sites is 16 (Figure 12), but for C57BL/6 mice at 60 days of spontaneous EAE development, the number is 12 (Supplementary Figure S5E,F), and only 5 of them are the same.
At 10 days of the experiment, IgGs from 5xFAD mice hydrolyze H4 histone at 9 sites (Figure 14), while IgGs from C57BL/6 mice at zero time hydrolyze it at only 5 sites—only one of them is the same. At 100 days, the number of H4 hydrolysis sites for 5xFAD mice increases to 17, compared to 10 sites after the spontaneous development of autoimmune reactions in C57BL/6 mice at 60 days (Supplementary Figure S5G,H). Interestingly, all these sites are different.
Thus, during spontaneous development of autoimmune reactions in C57BL/6 mice and AD in 5xFAD mice, there is a change in the differentiation profiles of BMSCs, but these changes are significantly different (Figure 1). It should be noted that the development of autoimmune reactions in 5xFAD mice begins earlier (2 months of life) than in C57BL/6 mice (3 months of life). There is also a significant difference in the change in the relative number of B and T lymphocytes over time in different organs of C57BL/6 [47] and 5xFAD mice. Whereas spontaneous EAE development in C57BL/6 mice leads to a constant, smooth increase in the relative activity of antibodies in histone hydrolysis [47], in the case of 5xFAD mice, there is a sharp increase in their activity up to 20–40 days, with a subsequent decrease at 70 days and a sharp increase by 100 days of deep pathology (Figure 6). Moreover, the number and types of histone hydrolysis sites at various stages of disease development in C57BL/6 and 5xFAD mice are very different. Taking this into account, it seemed interesting to understand how the introduction of specific genes into 5xFAD mice can alter the above parameters characterizing the development of these pathologies.
First, an unexpectedly high occurrence of antibody abzymes in AID-prone mice was revealed compared with normal conventional mouse strains [103,104]. The formation of natural catalytic antibodies usually occurs against many various molecules that at least to some extent mimic specific structures of chemical reaction transition states [7,8,9,10,11,12,24]. The sites of different protein cleavage by abzymes are mainly localized in their antigenic determinants (AGDs) [26,27,28], but different histones possess between 3 and 11 AGDs [105,106,107,108,109,110]. Abzymes could be formed against various protein AGDs that mimic the transition state of the peptide bond hydrolysis reaction. At the same time, the immune system can synthesize about a million different antibodies with a wide variety of properties against the same antigen or AGD [111]. It has been shown that the main antigens stimulating the formation of antibodies against histones and DNA are their complexes, which appear in biological fluids as a result of cell apoptosis [3]. Different AGDs of each histone can differ significantly in the efficiency of antibody abzyme formation against their protein sequence [26,27,28].
The development of multiple sclerosis proceeds in at least two to three stages [99,100,101]. The cascade of particular reactions at the first inflammatory stage is very complex, involving several different proteins, enzymes, chemokines, cytokines, macrophages, and other cells producing osteopontin and NO* radicals [99]. The coordinated action of inflammatory mediators, B- and T-lymphocytes, the complement system, and autoantibodies leads to the formation of demyelination foci and disturbance of axons. The neurodegenerative stage of pathology appears later and is directly associated with neural tissue destruction [99,100,101]. The rate of progression to pathology depends greatly on whether it is spontaneous or accelerated by immunization of EAE mice with MOG or a DNA–histone complex [49,50,51,52,53]. Each stage is characterized by a different set of B lymphocytes producing a different number of antibodies to each of the individual histones, which hydrolyze all five histones at different numbers and specific types of sites corresponding to various stages of pathology development [49,50,51,52,53].
The development of AD in humans and experimental 5xFAD mice also occurs in several stages. Moreover, the components of blood cells and other biological fluids at different stages of AD, MS, and EAE development can differ greatly. Individual histones and their complexes, as well as their complexes with DNA, can bind to very different molecules that are specifically characteristic of various temporal individual stages of EAE and AD development. Therefore, some histone AGDs in specific complexes with various molecules in the case of EAE and AD mice may become more or less accessible and more or less immunogenic (better imitate the transition states of peptide bond hydrolysis reactions) in the case of one of these specific pathologies. Thus, at different stages of EAE and AD progression, all histones and their complexes could represent different fragments of protein sequences or AGDs that mimic the transition states of hydrolysis of bonds between amino acids for the formation of abzymes. This may be the reason why antibody abzymes against the five histones corresponding to development of EAE and AD differ greatly in the number and specific type of cleavage sites.
In this regard, it should also be noted that during spontaneous development of autoimmune reactions in C57BL/6 mice, many antibody fractions appear that hydrolyze histones like trypsin after R (arginine) and K (lysine) residues [49,50,51,52,53]. However, the relative number of such hydrolysis sites in the case of 5xFAD mouse antibodies is significantly lower. The sites of histone hydrolysis by 5xFAD mouse abzymes are mainly grouped in specific clusters of histone sequences and occur predominantly after neutral amino acids: A, L, Q, T, G, and V (Figure 11, Figure 12, Figure 13 and Figure 14).
Thus, 5xFAD and C57BL/6 mice demonstrate significant differences in various indices during development of these pathologies, but at the same time, there are also common patterns in their development.
In general, it is obvious that in the case of AD, the early stages of pathology development are associated with changes in the differentiation profiles of bone marrow stem cells and the production of abzymes, which ultimately leads to the late stages of deep disease that are detected by clinicians.
Overexpression of human APP (amyloid precursor protein) and presenilin-1 can probably directly cause cellular stress and apoptosis, independently of any primary defects in bone marrow stem cells. However, these data do not answer the question of why 5xFAD mice develop abzymes, which are a consequence of a disruption of the bone marrow stem cell differentiation profile, leading to the production of B lymphocytes that produce very harmful abzymes hydrolyzing a wide variety of autoantigens. We have shown that the development of autoimmune processes in 5xFAD mice leads, as in the case of SLE and multiple sclerosis, not only to the production of abzymes that hydrolyze histones, but also to abzymes degrading many other autoantigens (to be published later). In humans and mice with SLE and multiple sclerosis, there is no overexpression of APP and presenilin-1; they die because, at the stage of advanced pathology, a very large number of blood components and cells are destroyed by abzymes and they are unable to perform their biological functions. Thus, it should be assumed that both the overexpression of APP and presenilin-1 and the destruction by abzymes of a large number of blood components and cells may be important in the development of Alzheimer’s disease. These processes may be parallel, leading to the development of Alzheimer’s disease.
5. Conclusions
It has been demonstrated that in 5xFAD mice, the development of Alzheimer’s disease (AD) is similar to the development of experimental autoimmune encephalomyelitis (EAE) in mice predisposed to EAE; at the beginning of the development of these diseases, disturbances in the differentiation profile of hemopoietic bone marrow stem cells and abzyme synthesis are observed. One of the earliest and most statistically reliable indicators of autoimmune reactions in mammals is the appearance of abzymes in the blood hydrolyzing various substrates that are not present in conditionally healthy humans and animals. Of most interest for the analysis of the development of autoimmune reactions are antibodies against five histones, which play vital roles in chromatin functioning but are very harmful in the intercellular space. IgGs against five individual histones (H1, H2A, H2B, H3, and H4) were obtained from the blood of 5xFAD mice at different stages of Alzheimer’s disease development. These IgGs effectively hydrolyzed all five histones. All IgGs at 10 days after the start of the experiment at zero time (2-month-old mice) demonstrated between 1 and 9 different H1, H2B, H3, and H4 hydrolysis sites. The spontaneous evolution of AD over 10, 20, 40, and 100 days leads to an increase in the number of histone cleavage sites, and by 100 days, corresponding to deep pathology, this number becomes maximal—16–18 sites. Possible mechanisms of AD development and reasons for strong differences in the type and number of histone splitting sites at different stages of AD development are discussed. This work shows for the first time that the initial stages of Alzheimer’s disease development may be caused by a disruption in the differentiation profile of bone marrow stem cells and by the development of autoimmune processes that, together with later processes—the accumulation of insoluble forms of two proteins, amyloid β and hyperphosphorylated Tau—lead to the formation of deep pathology.
Supplementary Materials
The following supporting information can be downloaded at: https://www.mdpi.com/article/10.3390/cimb48111233/s1.
Author Contributions
Conceptualization, G.A.N. and P.S.D.; methodology, G.A.N., P.S.D. and A.E.U.; software, P.S.D. and L.B.T.; validation, K.S.A.; investigation, A.E.U., L.B.T., A.D.C., G.S.C., A.M.T., K.S.A. and I.A.O.; supervision, G.A.N.; project administration, G.A.N. and P.S.D.; funding acquisition, G.A.N. All authors have read and agreed to the published version of the manuscript.
Funding
This investigation had the support of a grant from Russian State-funded budget project of ICBFM SB RAS 125012300658-9.
Institutional Review Board Statement
The protocols of all analyses were approved by the Bioethical Committee of the Institute of Chemical Biology and Fundamental Medicine of SB RAS (protocol document number 21-4, dated 7 August 2020) and followed the recommendations of the European Committee (Council Directive of European Communities 86/609/CEE; document number 21-4, dated 7 August 2020).
Informed Consent Statement
Not applicable.
Data Availability Statement
The original contributions presented in this study are included in the article/Supplementary Material. Further inquiries can be directed to the corresponding author.
Conflicts of Interest
The authors declare no conflicts of interest.
Abbreviations
Abs, antibodies; Abz, abzyme; AGDs, antigenic determinants; AIDs, autoimmune diseases; AA, amino acid; CFU-GM, granulocytic–macrophagic colony-forming unit; CFU-GEMM, granulocytic–erythroid–megakaryocytic–macrophagic colony-forming unit; BFU-E, erythroid burst-forming unit (early erythroid colonies); CFU-E, erythroid burst-forming unit (late erythroid colonies); EAE, experimental autoimmune encephalomyelitis; MBP, myelin basic protein; MOG, myelin oligodendrocyte glycoprotein; SDS-PAGE, sodium dodecyl sulfate–polyacrylamide gel electrophoresis; HIV-1, human immunodeficiency virus type 1; MS, multiple sclerosis; MALDI-TOF, matrix-assisted laser desorption/ionization time-of-flight mass spectrometry; RA, relative activity; SLE, systemic lupus erythematosus.
References
- Chen, R.; Kang, R.; Fan, X.-G.; Tang, D. Release and Activity of Histone in Diseases. Cell Death Dis. 2014, 5, e1370. [Google Scholar] [CrossRef] [Scilit] [PubMed]
- Suwa, A. Specificities and Clinical Significance of Autoantibodies Directed Against Histones. Nihon Rinsho Meneki Gakkai Kaishi 2005, 28, 123–130. [Google Scholar] [CrossRef] [Scilit] [PubMed]
- Founel, S.; Muller, S. Antinucleosome Antibodies and T-Cell Response in Systemic Lupus Erythematosus. Ann. Med. Interne 2002, 153, 513–519. [Google Scholar] [PubMed]
- O’Connor, K.C.; Bar-Or, A.; Hafler, D.A. Neuroimmunology of Multiple Sclerosis. J. Clin. Immunol. 2001, 21, 81–92. [Google Scholar] [CrossRef] [Scilit] [PubMed]
- Archelos, J.J.; Storch, M.K.; Hartung, H.P. The Role of B Cells and Autoantibodies in Multiple Sclerosis. Ann. Neurol. 2000, 47, 694–706. [Google Scholar] [CrossRef] [Scilit] [PubMed]
- Hemmer, B.; Archelos, J.J.; Hartung, H.P. New Concepts in the Immunopathogenesis of Multiple Sclerosis. Nat. Rev. Neurosci. 2002, 3, 291–301. [Google Scholar] [CrossRef] [Scilit] [PubMed]
- Lerner, R.A.; Tramontano, A. Antibodies as Enzymes. Trends Biochem. Sci. 1987, 12, 427–438. [Google Scholar] [CrossRef] [Scilit]
- Stewart, J.D.; Benkovic, S.J. Recent Developments in Catalytic Antibodies. Int. Rev. Immunol. 1993, 10, 229–240. [Google Scholar] [CrossRef] [Scilit] [PubMed]
- Martin, A.B.; Schultz, P.G. Opportunities at the Interface of Chemistry and Biology. Trends Cell Biol. 1999, 9, 24–28. [Google Scholar] [CrossRef] [Scilit] [PubMed]
- Tramontano, A.; Gololobov, G.; Paul, S. Proteolytic Antibodies: Origins Selection and Induction. Chem. Immunol. 2000, 77, 1–17. [Google Scholar] [CrossRef] [Scilit] [PubMed]
- Zhao, D.; Chen, J.; Hu, X.; Zhang, S. Catalytic Antibodies: Design Expression and Their Applications in Medicine. Appl. Biochem. Biotechnol. 2023, 195, 1514–1540. [Google Scholar] [CrossRef] [Scilit] [PubMed]
- Ostler, E.L.; Resmini, M.; Brocklehurst, K.; Gallacher, G.J. Polyclonal Catalytic Antibodies. J. Immunol. Methods 2002, 269, 111–124. [Google Scholar] [CrossRef] [Scilit] [PubMed]
- Padiolleau-Lefèvre, S.; Ben Naya, R.; Shahsavarian, M.A.; Friboulet, A.; Avalle, B. Catalytic Antibodies and Their Applications in Biotechnology: State of the Art. Biotechnol. Lett. 2014, 36, 1369–1379. [Google Scholar] [CrossRef] [Scilit] [PubMed]
- Hanson, C.V.; Nishiyama, Y.; Paul, S. Catalytic Antibodies and Their Applications. Curr. Opin. Biotechnol. 2005, 16, 631–636. [Google Scholar] [CrossRef] [Scilit] [PubMed]
- Paul, S. Natural Catalytic Antibodies. Mol. Biotechnol. 1996, 5, 197–207. [Google Scholar] [CrossRef] [Scilit] [PubMed]
- Dimitrov, J.D.; Lacroix-Desmazes, S. Noncanonical Functions of Antibodies. Trends Immunol. 2020, 41, 379–393. [Google Scholar] [CrossRef] [Scilit] [PubMed]
- Wootla, B.; Lacroix-Desmazes, S.; Warrington, A.E.; Bieber, A.J.; Kaveri, S.V.; Rodriguez, M. Autoantibodies with Enzymatic Properties in Human Autoimmune Diseases. J. Autoimmun. 2011, 37, 144–150. [Google Scholar] [CrossRef] [Scilit] [PubMed]
- Kamalanathan, A.S.; Goulvestre, C.; Weill, B.; Vijayalakshmi, M.A. Proteolysis Activity of IgM Antibodies from Rheumatoid Arthritis Patients’ Sera: Evidence of Atypical Catalytic Site. J. Mol. Recognit. 2010, 23, 577–582. [Google Scholar] [CrossRef] [Scilit] [PubMed]
- Gabibov, A.G.; Ponomarenko, N.A.; Tretyak, E.B.; Paltsev, M.A.; Suchkov, S.V. Catalytic Autoantibodies in Clinical Autoimmunity and Modern Medicine. Autoimmun. Rev. 2006, 5, 324–330. [Google Scholar] [CrossRef] [Scilit] [PubMed]
- Kozyr, A.V.; Gabibov, A.G. DNA-Hydrolyzing Ab: Is Catalytic Activity a Clue for Physiological Significance? Autoimmunity 2009, 42, 359–361. [Google Scholar] [CrossRef] [Scilit] [PubMed]
- Ponomarenko, N.A.; Vorobiev, I.I.; Alexandrova, E.S.; Reshetnyak, A.V.; Telegin, G.B.; Khaidukov, S.V.; Avalle, B.; Karavanov, A.; Morse, H.C., 3rd; Thomas, D.; et al. Induction of a Protein-Targeted Catalytic Response in Autoimmune Prone Mice: Antibody-Mediated Cleavage of HIV-1 Glycoprotein GP120. Biochemistry 2006, 45, 324–330. [Google Scholar] [CrossRef] [Scilit] [PubMed]
- Belogurov, A., Jr.; Kozyr, A.; Ponomarenko, N.; Gabibov, A. Catalytic Antibodies: Balancing between Dr. Jekyll and Mr. Hyde. Bioessays 2009, 31, 1161–1171. [Google Scholar] [CrossRef] [Scilit] [PubMed]
- Croxford, A.L.; Kurschus, F.C.; Waisman, A. Mouse Models for Multiple Sclerosis: Historical Facts and Future Implications. Biochim. Biophys. Acta 2011, 1812, 177–183. [Google Scholar] [CrossRef] [Scilit] [PubMed]
- Keinan, E. (Ed.) Catalytic Antibodies; Wiley-VCH Verlag GmbH and Co. KGaA: Weinheim, Germany, 2005; pp. 1–586. [Google Scholar]
- Nevinsky, G.A. Autoimmune Processes in Multiple Sclerosis: Production of Harmful Catalytic Antibodies Associated with Significant Changes in the Hematopoietic Stem Cell Differentiation and Proliferation. In Multiple Sclerosis; Conzalez-Quevedo, A., Ed.; InTech: Rijeka, Croatia, 2016; pp. 100–147. [Google Scholar]
- Nevinsky, G.A. Natural Catalytic Antibodies in Norm and in Autoimmune Diseases. In Autoimmune Diseases: Symptoms Diagnosis and Treatment; Brenner, K.J., Ed.; Nova Science Publishers Inc.: New York, NY, USA, 2010; pp. 1–107. [Google Scholar]
- Nevinsky, G.A. Catalytic Antibodies in Norm and Systemic Lupus Erythematosus. In Lupus; Khan, W.A., Ed.; InTech: Rijeka, Croatia, 2017; pp. 41–101. [Google Scholar]
- Nevinsky, G.A. The Extreme Diversity of Autoantibodies and Abzymes Against Different Antigens in Patients with Various Autoimmune Diseases. In Advances in Medicine and Biology; Nova Science Publishers Inc.: New York, NY, USA, 2021; Volume 184, pp. 1–130. [Google Scholar]
- Paul, S.; Volle, D.J.; Beach, C.M.; Johnson, D.R.; Powell, M.J.; Massey, R.J. Catalytic Hydrolysis of Vasoactive Intestinal Peptide by Human Autoantibody. Science 1989, 244, 1158–1162. [Google Scholar] [CrossRef] [Scilit] [PubMed]
- Savel’ev, A.N.; Eneyskaya, E.V.; Shabalin, K.A.; Filatov, M.V.; Neustroev, K.N. Antibodies with Amylolytic Activity. Protein Pept. Lett. 1999, 6, 179–181. [Google Scholar]
- Li, L.; Paul, S.; Tyutyulkova, S.; Kazatchkine, M.D.; Kaveri, S.J. Catalytic Activity of Anti-Thyroglobulin Antibodies. J. Immunol. 1995, 154, 3328–3332. [Google Scholar] [CrossRef] [Scilit] [PubMed]
- Kalaga, R.; Li, L.; O’Dell, J.R.; Paul, S. Unexpected Presence of Polyreactive Catalytic Antibodies in IgG from Unimmunized Donors and Decreased Levels in Rheumatoid Arthritis. J. Immunol. 1995, 155, 2695–2702. [Google Scholar] [CrossRef] [Scilit] [PubMed]
- Ponomarenko, N.A.; Durova, O.M.; Vorobiev, I.I.; Belogurov, A.A., Jr.; Kurkova, I.N.; Petrenko, A.G.; Telegin, G.B.; Suchkov, S.V.; Kiselev, S.L.; Lagarkova, M.A.; et al. Autoantibodies to Myelin Basic Protein Catalyze Site-Specific Degradation of Their Antigen. Proc. Natl. Acad. Sci. USA 2006, 103, 281–286. [Google Scholar] [CrossRef] [Scilit] [PubMed]
- Shuster, A.M.; Gololobov, G.V.; Kvashuk, O.A.; Bogomolova, A.E.; Smirnov, I.V.; Gabibov, A.G. DNA Hydrolyzing Autoantibodies. Science 1992, 256, 665–667. [Google Scholar] [CrossRef] [Scilit] [PubMed]
- Kou, J.; Yang, J.; Lim, J.E.; Pattanayak, A.; Song, M.; Planque, S.; Paul, S.; Fukuchi, K. Catalytic Immunoglobulin Gene Delivery in a Mouse Model of Alzheimer’s Disease: Prophylactic and Therapeutic Applications. Mol. Neurobiol. 2015, 51, 43–56. [Google Scholar] [CrossRef] [Scilit] [PubMed]
- Song, C.; Li, H.; Zheng, C.; Zhang, T.; Zhang, Y. Dual Efficacy of a Catalytic Anti-Oligomeric Aβ42 scFv Antibody in Clearing Aβ42 Aggregates and Reducing Aβ Burden in the Brains of Alzheimer’s Disease Mice. Mol. Neurobiol. 2023, 60, 5515–5532. [Google Scholar] [CrossRef] [Scilit] [PubMed]
- Song, C.; Li, H.; Zhang, T.; Zheng, C.; Zhang, Y. Synergetic Effect of Matrine on the Catalytic scFv Antibody HS72 In Vitro and in Mice with Alzheimer Disease Pathology. Neuropharmacology 2024, 242, 109775. [Google Scholar] [CrossRef] [Scilit] [PubMed]
- Taguchi, H.; Planque, S.; Nishiyama, Y.; Szabo, P.; Weksler, M.E.; Friedland, R.P.; Paul, S. Catalytic Antibodies to Amyloid Beta Peptide in Defense Against Alzheimer Disease. Autoimmun. Rev. 2008, 7, 391–397. [Google Scholar] [CrossRef] [Scilit] [PubMed]
- Harirchian, M.; Saberi, H.; Najafizadeh, S.R.; Hashemi, S.A. Evaluation of Brain and Cervical MRI Abnormality Rates in Patients with Systemic Lupus Erythematosus with or Without Neurological Manifestations. Iran. J. Radiol. 2011, 8, 157–160. [Google Scholar] [CrossRef] [Scilit] [PubMed]
- Cannerfelt, B.; Nystedt, J.; Jönsen, A.; Lätt, J.; van Westen, D.; Lilja, A.; Bengtsson, A.; Nilsson, P.; Mårtensson, J.; Sundgren, P.C. White Matter Lesions and Brain Atrophy in Systemic Lupus Erythematosus Patients: Correlation to Cognitive Dysfunction in a Cohort of Systemic Lupus Erythematosus Patients Using Different Definition Models for Neuropsychiatric Systemic Lupus Erythematosus. Lupus 2018, 27, 1140–1149. [Google Scholar] [CrossRef] [Scilit] [PubMed]
- Kalinowska-Lyszczarz, A.; Pawlak, M.A.; Pietrzak, A.; Pawlak-Bus, K.; Leszczynski, P.; Puszczewicz, M.; Paprzycki, W.; Kozubski, W.; Michalak, S. Distinct Regional Brain Atrophy Pattern in Multiple Sclerosis and Neuropsychiatric Systemic Lupus erythematosus Patients. Lupus 2018, 27, 1624–1635. [Google Scholar] [CrossRef] [Scilit] [PubMed]
- Müller, S.; Saur, R.; Greve, B.; Melms, A.; Hautzinger, M.; Fallgatter, A.J.; Leyhe, T. Similar Autobiographical Memory Impairment in Long-Term Secondary Progressive Multiple Sclerosis and Alzheimer’s Disease. Mult. Scler. J. 2013, 19, 225–232. [Google Scholar] [CrossRef] [Scilit] [PubMed]
- Van Wageningen, T.A.; Gerrits, E.; Palacin, I.; Bonson, S.; Huitinga, I.; Eggen, B.J.; van Dam, A.M. Exploring Reported Genes of Microglia RNA-Sequencing Data: Uses and Considerations. Glia 2021, 69, 2933–2946. [Google Scholar] [CrossRef] [Scilit] [PubMed]
- Sumowski, J.F.; Wylie, G.R.; Deluca, J.; Chiaravalloti, N. Intellectual Enrichment Is Linked to Cerebral Efficiency in Multiple Sclerosis: Functional Magnetic Resonance Imaging Evidence for Cognitive Reserve. Brain 2010, 133, 362–374. [Google Scholar] [CrossRef] [Scilit] [PubMed]
- Ikehara, S.; Kawamura, M.; Takao, F. Organ-Specific and Systemic Autoimmune Diseases Originate from Defects in Hematopoietic Stem Cells. Proc. Natl. Acad. Sci. USA 1990, 87, 8341–8344. [Google Scholar] [CrossRef] [Scilit] [PubMed]
- Andryushkova, A.S.; Kuznetsova, I.A.; Buneva, V.N.; Toporkova, L.B.; Sakhno, L.V.; Tikhonova, M.A.; Chernykh, E.R.; Orlovskaya, I.A.; Nevinsky, G.A. Formation of Different Abzymes in Autoimmune-Prone MRL-lpr/lpr Mice Is Associated with Changes in Colony Formation of Haematopoetic Progenitors. J. Cell. Mol. Med. 2007, 11, 531–551. [Google Scholar] [CrossRef] [Scilit] [PubMed]
- Doronin, V.B.; Parkhomenko, T.A.; Korablev, A.; Toporkova, L.B.; Lopatnikova, J.A.; Alshevskaja, A.A.; Sennikov, S.V.; Buneva, V.N.; Budde, T.; Meuth, S.G.; et al. Changes in Different Parameters Lymphocyte Proliferation and Hematopoietic Progenitor Colony Formation in EAE Mice Treated with Myelin Oligodendrocyte Glycoprotein. J. Cell. Mol. Med. 2016, 20, 81–94. [Google Scholar] [CrossRef] [Scilit] [PubMed]
- Aulova, K.S.; Toporkova, L.B.; Lopatnikova, J.A.; Alshevskaya, A.A.; Sedykh, S.E.; Buneva, V.N.; Budde, T.; Meuth, S.G.; Popova, N.A.; Orlovskaya, I.A.; et al. Changes in Cell Differentiation and Proliferation Lead to Production of Abzymes in EAE Mice Treated with DNA-Histone Complexes. J. Cell. Mol. Med. 2018, 22, 5816. [Google Scholar] [CrossRef] [Scilit] [PubMed]
- Urusov, A.E.; Aulova, K.S.; Dmitrenok, P.S.; Buneva, V.N.; Nevinsky, G.A. Experimental Autoimmune Encephalomyelitis of Mice: Enzymatic Cross Site-Specific Hydrolysis of H4 Histone by IgGs Against Histones and Myelin Basic Protein. Int. J. Mol. Sci. 2022, 23, 9182. [Google Scholar] [CrossRef] [Scilit] [PubMed]
- Urusov, A.E.; Aulova, K.S.; Dmitrenok, P.S.; Buneva, V.N.; Nevinsky, G.A. EAE of Mice: Enzymatic Cross Site-Specific Hydrolysis of H2A Histone by IgGs Against H2A H1 H2B H3 and H4 Histones and Myelin Basic Protein. Int. J. Mol. Sci. 2023, 24, 8636. [Google Scholar] [CrossRef] [Scilit] [PubMed]
- Urusov, A.E.; Aulova, K.S.; Dmitrenok, P.S.; Buneva, V.N.; Nevinsky, G.A. EAE of Mice: Enzymatic Cross Site-Specific Hydrolysis of H2B Histone by IgGs Against H1 H2A H2B H3 and H4 Histones and Myelin Basic Protein. Molecules 2023, 28, 2973. [Google Scholar] [CrossRef] [Scilit] [PubMed]
- Urusov, A.E.; Aulova, K.S.; Dmitrenok, P.S.; Buneva, V.N.; Nevinsky, G.A. Experimental Autoimmune Encephalomyelitis of Mice: Catalytic Cross Site-Specific Hydrolysis of H1 Histone by IgG Antibodies Against H1, H2A, H2B, H3, H4 Histones and Myelin Basic Protein. J. Biomed. Res. 2023, 4, 33–60. [Google Scholar] [CrossRef] [Scilit]
- Urusov, A.E.; Aulova, K.S.; Dmitrenok, P.S.; Buneva, V.N.; Nevinsky, G.A. Experimental Autoimmune Encephalomyelitis of Mice: Enzymatic Cross Site-Specific Hydrolysis of H3 Histone by IgGs Against H3, H1, H2A, H2B and H4 Histones and Myelin Basic Protein. J. Biomed. Res. 2024, 5, 71–95. [Google Scholar] [CrossRef] [Scilit]
- Aulova, K.S.; Urusov, A.E.; Toporkova, L.B.; Sedykh, S.E.; Shevchenko, Y.A.; Tereshchenko, V.P.; Sennikov, S.V.; Budde, T.; Meuth, S.G.; Orlovskaya, I.A.; et al. Catalytic Antibodies in the Bone Marrow and Other Organs of Th Mice During Spontaneous Development of Experimental Autoimmune Encephalomyelitis Associated with Cell Differentiation. Mol. Biol. Rep. 2021, 48, 1055–1068. [Google Scholar] [CrossRef] [Scilit] [PubMed]
- Aulova, K.S.; Urusov, A.E.; Toporkova, L.B.; Sedykh, S.E.; Shevchenko, J.A.; Tereshchenko, V.P.; Sennikov, S.V.; Orlovskaya, I.A.; Nevinsky, G.A. Cell Differentiation and Proliferation in the Bone Marrow and Other Organs of 2D2 Mice During Spontaneous Development of EAE Leading to the Production of Abzymes. Molecules 2022, 27, 2195. [Google Scholar] [CrossRef] [Scilit] [PubMed]
- Shi, F.D.; Yong, V.W. Neuroinflammation Across Neurological Diseases. Science 2025, 388, eadx0043. [Google Scholar] [CrossRef] [Scilit] [PubMed]
- Patani, R.; Hardingham, G.E.; Liddelow, S.A. Functional Roles of Reactive Astrocytes in Neuroinflammation and Neurodegeneration. Nat. Rev. Neurol. 2023, 19, 395–409. [Google Scholar] [CrossRef] [Scilit] [PubMed]
- Leng, F.; Edison, P. Neuroinflammation and Microglial Activation in Alzheimer Disease: Where Do We Go from Here? Nat. Rev. Neurol. 2021, 17, 157–172. [Google Scholar] [CrossRef] [Scilit] [PubMed]
- Thakur, S.; Dhapola, R.; Sarma, P.; Medhi, B.; Reddy, D.H. Neuroinflammation in Alzheimer’s Disease: Current Progress in Molecular Signaling and Therapeutics. Inflammation 2023, 46, 1–17. [Google Scholar] [CrossRef] [Scilit] [PubMed]
- Dhapola, R.; Hota, S.S.; Sarma, P.; Bhattacharyya, A.; Medhi, B.; Reddy, D.H. Recent Advances in Molecular Pathways and Therapeutic Implications Targeting Neuroinflammation for Alzheimer’s Disease. Inflammopharmacology 2021, 29, 1669–1681. [Google Scholar] [CrossRef] [Scilit] [PubMed]
- Nelson, P.T.; Alafuzoff, I.; Bigio, E.H.; Bouras, C.; Braak, H.; Cairns, N.J.; Castellani, R.J.; Crain, B.J.; Davies, P.; Del Tredici, K.; et al. Correlation of Alzheimer Disease Neuropathologic Changes with Cognitive Status: A Review of the Literature. J. Neuropathol. Exp. Neurol. 2012, 71, 362–381. [Google Scholar] [CrossRef] [Scilit] [PubMed]
- Duyckaerts, C.; Delatour, B.; Potier, M.C. Classification and Basic Pathology of Alzheimer Disease. Acta Neuropathol. 2009, 118, 5–36. [Google Scholar] [CrossRef] [Scilit] [PubMed]
- Nisbet, R.M.; Polanco, J.C.; Ittner, L.M.; Götz, J. Tau Aggregation and Its Interplay with Amyloid-β. Acta Neuropathol. 2015, 129, 207–220. [Google Scholar] [CrossRef] [Scilit] [PubMed]
- Busche, M.A.; Hyman, B.T. Synergy Between Amyloid-β and Tau in Alzheimer’s Disease. Nat. Neurosci. 2020, 23, 1183–1193. [Google Scholar] [CrossRef] [Scilit] [PubMed]
- Mayeux, R.; Stern, Y. Epidemiology of Alzheimer Disease. Cold Spring Harb. Perspect. Med. 2012, 2, a006239. [Google Scholar] [CrossRef] [Scilit] [PubMed]
- Ryman, D.C.; Acosta-Baena, N.; Aisen, P.S.; Bird, T.; Danek, A.; Fox, N.C.; Goate, A.; Frommelt, P.; Ghetti, B.; Langbaum, J.B.; et al. Symptom Onset in Autosomal Dominant Alzheimer Disease: A Systematic Review and Meta-Analysis. Neurology 2014, 83, 253–260. [Google Scholar] [CrossRef] [Scilit] [PubMed]
- Bateman, R.J.; Aisen, P.S.; De Strooper, B.; Fox, N.C.; Lemere, C.A.; Ringman, J.M.; Salloway, S.; Sperling, R.A.; Windisch, M.; Xiong, C. Autosomal-Dominant Alzheimer’s Disease: A Review and Proposal for the Prevention of Alzheimer’s Disease. Alzheimers Res. Ther. 2011, 3, 1. [Google Scholar] [CrossRef] [Scilit] [PubMed]
- Gao, Y.; Ren, R.J.; Zhong, Z.L.; Dammer, E.; Zhao, Q.H.; Shan, S.; Zhou, Z.; Li, X.; Zhang, Y.-Q.; Cui, H.-L.; et al. Mutation Profile of APP PSEN1 and PSEN2 in Chinese Familial Alzheimer’s Disease. Neurobiol. Aging 2019, 77, 154–157. [Google Scholar] [CrossRef] [Scilit] [PubMed]
- Jia, L.; Fu, Y.; Shen, L.; Zhang, H.; Zhu, M.; Qiu, Q.; Wang, Q.; Yan, X.; Kong, C.; Hao, J.; et al. PSEN1 PSEN2 and APP Mutations in 404 Chinese Pedigrees with Familial Alzheimer’s Disease. Alzheimers Dement. 2020, 16, 178–191. [Google Scholar] [CrossRef] [Scilit] [PubMed]
- Blauwendraat, C.; Wilke, C.; Jansen, I.E.; Schulte, C.; Simón-Sánchez, J.; Metzger, F.G.; Bender, B.; Gasser, T.; Maetzler, W.; Rizzu, P.; et al. Pilot Whole-Exome Sequencing of a German Early-Onset Alzheimer’s Disease Cohort Reveals a Substantial Frequency of PSEN2 Variants. Neurobiol. Aging 2016, 37, 208.e11–208.e17. [Google Scholar] [CrossRef] [Scilit] [PubMed]
- Jankowsky, J.L.; Xu, G.; Fromholt, D.; Gonzales, V.; Borchelt, D.R. Environmental Enrichment Exacerbates Amyloid Plaque Formation in a Transgenic Mouse Model of Alzheimer Disease. J. Neuropathol. Exp. Neurol. 2003, 62, 1220–1227. [Google Scholar] [CrossRef] [Scilit] [PubMed]
- Oddo, S.; Caccamo, A.; Shepherd, J.D.; Murphy, M.P.; Golde, T.E.; Kayed, R.; Metherate, R.; Mattson, M.P.; Akbari, Y.; LaFerla, F.M. Triple-Transgenic Model of Alzheimer’s Disease with Plaques and Tangles: Intracellular Abeta and Synaptic Dysfunction. Neuron 2003, 39, 409–421, Correction in Neuron 2026, 114, 1878. [Google Scholar] [CrossRef] [Scilit] [PubMed]
- Oakley, H.; Cole, S.L.; Logan, S.; Maus, E.; Shao, P.; Craft, J.; Guillozet-Bongaarts, A.; Ohno, M.; Disterhoft, J.; Van Eldik, L.; et al. Intraneuronal Beta-Amyloid Aggregates Neurodegeneration and Neuron Loss in Transgenic Mice with Five Familial Alzheimer’s Disease Mutations: Potential Factors in Amyloid Plaque Formation. J. Neurosci. 2006, 26, 10129–10140. [Google Scholar] [CrossRef] [Scilit] [PubMed]
- Jankowsky, J.L.; Zheng, H. Practical Considerations for Choosing a Mouse Model of Alzheimer’s Disease. Mol. Neurodegener. 2017, 12, 89. [Google Scholar] [CrossRef] [Scilit] [PubMed]
- Karran, E.; Mercken, M.; De Strooper, B. The Amyloid Cascade Hypothesis for Alzheimer’s Disease: An Appraisal for the Development of Therapeutics. Nat. Rev. Drug Discov. 2011, 10, 698–712. [Google Scholar] [CrossRef] [Scilit] [PubMed]
- Mullan, M.; Crawford, F.; Axelman, K.; Houlden, H.; Lilius, L.; Winblad, B.; Lannfelt, L. A Pathogenic Mutation for Probable Alzheimer’s Disease in the APP Gene at the N-Terminus of Beta-Amyloid. Nat. Genet. 1992, 1, 345–347. [Google Scholar] [CrossRef] [Scilit] [PubMed]
- Hendriks, L.; van Duijn, C.M.; Cras, P.; Cruts, M.; Van Hul, W.; van Harskamp, F.; Warren, A.; McInnis, M.G.; Antonarakis, S.E.; Martin, J.J.; et al. Presenile Dementia and Cerebral Haemorrhage Linked to a Mutation at Codon 692 of the Beta-Amyloid Precursor Protein Gene. Nat. Genet. 1992, 1, 218–221. [Google Scholar] [CrossRef] [Scilit] [PubMed]
- Walsh, D.M.; Hartley, D.M.; Condron, M.M.; Selkoe, D.J.; Teplow, D.B. In Vitro Studies of Amyloid Beta-Protein Fibril Assembly and Toxicity Provide Clues to the Aetiology of Flemish Variant (Ala692→Gly) Alzheimer’s Disease. Biochem. J. 2001, 355, 869–877. [Google Scholar] [CrossRef] [Scilit] [PubMed]
- Cras, P.; van Harskamp, F.; Hendriks, L.; Ceuterick, C.; van Duijn, C.M.; Stefanko, S.Z.; Hofman, A.; Kros, J.M.; Van Broeckhoven, C.; Martin, J.J. Presenile Alzheimer Dementia Characterized by Amyloid Angiopathy and Large Amyloid Core Type Senile Plaques in the APP 692Ala→Gly Mutation. Acta Neuropathol. 1998, 96, 253–260. [Google Scholar] [CrossRef] [Scilit] [PubMed]
- Zou, Z.; Liu, C.; Che, C.; Huang, H. Clinical Genetics of Alzheimer’s Disease. BioMed Res. Int. 2014, 2014, 291862. [Google Scholar] [CrossRef] [Scilit] [PubMed]
- Levy, E.; Carman, M.D.; Fernandez-Madrid, I.J.; Power, M.D.; Lieberburg, I.; van Duinen, S.G.; Bots, G.T.; Luyendijk, W.; Frangione, B. Mutation of the Alzheimer’s Disease Amyloid Gene in Hereditary Cerebral Hemorrhage Dutch Type. Science 1990, 248, 1124–1126. [Google Scholar] [CrossRef] [Scilit] [PubMed]
- Grabowski, T.J.; Cho, H.S.; Vonsattel, J.P.; Rebeck, G.W.; Greenberg, S.M. Novel Amyloid Precursor Protein Mutation in an Iowa Family with Dementia and Severe Cerebral Amyloid Angiopathy. Ann. Neurol. 2001, 49, 697–705. [Google Scholar] [CrossRef] [Scilit] [PubMed]
- Pasalar, P.; Najmabadi, H.; Noorian, A.R.; Moghimi, B.; Jannati, A.; Soltanzadeh, A.; Krefft, T.; Crook, R.; Hardy, J. An Iranian Family with Alzheimer’s Disease Caused by a Novel APP Mutation (Thr714Ala). Neurology 2002, 58, 1574–1575. [Google Scholar] [CrossRef] [Scilit] [PubMed]
- Kumar-Singh, S.; De Jonghe, C.; Cruts, M.; Kleinert, R.; Wang, R.; Mercken, M.; De Strooper, B.; Vanderstichele, H.; Löfgren, A.; Vanderhoeven, I.; et al. Nonfibrillar Diffuse Amyloid Deposition Due to a Gamma(42)-Secretase Site Mutation Points to an Essential Role for N-Truncated A Beta(42) in Alzheimer’s Disease. Hum. Mol. Genet. 2000, 9, 2589–2598. [Google Scholar] [CrossRef] [Scilit] [PubMed]
- Bornebroek, M.; De Jonghe, C.; Haan, J.; Kumar-Singh, S.; Younkin, S.; Roos, R.; Van Broeckhoven, C. Hereditary Cerebral Hemorrhage with Amyloidosis Dutch Type (AbetaPP 693): Decreased Plasma Amyloid-Beta 42 Concentration. Neurobiol. Dis. 2003, 14, 619–623. [Google Scholar] [CrossRef] [Scilit] [PubMed]
- Ancolio, K.; Dumanchin, C.; Barelli, H.; Warter, J.M.; Brice, A.; Campion, D.; Frébourg, T.; Checler, F. Unusual Phenotypic Alteration of Beta Amyloid Precursor Protein (BetaAPP) Maturation by a New Val-715 → Met BetaAPP-770 Mutation Responsible for Probable Early-Onset Alzheimer’s Disease. Proc. Natl. Acad. Sci. USA 1999, 96, 4119–4124. [Google Scholar] [CrossRef] [Scilit] [PubMed]
- Cruts, M.; Dermaut, B.; Rademakers, R.; Van den Broeck, M.; Stögbauer, F.; Van Broeckhoven, C. Novel APP Mutation V715A Associated with Presenile Alzheimer’s Disease in a German Family. J. Neurol. 2003, 250, 1374–1375. [Google Scholar] [CrossRef] [Scilit] [PubMed]
- Eckman, C.B.; Mehta, N.D.; Crook, R.; Perez-tur, J.; Prihar, G.; Pfeiffer, E.; Graff-Radford, N.; Hinder, P.; Yager, D.; Zenk, B.; et al. A New Pathogenic Mutation in the APP Gene (I716V) Increases the Relative Proportion of A Beta 42(43). Hum. Mol. Genet. 1997, 6, 2087–2089. [Google Scholar] [CrossRef] [Scilit] [PubMed]
- Goate, A.; Chartier-Harlin, M.C.; Mullan, M.; Brown, J.; Crawford, F.; Fidani, L.; Giuffra, L.; Haynes, A.; Irving, N.; James, L.; et al. Segregation of a Missense Mutation in the Amyloid Precursor Protein Gene with Familial Alzheimer’s Disease. Nature 1991, 349, 704–706. [Google Scholar] [CrossRef] [Scilit] [PubMed]
- Murrell, J.R.; Hake, A.M.; Quaid, K.A.; Farlow, M.R.; Ghetti, B. Early-Onset Alzheimer Disease Caused by a New Mutation (V717L) in the Amyloid Precursor Protein Gene. Arch. Neurol. 2000, 57, 885–887. [Google Scholar] [CrossRef] [Scilit] [PubMed]
- Kamino, K.; Orr, H.T.; Payami, H.; Wijsman, E.M.; Alonso, M.E.; Pulst, S.M.; Anderson, L.; O’dahl, S.; Nemens, E.; White, J.A.; et al. Linkage and Mutational Analysis of Familial Alzheimer Disease Kindreds for the APP Gene Region. Am. J. Hum. Genet. 1992, 51, 998–1014. [Google Scholar] [PubMed]
- Chen, C.; Wei, J.; Ma, X.; Xia, B.; Shakir, N.; Zhang, J.K.; Zhang, L.; Cui, Y.; Ferguson, D.; Qiu, S.; et al. Disrupted Maturation of Prefrontal Layer 5 Neuronal Circuits in an Alzheimer’s Mouse Model of Amyloid Deposition. Neurosci. Bull. 2023, 39, 881–892. [Google Scholar] [CrossRef] [Scilit] [PubMed]
- Westi, E.W.; Molhemi, S.; Hansen, C.T.; Skoven, C.S.; Knopper, R.W.; Ahmad, D.A.; Rindshøj, M.B.; Ameen, A.O.; Hansen, B.; Kohlmeier, K.A.; et al. Comprehensive Analysis of the 5xFAD Mouse Model of Alzheimer’s Disease Using dMRI Immunohistochemistry and Neuronal and Glial Functional Metabolic Mapping. Biomolecules 2024, 14, 1294. [Google Scholar] [CrossRef] [Scilit] [PubMed]
- Wong, S.Q.; Ouellette, A.; McNamara, A.; Tam, R.A.; Alexandrov, A.; Nawrocik-Madrid, A.; Sanchez, J.J.; Ginsburg, B.C.; Andrade, A.A. Spatial Memory in Alzheimer’s Disease 5xFAD Mice Is Enhanced by XPO1 Inhibitor KPT-330. GeroScience 2024, 48, 8341–8352. [Google Scholar]
- Forner, S.; Kawauchi, S.; Balderrama-Gutierrez, G.; Kramár, E.A.; Matheos, D.P.; Phan, J.; Javonillo, D.I.; Tran, K.M.; Hingco, E.; da Cunha, C.; et al. Systematic Phenotyping and Characterization of the 5xFAD Mouse Model of Alzheimer’s Disease. Sci. Data 2021, 8, 270. [Google Scholar] [CrossRef] [Scilit] [PubMed]
- Eimer, W.A.; Vassar, R. Neuron Loss in the 5XFAD Mouse Model of Alzheimer’s Disease Correlates with Intraneuronal Aβ42 Accumulation and Caspase-3 Activation. Mol. Neurodegener. 2013, 8, 2. [Google Scholar] [CrossRef] [Scilit] [PubMed]
- Richard, B.C.; Kurdakova, A.; Baches, S.; Bayer, T.A.; Weggen, S.; Wirths, O. Gene Dosage Dependent Aggravation of the Neurological Phenotype in the 5XFAD Mouse Model of Alzheimer’s Disease. J. Alzheimer’s Dis. 2015, 45, 1223–1236. [Google Scholar] [CrossRef] [Scilit] [PubMed]
- Doronin, V.B.; Parkhomenko, T.A.; Castellazzi, M.; Padroni, M.; Pastore, M.; Buneva, V.N.; Granieri, E.; Nevinsky, G.A. Comparison of Antibodies Hydrolyzing Myelin Basic Protein from the Cerebrospinal Fluid and Serum of Patients with Multiple Sclerosis. PLoS ONE 2014, 9, e107807. [Google Scholar] [CrossRef] [Scilit] [PubMed]
- Steinman, L. Multiple Sclerosis: A Two-Stage Disease. Nat. Immunol. 2001, 2, 762–764. [Google Scholar] [CrossRef] [Scilit] [PubMed]
- Lanz, T.V.; Brewer, R.C.; Ho, P.P.; Moon, J.S.; Jude, K.M.; Fernandez, D.; Fernandes, R.A.; Gomez, A.M.; Nadj, G.-S.; Bartley, C.M.; et al. Clonally Expanded B Cells in Multiple Sclerosis Bind EBV EBNA1 and GlialCAM. Nature 2022, 603, 321–327. [Google Scholar] [CrossRef] [Scilit] [PubMed]
- Steinman, L.; Fox, E.; Hartung, H.P.; Alvarez, E.; Qian, P.; Wray, S.; Robertson, D.; Huang, D.; Selmaj, K.; Wynn, D.; et al. Ublituximab Versus Teriflunomide in Relapsing Multiple Sclerosis. N. Engl. J. Med. 2022, 387, 704–714. [Google Scholar] [CrossRef] [Scilit] [PubMed]
- Mekada, K.; Yoshiki, A. Substrains Matter in Phenotyping of C57BL/6 Mice. Exp. Anim. 2021, 70, 145–160. [Google Scholar] [CrossRef] [Scilit] [PubMed]
- Tawfik, D.S.; Chap, R.; Green, B.S.; Sela, M.; Eshhar, Z. Unexpectedly High Occurrence of Catalytic Antibodies in MRL/lpr and SJL Mice Immunized with a Transition-State Analog: Is There a Linkage to Autoimmunity? Proc. Natl. Acad. Sci. USA 1995, 92, 2145–2149. [Google Scholar] [CrossRef] [Scilit] [PubMed]
- Charbonnier, J.B.; Golinelli-Pimpaneau, B.; Gigant, B.; Tawfik, D.S.; Chap, R.; Schindler, D.G.; Kim, S.H.; Green, B.S.; Eshhar, Z.; Knossow, M. Structural Convergence in the Active Sites of a Family of Catalytic Antibodies. Science 1997, 275, 1140–1142. [Google Scholar] [CrossRef] [Scilit] [PubMed]
- Thomas, J.O.; Wilson, C.M.; Hardin, J.A. The Major Core Histone Antigenic Determinants in Systemic Lupus Erythematosus Are in the Trypsin-Sensitive Regions. FEBS Lett. 1984, 169, 90–96. [Google Scholar] [CrossRef] [Scilit] [PubMed]
- Banchev, T.B.; Zlatanova, J.S. Antigenic Structure of Histone H1. Mol. Cell. Biochem. 1991, 107, 161–168. [Google Scholar] [CrossRef] [Scilit] [PubMed]
- Muller, S.; Soussanieh, A.; Bouley, J.P.; Reinbolt, J.; Van Regenmortel, M.H. Localization of Two Antigenic Determinants in Histone H4. Biochim. Biophys. Acta 1983, 747, 100–106. [Google Scholar] [CrossRef] [Scilit] [PubMed]
- Muller, S.; Plaue, S.; Couppez, M.; Van Regenmortel, M.H. Comparison of Different Methods for Localizing Antigenic Regions in Histone H2A. Mol. Immunol. 1986, 23, 593–601. [Google Scholar] [CrossRef] [Scilit] [PubMed]
- Maglioco, A.; Agüero, F.A.; Valacco, M.P.; Valdez, A.J.; Paulino, M.; Fuchs, A.G. Characterization of the B-Cell Epitopes of Echinococcus granulosus Histones H4 and H2A Recognized by Sera from Patients with Liver Cysts. Front. Cell. Infect. Microbiol. 2022, 12, 901994. [Google Scholar] [CrossRef] [Scilit] [PubMed]
- Soto, M.; Requena, J.M.; Quijada, L.; Gomez, L.C.; Guzman, F.; Patarroyo, M.E.; Alonso, C. Characterization of the Antigenic Determinants of the Leishmania Infantum Histone H3 Recognized by Antibodies Elicited During Canine Visceral Leishmaniasis. Clin. Exp. Immunol. 1996, 106, 454–461. [Google Scholar] [CrossRef] [Scilit] [PubMed]
- Khaitov, R.M.; Ignatieva, G.A.; Sidorovich, I.G. Immunology; Medicine: Moscow, Russia, 2000. (In Russian) [Google Scholar]
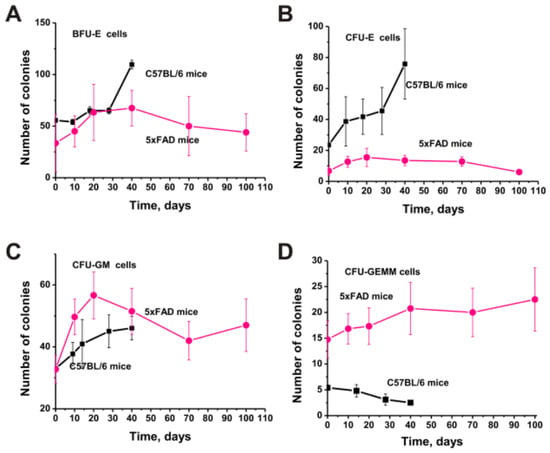
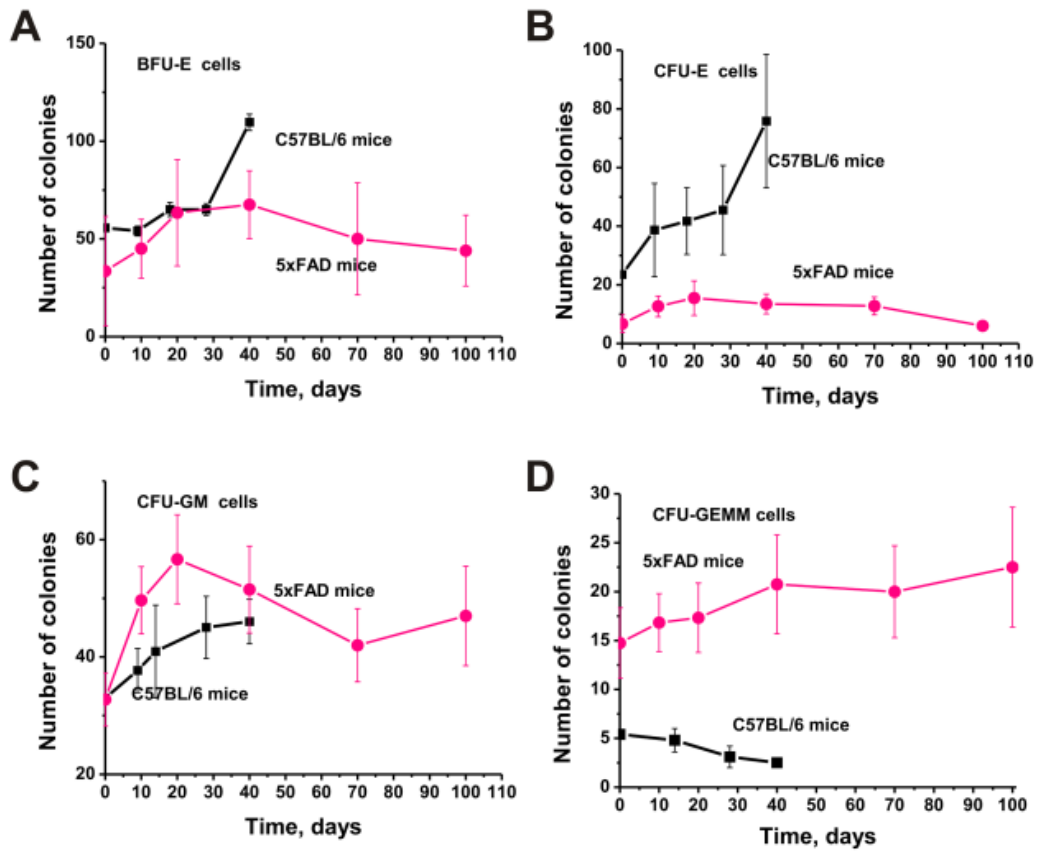
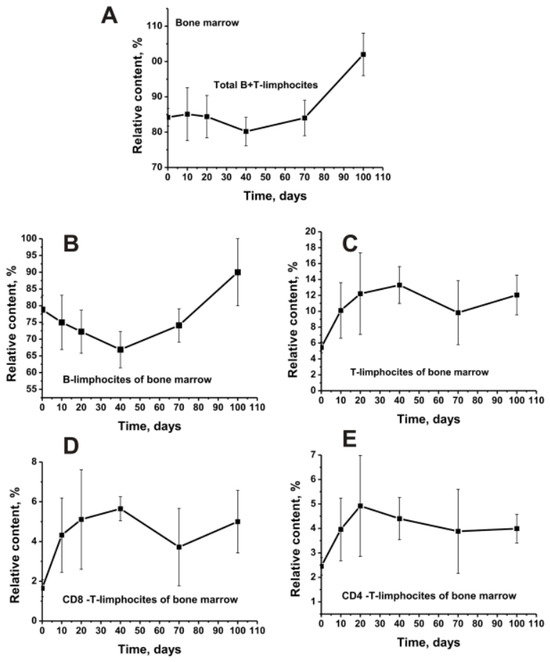
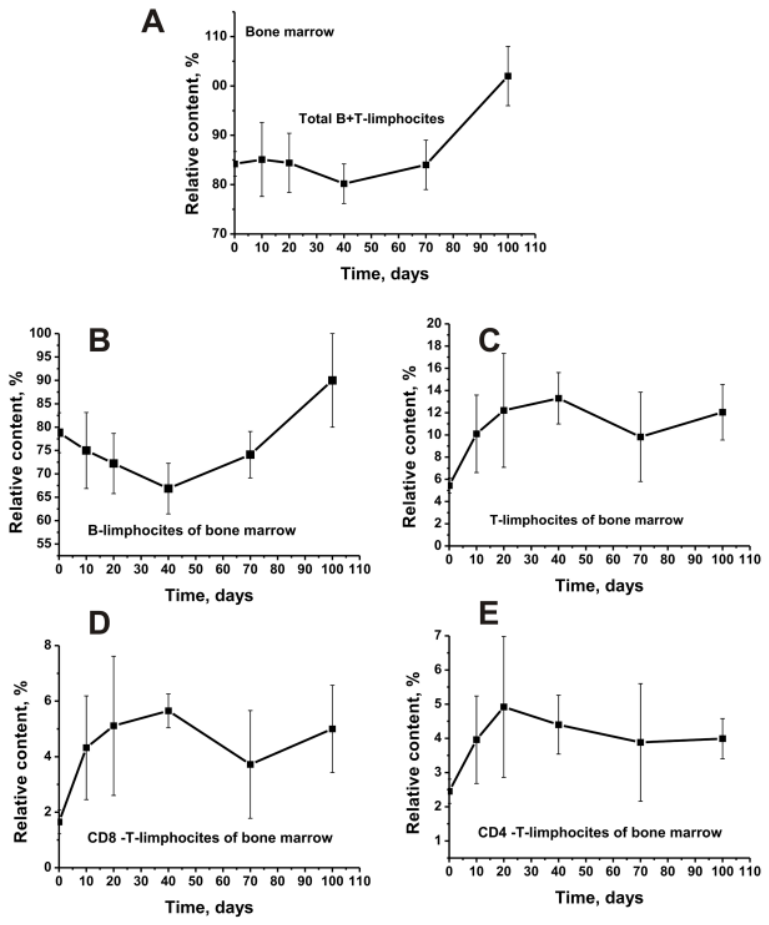
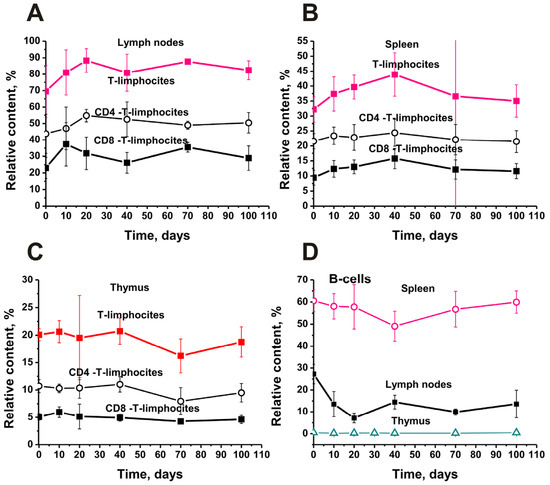
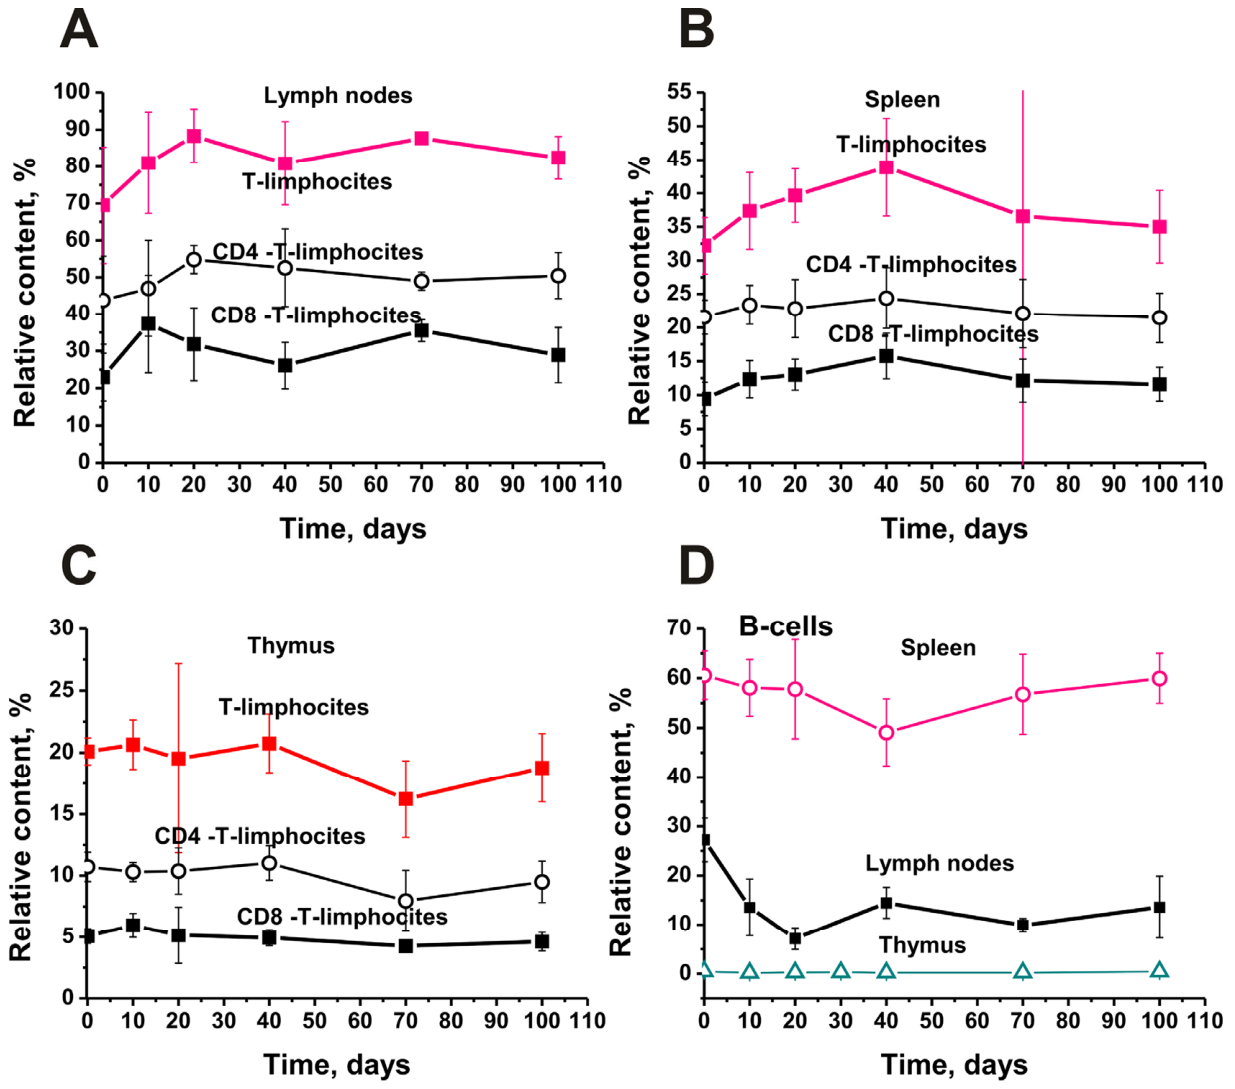
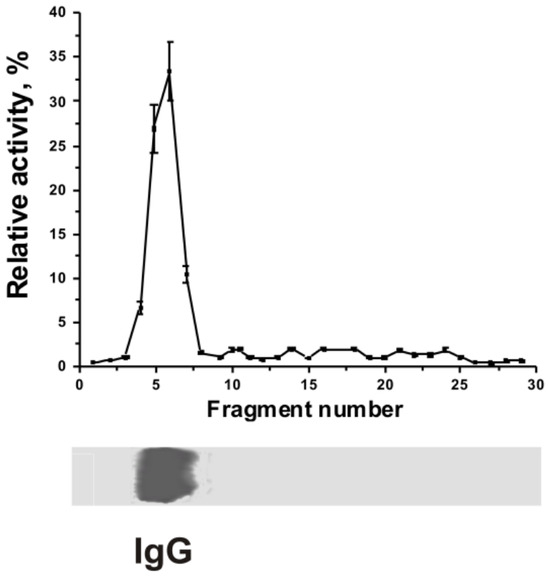
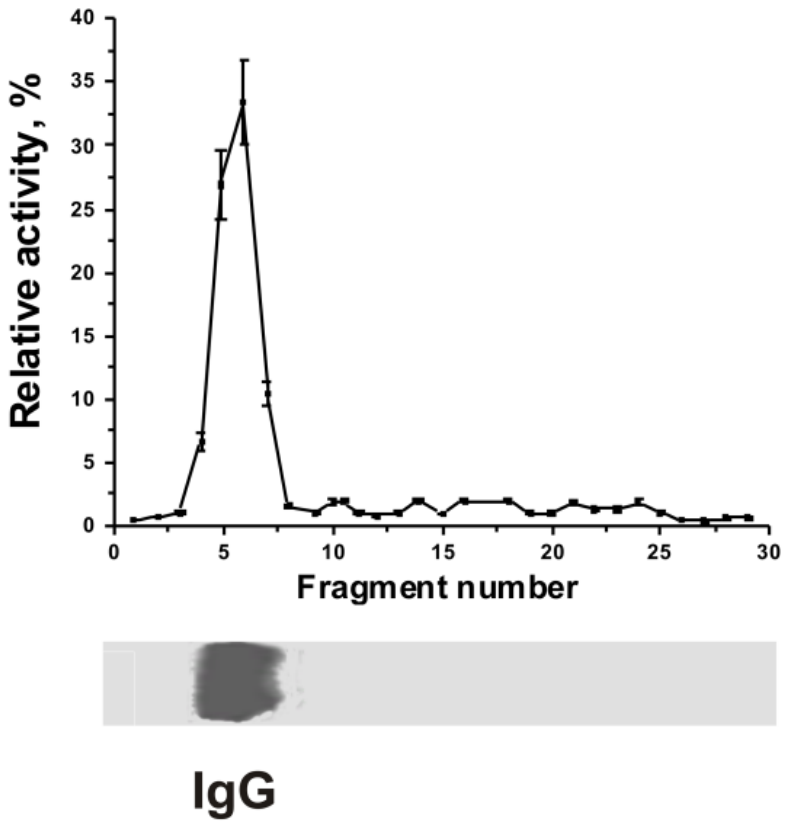
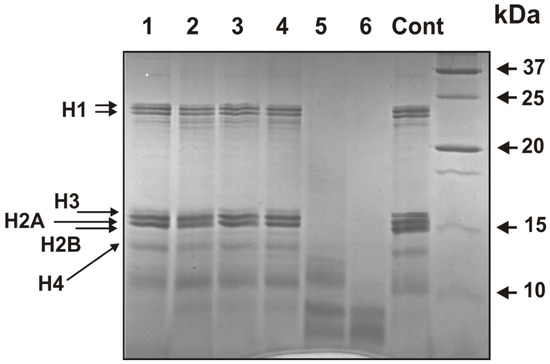
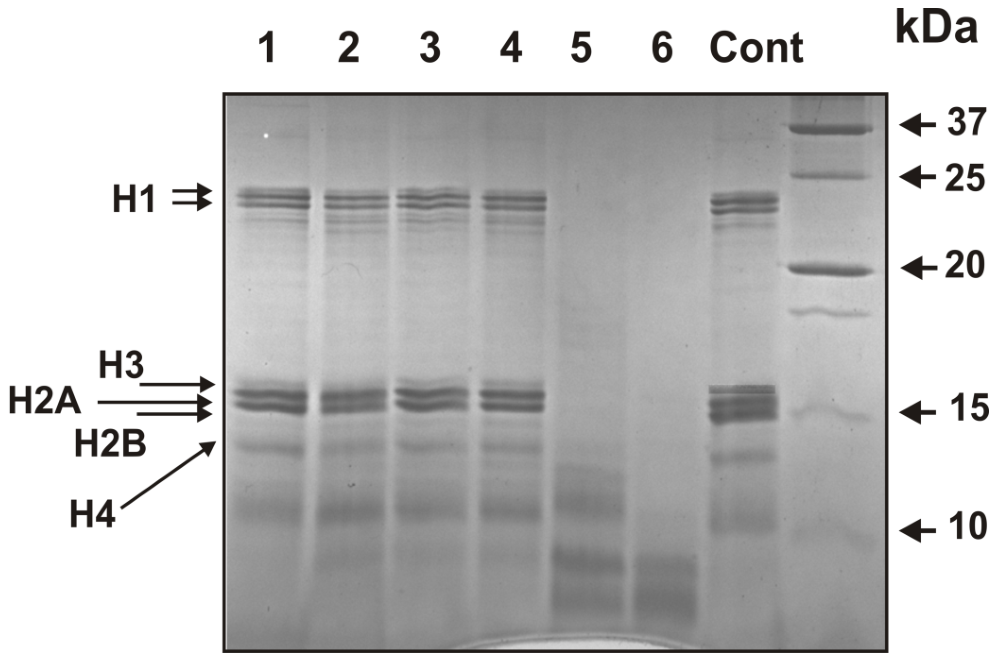
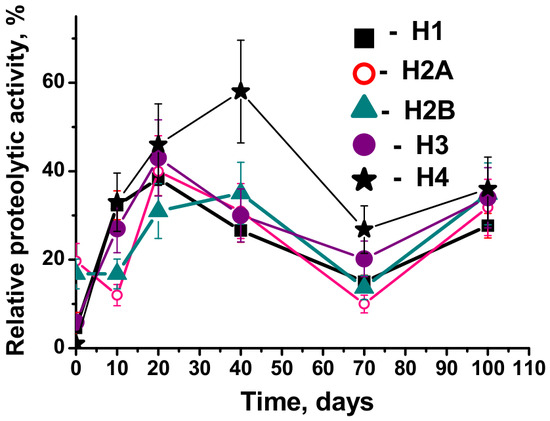
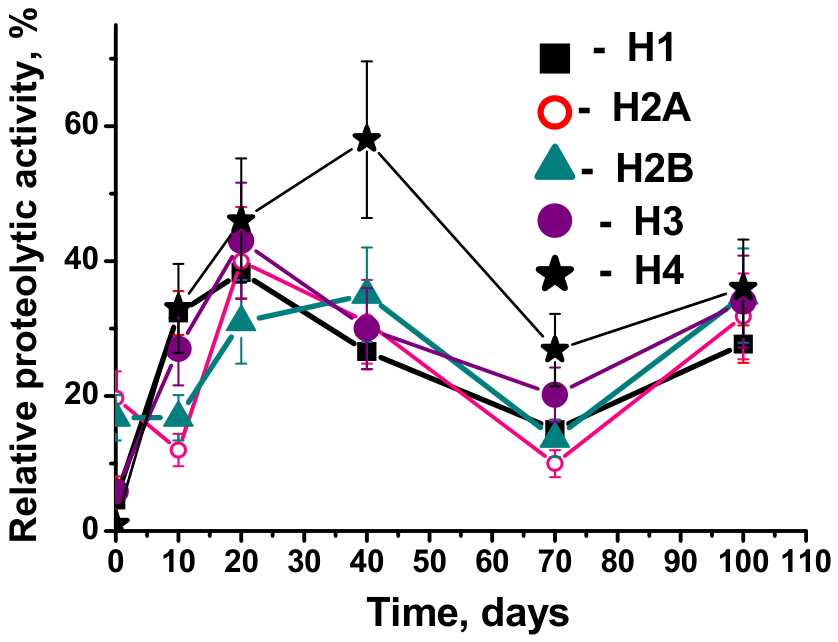
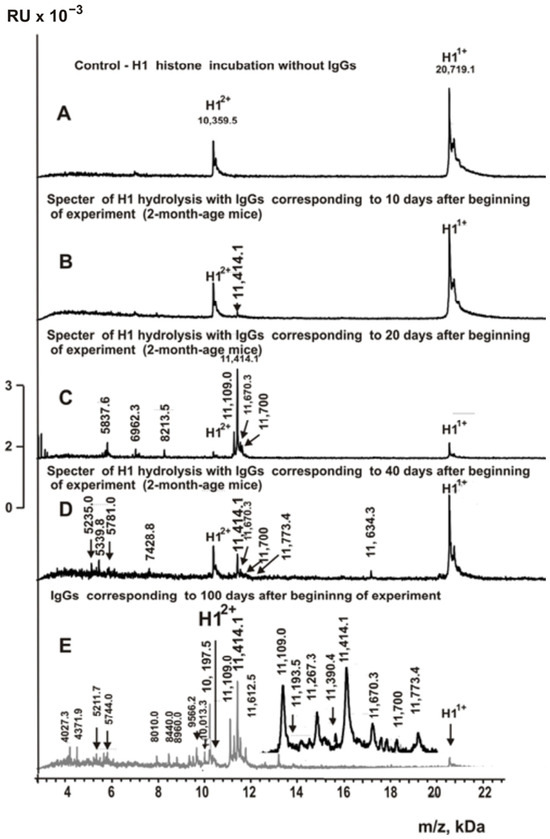
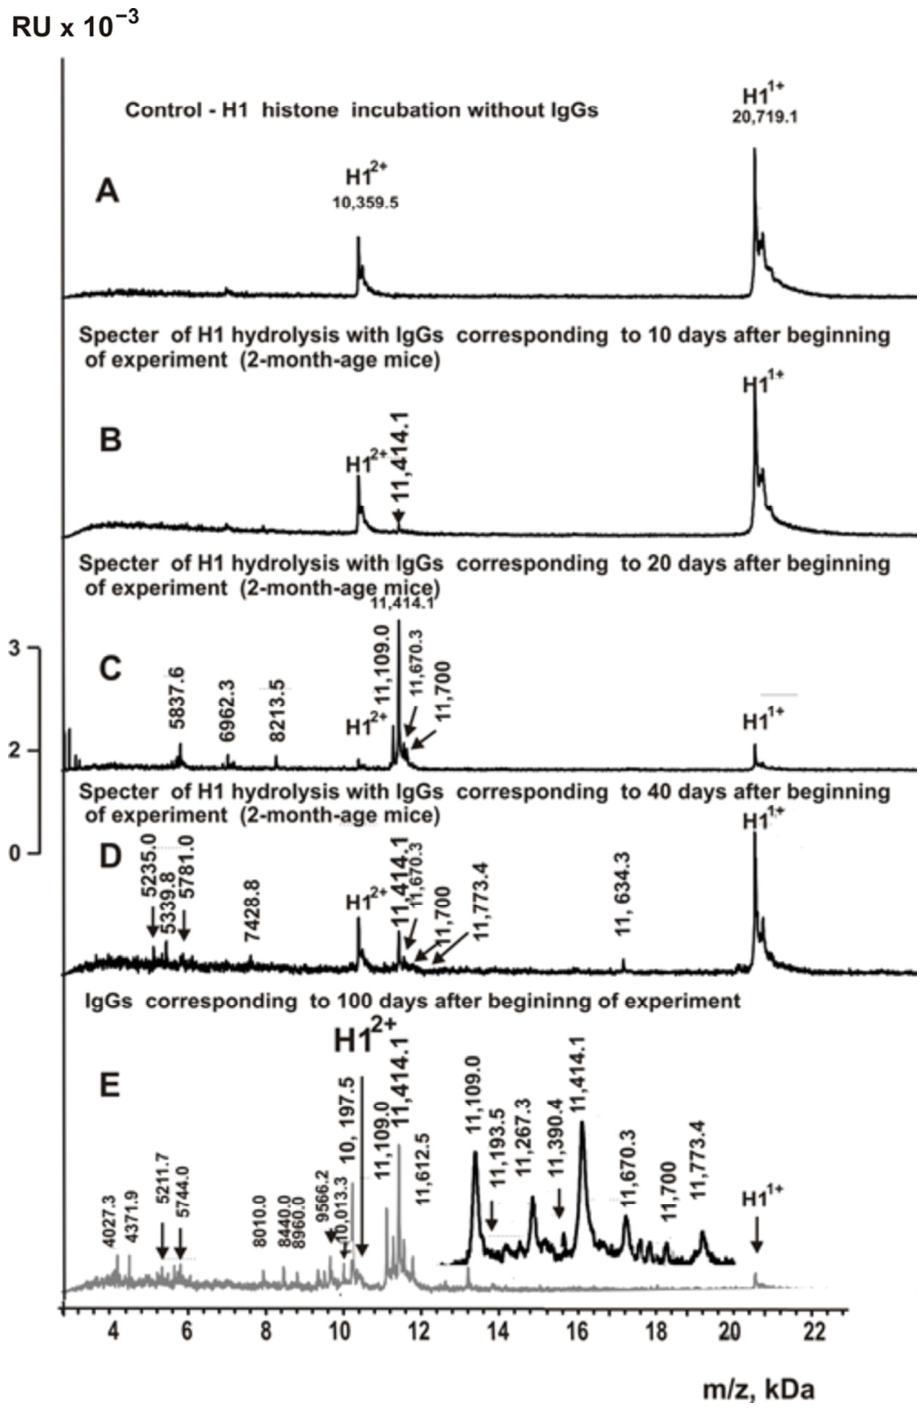
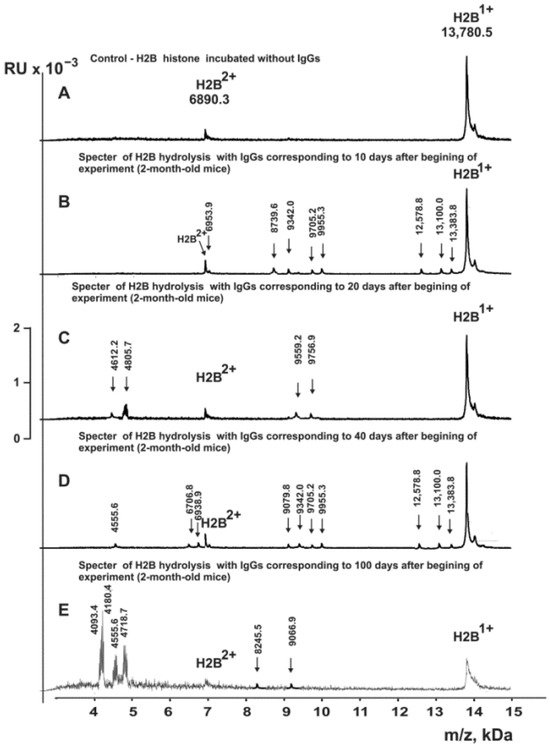
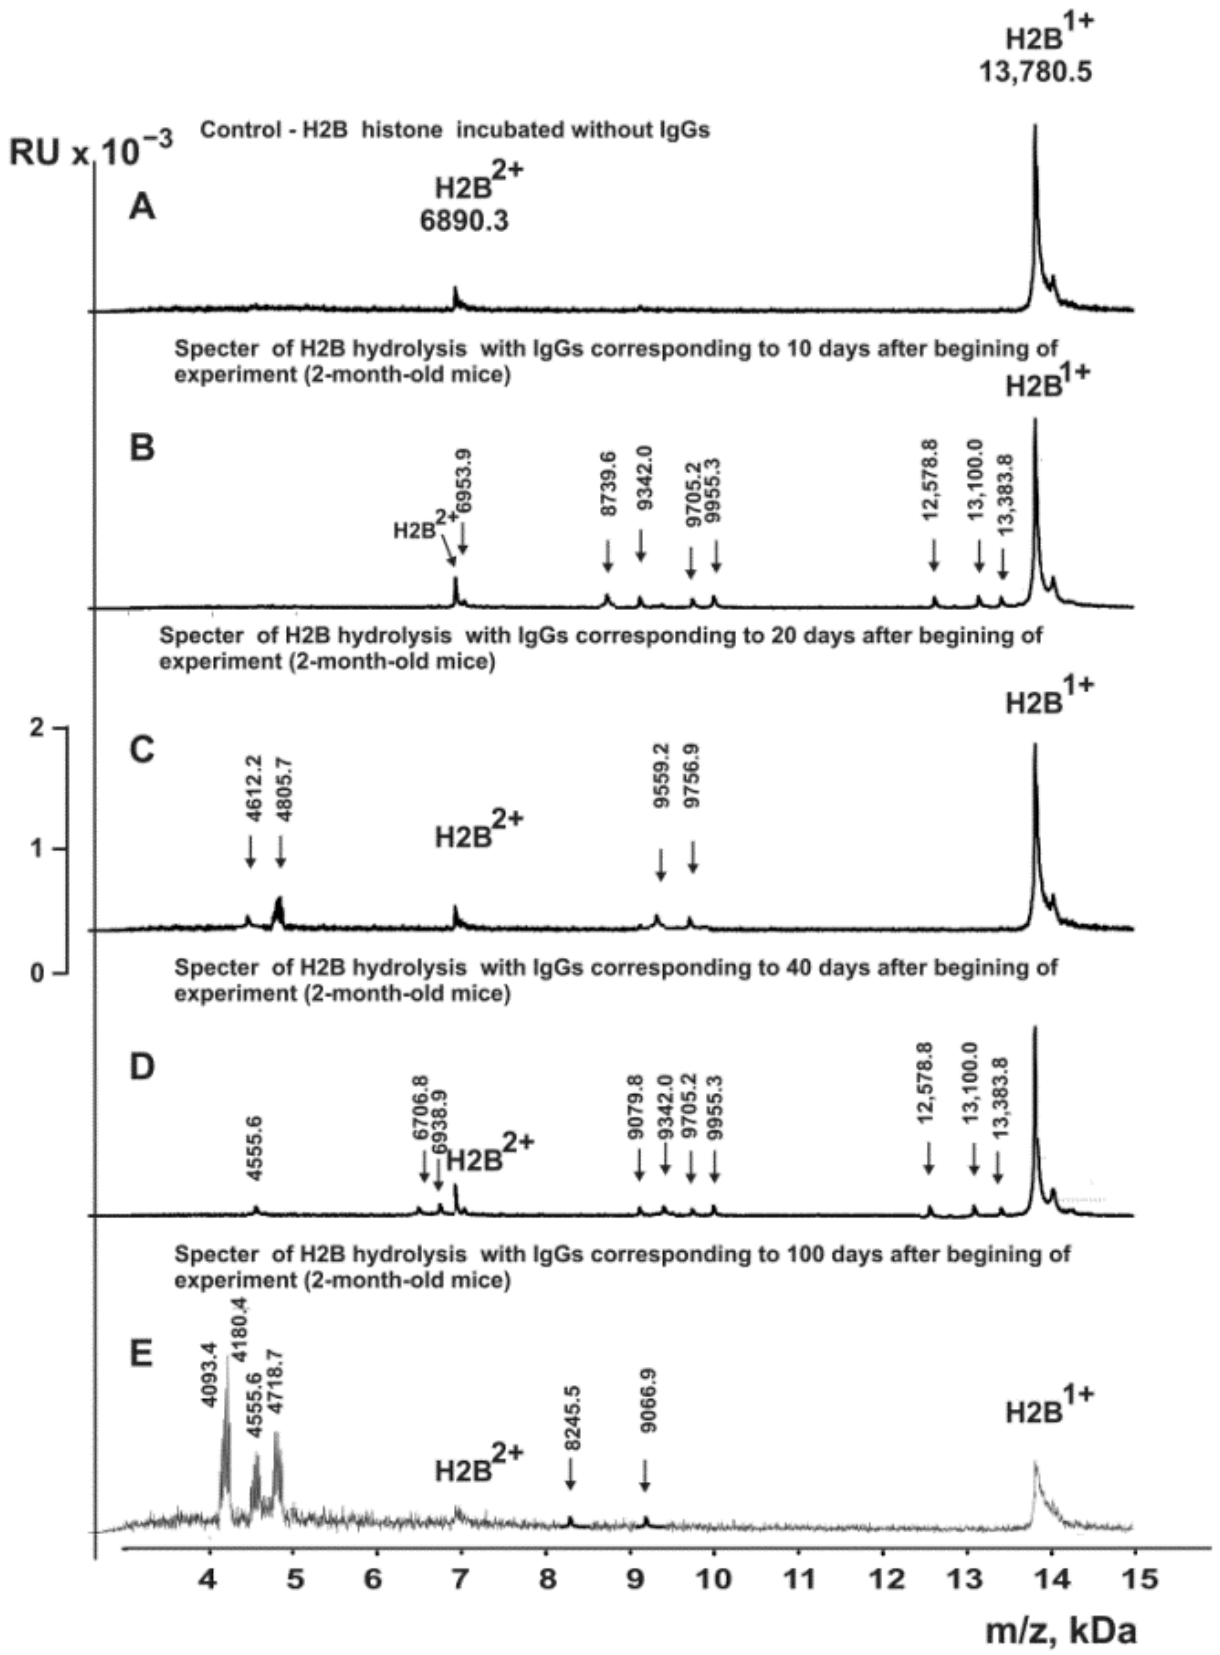
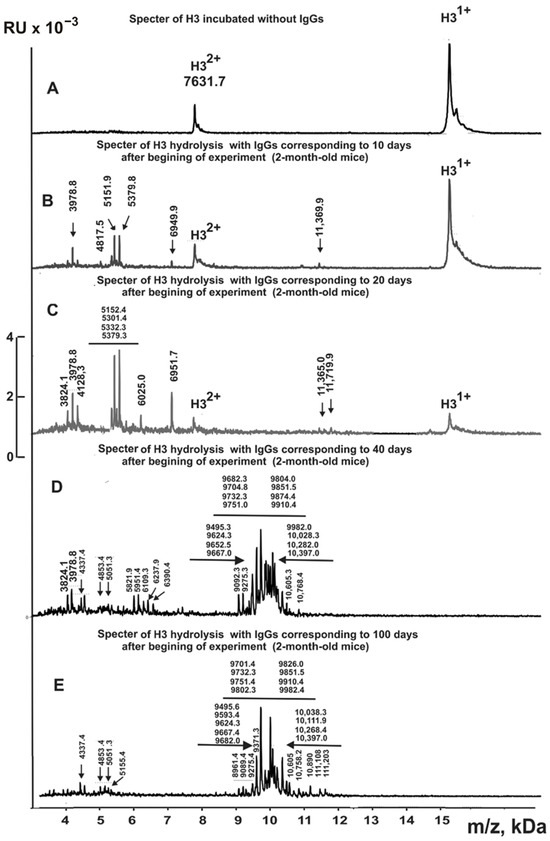
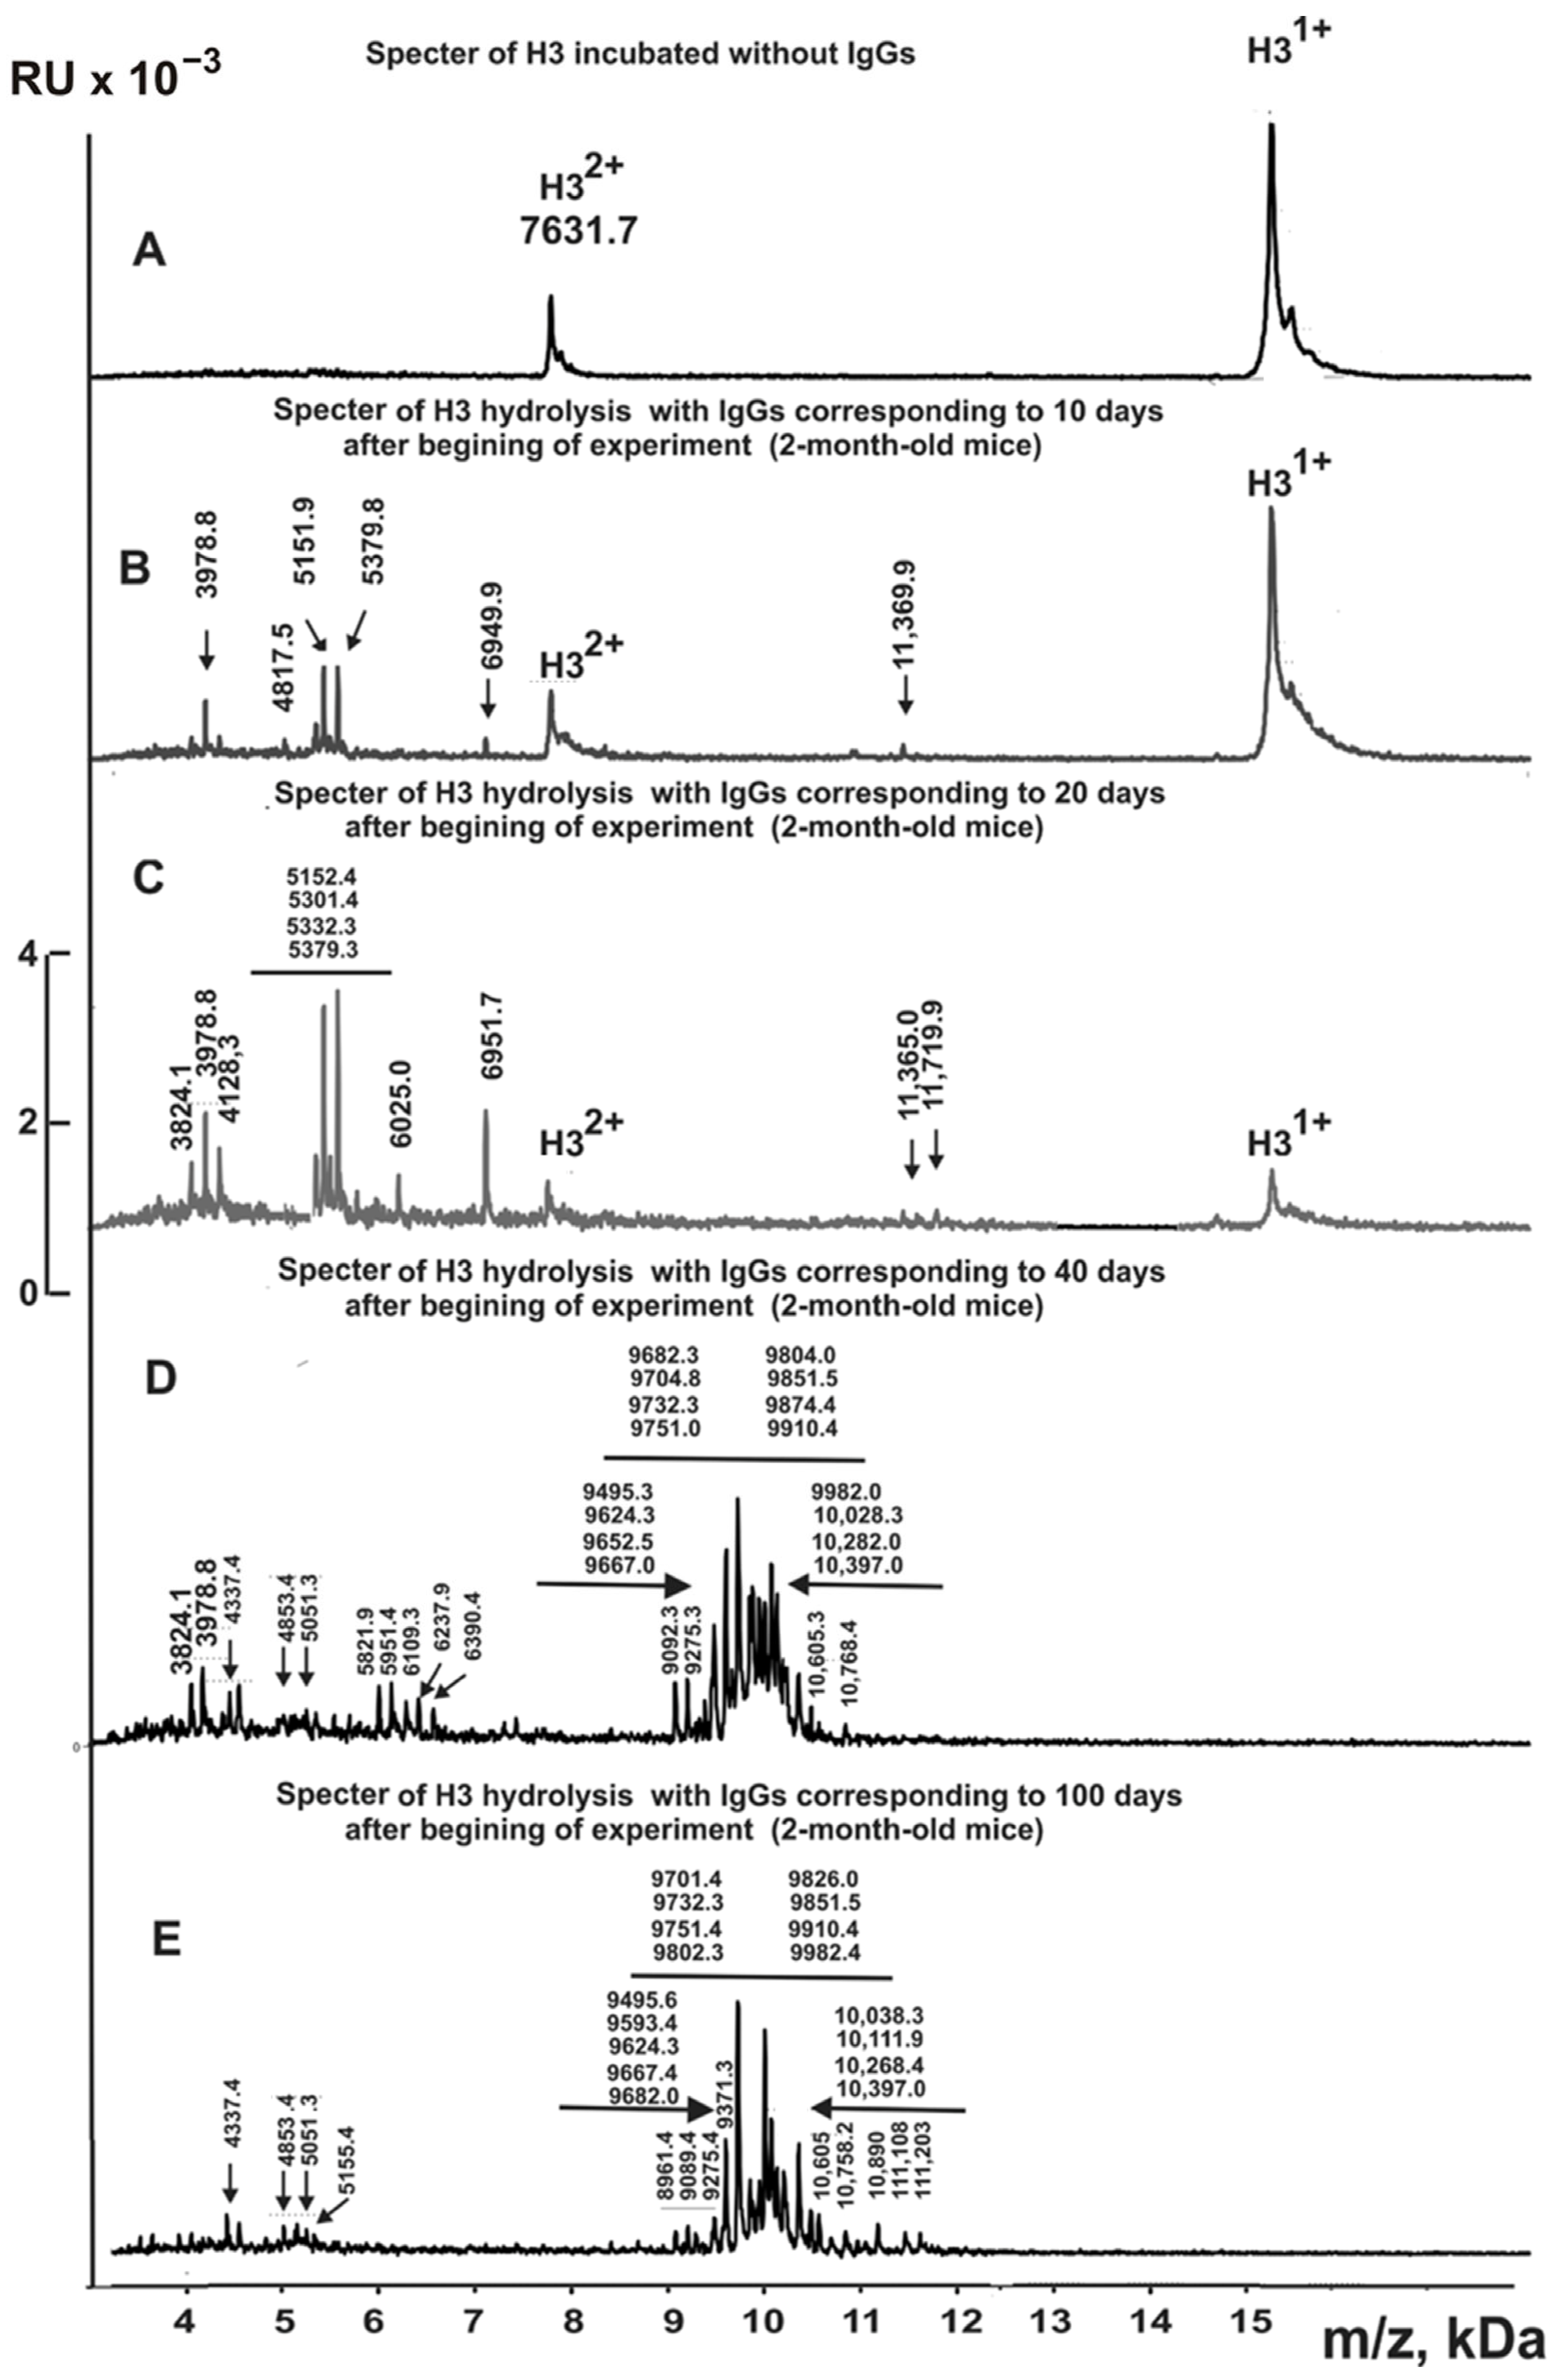
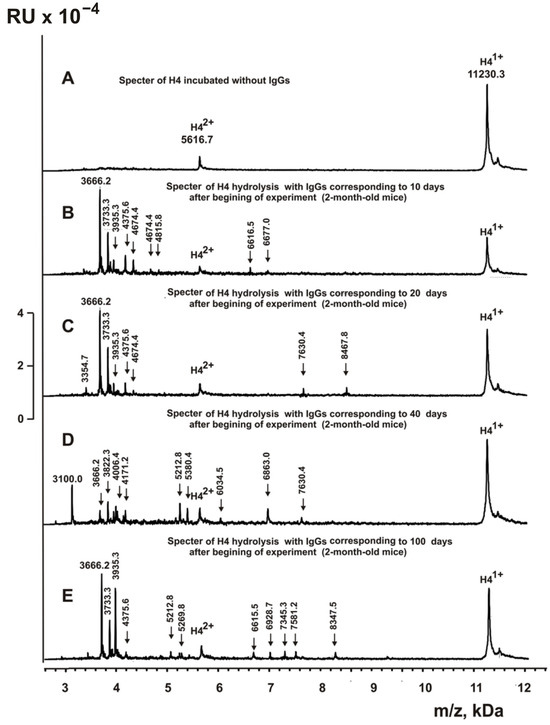
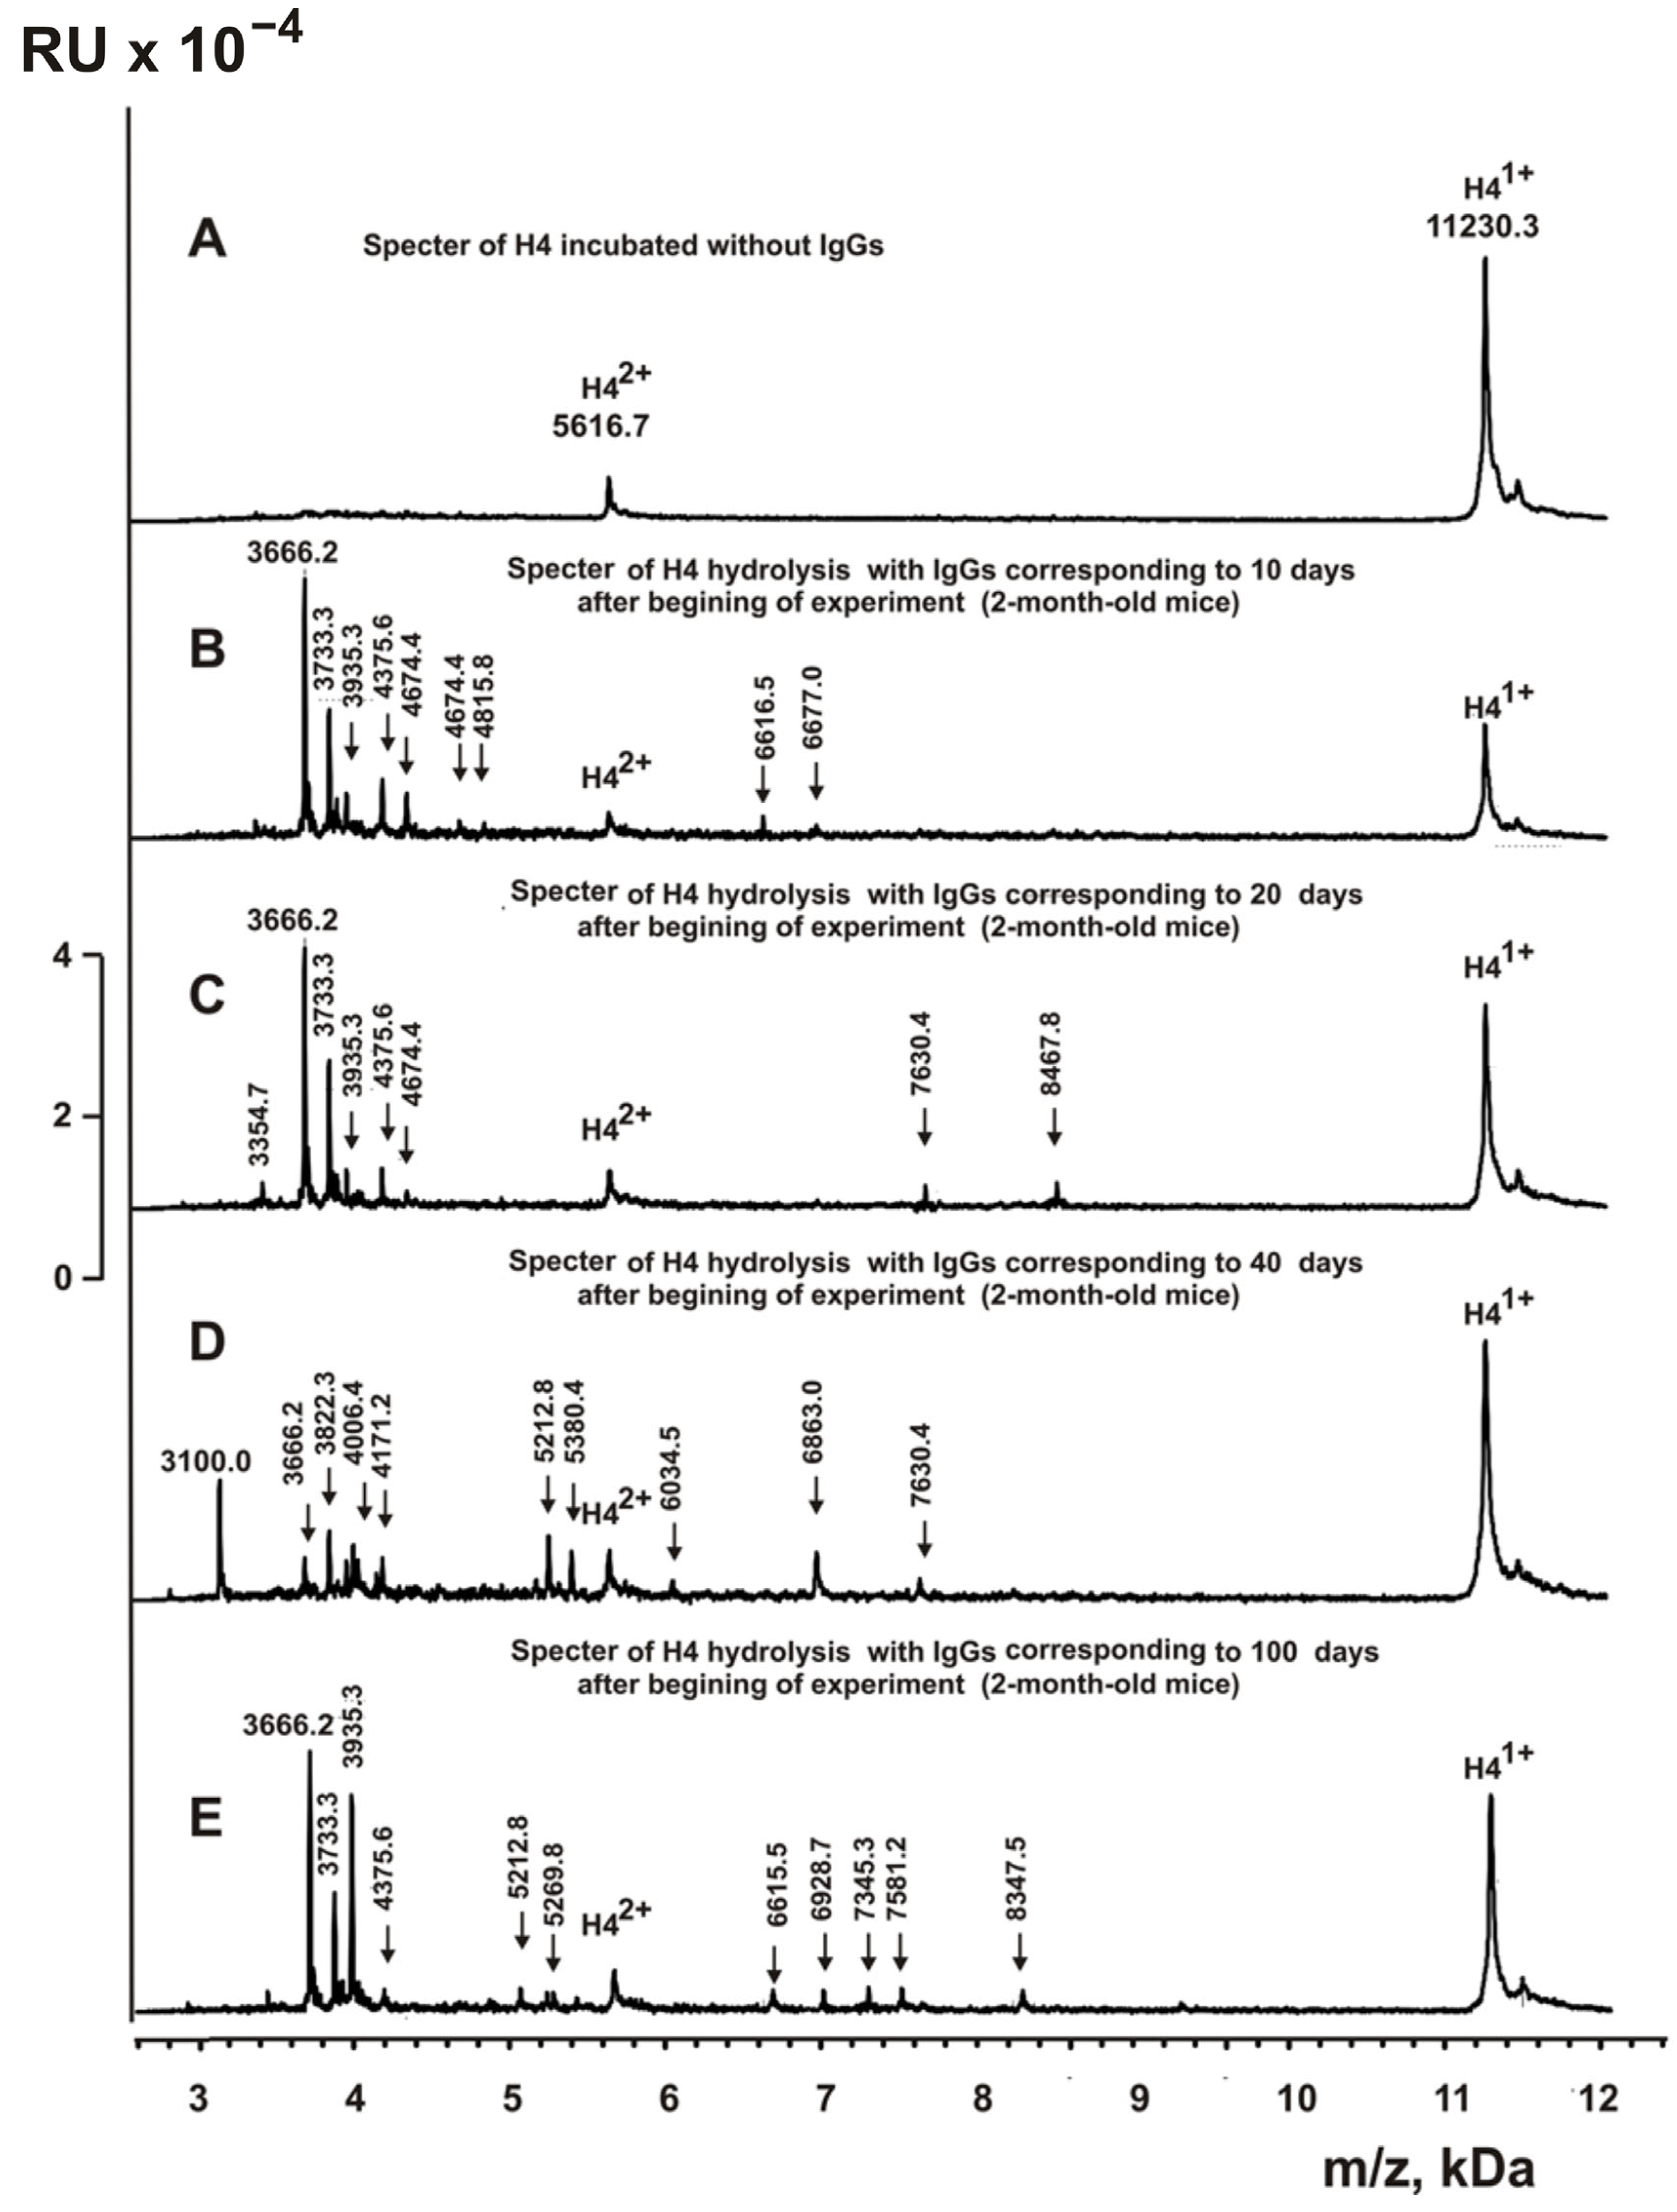
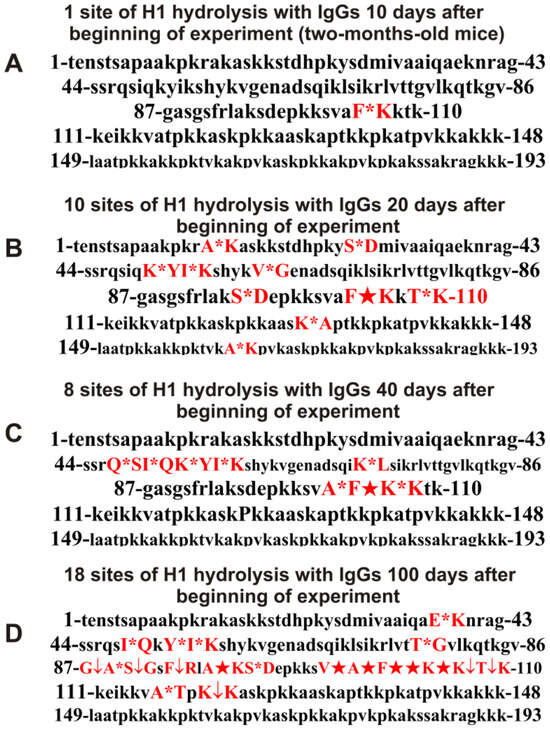
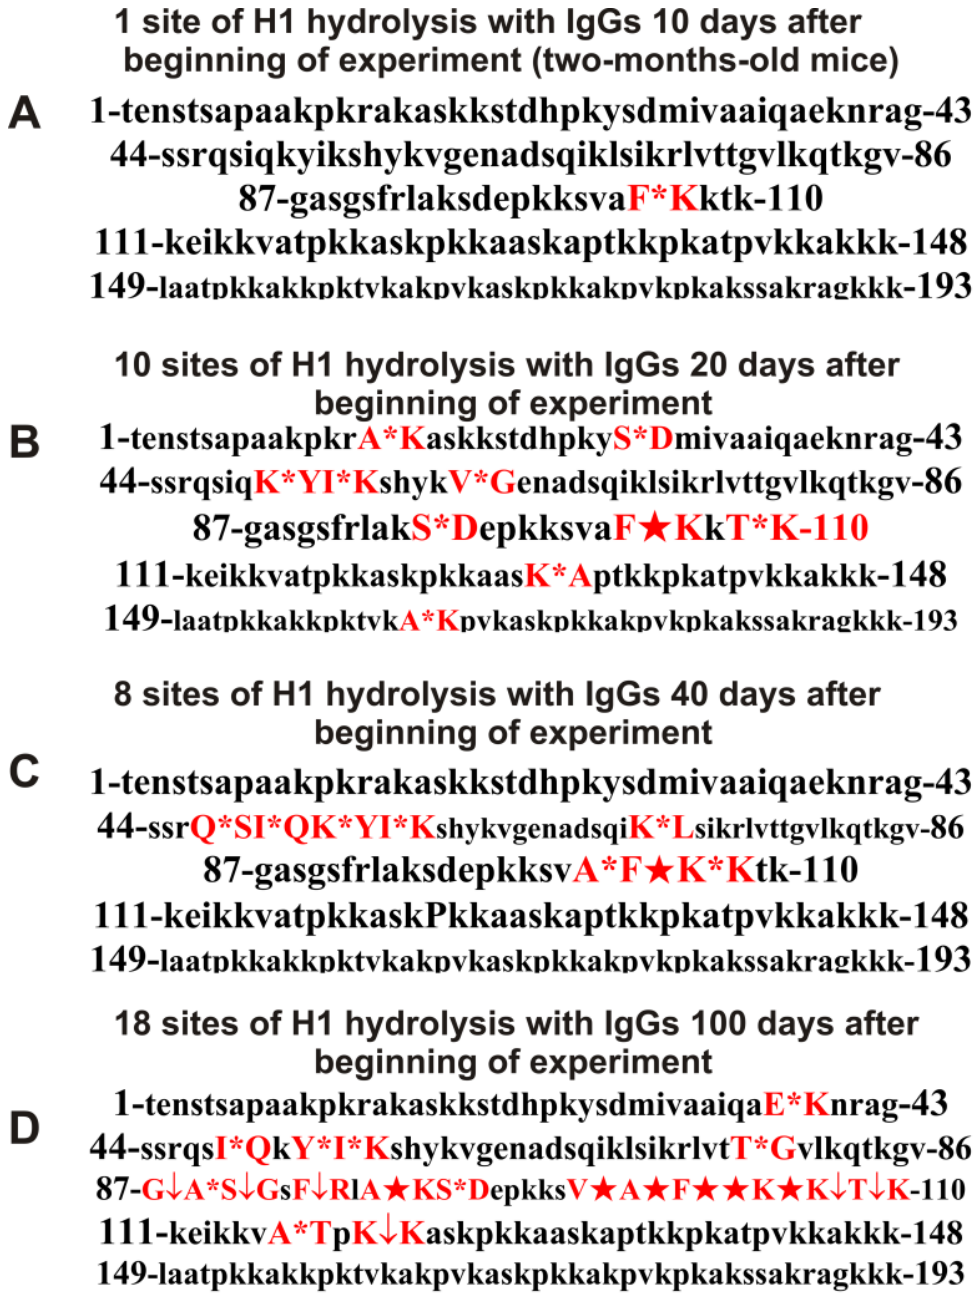
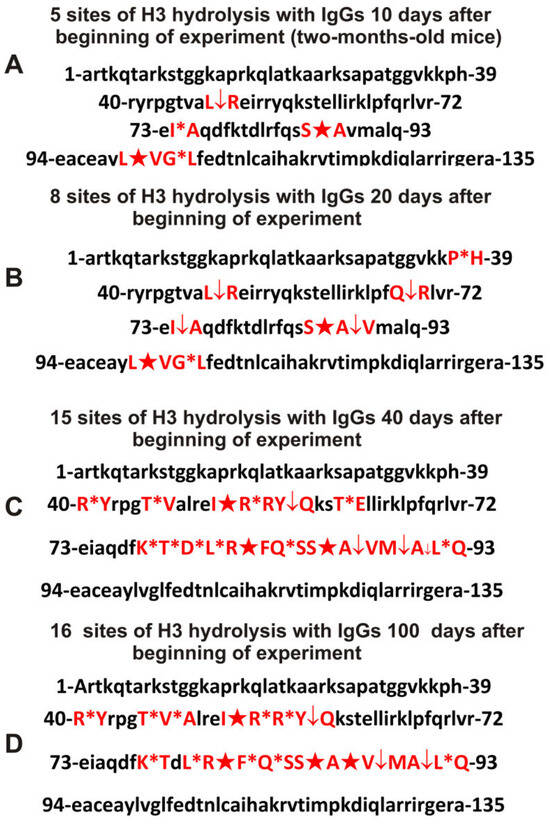
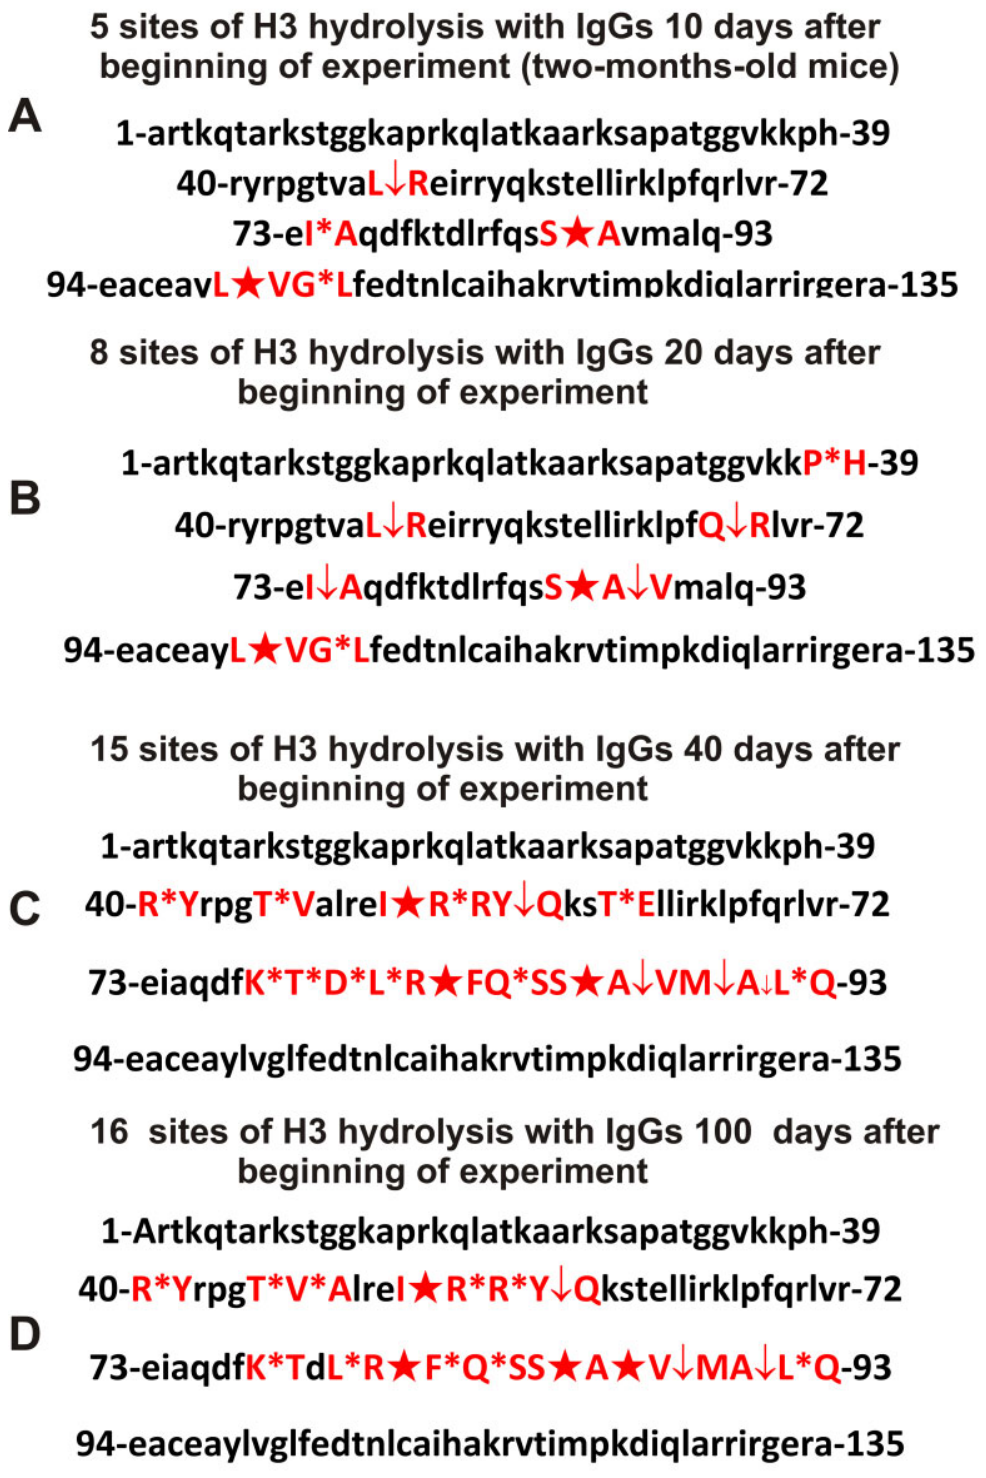
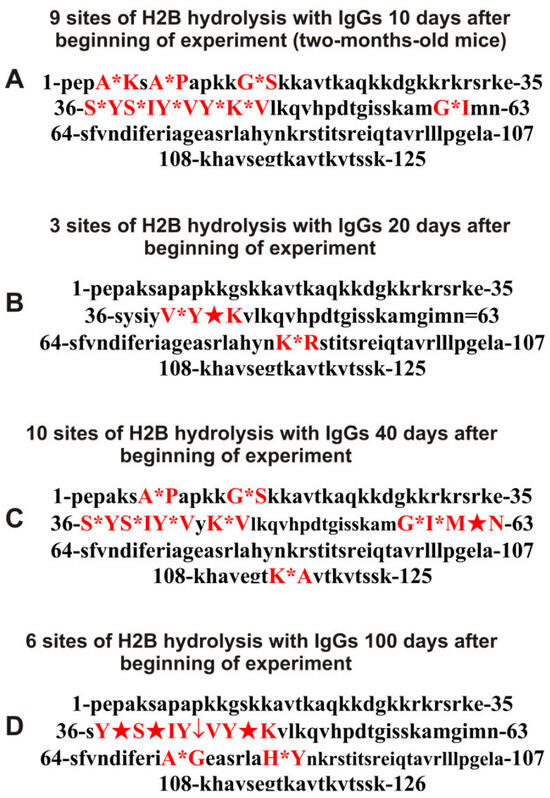
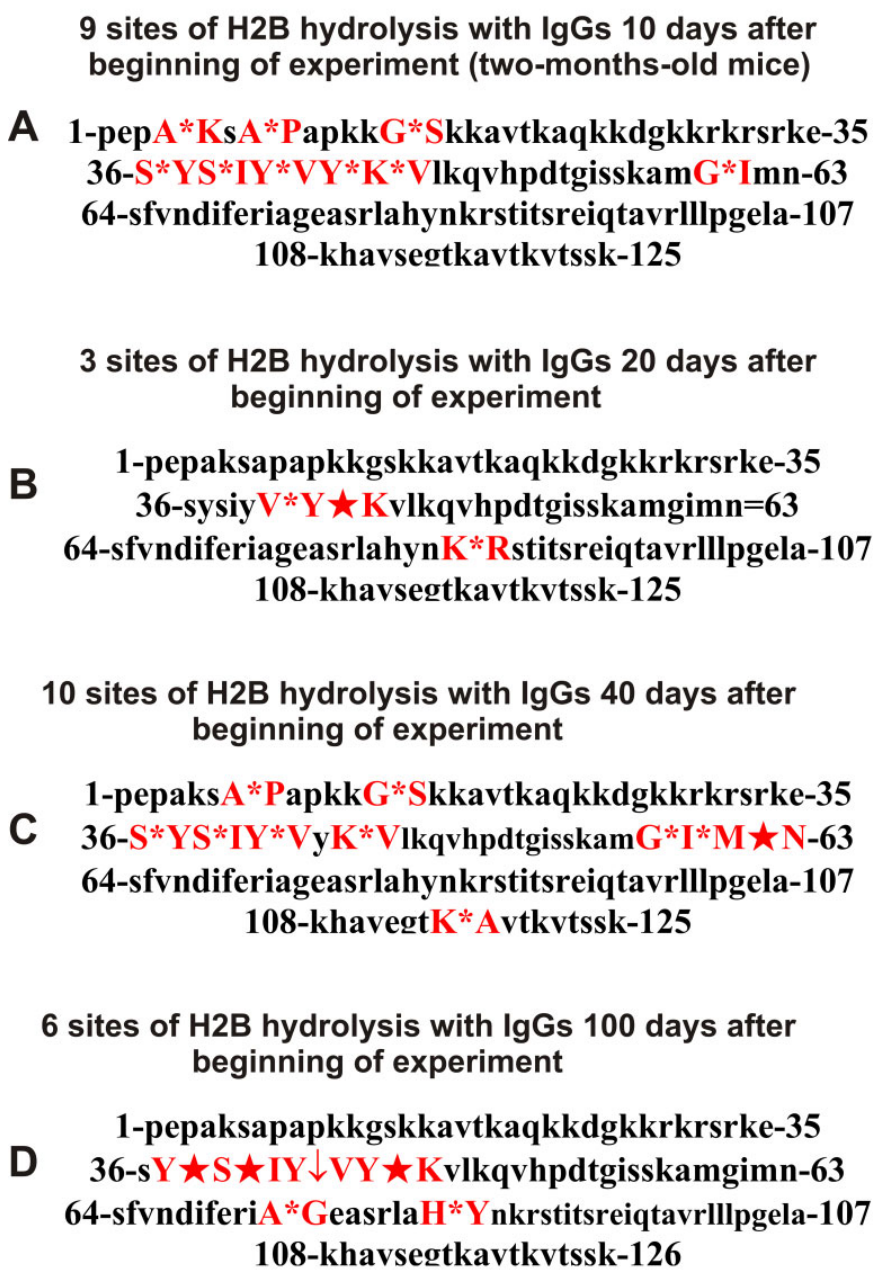
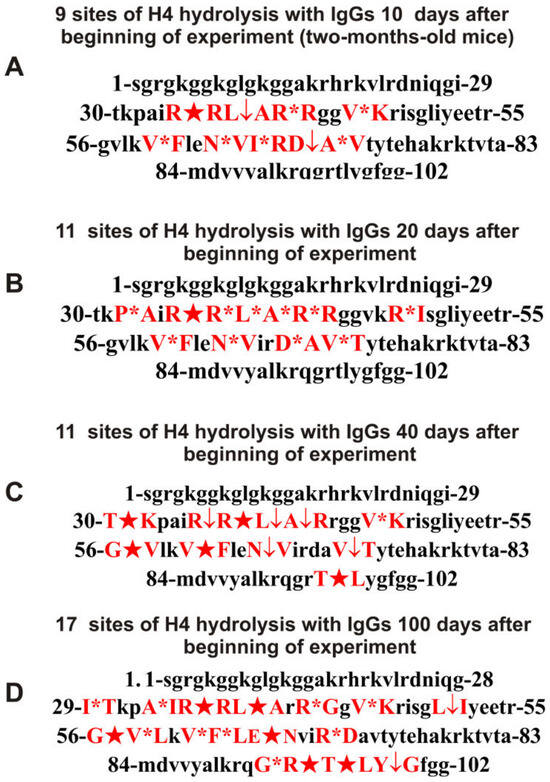
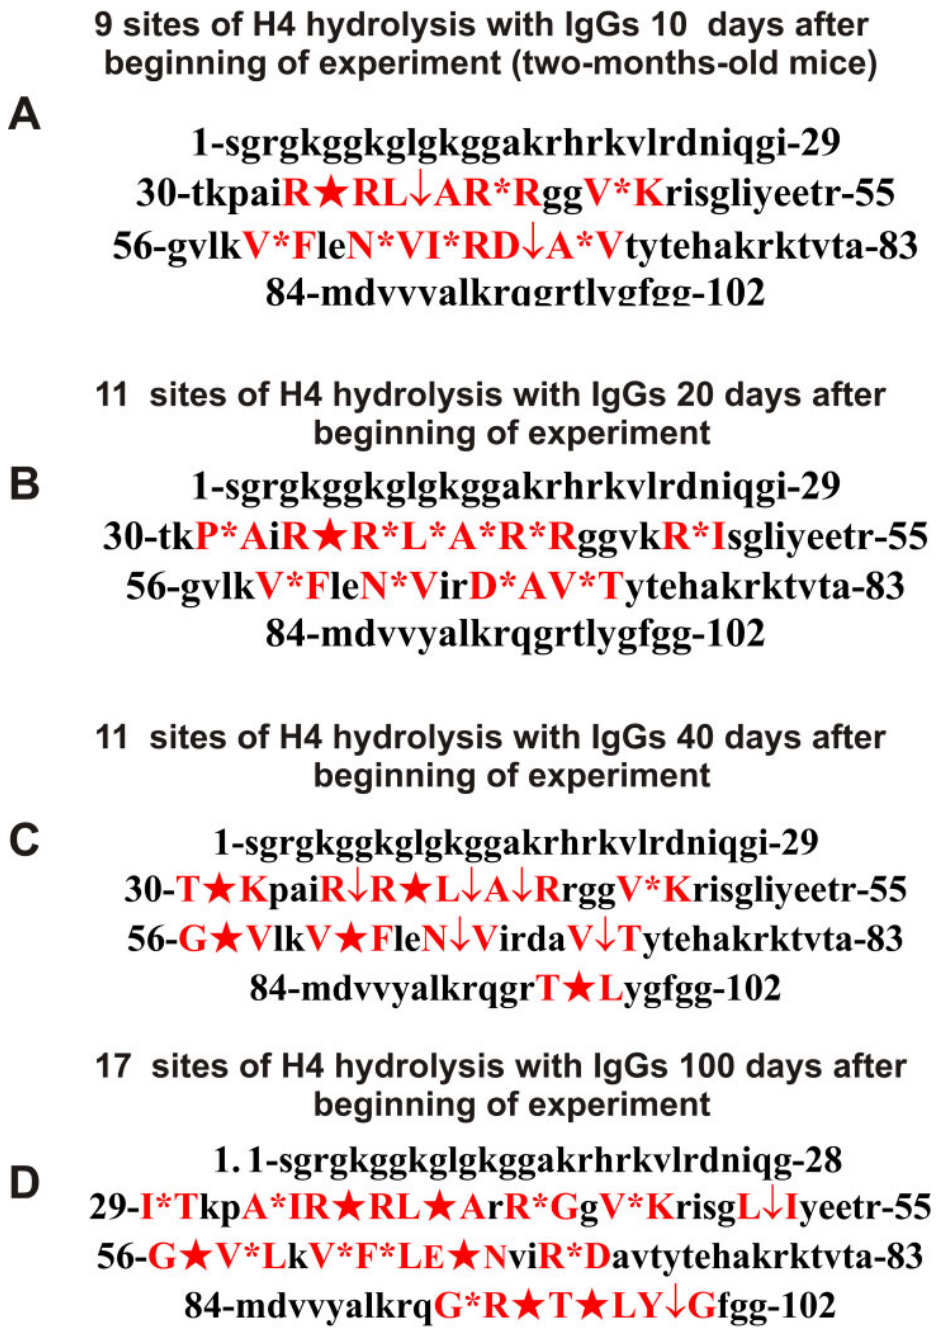
Disclaimer/Publisher’s Note: The statements, opinions and data contained in all publications are solely those of the individual author(s) and contributor(s) and not of MDPI and/or the editor(s). MDPI and/or the editor(s) disclaim responsibility for any injury to people or property resulting from any ideas, methods, instructions or products referred to in the content. |
© 2026 by the authors. Licensee MDPI, Basel, Switzerland. This article is an open access article distributed under the terms and conditions of the Creative Commons Attribution (CC BY) license.