


Abstract
CCND2 has context-dependent roles in cancer, but its prognostic relevance in the major histological subtypes of non-small cell lung cancer remains uncertain. We evaluated CCND2 separately in lung adenocarcinoma (LUAD) and lung squamous cell carcinoma (LUSC) using The Cancer Genome Atlas (TCGA)data from OncoLnc and the Genomic Data Commons, together with three independent Gene Expression Omnibus (GEO) cohorts. Continuous-expression overall survival (OS) models were prespecified as the principal survival analyses. In matched tumor–normal pairs, CCND2 expression was lower in LUAD tumors (p < 0.001), with a nonsignificant difference in LUSC (p = 0.054). In TCGA-LUAD, higher CCND2 expression was associated with a lower mortality hazard after clinical adjustment (HR per SD = 0.839, 95% CI 0.722–0.975, p = 0.022; 0.841 without the pack-years-recorded indicator), with similar estimates in detailed-stage, EGFR-adjusted, and purity-adjusted models. The LUSC association was nonsignificant (HR = 0.888, 95% CI 0.776–1.017, p = 0.085), and a formal histology interaction test was nonsignificant (p = 0.235). Adding CCND2 to clinical models yielded only a small, uncertain gain in the C-index. External associations were heterogeneous and partly probe-dependent, and pooled estimates were nonsignificant in both histologies. Gene correlations were small, and pathway enrichments described bulk-tissue association patterns. CCND2 is an exploratory prognostic candidate in LUAD that requires further validation before clinical application.
1. Introduction
Lung cancer remains the leading cause of cancer-related death worldwide, with approximately 2.5 million new cases and 1.8 million deaths reported annually [1]. Non-small cell lung cancer (NSCLC) accounts for nearly 85% of all lung cancers and consists mainly of two histological subtypes, lung adenocarcinoma (LUAD) and lung squamous cell carcinoma (LUSC) [2]. Although these tumors are grouped under the same disease category, they differ substantially in their molecular alterations, biological behavior, treatment response, and prognosis. LUAD commonly harbors alterations in EGFR, KRAS, ALK, BRAF, and MET, whereas LUSC is characterized by frequent abnormalities involving TP53, CDKN2A, SOX2, PIK3CA, and FGFR1 [3,4,5]. These molecular differences suggest that prognostic biomarkers should be evaluated within each histological subtype rather than across NSCLC as a whole.
CCND2 encodes Cyclin D2, a member of the D-type cyclin family that regulates G1/S cell-cycle progression through activation of CDK4/6 and phosphorylation of the retinoblastoma protein. Although dysregulation of the Cyclin D–CDK4/6–RB pathway is a common feature of human cancers, the biological role of CCND2 appears to be context-dependent. Depending on tumor type, CCND2 has been reported to exhibit either oncogenic or tumor-suppressive characteristics, indicating that its clinical significance cannot be generalized across different malignancies [6,7].
In NSCLC, CCND2 expression has been reported to be reduced through promoter hypermethylation, suggesting that epigenetic silencing may contribute to lung carcinogenesis [8], and reduced CCND2 expression has been associated with poor survival in LUAD [9]. These observations distinguish CCND2 from CCND1, which is more commonly activated by amplification or overexpression in human cancers, and suggest that the expression–survival relationship of CCND2 may differ from the conventional expectation for a cell-cycle-promoting cyclin. CCND2 was therefore selected a priori on the basis of this published evidence rather than by transcriptome-wide screening of the present datasets. However, previous studies have largely evaluated NSCLC as a single disease entity or focused on LUAD, and it remains unclear whether the survival association of CCND2 extends to LUSC, is robust to continuous-expression modeling and clinical adjustment, and is reproduced in independent cohorts.
In the present study, we evaluated CCND2 separately in LUAD and LUSC using The Cancer Genome Atlas (TCGA) data. We compared CCND2 expression between matched tumor and normal tissues, modeled overall survival using continuous CCND2 expression in multivariable Cox models, formally tested whether the survival association differed between histologies, examined gene-expression and pathway associations within each subtype, and evaluated the survival association in three independent Gene Expression Omnibus (GEO) cohorts. This study was designed as an exploratory extension of prior work, assessing the reproducibility and transcriptomic context of CCND2 associations rather than identifying a new biomarker.
2. Materials and Methods
2.1. TCGA Data Collection and Tumor–Normal Expression Analysis
Clinical and overall-survival data were obtained from the UCSC Xena TCGA clinical matrices for the TCGA-LUAD and TCGA-LUSC projects, and CCND2 mRNA expression data for the primary clinicopathological and survival analyses were obtained from OncoLnc (http://www.oncolnc.org/), both accessed on 14 October 2025. OncoLnc provides TCGA RNASeqV2 gene-expression data derived from normalized RNA-Seq by Expectation-Maximization (RSEM) expression files; CCND2 (Entrez Gene ID 894) values and the OncoLnc median groups were downloaded as gene-level files for each project. The OncoLnc-derived primary expression dataset comprised 980 patients with NSCLC, including 492 patients with LUAD and 488 patients with LUSC (Figure 1). Clinical information, including age, sex, the recorded number of pack-years smoked, pathological TNM stage, and EGFR mutation annotation, was linked to the expression records using the 12-character TCGA patient barcode, yielding one record per patient; this ensured that clinical records stored under a sample-level identifier (one LUAD patient) were assigned to the corresponding patient. Source fields, coding rules, and analysis-specific inclusion flags for every patient are provided in the analysis-ready dataset and variable dictionary (Data Availability Statement). No additional expression-based exclusion was applied to define the primary LUAD and LUSC cohorts. For individual analyses, cases with missing outcome or covariate information required for a given analysis were excluded on a complete-case basis; missing observations were not imputed. Analyses were performed separately in LUAD and LUSC.
Figure 1.
Flow diagram of patient selection and analysis-specific cohorts.
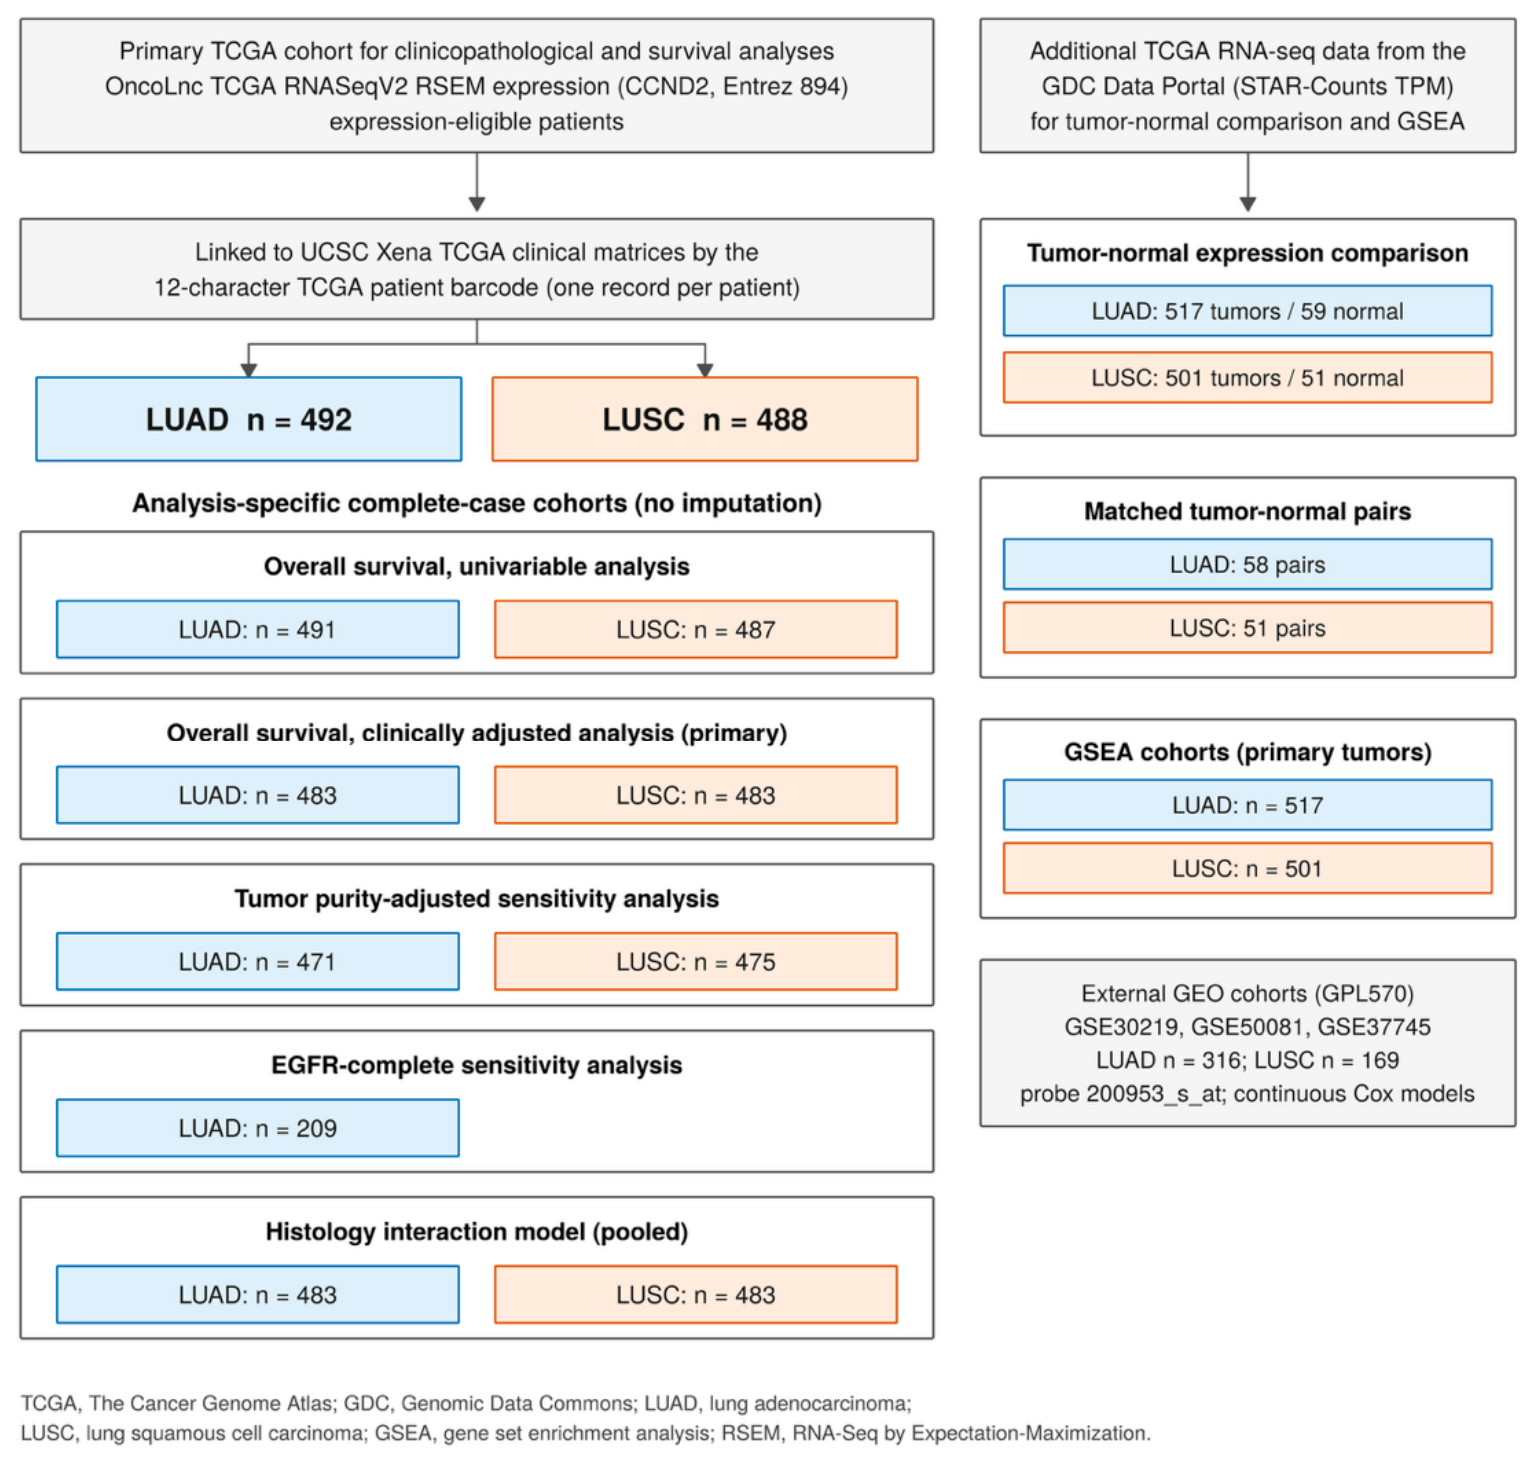
The primary clinicopathological and survival analyses were based on OncoLnc-derived TCGA RNASeqV2 expression data comprising 492 LUAD and 488 LUSC cases. Clinical records were linked using the 12-character TCGA patient barcode. Sample sizes for individual analyses varied according to the availability of survival outcomes and clinical covariates, and complete-case analyses were performed without imputation. Ad-ditional GDC-derived RNA-sequencing datasets were used for tumor–normal expression comparisons and gene set enrichment analysis; of the 59 LUAD normal samples, 58 had a matched primary tumor sample from the same patient. Tumor purity-adjusted and EGFR-complete counts refer to the corresponding complete-case subsets, and the external GEO cohorts are shown for completeness. TCGA, The Cancer Genome Atlas; RSEM, RNA-Seq by Expectation-Maximization; TPM, transcripts per million; LUAD, lung adenocarcinoma; LUSC, lung squamous cell carcinoma; GDC, Genomic Data Commons; GSEA, gene set enrichment analysis; GEO, Gene Expression Omnibus.
OncoLnc provides patient-level expression of individual genes for primary tumors linked to clinical data but does not include solid tissue normal samples or genome-wide expression matrices. Therefore, RNA-sequencing data for primary tumor and solid tissue normal samples were additionally obtained from the TCGA-LUAD and TCGA-LUSC projects through the Genomic Data Commons (GDC) Data Portal (https://portal.gdc.cancer.gov/; STAR-Counts workflow; GDC Data Release 46.0, 10 August 2026; accessed 29 October 2026). CCND2 expression was quantified using transcripts per million (TPM) values and transformed as log2(TPM + 1). To avoid duplicated patient representation, one representative sample per patient and tissue type was retained. When multiple aliquots were available, 01A samples were prioritized for primary tumors and 11A samples for solid tissue normal specimens, and any remaining ties were resolved by selecting the alphabetically first aliquot barcode. GDC file identifiers, md5 checksums, and the selected aliquot barcodes are provided in the reproducibility package. This yielded 517 LUAD primary tumors and 59 LUAD normal samples, and 501 LUSC primary tumors and 51 LUSC normal samples for patient-level expression comparisons.
Because some patients contributed both tumor and normal samples, the full tumor and normal groups were not independent. Within-patient differences in CCND2 expression were therefore evaluated in matched tumor–normal pairs (58 LUAD and 51 LUSC pairs) using the Wilcoxon signed-rank test, together with the Hodges–Lehmann estimate of the paired difference and its 95% confidence interval; this paired analysis served as the primary tumor–normal comparison. Expression distributions of all available tumor and normal samples were summarized descriptively as medians and quartiles, without between-group significance testing, because the two groups were partly paired. All analyses complied with the TCGA publication guidelines (https://portal.gdc.cancer.gov/, accessed on 29 October 2026).
2.2. Clinicopathological Analysis
For exploratory clinicopathological comparisons, high- and low-CCND2-expression groups were defined using the histology-specific median. Age was categorized as ≤65 versus >65 years. A binary pack-years-recorded indicator was derived from the clinical field recording the number of pack-years smoked (number_pack_years_smoked): patients with a recorded pack-year value were coded as pack-years recorded, and those without a recorded value as pack-years not recorded. This indicator documents whether an exposure record was available; it is not a validated measure of smoking history, because an absent pack-year value does not necessarily indicate never smoking. The merged clinical files used in this study did not retain a separate smoking-history field, so smoking history was not reconstructed, and adjustment for this indicator is not interpreted as adjustment for measured tobacco exposure. Tumor stage was classified according to the seventh edition of the American Joint Committee on Cancer (AJCC) staging system, and overall pathological stage and pathological T, N, and M categories were evaluated.
Categorical data are reported as n (%), with percentages calculated among non-missing observations within each CCND2 expression group. Because the completeness of clinical annotation varied across variables, the number of evaluable patients differed among analyses. The number of missing observations is reported separately for the low- and high-CCND2-expression groups in Table 1, and a consolidated summary of missingness is provided in Table S1. Cases with missing or unavailable values were excluded from the corresponding comparison without imputation. Associations between CCND2 expression groups and clinicopathological variables were evaluated using Pearson’s chi-square test. Fisher’s exact test was used when expected cell counts were <5. All clinicopathological analyses were considered exploratory.
Table 1.
Clinicopathological characteristics according to CCND2 expression in TCGA-LUAD and TCGA-LUSC.
2.3. Correlation Analysis
Associations between CCND2 expression and selected subtype-related and cell-cycle-associated genes were evaluated separately in the LUAD and LUSC cohorts using Spearman rank correlation analysis of OncoLnc gene-level expression values. The LUAD analysis included EGFR, KRAS, TP53, ALK, BRAF, CDK1, CDK2, CCNA2, and CCNB1, whereas the LUSC analysis included TP53, CDKN2A, SOX2, PIK3CA, NOTCH1, CDK1, CDK2, CCNA2, and CCNB1. Pairwise complete observations were used for each correlation. To account for multiple comparisons, Benjamini–Hochberg false-discovery-rate (FDR) correction was applied separately within the LUAD and LUSC cohorts. Both nominal p values and FDR-adjusted q values were reported, and q values < 0.05 were considered statistically significant after correction. Both the magnitude of the correlation coefficient and the q value were considered in interpretation, because small coefficients may reach statistical significance in large cohorts. These analyses were based on bulk tumor tissue and were not adjusted for tumor purity.
For the five genes shared by the original histology panels (TP53, CDK1, CDK2, CCNA2 and CCNB1), differences in Spearman correlation coefficients were assessed using 2000 independent within-histology resamples of complete CCND2/partner-gene pairs (seed 4621087). Percentile intervals at 99% applied a Bonferroni interval level for five comparisons. These comparisons are exploratory, unadjusted bulk-tissue associations; pathway enrichments were not formally compared between histologies.
2.4. Kaplan–Meier and Cox Regression Analyses
Overall survival (OS), the primary endpoint, was defined as the interval from initial diagnosis to death from any cause, with surviving patients censored at last follow-up (source fields OS and OS.time). Recurrence-free survival was not analyzed because the available clinical fields could not establish an initially disease-free population or distinguish recurrence from progression of persistent disease or new primary tumors. For graphical comparison, patients were divided into high- and low-CCND2-expression groups using the histology-specific median, and OS distributions were compared using two-sided log-rank tests. These median-based analyses were exploratory, and the median cutoffs were not interpreted as clinical decision thresholds.
Cox proportional-hazards regression was performed separately in the LUAD and LUSC cohorts to evaluate the association between CCND2 expression and OS. For the primary Cox analyses, CCND2 expression was modeled as a continuous variable to preserve quantitative expression information. Because raw CCND2 expression showed a right-skewed distribution, values were log2-transformed after adding 1 and subsequently standardized separately within the LUAD and LUSC cohorts. In all within-histology continuous Cox models, standardization used all expression-eligible patients in each histology (492 LUAD and 488 LUSC; mean/standard deviation (SD) of log2[RSEM + 1] expression, 9.367/1.049 and 10.099/1.704) before complete-case selection, so that one SD has the same meaning in every model. Continuous Cox regression results are presented as hazard ratios (HRs) with 95% confidence intervals (CIs) per one-standard-deviation increase in transformed CCND2 expression. Clinically adjusted models included CCND2 expression, age group (>65 vs. ≤65 years), sex, the pack-years-recorded indicator, and pathological stage (III–IV vs. I–II). Because the pack-years-recorded indicator is not a validated smoking-history variable, the same model without this indicator is reported with equal prominence alongside the primary model. Tied event times were handled with the Breslow method, and full covariate estimates for the two primary histology-specific models are provided in Table S8. Median-dichotomized CCND2 expression (high vs. low) was additionally evaluated as a secondary analysis to facilitate comparison with the Kaplan–Meier analyses. Differences in statistical significance between the separately fitted histology models were not treated as evidence of an interaction between CCND2 expression and histology.
To assess residual confounding from coarse covariate coding, additional sensitivity models included age as a continuous variable (per 10 years) together with either separate overall-stage categories (II, III, and IV vs. I) or T and N categories (T2 and T3–4 vs. T1; N1 and N2–3 vs. N0), sex, and the pack-years-recorded indicator; overall stage and its T/N components were not entered together. Because the pack-years-recorded indicator may misclassify smokers with unrecorded pack-years, the primary adjusted model was also refitted without this indicator. Reference categories, sample sizes, and model diagnostics are provided in Tables S2–S4.
In LUAD, EGFR mutation status was available for 212 of 492 patients (29 EGFR-mutant and 183 EGFR-wild-type). In the EGFR annotation field of the clinical matrix, the source category “none” was coded as wild type and any listed EGFR protein-level variant as mutant, so mutant status included variants of uncertain functional significance in addition to canonical sensitizing mutations, and blank annotation was treated as missing rather than inferred to be wild type. Because comparable patient-level EGFR data were unavailable for LUSC, EGFR mutation status was not included in the primary models, and an EGFR-adjusted sensitivity analysis was performed only in LUAD. To separate the effect of EGFR adjustment from that of restriction to the EGFR-annotated subset, clinical-only and clinical-plus-EGFR models were fitted to the same patients, and included and excluded patients were compared descriptively (Table S3).
To evaluate the potential influence of tumor cellular composition, ABSOLUTE tumor purity estimates from the TCGA Pan-Cancer Atlas (file TCGA_mastercalls.abs_tables_JSedit.fixed.txt) were linked to the LUAD and LUSC cohorts using the 12-character patient barcode; for each patient, the primary-tumor (sample type 01) aliquot with a non-missing purity estimate was used, irrespective of ABSOLUTE call status. Associations between CCND2 expression and tumor purity were assessed using Spearman rank correlation analysis. Sensitivity Cox proportional-hazards models were additionally fitted by including tumor purity together with continuous CCND2 expression, age group, sex, the pack-years-recorded indicator, and pathological stage. To separate the effect of purity adjustment from that of restriction to the purity-complete subset, the clinical-only model was refitted to the same patients.
The proportional-hazards assumption was assessed for all TCGA Cox models using CCND2-specific and global Schoenfeld residual tests with a Kaplan–Meier time transformation, and model convergence was documented (Table S4). To assess whether the association between continuous CCND2 expression and overall survival deviated from linearity, restricted cubic spline analyses with three knots placed at the 10th, 50th, and 90th percentiles of log2(RSEM + 1) CCND2 expression in the complete-case sample were additionally performed separately in the LUAD and LUSC cohorts, with the median expression as the reference value. The spline models were adjusted for age group, sex, the pack-years-recorded indicator, and pathological stage, consistent with the primary multivariable Cox models, and nonlinearity was evaluated using the nonlinear component of the spline function.
To formally test whether the association between CCND2 expression and OS differed between histologies, a pooled Cox model with baseline hazards stratified by histology, common coefficients for age group, sex, the pack-years-recorded indicator, and grouped stage, and a CCND2 × LUSC interaction term was compared with the corresponding model without the interaction term using a one-degree-of-freedom likelihood-ratio test. For this analysis, log2(RSEM + 1) CCND2 expression was standardized on one common scale across all 980 expression-eligible patients; the interaction coefficient therefore represents the LUSC-to-LUAD ratio of HRs per pooled standard deviation rather than a histology-specific HR (Table S7).
Incremental discrimination was assessed by comparing Harrell’s concordance index (C-index; survival package) between clinical-only and clinical-plus-CCND2 models fitted to identical primary complete cases within each histology. Percentile intervals for the apparent C-index difference were obtained from 200 paired participant bootstrap resamples, and optimism-corrected estimates were reported separately (seed 4621086; Table S5). Tied follow-up times were excluded from comparable pairs, and tied risk scores received half credit. These estimates were exploratory and internal; calibration, time-dependent receiver operating characteristic analysis, net reclassification improvement, and external performance validation were not performed.
2.5. Gene Set Enrichment Analysis
Gene Set Enrichment Analysis (GSEA) was performed separately in LUAD and LUSC cohorts to identify biological pathways associated with continuous CCND2 expression. RNA-sequencing data for primary tumor samples were obtained from TCGA Genomic Data Commons using TCGAbiolinks (version 2.40.0) in R version 4.6.1 (GDC Data Release 46.0). Gene-level expression abundance was extracted from the tpm_unstrand assay generated from the STAR-Counts workflow. When multiple primary-tumor RNA-sequencing samples were available for the same participant, one sample per participant was retained, with the 01A sample preferentially selected when available and remaining ties resolved by the alphabetically first aliquot barcode. After participant-level deduplication, 517 LUAD and 501 LUSC tumors were included in the pathway analysis.
Gene annotations provided in the corresponding TCGA SummarizedExperiment objects were used to map expression records to gene symbols. Records with missing gene symbols were excluded, and duplicate gene symbols were collapsed by averaging their expression values. Expression values were transformed as log2(TPM + 1), and genes with zero variance across samples were excluded before gene-level modeling.
CCND2 expression was analyzed as a continuous variable and standardized separately within the LUAD and LUSC cohorts. For each histological subtype, expression of each gene was modeled as a function of standardized CCND2 expression using limma (version 3.68.5). Empirical Bayes moderation was applied, and genes were ranked according to the moderated t-statistic for the CCND2 coefficient. CCND2 itself was excluded from the ranked gene list before enrichment analysis. Positive ranking statistics therefore represented genes positively associated with CCND2 expression, whereas negative statistics represented genes inversely associated with CCND2 expression.
Hallmark gene sets were obtained from the Molecular Signatures Database (MSigDB, version 2026.1.Hs) using msigdbr (version 26.1.1). Preranked GSEA was performed using fgseaMultilevel in fgsea (version 1.38.0). fgseaMultilevel, which uses an adaptive multilevel-splitting Monte Carlo procedure, was run with nPermSimple = 10,000. For gene sets in which this procedure could not estimate a p value because of strongly unbalanced gene-level statistics, it was repeated with nPermSimple = 100,000 (six LUAD sets and one LUSC set); the two LUSC sets that still could not be estimated were analyzed with fgseaSimple using 100,000 gene-set permutations, whose smallest attainable p value is determined by the number of permutations yielding enrichment scores of the same sign (approximately the reciprocal of that number plus one). FDR q values were then recomputed across all tested sets, and the estimation method for each set is reported in Supplementary Data S1. A fixed random seed (4621086) was set before enrichment testing, and gene sets containing fewer than 15 or more than 500 genes were excluded. Positive normalized enrichment scores (NESs) indicated enrichment toward higher CCND2 expression, whereas negative NESs indicated enrichment toward lower CCND2 expression. Multiple testing was controlled using false-discovery-rate adjustment, and Hallmark gene sets with an FDR q-value < 0.05 were considered statistically significant. For visualization, representative pathways with the largest absolute NES values among FDR-significant Hallmark gene sets were displayed. Because the gene-level models included CCND2 expression alone and were based on bulk tumor tissue, the resulting enrichment patterns may partly reflect differences in tissue composition, including tumor purity and immune or stromal content. Complete gene rankings and results for all tested Hallmark gene sets, including set sizes, enrichment scores, NESs, nominal p values, FDR q values, and leading-edge genes, are provided as Supplementary Data S1 and S2.
2.6. External Evaluation in Independent GEO Cohorts
External evaluation was performed using three independent NSCLC cohorts from GEO: GSE30219 [10], GSE50081 [11], and GSE37745 [12]. All three datasets were generated using the Affymetrix Human Genome U133 Plus 2.0 Array (GPL570), and the processed expression values deposited in the GEO series matrix files were used without further normalization (RMA-normalized log2 values, processed with GeneSpring for GSE30219 and with the Bioconductor affy package for GSE50081 and GSE37745, as described in the GEO records). Histologic annotations were used to identify LUAD and LUSC cases. In GSE30219, adenocarcinoma (ADC) and squamous cell carcinoma (SQC) were classified as LUAD and LUSC, respectively. In GSE50081, only tumors explicitly annotated as adenocarcinoma or squamous cell carcinoma were retained, whereas ambiguous or other histologic categories were excluded. In GSE37745, samples annotated as adeno and squamous were classified as LUAD and LUSC, respectively, and large-cell tumors were excluded. Cases with missing or nonpositive overall survival (OS) time were excluded. The resulting survival cohorts included 83 LUAD and 61 LUSC cases in GSE30219, 127 LUAD and 42 LUSC cases in GSE50081, and 106 LUAD and 66 LUSC cases in GSE37745. Sample-level identifiers and inclusion flags are provided in the reproducibility package.
Four GPL570 probe sets were annotated to CCND2 (200951_s_at, 200952_s_at, 200953_s_at, and 231259_s_at). For the principal external analysis, 200953_s_at was selected on annotation grounds because it was directly linked to the CCND2 transcript NM_001759; in all three cohorts, it also had the highest mean expression of the four probe sets, an outcome-independent property (Table S9). Expression of 200953_s_at was standardized within each pooled LUAD/LUSC survival cohort using the cohort mean and standard deviation of the deposited log2 values (Table S9). OS associations were then evaluated separately within LUAD and LUSC using univariable and multivariable Cox proportional-hazards regression with Efron handling of ties, with HRs reported per one-standard-deviation increase in CCND2 expression. GSE30219 and GSE50081 models were adjusted for age (continuous), sex, T category (T1 vs. T2 or higher), and N category (N0 vs. N1 or higher); T and N were dichotomized because T3–T4 and N2–N3 tumors were absent or rare in these cohorts, giving five model parameters. GSE37745 models were adjusted for age, sex, and grouped pathologic stage (I, II, and III–IV). Missing clinical observations were not imputed.
Additional sensitivity analyses assessed the robustness of the external estimates. First, because pooled LUAD/LUSC standardization defines effect units that differ from the within-histology scaling used in TCGA, 200953_s_at expression was restandardized within each histology in each cohort, and the models and pooling were repeated on this scale. Second, the models and pooling were repeated for each of the other three CCND2 probe sets and for an outcome-independent summary defined as the mean of the four standardized probe sets, which was itself restandardized to unit SD on the corresponding scale before modeling; disagreements between probe sets are reported rather than selecting a single probe on the basis of survival results. Third, for the smallest subgroup (GSE50081 LUSC; 42 patients, 16 deaths), category counts, convergence, influence statistics (dfbetas and leave-one-out estimates), reduced models, and a Firth-type penalized partial-likelihood model with profile-likelihood confidence intervals were examined.
Cohort-specific HRs were synthesized separately for LUAD and LUSC using random-effects meta-analysis with restricted maximum likelihood (REML) estimation and Knapp–Hartung inference (metafor package), applied to unrounded cohort-level log-HRs and standard errors. Between-cohort heterogeneity was assessed using the I2 statistic. TCGA cohorts were not included in the external meta-analysis. Proportional-hazards assumptions for the primary histology-specific multivariable Cox models were assessed using Schoenfeld residual tests with a Kaplan–Meier time transformation. As a secondary graphical analysis, Kaplan–Meier curves were generated using cohort- and histology-specific median 200953_s_at expression cutoffs, follow-up was converted to years for all cohorts, numbers at risk were displayed, and survival distributions were compared using two-sided log-rank tests.
2.7. Statistical Software and General Considerations
Statistical analyses were originally performed using IBM SPSS Statistics (version 26.0; IBM Corp., Armonk, NY, USA) and R (versions 4.3.3 and 4.6.1; R Foundation for Statistical Computing, Vienna, Austria). SPSS was used for clinical data processing, descriptive analyses, correlation analyses, and primary survival analyses, and R was used for TCGA RNA-sequencing processing, tumor–normal expression comparisons, restricted cubic spline analyses, GSEA, and external GEO analyses. All reported results were regenerated with the publicly released R code (Data Availability Statement), which reproduced the original SPSS estimates, in two computing environments whose session records are provided with the code: the TCGA clinicopathological, correlation, survival, interaction, discrimination, spline, and tumor-purity analyses and all GEO analyses were run in R version 4.3.3 (survival 3.5-8, rms 6.7-1, and metafor 4.4-0), and the GDC download, tumor–normal comparisons, and GSEA were run in R version 4.6.1 (TCGAbiolinks 2.40.0, limma 3.68.5, fgsea 1.38.0, and msigdbr 26.1.1). Unless otherwise specified, statistical tests were two-sided and p values < 0.05 were considered statistically significant. For analyses involving multiple comparisons, the prespecified FDR-adjusted significance thresholds described above were applied. Missing observations were not imputed. The two histology-specific continuous OS analyses were interpreted as exploratory association analyses; their nominal p values were not adjusted jointly for testing both histologies. Median-based survival comparisons and clinicopathological comparisons were secondary and exploratory. Gene- and pathway-level FDR correction does not address multiplicity across all analyses in the study.
3. Results
3.1. CCND2 Expression in Primary Tumor and Solid Tissue Normal Samples
In matched tumor–normal analyses, CCND2 expression was lower in LUAD tumors than in the corresponding normal tissue (58 pairs; Hodges–Lehmann estimate of the paired difference −1.42, 95% CI −1.65 to −1.16; Wilcoxon signed-rank p < 0.001). The LUSC paired comparison showed the same direction but did not reach statistical significance (51 pairs; Hodges–Lehmann estimate −0.47, 95% CI −0.94 to 0.01; p = 0.054). In the full available sample distributions, which are presented descriptively without significance testing, median log2(TPM + 1) expression was 3.75 (interquartile range [IQR] 3.05–4.27) in 517 LUAD tumors and 5.29 (IQR 4.96–5.63) in 59 LUAD normal samples. Corresponding values were 4.15 (IQR 3.13–5.67) in 501 LUSC tumors and 5.20 (IQR 4.95–5.47) in 51 LUSC normal samples (Figure 2). In patients with both measurements, CCND2 tumor expression from OncoLnc (log2[RSEM + 1]) and from the GDC (log2[TPM + 1]) was highly concordant (Spearman ρ = 0.950 in 492 LUAD and 0.984 in 488 LUSC patients).
Figure 2.
CCND2 expression in primary tumor and solid tissue normal samples in TCGA-LUAD and TCGA-LUSC. Green indicates solid tissue normal samples, and magenta indicates primary tumor samples. (A) TCGA-LUAD and (B) TCGA-LUSC. Left panels show CCND2 expression on the log2(TPM + 1) scale in all selected primary tumors and solid tissue normal samples as violin and box plots; these distributions are descriptive, and no between-group test is shown because the groups are partly paired. Right panels show only the matched tumor–normal pairs (58 LUAD and 51 LUSC patients), connected by lines, with the Wilcoxon signed-rank p value for these pairs. One sample per patient and tissue type was retained, prioritizing 01A primary tumor aliquots and 11A normal aliquots when multiple samples were available. TCGA, The Cancer Genome Atlas; LUAD, lung adenocarcinoma; LUSC, lung squamous cell carcinoma; TPM, transcripts per million.
3.2. Clinicopathological Characteristics Associated with CCND2 Expression
Clinicopathological characteristics according to CCND2 expression are summarized in Table 1. The number of evaluable patients varied across clinical variables because of incomplete clinical annotation, with pathologic M-stage information showing the greatest proportion of missing observations.
In LUAD, CCND2 expression was not significantly associated with age (p = 0.222), sex (p = 0.093), pack-years recording (p = 0.923), overall pathologic stage (p = 0.275), M stage (p = 0.380), or N stage (Fisher’s exact p = 0.544). A significant association was observed with pathologic T stage (p = 0.001), with T1 tumors occurring more frequently in the high-CCND2-expression group than in the low-expression group (41.2% vs. 26.5%).
In LUSC, CCND2 expression was not significantly associated with age (p = 0.084), sex (p = 0.776), pack-years recording (p = 0.259), pathologic stage (Fisher’s exact p = 0.230), M stage (Fisher’s exact p = 0.122), N stage (Fisher’s exact p = 0.836), or T stage (p = 0.502).
3.3. Correlation Analysis of CCND2 Expression
Spearman correlation analysis described the within-histology patterns of CCND2-associated genes within the LUAD and LUSC cohorts (Table 2). In LUAD, CCND2 expression was positively correlated with ALK expression (ρ = 0.217, q < 0.001) and inversely correlated with KRAS (ρ = −0.128, q = 0.006), BRAF (ρ = −0.140, q = 0.003), CDK1 (ρ = −0.272, q < 0.001), CDK2 (ρ = −0.188, q < 0.001), CCNA2 (ρ = −0.243, q < 0.001), and CCNB1 (ρ = −0.269, q < 0.001) after Benjamini–Hochberg FDR correction. No significant FDR-adjusted associations were observed with EGFR or TP53. The largest absolute correlation coefficients were observed for CDK1, CCNB1, and CCNA2, although the magnitudes of these associations remained small (all |ρ| < 0.30). These small correlation magnitudes should not be equated with strong biological coupling; statistical significance may partly reflect the cohort size.
Table 2.
Spearman correlations between CCND2 expression and selected genes in LUAD and LUSC.
In LUSC, CCNB1 was the only gene that remained significantly correlated with CCND2 after FDR correction (ρ = −0.191, q < 0.001). SOX2 showed a nominal positive correlation with CCND2 (ρ = 0.108, p = 0.017), and CDK1 showed a nominal inverse correlation (ρ = −0.099, p = 0.029), but neither association remained significant after multiple-testing correction. No significant FDR-adjusted correlations were identified for TP53, CDKN2A, PIK3CA, NOTCH1, CDK2, or CCNA2. Each LUSC correlation used 487 pairwise complete observations because one partner-gene value was missing in each comparison; the missing value did not involve the same patient for every gene.
In exploratory comparisons of the five shared genes, the LUAD-minus-LUSC Spearman differences were −0.173 for CDK1 (99% bootstrap interval −0.329 to −0.001) and −0.170 for CDK2 (−0.337 to −0.010); the CDK1 interval only narrowly excluded zero. The intervals for TP53, CCNA2 and CCNB1 included zero (Table S6). The retained CDK1 and CDK2 differences describe unadjusted bulk-tissue associations and do not demonstrate direct regulation or a difference in survival effects.
3.4. Kaplan–Meier Survival Analysis of CCND2 Expression
In exploratory median-based analyses, the high-CCND2-expression group showed a more favorable OS distribution in LUAD (log-rank p = 0.041; Figure 3) and LUSC (p = 0.034; Figure 4). The median-based comparisons were exploratory and do not supersede the continuous-expression OS models.
Figure 3.
Kaplan–Meier analysis of overall survival according to CCND2 expression in TCGA-LUAD.
Figure 4.
Kaplan–Meier analysis of overall survival according to CCND2 expression in TCGA-LUSC.
Kaplan–Meier curves show overall survival according to CCND2 expression in TCGA-LUAD (491 patients, 179 deaths). Patients were classified as CCND2-high or CCND2-low using the cohort-specific median expression level. Follow-up is shown in years from initial diagnosis, and survival distributions were compared using a two-sided log-rank test. Tick marks indicate censored observations, and numbers at risk are shown below the panel. The median-based analysis was exploratory.
Kaplan–Meier curves show overall survival according to CCND2 expression in TCGA-LUSC (487 patients, 211 deaths). Patients were classified as CCND2-high or CCND2-low using the cohort-specific median expression level. Follow-up is shown in years from initial diagnosis, and survival distributions were compared using a two-sided log-rank test. Tick marks indicate censored observations, and numbers at risk are shown below the panel. The median-based analysis was exploratory.
3.5. Cox Proportional Hazards Regression Analysis
Cox proportional hazards regression analyses were performed separately in the LUAD and LUSC cohorts to evaluate the association between CCND2 expression and overall survival (Table 3). The continuous-expression analyses were primary; the median-dichotomized models were secondary. In LUAD, median-dichotomized CCND2 expression was significantly associated with overall survival in the univariate model, with the high-expression group showing a lower mortality hazard than the low-expression group (HR = 0.735, 95% CI = 0.546–0.989, p = 0.042; N = 491, 179 events). After adjustment for age group, sex, the pack-years-recorded indicator, and pathological stage, the association was attenuated and was no longer statistically significant (HR = 0.772, 95% CI = 0.571–1.043, p = 0.092; N = 483, 177 events).
Table 3.
Cox proportional hazards regression analyses of overall survival according to CCND2 expression in LUAD and LUSC.
When CCND2 expression was analyzed as a continuous variable, higher expression was significantly associated with a lower mortality hazard in LUAD. The univariate HR per one-standard-deviation increase in CCND2 expression was 0.859 (95% CI = 0.744–0.992, p = 0.038; N = 491, 179 events). This association remained statistically significant after adjustment for age group, sex, the pack-years-recorded indicator, and pathological stage (HR = 0.839, 95% CI = 0.722–0.975, p = 0.022; N = 483, 177 events). The estimate was essentially unchanged when the pack-years-recorded indicator was omitted (HR = 0.841, 95% CI = 0.724–0.977, p = 0.023; N = 483, 177 events), so the association did not depend on this documentation indicator; neither model represents adjustment for measured tobacco exposure. Full covariate estimates are provided in Table S8; pathological stage III–IV was the strongest covariate in both histologies (LUAD HR = 2.450; LUSC HR = 1.571). In an additional sensitivity analysis restricted to patients with available EGFR mutation data, higher continuous CCND2 expression remained associated with a lower mortality hazard after further adjustment for EGFR mutation status (HR = 0.773, 95% CI = 0.606–0.985, p = 0.037; N = 209, 88 events).
In LUSC, high CCND2 expression was significantly associated with a lower mortality hazard in the univariate dichotomized analysis (HR = 0.746, 95% CI = 0.568–0.978, p = 0.034; N = 487, 211 events). The association remained statistically significant after adjustment for age group, sex, the pack-years-recorded indicator, and pathological stage (HR = 0.745, 95% CI = 0.566–0.979, p = 0.035; N = 483, 209 events). However, when CCND2 expression was analyzed continuously, the association did not reach statistical significance in either the univariate model (HR = 0.882, 95% CI = 0.772–1.009, p = 0.068; N = 487, 211 events) or the clinically adjusted model (HR = 0.888, 95% CI = 0.776–1.017, p = 0.085; N = 483, 209 events), although the direction of the association remained consistent with the dichotomized analysis. Omitting the pack-years-recorded indicator gave an identical continuous estimate (HR = 0.888, 95% CI = 0.776–1.017, p = 0.085).
The proportional hazards assumption was not significantly violated in the primary clinically adjusted continuous Cox models. Schoenfeld residual testing showed no evidence of non-proportionality for CCND2 in LUAD (p = 0.568) or LUSC (p = 0.396), and the corresponding global tests were also nonsignificant (p = 0.295 and p = 0.365, respectively). All TCGA Cox models converged within five iterations (Table S4).
With continuous age and separate overall-stage categories, the CCND2 estimate was HR = 0.853, 95% CI 0.733–0.993, p = 0.040; N = 483, 177 deaths in LUAD and HR = 0.885, 95% CI 0.773–1.013, p = 0.077; N = 483, 209 deaths in LUSC. With continuous age and T/N categories, estimates were HR = 0.852, 95% CI 0.731–0.994, p = 0.041; N = 480, 175 deaths and HR = 0.883, 95% CI 0.771–1.012, p = 0.073; N = 481, 208 deaths, respectively (Table S2). These sensitivity analyses preserved the LUAD association while leaving the LUSC estimates nonsignificant. All additional sensitivity models converged, and their Schoenfeld residual tests were nonsignificant (Table S4).
In the same 209 LUAD participants with 88 deaths, the clinical-only estimate was HR = 0.766, 95% CI 0.602–0.975, p = 0.030; after adding EGFR, it was HR = 0.773, 95% CI 0.606–0.985, p = 0.037. Thus, the difference between the primary cohort and the EGFR-complete cohort should not be attributed solely to EGFR adjustment. The 209 included patients were older on average than the 283 excluded expression-eligible patients (66.19 versus 64.70 years), with stage III–IV in 51/209 versus 52/274 with available stage information (Table S3). These descriptive differences do not establish that annotation is missing at random.
The histology-stratified interaction analysis included 966 complete cases and 386 deaths (483 LUAD and 483 LUSC). The ratio of HRs for CCND2 (LUSC vs. LUAD) per pooled SD was 1.154 (95% CI 0.910–1.464); the likelihood-ratio interaction test was nonsignificant (chi-square = 1.413, df = 1, p = 0.235; Table S7). This does not establish effect modification and does not prove equivalence between histologies.
Apparent C-index increased from 0.615 to 0.633 in LUAD (difference 0.019; 95% bootstrap percentile interval −0.003 to 0.049) and from 0.573 to 0.588 in LUSC (difference 0.015; −0.002 to 0.047). Both intervals included zero. Optimism-corrected differences were 0.019 and 0.012, respectively; all 200 bootstrap fits converged in each histology (Table S5). These small internal discrimination changes do not demonstrate clinically useful incremental prediction.
Tumor purity was inversely correlated with CCND2 expression in both LUAD and LUSC, with a larger absolute correlation coefficient in LUAD (LUAD: n = 480, ρ = −0.507, p < 0.001; LUSC: n = 480, ρ = −0.109, p = 0.017). In the purity-complete LUAD subset (N = 471, 168 events), the clinical-only estimate was HR = 0.802 (95% CI = 0.687–0.936, p = 0.005), and adding tumor purity gave HR = 0.831 (95% CI = 0.700–0.986, p = 0.034). In the purity-complete LUSC subset (N = 475, 206 events), the corresponding estimates were HR = 0.886 (95% CI = 0.774–1.014, p = 0.079) and HR = 0.878 (95% CI = 0.765–1.008, p = 0.066). Thus, within the same LUAD patients, purity adjustment moved the CCND2 estimate modestly toward the null, although an association remained in the model containing purity; differences between the primary-cohort estimate and the purity-adjusted estimate should not be attributed solely to purity adjustment. Tumor purity itself was not significantly associated with overall survival in either cohort. No significant violation of the proportional hazards assumption was detected in the purity-adjusted models (global p = 0.385 for LUAD and p = 0.189 for LUSC). The two correlation coefficients were not formally compared, and these survival models do not establish that the gene-expression correlations or GSEA findings are independent of cellular composition.
To further examine the functional form of the association between continuous CCND2 expression and overall survival, restricted cubic spline analyses were performed using the same clinical adjustment variables as the primary Cox models (Figure 5). No significant evidence of nonlinearity was observed in either LUAD (p for nonlinearity = 0.487) or LUSC (p for nonlinearity = 0.157), indicating no statistically significant departure from a linear association within either histological subtype.
Figure 5.
Restricted cubic spline analysis of the association between CCND2 expression and overall survival in LUAD and LUSC. Restricted cubic spline curves illustrate the multivariable-adjusted association between continuous CCND2 expression (log2[RSEM + 1]) and overall survival in (A) lung adenocarcinoma (LUAD) and (B) lung squamous cell carcinoma (LUSC). Models incorporated restricted cubic splines with three knots placed at the 10th, 50th, and 90th percentiles of CCND2 expression (LUAD: 8.11, 9.38, and 10.60; LUSC: 7.89, 10.04, and 12.36), using the median expression as the reference (HR = 1), and were adjusted for age group, sex, the pack-years-recorded indicator, and pathological stage. Solid lines represent estimated hazard ratios (HRs), shaded areas indicate 95% confidence intervals (CIs), and the horizontal dashed line represents HR = 1. Dotted vertical lines mark the knot locations, and the y-axis is on a logarithmic scale.
3.6. Hallmark Gene Sets Associated with Continuous CCND2 Expression
GSEA based on continuous CCND2 expression identified pathway-level associations with CCND2 separately in LUAD and LUSC (Table 4 and Figure 6; complete results for all Hallmark gene sets in Supplementary Data S1). In LUAD, lower CCND2 expression was strongly associated with enrichment of oxidative phosphorylation (NES = −3.921), E2F targets (NES = −3.596), MYC targets V1 (NES = −3.537), MYC targets V2 (NES = −2.825), the G2/M checkpoint (NES = −2.443), and DNA repair (NES = −2.426). In contrast, higher CCND2 expression was associated with immune- and inflammation-related programs, including interferon-γ response (NES = 2.351), allograft rejection (NES = 2.294), interferon-α response (NES = 2.209), IL6–JAK–STAT3 signaling (NES = 2.191), and inflammatory response (NES = 2.159), as well as epithelial–mesenchymal transition (NES = 2.207).
Table 4.
Representative Hallmark gene sets associated with continuous CCND2 expression in LUAD and LUSC.
Figure 6.
Hallmark gene-set enrichment analysis according to continuous CCND2 expression in LUAD and LUSC.
In LUSC, lower CCND2 expression was significantly associated with the reactive oxygen species pathway (NES = −2.729) and fatty acid metabolism (NES = −1.312, q = 0.006). Oxidative phosphorylation (NES = −3.069) and xenobiotic metabolism (NES = −1.586) also had negative enrichment scores but did not reach FDR significance (q = 0.099 and 0.113, respectively); for these two large gene sets, the strongly positively skewed gene-level statistics left very few permutations with negative enrichment scores, which limited the attainable p values (Section 2.5), so their direction is reported descriptively. Higher CCND2 expression was associated with epithelial–mesenchymal transition (NES = 2.204), Hedgehog signaling (NES = 2.131), UV response DN (NES = 2.099), WNT/β-catenin signaling (NES = 1.938), mitotic spindle (NES = 1.848), and apical junction (NES = 1.758).
Within LUAD, lower CCND2 expression was prominently associated with cell-cycle and proliferative programs. Within LUSC, the FDR-significant inverse associations involved the reactive oxygen species pathway and fatty acid metabolism. These within-subtype patterns were not formally compared between histological subtypes. Because these models were based on bulk tumor tissue without adjustment for tumor purity, the enrichment patterns may partly reflect tissue composition and do not indicate direct regulation by CCND2.
Representative significantly enriched Hallmark pathways are shown for LUAD and LUSC. Positive normalized enrichment scores (NESs) indicate enrichment toward higher CCND2 expression, whereas negative NESs indicate enrichment toward lower CCND2 expression. Orange circles indicate pathways enriched toward higher CCND2 expression, and blue triangles indicate pathways enriched toward lower CCND2 expression. Point size represents −log10(FDR q-value). Only pathways with FDR q < 0.05 are shown (up to six per direction with the largest absolute NES); GDC Data Release 46.0.
3.7. Survival Associations of CCND2 in Independent GEO Cohorts
External evaluation was performed in three independent GPL570 cohorts comprising a total of 316 LUAD cases with 171 deaths and 169 LUSC cases with 111 deaths (Table 5 and Figure 7). Using the annotation-prioritized CCND2 probe 200953_s_at, the association between continuous CCND2 expression and overall survival varied across cohorts. Standardization constants and probe-set characteristics are given in Table S9.
Table 5.
External evaluation of the association between CCND2 expression and overall survival in independent GEO cohorts.
Figure 7.
External evaluation of the association between CCND2 expression and overall survival in independent GEO cohorts. (A) Lung adenocarcinoma (LUAD): forest plot of cohort-specific adjusted hazard ratios (HRs) for overall survival per 1-standard-deviation (SD) increase in expression of the annotation-prioritized CCND2 probe 200953_s_at in GSE30219, GSE50081, and GSE37745, with the pooled estimate (316 patients, 171 deaths). (B) Lung squamous cell carcinoma (LUSC): corresponding forest plot for the LUSC subgroups of the same cohorts, with the pooled estimate (169 patients, 111 deaths). Continuous probe expression was standardized within each pooled LUAD/LUSC cohort, and cohort-specific effects were estimated using multivariable Cox proportional-hazards models fitted separately within LUAD and LUSC. GSE30219 and GSE50081 models were adjusted for age, sex, T category (T1 vs. T2 or higher), and N category (N0 vs. N1 or higher), whereas GSE37745 models were adjusted for age, sex, and pathologic stage. In both panels, squares indicate cohort-specific HR estimates (size proportional to the number of deaths), horizontal lines indicate 95% confidence intervals (CIs), and numerical estimates are shown at right. Diamonds indicate pooled estimates from random-effects meta-analysis using restricted maximum likelihood (REML) estimation with Knapp–Hartung inference. The vertical dashed line represents HR = 1, and the x-axis is on a logarithmic scale.
In LUAD, higher CCND2 expression was significantly associated with a lower mortality hazard in GSE37745 in both the unadjusted model (HR per 1-SD increase = 0.608, 95% CI = 0.453–0.816, p < 0.001) and the clinically adjusted model (HR = 0.651, 95% CI = 0.489–0.866, p = 0.003). In contrast, the adjusted associations were not statistically significant in GSE30219 (HR = 0.893, 95% CI = 0.625–1.274, p = 0.531) or GSE50081 (HR = 0.934, 95% CI = 0.686–1.271, p = 0.663).
In LUSC, higher CCND2 expression was significantly associated with a lower mortality hazard in GSE50081. The unadjusted HR per 1-SD increase was 0.523 (95% CI = 0.345–0.794, p = 0.002), and the association remained statistically significant after adjustment for age, sex, T category, and N category (HR = 0.620, 95% CI = 0.399–0.964, p = 0.034). In contrast, the adjusted associations were not statistically significant in GSE30219 (HR = 0.831, 95% CI = 0.636–1.084, p = 0.172) or GSE37745 (HR = 1.006, 95% CI = 0.787–1.285, p = 0.964). The GSE50081 LUSC model included 42 patients, 16 deaths, and five parameters (3.2 events per parameter). It converged, but only 1 of 18 women died, so sex was nearly separated from the outcome, and removing that patient produced a non-finite sex coefficient (Table S11). The CCND2 estimate was nevertheless stable: the Firth-penalized estimate was HR = 0.624 (95% CI = 0.413–0.980, p = 0.041), leave-one-out estimates ranged from 0.484 to 0.665, and reduced models with fewer covariates gave HRs of 0.509–0.512. This subgroup estimate nonetheless remains imprecise and should be interpreted cautiously.
The proportional-hazards assumption was not significantly violated in any of the six primary histology-specific multivariable Cox models, with nonsignificant CCND2-specific (p = 0.255–0.882) and global (p = 0.312–0.926) Schoenfeld residual tests across all cohorts and histological subtypes, and all six models converged.
Random-effects meta-analysis did not demonstrate a statistically significant overall external association in either histological subtype. For LUAD, the pooled clinically adjusted HR was 0.806 (95% CI = 0.487–1.333, p = 0.206), with moderate between-cohort heterogeneity (I2 = 41.3%). For LUSC, the pooled adjusted HR was 0.847 (95% CI = 0.490–1.462, p = 0.320; I2 = 44.5%). Although both pooled point estimates were below 1, their confidence intervals included the null value, indicating that the favorable association observed in individual cohorts was not consistently reproduced across the external datasets.
Sensitivity analyses gave a consistent pooled result but showed probe-dependent cohort-level results (Table S10). With within-histology standardization, the pooled adjusted HR was 0.833 (95% CI = 0.560–1.237, p = 0.185; I2 = 34.6%) in LUAD and 0.821 (95% CI = 0.437–1.540, p = 0.309; I2 = 43.2%) in LUSC. Pooled adjusted estimates were also nonsignificant for each alternative probe set and for the four-probe mean under either scaling (all p > 0.15). However, cohort-level results differed between probe sets. The GSE37745 LUAD association was also observed with 200951_s_at (HR = 0.549, 95% CI = 0.385–0.785, p = 0.001) and the four-probe mean (HR = 0.569, 95% CI = 0.390–0.831, p = 0.004), whereas the GSE50081 LUSC association was specific to 200953_s_at (other probe sets and the four-probe mean: HR 0.708–1.479, all p > 0.23). In GSE50081 LUAD, 200951_s_at showed an association in the opposite direction (HR = 1.316, 95% CI = 1.015–1.707, p = 0.038). 231259_s_at was expressed near background levels and correlated less closely with 200953_s_at (Spearman ρ = 0.05–0.59) than 200951_s_at and 200952_s_at did (ρ = 0.62–0.87; Table S9).
Secondary median-based Kaplan–Meier analyses showed a similarly cohort-dependent pattern (Figure 8). In GSE37745 LUAD, patients with higher CCND2 expression had significantly better overall survival than those with lower expression (log-rank p = 0.004). The corresponding median-based comparisons were not statistically significant in GSE30219 LUAD, GSE50081 LUAD, or any of the three LUSC cohorts. Because these analyses used cohort- and histology-specific median cutoffs, they were interpreted as descriptive visualizations supporting the continuous-expression analyses rather than as clinically established thresholds.
Figure 8.
Kaplan–Meier analysis of overall survival according to CCND2 expression in independent GEO cohorts. Kaplan–Meier curves show overall survival according to expression of the annotation-prioritized CCND2 probe 200953_s_at in three independent Affymetrix GPL570 cohorts. Analyses were performed separately within each histologic subtype: (A) GSE30219 LUAD, (B) GSE30219 LUSC, (C) GSE50081 LUAD, (D) GSE50081 LUSC, (E) GSE37745 LUAD, and (F) GSE37745 LUSC. Within each cohort and histologic subtype, patients were classified as CCND2-high or CCND2-low using the corresponding median probe-expression value as an outcome-independent cutoff. Survival distributions were compared using the log-rank test; tick marks indicate censored observations, and numbers at risk are shown below each panel. Follow-up times were converted to years for all cohorts (from months in GSE30219 and from days in GSE37745). These median-based Kaplan–Meier analyses were performed as secondary graphical analyses; the primary external survival analyses modeled CCND2 expression continuously in multivariable Cox proportional-hazards models.
Overall, the external cohorts provided partial but heterogeneous support for a favorable association between higher CCND2 expression and overall survival. A significant association was observed in GSE37745 LUAD, which was also supported by an alternative probe set and the four-probe mean, and in GSE50081 LUSC, which was specific to 200953_s_at; however, the pooled external estimates were not statistically significant in either histological subtype.
4. Discussion
We evaluated the clinicopathological, prognostic, and transcriptomic associations of CCND2 separately in LUAD and LUSC. In matched tumor–normal pairs, CCND2 expression was significantly lower in LUAD tumors than in normal lung tissue, with a directionally similar but nonsignificant difference in LUSC. In TCGA-LUAD, higher continuous CCND2 expression remained associated with a lower mortality hazard after clinical adjustment, with similar findings in sensitivity analyses. In LUSC, the survival association was significant in median-based analyses but not when CCND2 was modeled continuously, and a formal interaction test did not show a significant difference in the survival association between histologies. Transcriptomic analyses identified different sets of within-subtype associations; exploratory comparisons suggested larger inverse correlations of CCND2 with CDK1 and CDK2 in LUAD, but pathway enrichments were not formally compared between histologies. External findings were heterogeneous and, in some cohorts, probe-dependent, and pooled GEO estimates were not statistically significant in either histological subtype.
The tumor–normal analysis provides additional biological context for the survival findings. In matched pairs, CCND2 expression was significantly lower in LUAD tumors than in the corresponding normal tissue, whereas the LUSC paired comparison showed the same direction without reaching statistical significance; the unpaired distributions were consistent with this pattern but were presented descriptively. Previous studies have linked reduced CCND2 expression in lung cancer to promoter hypermethylation, suggesting that epigenetic silencing may contribute to loss of CCND2 during tumorigenesis [8]. Our findings are directionally consistent with this observation, although promoter methylation was not directly evaluated. Reduced expression in tumors and a favorable association of relatively higher expression among tumors are not necessarily contradictory. One possible explanation is that CCND2 loss occurs during tumorigenesis, whereas relative preservation within established tumors marks a more favorable biological state; however, this interpretation remains hypothesis-generating and does not establish a direct tumor-suppressive effect of CCND2.
The prognostic association was more consistent in LUAD than in LUSC; however, this describes the observed pattern of evidence rather than a tested difference, because the formal histology interaction test was nonsignificant (p = 0.235). In LUAD, higher continuous CCND2 expression remained associated with a lower mortality hazard after adjustment for age, sex, and pathological stage, with or without the pack-years-recorded indicator (HR = 0.839 and 0.841 per SD, respectively). Estimates were similar in sensitivity analyses using continuous age with more detailed stage categories, adding EGFR mutation status within an identical patient subset, and adding ABSOLUTE tumor purity, although in the identical purity-complete subset, purity adjustment moved the estimate modestly toward the null (HR 0.802 to 0.831). Restricted cubic spline analysis showed no significant evidence of departure from linearity, although nonsignificant nonlinearity tests do not prove a linear relationship. These findings extend previous work reporting a favorable prognostic association of CCND2 in LUAD [9] by modeling expression continuously, examining LUSC in parallel, assessing robustness to clinical and tumor-composition adjustment, and examining the association in independent datasets. Nevertheless, the effect size was modest (HR = 0.839 per SD), and the small increase in the C-index (0.019; 95% bootstrap interval −0.003 to 0.049) did not demonstrate incremental prognostic value beyond routine clinical variables.
The molecular findings in LUAD were broadly compatible with the survival results but should be interpreted as associations in unadjusted bulk tissue. After correction for multiple testing, CCND2 expression was inversely correlated with CDK1, CDK2, CCNA2, and CCNB1, although all of these correlations were small (|ρ| < 0.30) and do not imply direct regulation. Lower CCND2 expression was also associated with enrichment of E2F targets, the G2/M checkpoint, MYC target programs, DNA repair, and other proliferative or replication-related pathways. These genes are established regulators of cell-cycle progression and have previously been linked to proliferative behavior and adverse clinical outcomes [13,14,15,16,17,18,19]. T1 tumors were also more frequent in the high-CCND2-expression group. Together, these observations are compatible with the possibility that relatively preserved CCND2 expression identifies a tumor state with less prominent activation of proliferative and mitotic transcriptional programs. However, because CCND2 expression was inversely correlated with tumor purity in LUAD and the gene-level analyses were not adjusted for purity, part of this pattern may reflect differences in the proportion of proliferating malignant cells within the sampled tissue rather than CCND2-associated programs within tumor cells.
CCND2 functions in G1/S progression through the Cyclin D–CDK4/6–RB axis [6]. Dysregulated RB–E2F signaling and excessive cyclin-dependent kinase activity have been linked to replication stress, while ATR-dependent checkpoint signaling coordinates S/G2 progression and FOXM1-related mitotic transcription [20,21,22,23,24,25,26]. In this context, the inverse associations of CCND2 with G2/M-related transcripts and the enrichment of E2F and G2/M programs at lower CCND2 expression could be consistent with a link between reduced CCND2 expression and a more proliferative, replication-stress-related cell-cycle state. However, replication stress, ATR signaling, and FOXM1 activity were not directly measured, and the underlying correlation and enrichment results were derived from bulk tissue without adjustment for tumor purity. This mechanistic interpretation is therefore hypothesis-generating only and requires validation in purity-resolved or cell-type-specific data and functional experiments.
Immune- and inflammation-related pathways enriched toward higher CCND2 expression in LUAD included interferon responses, inflammatory response, allograft rejection, and IL6–JAK–STAT3 signaling; a previous LUAD study also reported associations between CCND2 and immune infiltration [9]. These are broad signatures that span multiple cell types and may largely reflect tissue composition. The inverse correlation with tumor purity was substantial in LUAD (ρ = −0.507), suggesting that immune or stromal cells may contribute to the bulk-tissue CCND2 signal. Although the purity-adjusted OS estimate remained significant, it was modestly attenuated relative to the clinical-only estimate in the same patients, and this does not establish the cellular source of expression or remove composition-related confounding from the separately derived gene-correlation and GSEA results, which were not adjusted for purity. Accordingly, the pathway results describe bulk-tissue association patterns and cannot be directly attributed to CCND2 activity in malignant cells. Deconvolution approaches such as ESTIMATE, CIBERSORT, or xCell, purity-adjusted transcriptomic models, and single-cell or spatial transcriptomic data would help determine which cell populations express CCND2 and whether its prognostic association is tumor-intrinsic.
The results in LUSC were less consistent and should be interpreted conservatively. High CCND2 expression was associated with favorable OS in Kaplan–Meier analysis and remained significant in the clinically adjusted median-dichotomized Cox model. However, the continuous models, which were designated as the primary analyses, were not statistically significant, including the clinically adjusted and tumor-purity-adjusted models. Because median dichotomization discards quantitative information, this discrepancy suggests that the apparent LUSC association is sensitive to expression parameterization, and the LUSC findings should be regarded as inconclusive. They demonstrate neither the absence of an association in LUSC nor a different association from that in LUAD, because the formal interaction test was nonsignificant. After FDR correction, CCNB1 was the only examined gene significantly correlated with CCND2, whereas nominal associations with SOX2 and CDK1 did not remain significant. The present data therefore do not support strong conclusions regarding a specific SOX2-, PIK3CA-, or squamous-lineage-related mechanism.
The pathway analysis also indicated a complex transcriptional context in LUSC. Lower CCND2 expression was significantly associated with the reactive oxygen species pathway and fatty acid metabolism, and oxidative phosphorylation and xenobiotic metabolism showed negative enrichment without reaching FDR significance, whereas higher CCND2 expression was associated with epithelial–mesenchymal transition (EMT), Hedgehog signaling, WNT/β-catenin signaling, mitotic spindle, and apical-junction programs. Because EMT has generally been associated with invasion, metastatic behavior, and adverse clinical characteristics in NSCLC [27], the CCND2-high LUSC profile cannot be interpreted as uniformly favorable. Several of these Hallmark gene sets are broad signatures spanning multiple cell types and biological processes, and they were derived from bulk-tissue models without purity adjustment. These mixed pathway associations, together with the weaker continuous survival signal, suggest that CCND2 may reflect a complex transcriptional state rather than a single tumor-suppressive or lineage-stabilizing program. As with the correlation analyses, GSEA cannot determine whether CCND2 directly regulates these pathways, and the LUSC pathway patterns were not formally compared with those in LUAD.
The external analyses further support cautious interpretation. In LUAD, the favorable continuous association observed in TCGA was reproduced in GSE37745 but not in GSE30219 or GSE50081. In LUSC, a significant association was observed in GSE50081, but this subgroup included only 42 patients and 16 deaths; the association was specific to one of four probe sets, and it was not observed in GSE30219 or GSE37745. Random-effects meta-analysis did not show a statistically significant pooled association in either histological subtype, irrespective of probe set or scaling, and moderate between-cohort heterogeneity was present; in GSE50081 LUAD, one alternative probe set showed an association in the opposite direction. Differences in patient composition, stage distribution, available covariates, probe behavior, and the use of microarray rather than RNA-sequencing platforms may have contributed to this variability. In addition, GEO expression was standardized across both histologies within each cohort for the primary analysis; restandardizing within histology did not change the pooled conclusions, but per-SD effect sizes from microarray probes are not directly comparable in magnitude with the TCGA RNA-sequencing estimates. Therefore, the external findings provide cohort-specific support but do not constitute external validation of CCND2 as a prognostic biomarker. The median-based external Kaplan–Meier analyses should likewise be interpreted descriptively because cohort-specific median cutoffs are not transferable clinical thresholds.
Several limitations should be acknowledged. First, this was a retrospective analysis of publicly available datasets, so selection bias, incomplete clinical annotation, and residual confounding cannot be excluded. Treatment information suitable for inclusion in the survival models was unavailable. Smoking history could not be adjusted for: the available pack-years-recorded indicator documents record availability rather than tobacco exposure, although omitting it did not materially change the CCND2 estimates. EGFR mutation status was missing for 280 of 492 LUAD patients; the same-subset analysis separated the effect of adjustment from that of restriction but cannot exclude selection bias. Second, recurrence could not be analyzed because the available clinical fields did not establish an initially disease-free population or distinguish recurrence from progression of persistent disease or new primary tumors; only overall survival was therefore evaluated. Third, the principal analyses were based on bulk-tissue mRNA expression. The survival and correlation analyses used OncoLnc RSEM values, whereas the tumor–normal and pathway analyses used GDC TPM values, although the two quantifications were highly concordant in shared patients (Spearman ρ = 0.950 in LUAD and 0.984 in LUSC). Tumor-purity adjustment was applied only to the survival models; the correlation and pathway analyses were not adjusted for purity, and immune or stromal deconvolution was not performed, so tumor-intrinsic and microenvironmental contributions could not be distinguished. Fourth, protein expression, promoter methylation, copy-number alterations, and other D-type cyclins were not examined, so the specificity of these findings for CCND2 relative to related cell-cycle regulators cannot be established. Fifth, the primary external evaluation used a single annotation-prioritized microarray probe; alternative probe sets gave discordant cohort-level results in GSE50081, the histological subgroups were small, and the pooled estimates were nonsignificant with moderate heterogeneity regardless of probe set or scaling. Finally, nominal p values for the two histology-specific primary analyses were not adjusted for multiplicity, incremental prognostic value was assessed only by internal C-index comparison, and calibration, time-dependent discrimination, reclassification, and clinical utility were not evaluated.
5. Conclusions
This study characterized the prognostic and transcriptomic associations of CCND2 separately in LUAD and LUSC. In matched tumor–normal pairs, CCND2 expression was lower in LUAD tumors than in normal lung tissue. In TCGA-LUAD, higher continuous CCND2 expression was associated with a lower mortality hazard after clinical adjustment, and this association persisted with or without the pack-years-recorded indicator and in sensitivity analyses with more detailed clinical adjustment, EGFR mutation status, and tumor purity. In LUSC, the continuous association was not statistically significant, and the formal test for a difference between histologies was nonsignificant. External results were heterogeneous and partly probe-dependent; pooled external estimates were nonsignificant, and CCND2 did not demonstrably improve discrimination beyond clinical variables. Transcriptomic analyses identified CCND2-associated proliferative and immune-related patterns in bulk tumor tissue that do not establish direct regulation or a tumor-cell origin. CCND2 should therefore be regarded as an exploratory prognostic candidate in LUAD that requires validation in independent cohorts and cell-type-resolved functional studies before clinical application.
Supplementary Materials
The following supporting information can be downloaded at https://www.mdpi.com/article/10.3390/cimb48111230/s1.
Author Contributions
Conceptualization, U.J., Y.-R.H. and J.-H.L.; methodology, U.J., J.-H.A., N.-H.P. and J.-W.M.; software, J.-C.L., Y.-R.H. and J.-H.L.; validation, U.J., J.-H.A. and N.-H.P.; formal analysis, U.J., J.-H.A., N.-H.P., J.-W.M. and J.-C.L.; investigation, U.J., J.-H.A., N.-H.P. and J.-W.M.; resources, Y.-R.H. and J.-H.L.; data curation, U.J., J.-H.A. and J.-C.L.; writing—original draft preparation, U.J.; writing—review and editing, J.-H.A., N.-H.P., J.-W.M., J.-C.L., Y.-R.H. and J.-H.L.; visualization, U.J.; supervision, Y.-R.H. and J.-H.L.; project administration, Y.-R.H. and J.-H.L. U.J. confirms the authenticity of all the raw data. All authors have read and agreed to the published version of the manuscript.
Funding
This research received no external funding.
Institutional Review Board Statement
The study was conducted in accordance with the Declaration of Helsinki, using publicly available and de-identified datasets obtained from TCGA and other open-access databases. In accordance with Article 13 of the Enforcement Rule of the Bio-ethics and Safety Act of the Republic of Korea, Institutional Review Board approval was waived because the study used publicly available in-formation and did not involve identifiable human subjects.
Informed Consent Statement
Patient consent was waived as the study used only publicly available and de-identified datasets.
Data Availability Statement
This study analyzed publicly available data. TCGA-LUAD and TCGA-LUSC data were obtained from OncoLnc (http://www.oncolnc.org/, accessed on 14 October 2025), the UCSC Xena TCGA clinical matrices (https://xenabrowser.net/, accessed on 14 October 2025), the GDC Data Portal (https://portal.gdc.cancer.gov/, accessed on 29 October 2026), and the TCGA PanCanAtlas ABSOLUTE purity calls (https://gdc.cancer.gov/about-data/publications/pancanatlas, accessed on 29 October 2026), and external cohorts from the Gene Expression Omnibus (GSE30219, GSE50081, and GSE37745). The analysis-ready patient-level linkage with inclusion flags, the variable dictionary, input-file manifests with download instructions and checksums, the R code that regenerates all reported TCGA and GEO tables and figures, the complete GSEA gene rankings and Hallmark results, and software-session records are available at https://github.com/010w78-ai/CCND2_repro (accessed on 10 November 2026) and archived at Zenodo (https://doi.org/10.5281/zenodo.23740304).
Conflicts of Interest
The authors declare that they have no competing interests.
References
- Bray, F.; Laversanne, M.; Sung, H.; Ferlay, J.; Siegel, R.L.; Soerjomataram, I. Global cancer statistics 2022: GLOBOCAN estimates of incidence and mortality worldwide for 36 cancers in 185 countries. CA Cancer J. Clin. 2024, 74, 229–263. [Google Scholar] [CrossRef] [Scilit] [PubMed]
- Herbst, R.S.; Morgensztern, D.; Boshoff, C. The biology and management of non-small cell lung cancer. Nature 2018, 553, 446–454. [Google Scholar] [CrossRef] [Scilit] [PubMed]
- Cancer Genome Atlas Research Network. Comprehensive molecular profiling of lung adenocarcinoma. Nature 2014, 511, 543–550, Correction in Nature 2014, 514, 262. Correction in Nature 2018, 559, E12. [Google Scholar] [CrossRef] [Scilit] [PubMed]
- Cancer Genome Atlas Research Network. Comprehensive genomic characterization of squamous cell lung cancers. Nature 2012, 489, 519–525, Correction in Nature 2012, 491, 288. [Google Scholar] [CrossRef] [Scilit] [PubMed]
- Pao, W.; Girard, N. New driver mutations in non-small-cell lung cancer. Lancet Oncol. 2011, 12, 175–180. [Google Scholar] [CrossRef] [Scilit] [PubMed]
- Musgrove, E.A.; Caldon, C.E.; Barraclough, J.; Stone, A.; Sutherland, R.L. Cyclin D as a therapeutic target in cancer. Nat. Rev. Cancer 2011, 11, 558–572. [Google Scholar] [CrossRef] [Scilit] [PubMed]
- Ding, Z.Y.; Li, R.; Zhang, Q.J.; Wang, Y.; Jiang, Y.; Meng, Q.Y.; Xi, Q.L.; Wu, G.H. Prognostic role of cyclin D2/D3 in multiple human malignant neoplasms: A systematic review and meta-analysis. Cancer Med. 2019, 8, 2717–2729. [Google Scholar] [CrossRef] [Scilit] [PubMed]
- Hung, C.S.; Wang, S.C.; Yen, Y.T.; Lee, T.H.; Wen, W.C.; Lin, R.K. Hypermethylation of CCND2 in lung and breast cancer is a potential biomarker and drug target. Int. J. Mol. Sci. 2018, 19, 3096. [Google Scholar] [CrossRef] [Scilit] [PubMed]
- Jia, E.; Shi, X.; Xue, J. CCND2 is a prognostic biomarker and correlates with immune infiltration in lung adenocarcinoma. Transl. Cancer Res. 2024, 13, 1241–1251. [Google Scholar] [CrossRef] [Scilit] [PubMed]
- Rousseaux, S.; Debernardi, A.; Jacquiau, B.; Vitte, A.-L.; Vesin, A.; Nagy-Mignotte, H.; Moro-Sibilot, D.; Brichon, P.-Y.; Lantuejoul, S.; Hainaut, P.; et al. Ectopic activation of germline and placental genes identifies aggressive metastasis-prone lung cancers. Sci. Transl. Med. 2013, 5, 186ra66. [Google Scholar] [CrossRef] [Scilit] [PubMed]
- Der, S.D.; Sykes, J.; Pintilie, M.; Zhu, C.Q.; Strumpf, D.; Liu, N.; Jurisica, I.; Shepherd, F.A.; Tsao, M.S. Validation of a histology-independent prognostic gene signature for early-stage, non-small-cell lung cancer including stage IA patients. J. Thorac. Oncol. 2014, 9, 59–64. [Google Scholar] [CrossRef] [Scilit] [PubMed]
- Botling, J.; Edlund, K.; Lohr, M.; Hellwig, B.; Holmberg, L.; Lambe, M.; Berglund, A.; Ekman, S.; Bergqvist, M.; Pontén, F.; et al. Biomarker discovery in non-small cell lung cancer: Integrating gene expression profiling, meta-analysis, and tissue microarray validation. Clin. Cancer Res. 2013, 19, 194–204. [Google Scholar] [CrossRef] [Scilit] [PubMed]
- Wang, J.; Zhang, Y.; Xu, S.; Li, W.; Chen, Z.; Wang, Z.; Han, X.; Zhao, Y.; Li, S. Prognostic significance of G2/M arrest signaling pathway proteins in advanced non-small cell lung cancer patients. Oncol. Lett. 2015, 9, 1266–1272. [Google Scholar] [CrossRef] [Scilit] [PubMed]
- Shi, Y.X.; Zhu, T.; Zou, T.; Zhuo, W.; Chen, Y.X.; Huang, M.S.; Zheng, W.; Wang, C.J.; Li, X.; Mao, X.Y.; et al. Prognostic and predictive values of CDK1 and MAD2L1 in lung adenocarcinoma. Oncotarget 2016, 7, 85235–85243. [Google Scholar] [CrossRef] [Scilit] [PubMed]
- Li, M.; He, F.; Zhang, Z.; Xiang, Z.; Hu, D. CDK1 serves as a potential prognostic biomarker and target for lung cancer. J. Int. Med. Res. 2020, 48, 0300060519897508. [Google Scholar] [CrossRef] [Scilit] [PubMed]
- Huang, Y.; Zhong, L.; Nie, K.; Li, L.; Song, S.; Liu, F.; Li, P.; Cao, D.; Liu, Y. Identification of LINC00665-miR-let-7b-CCNA2 competing endogenous RNA network associated with prognosis of lung adenocarcinoma. Sci. Rep. 2021, 11, 4434. [Google Scholar] [CrossRef] [Scilit] [PubMed]
- Ye, C.; Wang, J.; Wu, P.; Li, X.; Chai, Y. Prognostic role of cyclin B1 in solid tumors: A meta-analysis. Oncotarget 2017, 8, 2224–2232. [Google Scholar] [CrossRef] [Scilit] [PubMed]
- Müller-Tidow, C.; Metzger, R.; Kügler, K.; Diederichs, S.; Idos, G.; Thomas, M.; Dockhorn-Dworniczak, B.; Schneider, P.M.; Koeffler, H.P.; Berdel, W.E.; et al. Cyclin E is the only cyclin-dependent kinase 2-associated cyclin that predicts metastasis and survival in early stage non-small cell lung cancer. Cancer Res. 2001, 61, 647–653. [Google Scholar] [PubMed]
- Soria, J.C.; Jang, S.J.; Khuri, F.R.; Hassan, K.; Liu, D.; Hong, W.K.; Mao, L. Overexpression of cyclin B1 in early-stage non-small cell lung cancer and its clinical implication. Cancer Res. 2000, 60, 4000–4004. [Google Scholar] [PubMed]
- Bester, A.C.; Roniger, M.; Oren, Y.S.; Im, M.M.; Sarni, D.; Chaoat, M.; Bensimon, A.; Zamir, G.; Shewach, D.S.; Kerem, B. Nucleotide deficiency promotes genomic instability in early stages of cancer development. Cell 2011, 145, 435–446. [Google Scholar] [CrossRef] [Scilit] [PubMed]
- Macheret, M.; Halazonetis, T.D. DNA replication stress as a hallmark of cancer. Annu. Rev. Pathol. 2015, 10, 425–448. [Google Scholar] [CrossRef] [Scilit] [PubMed]
- Cimprich, K.A.; Cortez, D. ATR: An essential regulator of genome integrity. Nat. Rev. Mol. Cell Biol. 2008, 9, 616–627. [Google Scholar] [CrossRef] [Scilit] [PubMed]
- Saldivar, J.C.; Hamperl, S.; Bocek, M.J.; Chung, M.; Bass, T.E.; Cisneros-Soberanis, F.; Samejima, K.; Xie, L.; Paulson, J.R.; Earnshaw, W.C.; et al. An intrinsic S/G2 checkpoint enforced by ATR. Science 2018, 361, 806–810. [Google Scholar] [CrossRef] [Scilit] [PubMed]
- Laoukili, J.; Kooistra, M.R.; Brás, A.; Kauw, J.; Kerkhoven, R.M.; Morrison, A.; Clevers, H.; Medema, R.H. FoxM1 is required for execution of the mitotic programme and chromosome stability. Nat. Cell Biol. 2005, 7, 126–136. [Google Scholar] [CrossRef] [Scilit] [PubMed]
- Alvarez-Fernández, M.; Halim, V.A.; Krenning, L.; Aprelia, M.; Mohammed, S.; Heck, A.J.; Medema, R.H. Recovery from a DNA-damage-induced G2 arrest requires Cdk-dependent activation of FoxM1. EMBO Rep. 2010, 11, 452–458. [Google Scholar] [CrossRef] [Scilit] [PubMed]
- Polito, M.P.; Romaldini, A.; Tagliazucchi, L.; Marini, G.; Radice, F.; Gozza, G.A.; Bergamini, G.; Costi, M.P.; Enzo, E. Biochemical characterization of the feedforward loop between CDK1 and FOXM1 in epidermal stem cells. Biol. Direct 2024, 19, 91. [Google Scholar] [CrossRef] [Scilit] [PubMed]
- Soltermann, A.; Tischler, V.; Arbogast, S.; Braun, J.; Probst-Hensch, N.; Weder, W.; Moch, H.; Kristiansen, G. Prognostic significance of epithelial-mesenchymal and mesenchymal-epithelial transition protein expression in non-small cell lung cancer. Clin. Cancer Res. 2008, 14, 7430–7437. [Google Scholar] [CrossRef] [Scilit] [PubMed]
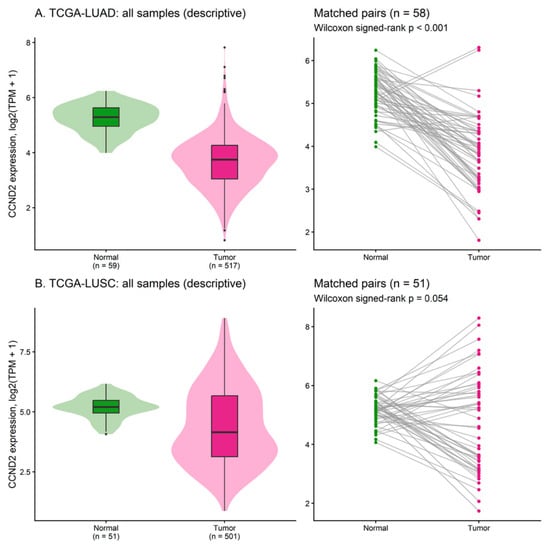
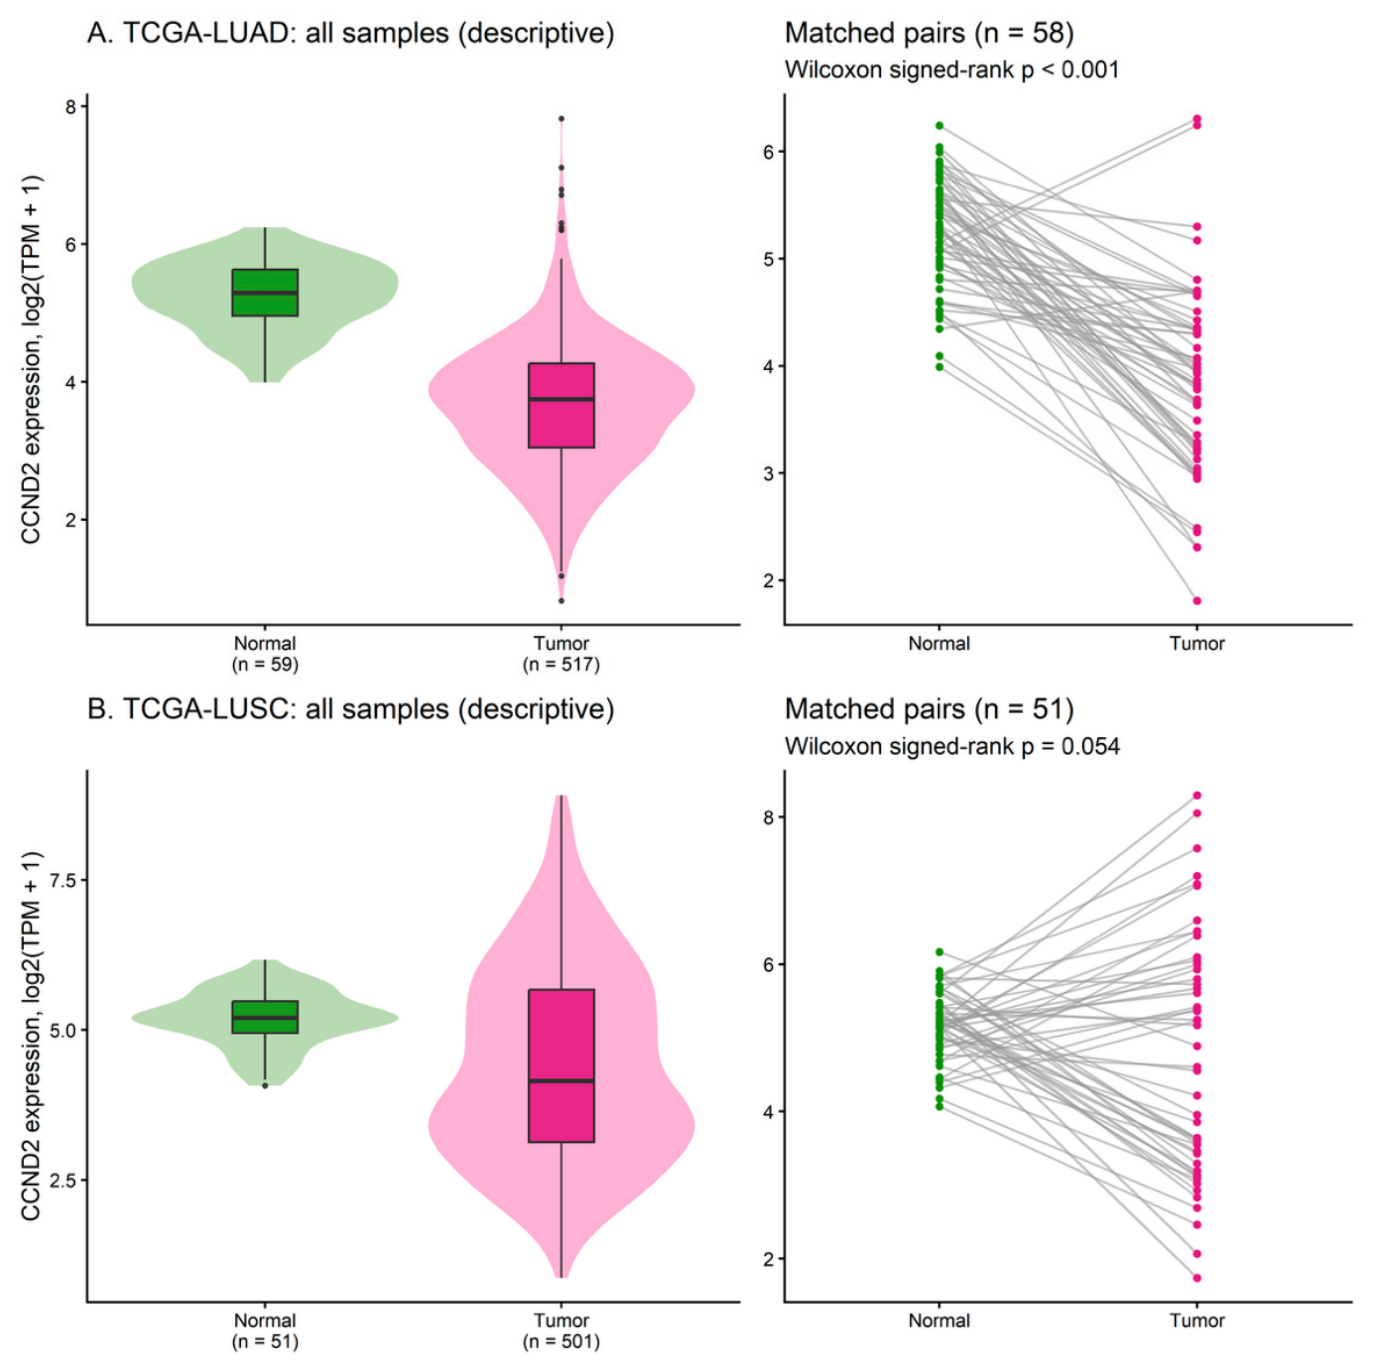
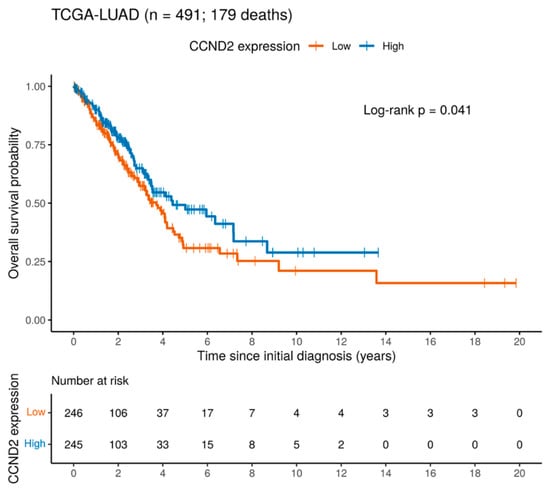
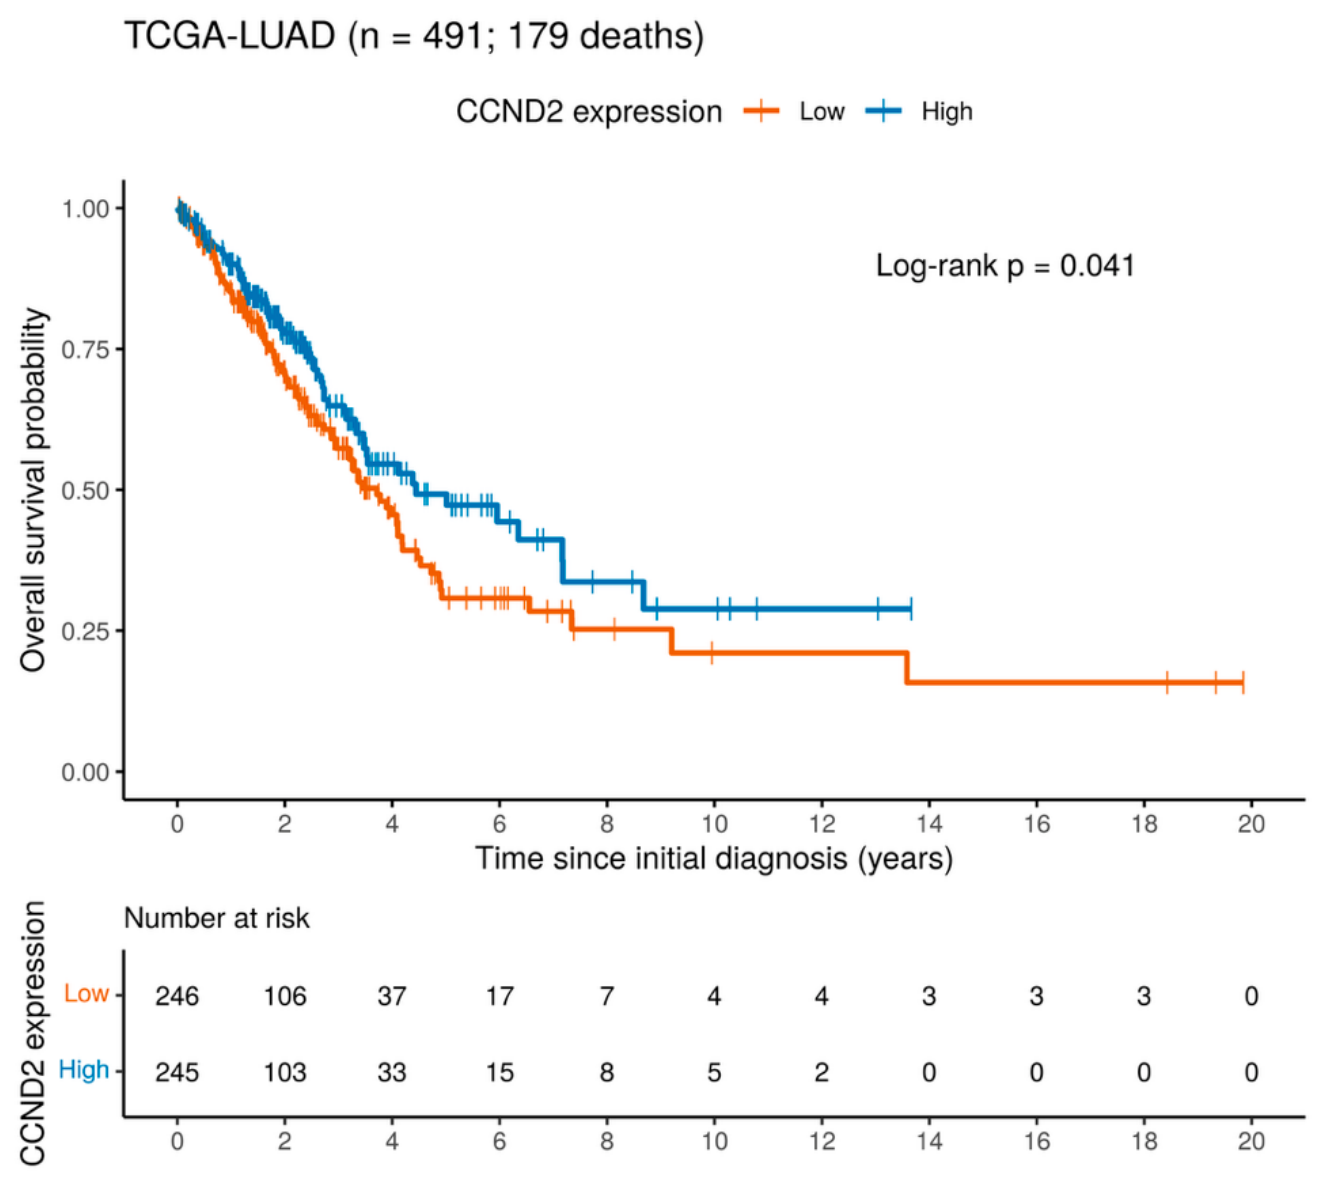
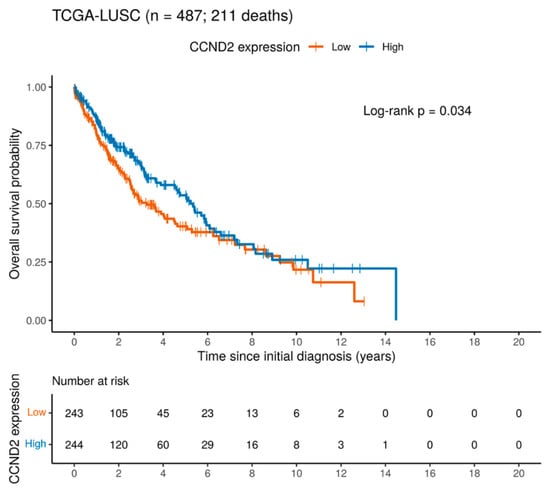
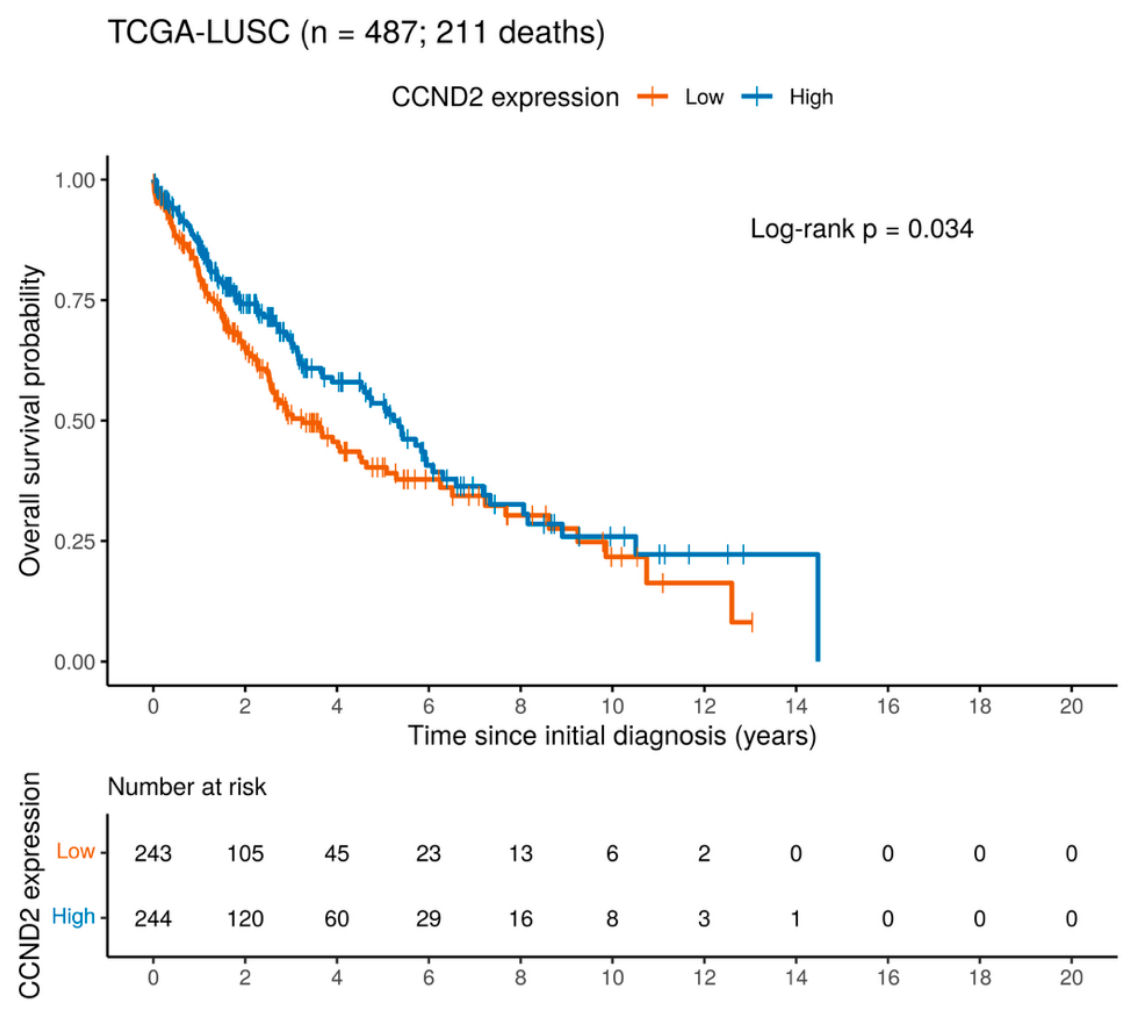
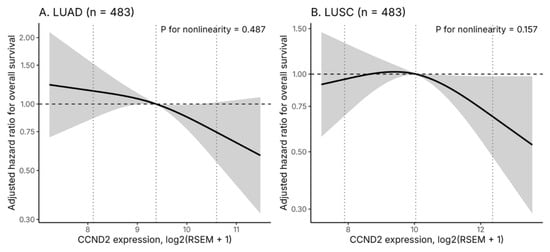
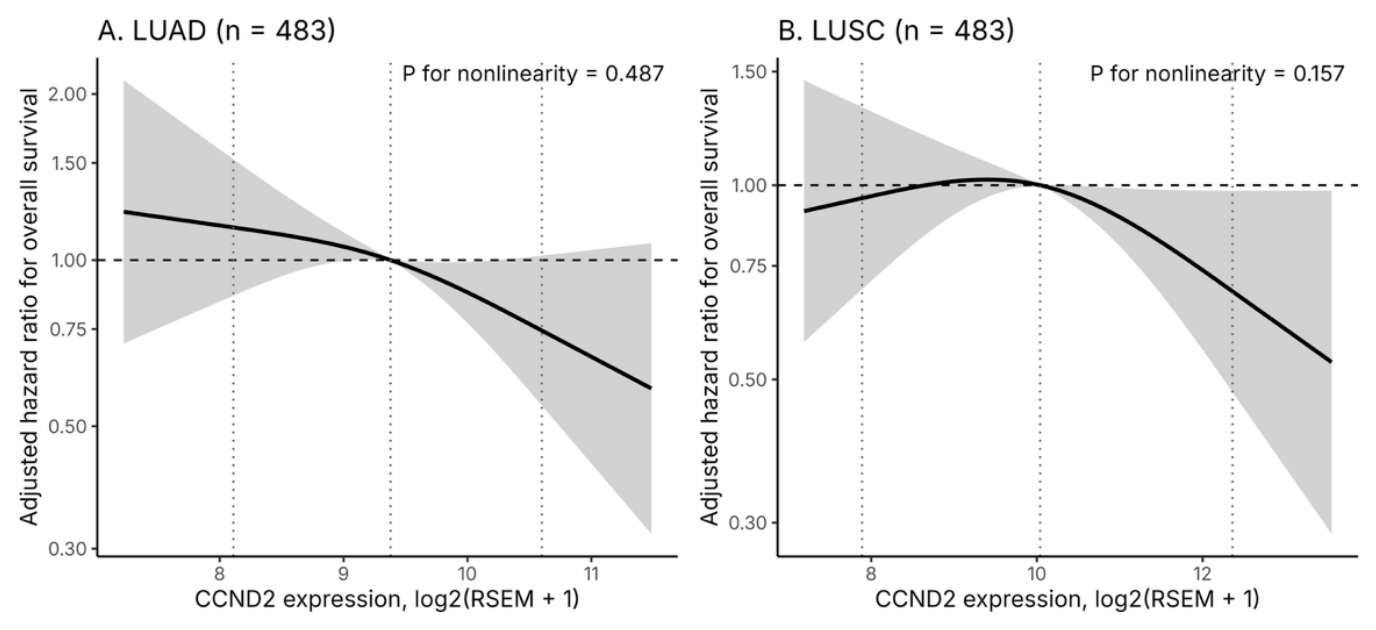
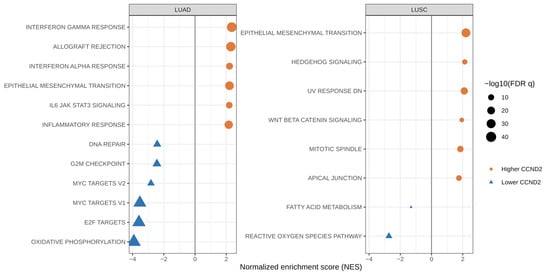
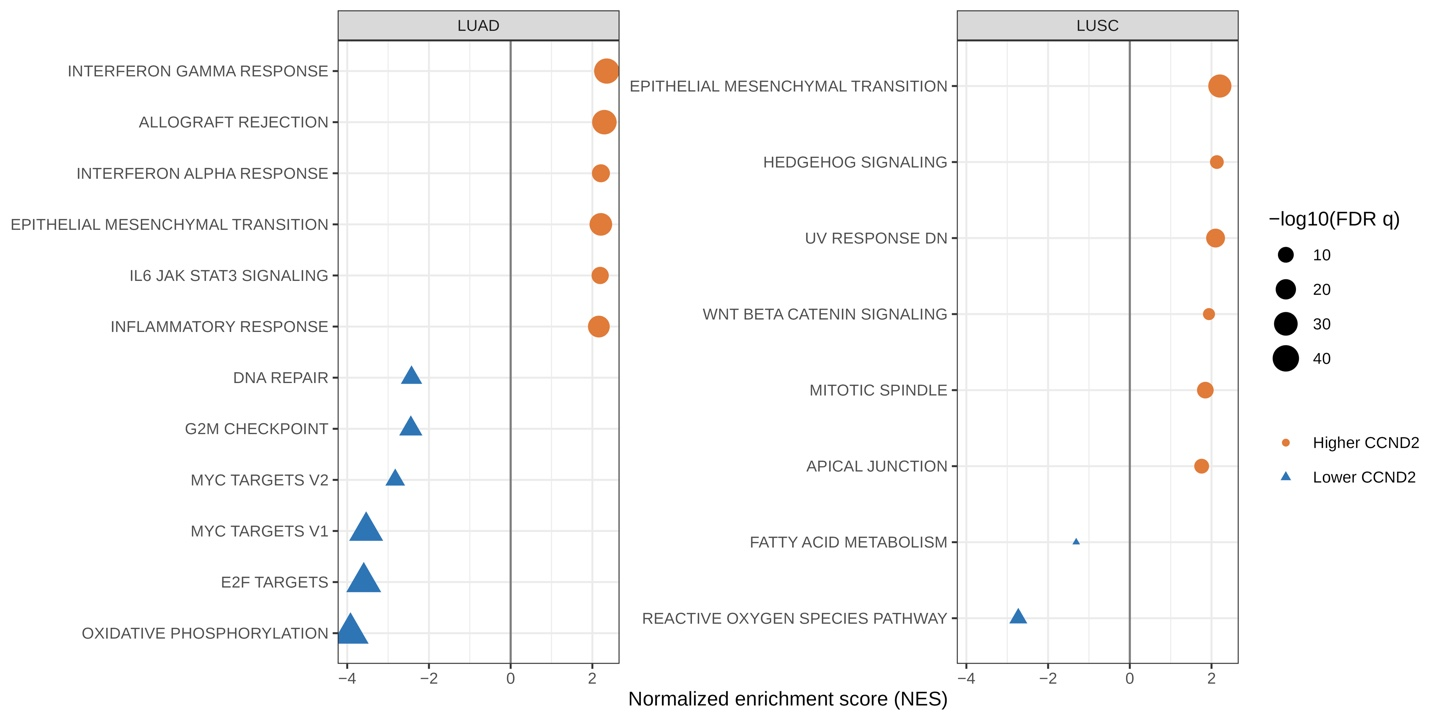
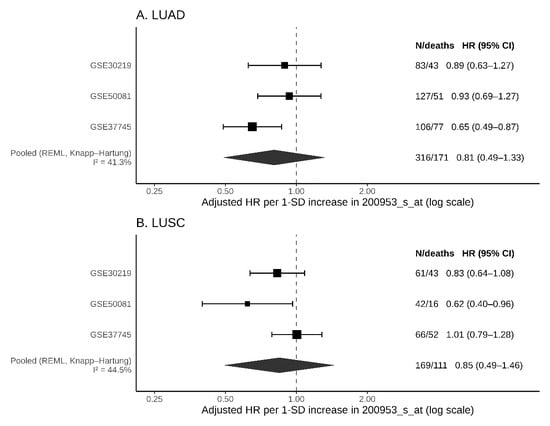
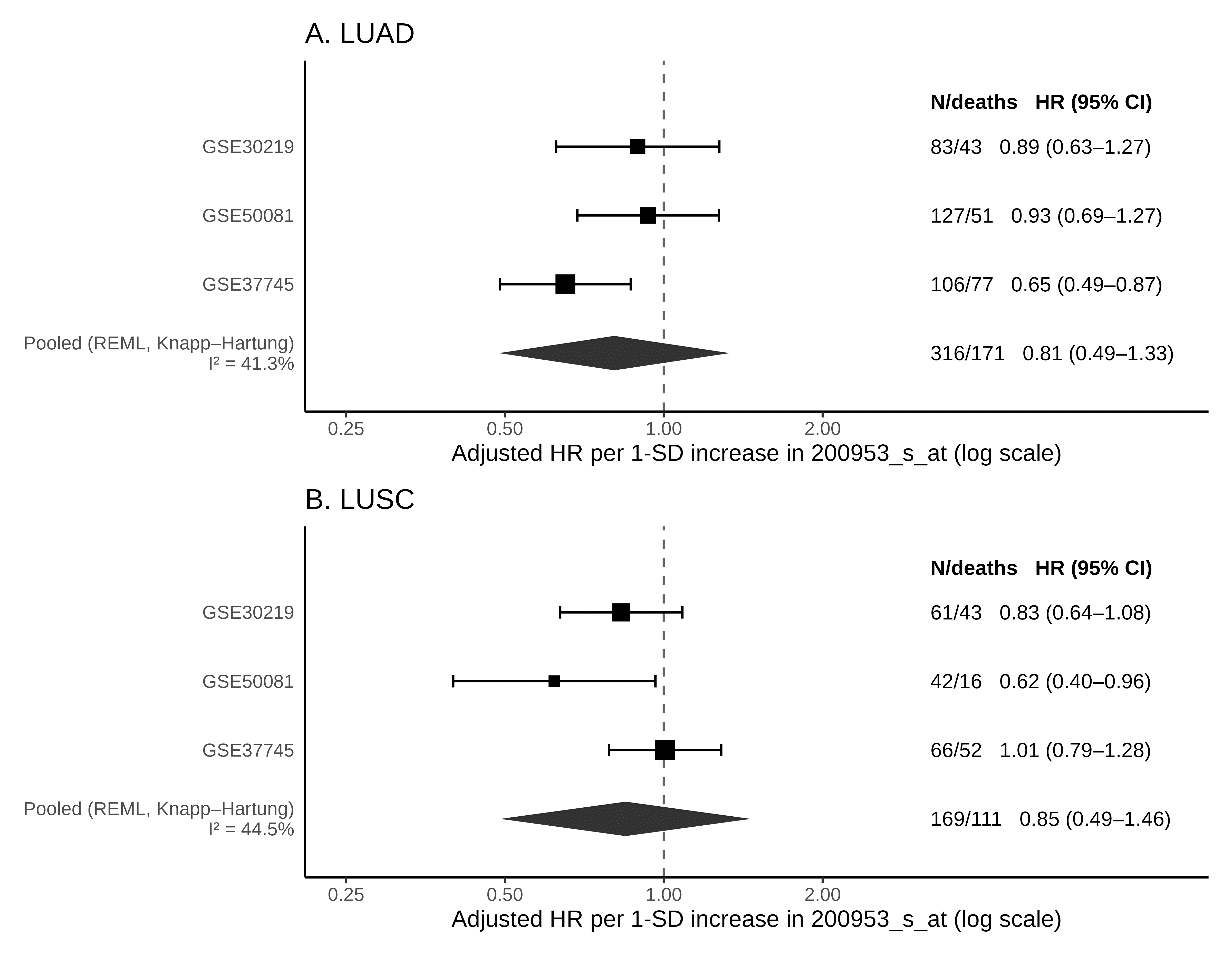
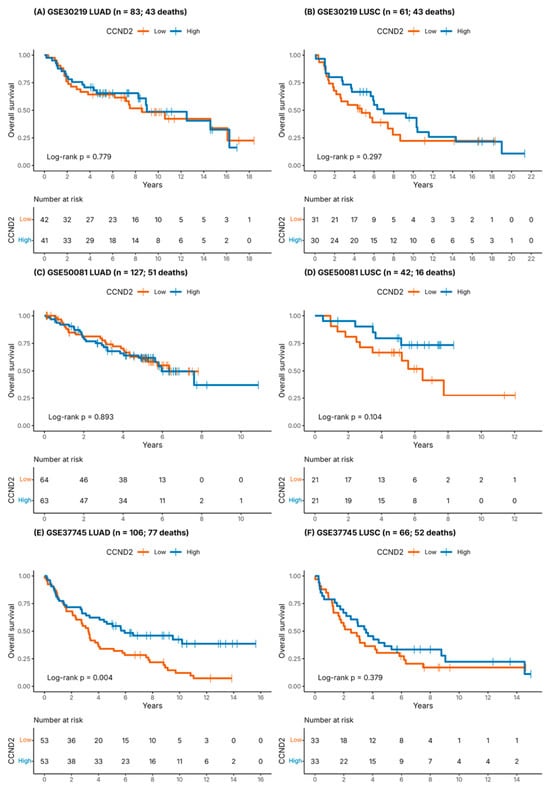
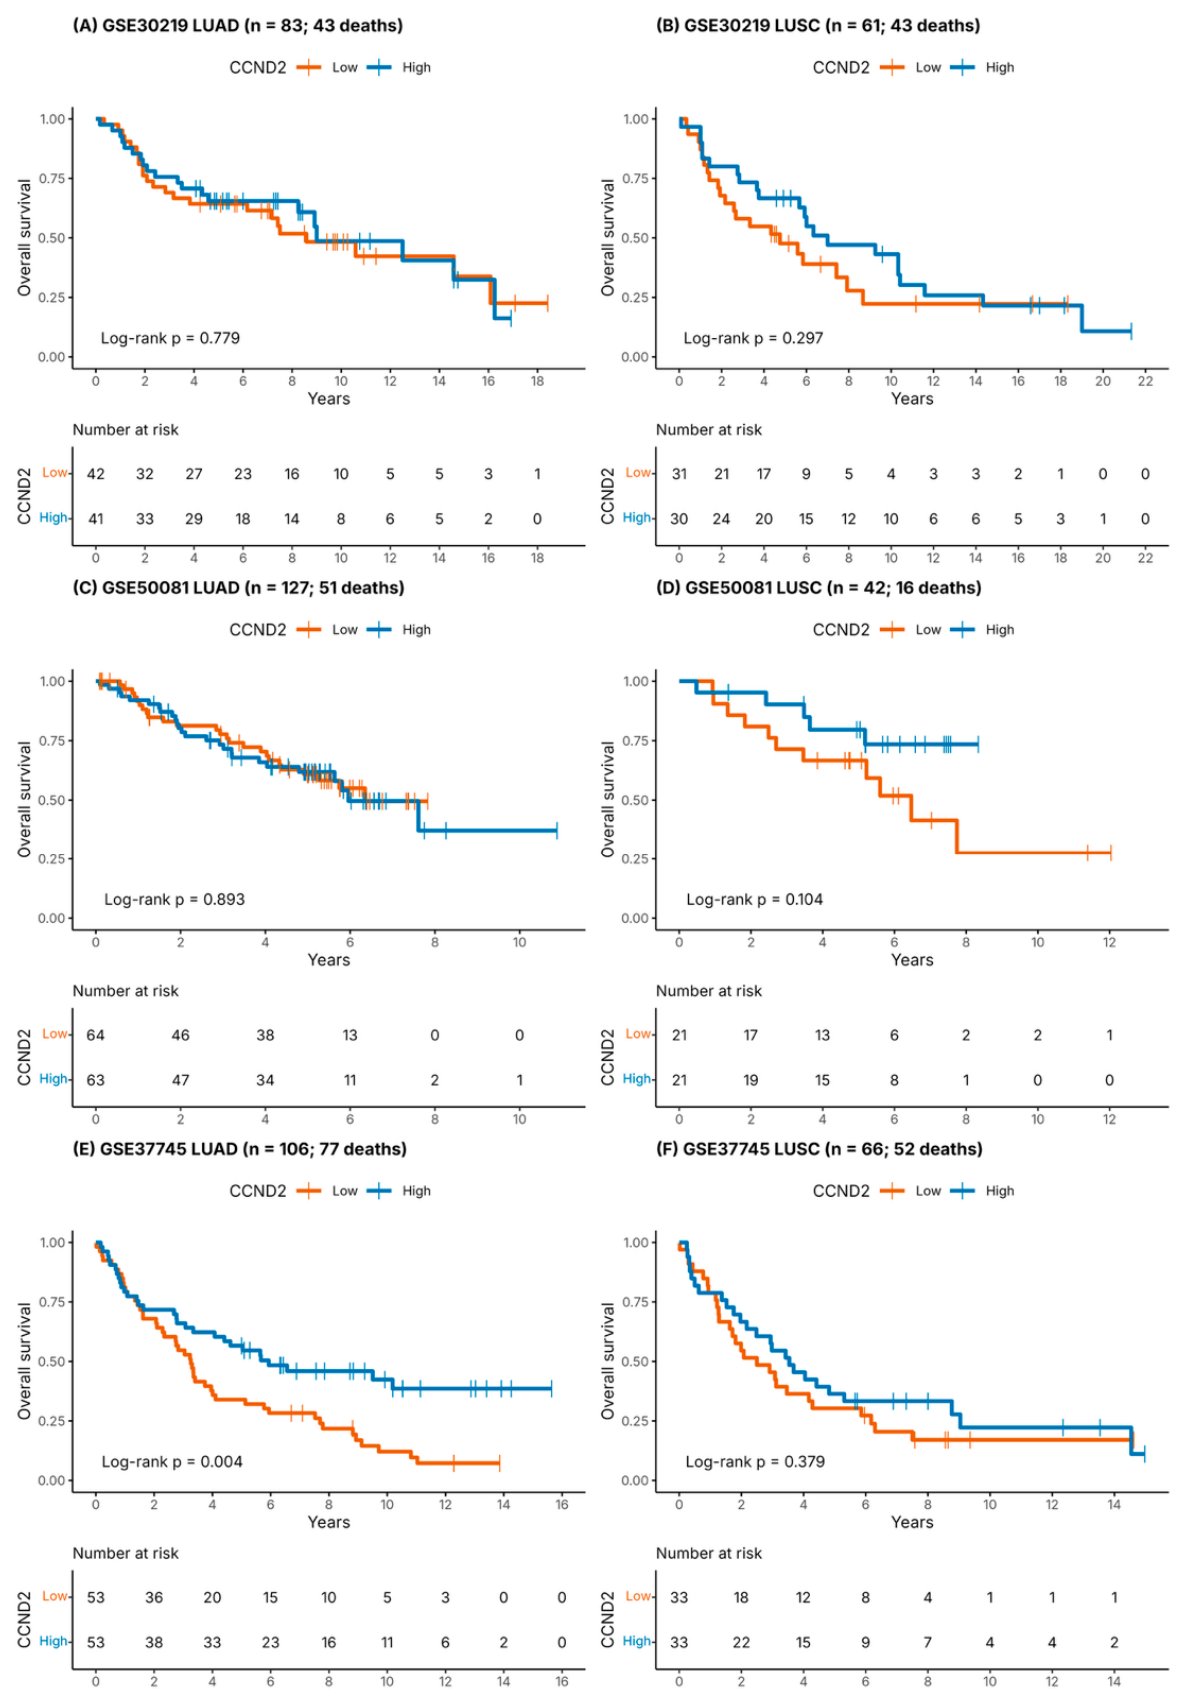

Disclaimer/Publisher’s Note: The statements, opinions and data contained in all publications are solely those of the individual author(s) and contributor(s) and not of MDPI and/or the editor(s). MDPI and/or the editor(s) disclaim responsibility for any injury to people or property resulting from any ideas, methods, instructions or products referred to in the content. |
© 2026 by the authors. Licensee MDPI, Basel, Switzerland. This article is an open access article distributed under the terms and conditions of the Creative Commons Attribution (CC BY) license.