


Abstract
Opioid use disorder (OUD) is a global issue characterized by compulsive opioid use and is linked to significant morbidity and mortality. Ceftriaxone has been investigated for its potential neuroprotective and immunomodulatory effects; however, its mechanisms in opioid dependence remain unclear. This study employed a network pharmacological approach to explore the potential molecular target of ceftriaxone and related signaling pathways in OUD. Targets were identified based on a comparative toxicogenomics database, SwissTargetPrediction, complemented by PharmMapper for ceftriaxone and GeneCards and Gene Expression Omnibus for OUD. Overlapping targets were identified using Venn diagrams and analyzed via the STRING platform to construct a protein–protein interaction network. Biological insights were sourced from the DAVID database, and Gene Ontology and KEGG pathway enrichment evaluated the biological significance of the target genes using Metascape. Molecular docking was performed using AutoDock Vina (version 1.1.1) for ceftriaxone, its analogs, and other GLT-1 modulators: MC-100093, MC-350012, MC-350013, and MC-290401. A total of 10 overlapping genes (IL-1β, TNF, ALB, EGFR, ESR1, CDK5, MME, SLC1A2, EPO, and SRC) were identified with multiple biological functions and signaling pathways. Molecular docking predicted that the novel GLT-1 modulator, MC-350013, exhibited favorable docking scores toward several prioritized proteins, particularly ESR1, EGFR, IL-1β, and ALB. Molecule 13 also demonstrated favorable docking scores for the selected proteins. Molecular dynamics simulations characterized the interaction behavior of the novel GLT-1 modulator, MC-350012 and MC-350013. Although ceftriaxone showed stronger hydrogen-bonding interactions, MC-350012 and MC-350013 showed favorable predicted interaction profiles with IL-1β and ESR1. Collectively, these computational findings may suggest MC-350012 and MC-350013 as candidates for further experimental investigation based on their predicted interactions with key OUD-related targets.
1. Introduction
Opioid use disorder (OUD) is a relapsing chronic condition marked by the compulsive misuse of opioids, a class of analgesics whose misuse causes significant impairment or distress [1]. It is characterized by tolerance, withdrawal symptoms, intense opioid craving, distress, and functional impairment [2]. Recently, OUD has become a significant public health concern in several countries, to the point of being declared an epidemic. In 2021, opioids were the second most commonly used controlled substance class, with approximately 60 million opioid users worldwide and 5.8% of people aged 15 to 64 suffering from OUD [3]. It is alarming to note that opioids are responsible for nearly 68% of all drug-related deaths worldwide, and nearly 128,000 deaths annually [1]. Many factors may contribute to OUD, such as genetic predisposition, neurobiological mechanisms, psychological factors, and environmental influences [4,5]. Furthermore, while opioids are often prescribed for legitimate medical uses, misuse can occur, particularly with long-term pain management, when opioids are overprescribed or improperly monitored, or if there is a history of substance abuse or mental illness. Therefore, OUD can progress from dependence to addiction, resulting in a cycle that is challenging to break without targeted interventions [6].
A number of brain regions are affected by OUD, undergoing both structural and functional changes; for example, chronic opioid use has been shown to affect neurotransmitter systems and synaptic function. There is a significant link between OUD and brain dysfunction due to disruptions in glutamate signaling, which may contribute to glutamate toxicity and neuroplastic changes linked to relapse and addiction. In particular, the nucleus accumbens and the dorsolateral prefrontal cortex exhibit significant alterations in the expression of synaptic proteins and genes that play roles in reward and cognition in OUD. The disruption of glutamate and GABA signaling pathways also suggests an imbalance in excitatory-inhibitory signaling [7,8,9]. More specifically, dysregulation of glutamate transporters such as glutamate transporter-1 (GLT-1) (its human homolog is EAAT-2) and xCT results in glutamate excitotoxicity, which causes neural death by increasing NMDA sensitivity, enhancing calcium overload, inducing oxidative stress, disrupting mitochondrial function, and activating cell death pathways [10,11,12]. The traditional treatments for opioid addiction are buprenorphine and methadone, which target opioid receptors to reduce cravings, suppress withdrawal symptoms, and restore functional balance in the brain’s systems [13,14]; however, these drugs are themselves opioids and therefore present a high risk of abuse and addiction. Non-opioid pharmacotherapies are urgently needed [15].
Β-lactam antibiotics, particularly ceftriaxone, have garnered attention for their neuroprotective properties. Many experimental studies have shown ceftriaxone to upregulate the astrocytic glutamate transporter (GLT-1) and xCT and thereby restore glutamate concentrations in disrupted regions [10]. In models of drug dependence, it also reduces inflammation and drug-seeking behavior [10,16]. Specifically, in a cocaine dependence model, administration of ceftriaxone produced an effective reduction in cocaine sensitization and lowered drug-seeking behavior, along with upregulating GLT-1 [17]. Alasmari et al. (2024) likewise demonstrated in a mouse model of fentanyl overdose that ceftriaxone reduced neuroinflammation (IL-6 and TNF-α) and oxidative stress and improved behavioral changes [16]. Another study found that ceftriaxone decreased nicotine and ethanol consumption, and these effects were associated with increased expression of GLT-1 in the prefrontal cortex and the nucleus accumbens [18]. Collectively, these findings highlight ceftriaxone’s potential as a GLT-1 modulator that counteracts neuro-excitotoxicity and neuroinflammation.
A synthetic β-lactam non-antibiotic termed “MC-100093” has recently been studied for its role in modulating drug dependence-related behaviors by modulating GLT-1 and glutamate homeostasis. It has been shown to suppress the proinflammatory activity and hyperactivity induced by morphine and fentanyl, as well as to attenuate the downregulation of GLT-1 and xCT [10,16]. In the cocaine relapse model, this compound likewise reduces the cue-induced reinstatement of drug-seeking behavior, along with enhancing GLT-1 expression [19]. In the context of chronic ethanol exposure, MC-100093 was found to reduce alcohol intake, mitigate ethanol-induced neuroinflammation, and reverse dysregulation of brain-derived neurotrophic factor [20]. However, while these effects are intriguing, the broad, systemic mechanisms by which β-lactam antibiotics, specifically ceftriaxone, exert effects on OUD remain unclear. Therefore, we employed a network pharmacology approach to map ceftriaxone’s multi-target actions in this disorder.
The network pharmacology approach is one of the most revolutionary approaches to drug discovery, allowing the identification of multi-target interactions and their involvement in complex biological pathways [21,22]. Research of this type clarifies the synergistic effects and mechanisms of a compound of interest by facilitating evaluation of the underlying interactions across multiple levels [22]. In this study, we used a network pharmacology framework to systematically explore potential associations between ceftriaxone-related targets and OUD-related molecular pathways. By identifying candidate targets and signaling pathways, we further employed molecular docking to evaluate the predicted binding interactions of ceftriaxone and its analogs. The investigation was extended to include ceftriaxone-derived beta-lactams (MC-290401 and MC-100093) and novel synthetic GLT-1 modulators (MC-350012 and MC-350013), allowing structurally distinct compounds to be computationally evaluated against OUD-related targets within the same framework. This broader evaluation represents the specific novelty of the present study and provides a basis for prioritizing candidate compounds and target interactions that may warrant further experimental validation.
2. Materials and Methods
2.1. Identification of Drug Targets
The potential molecular targets of ceftriaxone were identified using a multi-database approach: the Comparative Toxicogenomics Database (CTD), SwissTargetPrediction, and PharmMapper. In CTD (https://ctdbase.org/ (accessed on 11 June 2025)), the drug name was used to search for chemical-gene interactions. SwissTargetPrediction (http://www.swisstargetprediction.ch/ (accessed on 11 June 2025)) was performed with the canonical SMILES of the drug, and only targets with a probability score of ≥0.1 were retained. For PharmMapper (https://www.lilab-ecust.cn/pharmmapper/ (accessed on 11 June 2025)), the 3D structure obtained from PubChem (https://pubchem.ncbi.nlm.nih.gov/ (accessed on 11 June 2025)) was converted into SDF format, and results were ranked according to Norm Fit scores; targets with fit scores greater than 0.8 were retained. After compiling the target lists, duplicates and non-human proteins were removed for further analysis [23,24].
2.2. Identification of Opioid Use Disorder-Related Targets
GeneCards and Gene Expression Omnibus (GEO) databases were used to identify genes associated with OUD. First, we searched in the GeneCards database (https://www.genecards.org/ (accessed on 11 June 2025)) using the keyword “opioid use disorder”. The resulting gene list was ranked based on GeneCards Inferred Functionality Score (GIFtS) and relevance score, where genes with relevance score ≥ 20 were selected, as the higher relevance score reveals a strong association between that gene and the disease [25]. Secondly, we used the GEO database (https://www.ncbi.nlm.nih.gov/gds/ (accessed on 11 June 2025)) to obtain gene expression profiles by retrieving the dataset GSE174409. The dataset included RNA-sequencing data from 20 individuals with OUD and 20 control subjects, with samples obtained from two brain regions, the dorsolateral prefrontal cortex (DLPFC) and nucleus accumbens (NAc), resulting in 80 samples in total [26]. We included all 80 available samples in the analysis, and no samples were excluded. Data analysis was performed with GEO2R using the default settings for the DESeq2 workflow. Differential expression analyses were conducted for NAc and DLPFC. Within each brain region, samples were categorized into two groups by diagnosis: OUD (n = 20) and control (n = 20). Low-count genes were pre-filtered by retaining genes with counts ≥ 10 in at least as many samples as the size of the smallest comparison group. Differential expression analysis was performed using the Wald test with sfType = “poscount”, and multiple-testing correction was applied using the false discovery rate (FDR) method. Differentially expressed genes (DEGs) were identified using two criteria: an adjusted p-value of 0.05 and |log2 fold change| ≥ 1 (i.e., log2FC > 1 or <−1), to ensure that we included genes that were significantly up-regulated or down-regulated [27]. The DEG lists obtained independently from NAc and DLPFC were subsequently merged, and duplicate genes were removed. Then we merged GeneCards and GEO-derived genes and removed duplicates to obtain the final list of candidate OUD-associated genes. The computational analyses were based on previously published, publicly available data, for which ethical approvals were obtained in the original studies. No new human participants were recruited, and no new biological samples were collected.
2.3. Identification of Overlapping Genes
To identify overlapping genes between the ceftriaxone-related targets and OUD-related genes, a Venn diagram analysis was performed to identify genes shared between the disease and the drug. The two gene sets (76 targets related to ceftriaxone and 462 associated with OUD) were input into an online tool called Venn Diagram (https://bioinformatics.psb.ugent.be/webtools/Venn/ (accessed on 13 June 2025)) to visualize and clarify the shared genes. The overlapping genes were then analyzed using protein–protein interaction networks and functionally enriched [28].
2.4. Protein–Protein Interaction (PPI) Network
Identified overlapping genes were exported to the STRING database (https://string-db.org/ (accessed on 17 June 2025)) to construct PPI networks. The organism was set to Homo sapiens, and given the exploratory nature of this study and the limited number of overlapping genes, the minimum interaction score was set at 0.4 (medium confidence) to retain potentially relevant protein associations while maintaining adequate network coverage. The resulting network was exported in TSV format and imported into Cytoscape (version 3.10.3), an open-source network visualization tool, for topological analysis [28].
2.5. Functional (GO and KEGG Pathway) Enrichment Analysis
To investigate the target genes’ biological significance and understand their biological meaning, Gene Ontology (GO) enrichment analysis and Kyoto Encyclopedia of Genes and Genomes (KEGG) were conducted through the Database for Annotation, Visualization and Integrated Discovery (DAVID: https://davidbioinformatics.nih.gov/home.jsp (accessed on 17 June 2025)), an integrated set of functional annotation tools. The species selected was “Homo sapiens”; no custom background gene list was specified. GO and KEGG pathway terms with a raw p-value less than 0.05 were considered nominally enriched. Benjamini-adjusted p-values were also reported to account for multiple testing but were not used as the primary selection criterion. The complete enrichment output is provided in the Supplementary Table S1. The results of enrichment analysis for KEGG pathways and GO terms of biological process (BP), cellular component (CC), and molecular function (MF) were visualized using the Bioinformatics online visualization tool (https://www.bioinformatics.com.cn/ (accessed on 17 June 2025)). GO/KEGG enrichment, as well as functional ontology clustering, was also performed using Metascape (https://metascape.org/gp/index.html#/main/step1 (accessed on 18 June 2025)). The representative clusters were generated within the Metascape platform based on the p-value and enrichment strength [28].
2.6. Identification of Hub Genes
Protein–protein interaction hub genes were identified and selected using two Cytoscape tools: CytoHubba and CytoNCA. The MCC (Maximal Clique Centrality) algorithm is conducted via CytoHubba. Degree Centrality (DC), Closeness Centrality (CC), and Betweenness Centrality (BC) are calculated using CytoNCA. Candidate proteins were prioritized for subsequent molecular docking based on their overall centrality rankings across both tools, along with their relevance to OUD-related molecular processes [29].
2.7. Generating AI Analogs of Ceftriaxone and Assessment of Drug-like Properties
Ceftriaxone analogs were generated using the software “Webserver-Aided Drug Design By Artificial Intelligence And Classical Algorithm” (WADDAICA) (https://heisenberg.ucam.edu:5000/ (accessed on 25 June 2025)), which uses the SMILES format to enhance the pharmacophore of existing drugs [30]. The “Drug design by AI” module was used, which implements the ligDream generative model, a variational autoencoder coupled to convolutional and recurrent networks that produce novel SMILES from the seed molecule. The seed submitted was the SMILES of ceftriaxone, and the number of generated molecules parameter was set to 17. All raw server output is provided as Supplementary Table S2. Also, in this study, we examined four compounds: β-lactam GLT-1 modulator derivatives (MC-100093 and MC-290401) and GLT-1 modulator derivatives (MC-350013 and MC-350012), which were synthesized in-house at the Moulder Center for Drug Discovery Research, Temple University School of Pharmacy (Figure 1). The pharmacokinetic properties of the selected and generated ligands were evaluated with SwissADME (http://www.swissadme.ch/ (accessed on 29 June 2025)), a tool that calculates physicochemical descriptors, predicts absorption, distribution, metabolism, and excretion, and assesses the drug-like nature of one or multiple small molecules [31].
Figure 1.
Chemical structures of the beta-lactam, MC-100093 and MC-290401, and non-beta lactams MC-350012 and MC-350013 compounds.
2.8. Molecular Docking: Validation Protocol, Selection and Preparation of Target Proteins
2.8.1. Validation of Protocol for Docking
A docking validation protocol was performed to assess the accuracy and reliability of the docking procedure in reproducing the experimentally observed binding pose of the co-crystallized ligand [32]. The co-crystallized ligand was docked into the target protein’s active site. Native ligands were removed from the protein structures, prepared for docking in UCSF Chimera, and then redocked into the active sites via AutoDock Vina implemented in PyRx. The resulting docked complexes were superimposed onto the original X-ray crystal structures containing co-crystallized ligands, and root-mean-square deviation (RMSD) values were calculated in PyMol. The validation is considered successful when the RMSD value is less than 2.0 Å [33].
2.8.2. Molecular Docking
Molecular docking studies were conducted to evaluate the predicted binding poses, docking scores, and interaction profiles of ceftriaxone, its analogs, and non-β-lactam derivatives with the five prioritized target proteins. (IL-1β, TNF, ALB, EGFR, and ESR1). The PDB target proteins were selected based on the effect and potential impact of ceftriaxone on neuroinflammation and addiction pathways. Since ceftriaxone has anti-inflammatory effects, interleukin-1β protein (PDB: 8C3U) and tumor necrosis factor (PDB: 2AZ5) co-crystallized with the antagonist were chosen for this study [15,34]. For serum albumin, the PDB: 8YXB was chosen as it complexes with ceftriaxone. Since opioid exposure induces EGFR upregulation, contributing to the production of pro-inflammatory cytokines, the crystal structure of the EGFR co-crystal with an inhibitor (PDB: 1M17) was selected for this molecular docking study [35,36]. Finally, ESR1 (PDB: 1XPC), the human estrogen receptor alpha ligand-binding domain complex with selective estrogen receptor modulator (SERM), compound 19, was chosen since SERMs are believed to reduce neural damage and promote neuroprotection [37]. The three-dimensional (3D) structures of the corresponding proteins (Homo sapiens) were downloaded from the RCSB Protein Data Bank (https://www.rcsb.org/) as PDB files. Active site parameters and docking grid parameters were determined for each structure using co-crystallized ligands (see Table 1 for details). We prepared the target proteins by retaining chain A, removing co-crystallized ligands, and water motifs and adding polar hydrogen. Ligands were obtained in SDF format from the PubChem database, followed by energy minimization by Merck Molecular Force Field 94 (MMFF94) in Open Babel integrated with PyRx. Proteins and drugs were converted into PDBQT format. AutoDock Vina version 1.1.1 was then used for molecular docking with an exhaustiveness value of 8, a maximum of nine binding poses, and an energy range of 3 kcal/mol. PyMOL (version 3.1.5.1) was used for visual analysis. A docking score was generated for each ligand-protein complex, where a more negative score indicates more favorable predicted interactions according to the Vina scoring function [33].
Table 1.
Grid box parameters selected of the target proteins.
2.9. Selection of Compounds and ADMET Profiling
Following the molecular docking analysis, AI-generated analogs were ranked by docking score from most to least negative for each target protein independently. The top 10 analogs for each target were considered, and analogs consistently ranked among the top 10 across all target proteins were selected for subsequent ADMET evaluation. Similarly, from synthetic derivatives of novel GLT-1 modulators, the two compounds with the most favorable docking scores for all targets were selected. The chosen compounds, together with the reference compound, ceftriaxone, were then subjected to the ADMET tool (https://ai-druglab.smu.edu/admet (accessed on 29 June 2025)), a tool for predicting chemical absorption, distribution, metabolism, excretion, and toxicity (ADMET), which is crucial for drug discovery and development. The evaluation focused on the predicted properties of CNS-targeted drugs, including molecular weight, BBB permeability, lipophilicity, number of hydrogen-bound acceptors and donors, and bioavailability [33]. Additionally, to visualize the key binding interactions between the ligands and target proteins, 2D interaction analyses were conducted using BIOVIA Discovery Studio Visualizer [33].
2.10. Molecular Dynamics Simulation
Intrinsic kinetic properties, structural stability, and dynamic behavior of protein-ligand complexes were evaluated by performing molecular dynamics (MD) simulations. Simulations were conducted using GROMACS version 2022.3. Initially, the compounds from both ceftriaxone and its analogs and novel GLT-1 modulators with the most favorable docking scores and favorable predicted ADMET properties were selected. Each protein-ligand complex was solvated in a triclinic simulation box filled with TIP3P water molecules with an edge distance of 1 nm. An appropriate number of ions (Na+ and Cl−) was added to neutralize the system charge and achieve a physiological ionic strength of 0.15 M. System preparation was performed with the Stage3 tool, using the AMBER99SB-ILDN force field for proteins and the GAFF2 for ligands. The AM1-BCC method was used to calculate the ligand charges. The energy is minimized using the steepest descent algorithm with a step size of 0.01 for 50,000 steps until convergence to optimize the geometry and eliminate steric clashes. The system was then equilibrated for 1 ns in the NVT and NPT ensembles at 310.15 K and 1 bar. A constant temperature was achieved using a V-rescale thermostat, and the pressure was maintained with the aid of Parrinello–Rahman barostat. Then the MD simulation was performed for 100 ns at the same temperature and pressure. Long-range electrostatic interaction was treated using the (PME) method, and bond constraints were applied via the (LINCS) algorithm, with a 2 fs time step. To assess reproducibility and convergence, three independent replicate simulations of 100 ns were performed for each protein–ligand complex, yielding 30 simulations in total. Each replicate was branched from the same energy-minimized structure and equilibrated independently, with initial velocities generated from a Maxwell–Boltzmann distribution at 310.15 K using a different random seed per replicate, and with independent thermostat seeds assigned to the NVT, NPT, and production stages. The complexes’ stability and conformation were evaluated using several metrics, including the root mean square deviation (RMSD), root mean square fluctuation (RMSF), hydrogen bonding (H-bond), center-of-mass (COM) distance, and protein–ligand contact frequency, which are reported as the mean ± standard deviation across the three replicates [42].
2.11. Molecular Mechanics with Generalized Born Surface Area (MM/GBSA) Binding Free Energy Calculations
The binding free energy was calculated using the MM/GBSA method implemented in the gmx_MMPBSA package version 1.6.2 following MD simulations to analyze the binding energy of ligand-protein complexes (ΔG_bind). Trajectory snapshots were extracted from a 20 ns window (60–80 ns) of the 100 ns MD simulations, selected as the equilibrated portion of the trajectories. A total of 200 trajectory frames were sampled at 100 ps intervals, and the MM/GBSA binding free energy was calculated. Specifically, the total binding energy (ΔG_bind) consists of van der Waals (VDWAALS) and electrostatic contributions (EEL), which represent gas-phase interaction energies, together with polar (ΔG_polar) and non-polar (ΔG_nonpolar), form solvation free energy (ΔG_solv). A per-residue energy decomposition was performed to determine the energetic contribution of each amino acid residue within the binding pocket to identify the residues contributing to the calculated interaction energy [42]. Calculations employed the GB-OBC2 model (igb = 5) with mbondi2 intrinsic Born radii (PBRadii = 3), internal and external dielectric constants of 1.0 and 78.5 respectively, a salt concentration of 0.15 M, and a temperature of 310.15 K. The nonpolar solvation term was derived from the solvent-accessible surface area using a surface tension coefficient of 0.0072 kcal mol−1 Å−2, an offset of 0.0, and a solvent probe radius of 1.4 Å. Per-residue energy decomposition (idecomp = 2) was performed for residues within 6 Å of the ligand. Calculations were carried out independently for all three replicates of each complex, and the results are reported as the mean ± standard deviation across replicates.
2.12. Principal Component Analysis (PCA)
Principal component analysis was used to explore both the quantitative and qualitative analyses through reducing the dimensionality of their configurational space. Accordingly, it is beneficial to investigate the conformational behavior and collective motions of proteins and their complexes through molecular dynamics simulations. From each ligand-protein system, 1000 trajectory frames were extracted and analyzed by Geo_Measures v0.9d software. The covariance matrix of atomic fluctuations was constructed, and the trajectories were projected onto the principal components. The conformational space, sampled by each complex, was subsequently analyzed using the first two principal components (PC1 and PC2).
3. Results
3.1. Potential Targets of Ceftriaxone in OUD and the Overlapping Genes
A total of 76 potential target genes for ceftriaxone were identified from CTD (15 genes), SwissTargetPrediction (6 genes), and PharmMapper (56 genes). In parallel, 462 DEGs were identified from the GSE dataset (accession number GSE174409) through separate GEO2R analyses of NAc and DLPFC samples. The OUD group included 20 individuals (10 females and 10 males) aged 35–59 years, whereas the control group also included 20 individuals (10 males and 10 females) aged 23 to 60. Drug overdose was the predominant cause of death in the OUD group, while causes of death were varied among controls. In addition, 319 candidate OUD-associated genes were retrieved from the GeneCards database. Based on the intersection of these gene sets via a Venn diagram (Figure 2), a total of 10 overlapped genes (TNF, CDK5, SLC1A2, EGFR, IL-1β, ESR1, ALB, MME, EPO, and SRC) were identified as shared genes between ceftriaxone-related targets and OUD-related genes.
Figure 2.
Venn diagram illustrating the overlap between ceftriaxone-associated targets and opioid use disorder (OUD)-associated genes.
3.2. PPI Network Analysis and Hub Protein Identification
Functional interactions of the overlapping genes were determined with reference to the STRING database. The resultant PPI network featured 10 nodes and 28 edges, with a significant PPI enrichment p-value of 0.0354. To identify critical nodes, we employed two topological analysis methods (Figure 3). CytoNCA revealed TNF, IL-1β, and ALB to be the top hub genes with the highest degree (8.0), followed by EGFR (7 degrees) and ESR1 (6 degrees) (Table 2). EGFR exhibited the highest betweenness centrality (16.4), suggesting that it can be considered a bottleneck node, involved in a number of interactions [43]. The MCC method, applied via CytoHubba (Figure 3B), identified IL-1β, TNF, and ALB as all sharing the highest score and thus jointly ranked first, indicating high centrality within the PPI network. These proteins were prioritized as candidate proteins for further analysis based on their network centrality. Based on a combined consideration of network centrality rankings from both analyses and biological relevance, IL-1β, TNF, ALB, EGFR, and ESR1 were selected for subsequent molecular docking.
Figure 3.
PPI network and hub gene identification with Cytoscape tools: CytoHubba and CytoNCA. (A) A network of protein–protein interactions across overlapping genes using the STRING database; nodes are proteins; edges are functional associations. (B) The list and network of the top 10 hub genes identified by the MCC algorithm in the CytoHubba plugin of Cytoscape. (C) The centrality analysis of the PPI network using the CytoNCA plugin, displaying node relationships based on network topology parameters (e.g., degree, betweenness, closeness). Those nodes with a higher centrality score have a darker color intensity. MME: membrane metalloendopeptidase (neprilysin), ESR1: encodes estrogen receptor 1, CDK5:cyclin dependent kinase 5, ALB: albumin, EGFR: epidermal growth factor receptor, SRC: proto-oncogene, non-receptor tyrosine kinase, TNF: tumor necrosis factor, IL-1β: interleukin 1 beta gene (encoding IL-1β), EPO: erythropoietin, SLC1A2: solute carrier family 1 member 2.
Table 2.
Degree, closeness, and betweenness centrality of targeted genes identified by CytoNCA.
3.3. Gene Ontology and KEGG Pathway Enrichment Analysis:
GO enrichment analysis was performed using DAVID on the 10 identified candidate genes. A total of 100 GO terms were identified in enrichment analyses based on a raw p-value less than 0.05. Of these, 78 fell under the biological process aspect, including ERK1 and ERK2 cascade regulation, astrocyte activation, and glial cell proliferation, all of which remained statistically significant after Benjamini correction for multiple testing (adjusted p < 0.05). These processes were associated with neurodevelopment, neuroinflammation, and synaptic plasticity, which are relevant to the pathophysiology of OUD [44,45,46]. Enriched cellular compartment terms included membrane raft, cell surface, and neuronal cell body, which also remained statistically significant after Benjamini correction. Additionally, enriched molecular function terms included integrin binding, cytokine activity, protein tyrosine kinase activator activity, and protein kinase activity, suggesting potential associations of the candidate genes with regulating immunity and signal transduction, as shown in Figure 4 [47,48]. However, none of the MF terms remained statistically significant after Benjamini correction. KEGG pathway enrichment analysis was also conducted via DAVID, identifying 24 pathways at a raw p-value of less than 0.05; Figure 5 illustrates the top 20 pathways, including cytokine-cytokine receptor interaction, MAPK signaling pathway, C-type lectin receptor signaling pathway, hormone signaling, and Alzheimer’s disease. Several of these pathways may be associated with neuroinflammation and cellular signaling cascades in the brain. These pathways have also been associated with cell survival, immune activation, and synaptic plasticity, all of which are dysregulated in OUD [49,50]. After Benjamini correction for multiple testing, only the hematopoietic cell lineage pathway remained statistically significant, while the significance of the other pathways was attenuated after adjustment. The complete KEGG enrichment results are provided in Supplementary Table S1.
Figure 4.
Gene ontology (GO) enrichment analysis. The bar plot illustrates enriched GO terms identified using raw p-values (p < 0.05), classified into three categories: green: biological process (BP), blue: cellular component (CC), and orange: molecular function (MF). The x-axis shows enrichment significance (−log10 of the raw p-value), while the y-axis lists the top enriched functional terms. Numbers at the end of each bar indicate the number of genes associated with the respective GO terms. The top 10 GO terms in each category were selected based on raw p-values (p < 0.05); however, not all of these terms remained statistically significant after Benjamini correction for multiple testing (adjusted p < 0.05).
Figure 5.
KEGG pathway enrichment analysis. (A) Bubble plot representing the top enriched KEGG pathways ranked by gene ratio. The X-axis indicates the gene ratio, bubble sizes reflect gene counts, and color gradients indicate unadjusted p-values, where red represents lower p-values (greater statistical significance), and blue represents higher p-values (lower statistical significance). (B) A bar chart representation of the top 20 KEGG pathways among the targeted genes, arranged by pathway category. The displayed pathways were selected based on unadjusted p-values (p < 0.05), rather than Benjamini correction for multiple testing.
Ontology clustering in Metascape further identified multiple representative clusters, including the aryl hydrocarbon receptor pathway, cognition, and response to interleukin-1 (Figure 6). The clustering analysis also highlighted pathways related to regulation of membrane potential and response to interleukin-1. These findings were consistent with the enriched terms identified in the GO biological process and KEGG pathway analyses.
Figure 6.
Ontology enrichment bar chart of clustered enrichment categories (GO/KEGG terms) by Metascape.
3.4. Pharmacokinetic Screening of Ceftriaxone, AI-Generated Analogs, and Novel Synthetic GLT-1 Modulators Derivatives
A total of 17 analogs of ceftriaxone were successfully generated using the WADDAICA web platform (Figure 7). Compounds were screened based on predefined pharmacokinetic and drug-likeness criteria, including Lipinski’s rule of five, molecular weight less than 500 Da, low topological polar surface area (TPSA), LogP (lipophilicity) between 1 and 3, and favorable predicted oral bioavailability. The majority of AI analogs had MW values below 500 Da and showed no more than one violation of Lipinski’s rule of five (Table 3). The number of hydrogen bond donors (≤4) and acceptors (≤8) remained within the acceptable range. However, TPSA values were relatively high, with most analogs above 90–140 Å2. Several analogs showed differences in predicted pharmacokinetic parameters compared with ceftriaxone.
Figure 7.
Structures of AI-generated molecule analogs of ceftriaxone generated through the WADDAICA web platform.
Table 3.
Pharmacokinetic and drug-like properties of ligands based on SwissADME.
Novel synthetic GLT-1 modulators also exhibited predicted drug-likeness properties, such as molecular weight less than 500 Da, TPSA between 48 and 112, and zero violations of Lipinski’s rule of five. Table 3 summarizes the pharmacokinetic and drug-like properties of the four novel synthetic GLT-1 modulators (MC-100093, MC-350012, MC-350013, and MC-290401) and ceftriaxone and its analogs, as determined with SwissADME tools. The complete SwissADME results for all evaluated compounds are provided in Supplementary Table S3, which is divided into four tables covering physicochemical properties, lipophilicity and water solubility, pharmacokinetic properties, and drug-likeness and medicinal chemistry.
3.5. Validation of the Molecular Docking Protocol
Prior to docking the selected ligands against the target proteins, the protocol was validated to ensure that the docking procedure and software could reliably reproduce the binding orientation of native ligands within their respective binding pockets. As an indicator of successful redocking, a RMSD value in the range of 0–2 Å between the docked and crystallographic pose is conventionally acceptable. The protocol was validated across five proteins–ligand complexes: IL-1β (PDB: 8C3U), TNF-α (PDB: 2AZ5), human serum albumin (PDB: 8YXB), EGFR kinase (PDB: 1M17), and estrogen receptor α (PDB: 1XPC). Redocking each cognate ligand reproduced its experimentally observed binding pose, with heavy-atom RMSDs of 0.675 Å, 0.815 Å, 1.150 Å, 1.240 Å, and 0.886 Å (Figure 8). All values lie within the accepted 0–2 Å range, confirming that the docking protocol reliably reproduces the native binding orientation across all five complexes.
Figure 8.
Validation of the docking protocol. Docked poses (colored sticks) are shown overlaid on the crystallographic poses (white sticks) for five proteins–ligand complexes: (A) IL-1β with T9C (PDB: 8C3U), RMSD 0.675 Å; (B) TNF-α with compound 307 (PDB: 2AZ5), RMSD 0.815 Å; (C) human serum albumin with ceftriaxone (PDB: 8YXB), RMSD 1.150 Å; (D) EGFR with erlotinib (PDB: 1M17), RMSD 1.240 Å; (E) ERα with compound 19 (PDB: 1XPC), RMSD 0.886 Å.
3.6. Molecular Docking, Compound Selection, and ADMET Profiling Results:
AutoDock Vina was utilized to evaluate docking scores and predicted binding poses of the candidate ligands against the five selected prioritized proteins potentially implicated in OUD. Several AI analogs showed docking scores comparable to or more favorable than ceftriaxone. For instance, molecule 13 ranked among the top three compounds based on docking score for EGFR (−8.6 kcal/mol), ALB (−10.1 kcal/mol), and ESR1 (−9.4 kcal/mol) and also showed a favorable docking score to proinflammatory proteins (−7.2 kcal/mol for IL-1β and −7.3 kcal/mol for TNF). Meanwhile, molecules 9 and 10 exhibited the most favorable docking scores to IL-1β (−7.7 kcal/mol) alongside favorable docking scores to TNF (−6.4 kcal/mol for molecule 9 and −6.1 kcal/mol for molecule 10); they also possessed similar docking scores for EGFR and ALB that were more favorable docking scores than ceftriaxone: −8.1 kcal/mol (9) and −8.5 kcal/mol (10) for EGFR and −9.7 kcal/mol (9) and −10 kcal/mol (10) for ALB. With regard to TNF, molecule 12 demonstrated the most favorable docking score (−7.7 kcal/mol), along with favorable docking scores for other proteins. At the other end, molecules 2 and 11 showed less favorable docking scores across the target proteins.
The novel synthetic GLT-1 modulators also demonstrated favorable docking profiles compared to ceftriaxone; especially, MC-350013 exhibited docking scores of −7.7 kcal/mol for IL-1β and −7.2 kcal/mol for TNF, indicating more favorable docking scores with these cytokine-related targets. This group also showed favorable docking scores for ALB, ranging from −6.8 to −10.1 kcal/mol. In the cases of EGFR and ESR, novel synthetic GLT-1 enhancers and ceftriaxone showed similar scores.
Overall, both AI-generated and novel GLT-1 modulator-derived compounds demonstrated favorable docking profiles for the target proteins, with several analogs showing more favorable docking scores than ceftriaxone. The docking poses of the selected compounds are illustrated in Supplementary Figures S1–S5, and the molecular docking results for all tested compounds are summarized in Table 4.
Table 4.
Molecular docking scores (kcal/mol) for the predicted ligand–target protein complexes.
Following the molecular docking analysis, three AI-generated ceftriaxone analogs (molecules 13, 9, and 10) were consistently ranked among the top 10 across all five target proteins and were therefore selected for further evaluation. These three selected molecules, along with novel synthetic GLT-1 modulators and ceftriaxone, were subjected to ADMET profiling to assess their predicted pharmacokinetic, toxicity, and drug-likeness profiles. As presented in Table 5 and Table 6, the selected compounds exhibited favorable predicted BBB permeability, low molecular weights (below 500 Da, with the exception of ceftriaxone), favorable lipophilicity (log D7.4), a low number of rotatable bonds, and few hydrogen bond acceptors. In pharmacokinetic half-life and toxicity profiles, molecule 9 and molecule 13 displayed a longer predicted half-life (up to 128.45 h) relative to ceftriaxone (118.63 h). However, these extended predicted half-lives may have different pharmacokinetic implications depending on the intended therapeutic application, and the predicted values require further experimental validation. Regarding the predicted toxicity parameters, all compounds had predicted LD50 values between 1.97 and 2.5. Overall, the evaluated compounds showed varied predicted pharmacokinetic and toxicity profiles. These findings suggest that the selected compounds showed predicted physicochemical properties consistent with drug-likeness criteria, together with predicted BBB permeability. Based on the combined consideration of docking results and predicted ADMET profiles, the analog (molecule 13) and two novel compounds, MC-350013 and MC-350012, were selected for subsequent 2D interaction analysis and molecular dynamics simulation.
Table 5.
Predicted ADMET properties of the ceftriaxone and selected molecules (molecule 9, molecule 10, and molecule 13).
Table 6.
Predicted ADMET properties of the β-lactam derivative compounds.
3.7. Analysis of Protein–Ligand Interactions (2D Visualization)
Comparison of the 2D interaction analysis of the selected compounds with ceftriaxone revealed differences in predicted binding patterns and interaction profiles within the active sites of the target proteins. When interacting with IL-1β (Figure 9), ceftriaxone exhibited a diverse range of interactions, including hydrogen bonding, van der Waals interactions, and pi-alkyl interactions. Key residues mediating these interactions included Lys 94, Lys 93, Lys 92, Asn 102, Lys 55, Val 47, Val 100, and Pro 118. Similar to ceftriaxone, molecule 13 exhibits interactions including a hydrogen bond with Met 95, alongside van der Waals, alkyl, and carbon-hydrogen interactions. Meanwhile, the novel GLT-1 enhancer derivatives were found to form hydrogen bonds with Lys 94, participate in alkyl and pi-alkyl interactions with Pro 57, Val 100, and Val 47, and undergo van der Waals interactions with Val 58, Phe 46, Met 95, and Lys 97. Visualizations of TNF complexes are depicted in Figure 9. These analyses demonstrated ceftriaxone to form multiple hydrogen bonds and van der Waals interactions with Gln 61, Gln 149, Ser 60, Leu 120, Gly 121, Leu 63, Tyr 151, Leu 57, Gly 122, and Ile 58. The other compounds form fewer hydrogen bonds, as in molecule 13, which forms a single hydrogen bond with Gly 121; of the novel synthetic GLT-1 modulator, MC-350012 forms a hydrogen bond with Tyr 151, while MC-350013 forms hydrogen bonds with Tyr 151 and Ser 95. Pi-pi stacking was observed for molecule 13, MC-350013, and MC-350012. Beyond these interactions, alkyl, pi-alkyl, and van der Waals interactions also observed within TNF complexes.
Figure 9.
The 2D protein–ligand interaction map derived from molecular docking of IL-1β and TNF proteins with ceftriaxone, its analog (Molecule 13), and non-beta-lactam derivatives. (A–D) represent the binding of the compounds with IL-1β. (E–H) show the same compounds in interaction with TNF.
Interactions with ALB are illustrated in Figure 10. All compounds except molecule 13 and MC-350013 were found to form hydrogen bonds. Notably, a pi-sulfur interaction was observed between ceftriaxone and Tyr 138. Pi-cation and pi-sigma interactions were additionally observed for several molecules. The pi-sigma with MC-350012 involved Arg 186, and those with MC-350013 and molecule 13 involved Tyr 138. Pi-cation interactions were identified between molecule 13 and Lys 190 and between ceftriaxone and Phe 134. Notably, for MC-350013, an unfavorable donor-donor interaction was also observed within the predicted binding pose. Such unfavorable interactions may negatively influence the predicted stability of the ligand-protein complex [51]. Figure 10 likewise illustrates interactions of the examined compounds with the binding pocket of EGFR. Ceftriaxone forms five conventional hydrogen bonds with Met 769, Leu 694, Cys 773, Asp 831, and Lys 721, along with van der Waals and pi-alkyl interactions. Molecular 13 similarly forms multiple interactions, including hydrogen bonds, pi-cation with Cys 751, pi-pi stacking with Phe 699, and alkyl, pi-alkyl, and van der Waals interactions; however, an unfavorable interaction with Thr 830 was also observed. Distinct from ceftriaxone, novel synthetic GLT-1 modulators showed interactions including alkyl, pi-alkyl, and van der Waals interactions. MC-350013 forms a hydrogen bond with Asp 776 and pi-sigma with Leu 820.
Figure 10.
The 2D protein–ligand interaction map derived from molecular docking of ALB and EGFR proteins with ceftriaxone, its analog (Molecule 13), and non-beta-lactam derivatives. (A–D) represent the binding of the compounds with ALB. (E–H) show the same compounds in interaction with EGFR.
Finally, as shown in Figure 11, ceftriaxone interacts with ESR1 via hydrogen bonds, electrostatic interactions with Glu 380, pi-pi T-shaped interactions with Trp 383, alkyl and pi-alkyl interactions with Met 522 and Leu 536, and van der Waals interactions. Molecule 13 showed interactions including pi-alkyl, alkyl, and van der Waals interactions, and novel synthetic GLT-1 modulators showed alkyl, pi-alkyl, and van der Waals interactions, as well as pi-sulfur interactions with Met 343.
Figure 11.
The 2D protein–ligand interaction map derived from molecular docking of the ESR1 protein with ceftriaxone, its analog (Molecule 13), and non-beta-lactam derivatives.
3.8. Molecular Dynamics Simulations for Selected Complexes of IL-1Β and ESR1
Molecular dynamics simulations are widely used to study the binding behavior and stability of ligand-protein complexes. In this study, we performed simulations for two proteins: IL-1β, which has been associated with OUD and implicated in neuroinflammatory processes, and the studied compounds showed favorable docking profiles; and ESR1 has been implicated in neuronal connectivity and inflammation associated with addiction. Based on the docking analysis, we selected ceftriaxone, molecule 13, and two novel compounds (MC-350013 and MC-350012) for molecular dynamics simulations, performed using GROMACS (version 2022.3); a co-crystallized reference structure was also evaluated.
Global stability was determined by calculating the RMSD, illustrated in Figure 12. IL-1β complexes exhibited low deviations (~1–2.5 Å), indicating relatively low backbone deviations during the simulation. The greatest fluctuations were observed with molecule 13 and MC-350012, whereas the lowest RMSD was achieved with the native inhibitor, a low molecular weight antagonist (T9C), ceftriaxone, and MC-350013 (Figure 12B,D,F,H,J). Ligand RMSD analysis (Figure 13B,D,F,H,J) further demonstrated that the native inhibitor displayed the lowest ligand RMSD (~0.5–1 Å), followed by MC-350012 (~0.6–1.7 Å) and MC-350013 (~0.8–2.0 Å). In contrast, molecule 13 showed moderate fluctuations (0.5–3 Å), and ceftriaxone showed the highest variability, with RMSD values reaching ~3.5 Å. The RMSF analysis showed generally similar fluctuation patterns across the IL-1β (Figure 14B,D,F,H,J). The similarity in fluctuation patterns across the complexes indicates no major differences in the overall fluctuation patterns among the studied complexes, though values in specific regions (30–50, 48–55, and 85–95) indicate increased flexibility [42,52]. Molecule 13 exhibited relatively higher fluctuations, suggesting increased local mobility [42,52]. H-bond interactions of the IL-1β complexes were analyzed throughout the simulation (Figure 15B,D,F,H,J). IL-1β complexes with ceftriaxone and the native inhibitor exhibit the highest and most persistent H-bond occupancy (1–5 bonds, peaks up to 8). Meanwhile, MC-350012, MC-350013, and molecule 13 resulted in predominantly 1–2 H-bonds, with occasional transient increases. The center of mass (COM) was monitored over 100 ns to evaluate the relative positional behavior of the complexes throughout the simulation (Figure 16B,D,F,H,J) [53]. The native inhibitor exhibited the most stable profile, maintaining a nearly constant distance of 4–5 Å with minimal fluctuations, followed by MC-350013 (2–6 Å). In contrast, the ceftriaxone and MC-350012 complexes showed greater fluctuations, with MC-350012 showing a noticeable increase after 80 ns. Molecule 13 showed the greatest variability among the three replicates, reaching about 10 Å. The protein–ligand contact frequency analysis was performed to evaluate the persistence of interactions between ligands and protein residues (Figure 17B,D,F,H,J) [54]. The complexes ceftriaxone and the native inhibitor exhibited relatively high contact frequencies across multiple residues. The MC-350013 complex also showed substantial contact frequencies, although some variation was observed among the three replicates. In contrast, the MC-350012 complex generally showed lower contact frequencies, while the molecule 13 complex showed considerable variability across residues and simulation replicates.
Figure 12.
Protein root-mean-square deviation (RMSD) profiles of ESR1 and IL-1β protein–ligand complexes during 100 ns molecular dynamics (MD) simulations. Panels (A,B) show ESR1-ceftriaxone and IL-1β–ceftriaxone complexes; (C,D) ESR1-MC-350012 and IL-1β–MC-350012 complexes; (E,F) ESR1-MC-350013 and IL-1β–MC-350013 complexes; (G,H) ESR1-Molecule 13 and IL-1β–Molecule 13 complexes; and (I,J) ESR1-native inhibitor and IL-1β–native inhibitor complexes, respectively. Each panel illustrates protein RMSD fluctuations across three independent simulation replicates (Rep-1, Rep-2, and Rep-3), reflecting conformational changes and structural stability of the proteins throughout the simulation period.
Figure 13.
Ligand root-mean-square deviation (RMSD) profiles of ESR1 and IL-1β protein–ligand complexes during 100 ns molecular dynamics (MD) simulations. Panels (A,B) show ESR1-ceftriaxone and IL-1β–ceftriaxone complexes; (C,D) ESR1-MC-350012 and IL-1β–MC-350012 complexes; (E,F) ESR1-MC-350013 and IL-1β–MC-350013 complexes; (G,H) ESR1-Molecule 13 and IL-1β–Molecule 13 complexes; and (I,J) ESR1-native inhibitor and IL-1β–native inhibitor complexes, respectively. Each panel illustrates ligand RMSD fluctuations across three independent simulation replicates (Rep-1, Rep-2, and Rep-3), reflecting changes in ligand positional stability and conformational dynamics within the protein-binding sites throughout the simulation period.
Figure 14.
Root-mean-square fluctuation (RMSF) profiles of ESR1 and IL-1β protein–ligand complexes during 100 ns molecular dynamics (MD) simulations. Panels (A,B) show ESR1-ceftriaxone and IL-1β–ceftriaxone complexes; (C,D) ESR1-MC-350012 and IL-1β–MC-350012 complexes; (E,F) ESR1-MC-350013 and IL-1β–MC-350013 complexes; (G,H) ESR1-Molecule 13 and IL-1β–Molecule 13 complexes; and (I,J) ESR1-native inhibitor and IL-1β–native inhibitor complexes, respectively. Each panel illustrates residue-wise RMSF variations across three independent simulation replicates (Rep-1, Rep-2, and Rep-3), reflecting local protein flexibility and residue-level conformational fluctuations throughout the simulation period.
Figure 15.
Hydrogen bond profiles of ESR1 and IL-1β protein–ligand complexes during 100 ns molecular dynamics (MD) simulations. Panels (A,B) show ESR1-ceftriaxone and IL-1β–ceftriaxone complexes; (C,D) ESR1-MC-350012 and IL-1β–MC-350012 complexes; (E,F) ESR1-MC-350013 and IL-1β–MC-350013 complexes; (G,H) ESR1-Molecule 13 and IL-1β–Molecule 13 complexes; and (I,J) ESR1-native inhibitor and IL-1β–native inhibitor complexes, respectively. Each panel illustrates fluctuations in the number of hydrogen bonds formed between the protein and ligand across three independent simulation replicates (Rep-1, Rep-2, and Rep-3), reflecting the dynamics and persistence of intermolecular hydrogen-bonding interactions throughout the simulation period.
Figure 16.
Center-of-mass (COM) distance profiles of ESR1 and IL-1β protein–ligand complexes during 100 ns molecular dynamics (MD) simulations. Panels (A,B) show ESR1-ceftriaxone and IL-1β–ceftriaxone complexes; (C,D) ESR1-MC-350012 and IL-1β–MC-350012 complexes; (E,F) ESR1-MC-350013 and IL-1β–MC-350013 complexes; (G,H) ESR1-Molecule 13 and IL-1β–Molecule 13 complexes; and (I,J) ESR1-native inhibitor and IL-1β–native inhibitor complexes, respectively. Each panel illustrates fluctuations in the COM distance between the protein and ligand across three independent simulation replicates (Rep-1, Rep-2, and Rep-3), reflecting changes in their relative spatial positioning and the stability of protein–ligand interactions throughout the simulation period.
Figure 17.
Protein–ligand contact frequency profiles of ESR1 and IL-1β complexes during 100 ns molecular dynamics (MD) simulations. Panels (A,B) show ESR1-ceftriaxone and IL-1β–ceftriaxone complexes; (C,D) ESR1-MC-350012 and IL-1β–MC-350012 complexes; (E,F) ESR1-MC-350013 and IL-1β–MC-350013 complexes; (G,H) ESR1-Molecule 13 and IL-1β–Molecule 13 complexes; and (I,J) ESR1-native inhibitor and IL-1β–native inhibitor complexes, respectively. Each panel illustrates the percentage frequency of protein–ligand contacts across three independent simulation replicates (Rep-1, Rep-2, and Rep-3), highlighting the persistence of interactions between individual protein residues and their respective ligands throughout the simulation period.
RMSD analysis of ESR1 binding dynamics also showed that all studied complexes exhibited varying RMSD values throughout the simulation (Figure 12A,C,E,G,I). The ceftriaxone and native inhibitor complexes showed relatively consistent RMSD profiles after initial equilibration, although their values often exceeded 3 Å. Complexes MC-350012 and MC-350013 showed more pronounced structural deviations, with MC-350013 exhibiting high variability across the three replicates, particularly after 50–60 ns. Molecule 13 exhibited moderate to high fluctuations. Figure 13A,C,E,G,I depict the ligand RMSD plots; all ligands remained predominantly below 2.5 Å, although occasional higher deviations were observed, particularly for ceftriaxone. The native inhibitor complex exhibited the lowest ligand RMSD, followed by MC-350012, molecule 13, and MC-350013, whereas ceftriaxone showed high deviations, with transient peaks approaching 4 Å. RMSF analysis (Figure 14A,C,E,G,I) further revealed that all complexes showed similar fluctuation patterns throughout the simulation. Despite this overall stability, RMSF increased in specific regions, notably in the approximately around residues 330–345 and 455–470 ranges, as well as near the MC-350012 terminal region (545–550), with peak values approaching or exceeding 6 Å in some replicates. Moderate elevation of RMSF was also observed around residues 405–425 and 525–540.
Hydrogen bond analysis showed the ESR1-ceftriaxone complex (Figure 15A,C,E,G,I) to exhibit a consistently high number of hydrogen bonds throughout the simulation, ranging from 1 to 6. This finding may indicate a relatively stable interaction, suggesting that ceftriaxone maintains a well-bound conformation within the ESR1 active site [55,56]. The native inhibitor also maintained persistent H-bond interactions (3 bonds) throughout the simulation. Molecule 13 displayed a moderate degree of hydrogen bonding to ESR1 (Figure 15G), forming 1 to 2 bonds with an increase to 4 in later stages (80–100 ns). This progressive increase may suggest a conformational adaptation of the ligand within the binding site [57].
While MC-350013 and MC-350012 were found to form a limited number of H-bonds, having approximately 1 throughout the simulation. The COM distance profiles (Figure 16A,C,E,G,I) revealed distinct positional behaviors among the studied complexes. The native inhibitor and MC-350012 maintained relatively narrow COM distance distributions, generally below 2.5 Å, which may indicate limited relative positional changes. MC-350013 also showed a comparatively consistent profile, although occasional fluctuations approached 3.5 Å. In contrast, molecule 13 displayed increased variability, particularly between 30 and 70 ns, with transient elevations reaching approximately 5.5 Å in one replicate. Ceftriaxone showed the most pronounced positional changes, especially after 75 ns, when one replicate exhibited a substantial increase in COM distance approaching 7.5 Å. Protein–ligand contact frequency analysis (Figure 17A,C,E,G,I) revealed distinct interaction patterns among the complexes during simulations. The native inhibitor showed consistently high contact frequency (60–95%) across most interacting residues. Similarly, MC-350012 and MC-350013 showed substantial contact frequencies (approximately 50–100%), maintaining frequent interactions with multiple protein residues. In contrast, molecule 13 showed greater variability across residues and replicates, while ceftriaxone showed high contact frequencies at selected residues but less uniform interaction patterns.
3.9. Free Energy Decomposition Analysis:
Free energy calculations were performed, including van der Waals, electrostatic, polar, and nonpolar solvation energies, to evaluate the calculated binding energetics of the studied compounds with the proteins. The MM/GBSA binding energies were calculated from three replicates for each compound, and the results were expressed as mean ± standard deviation (SD). For IL-1β, MC-350013 exhibited the most favorable MM/GBSA estimated binding energy among the tested compounds, with a ΔGbind value of (−37.604 ± 4.84 kcal/mol), followed by ceftriaxone and MC-350012 with −32.428 ± 0.3137 and −29.8087 ± 1.379 kcal/mol, respectively. Notably, MC-350013 also showed a slightly more favorable mean MM/GBSA estimated binding energy than the native inhibitor (−36.2759 ± 0.6613kcal/mol) (Table 7). This energetic profile may be attributed mainly to the VDWAALS interactions and electrostatic interactions. In contrast, molecule 13 showed the least favorable binding free energy among the tested compounds, with a ΔGbind value of −25.4148 ± 3.985 kcal/mol, which may be associated with a weaker hydrophobic interaction within the binding pocket, as shown by its VDWAALS interaction energy of −37.964 ± 5.675 kcal/mol. IL-1β binding free energy and its energetic components (VDWAALS and EEL), gas-phase interaction energy, and solvation energy (GSOLV: polar (EGB) and nonpolar (ESURF) of the tested compounds are illustrated in Figure 18.
Table 7.
MM/GBSA calculation of binding free energy (kcal/mol) for IL-1β -ligand complexes (mean ± SD, n = 3).
Figure 18.
Comparison of MM/GBSA-derived binding free energies (ΔG_bind) of native inhibitors, ceftriaxone, MC-350012, MC-350013, and Molecule 13 with (A) ESR1 and (B) IL-1β proteins, calculated using 200 snapshots per replicate, sampled every 10 frames from the 60–80 ns interval of each 100 ns molecular dynamics (MD) simulation. Blue, orange, and green circles represent the ΔG_bind values obtained from three independent simulation replicates (Replica-1, Replica-2, and Replica-3), respectively. Black diamonds indicate the mean binding free energy, with error bars representing the standard deviation (SD) across the three replicates. Binding free energies are expressed in kcal/mol, with more negative ΔG_bind values indicating more energetically favorable protein–ligand interactions.
On the other hand, the calculated free energy of ESR1 revealed that, compared to the native inhibitor, which had a binding energy of −65.237 ± 8.52 kcal/mol, the simulated compounds showed differences. Even though MC-350013 yielded an MM/GBSA estimated binding energy ΔGbind = −59.154 ± 7.63 kcal/mol, its value was less favorable than the co-crystallized ligand, with a difference of about 6 kcal/mol (Table 8). Similarly, MC-350012 showed a favorable calculated binding free energy of −46.7399 ± 7.701 kcal/mol, with favorable electrostatic and van der Waals energy contributions (−10.119 ± 6.061 kcal/mol and −54.140 ± 1.77 kcal/mol, respectively). Ceftriaxone exhibited a binding free energy of −43.580 ± 1.4218 kcal/mol, with hydrophobic contributions (VDWAALS interaction −53.792 ± 0.158 kcal/mol) playing an important role in the calculated energy. In comparison, Molecule 13 exhibited a slightly higher free binding energy of −43.664 ± 4.4744 kcal/mol. Overall, MC-350013 and MC-350012 exhibited favorable binding energy profiles for ESR1. The dominant van der Waals energy contribution across the complexes may suggest an important role for nonpolar interactions within the binding pocket. The MM/GBSA binding free energy decomposition results for both protein-ligand complexes are presented in Figure 19.
Table 8.
MM/GBSA calculation of binding free energy (kcal/mol) for ESR1-ligand complexes (mean ± SD, n = 3).
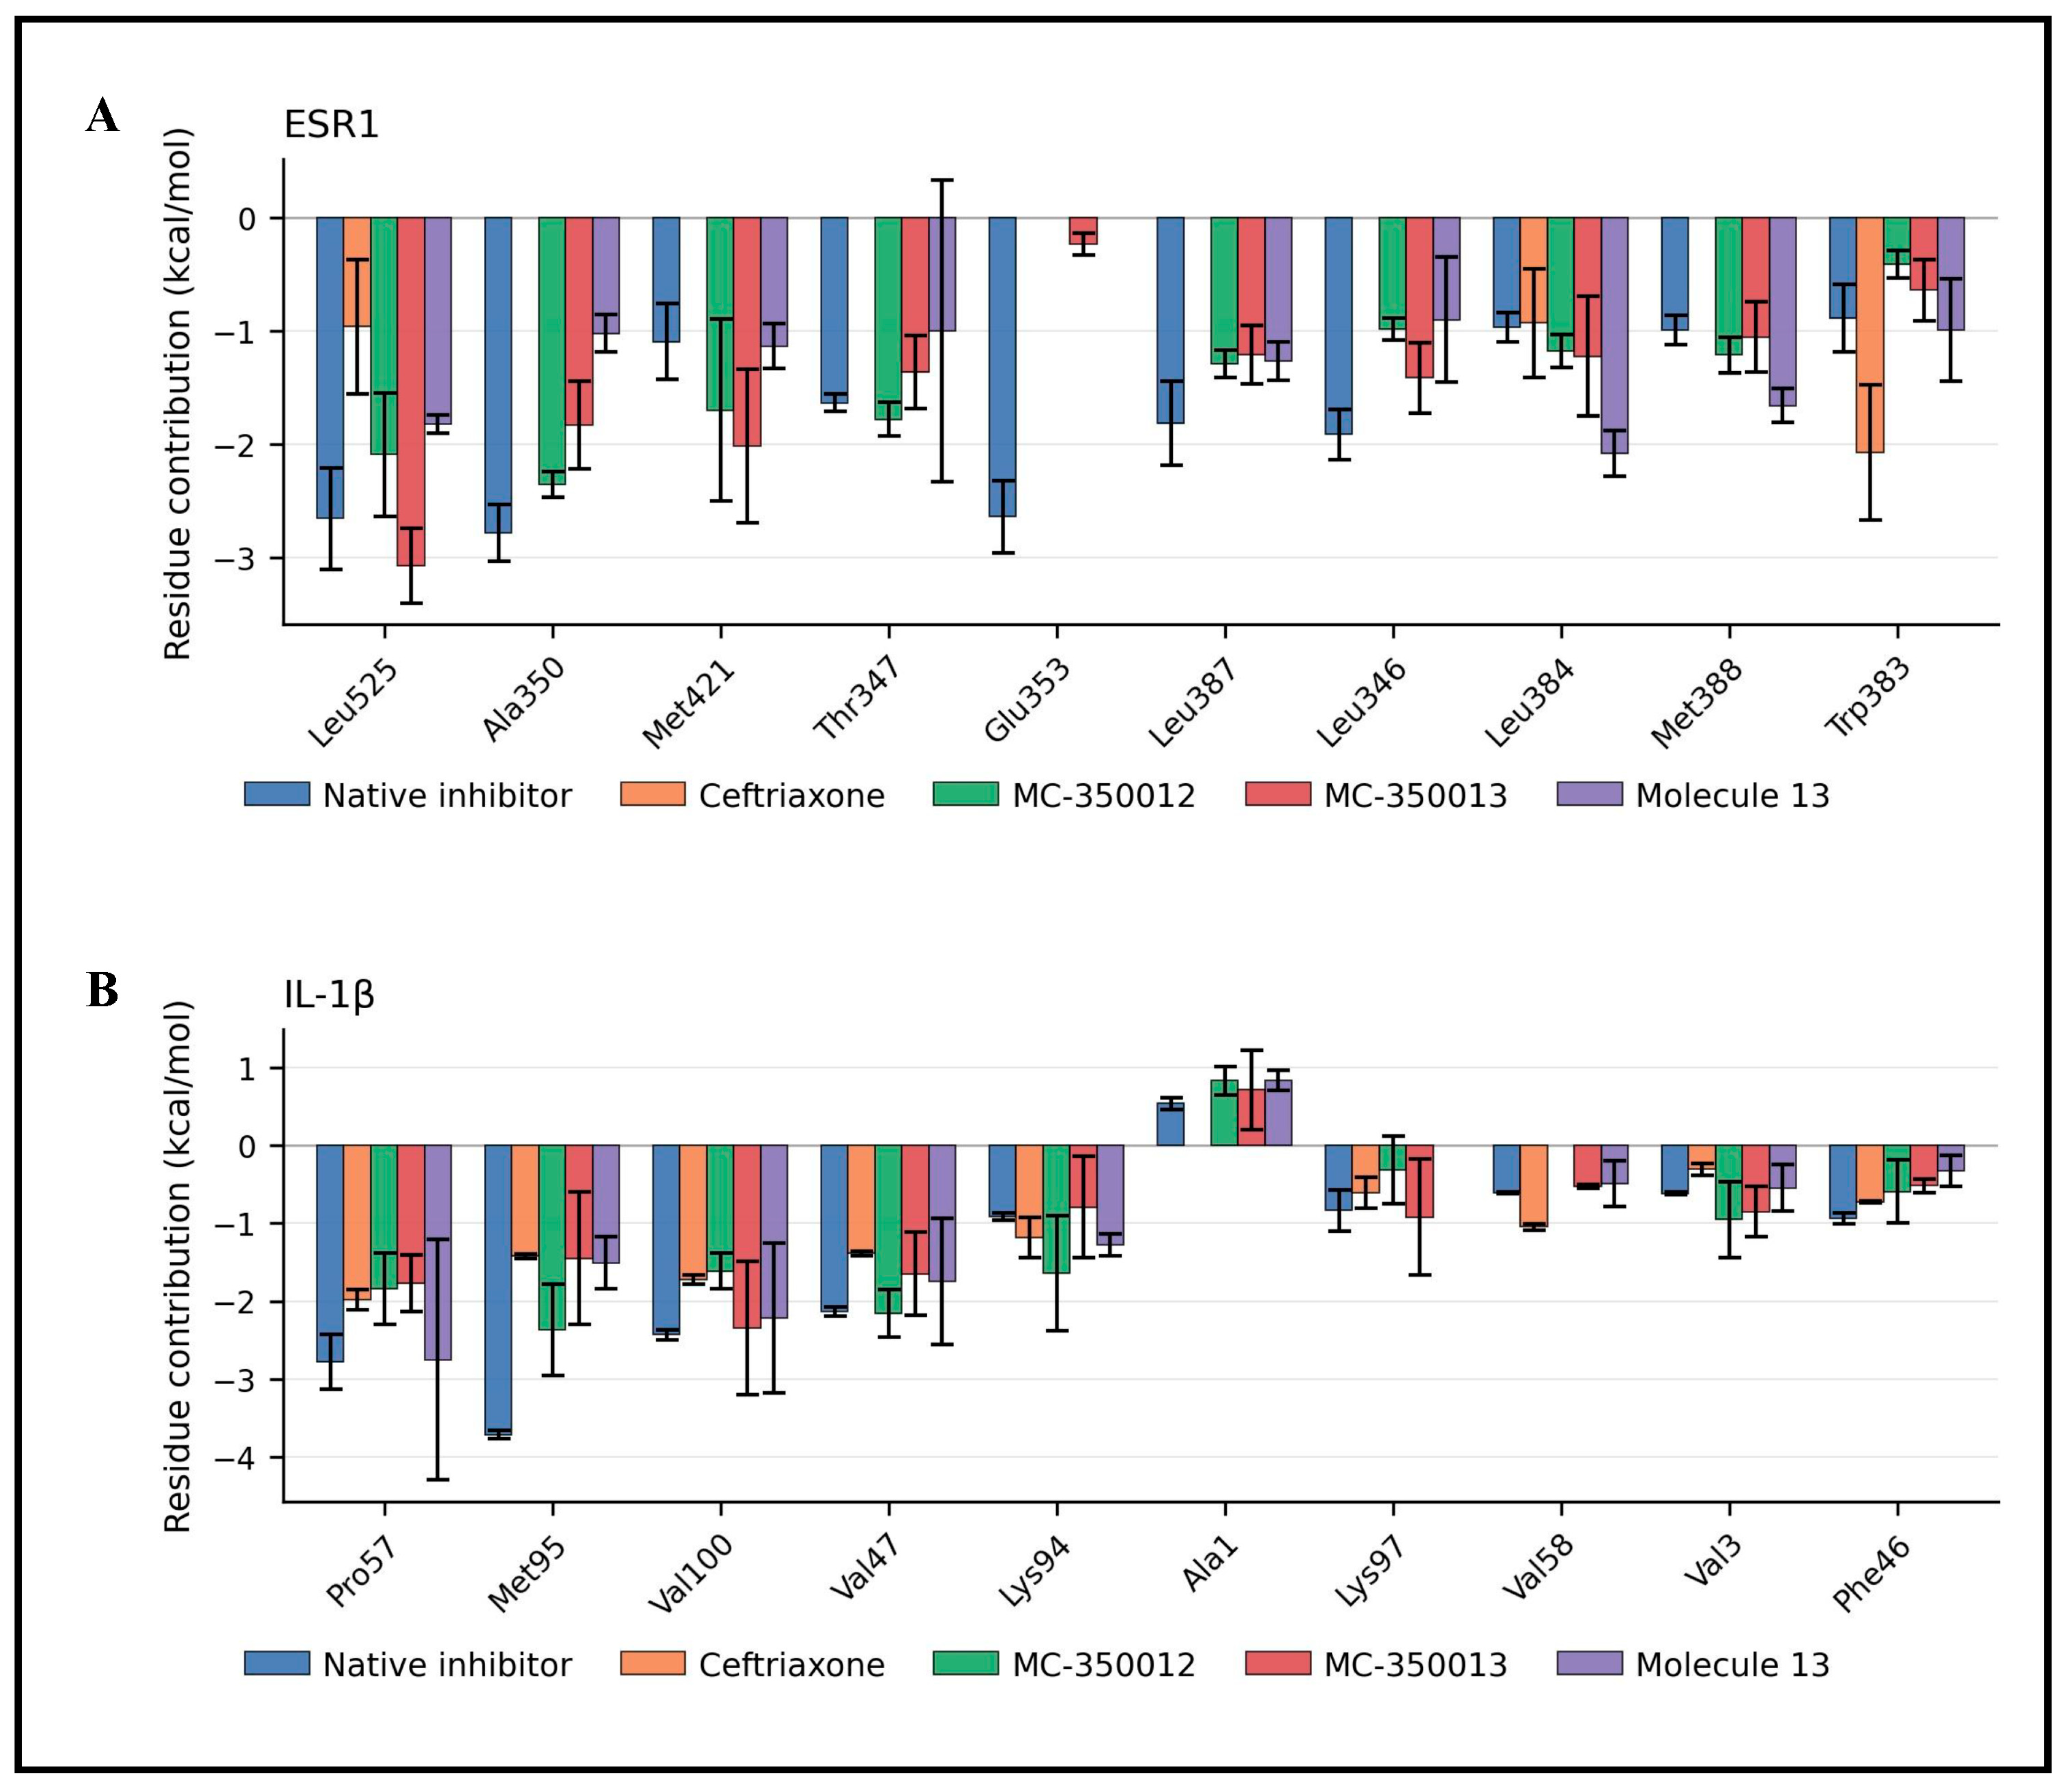
Residual energy decomposition analysis for IL-1β showed that the native inhibitor received favorable energy contributions from Met 95 (−3.72 kcal/mol), Pro 57 (−2.78 kcal/mol), Val 100 (−2.43 kcal/mol), and Val 47 (−2.14 kcal/mol). While Lys 94, Phe 46, and Lys 93 contribute to a moderate interaction (Figure 20B). Ceftriaxone showed interaction with Pro 57 (−1.98 kcal/mol), Val 100 (−1.73 kcal/mol), Met 95 (−1.42 kcal/mol), Lys 94 (−1.19 kcal/mol), and Val 58 (−1.05 kcal/mol). For MC-350012, residues are Met 95 (−2.37 kcal/mol), Val 47 (−2.16 kcal/mol), Pro 57 (−1.84 kcal/mol), Lys 94 (−1.64 kcal/mol), and Val 100 (−1.61 kcal/mol). Val 100 contributed favorably to the interactions of both MC-350013 (−2.34 kcal/mol) and molecule 13 (−2.22 kcal/mol). In addition to Pro 57, Val 47, and Met 95, they also showed favorable energy contribution to MC-350013 and molecule 13. Overall, Val 100, Pro 57, Val 47, and Met 95 consistently showed favorable energy contributions across most complexes and were identified as predicted energetic contributors to the ligand-protein interaction.
Figure 19.
MM/GBSA binding free energy decomposition analysis of (A) ESR1 and (B) IL-1β complexes with native inhibitors, ceftriaxone, MC-350012, MC-350013, and Molecule 13 using 200 snapshots per replicate, sampled every 10 frames from the 60–80 ns interval of each 100 ns molecular dynamics (MD) simulation. The grouped bar plots illustrate the contributions of van der Waals interactions (ΔE_vdW), electrostatic interactions (ΔE_ele), polar solvation energy (ΔG_GB), and nonpolar solvation energy (ΔG_SA) to the total binding free energy (ΔG_bind). Different colors represent the investigated ligands, while error bars indicate the standard deviation (SD) across three independent simulation replicates. Negative energy contributions indicate energetically favorable interactions, whereas positive values indicate unfavorable contributions, providing insights into the energetic factors governing protein–ligand binding.
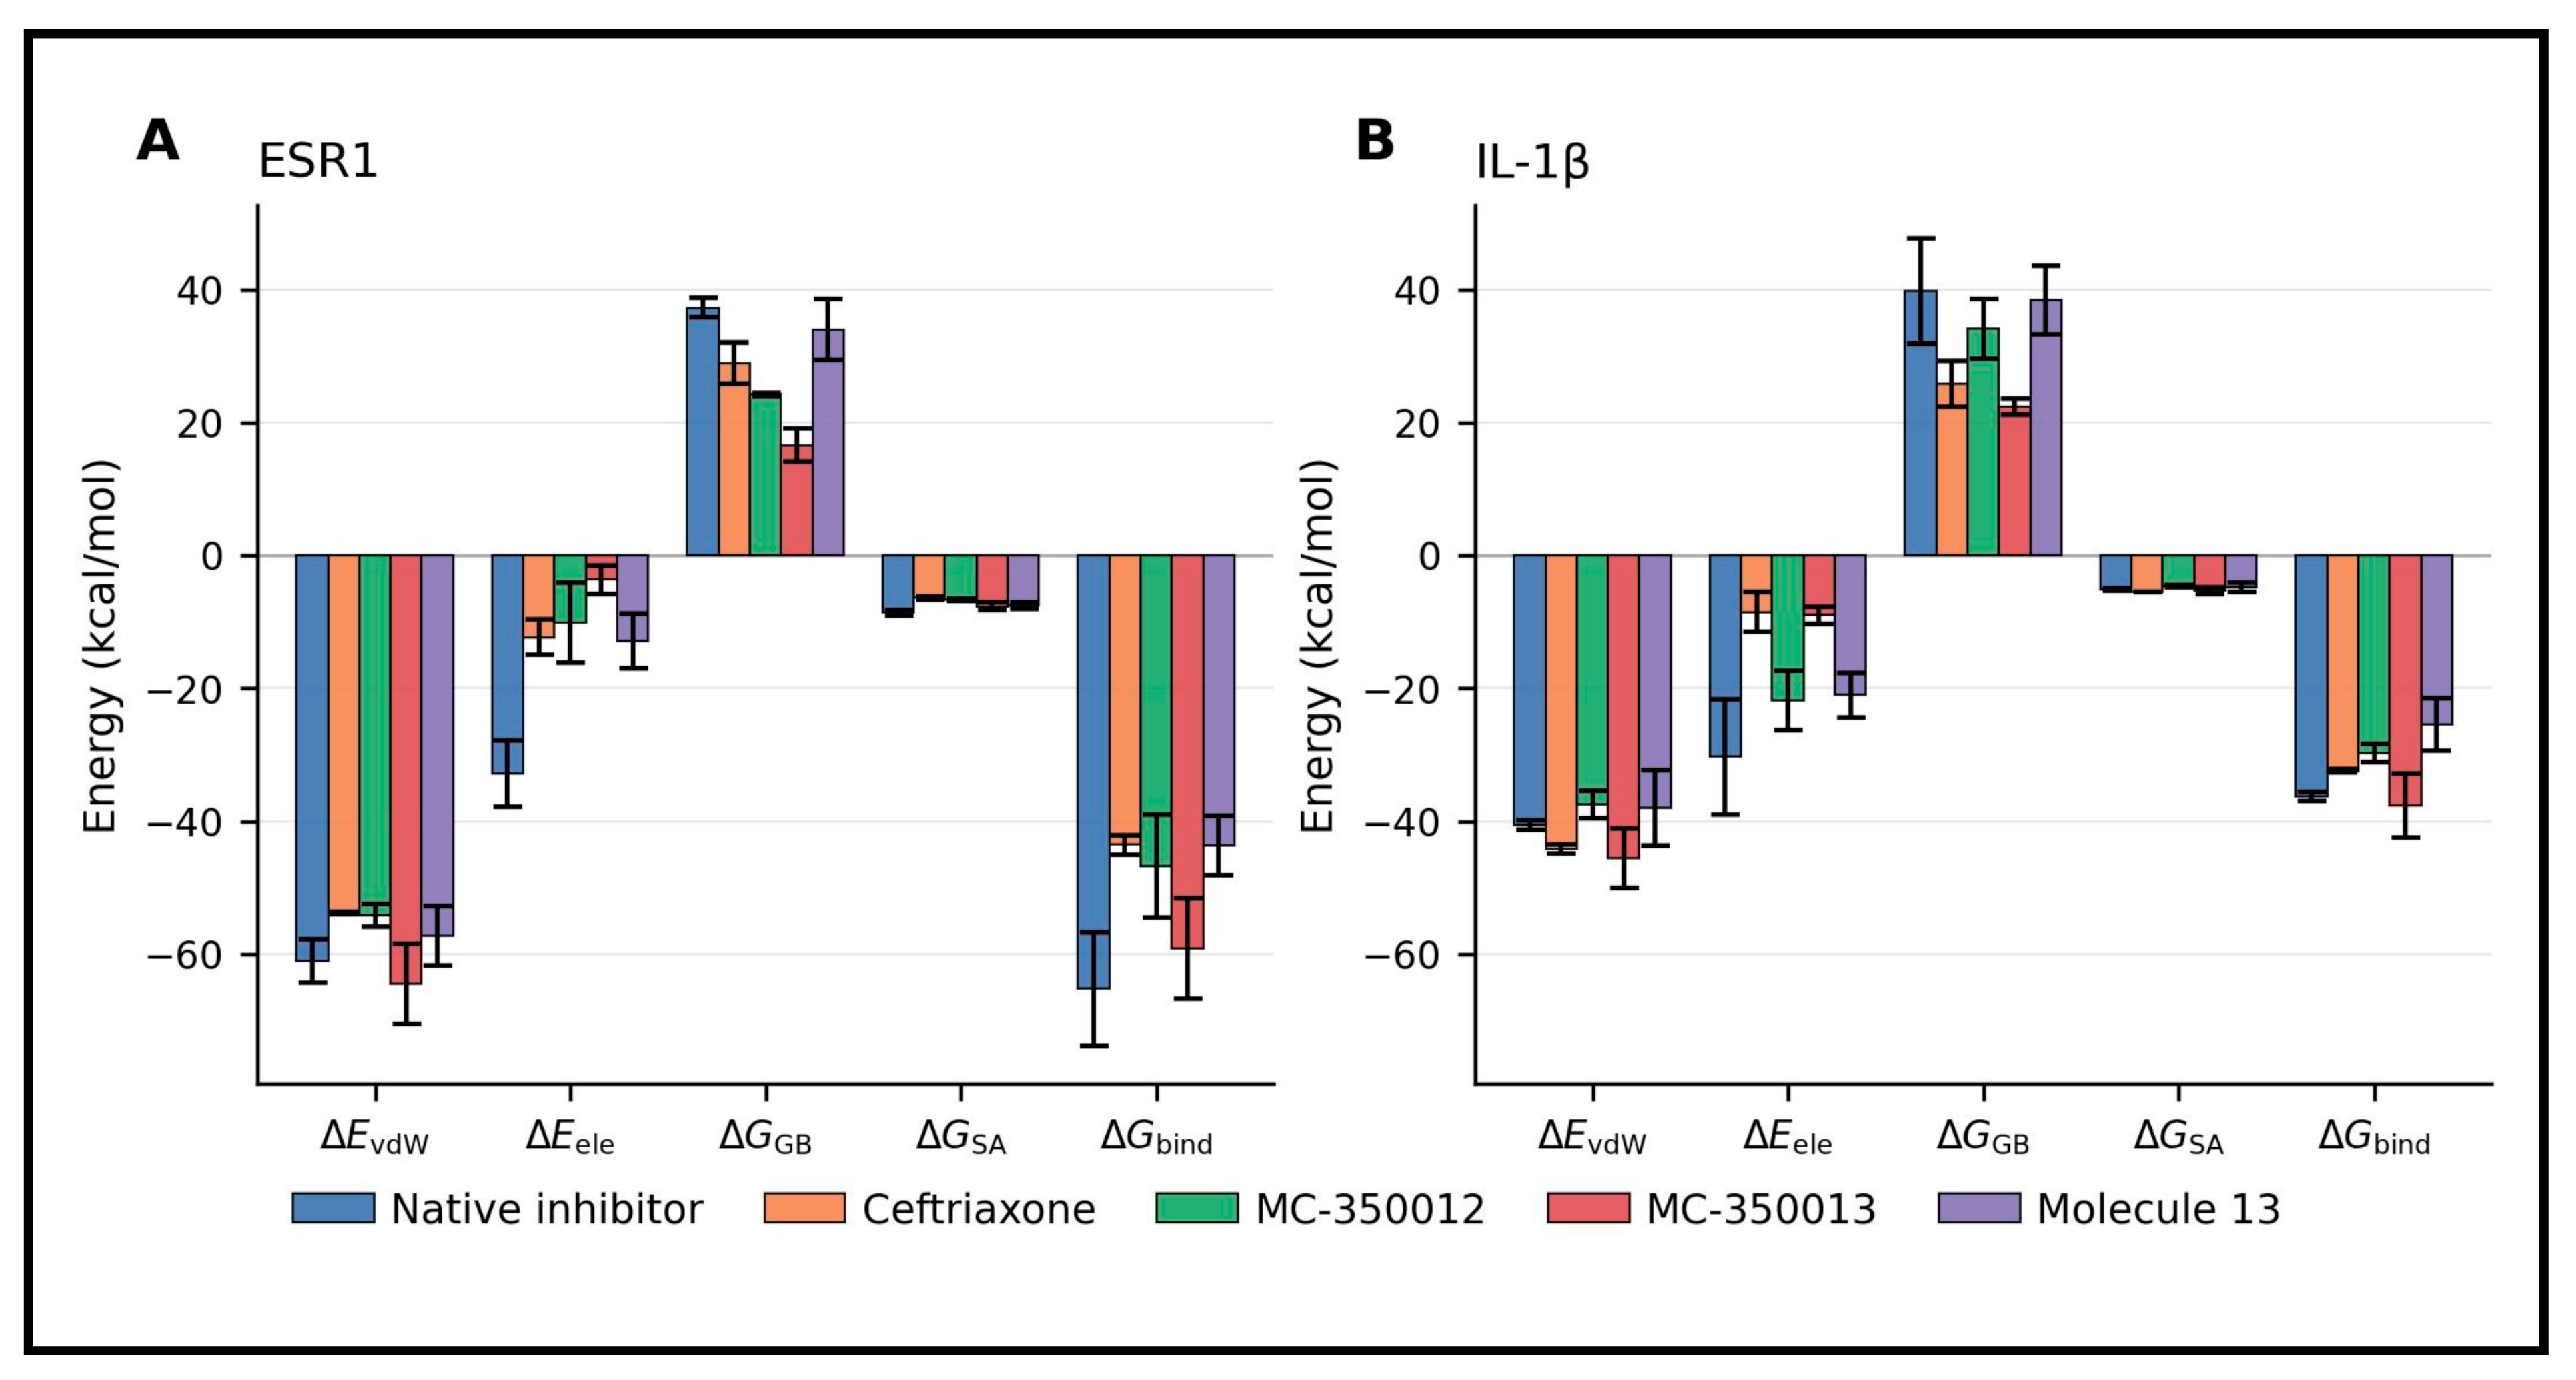
Figure 20.
Residue-wise MM/GBSA binding free energy decomposition analysis of ESR1 and IL-1β protein–ligand complexes using 200 snapshots per replicate, sampled every 10 frames from the 60–80 ns interval of each 100 ns molecular dynamics (MD) simulation. Heatmaps illustrate the mean energetic contributions of key binding-site residues in (A) ESR1 and (B) IL-1β complexes with native inhibitors, ceftriaxone, MC-350012, MC-350013, and Molecule 13. The color gradient represents the magnitude of residue-specific binding free energy contributions (kcal/mol), with blue indicating favorable negative contributions and red indicating unfavorable positive contributions. Numerical values within each cell represent the mean residue-wise energy contributions, while NA indicates residue-ligand combinations for which MM/GBSA energy contributions were not available.
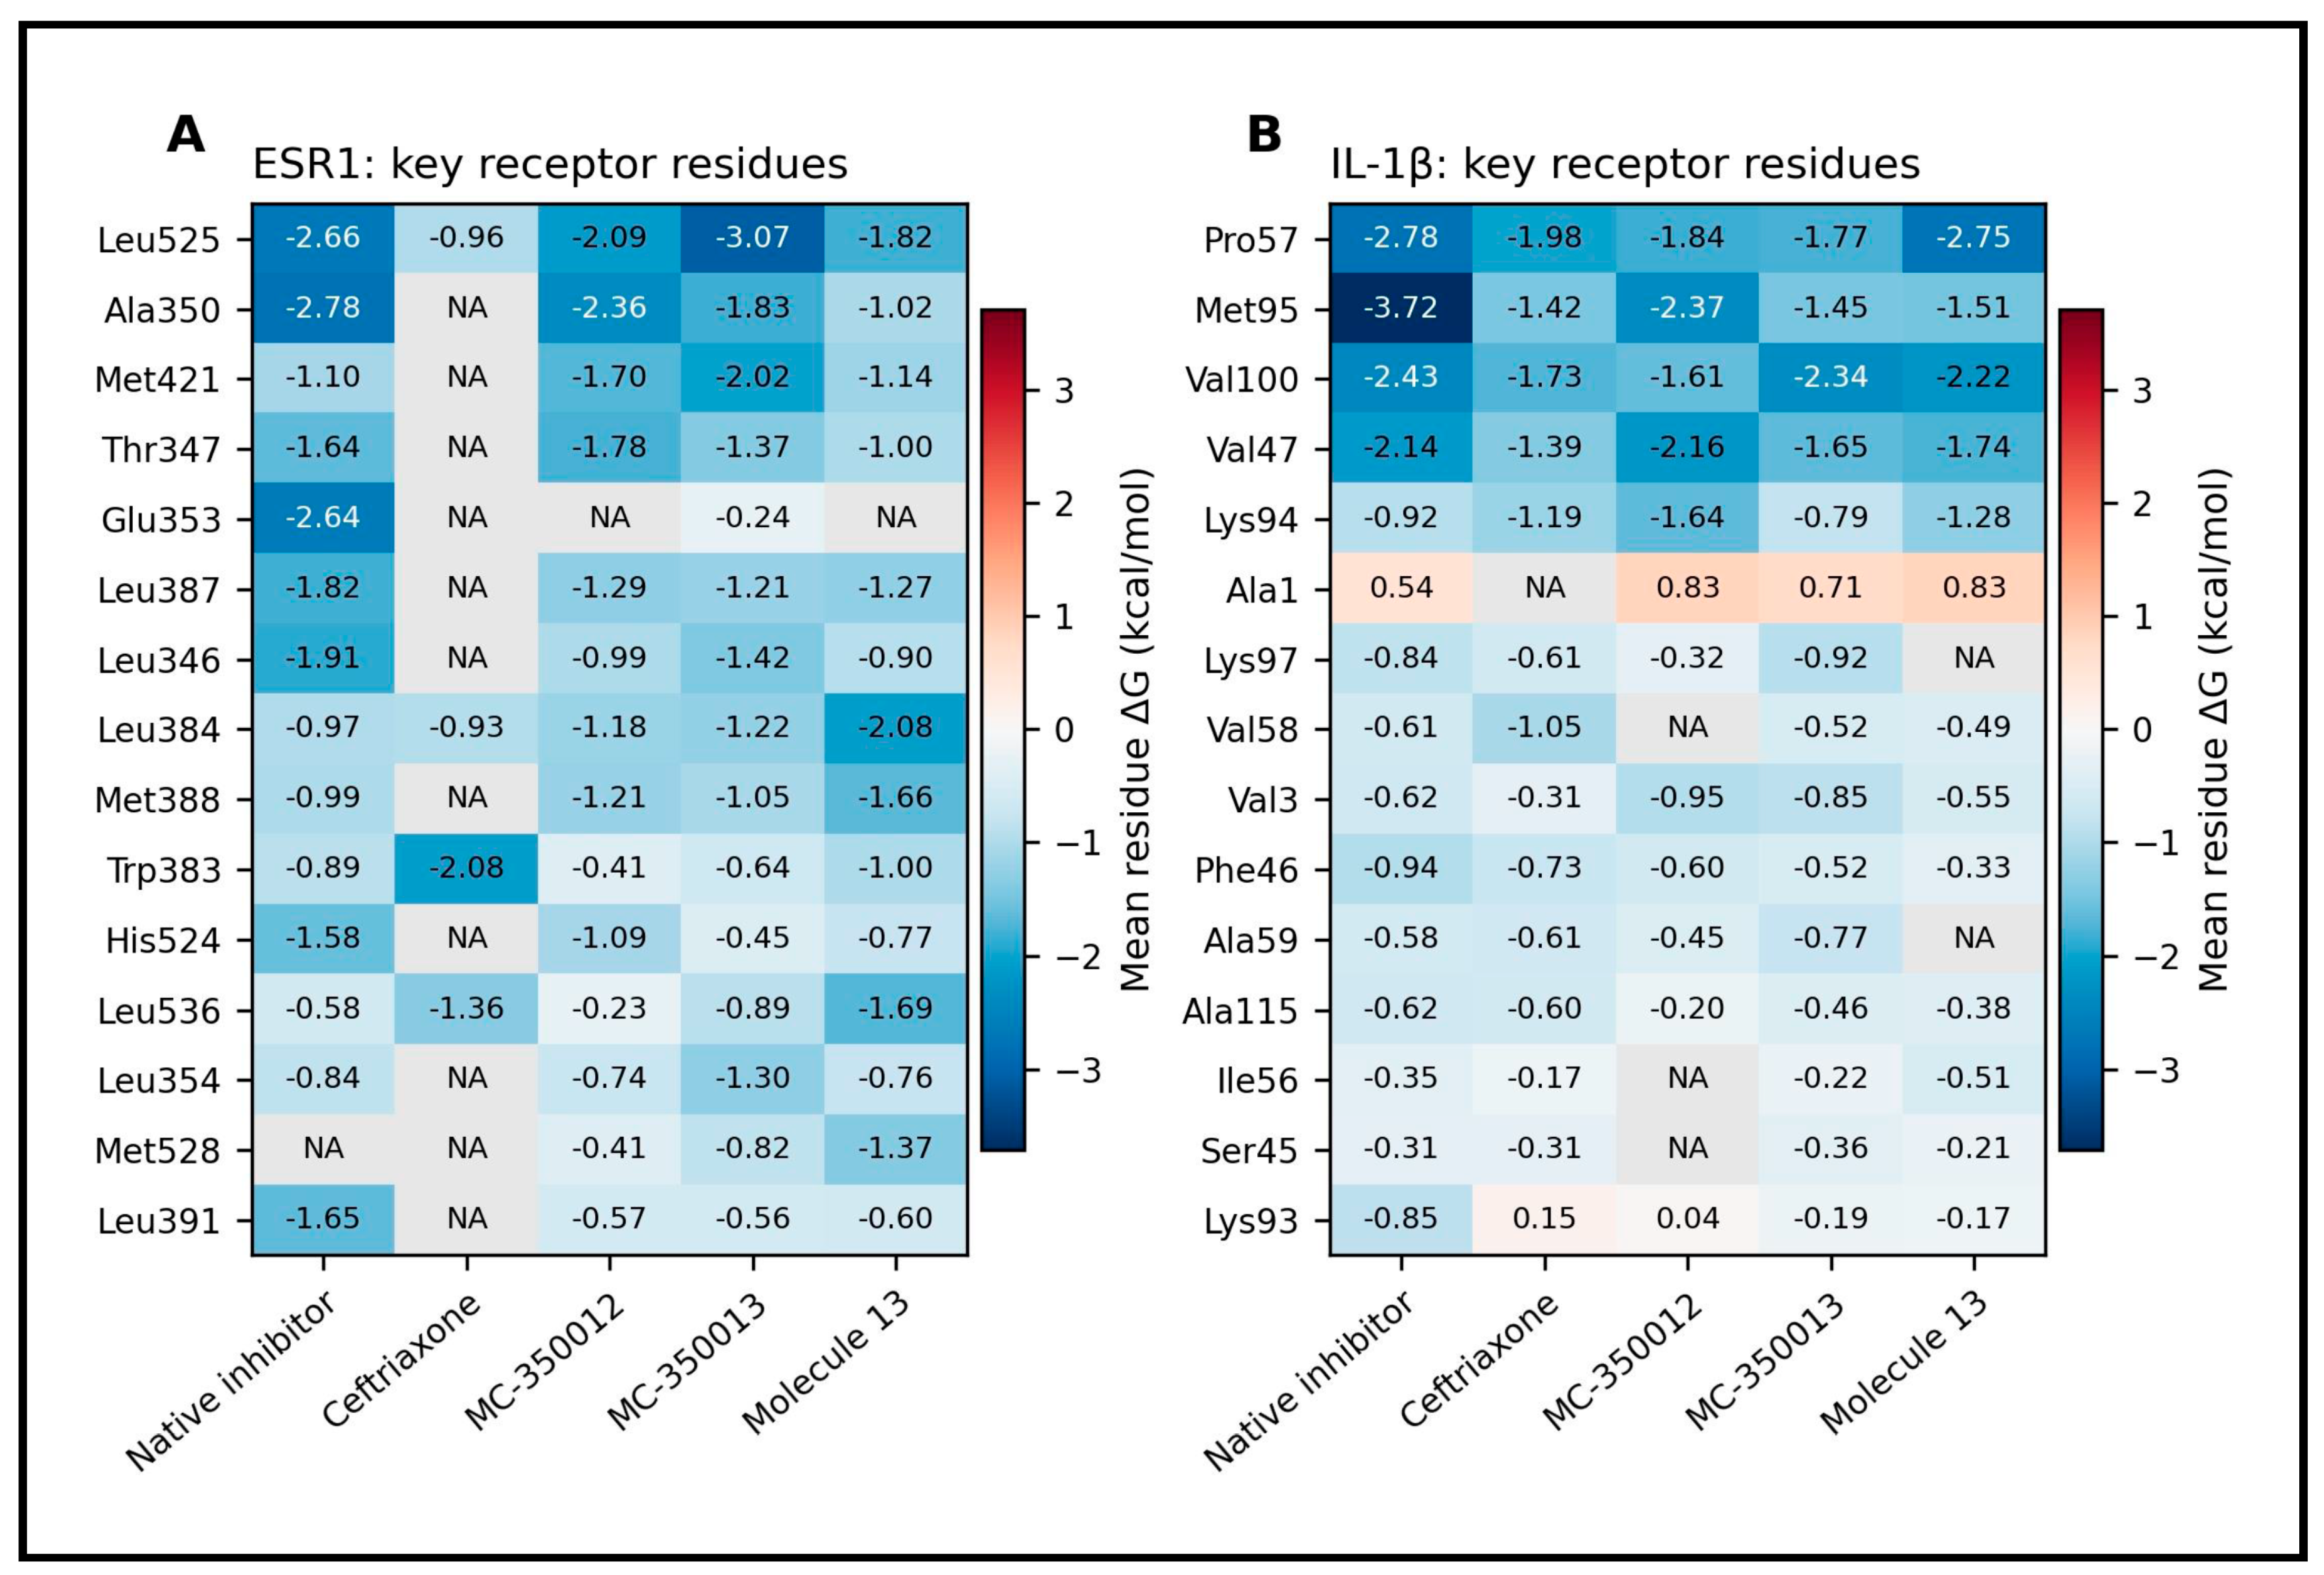
For ESR1 complexes, the major interactions of the native inhibitor involved Ala 350 (−2.78 kcal/mol), Leu 525 (−2.66 kcal/mol), Glu 353 (−2.64 kcal/mol), and Leu 346 (−1.91 kcal/mol). The Leu 525 residue contributed favorably to the calculated interaction energies of MC-350012, MC-350013, and molecule 13 with −2.09 kcal/mol, −3.07 kcal/mol, and −1.82 kcal/mol, respectively. Meanwhile, Trp 383 (−2.08 kcal/mol), Leu 536 (−1.36 kcal/mol), and Leu 525 (−0.96 kcal/mol) were among the main favorable contributors to the ceftriaxone complex (Figure 20A). Overall, the hydrophobic interactions may contribute to the predicted binding pose within the pocket. The residue-wise MM/GBSA binding free energy contributions of key amino acid residues in the ESR1 and IL-1β complexes are illustrated in Figure 21. MM/GBSA binding free energy and per-residue energy decomposition analysis of the compounds to the ESR1 and IL-1β are obtained (Supplementary Figures S6–S11).
Figure 21.
Residue-wise MM/GBSA binding free energy decomposition analysis of (A) ESR1 and (B) IL-1β complexes with native inhibitors, ceftriaxone, MC-350012, MC-350013, and Molecule 13 using 200 snapshots per replicate, sampled every 10 frames from the 60–80 ns interval of each 100 ns molecular dynamics (MD) simulation. The grouped bar plots illustrate the mean binding free energy contributions (kcal/mol) of key amino acid residues involved in protein–ligand interactions. Different colors represent the investigated ligands, while error bars indicate the standard deviation (SD) across three independent simulation replicates.
3.10. Principal Component Analysis
The conformational dynamics of target proteins in complex with compounds were evaluated using PCA. Based on the conformational trajectory, the first two principal components (PC1 and PC2) were derived, representing the collective motions contributing to the system’s structural variance. Principal component analysis of the ESR1 systems revealed that ligand binding significantly modulates the receptor’s essential subspace. The PC1 and PC2 collectively accounted for between 42.2% and 53.1% of the total conformational variance. The ESR1-native inhibitor and ESR1-ceftriaxone complexes exhibited the lowest overall mobility, with cumulative variances of 42.2 ± 5.4% and 43.0 ± 7.4%, respectively. In contrast, the ESR1-MC-350013 and ESR1-MC-350012 complexes displayed expanded structural flexibility, capturing 53.1% and 52.7% of the total variance, predominantly driven by an increase in the PC1 contribution. Notably, the ESR1-MC-350013 system demonstrated a highly stochastic dynamic profile, evidenced by a large standard deviation ±10.0 across the independent simulation replicates (Figure 22A).
Figure 22.
Principal component analysis (PCA) of essential dynamics for modeled protein–ligand complexes. The stacked bar charts illustrate the percentage of conformational variance captured by the first two principal components across various ligand-bound states for (A) estrogen receptor Alpha (ESR1) and (B) interleukin-1β. In both panels, the solid lower segments represent the individual variance contribution of the primary eigenvector (PC1), while the hatched upper segments indicate the variance contributed by the secondary eigenvector (PC2). Numerical annotations above the bars denote the mean cumulative variance explained by both components combined. Bottom error bars indicate the standard deviation for PC1 alone, and top error bars represent the standard deviation of the total cumulative variance across independent molecular dynamics replicates.
Evaluation of the IL-1β complexes demonstrated a generally lower degree of total conformational variance compared to the ESR1 systems, with cumulative PC1 and PC2 contributions ranging from 31.4% to 39.8%. The IL-1β-MC-350012 complex showed the highest overall essential dynamics (39.8 ± 8.0%), whereas the IL-1β-MC-350013 complex exhibited the most conformationally restricted state (31.4 ± 1.3%). Unlike its behavior in the ESR1 system, MC-350013 produced an exceptionally stable dynamic profile in IL-1β, indicated by the narrowest standard deviation among all simulated conditions. The IL-1β-native inhibitor complex maintained a relatively constrained structural state, capturing 33.3 ± 6.5% of the total variance (Figure 22B).
4. Discussion
There is no doubt that OUD is one of the biggest global health crises, not least because of its complex neurobiological basis and limited treatment options. Correspondingly, there is urgent demand for multi-target therapeutic strategies. This network pharmacology study took a systematic approach to exploring the potential associations between ceftriaxone-related targets and OUD overlapping genes. The first step was to identify targets related to the drug and disorder. By overlapping relevant gene sets, we found 10 genes that may represent a potential association between ceftriaxone and OUD. Using Cytoscape tools, five hub genes were prioritized based on their network centrality. Although SLC1A2 (GLT-1) is relevant to the investigated compounds as a GLT-1 modulator, GLT-1 ranked eighth in the CytoHubba analysis and was therefore not prioritized among the targets selected for docking. In addition, the interaction of MC-350013 and MC-350012 with GLT-1 had previously been examined in our in-silico study [33]. These genes may be associated with neuroinflammation, hormonal regulation, and neurotransmission. GO/KEGG enrichment analysis further identified related biological processes and pathways. Several biological process terms were enriched among the genes of interest, such as response to interleukin-1, astrocyte activation, and positive regulation of glial cell proliferation, which may be linked to inflammation. Key enriched pathways included cytokine-cytokine receptor interaction, MAPK signaling, and C-type lectin receptor signaling, which may suggest potential involvement of innate immune-related processes involved in the brain’s response to injury and/or infection [58]. In addition, the observed positive regulation of the ERK1 and ERK2 cascade may suggest the involvement of intracellular signaling mechanisms of glial proliferation and inflammatory response [59]. Activation of the immune system may explain the enrichment of multiple infection-related KEGG pathways, such as herpes simplex virus 1 and human cytomegalovirus (HCMV). Notably, among the identified candidate genes, EGFR, IL-1β, and TNF play crucial roles in host responses to viral infections (Supplementary Figures S12 and S13): EGFR is crucial for HCMV entry and latency, while IL-1β and TNF are key mediators of glial immune responses that help to control infection and inflammation [60,61].
These findings are in line with some of the previous studies that have reported links between immune response, neuroinflammation, and neurodegenerative diseases, such as Alzheimer’s disease (AD), in which similar genes were also identified as enriched (Supplementary Figure S14). It is becoming increasingly recognized that neuroinflammation is a major pathological feature of AD and may contribute to its progression. Microglial and astrocyte activation leads to the release of proinflammatory cytokines such as IL-1β and TNF-α, which impair neuroprotection and promote neurodegeneration [62]. In addition, chronic inflammation increases oxidative stress, synaptic damage, and eventually neural death as it stimulates pathways such as NF-kB, p38 MAPK, Akt/mTOR, caspase, and COX [63]. Inflammation is also linked to glutamatergic dysfunction, as abnormalities in GLT-1 function impair glutamate clearance, thereby causing excitotoxicity, which is implicated in both OUD and AD [64]. This provides a biological context for considering GLT-1 alongside the identified pathways; however, the present study did not investigate or establish a direct mechanistic relationship between GLT-1 and the prioritized proteins. Finally, the Biological Process terms identified as enriched, including learning and memory, may point to the involvement of genes related to neuroplasticity and cognitive function in the setting of OUD. These processes are often disrupted by inflammatory and neurodegenerative conditions [63,65]. Regarding EGFR, its potential relevance in the context of opioid exposure has been explored in previous studies. EGFR signaling may contribute to neuroadaptations associated with OUD, particularly those related to chronic use; preclinical evidence indicates that EGFR activation promotes morphine tolerance by altering μ-opioid receptor signaling and potentially enhancing NMDAR activity, whereas EGFR inhibition can restore morphine analgesic efficacy [66]. Moreover, morphine-induced activation of the EGFR/ERK pathway promotes microglial activation, which contributes to pro-inflammatory release, further contributing to morphine tolerance [35].
A fourth candidate gene, ESR1, is involved in estrogen signaling, which may modulate reward processing, particularly in the nucleus accumbens [67]. The role of estrogen receptors in addiction is complex. In preclinical studies, estradiol has been shown to decrease substance self-administration and increase dependence-like symptoms. There is evidence that estradiol enhances dopamine neurotransmission through the estrogen receptors ERα and ERβ; for instance, ERα overexpression has been found to increase GABA release and dopamine signaling in response to estradiol, which can influence cocaine-seeking behaviors [68]. In addition, the affinity of dopamine receptor D2 (DRD2) fluctuates throughout the estrous cycle, further illustrating estrogen’s dynamic role in modulating reward sensitivity [68]. Estradiol has further been shown to modulate behavioral responses to substance abuse, which implies that it directly affects genes involved in reward circuitry [69]. Female rats self-administer less heroin during proestrus, when estradiol levels are high. In ovariectomized (OVX) rodents, replacing estradiol can either suppress or enhance drug-seeking behavior depending on dose and model, with moderate morphine doses (10 mg/kg) causing estradiol to suppress conditioned place preference, whereas lower doses enhance opioid reward. Estradiol replacement in OVX rats has been shown to accelerate acquired opioid self-administration and amplify sensitivity to opioid-associated cues, similar to psychostimulant and alcohol effects. Nonetheless, studies on OVX and opioids in rodents overall remain mixed, with some reporting no significant effects of OVX on rat opioid self-administration models [69] and other studies involving selective estrogen receptor modulators (SERMs) reporting a protective effect against inflammation and excitotoxicity [37,70]. In the present work, we chose a SERM, compound 19, as a docking ligand; it has been reported that it may reduce addiction-related neurotoxicity through suppressing neuroinflammation and excitotoxicity [37]. Several studies in models of neurodegenerative diseases have shown SERMs to reduce neural damage, neural trauma, and brain inflammation [37]. These compounds exert anti-inflammatory effects through estrogen receptors like ESR1 or through estrogen-independent pathways via MAPK, CREB, NF-KB, and PI3K/Akt, which promote antioxidation, anti-inflammation, neuron survival, and anti-apoptosis, as well as prevent excitotoxicity [37,71]. Although ALB emerged as a prioritized protein, its role should be interpreted cautiously. Previous studies have reported reduced serum albumin levels in individuals with heroin dependence, mostly with prolonged use [72,73]. In addition, albumin can bind and transport opioids such as fentanyl and morphine [74]. Therefore, the identification of ALB in the network may reflect alterations associated with chronic use of opioids and its role in drug transport and distribution rather than a direct therapeutic mechanism in OUD. However, these enrichment findings should be interpreted with caution, as they were derived from a small set of 10 overlapping genes. Although several GO terms and KEGG pathways met the raw p-value threshold, most did not remain statistically significant after Benjamini correction for multiple testing. Therefore, these enrichment results should be regarded as exploratory and hypothesis-generating rather than as independent biological confirmation. In addition, this network provides a simplified representation of biological relationships and may not fully capture the dynamic, context-dependent regulation of the identified targets. Their expression and functional relevance may also vary across cellular conditions and be influenced by regulatory and epigenetic mechanisms. A further limitation is that the identification of ceftriaxone-associated targets and OUD-associated genes relied on heterogeneous databases with different data sources and evidence criteria. Therefore, the identified overlaps and associations should be considered computationally prioritized associations rather than experimentally established functional targets.
Molecular docking analysis revealed that all selected compounds (MC-350013, MC-350012, ceftriaxone, and its analog) show favorable docking scores toward IL-1β and ESR1, suggesting potential prediction interactions with these proteins. Ceftriaxone has been observed to reduce TNF-α and/or IL-1β in various models, including fentanyl overdose mice, cerebral hypoperfusion rats, and Parkinson’s disease mice [16,34,75]. The anti-inflammatory role of β-lactam derivatives is likewise supported by prior findings regarding MC-100093, which suppresses ethanol-induced TNF-α upregulation [20]. In the present work, 2D interaction analysis of the selected compounds with IL-1β and TNF-α revealed predicted interactions patterns consistent with previously reported interaction profiles. For instance, when interacting with IL-1β, ceftriaxone formed multiple hydrogen bonds with residues (Lys 94, Lys 93, Lys 92, and Asn 102) that were also supported by hydrophobic and van der Waals interactions with Val 47, Val 100, and Pro 118. MC-350012 and MC-350013 likewise interacted via hydrogen bonding with Lys 94, while molecule 13 exhibited additional interactions with Lys 55, Lys 93, Lys 94, and Met 95; hydrophobic contacts involving Pro 57, Val 47, and Val 3; and van der Waals interactions with Phe 46 and Lys 97. A number of the interacting residues (Phe 46, Val 47, Lys 97, Met 95, Lys 92–94) have similarly been reported in the binding profile of the known IL-1β inhibitor T9C [76]; some, particularly Lys 92–94 and Phe 46, are located within site B, which is the region responsible for interaction with 1L-1R [76,77]. For interactions with TNF-α, the residues Ser 60, Leu 57, Gln 61, Tyr 59, Tyr 119, Gly 121, Leu 120, Gly 122, Tyr 151, Val 123, and Leu 157 are known to feature in inhibitor binding and stabilization [76,78], with Tyr 119 playing a particularly crucial role in ligand accommodation and stabilization at the dimer interface [78]. The predicted interaction pattern in our study was consistent with those previously reported for TNF-α inhibitors, suggesting that our compounds may exhibit similar predicted interactions with TNF-α [76,78].
Our docking data also indicate favorable predicted interactions of the tested compounds with ESR1 (ERα), consistent with previously reported findings on β-lactam compounds that modulate estrogen receptors. For example, β-lactam compounds 23 and 26 described by O’Boyle et al. and Meegan et al. demonstrated high docking scores for ERα and ERβ along with potent antiproliferative activity against MCF-7 breast cancer cells [79,80]. Our analysis revealed that of the compounds examined, MC-350012 and MC-350013 form predicted interactions with several residues previously reported to be involved in ERα antagonist binding, including Asp 351, Thr 347, Leu 346, Phe 404, Leu 387, His 524, Gly 521, Trp 383, Cys 530, and Leu 536 [81,82].
Overall, the investigated compounds exhibited predicted interactions involving hydrogen bonds and hydrophobic contacts, similar to those observed with SERMs. The interaction profile of molecule 13 resembled that of a novel synthetic GLT-1 modulator, suggesting a potentially comparable binding mode, whereas ceftriaxone interacted with Leu 525, Cys 530, Leu 536, and Lys 531. These findings suggest that novel synthetic GLT-1 enhancers may exhibit a predicted interaction profile similar to that of SERMs. No direct studies have reported the effects of ceftriaxone specifically on EGFR; however, emerging evidence indicates that in general, suppressing EGFR provides multiple neuroprotective benefits. EGFR inhibitors have demonstrated improvements in pathological and behavioral outcomes [83]. Mechanistically, inhibition of EGFR reduces astrogliosis following injury, stimulates remyelination, and limits the release of inhibitory molecules in astrocytes, while enhancing axonal growth by stimulating neurotrophic factors [84].
The MD simulation and MM/GBSA analysis further characterized the interaction behavior and calculated binding energetics of the studied compounds with target proteins. For IL-1β, ceftriaxone and MC-350013 exhibited relatively consistent RMSD profiles, whereas MC-350012 and molecule 13 showed greater fluctuations. Ceftriaxone also maintained frequent protein–ligand contacts and hydrogen-bond interactions. For ESR1, ceftriaxone exhibited relatively consistent RMSD behavior and a high number of hydrogen bonds, while MC-350012 and MC-350013 demonstrated substantial protein–ligand contact frequencies throughout the simulations. RMSF analysis revealed similar fluctuation patterns across the investigated complexes, with variations in peak amplitudes. The native inhibitor showed relatively consistent COM distance profiles and persistent molecular interaction throughout the simulations. The MM/GBSA analysis showed differences in the calculated binding energetics among the tested compounds, with MC-350013 showing the lowest calculated MM/GBSA energy values for IL-1β and ESR1, at −37.604 ± 4.84 kcal/mol and −59.154 ± 7.63 kcal/mol, respectively, among the tested compounds, while the native inhibitor showed a lower calculated binding free energy value than MC-350013 for ESR1. The van der Waals and electrostatic interactions involving the residues contributed to the energetic profile of these complexes. The PCA showed conformational patterns that were consistent with these observations, reflecting differences in conformational sampling among the investigated complexes. Although the native inhibitor showed more persistent H-bond interactions and relatively consistent conformational behavior during the simulation, MC-350013 nevertheless showed a favorable calculated binding energy profile and relatively consistent conformational behavior during the simulation. This may suggest that hydrogen bond persistence may not fully reflect the interaction behavior of the investigated compounds. However, the differences in the calculated MM/GBSA binding energies should be interpreted cautiously, considering the variability across the three simulation replicates and the approximate nature of these estimates.
Although these findings are intriguing, the computational analyses alone can only indicate potential binding, and the true functional activity of these compounds must be confirmed by experimental validation. Further in vitro and in vivo studies are needed to evaluate the neuroprotective potential of these candidate compounds, along with their clinical potential. Nonetheless, based on their predicted interactions with genes and pathways associated with inflammation, immune signaling, and hormonal responses, ceftriaxone, its analogs, and the investigated novel synthetic GLT-1 modulators may represent candidates for further experimental investigation in OUD.
In conclusion, through the integration of network pharmacology, functional enrichment, and molecular docking analyses, the current study provides a preliminary computational evidence regarding the potential molecular interactions and target genes that may be associated with ceftriaxone and novel synthetic GLT-1 enhancers in opioid use disorder. Compared with β-lactam compounds such as ceftriaxone, MC-100093, and MC-290401, the novel compounds MC-350013 and MC-350012 showed distinct computational profiles across docking and simulation analyses. These novel GLT-1 modulators warrant further experimental investigation to evaluate the computationally predicted interactions and their biological relevance in OUD.
Supplementary Materials
The following supporting information can be downloaded at: https://www.mdpi.com/article/10.3390/cimb48111231/s1.
Author Contributions
R.S.A.: methodology, data curation, software, formal analysis, validation, investigation, writing—original draft preparation, and writing—review and editing. F.A. (Faizul Azam), M.M.A., Q.H.A., H.H.A., S.T.B. and A.F.A.: data curation, software, formal analysis, and writing—review and editing. Y.S., W.E.C., M.A.-G. and T.A.: Investigation, validation, resources, and writing—review and editing. F.A. (Fawaz Alasmari): conceptualization, methodology, data curation, software, formal analysis, visualization, validation, project administration, resources, funding acquisition, supervision, writing—original draft preparation, and writing—review and editing. All authors have read and agreed to the published version of the manuscript.
Funding
This work was supported by the ongoing research funding program, (ORF-2026-235), King Saud University, Riyadh, Saudi Arabia.
Institutional Review Board Statement
This study was based exclusively on the secondary computational analysis of previously published research and publicly available databases. No new experiments involving human participants or animals were conducted, and no identifiable personal information was collected or processed. The study was conducted with consideration of the Law of Ethics of Research on Living Creatures (Royal Decree No. M/59, Saudi Arabia) and its Implementing Regulations.
Informed Consent Statement
This study involved only secondary analysis of previously published, publicly available, and non-identifiable data, without direct involvement of human participants. In accordance with the Law of Ethics of Research on Living Creatures (Royal Decree No. M/59, Saudi Arabia) and its Implementing Regulations, informed consent was not required because the study used only existing, publicly available, and non-identifiable data and involved no direct participation by human subjects.
Data Availability Statement
The original contributions presented in this study are included in the article and its Supplementary Materials. The protein structures with the selected docked ligand poses are available from the corresponding author upon reasonable request. Further inquiries can be directed to the corresponding author.
Conflicts of Interest
The authors declare no conflicts of interest.
References
- Herlinger, K.; Lingford-Hughes, A. Opioid use disorder and the brain: A clinical perspective. Addiction 2022, 117, 495–505. [Google Scholar] [CrossRef] [Scilit] [PubMed]
- Szpak, V.; Suzuki, J.; Wiers, R.W.; Freichel, R. A network perspective on heroin use: Associations between craving, withdrawal symptoms, dependence, loss of control, and psychosocial consequences. Addict. Behav. 2025, 169, 108400. [Google Scholar] [CrossRef] [Scilit] [PubMed]
- World Health Organization. Opioid Overdose. Available online: https://www.who.int/news-room/fact-sheets/detail/opioid-overdose#:~:text=Worldwide%2C%20about%20296%20million%20people,disorders%20in%202021(2) (accessed on 21 August 2025).
- Belfiore, C.I.; Galofaro, V.; Cotroneo, D.; Lopis, A.; Tringali, I.; Denaro, V.; Casu, M. A Multi-Level Analysis of Biological, Social, and Psychological Determinants of Substance Use Disorder and Co-Occurring Mental Health Outcomes. Psychoactives 2024, 3, 194–214. [Google Scholar] [CrossRef] [Scilit]
- Levis, S.C.; Mahler, S.V.; Baram, T.Z. The Developmental Origins of Opioid Use Disorder and Its Comorbidities. Front. Hum. Neurosci. 2021, 15, 601905. [Google Scholar] [CrossRef] [Scilit] [PubMed]
- Dydyk, A.M.; Jain, N.K.; Gupta, M. Opioid Use Disorder: Evaluation and Management. In StatPearls; StatPearls Publishing LLC.: Treasure Island, FL, USA, 2025. [Google Scholar]
- Puig, S.; Xue, X.; Salisbury, R.; Shelton, M.A.; Kim, S.M.; Hildebrand, M.A.; Glausier, J.R.; Freyberg, Z.; Tseng, G.C.; Yocum, A.K.; et al. Circadian rhythm disruptions associated with opioid use disorder in the synaptic proteomes of the human dorsolateral prefrontal cortex and nucleus accumbens. bioRxiv 2023, 28, 4777–4792. [Google Scholar] [CrossRef] [Scilit] [PubMed]
- Thompson, B.L.; Oscar-Berman, M.; Kaplan, G.B. Opioid-induced structural and functional plasticity of medium-spiny neurons in the nucleus accumbens. Neurosci. Biobehav. Rev. 2021, 120, 417–430. [Google Scholar] [CrossRef] [Scilit] [PubMed]
- Xue, X.; Zong, W.; Glausier, J.R.; Kim, S.M.; Shelton, M.A.; Phan, B.N.; Srinivasan, C.; Pfenning, A.R.; Tseng, G.C.; Lewis, D.A.; et al. Molecular rhythm alterations in prefrontal cortex and nucleus accumbens associated with opioid use disorder. Transl. Psychiatry 2022, 12, 123. [Google Scholar] [CrossRef] [Scilit] [PubMed]
- Sari, Y.; Swiss, G.M.; Alrashedi, F.A.; Baeshen, K.A.; Alshammari, S.A.; Alsharari, S.D.; Ali, N.; Alasmari, A.F.; Alhoshani, A.; Alameen, A.A. Effects of novel beta-lactam, MC-100093, and ceftriaxone on astrocytic glutamate transporters and neuroinflammatory factors in nucleus accumbens of C57BL/6 mice exposed to escalated doses of morphine. Saudi Pharm. J. 2024, 32, 102108. [Google Scholar] [CrossRef] [Scilit] [PubMed]
- Alzu’bi, A.; Baker, W.B.; Al-Trad, B.; Zoubi, M.S.A.; AbuAlArjah, M.I.; Abu-El-Rub, E.; Tahat, L.; Helaly, A.M.; Ghorab, D.S.; El-Huneidi, W.; et al. The impact of chronic fentanyl administration on the cerebral cortex in mice: Molecular and histological effects. Brain Res. Bull. 2024, 209, 110917. [Google Scholar] [CrossRef] [Scilit] [PubMed]
- Feng, J.; Xu, N.; Wang, L.; Wang, H.; Zhou, Y.; Shen, Q. Synaptic Structure and Transcriptomic Profiling of Reward and Sensory Brain Areas in Male Mice of Fentanyl Addiction. Subst. Abuse Rehabil. 2024, 15, 233–245. [Google Scholar] [CrossRef] [Scilit] [PubMed]
- Kosten, T.R.; George, T.P. The neurobiology of opioid dependence: Implications for treatment. Sci. Pract. Perspect. 2002, 1, 13–20. [Google Scholar] [CrossRef] [Scilit] [PubMed]
- Leventelis, C.; Veskoukis, A.S.; Rojas Gil, A.P.; Papadopoulos, P.; Garderi, M.; Angeli, A.; Kampitsi, A.; Tsironi, M. Methadone and Buprenorphine as Medication for Addiction Treatment Diversely Affect Inflammation and Craving Depending on Their Doses. Pharmacy 2025, 13, 40. [Google Scholar] [CrossRef] [Scilit] [PubMed]
- Cao, D.N.; Li, F.; Wu, N.; Li, J. Insights into the mechanisms underlying opioid use disorder and potential treatment strategies. Br. J. Pharmacol. 2023, 180, 862–878. [Google Scholar] [CrossRef] [Scilit] [PubMed]
- Alasmari, M.S.; Alasmari, F.; Alsharari, S.D.; Alasmari, A.F.; Ali, N.; Ahamad, S.R.; Alghamdi, A.M.; Kadi, A.A.; Hammad, A.M.; Ali, Y.S.M.; et al. Neuroinflammation and Neurometabolomic Profiling in Fentanyl Overdose Mouse Model Treated with Novel β-Lactam, MC-100093, and Ceftriaxone. Toxics 2024, 12, 604. [Google Scholar] [CrossRef] [Scilit] [PubMed]
- Sondheimer, I.; Knackstedt, L.A. Ceftriaxone prevents the induction of cocaine sensitization and produces enduring attenuation of cue- and cocaine-primed reinstatement of cocaine-seeking. Behav. Brain Res. 2011, 225, 252–258. [Google Scholar] [CrossRef] [Scilit] [PubMed]
- Sari, Y.; Toalston, J.E.; Rao, P.S.S.; Bell, R.L. Effects of ceftriaxone on ethanol, nicotine or sucrose intake by alcohol-preferring (P) rats and its association with GLT-1 expression. Neuroscience 2016, 326, 117–125. [Google Scholar] [CrossRef] [Scilit] [PubMed]
- Knackstedt, L.A.; Wu, L.; Rothstein, J.; Vidensky, S.; Gordon, J.; Ramanjulu, M.; Dunman, P.; Blass, B.; Childers, W.; Abou-Gharbia, M. MC-100093, a Novel β-Lactam Glutamate Transporter-1 Enhancer Devoid of Antimicrobial Properties, Attenuates Cocaine Relapse in Rats. J. Pharmacol. Exp. Ther. 2021, 378, 51–59. [Google Scholar] [CrossRef] [Scilit] [PubMed]
- Travaglianti, S.; Alotaibi, A.; Wong, W.; Abou-Gharbia, M.; Childers, W.; Sari, Y. Effects of novel GLT-1 modulator, MC-100093, on neuroinflammatory and neurotrophic biomarkers in mesocorticolimbic brain regions of male alcohol preferring rats exposed chronically to ethanol. Brain Res. Bull. 2024, 211, 110935. [Google Scholar] [CrossRef] [Scilit] [PubMed]
- Saima, N.; Latha, S.; Sharma, R.; Kumar, A. Role of Network Pharmacology in Prediction of Mechanism of Neuroprotective Compounds. Methods Mol. Biol. 2024, 2761, 159–179. [Google Scholar] [CrossRef] [Scilit] [PubMed]
- Hu, M.; Yan, H.; Li, H.; Feng, Y.; Sun, W.; Ren, Y.; Ma, L.; Zeng, W.; Huang, F.; Jiang, Z.; et al. Use of network pharmacology and molecular docking to explore the mechanism of action of curcuma in the treatment of osteosarcoma. Sci. Rep. 2023, 13, 9569. [Google Scholar] [CrossRef] [Scilit] [PubMed]
- Sakuludomkan, C.; Khowsathit, J.; Thippraphan, P.; Koonrungsesomboon, N.; Takuathung, M.N.; Taychaworaditsakul, W. Network Pharmacology and Molecular Docking-Based Approach to Explore Potential Bioactive Compounds from Kaempferia parviflora on Chemokine Signaling Pathways in the Treatment of Psoriasis Disease. Int. J. Mol. Sci. 2025, 26, 5243. [Google Scholar] [CrossRef] [Scilit] [PubMed]
- Liu, X.; Ouyang, S.; Yu, B.; Liu, Y.; Huang, K.; Gong, J.; Zheng, S.; Li, Z.; Li, H.; Jiang, H. PharmMapper server: A web server for potential drug target identification using pharmacophore mapping approach. Nucleic Acids Res. 2010, 38, W609–W614. [Google Scholar] [CrossRef] [Scilit] [PubMed]
- Harel, A.; Inger, A.; Stelzer, G.; Strichman-Almashanu, L.; Dalah, I.; Safran, M.; Lancet, D. GIFtS: Annotation landscape analysis with GeneCards. BMC Bioinform. 2009, 10, 348. [Google Scholar] [CrossRef] [Scilit] [PubMed]
- Seney, M.L.; Kim, S.-M.; Glausier, J.R.; Hildebrand, M.A.; Xue, X.; Zong, W.; Wang, J.; Shelton, M.A.; Phan, B.N.; Srinivasan, C. Transcriptional alterations in dorsolateral prefrontal cortex and nucleus accumbens implicate neuroinflammation and synaptic remodeling in opioid use disorder. Biol. Psychiatry 2021, 90, 550–562. [Google Scholar] [CrossRef] [Scilit] [PubMed]
- Chen, C.; Guo, Q.; Tang, Y.; Qu, W.; Zuo, J.; Ke, X.; Song, Y. Screening and evaluation of the role of immune genes of brain metastasis in lung adenocarcinoma progression based on the TCGA and GEO databases. J. Thorac. Dis. 2021, 13, 5016–5034. [Google Scholar] [CrossRef] [Scilit] [PubMed]
- Wu, Y.; Luo, J.; Xu, B. Network pharmacology and bioinformatics to identify the molecular mechanisms of Gleditsiae Spina against colorectal cancer. Curr. Res. Toxicol. 2023, 5, 100139. [Google Scholar] [CrossRef] [Scilit] [PubMed]
- Dashti, S.; Taheri, M.; Ghafouri-Fard, S. An in-silico method leads to recognition of hub genes and crucial pathways in survival of patients with breast cancer. Sci. Rep. 2020, 10, 18770. [Google Scholar] [CrossRef] [Scilit] [PubMed]
- Sadia, H.; Qureshi, I.Z.; Naveed, M.; Aziz, T.; Alharbi, M.; Alasmari, A.F.; Albekairi, T.H. Natural AI-based drug designing by modification of ascorbic acid and curcumin to combat buprofezin toxicity by using molecular dynamics study. Sci. Rep. 2024, 14, 28445. [Google Scholar] [CrossRef] [Scilit] [PubMed]
- Daina, A.; Michielin, O.; Zoete, V. SwissADME: A free web tool to evaluate pharmacokinetics, drug-likeness and medicinal chemistry friendliness of small molecules. Sci. Rep. 2017, 7, 42717. [Google Scholar] [CrossRef] [Scilit] [PubMed]
- Azam, F.; Almahmoud, S.A. Open-Source Molecular Docking and AI-Augmented Structure-Based Drug Design: Current Workflows, Challenges, and Opportunities. Int. J. Mol. Sci. 2026, 27, 3302. [Google Scholar] [CrossRef] [Scilit] [PubMed]
- Alsikhan, R.S.; Alshehri, M.M.; Alqahtani, Q.H.; Alanazi, M.M.; Mohammed, A.S.; AlAsmari, A.F.; Sari, Y.; Childers, W.E.; Abou-Gharbia, M.; Alkhelb, D. MC-350013 and Corylin Emerge as Promising Neuroprotective Agents through Dual Targeting of xCT and GLT-1. J. Mol. Neurosci. 2026, 76, 29. [Google Scholar] [CrossRef] [Scilit] [PubMed]
- Sattayakhom, A.; Kalarat, K.; Rakmak, T.; Tapechum, S.; Monteil, A.; Punsawad, C.; Palipoch, S.; Koomhin, P. Effects of Ceftriaxone on Oxidative Stress and Inflammation in a Rat Model of Chronic Cerebral Hypoperfusion. Behav. Sci. 2022, 12, 287. [Google Scholar] [CrossRef] [Scilit] [PubMed]
- Yang, Y.; Sun, Y.; Hu, R.; Yan, J.; Wang, Z.; Li, W.; Jiang, H. Morphine promotes microglial activation by upregulating the EGFR/ERK signaling pathway. PLoS ONE 2021, 16, e0256870. [Google Scholar] [CrossRef] [Scilit] [PubMed]
- Stamos, J.; Sliwkowski, M.X.; Eigenbrot, C. Structure of the epidermal growth factor receptor kinase domain alone and in complex with a 4-anilinoquinazoline inhibitor. J. Biol. Chem. 2002, 277, 46265–46272. [Google Scholar] [CrossRef] [Scilit] [PubMed]
- Arevalo, M.A.; Santos-Galindo, M.; Lagunas, N.; Azcoitia, I.; Garcia-Segura, L.M. Selective estrogen receptor modulators as brain therapeutic agents. J. Mol. Endocrinol. 2011, 46, R1–R9. [Google Scholar] [CrossRef] [Scilit] [PubMed]
- Hommel, U.; Hurth, K.; Rondeau, J.-M.; Vulpetti, A.; Ostermeier, D.; Boettcher, A.; Brady, J.P.; Hediger, M.; Lehmann, S.; Koch, E.; et al. Discovery of a selective and biologically active low-molecular weight antagonist of human interleukin-1β. Nat. Commun. 2023, 14, 5497. [Google Scholar] [CrossRef] [Scilit] [PubMed]
- He, M.M.; Smith, A.S.; Oslob, J.D.; Flanagan, W.M.; Braisted, A.C.; Whitty, A.; Cancilla, M.T.; Wang, J.; Lugovskoy, A.A.; Yoburn, J.C.; et al. Small-molecule inhibition of TNF-alpha. Science 2005, 310, 1022–1025. [Google Scholar] [CrossRef] [Scilit] [PubMed]
- Kawai, A.; Yamasaki, K.; Otagiri, M.; Doi, Y. Interaction of Cephalosporins with Human Serum Albumin: A Structural Study. J. Med. Chem. 2024, 67, 14175–14183. [Google Scholar] [CrossRef] [Scilit] [PubMed]
- Blizzard, T.A.; Dininno, F.; Morgan, J.D., 2nd; Chen, H.Y.; Wu, J.Y.; Kim, S.; Chan, W.; Birzin, E.T.; Yang, Y.T.; Pai, L.Y.; et al. Estrogen receptor ligands. Part 9: Dihydrobenzoxathiin SERAMs with alkyl substituted pyrrolidine side chains and linkers. Bioorganic Med. Chem. Lett. 2005, 1, 107–113. [Google Scholar] [CrossRef] [Scilit] [PubMed]
- Azam, F.; Almahmoud, S.A.; Ali, A.; Ali, A. Targeting Mitochondrial Drp1 Dynamics in Neurodegenerative Diseases: A Comprehensive Drug Design Approach Using AutoDock Vina-GPU, DFT, and Molecular Dynamics Simulations. ChemistrySelect 2025, 10, e202406041. [Google Scholar] [CrossRef] [Scilit]
- Nithya, C.; Kiran, M.; Nagarajaram, H.A. Hubs and Bottlenecks in Protein-Protein Interaction Networks. Methods Mol. Biol. 2024, 2719, 227–248. [Google Scholar] [CrossRef] [Scilit] [PubMed]
- Sun, J.; Nan, G. The extracellular signal-regulated kinase 1/2 pathway in neurological diseases: A potential therapeutic target (Review). Int. J. Mol. Med. 2017, 39, 1338–1346. [Google Scholar] [CrossRef] [Scilit] [PubMed]
- Vellucci, L.; Mazza, B.; Barone, A.; Nasti, A.; De Simone, G.; Iasevoli, F.; de Bartolomeis, A. The Role of Astrocytes in the Molecular Pathophysiology of Schizophrenia: Between Neurodevelopment and Neurodegeneration. Biomolecules 2025, 15, 615. [Google Scholar] [CrossRef] [Scilit] [PubMed]
- Hein, Z.M.; Che Mohd Nassir, C.M.N.; Ramli, M.D.; El-Serafi, I.; Chetsawang, B. Neuron-Glial2 (NG2) Cells: A Promising Target for Neuroinflammation-Related Neurodegeneration. Transl. Res. Anat. 2025, 39, 100395. [Google Scholar] [CrossRef] [Scilit]
- Zahedipour, F.; Hosseini, S.A.; Henney, N.C.; Barreto, G.E.; Sahebkar, A. Phytochemicals as inhibitors of tumor necrosis factor alpha and neuroinflammatory responses in neurodegenerative diseases. Neural Regen. Res. 2022, 17, 1675–1684. [Google Scholar] [CrossRef] [Scilit] [PubMed]
- Neagu, M.; Constantin, C. Signal Transduction in Immune Cells and Protein Kinases. Adv. Exp. Med. Biol. 2021, 1275, 133–149, Correction in Adv. Exp. Med. Biol. 2021, 1275, C1. [Google Scholar] [CrossRef] [Scilit] [PubMed]
- Zuppe, H.; Reed, E. Common cytokine receptor gamma chain family cytokines activate MAPK, PI3K, and JAK/STAT pathways in microglia to influence Alzheimer’s Disease. Front. Mol. Neurosci. 2024, 17, 1441691. [Google Scholar] [CrossRef] [Scilit] [PubMed]
- Zipp, F.; Bittner, S.; Schafer, D.P. Cytokines as emerging regulators of central nervous system synapses. Immunity 2023, 56, 914–925. [Google Scholar] [CrossRef] [Scilit] [PubMed]
- Prabhakaran, P.; Hebbani, A.V.; Menon, S.V.; Paital, B.; Murmu, S.; Kumar, S.; Singh, M.K.; Sahoo, D.K.; Desai, P.P.D. Insilico generation of novel ligands for the inhibition of SARS-CoV-2 main protease (3CL(pro)) using deep learning. Front. Microbiol. 2023, 14, 1194794. [Google Scholar] [CrossRef] [Scilit] [PubMed]
- Suleiman, M.R.; Wang, H.; Huang, D.; Wang, H.; Joseph, J.; Huang, T.; Zhang, F.; Wang, J.; Cheng, M. Discovery of small molecule inhibitors through pharmacophore modeling, molecular docking, molecular dynamics simulation and experimental validation against myeloid cell leukemia-1 (Mcl-1). J. Biomol. Struct. Dyn. 2021, 39, 2512–2525. [Google Scholar] [CrossRef] [Scilit] [PubMed]
- Swegat, W.; Schlitter, J.; Krüger, P.; Wollmer, A. MD simulation of protein-ligand interaction: Formation and dissociation of an insulin-phenol complex. Biophys. J. 2003, 84, 1493–1506. [Google Scholar] [CrossRef] [Scilit] [PubMed]
- Bhati, A.P.; Hoti, A.; Potterton, A.; Bieniek, M.K.; Coveney, P.V. Long time scale ensemble methods in molecular dynamics: Ligand–protein interactions and allostery in SARS-CoV-2 targets. J. Chem. Theory Comput. 2023, 19, 3359. [Google Scholar] [CrossRef] [Scilit] [PubMed]
- Pace, C.N.; Fu, H.; Lee Fryar, K.; Landua, J.; Trevino, S.R.; Schell, D.; Thurlkill, R.L.; Imura, S.; Scholtz, J.M.; Gajiwala, K. Contribution of hydrogen bonds to protein stability. Protein Sci. 2014, 23, 652–661. [Google Scholar] [CrossRef] [Scilit] [PubMed]
- Ahamad, S.; Gupta, D.; Kumar, V. Targeting SARS-CoV-2 nucleocapsid oligomerization: Insights from molecular docking and molecular dynamics simulations. J. Biomol. Struct. Dyn. 2022, 40, 2430–2443. [Google Scholar] [CrossRef] [Scilit] [PubMed]
- Elasbali, A.M.; Ali, A.S.; Mohammad, T.; Adnan, M.; Shamsi, A.; Hassan, M.I. Flunarizine as a potential repurposed drug for the serotonin transporter inhibition: An integrated approach for therapeutic development against major depressive disorder. Front. Pharmacol. 2025, 16, 1599297. [Google Scholar] [CrossRef] [Scilit] [PubMed]
- Del Fresno, C.; Iborra, S.; Saz-Leal, P.; Martínez-López, M.; Sancho, D. Flexible Signaling of Myeloid C-Type Lectin Receptors in Immunity and Inflammation. Front. Immunol. 2018, 9, 804. [Google Scholar] [CrossRef] [Scilit] [PubMed]
- Cheng, P.; Alberts, I.; Li, X. The role of ERK1/2 in the regulation of proliferation and differentiation of astrocytes in developing brain. Int. J. Dev. Neurosci. 2013, 31, 783–789. [Google Scholar] [CrossRef] [Scilit] [PubMed]
- Lee, B.J.; Min, C.K.; Hancock, M.; Streblow, D.N.; Caposio, P.; Goodrum, F.D.; Yurochko, A.D. Human Cytomegalovirus Host Interactions: EGFR and Host Cell Signaling Is a Point of Convergence Between Viral Infection and Functional Changes in Infected Cells. Front. Microbiol. 2021, 12, 660901. [Google Scholar] [CrossRef] [Scilit] [PubMed]
- Katzilieris-Petras, G.; Lai, X.; Rashidi, A.S.; Verjans, G.; Reinert, L.S.; Paludan, S.R. Microglia Activate Early Antiviral Responses upon Herpes Simplex Virus 1 Entry into the Brain to Counteract Development of Encephalitis-Like Disease in Mice. J. Virol. 2022, 96, e0131121. [Google Scholar] [CrossRef] [Scilit] [PubMed]
- Zheng, C.; Zhou, X.-W.; Wang, J.-Z. The dual roles of cytokines in Alzheimer’s disease: Update on interleukins, TNF-α, TGF-β and IFN-γ. Transl. Neurodegener. 2016, 5, 7. [Google Scholar] [CrossRef] [Scilit] [PubMed]
- Thakur, S.; Dhapola, R.; Sarma, P.; Medhi, B.; Reddy, D.H. Neuroinflammation in Alzheimer’s Disease: Current Progress in Molecular Signaling and Therapeutics. Inflammation 2023, 46, 1–17. [Google Scholar] [CrossRef] [Scilit] [PubMed]
- Roussotte, F.F.; Daianu, M.; Jahanshad, N.; Leonardo, C.D.; Thompson, P.M. Neuroimaging and genetic risk for Alzheimer’s disease and addiction-related degenerative brain disorders. Brain Imaging Behav. 2014, 8, 217–233. [Google Scholar] [CrossRef] [Scilit] [PubMed]
- Adamu, A.; Li, S.; Gao, F.; Xue, G. The role of neuroinflammation in neurodegenerative diseases: Current understanding and future therapeutic targets. Front. Aging Neurosci. 2024, 16, 1347987. [Google Scholar] [CrossRef] [Scilit] [PubMed]
- Santi, M.D.; Zhang, M.; Liu, N.; Viet, C.T.; Xie, T.; Jensen, D.D.; Amit, M.; Pan, H.; Ye, Y. Repurposing EGFR inhibitors for oral cancer pain and opioid tolerance. Pharmaceuticals 2023, 16, 1558. [Google Scholar] [CrossRef] [Scilit] [PubMed]
- Logan, R.; Shelton, M.; Horan, N.; Xue, X.; Maturin, L.; Eacret, D.; Michaud, J.; Singh, N.; Williams, B.; Gamble, M.; et al. Sex-specific Concordance of Striatal Transcriptional Signatures of Opioid Addiction in Human and Rodent Brains. Res. Sq. 2024, 5, 100467. [Google Scholar] [CrossRef] [Scilit] [PubMed]
- Nicolas, C.; Zlebnik, N.E.; Farokhnia, M.; Leggio, L.; Ikemoto, S.; Shaham, Y. Sex Differences in Opioid and Psychostimulant Craving and Relapse: A Critical Review. Pharmacol. Rev. 2022, 74, 119–140. [Google Scholar] [CrossRef] [Scilit] [PubMed]
- Shelton, M.A.; Horan, N.; Xue, X.; Maturin, L.; Eacret, D.; Michaud, J.; Singh, N.; Williams, B.R.; Gamble, M.C.; Seggio, J.A.; et al. Sex-Specific Concordance of Striatal Transcriptional Signatures of Opioid Addiction in Human and Rodent Brains. Biol. Psychiatry Glob. Open Sci. 2025, 5, 100476. [Google Scholar] [CrossRef] [Scilit] [PubMed]
- Ciriza, I.; Carrero, P.; Azcoitia, I.; Lundeen, S.G.; Garcia-Segura, L.M. Selective estrogen receptor modulators protect hippocampal neurons from kainic acid excitotoxicity: Differences with the effect of estradiol. J. Neurobiol. 2004, 61, 209–221. [Google Scholar] [CrossRef] [Scilit] [PubMed]
- Vegeto, E.; Belcredito, S.; Etteri, S.; Ghisletti, S.; Brusadelli, A.; Meda, C.; Krust, A.; Dupont, S.; Ciana, P.; Chambon, P. Estrogen receptor-α mediates the brain antiinflammatory activity of estradiol. Proc. Natl. Acad. Sci. USA 2003, 100, 9614–9619. [Google Scholar] [CrossRef] [Scilit] [PubMed]
- Guleken, Z.; Ünübol, B.; Bilici, R.; Sarıbal, D.; Toraman, S.; Gündüz, O.; Kuruca, S.E. Investigation of the discrimination and characterization of blood serum structure in patients with opioid use disorder using IR spectroscopy and PCA-LDA analysis. J. Pharm. Biomed. Anal. 2020, 190, 113553. [Google Scholar] [CrossRef] [Scilit] [PubMed]
- Zhu, M.; Xu, Y.; Wang, H.; Shen, Z.; Xie, Z.; Chen, F.; Gao, Y.; Chen, X.; Zhang, Y.; Wu, Q. Heroin abuse results in shifted RNA expression to neurodegenerative diseases and attenuation of TNFα signaling pathway. Sci. Rep. 2018, 8, 9231. [Google Scholar] [CrossRef] [Scilit] [PubMed]
- Zhou, R.; Perez-Aguilar, J.M.; Meng, Q.; Saven, J.G.; Liu, R. Opioid binding sites in human serum albumin. Anesth. Analg. 2012, 114, 122–128. [Google Scholar] [CrossRef] [Scilit] [PubMed]
- Zhou, X.; Lu, J.; Wei, K.; Wei, J.; Tian, P.; Yue, M.; Wang, Y.; Hong, D.; Li, F.; Wang, B.; et al. Neuroprotective Effect of Ceftriaxone on MPTP-Induced Parkinson’s Disease Mouse Model by Regulating Inflammation and Intestinal Microbiota. Oxid. Med. Cell Longev. 2021, 2021, 9424582, Correction in Oxid. Med. Cell Longev. 2026, 2026, 9853756. [Google Scholar] [CrossRef] [Scilit] [PubMed]
- Wen, S.; Han, Y.; Li, Y.; Zhan, D. Therapeutic Mechanisms of Medicine Food Homology Plants in Alzheimer’s Disease: Insights from Network Pharmacology, Machine Learning, and Molecular Docking. Int. J. Mol. Sci. 2025, 26, 2121. [Google Scholar] [CrossRef] [Scilit] [PubMed]
- Liu, T.-t.; Chen, Y.-k.; Adil, M.; Almehmadi, M.; Alshabrmi, F.M.; Allahyani, M.; Alsaiari, A.A.; Liu, P.; Khan, M.R.; Peng, Q. In silico identification of natural product-based inhibitors targeting IL-1β/IL-1R protein–protein interface. Molecules 2023, 28, 4885. [Google Scholar] [CrossRef] [Scilit] [PubMed]
- Zia, K.; Ashraf, S.; Jabeen, A.; Saeed, M.; Nur-e-Alam, M.; Ahmed, S.; Al-Rehaily, A.J.; Ul-Haq, Z. Identification of potential TNF-α inhibitors: From in silico to in vitro studies. Sci. Rep. 2020, 10, 20974. [Google Scholar] [CrossRef] [Scilit] [PubMed]
- O’Boyle, N.M.; Pollock, J.K.; Carr, M.; Knox, A.J.; Nathwani, S.M.; Wang, S.; Caboni, L.; Zisterer, D.M.; Meegan, M.J. β-Lactam estrogen receptor antagonists and a dual-targeting estrogen receptor/tubulin ligand. J. Med. Chem. 2014, 57, 9370–9382. [Google Scholar] [CrossRef] [Scilit] [PubMed]
- Meegan, M.J.; Carr, M.; Knox, A.J.S.; Zisterer, D.M.; Lloyd, D.G. β-Lactam type molecular scaffolds for antiproliferative activity: Synthesis and cytotoxic effects in breast cancer cells. J. Enzym. Inhib. Med. Chem. 2008, 23, 668–685. [Google Scholar] [CrossRef] [Scilit] [PubMed]
- Lee, S.; Barron, M.G. Structure-based understanding of binding affinity and mode of estrogen receptor α agonists and antagonists. PLoS ONE 2017, 12, e0169607. [Google Scholar] [CrossRef] [Scilit] [PubMed]
- Hasyim, D.M.; Musfiroh, I.; Hendra, R.; Fakih, T.M.; Ikram, N.K.K.; Muchtaridi, M. In silico approaches for the discovery of novel pyrazoline benzenesulfonamide derivatives as anti-breast cancer agents against Estrogen receptor alpha (ERα). Appl. Sci. 2025, 15, 8444. [Google Scholar] [CrossRef] [Scilit]
- Tavassoly, O.; Sato, T.; Tavassoly, I. Inhibition of Brain Epidermal Growth Factor Receptor Activation: A Novel Target in Neurodegenerative Diseases and Brain Injuries. Mol. Pharmacol. 2020, 98, 13–22. [Google Scholar] [CrossRef] [Scilit] [PubMed]
- Romano, R.; Bucci, C. Role of EGFR in the Nervous System. Cells 2020, 9, 1887. [Google Scholar] [CrossRef] [Scilit] [PubMed]
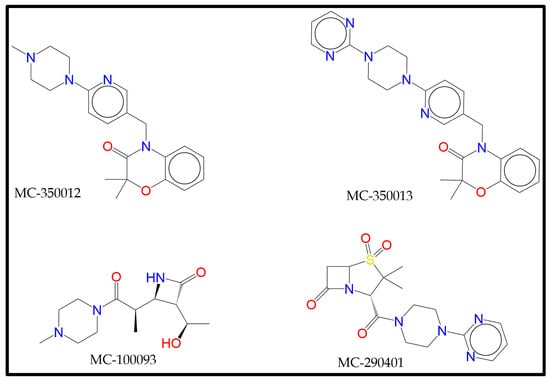
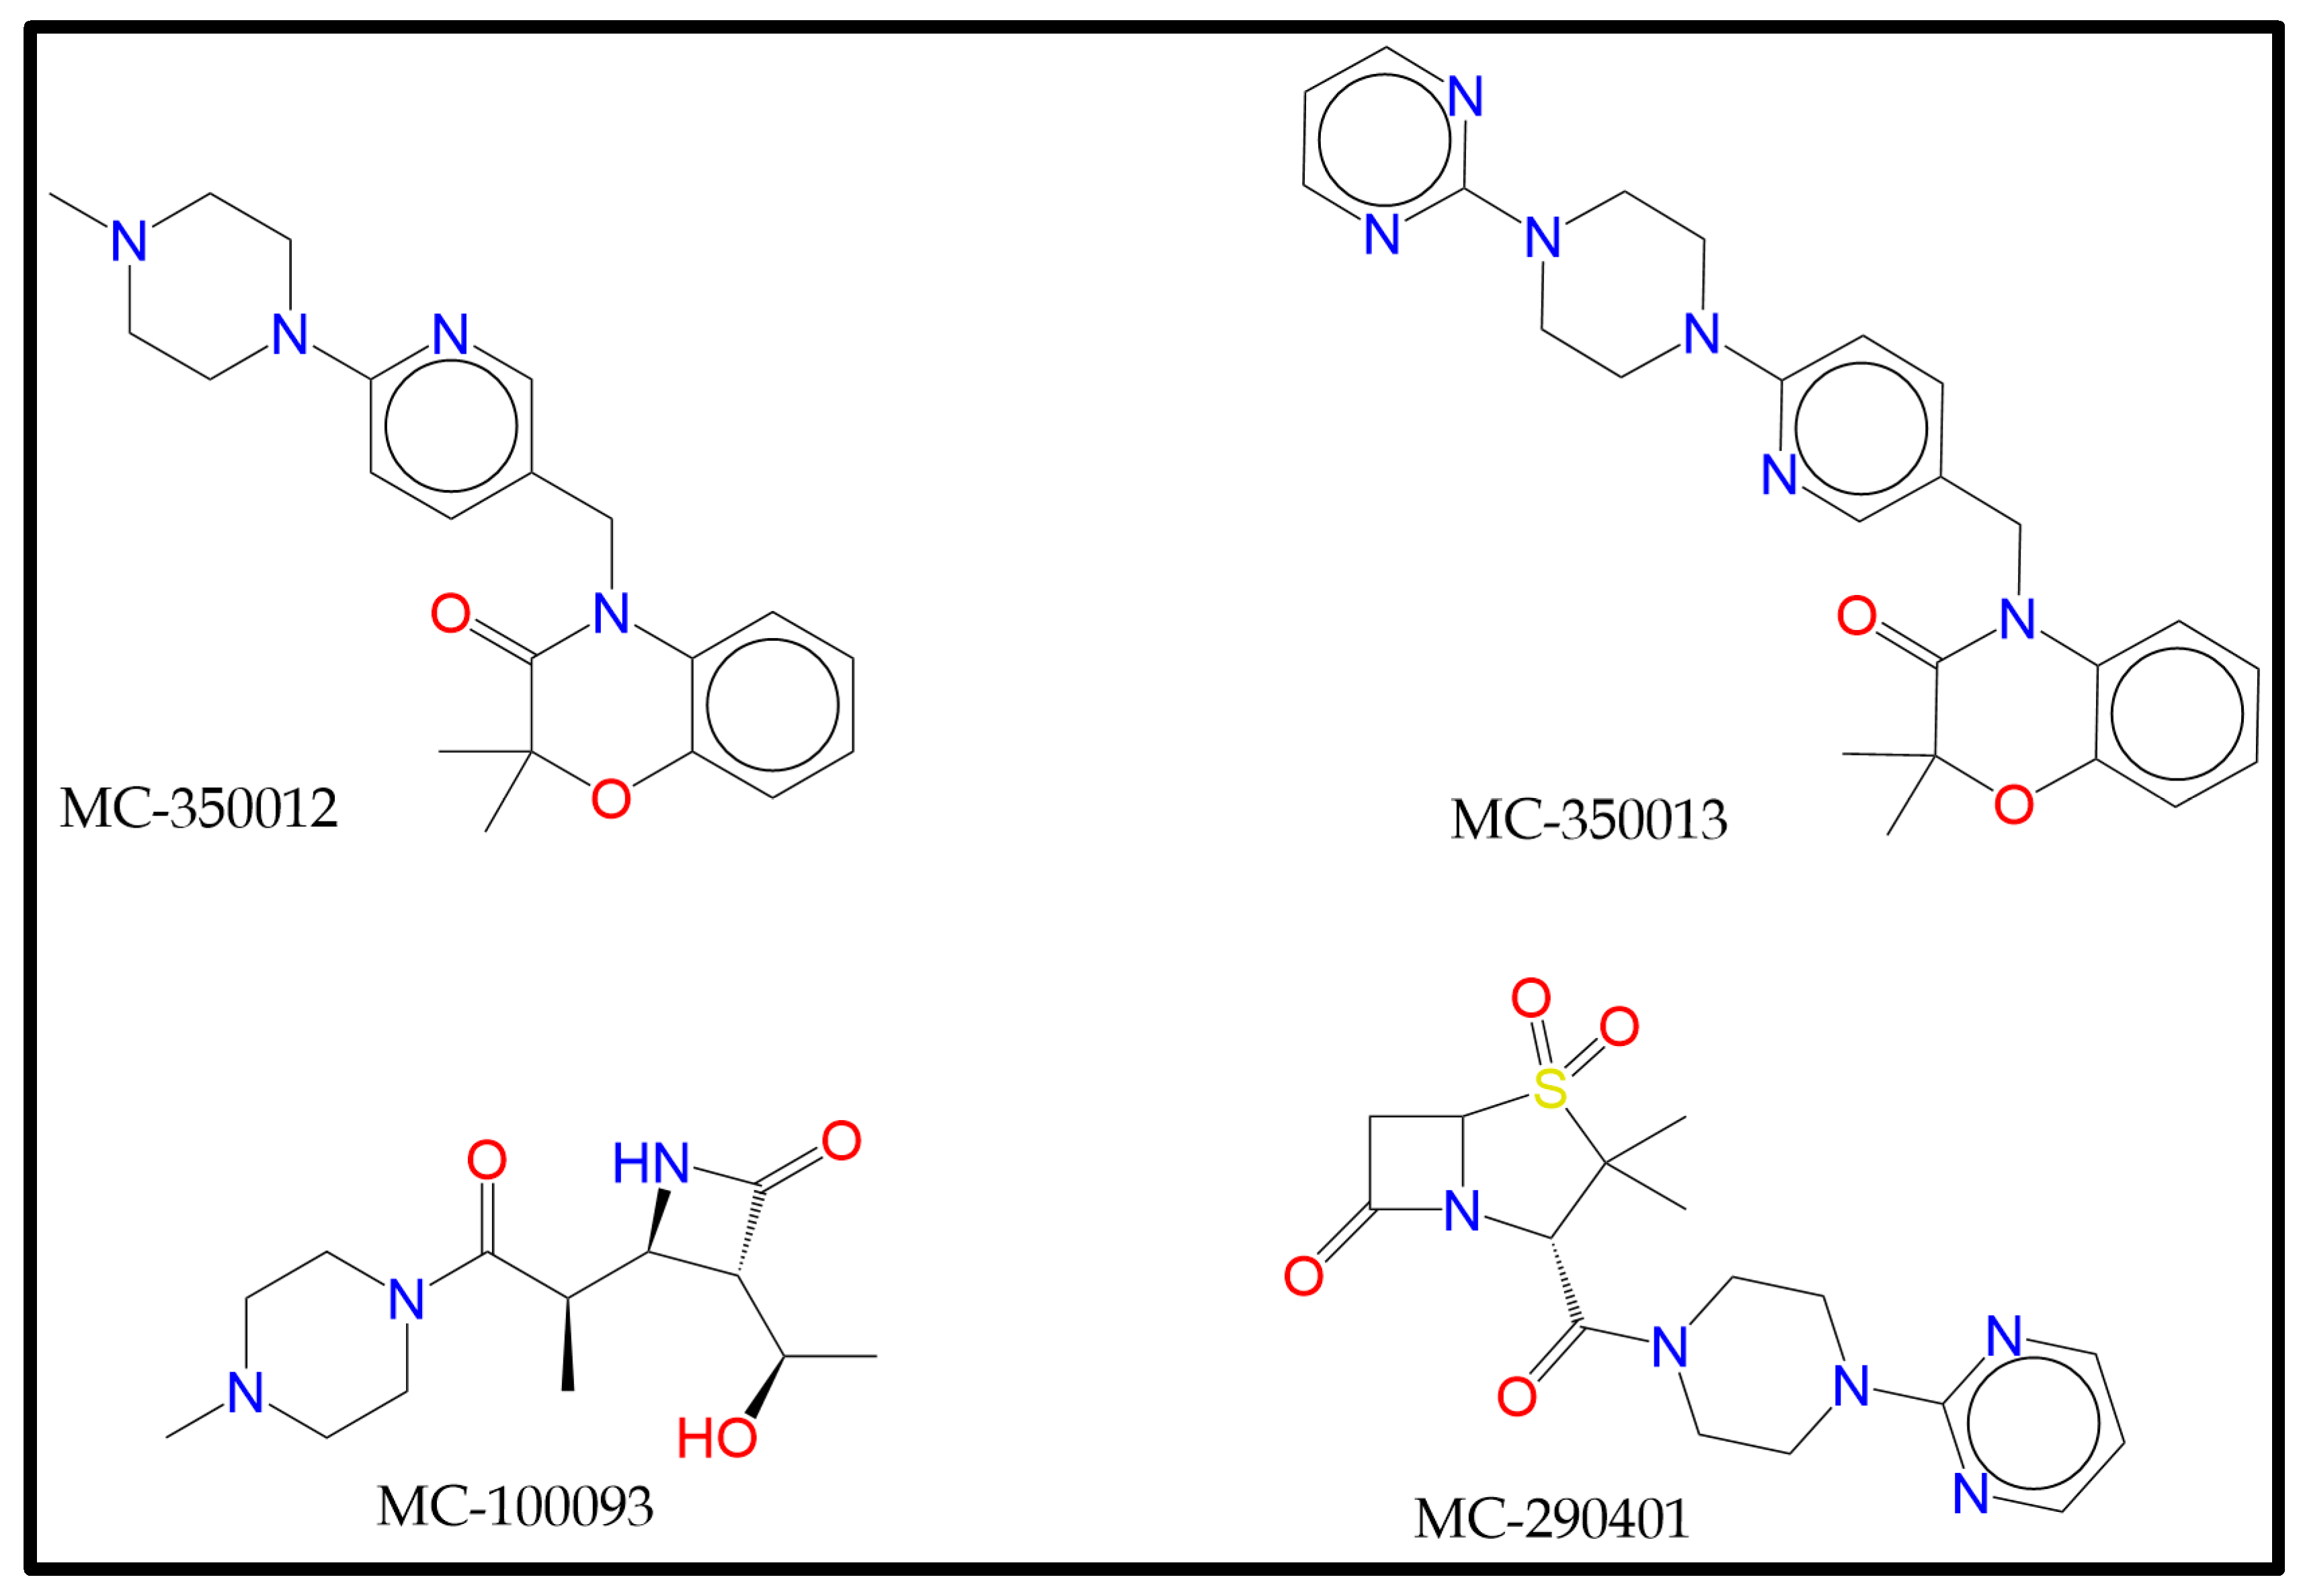
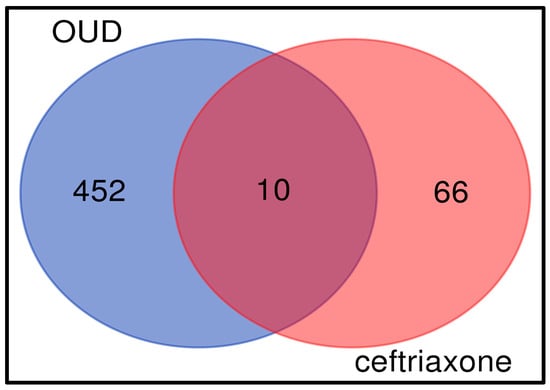
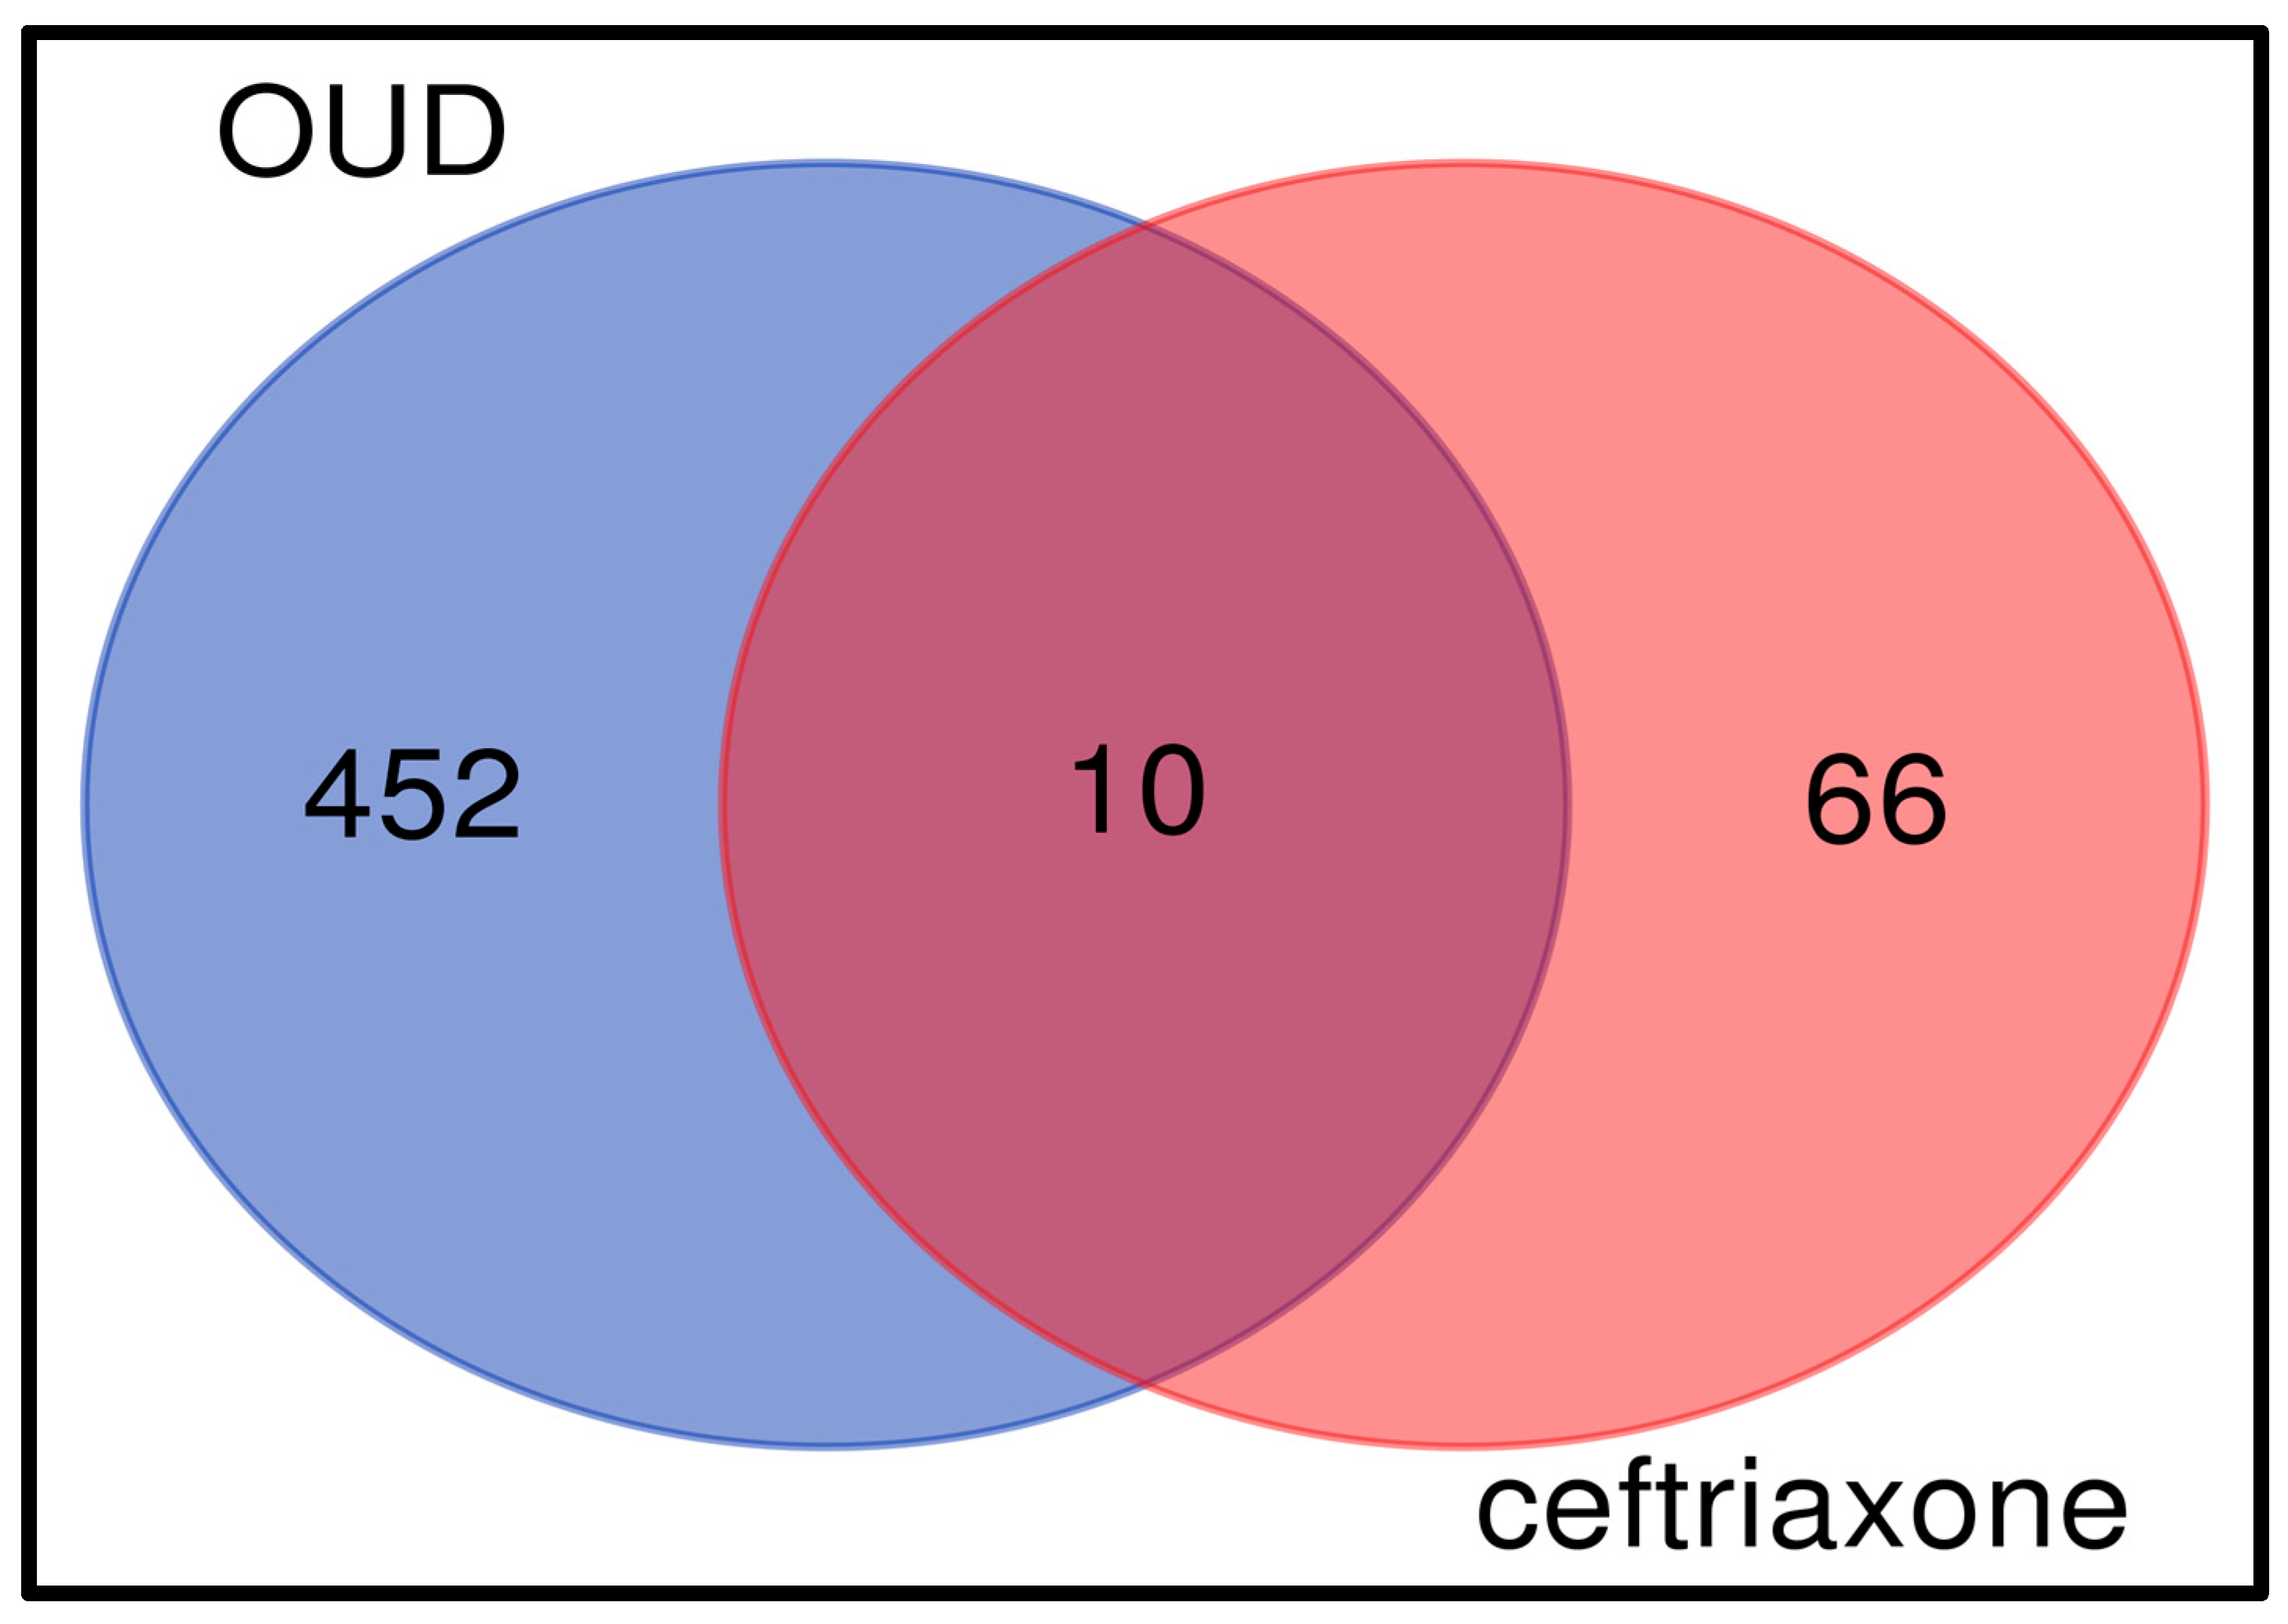
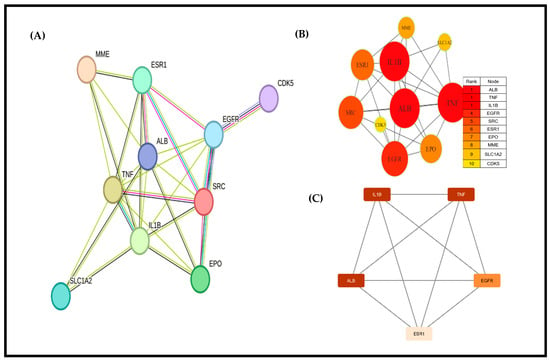
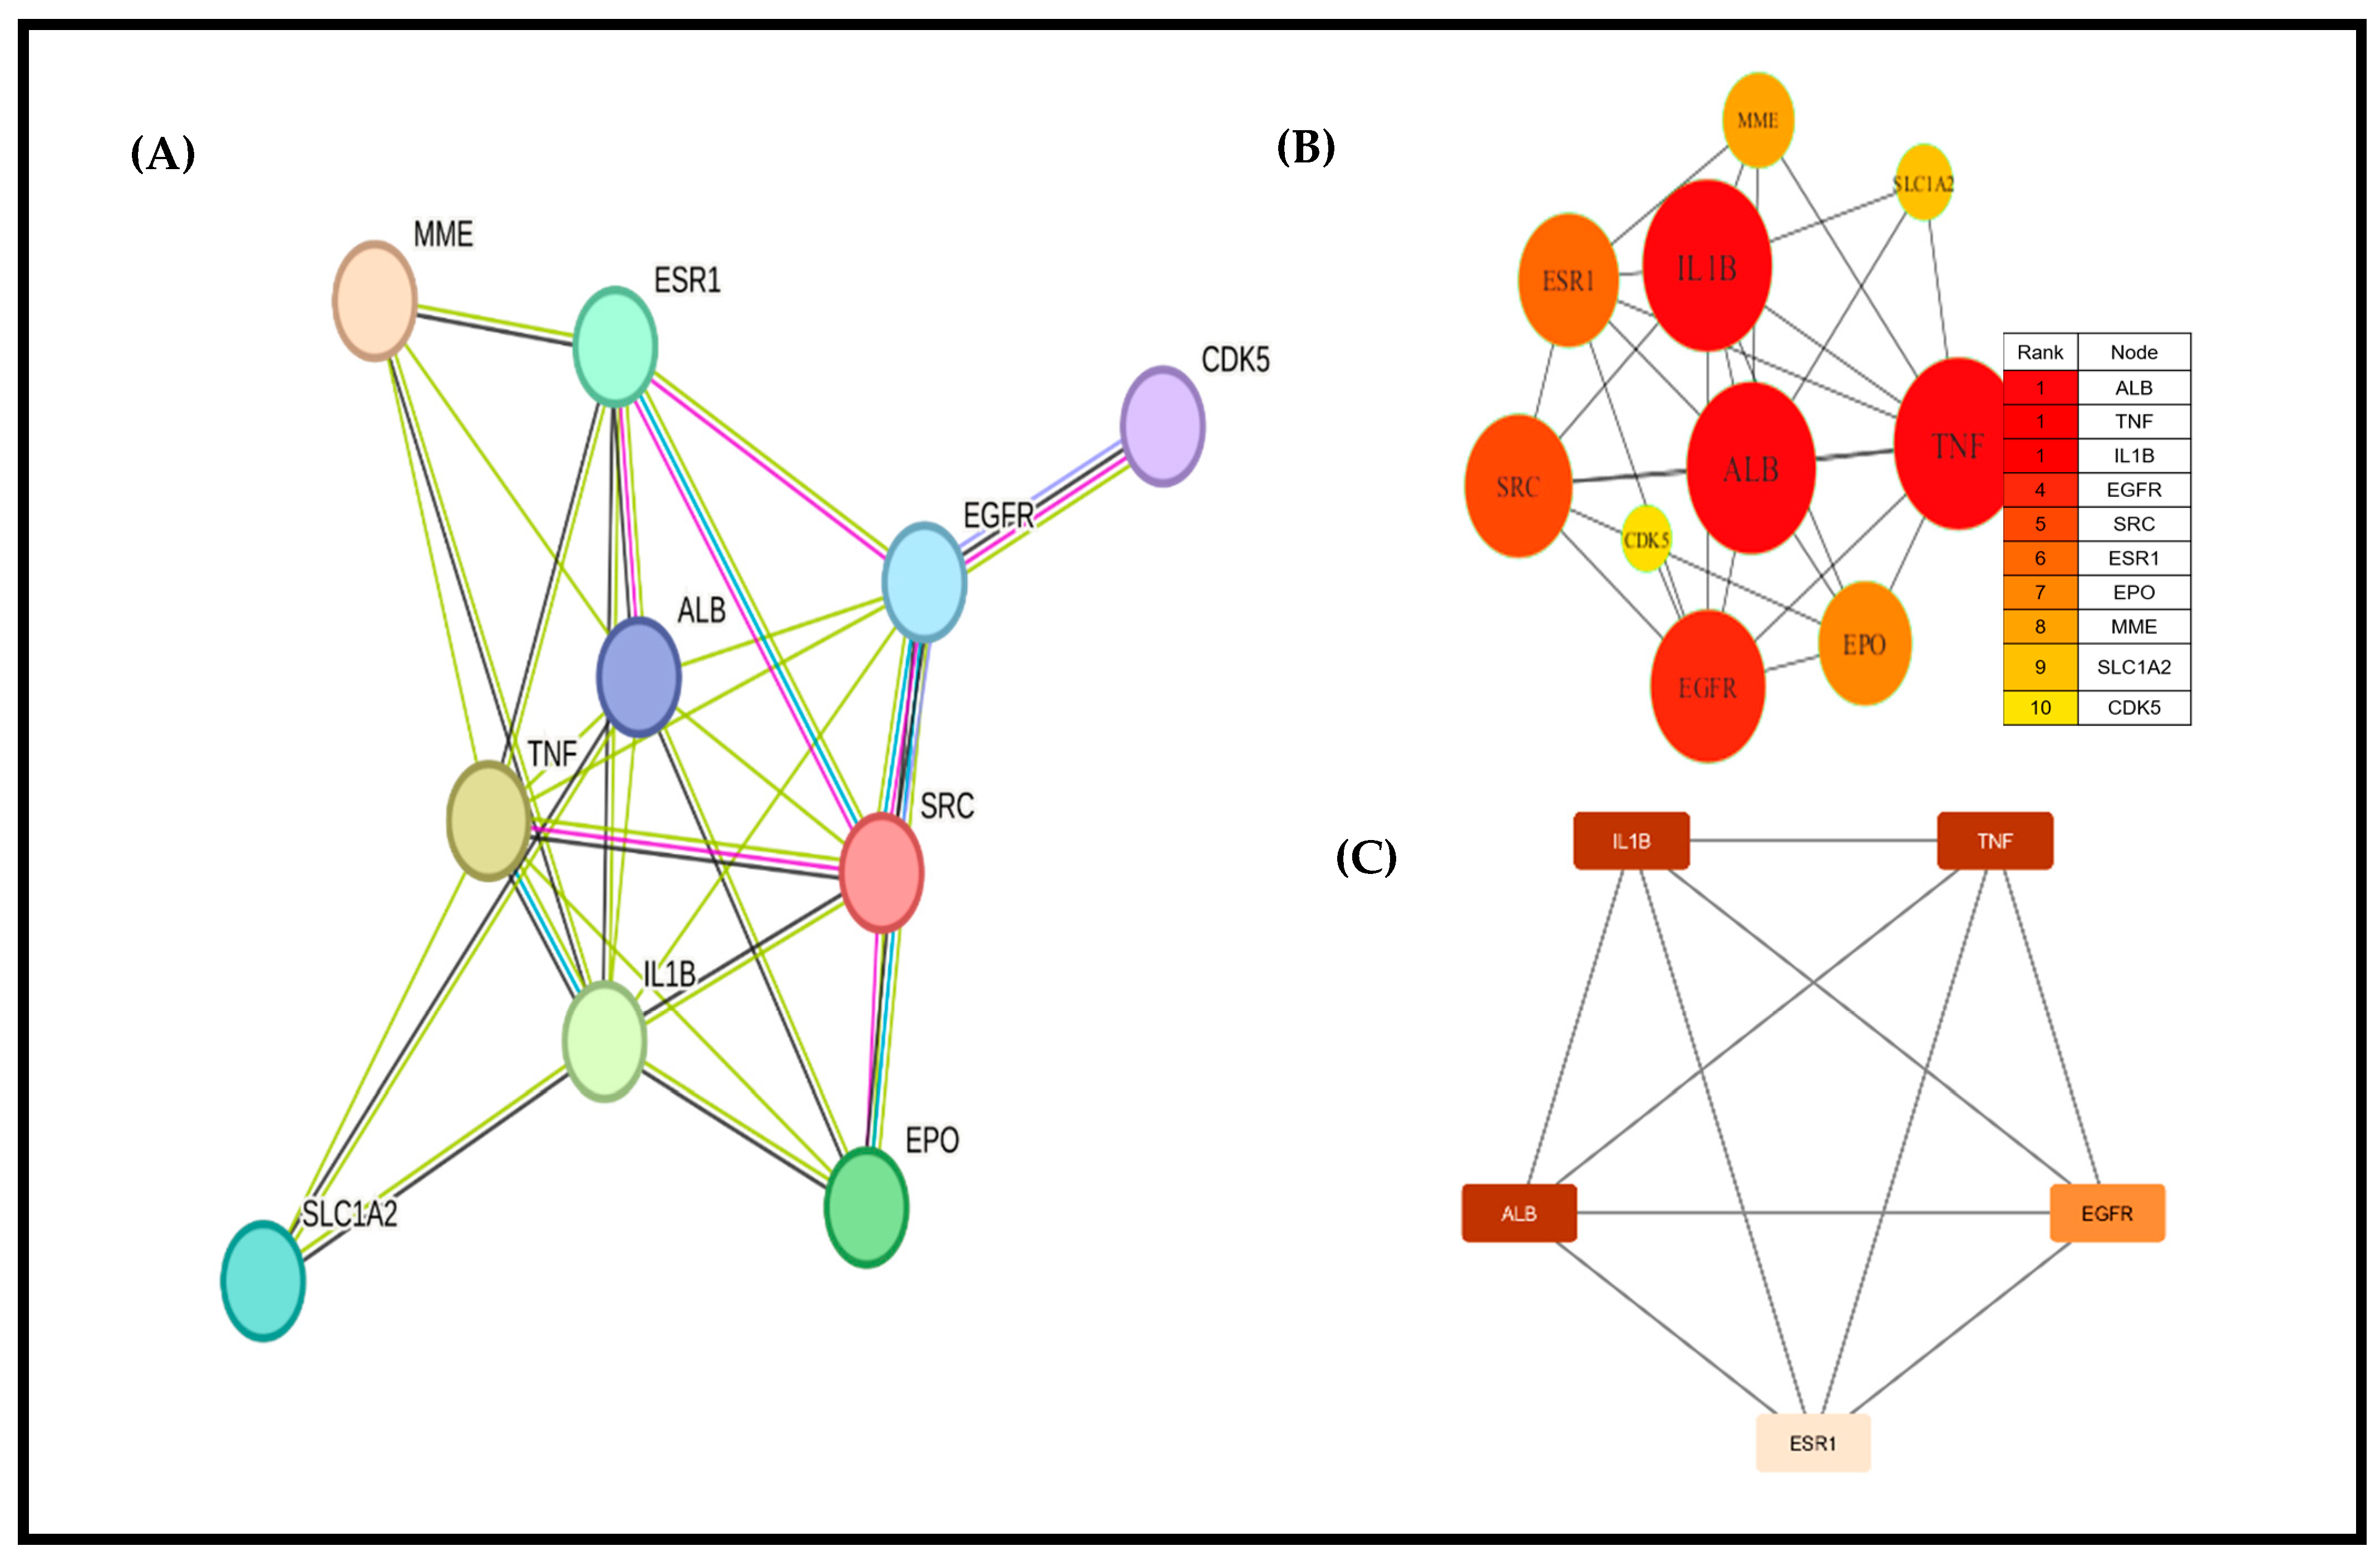
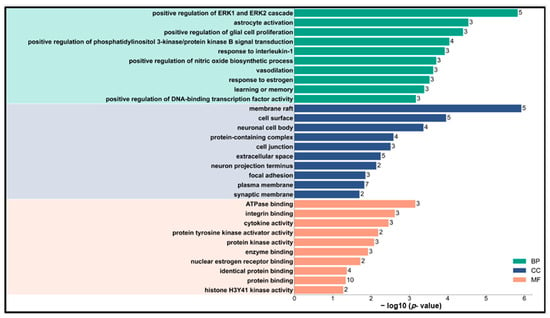
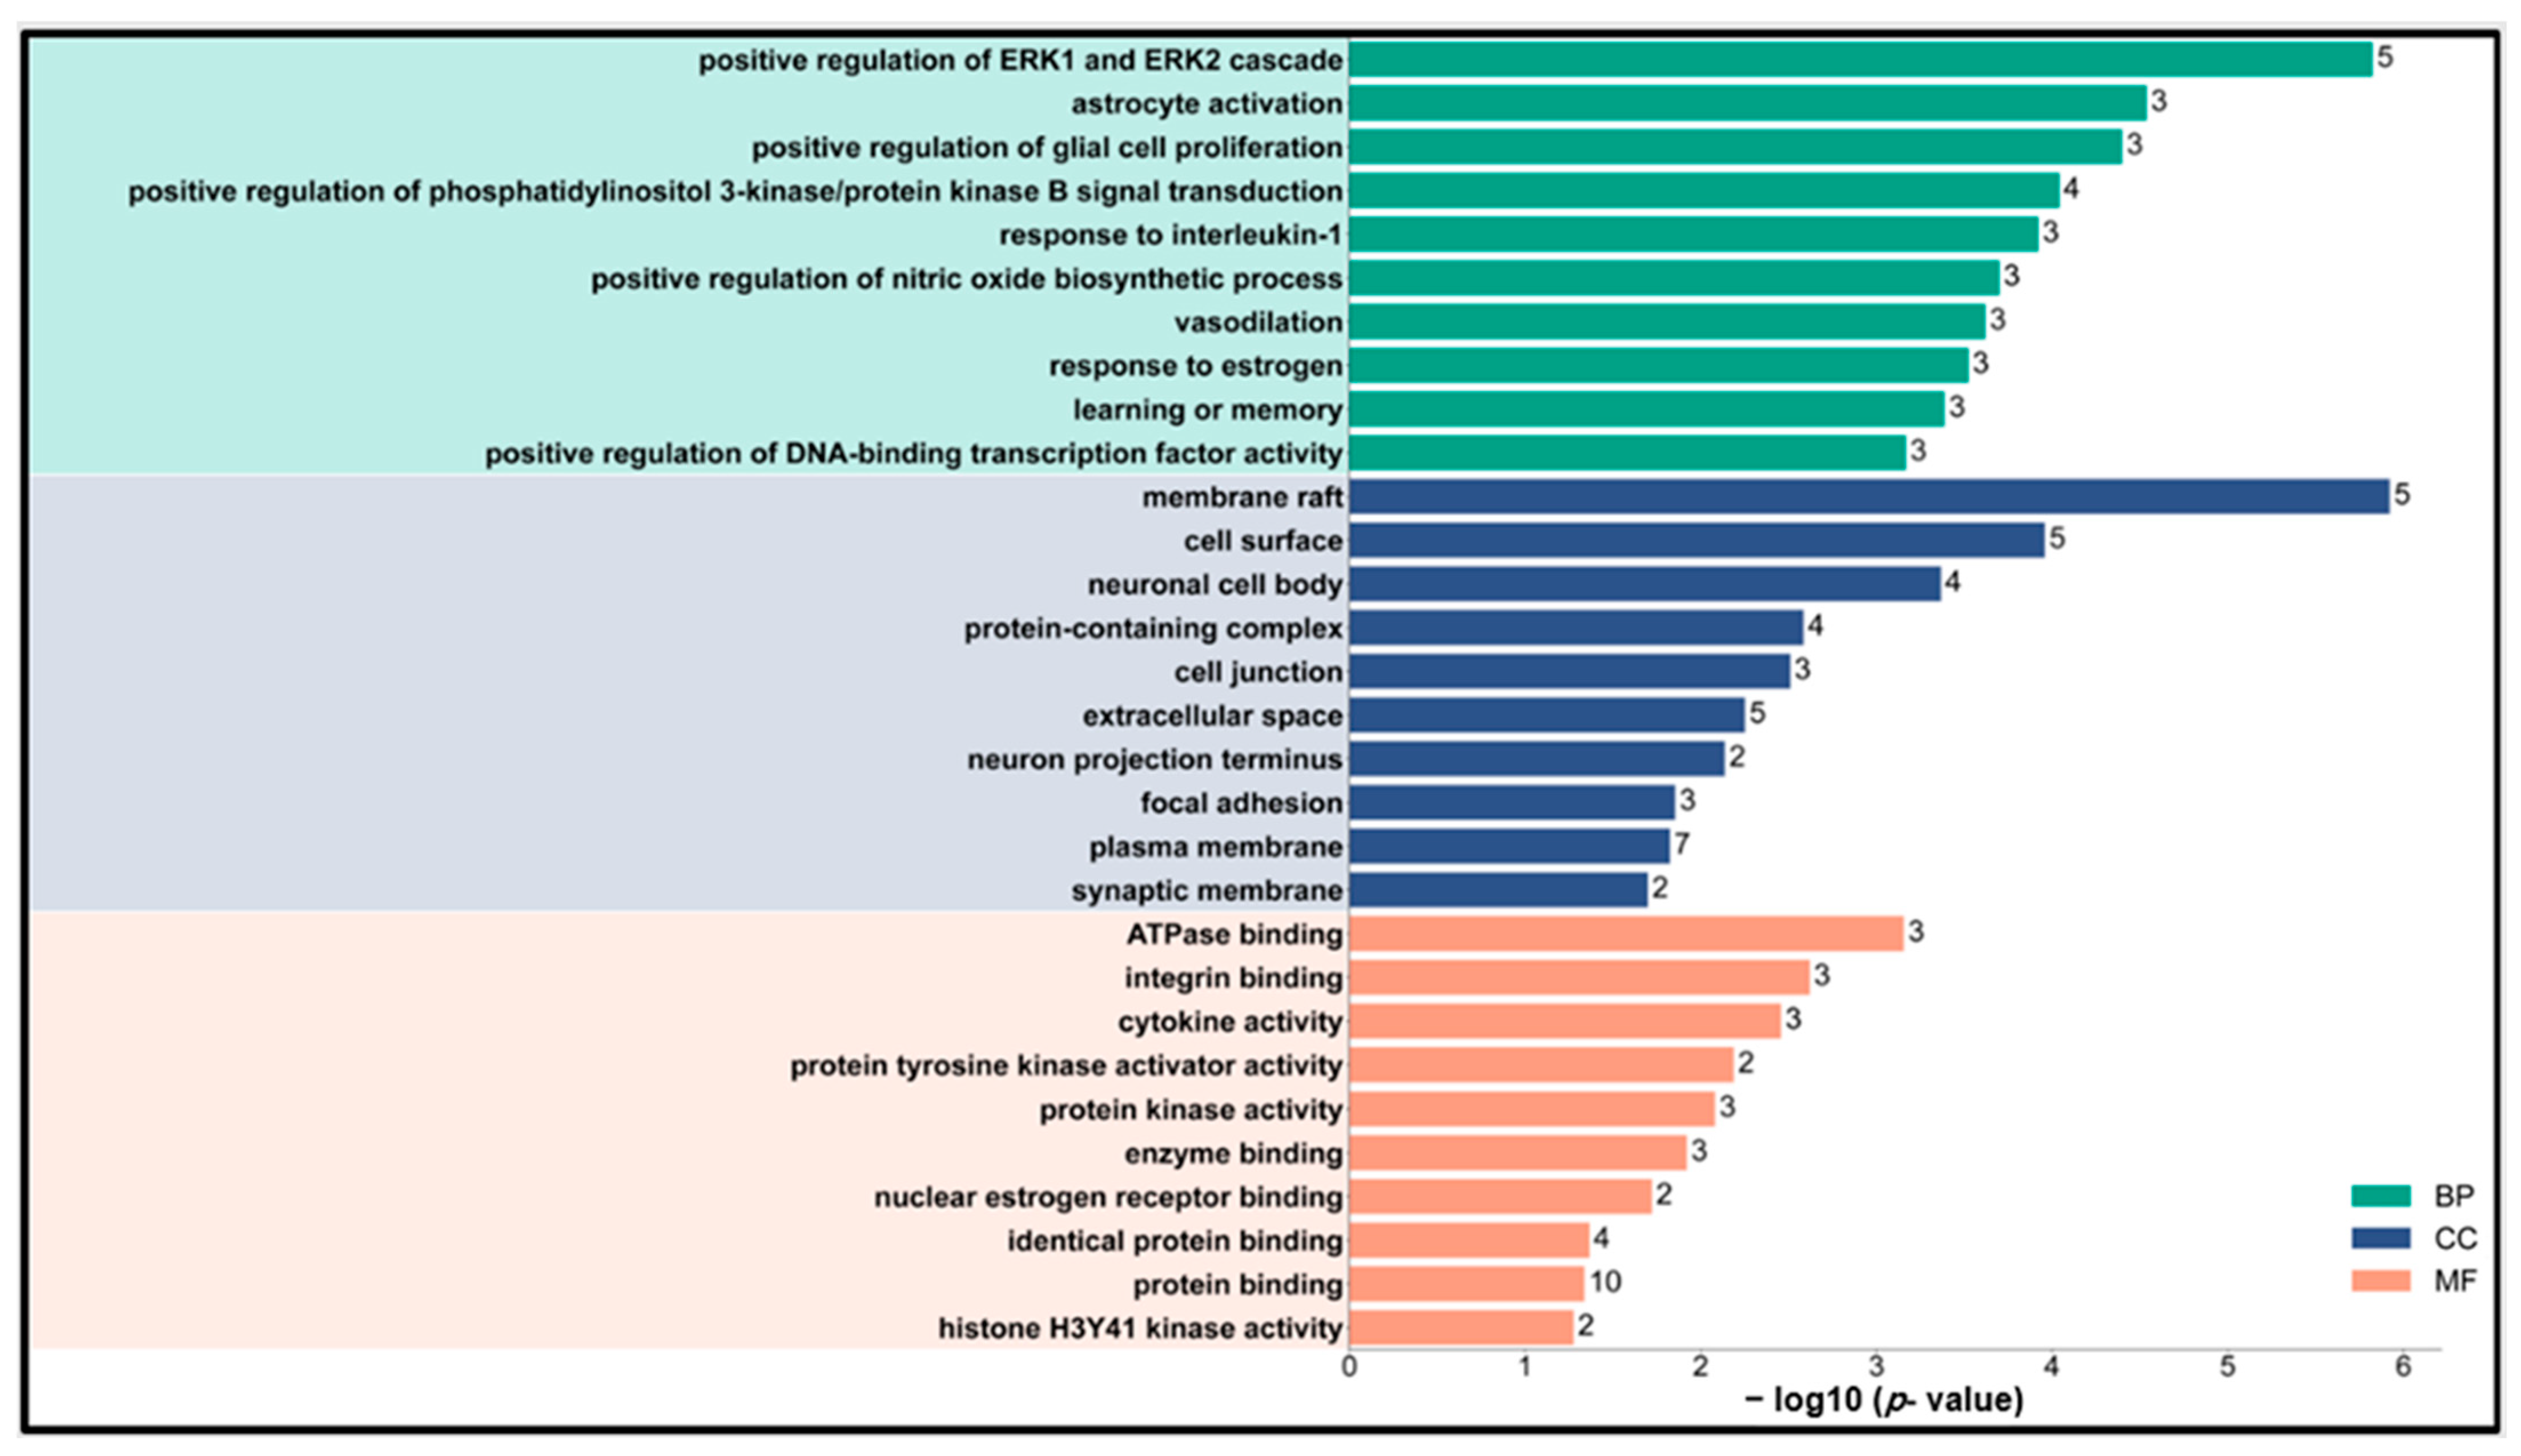
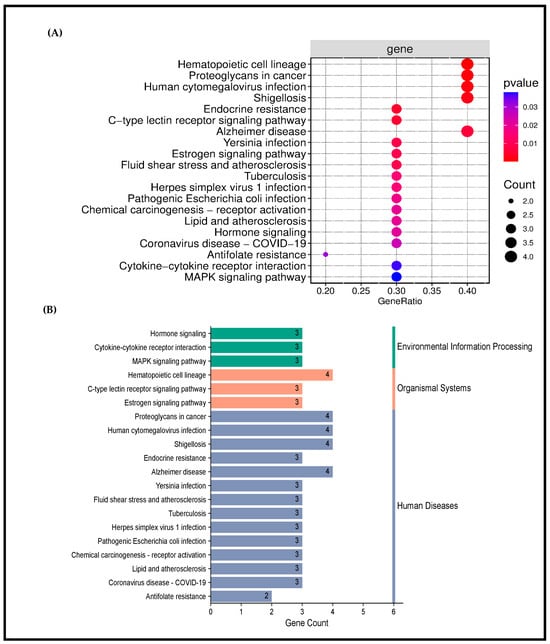
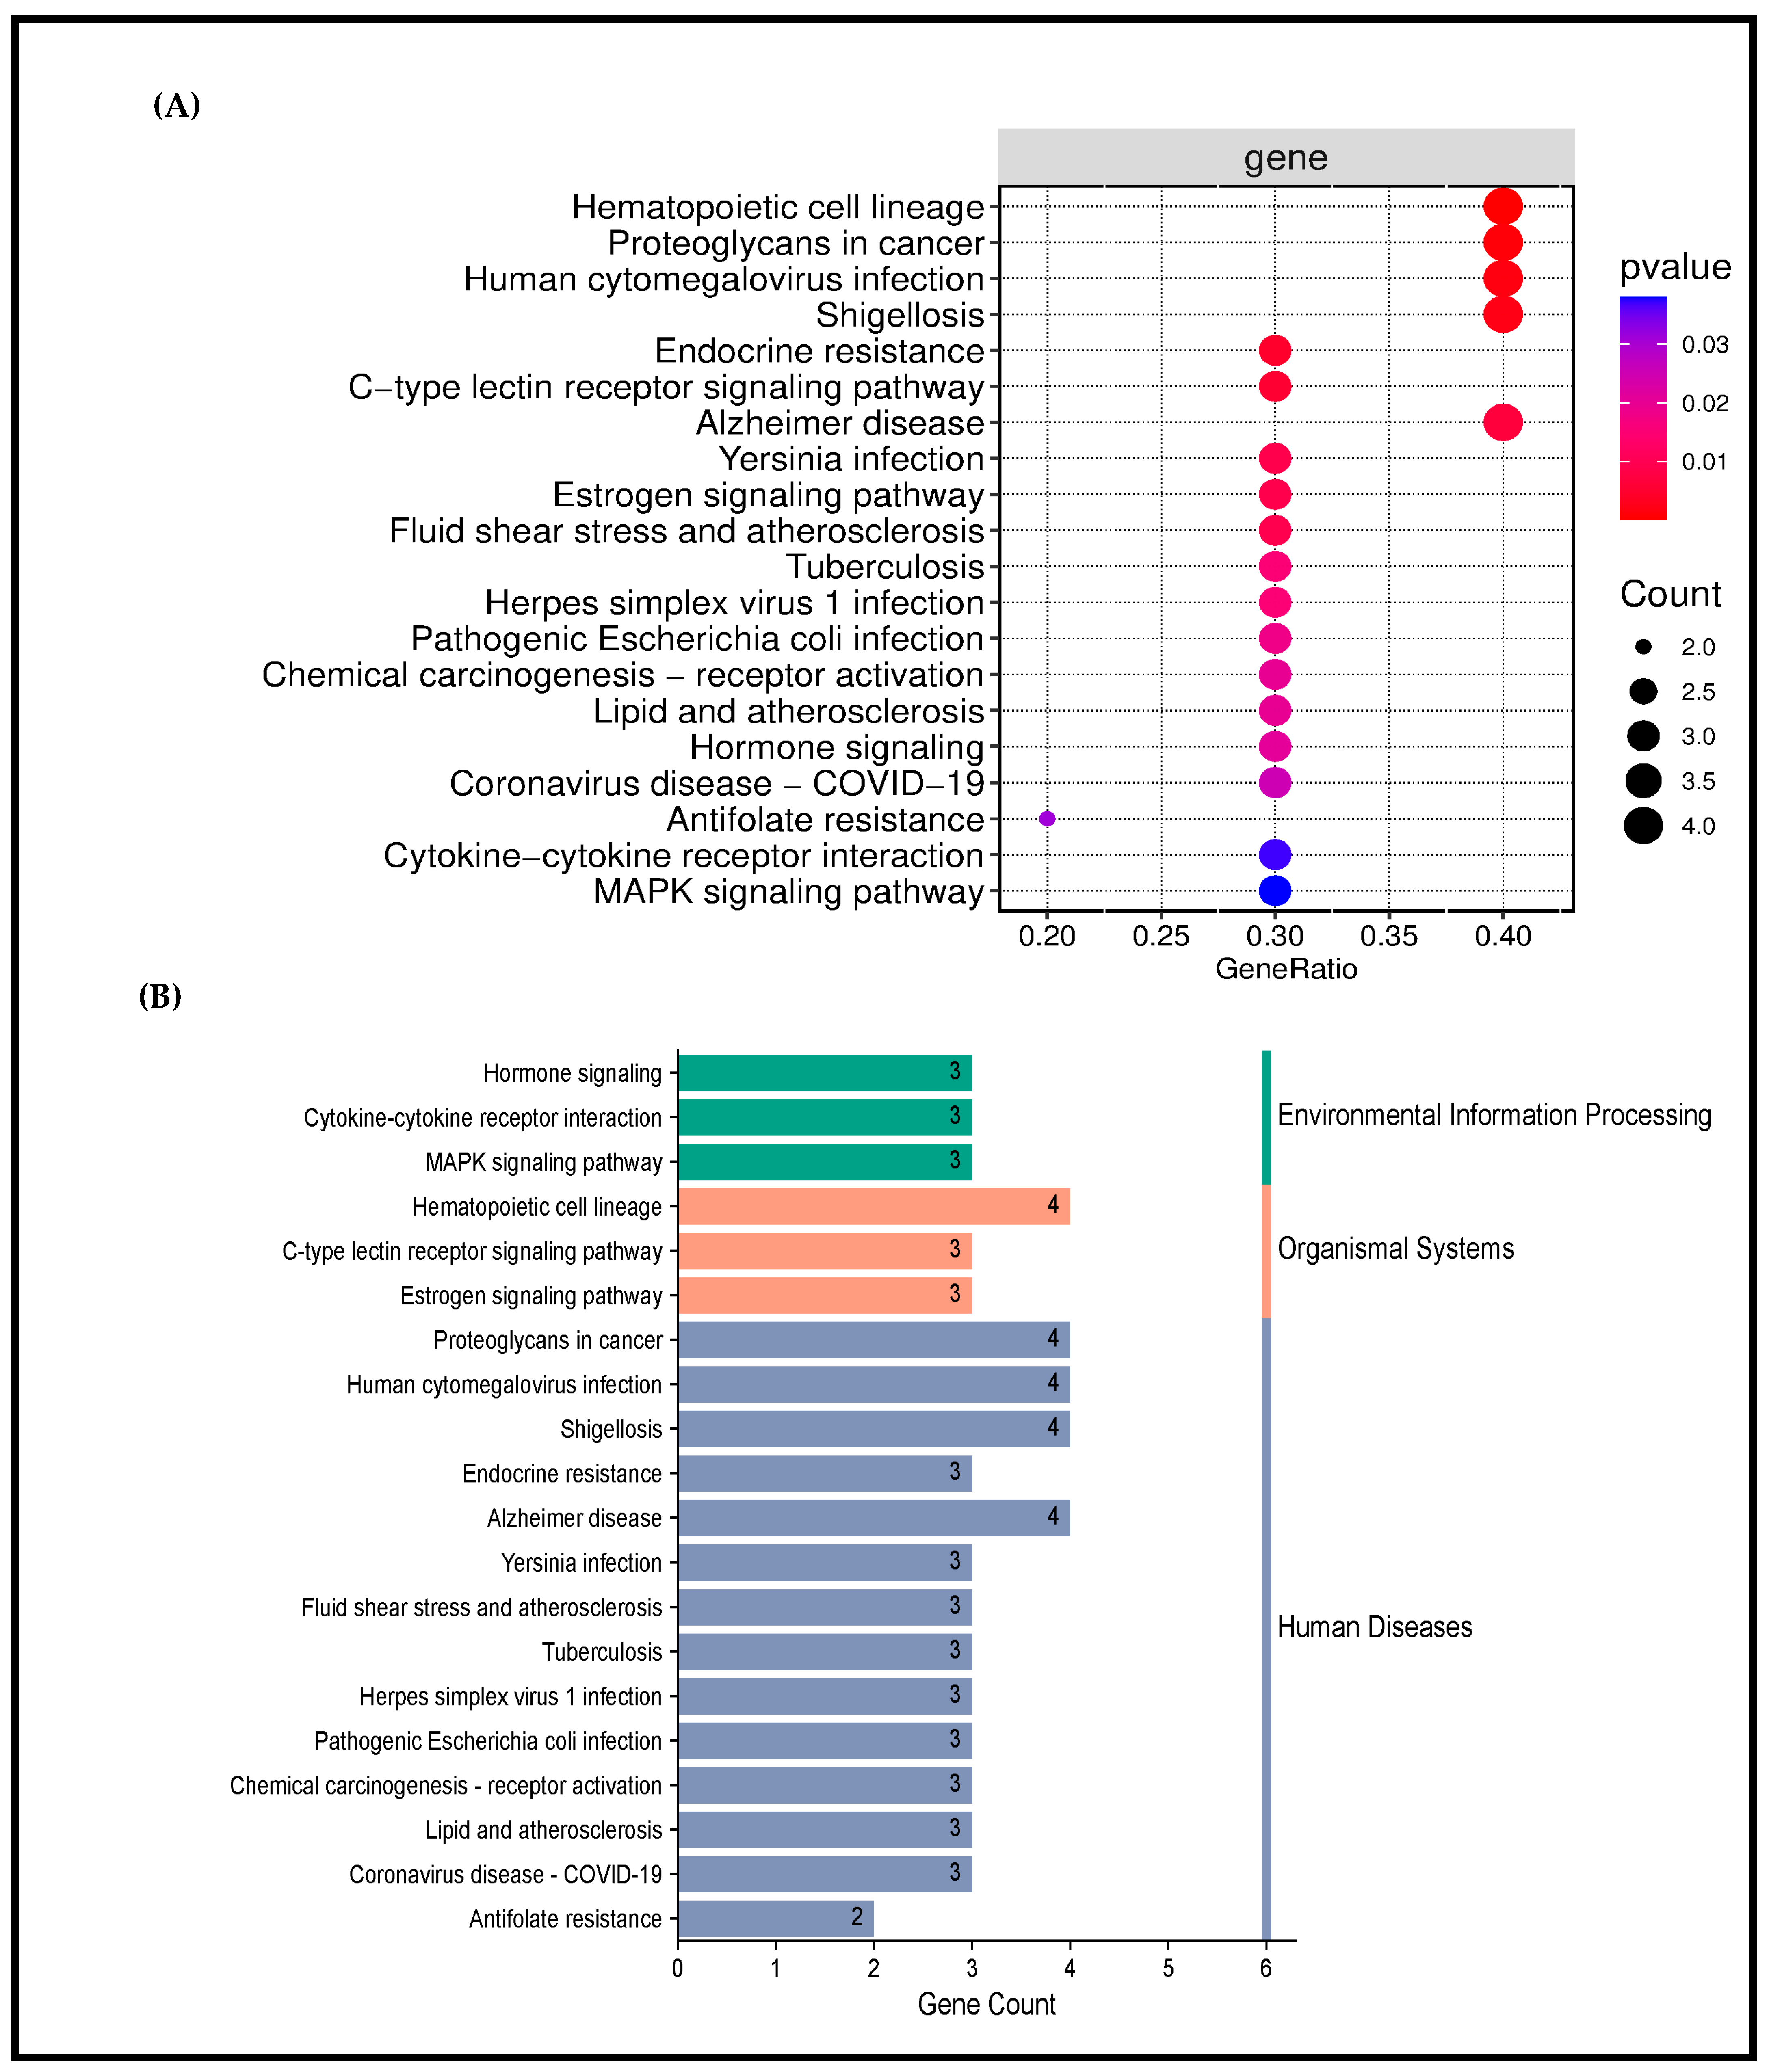
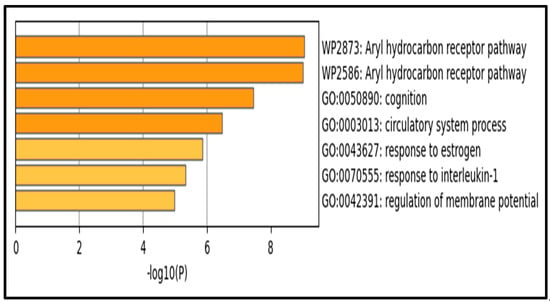
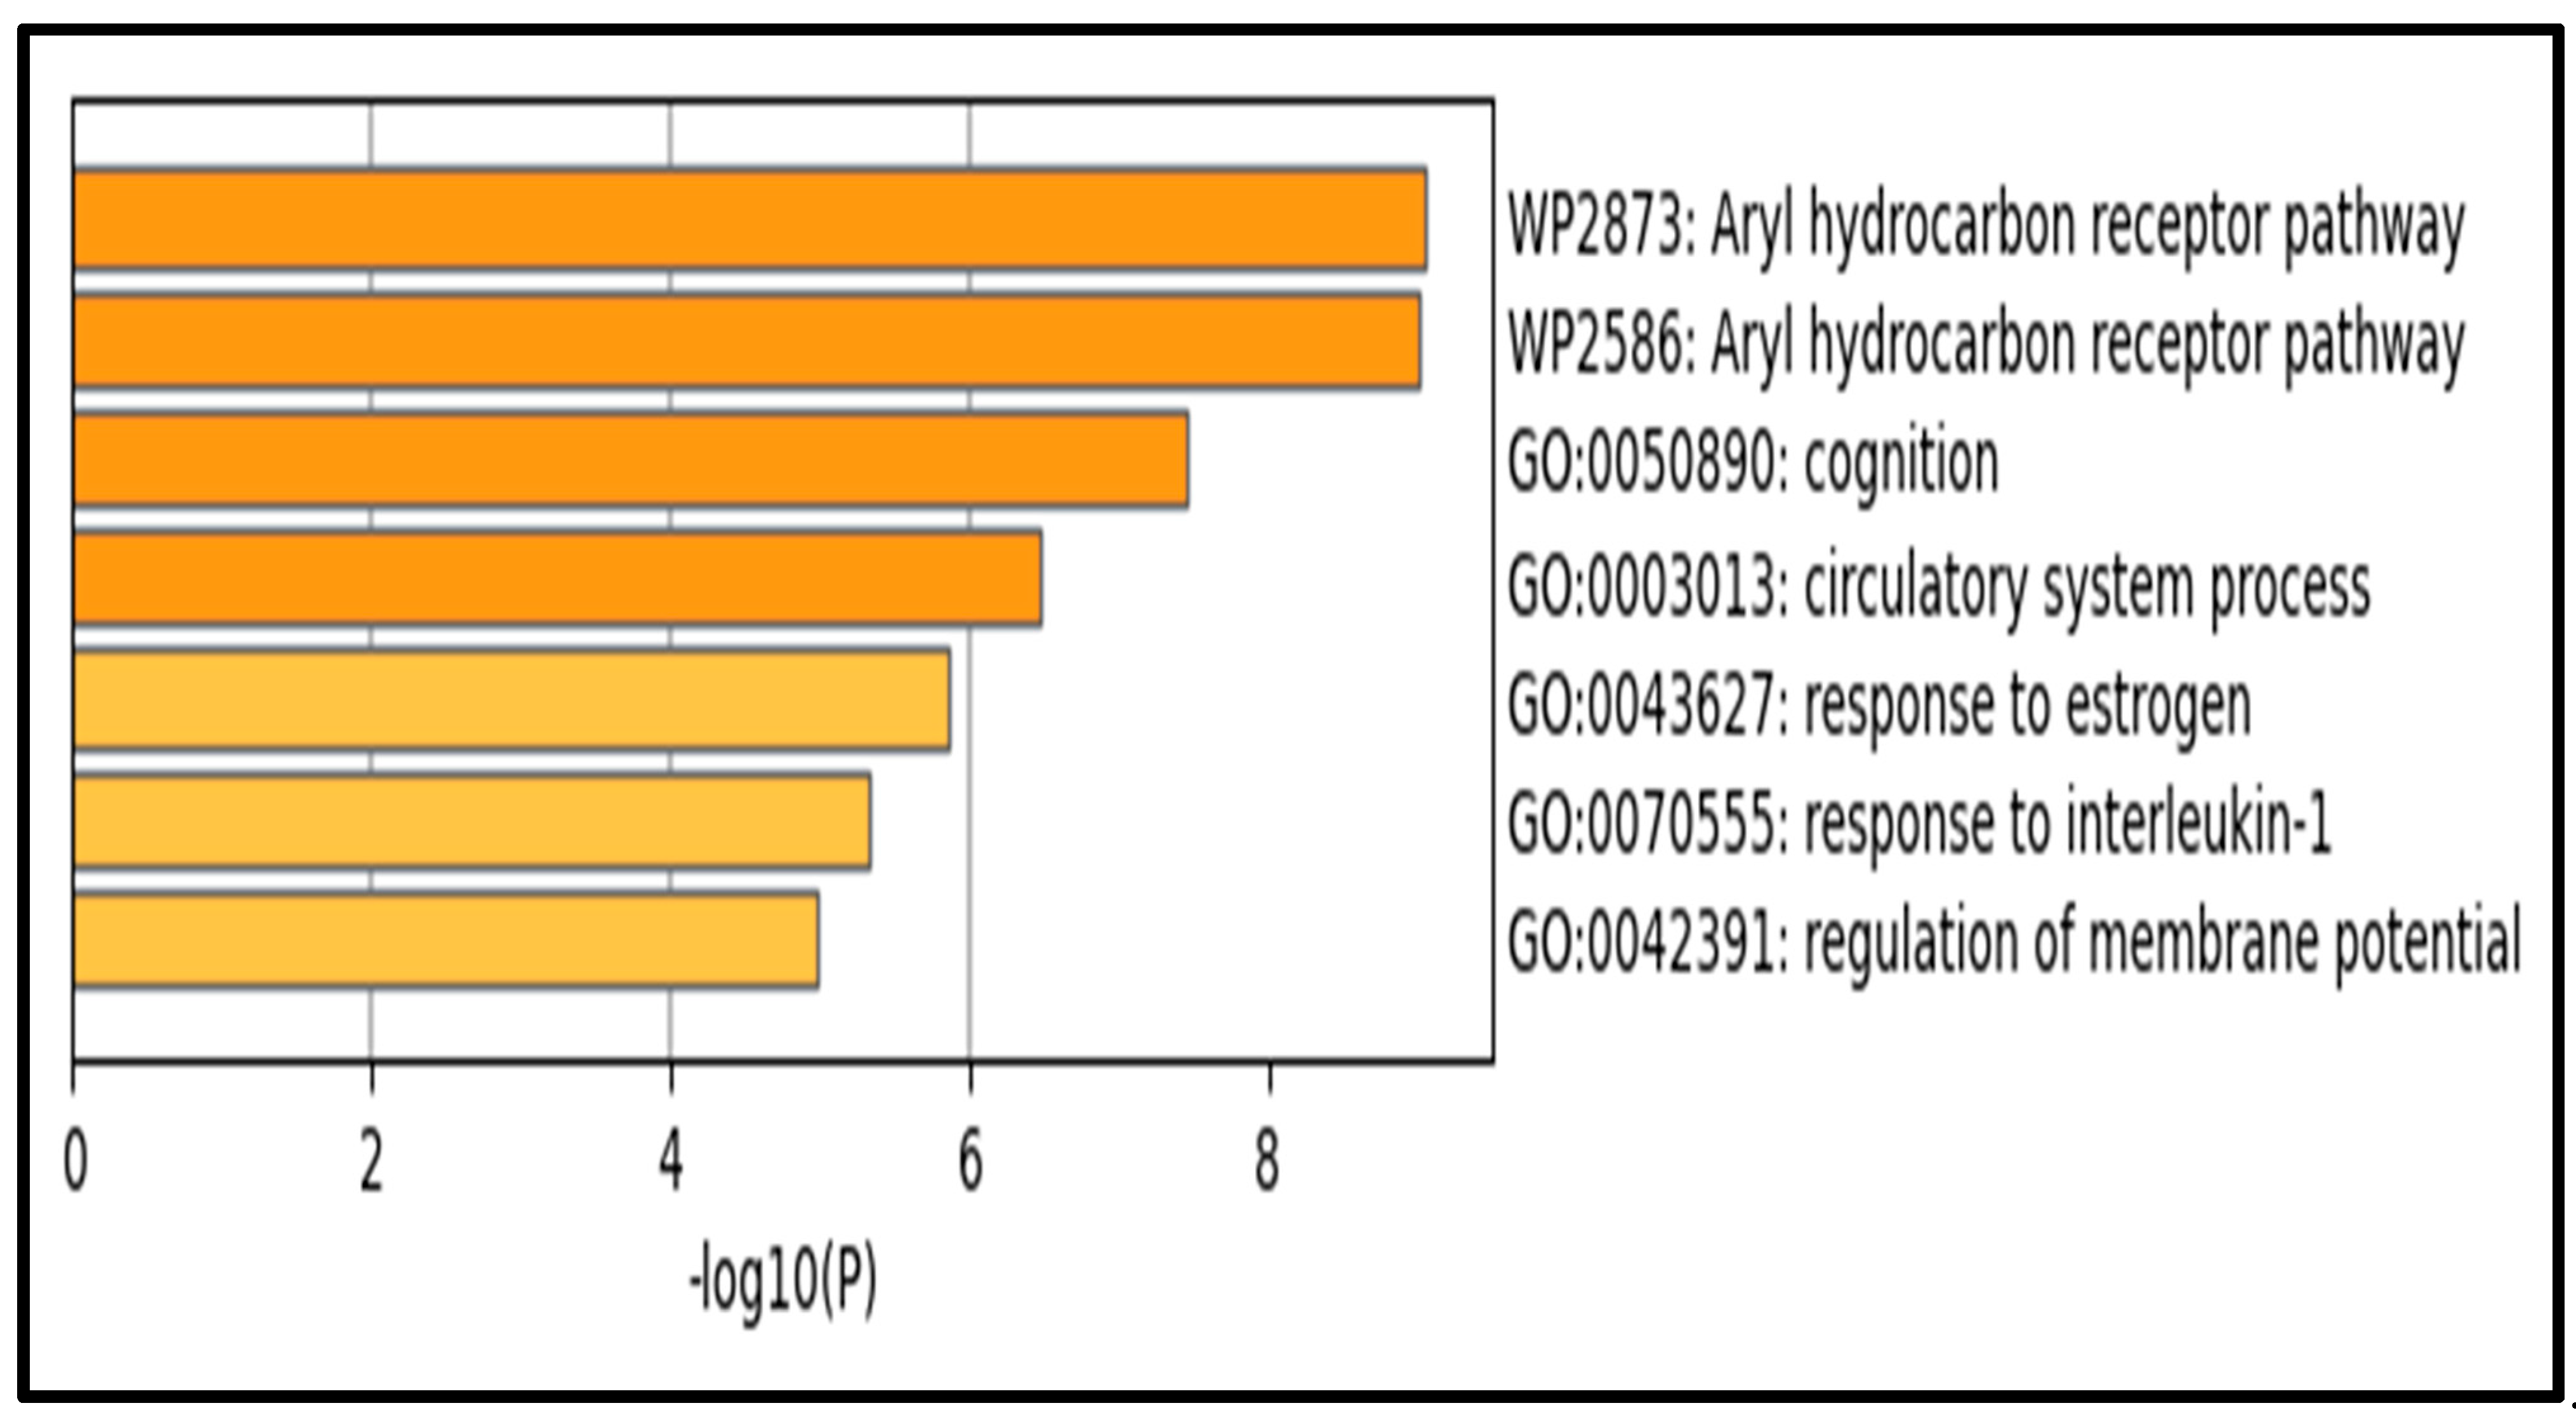
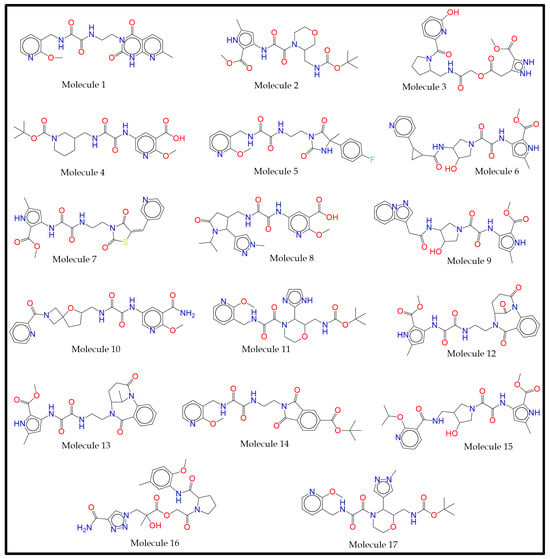
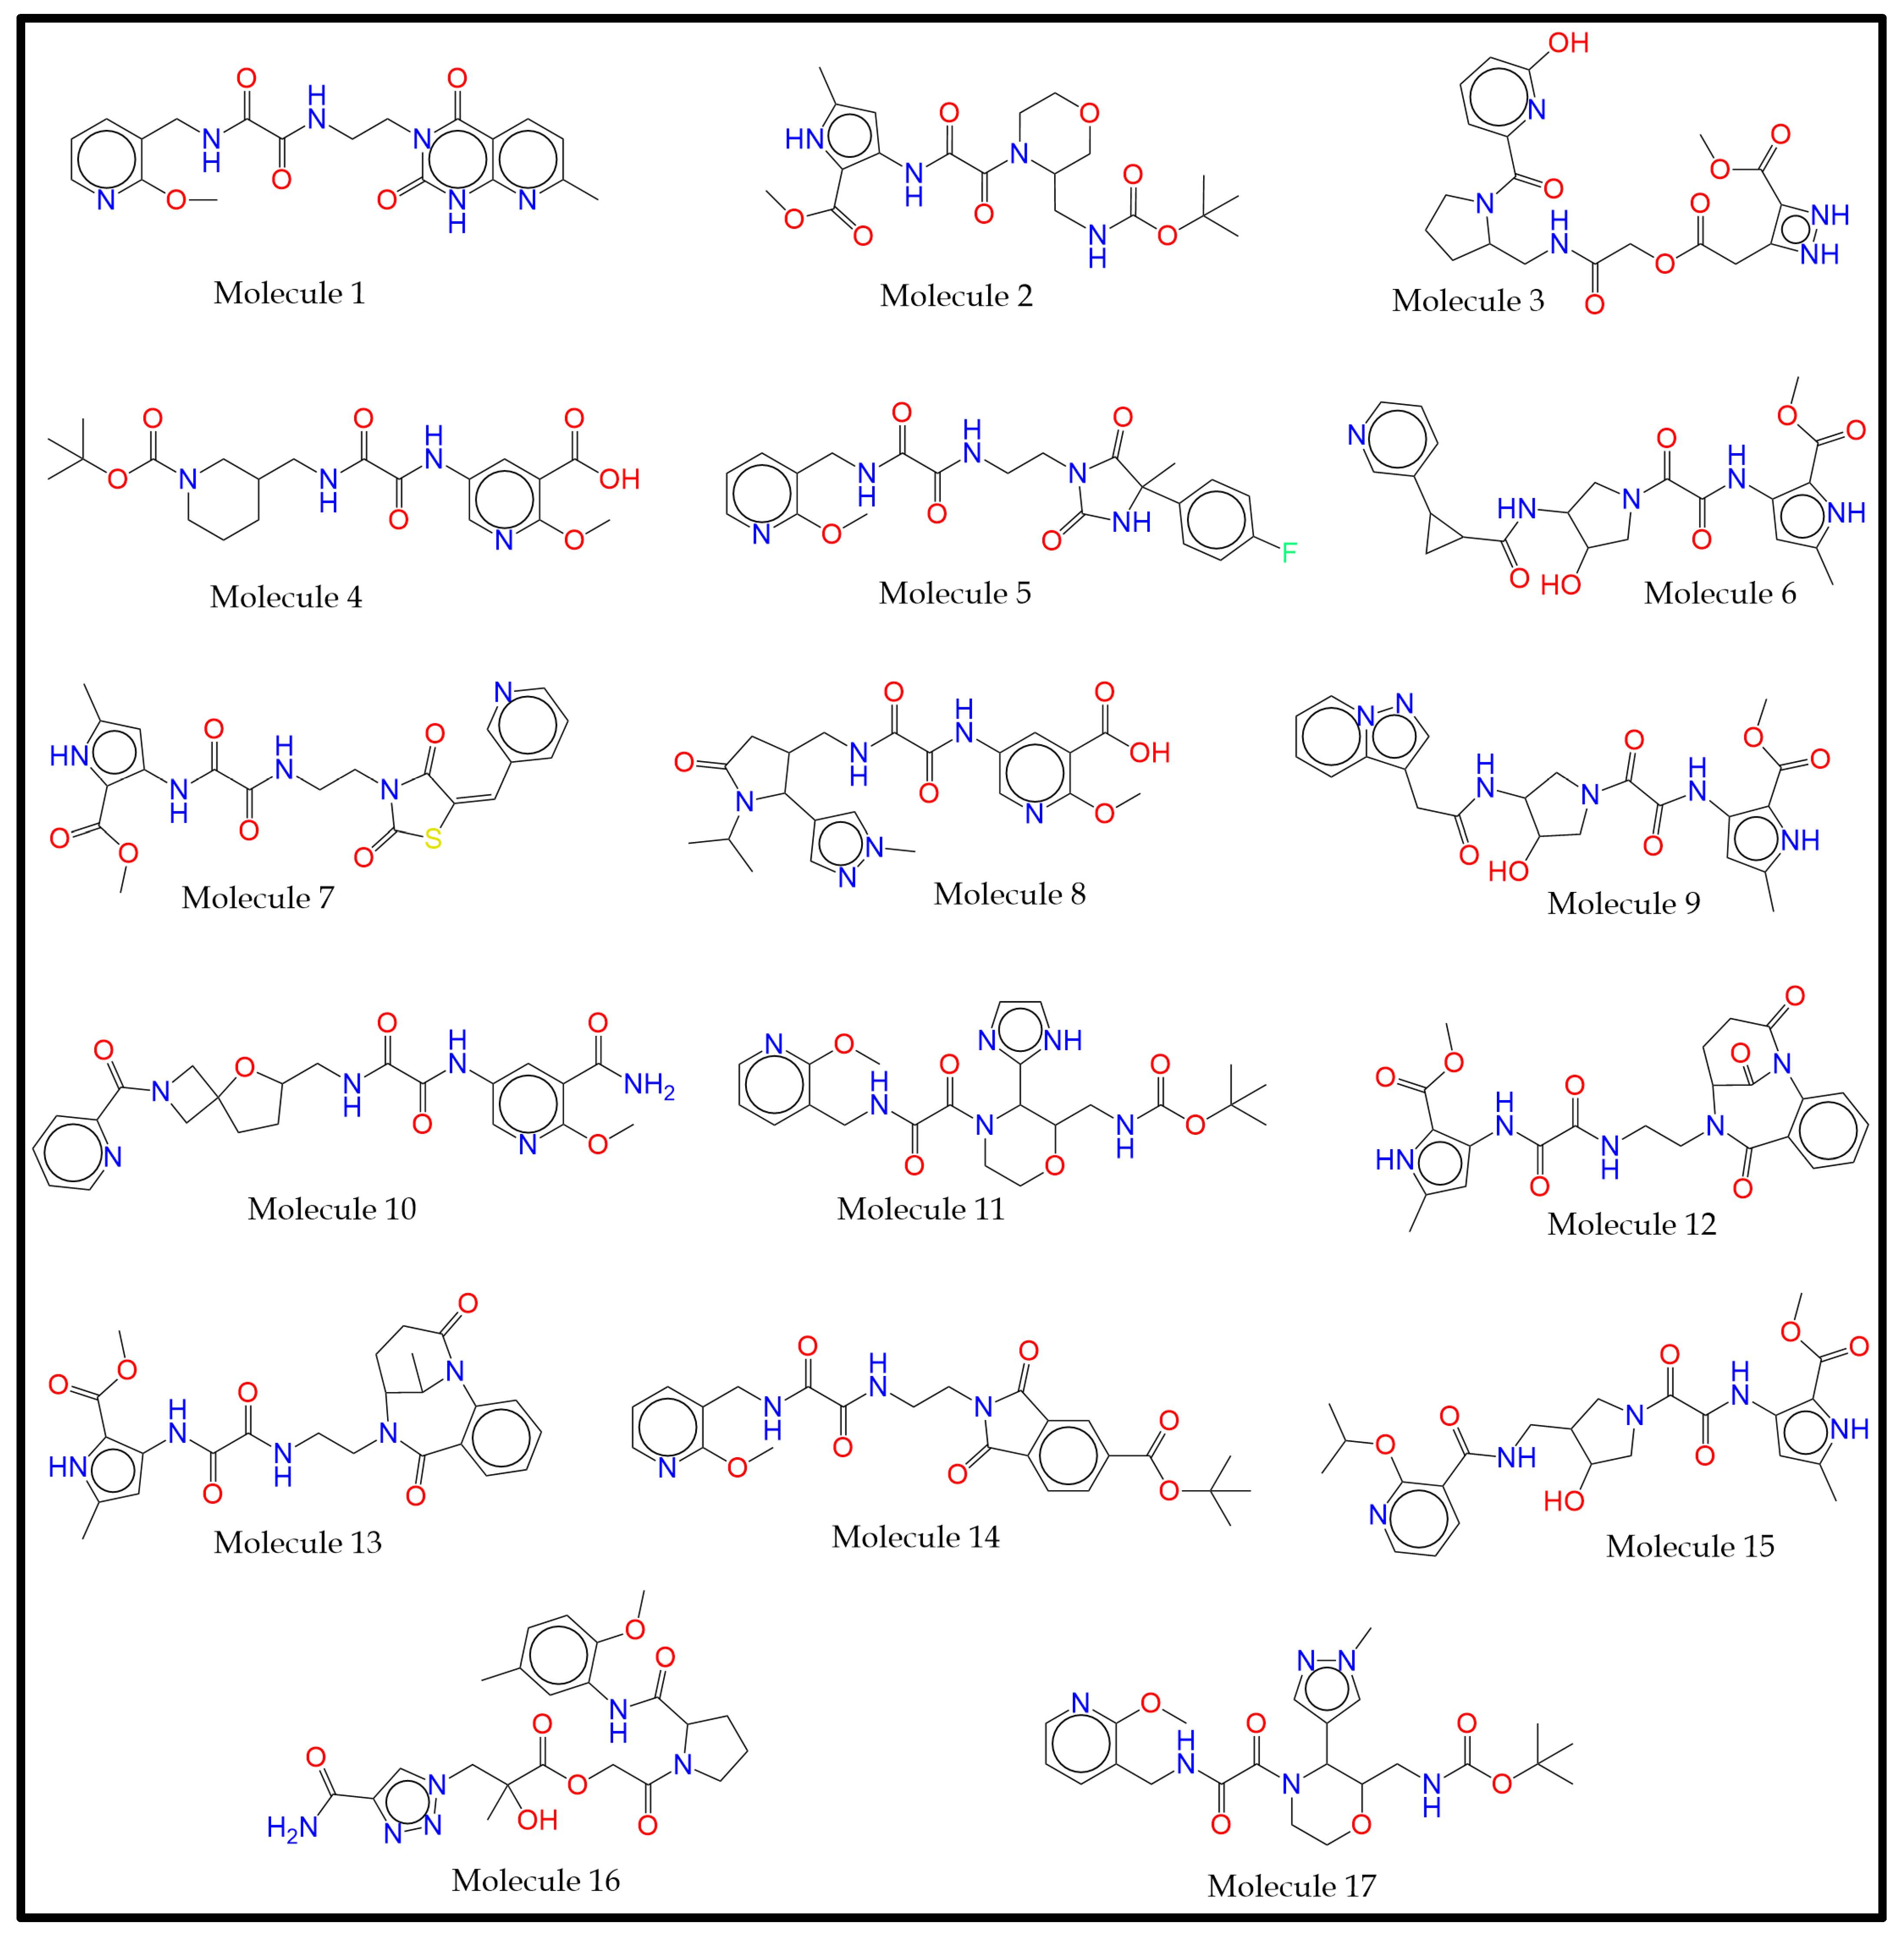
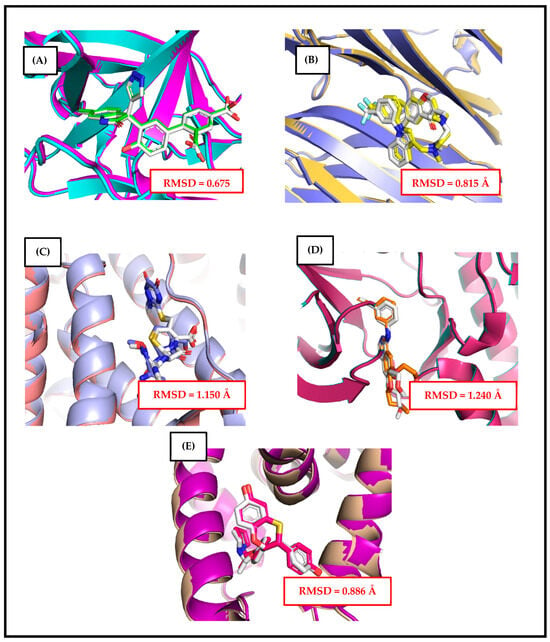
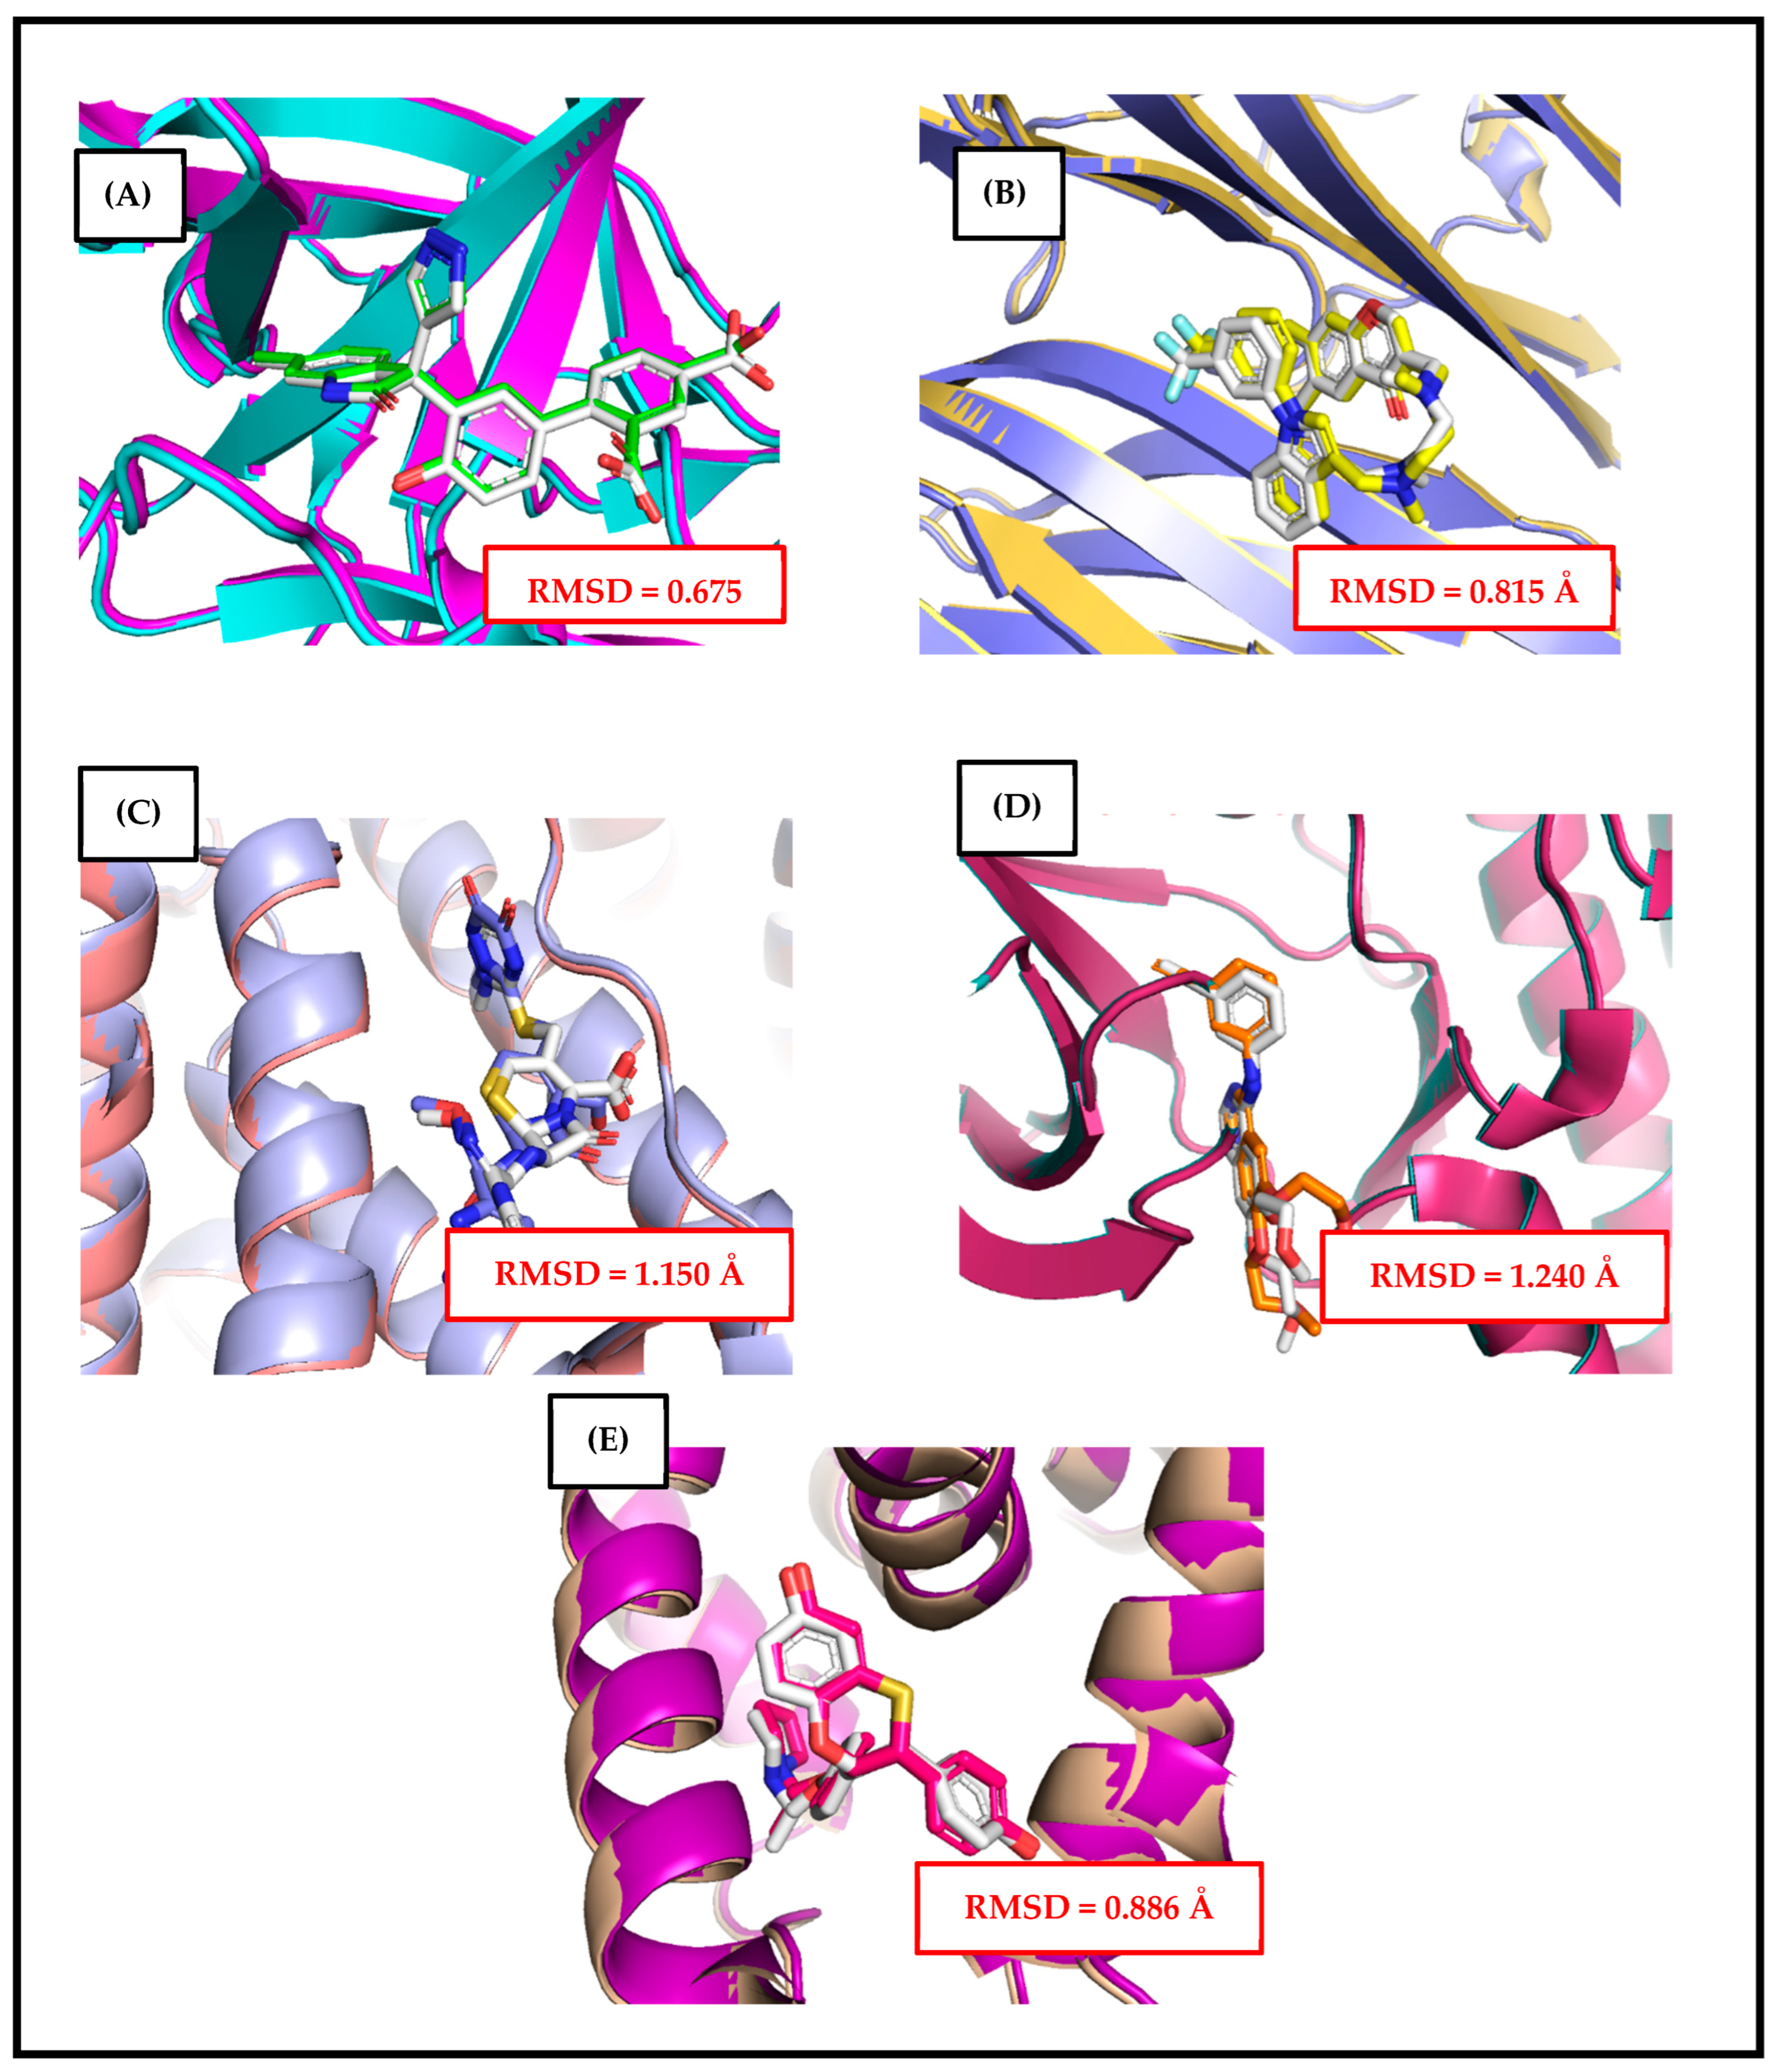
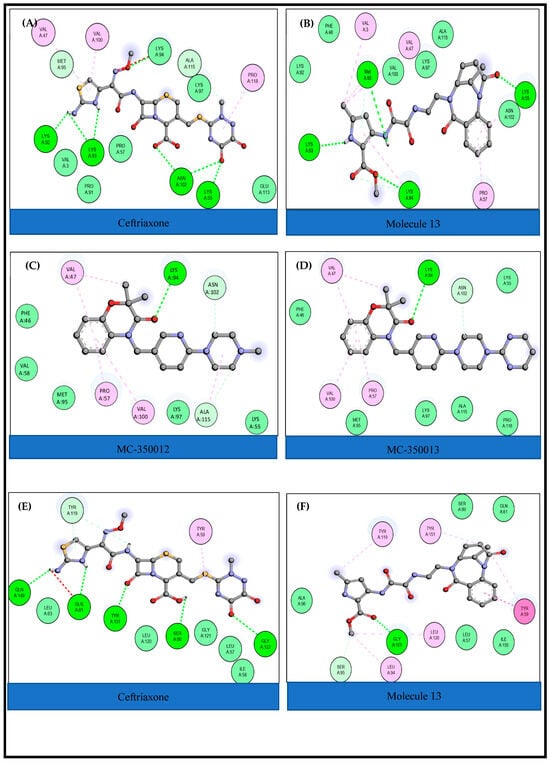
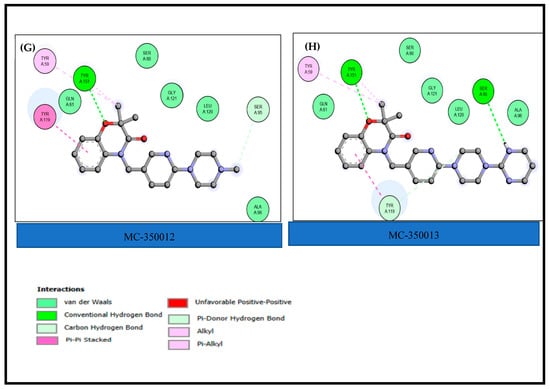
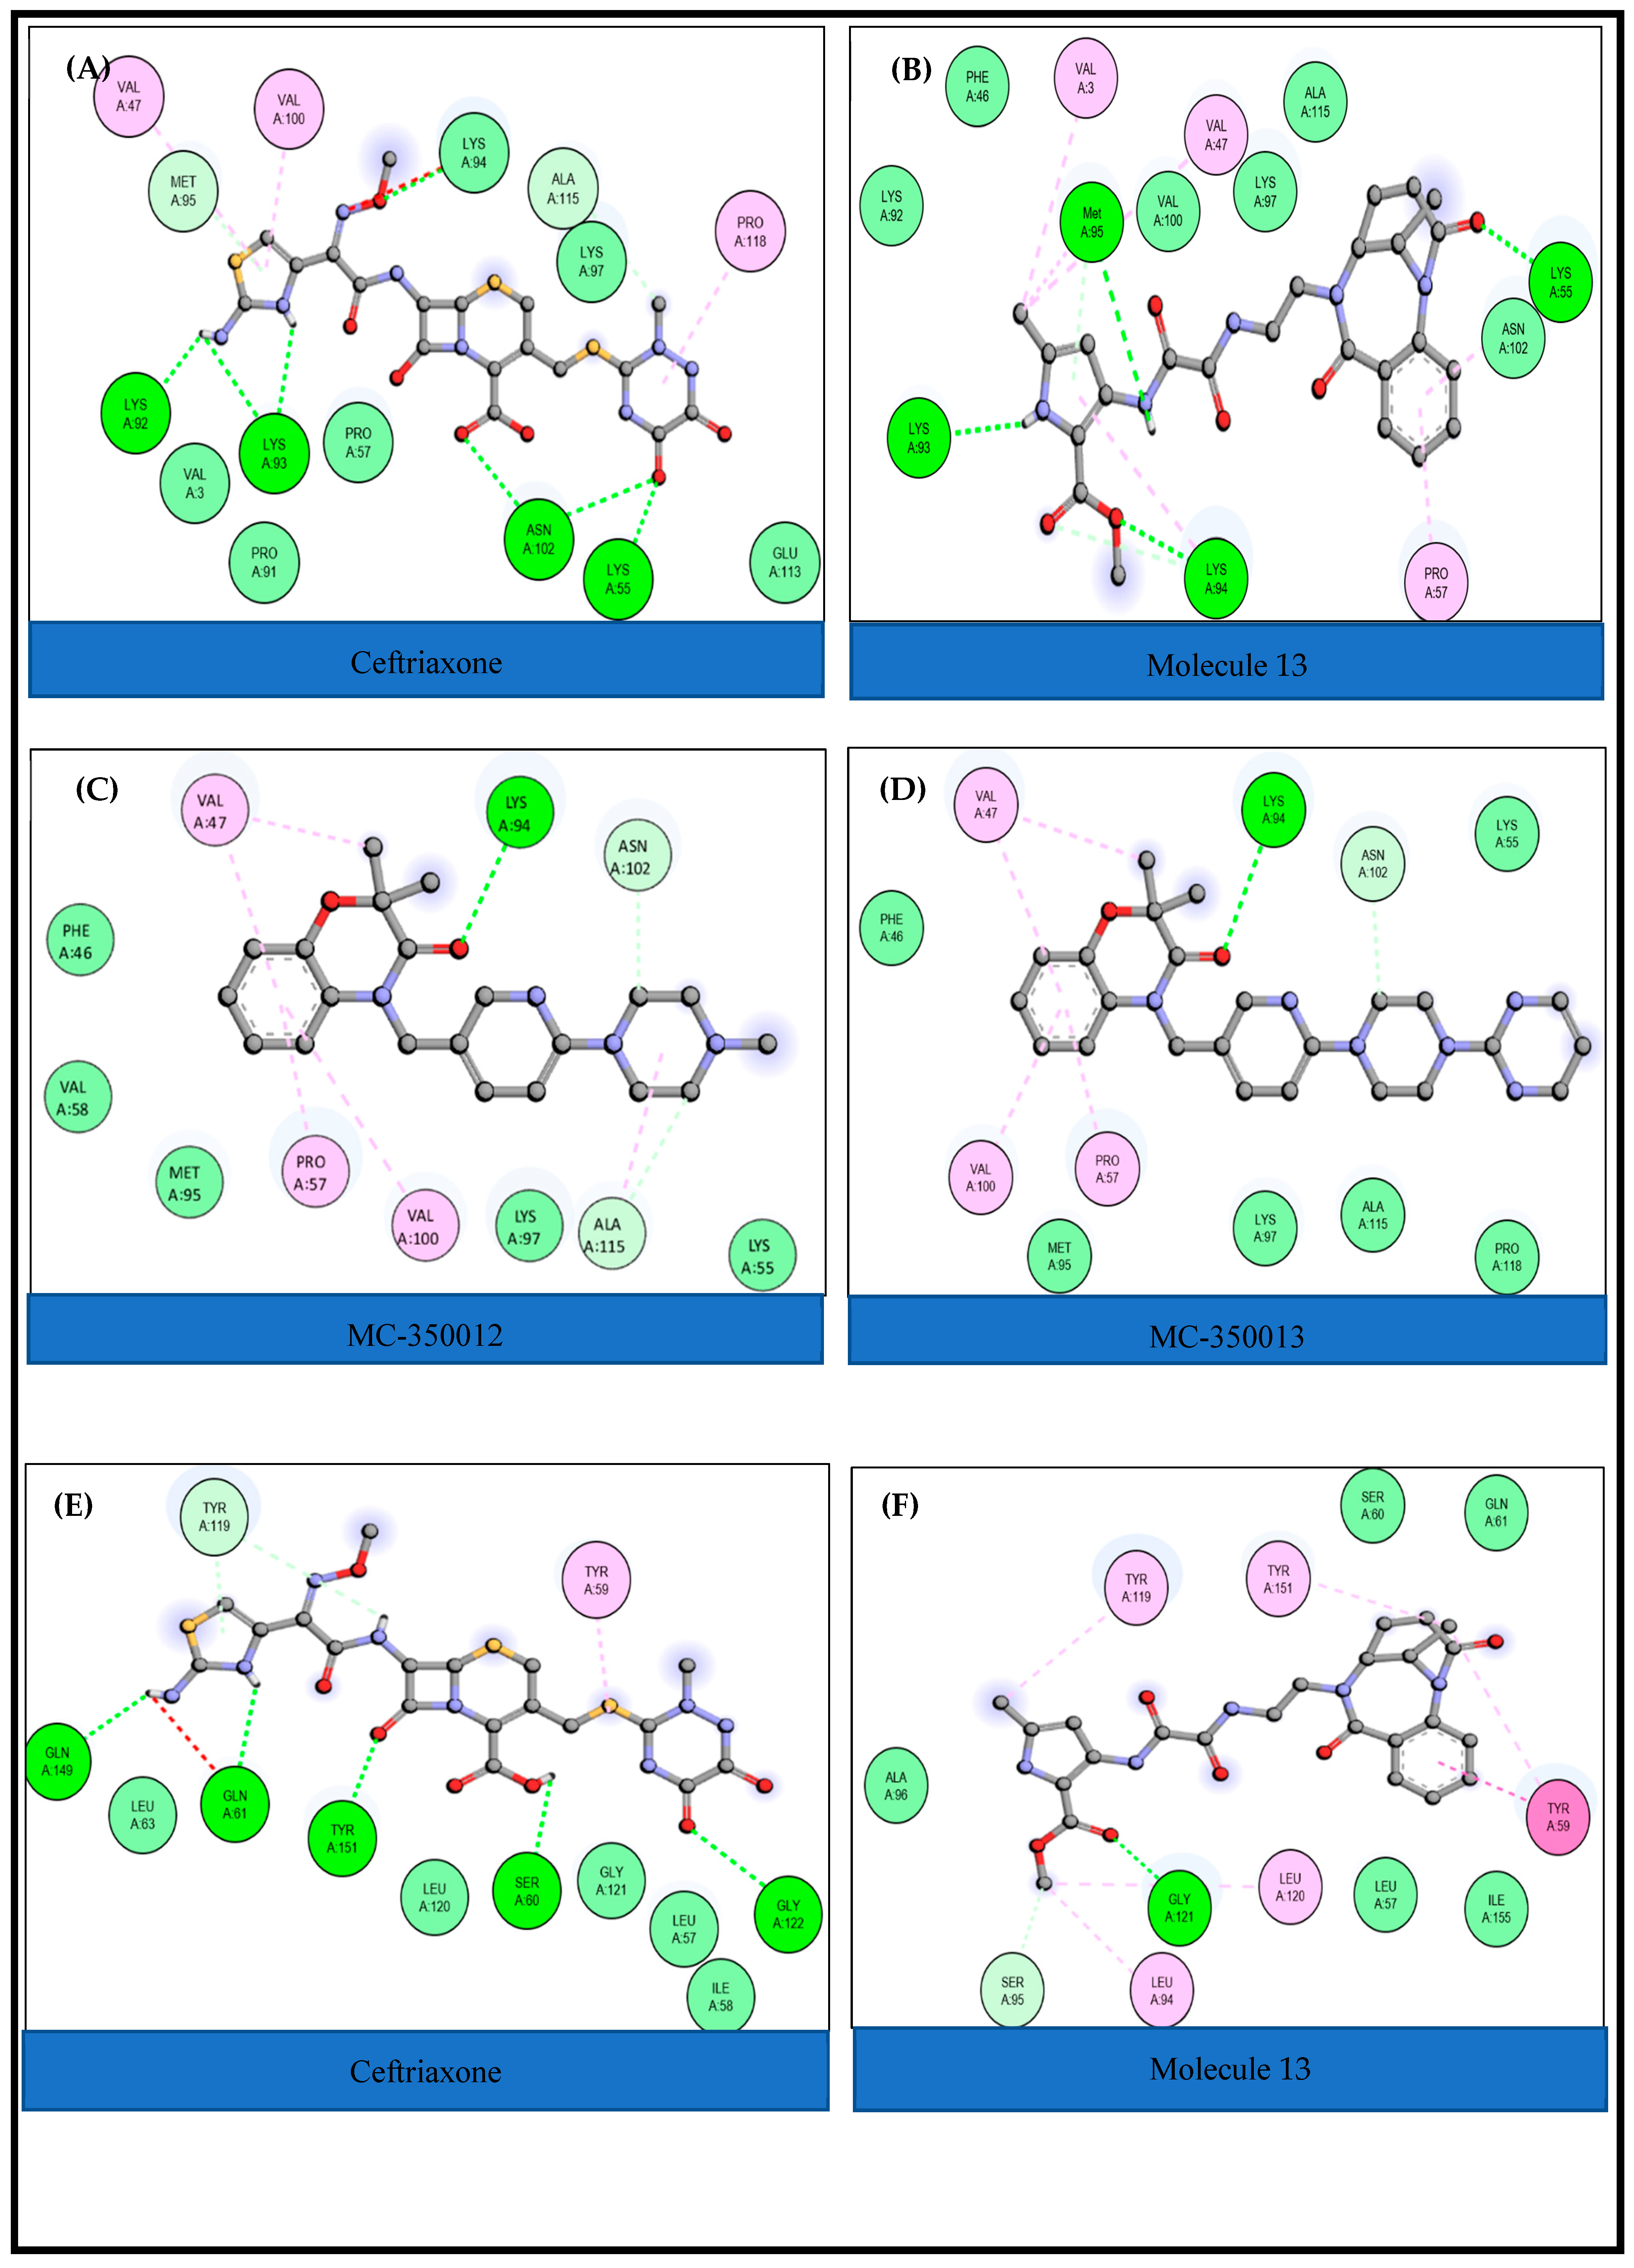
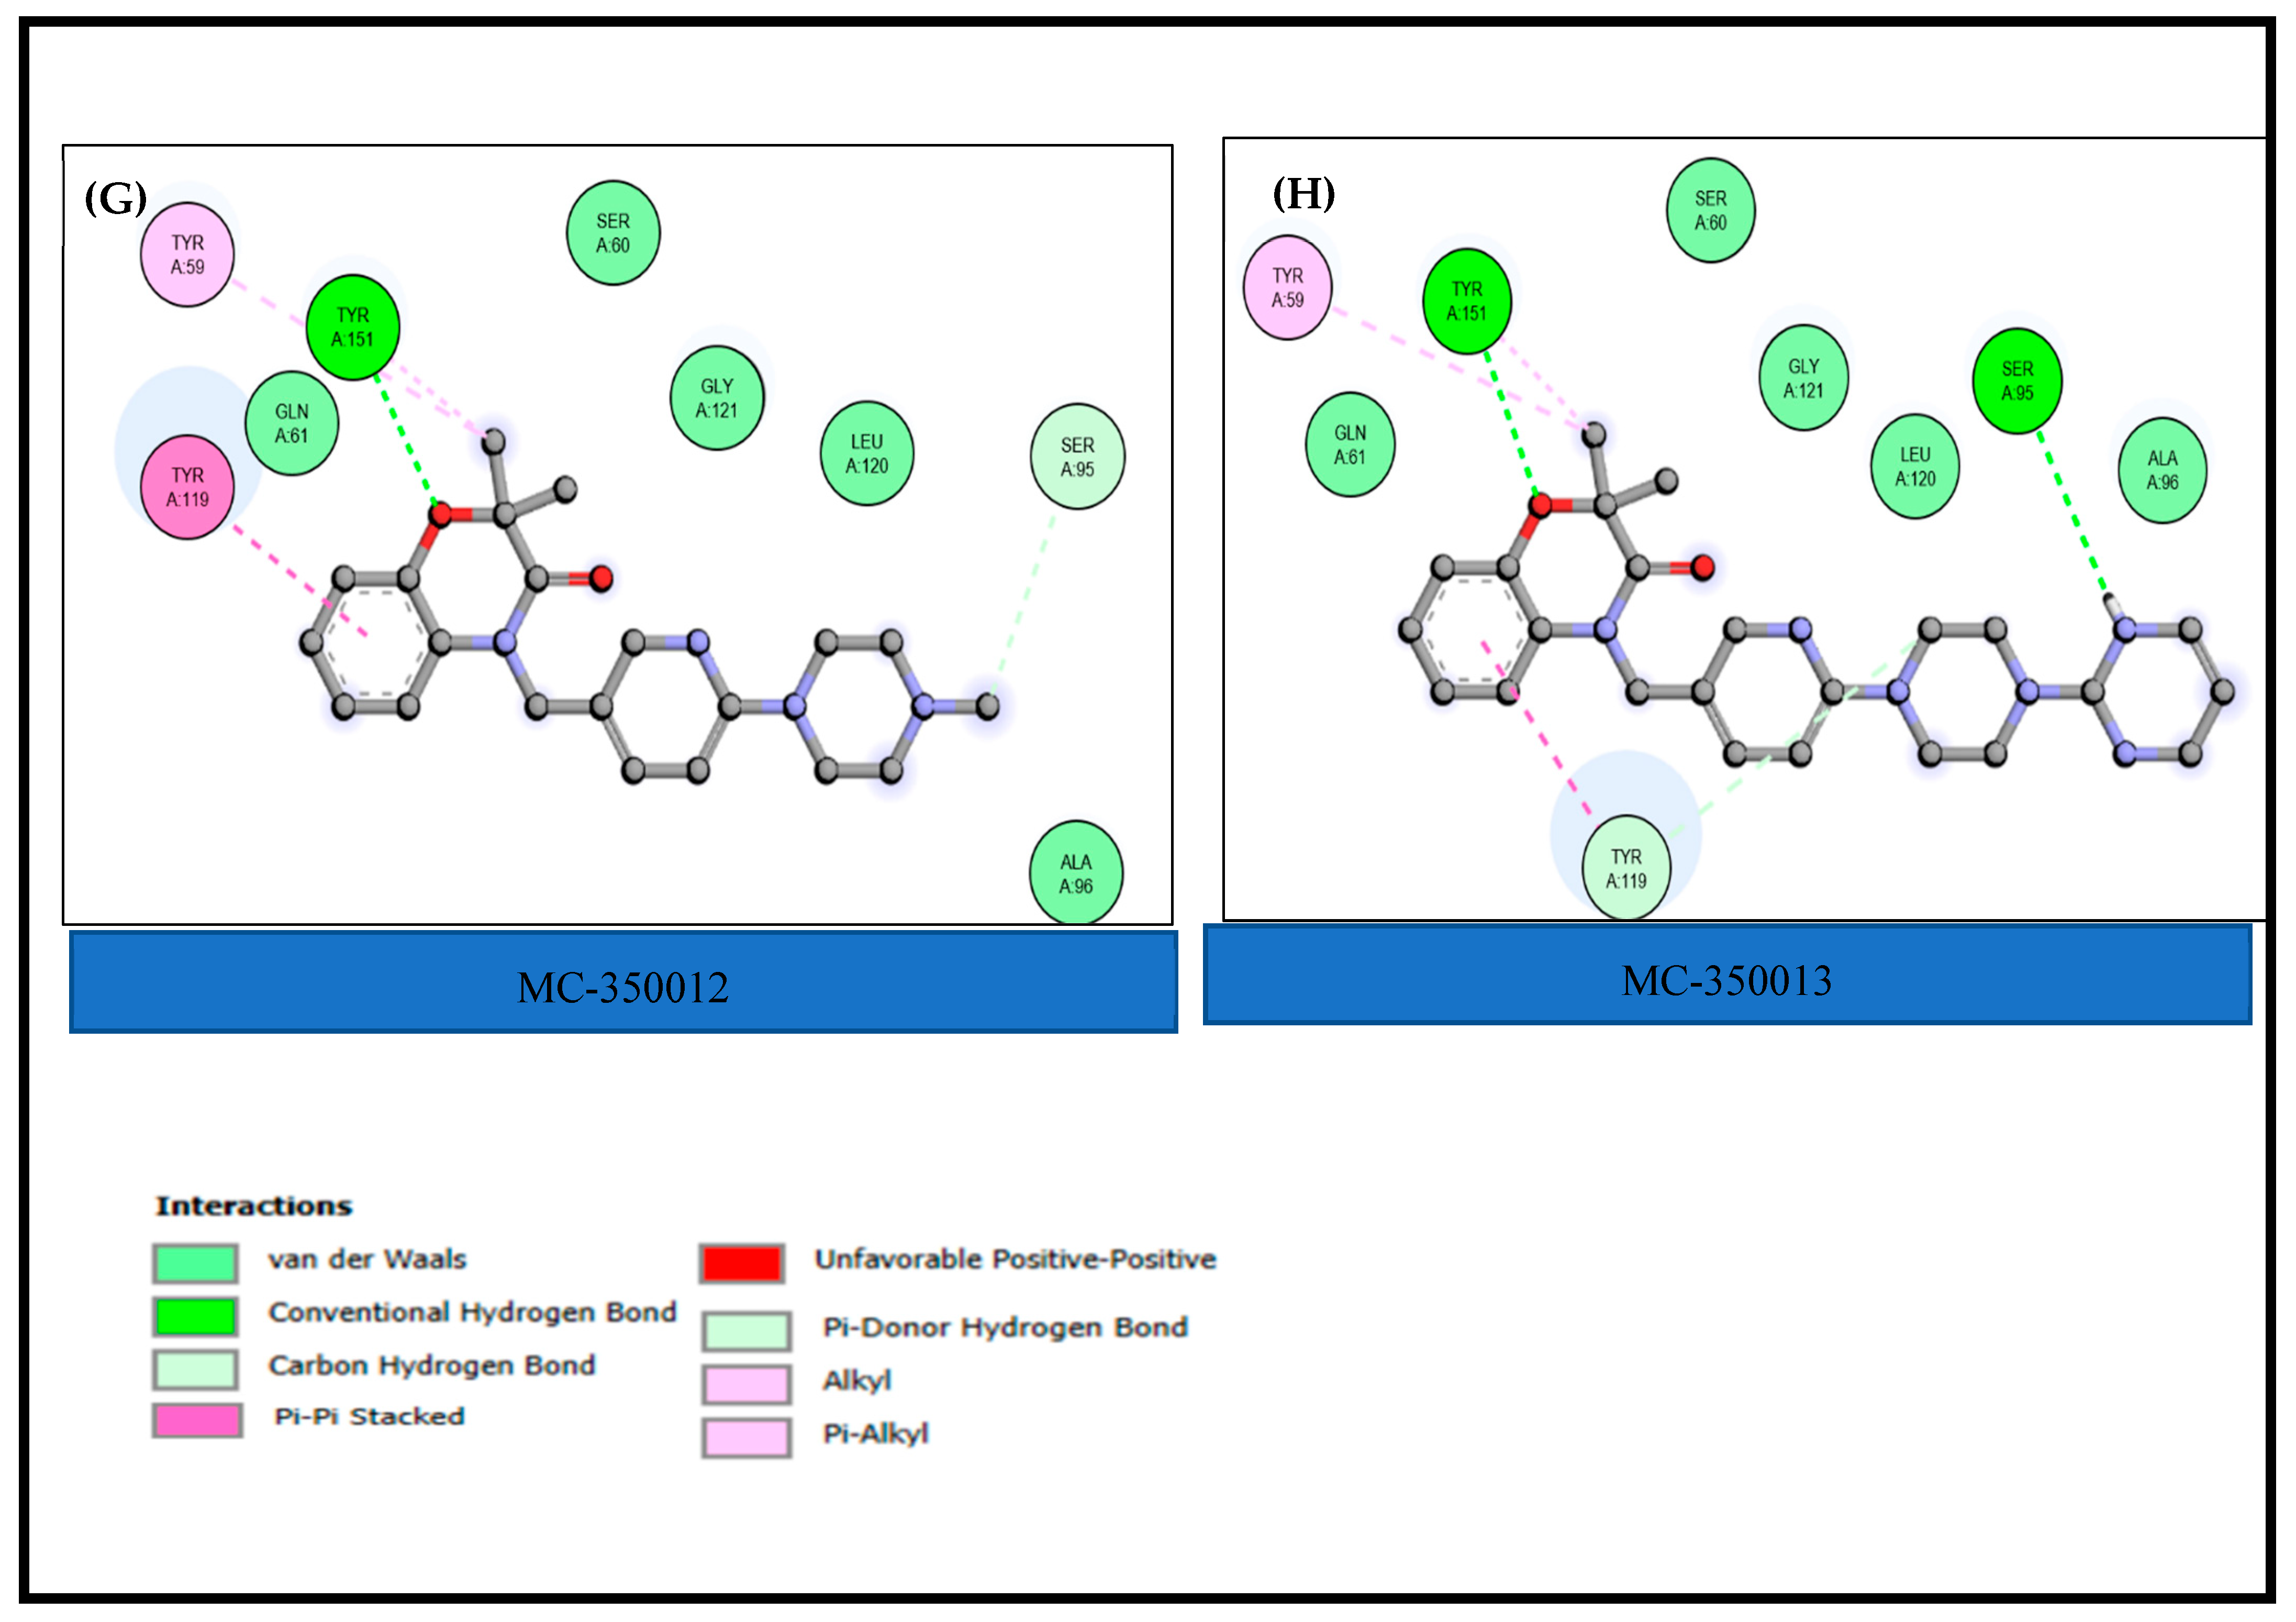
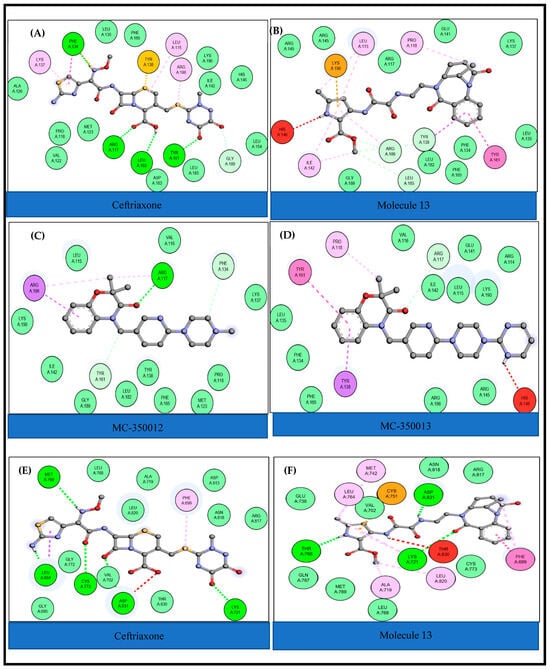
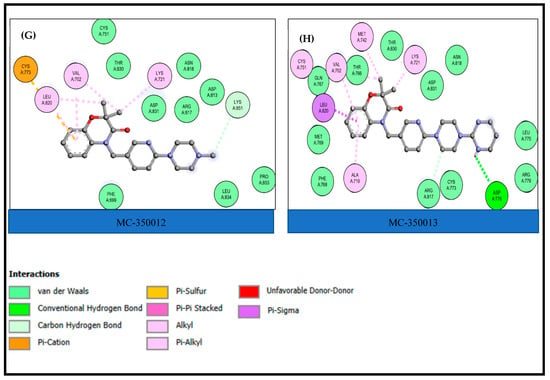
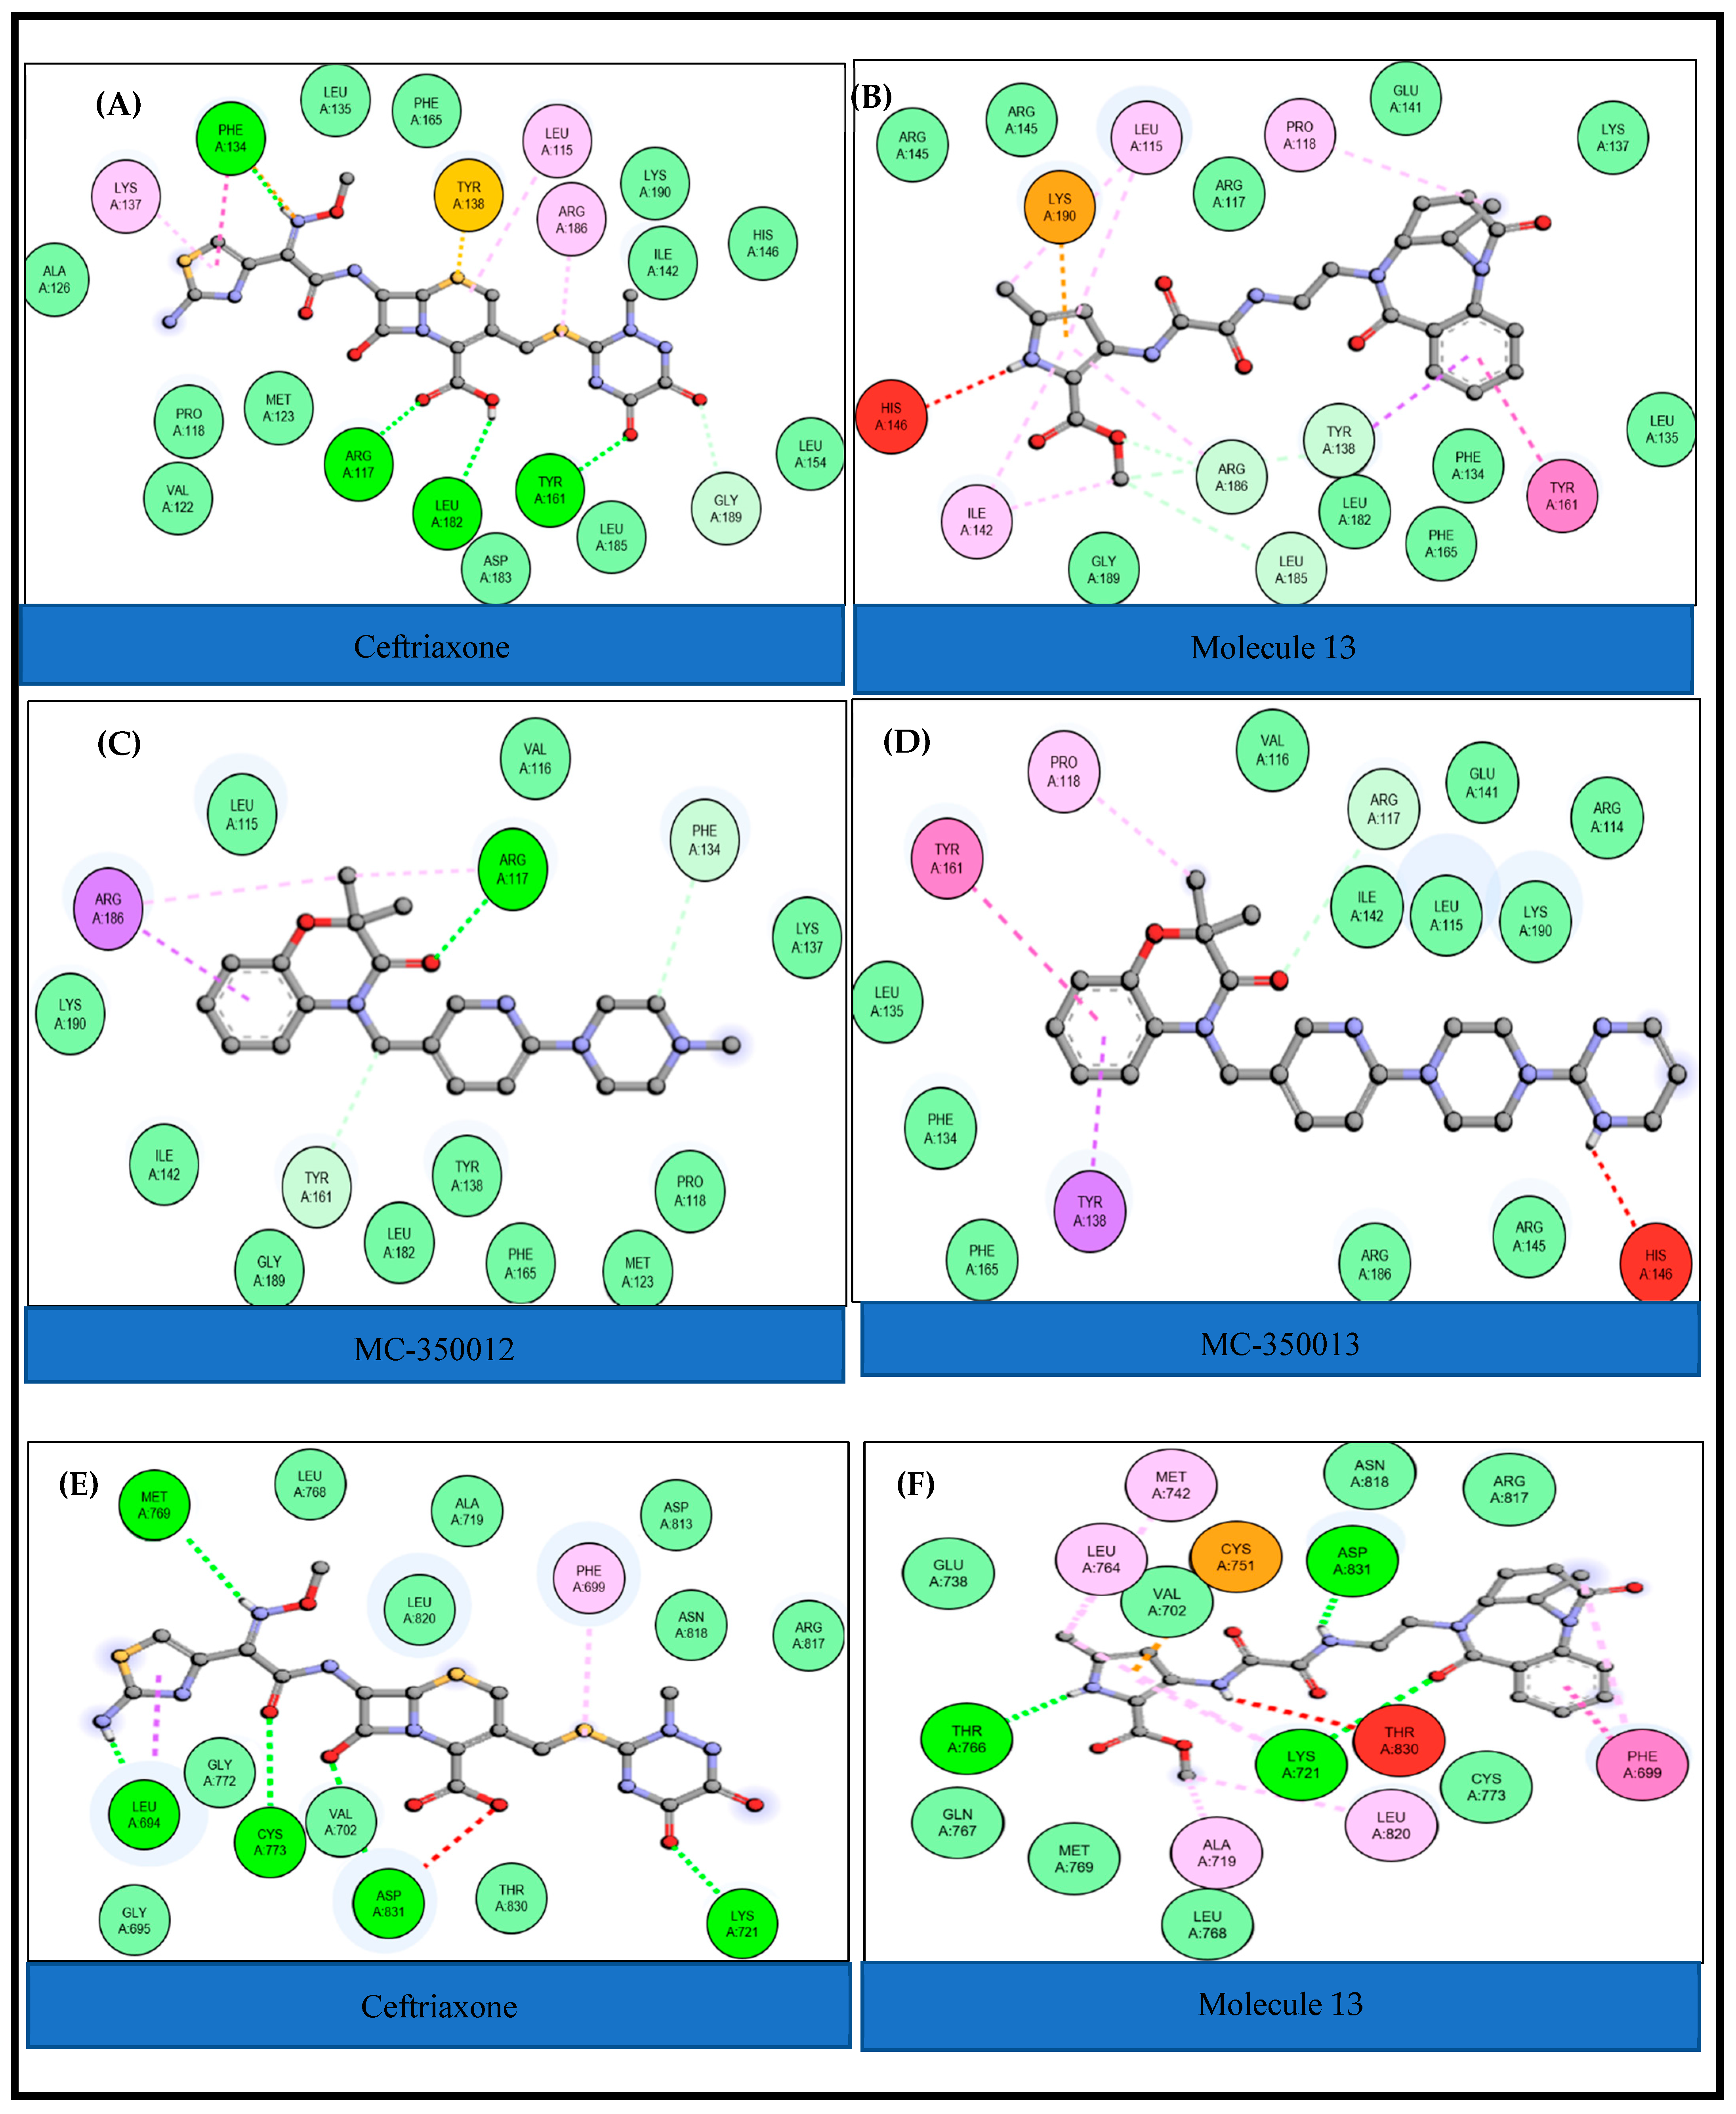
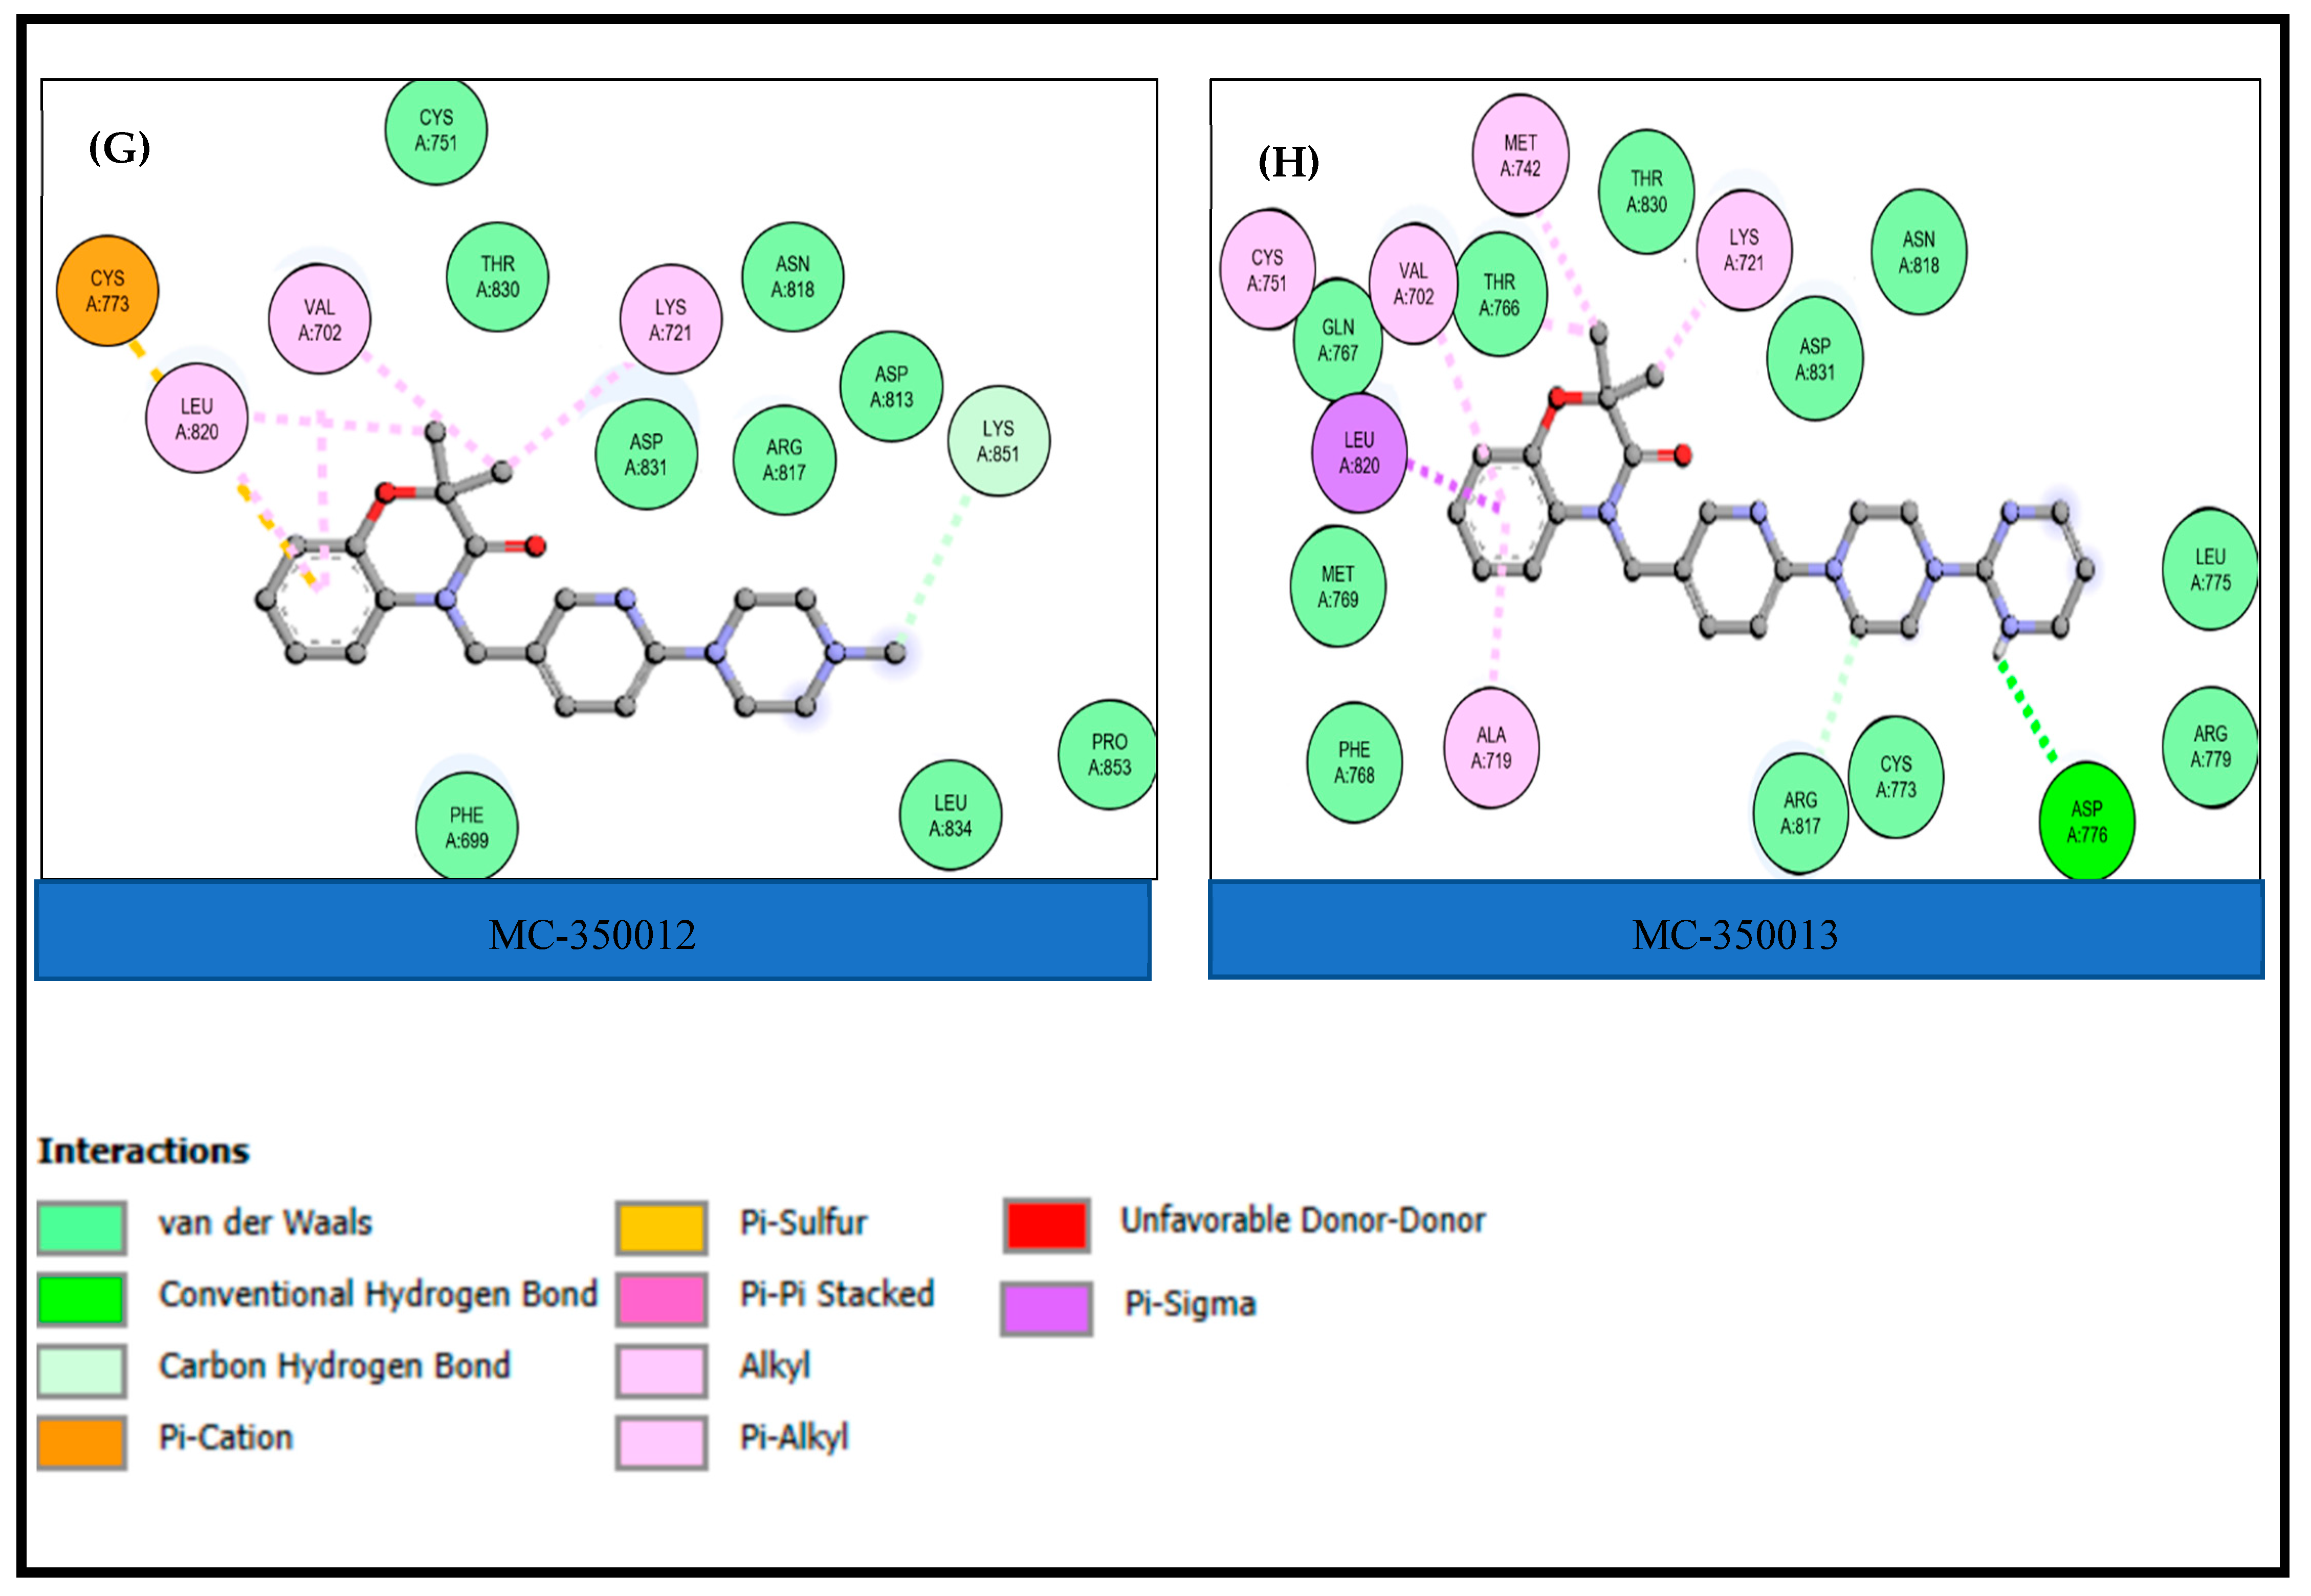
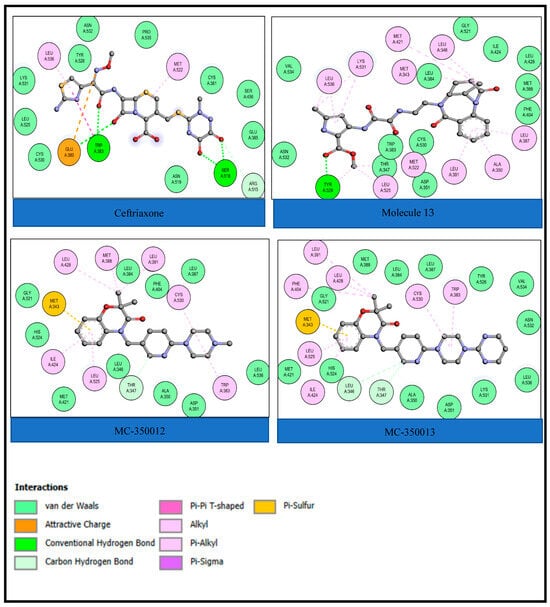
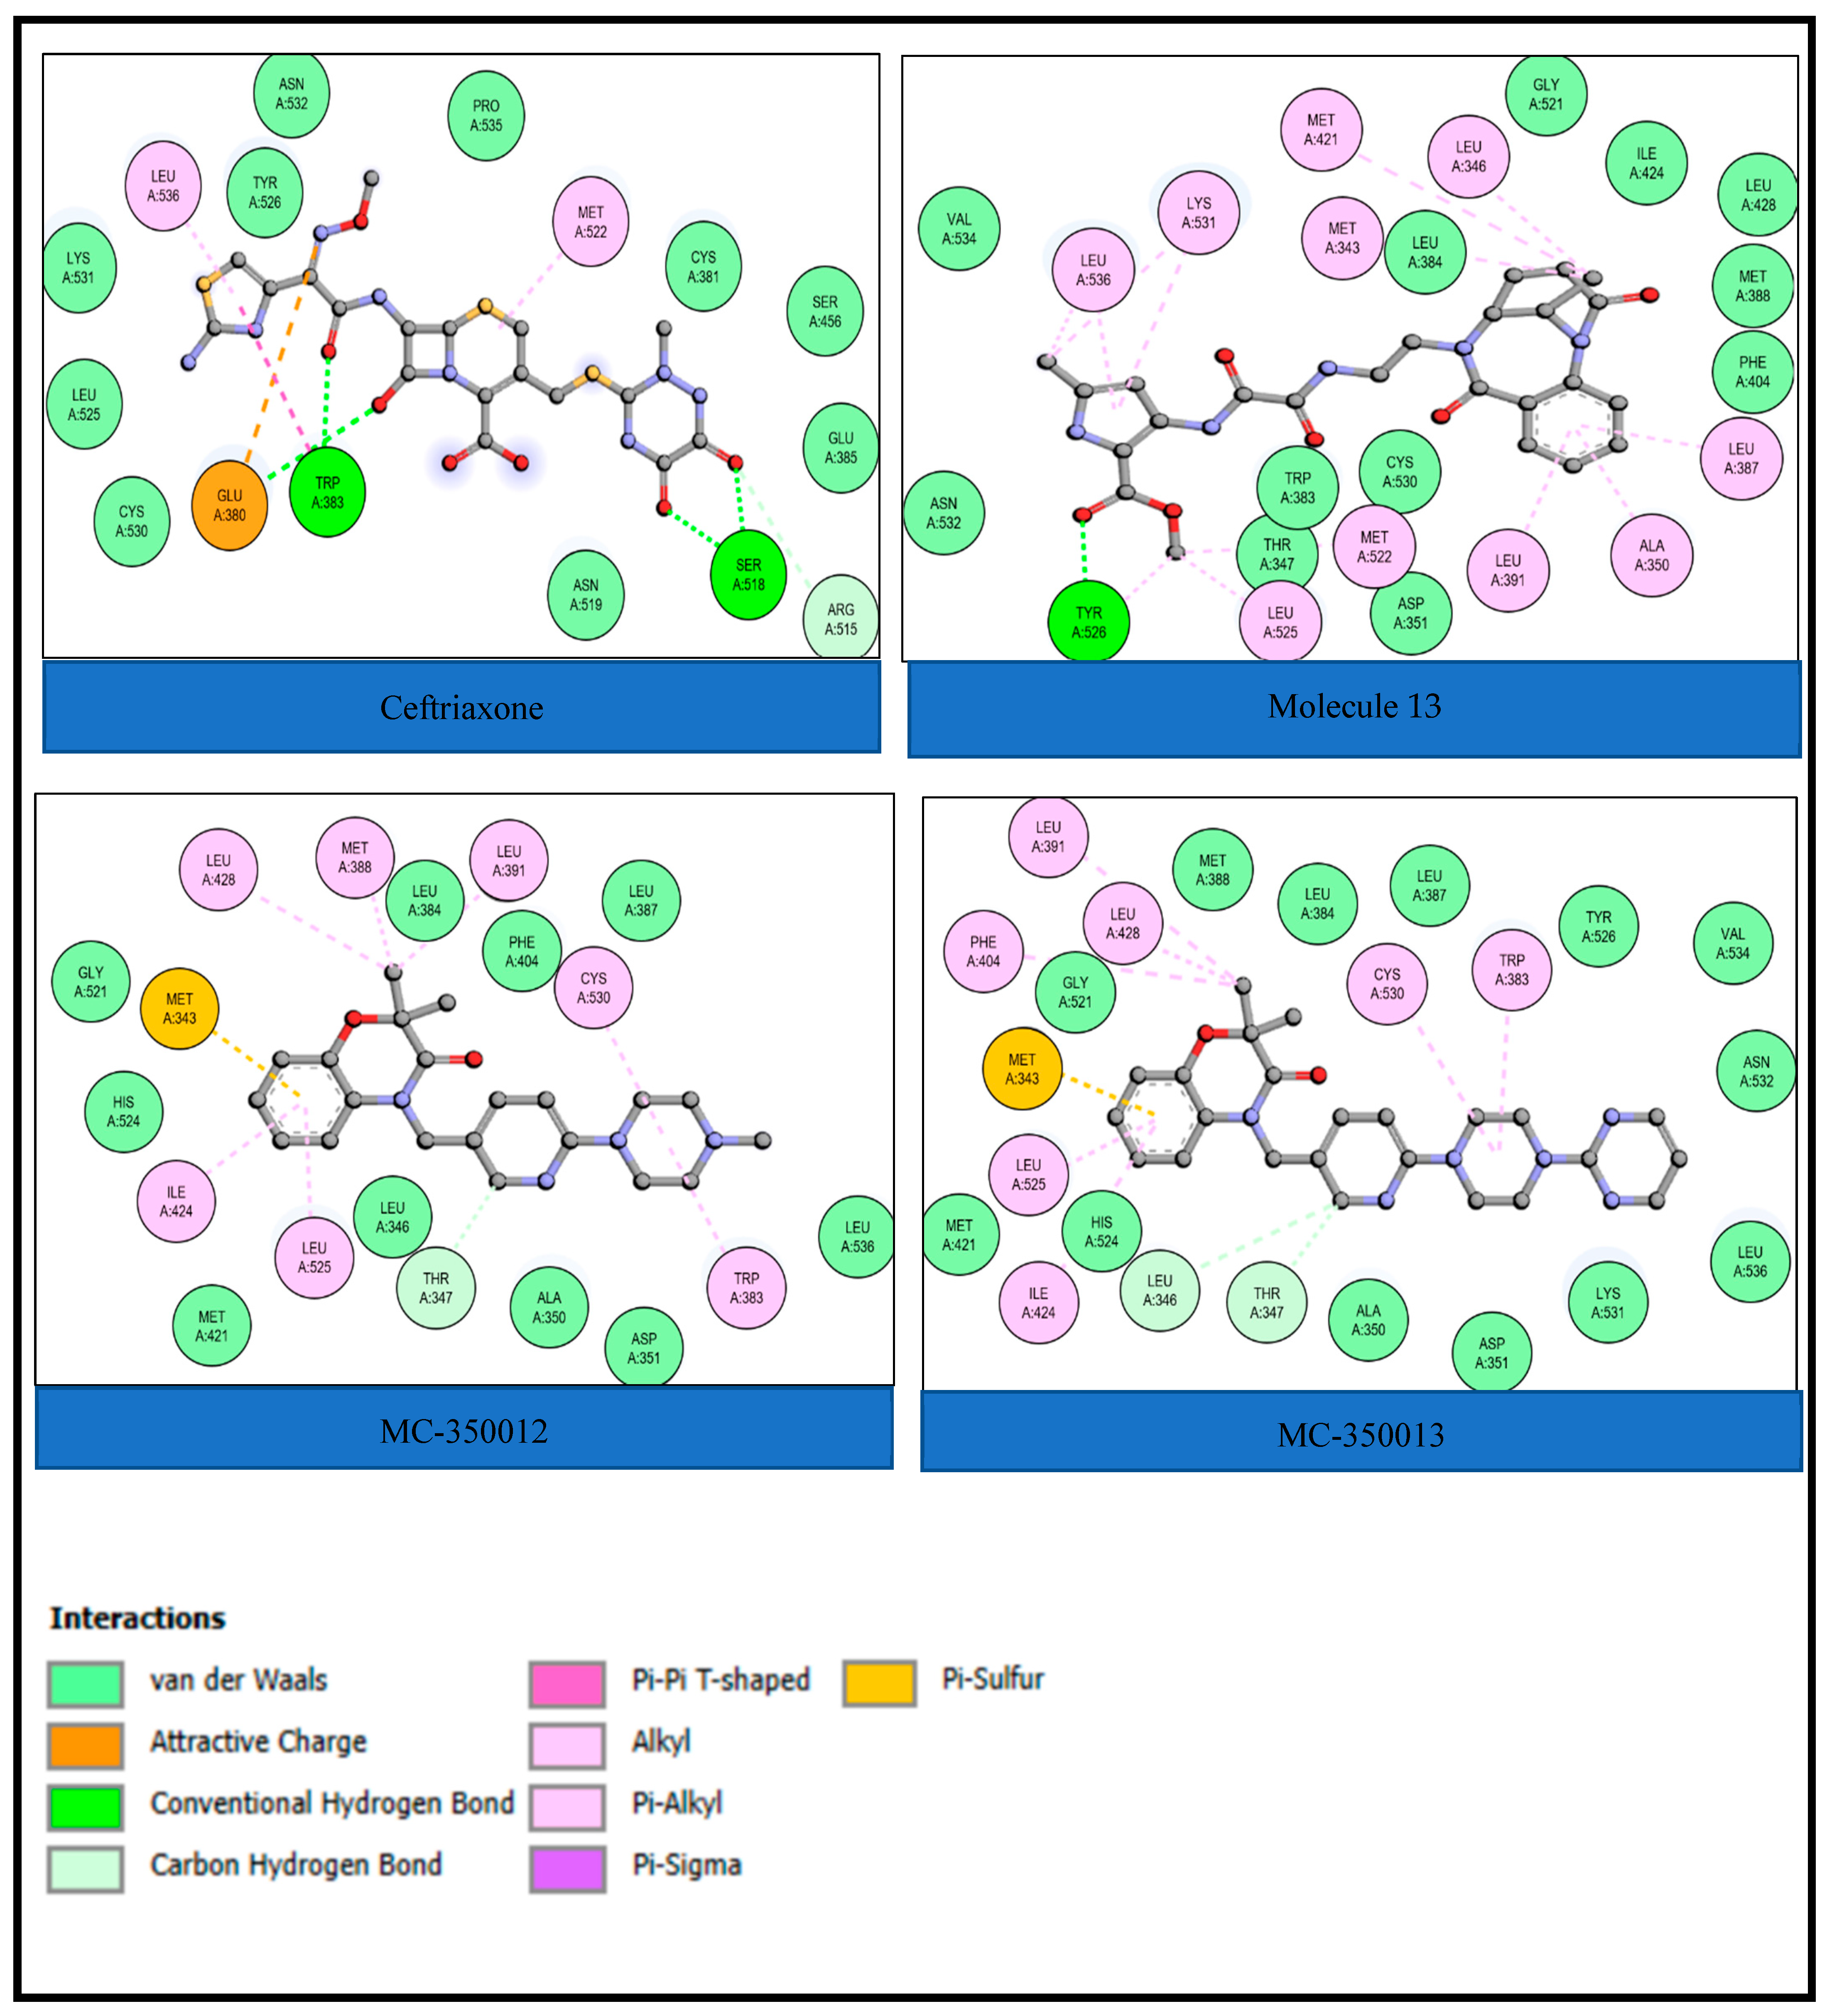
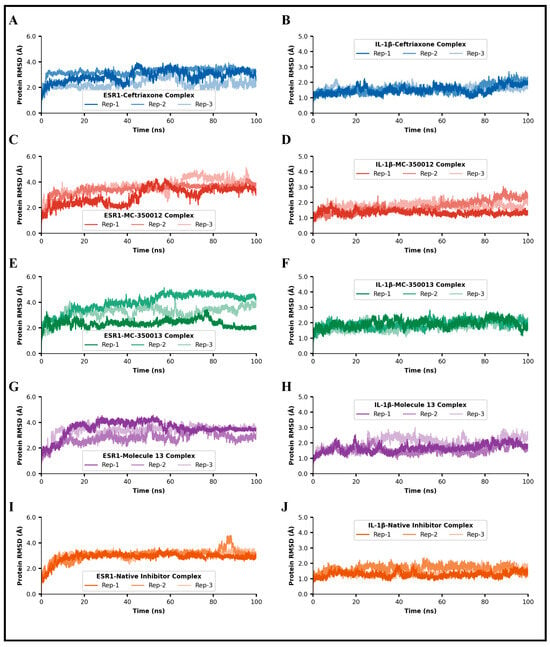
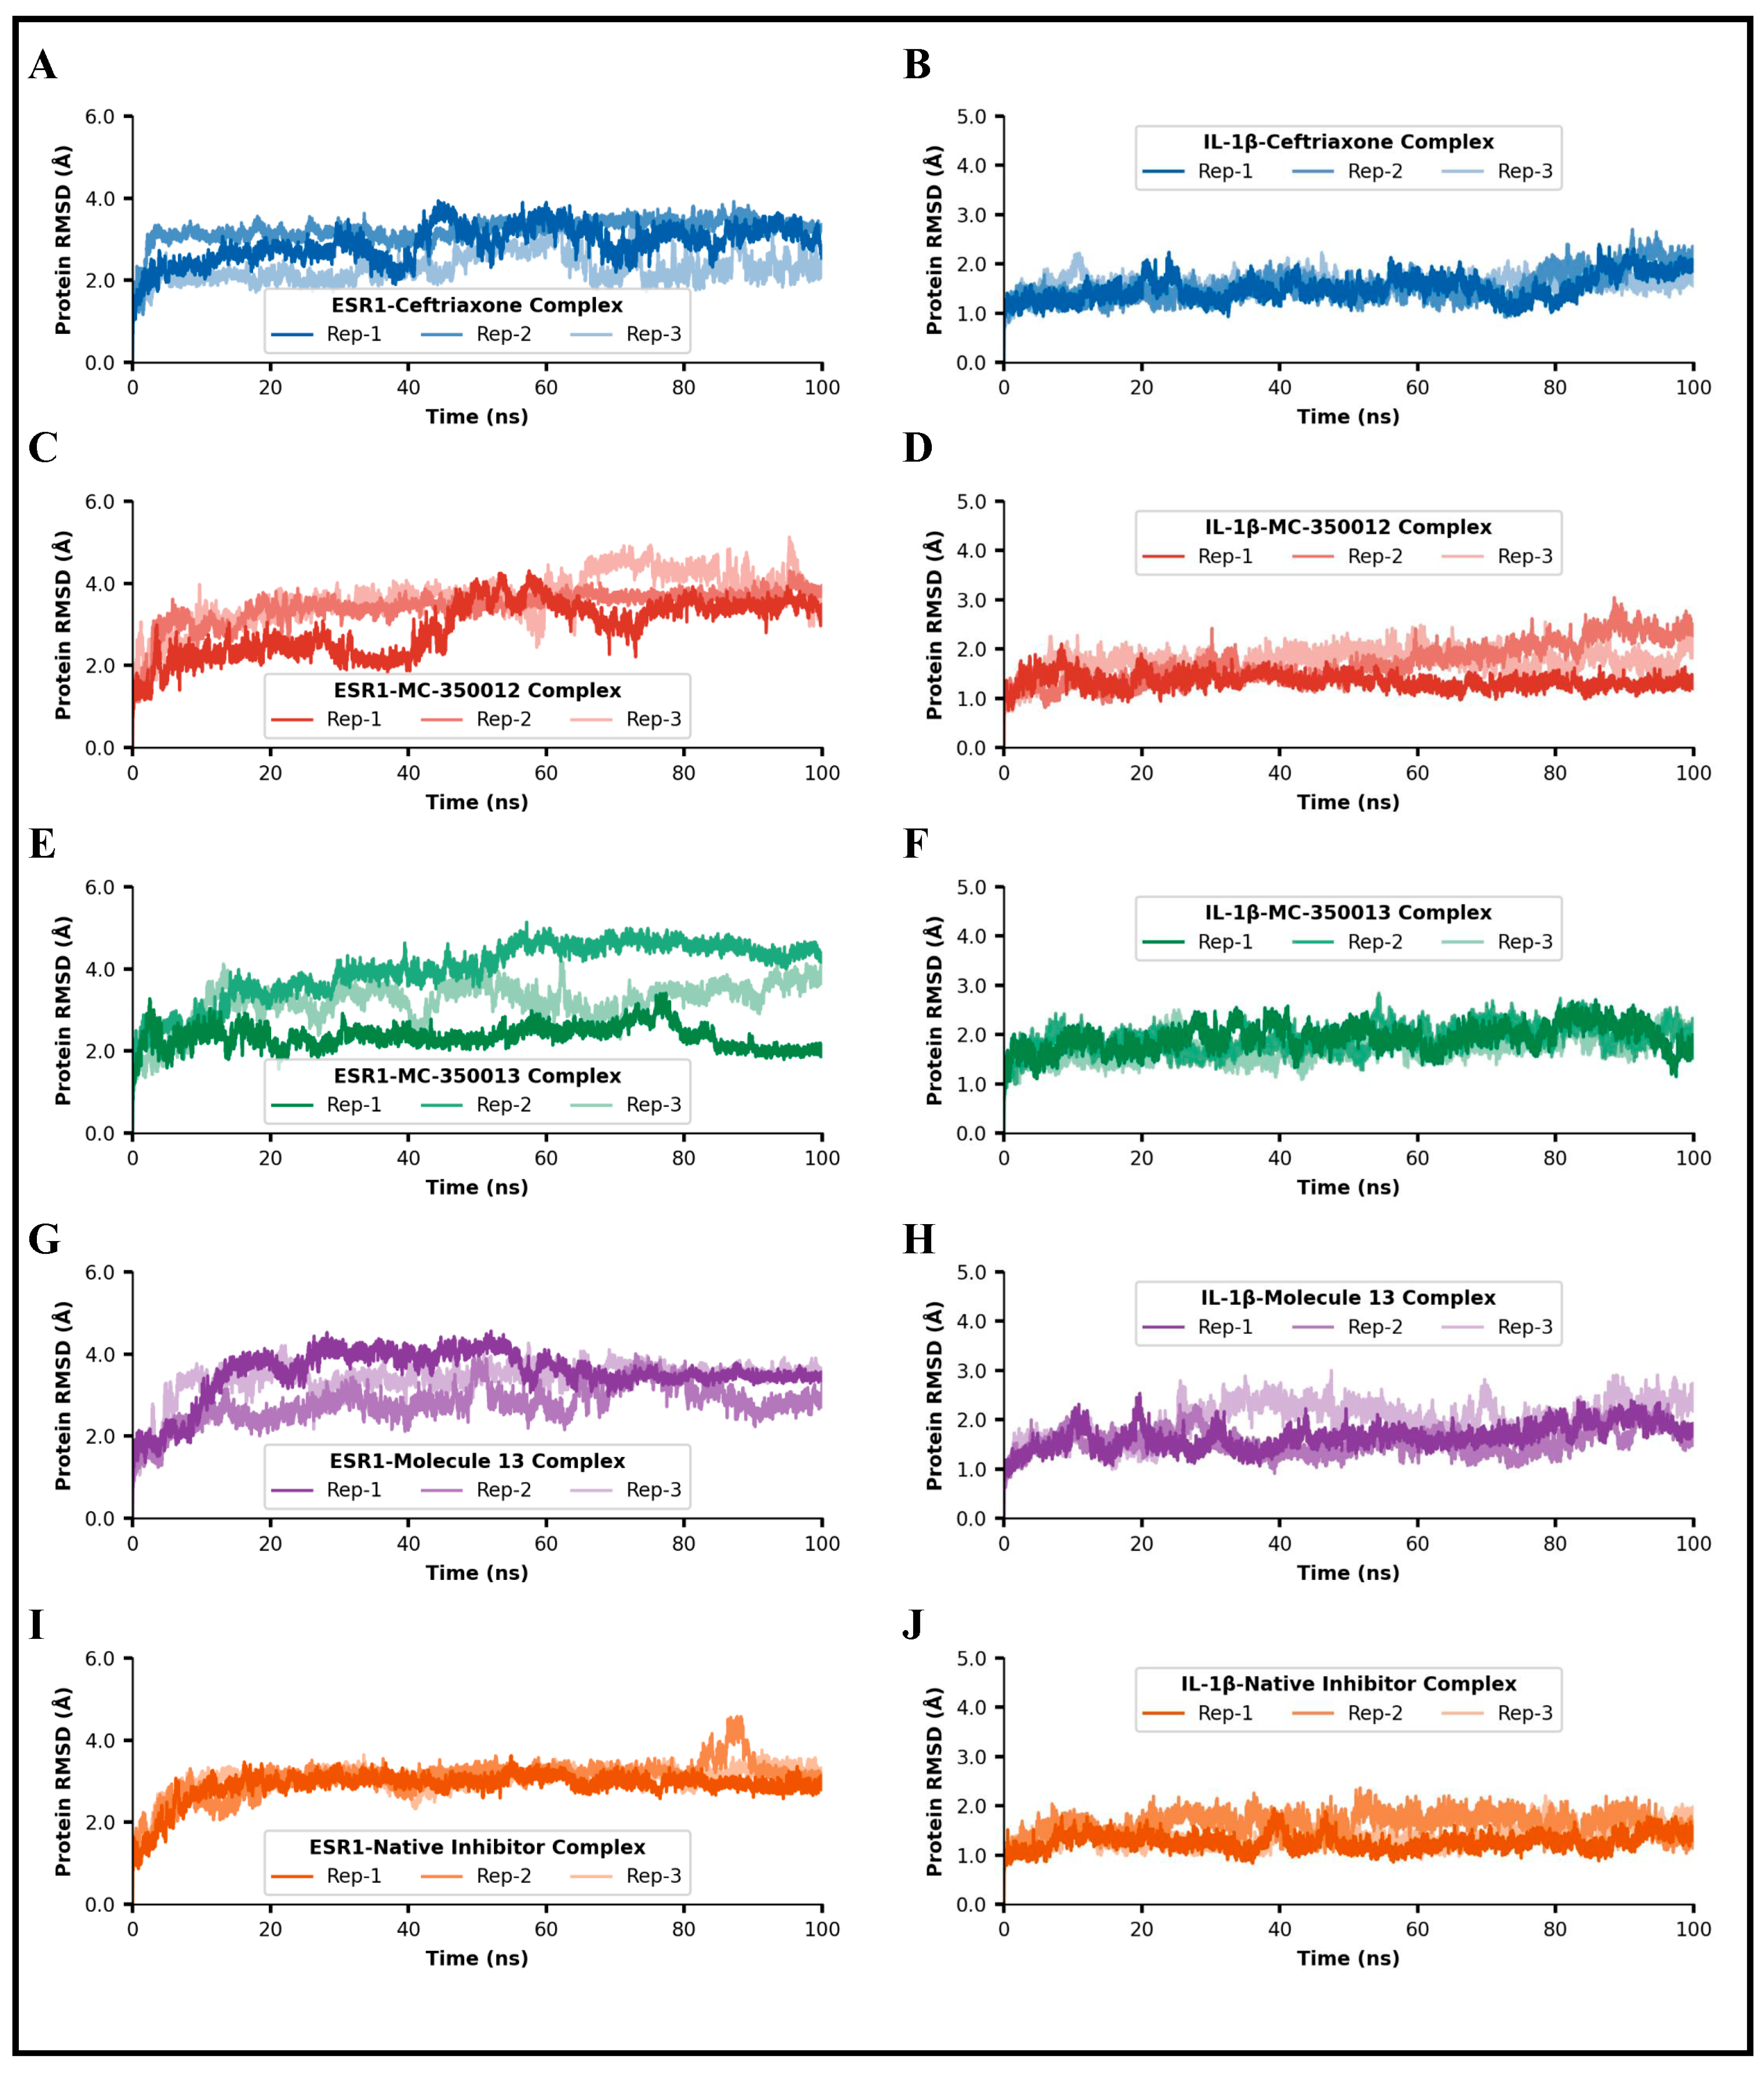
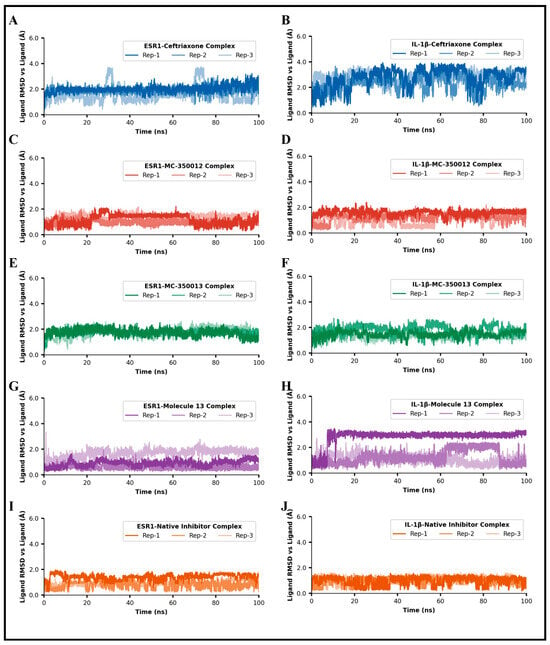
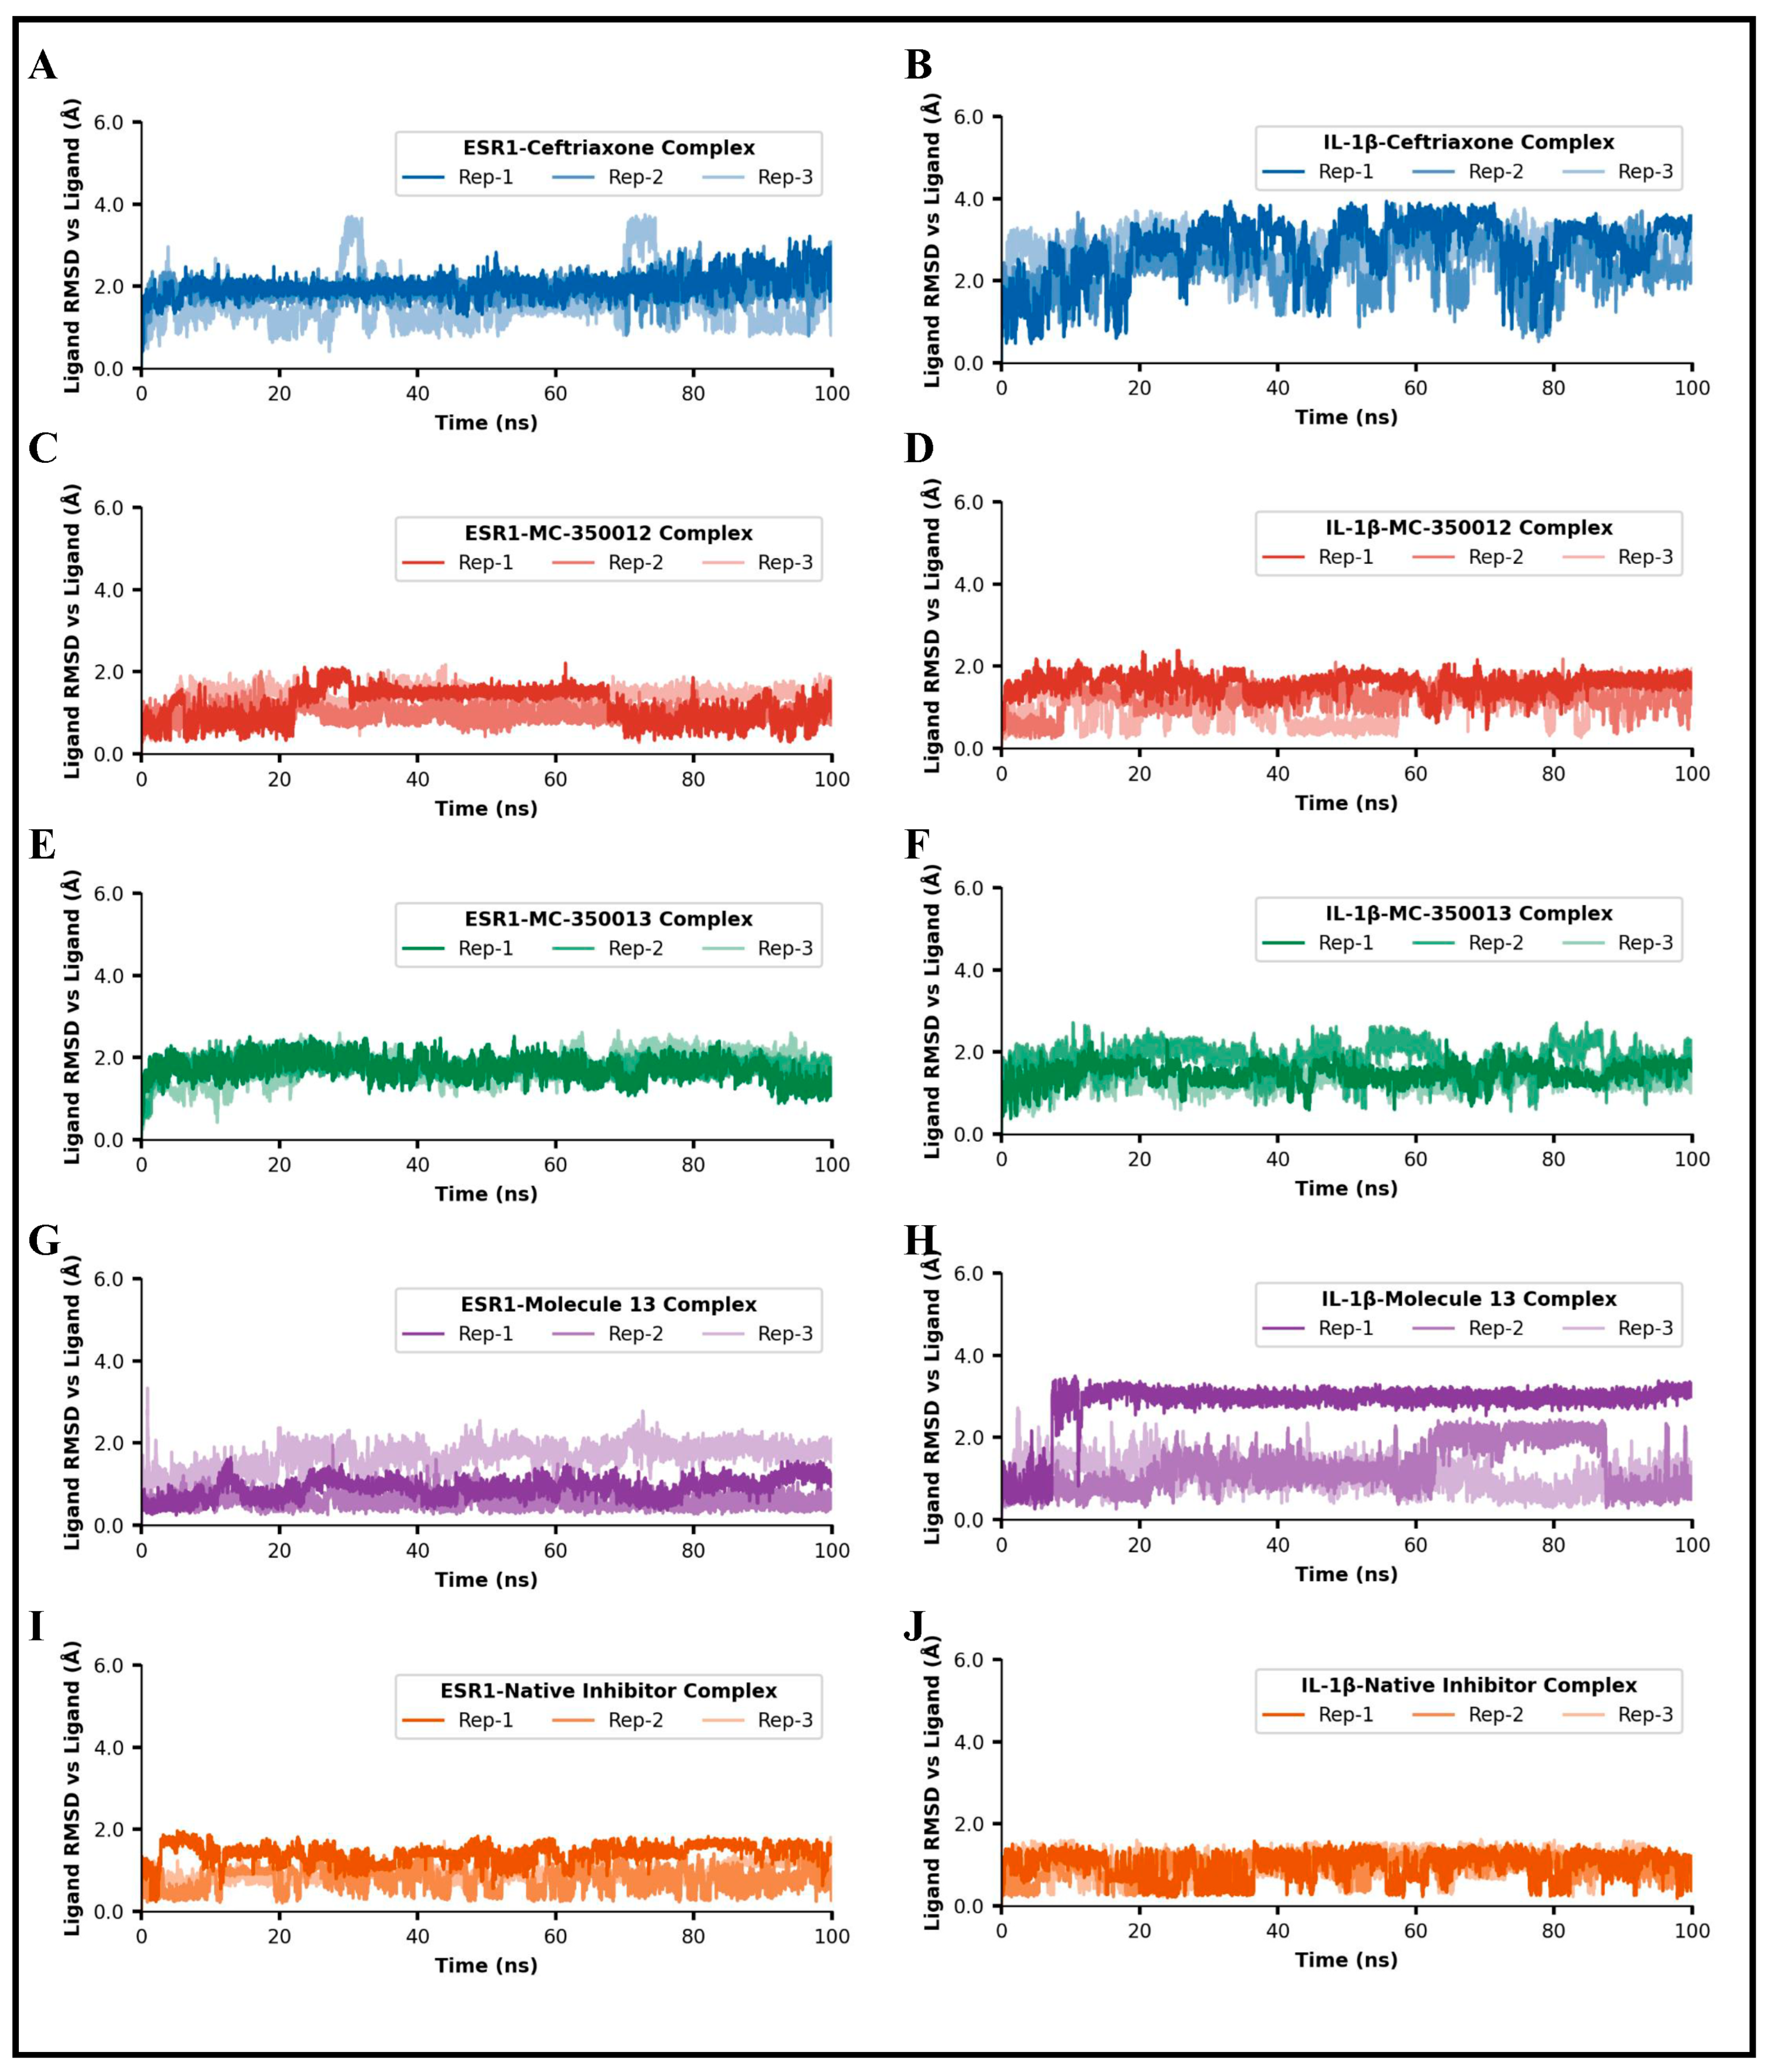
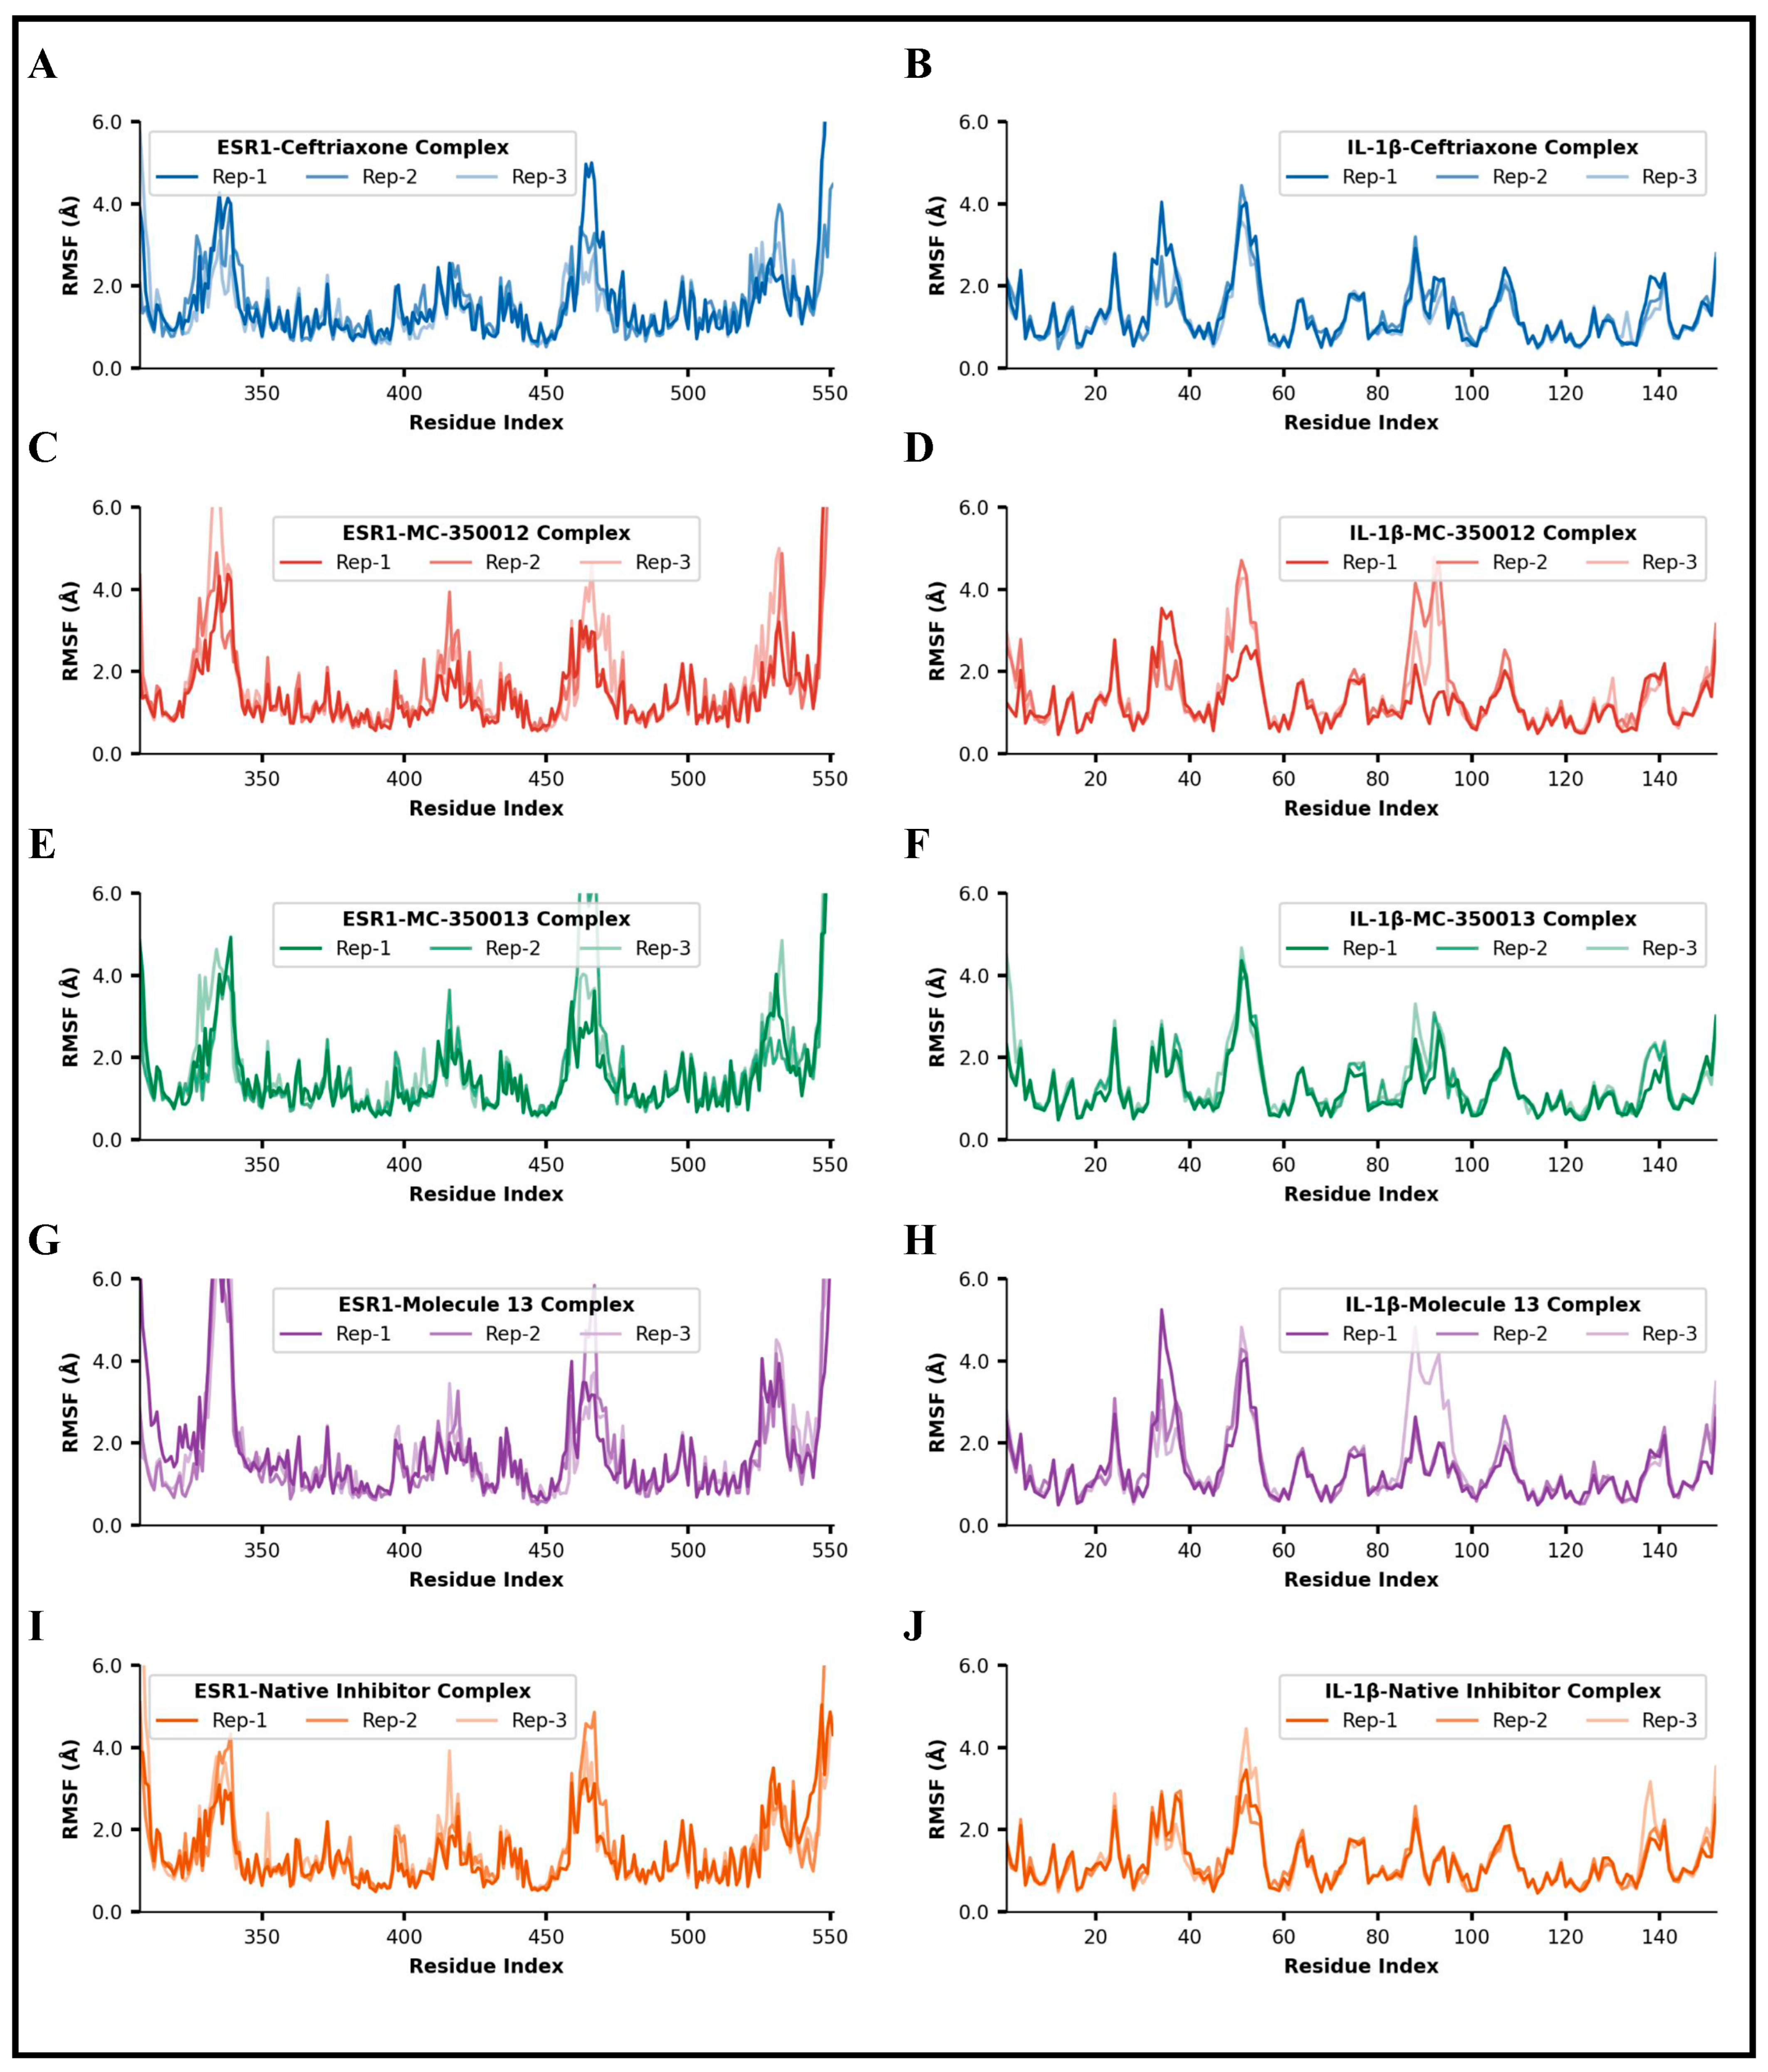
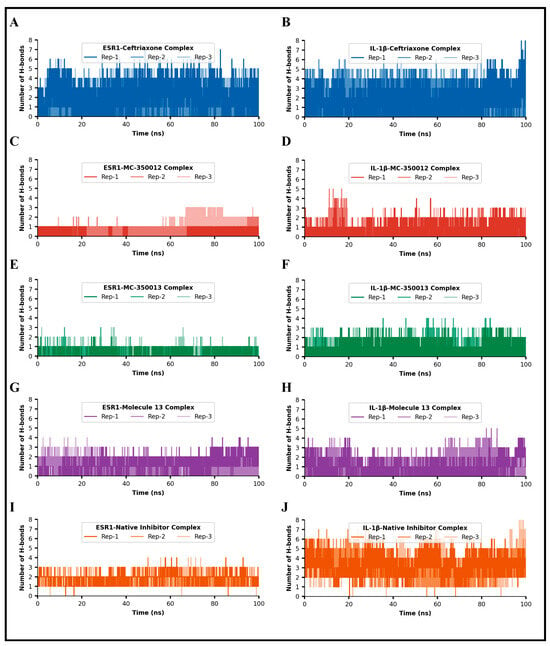
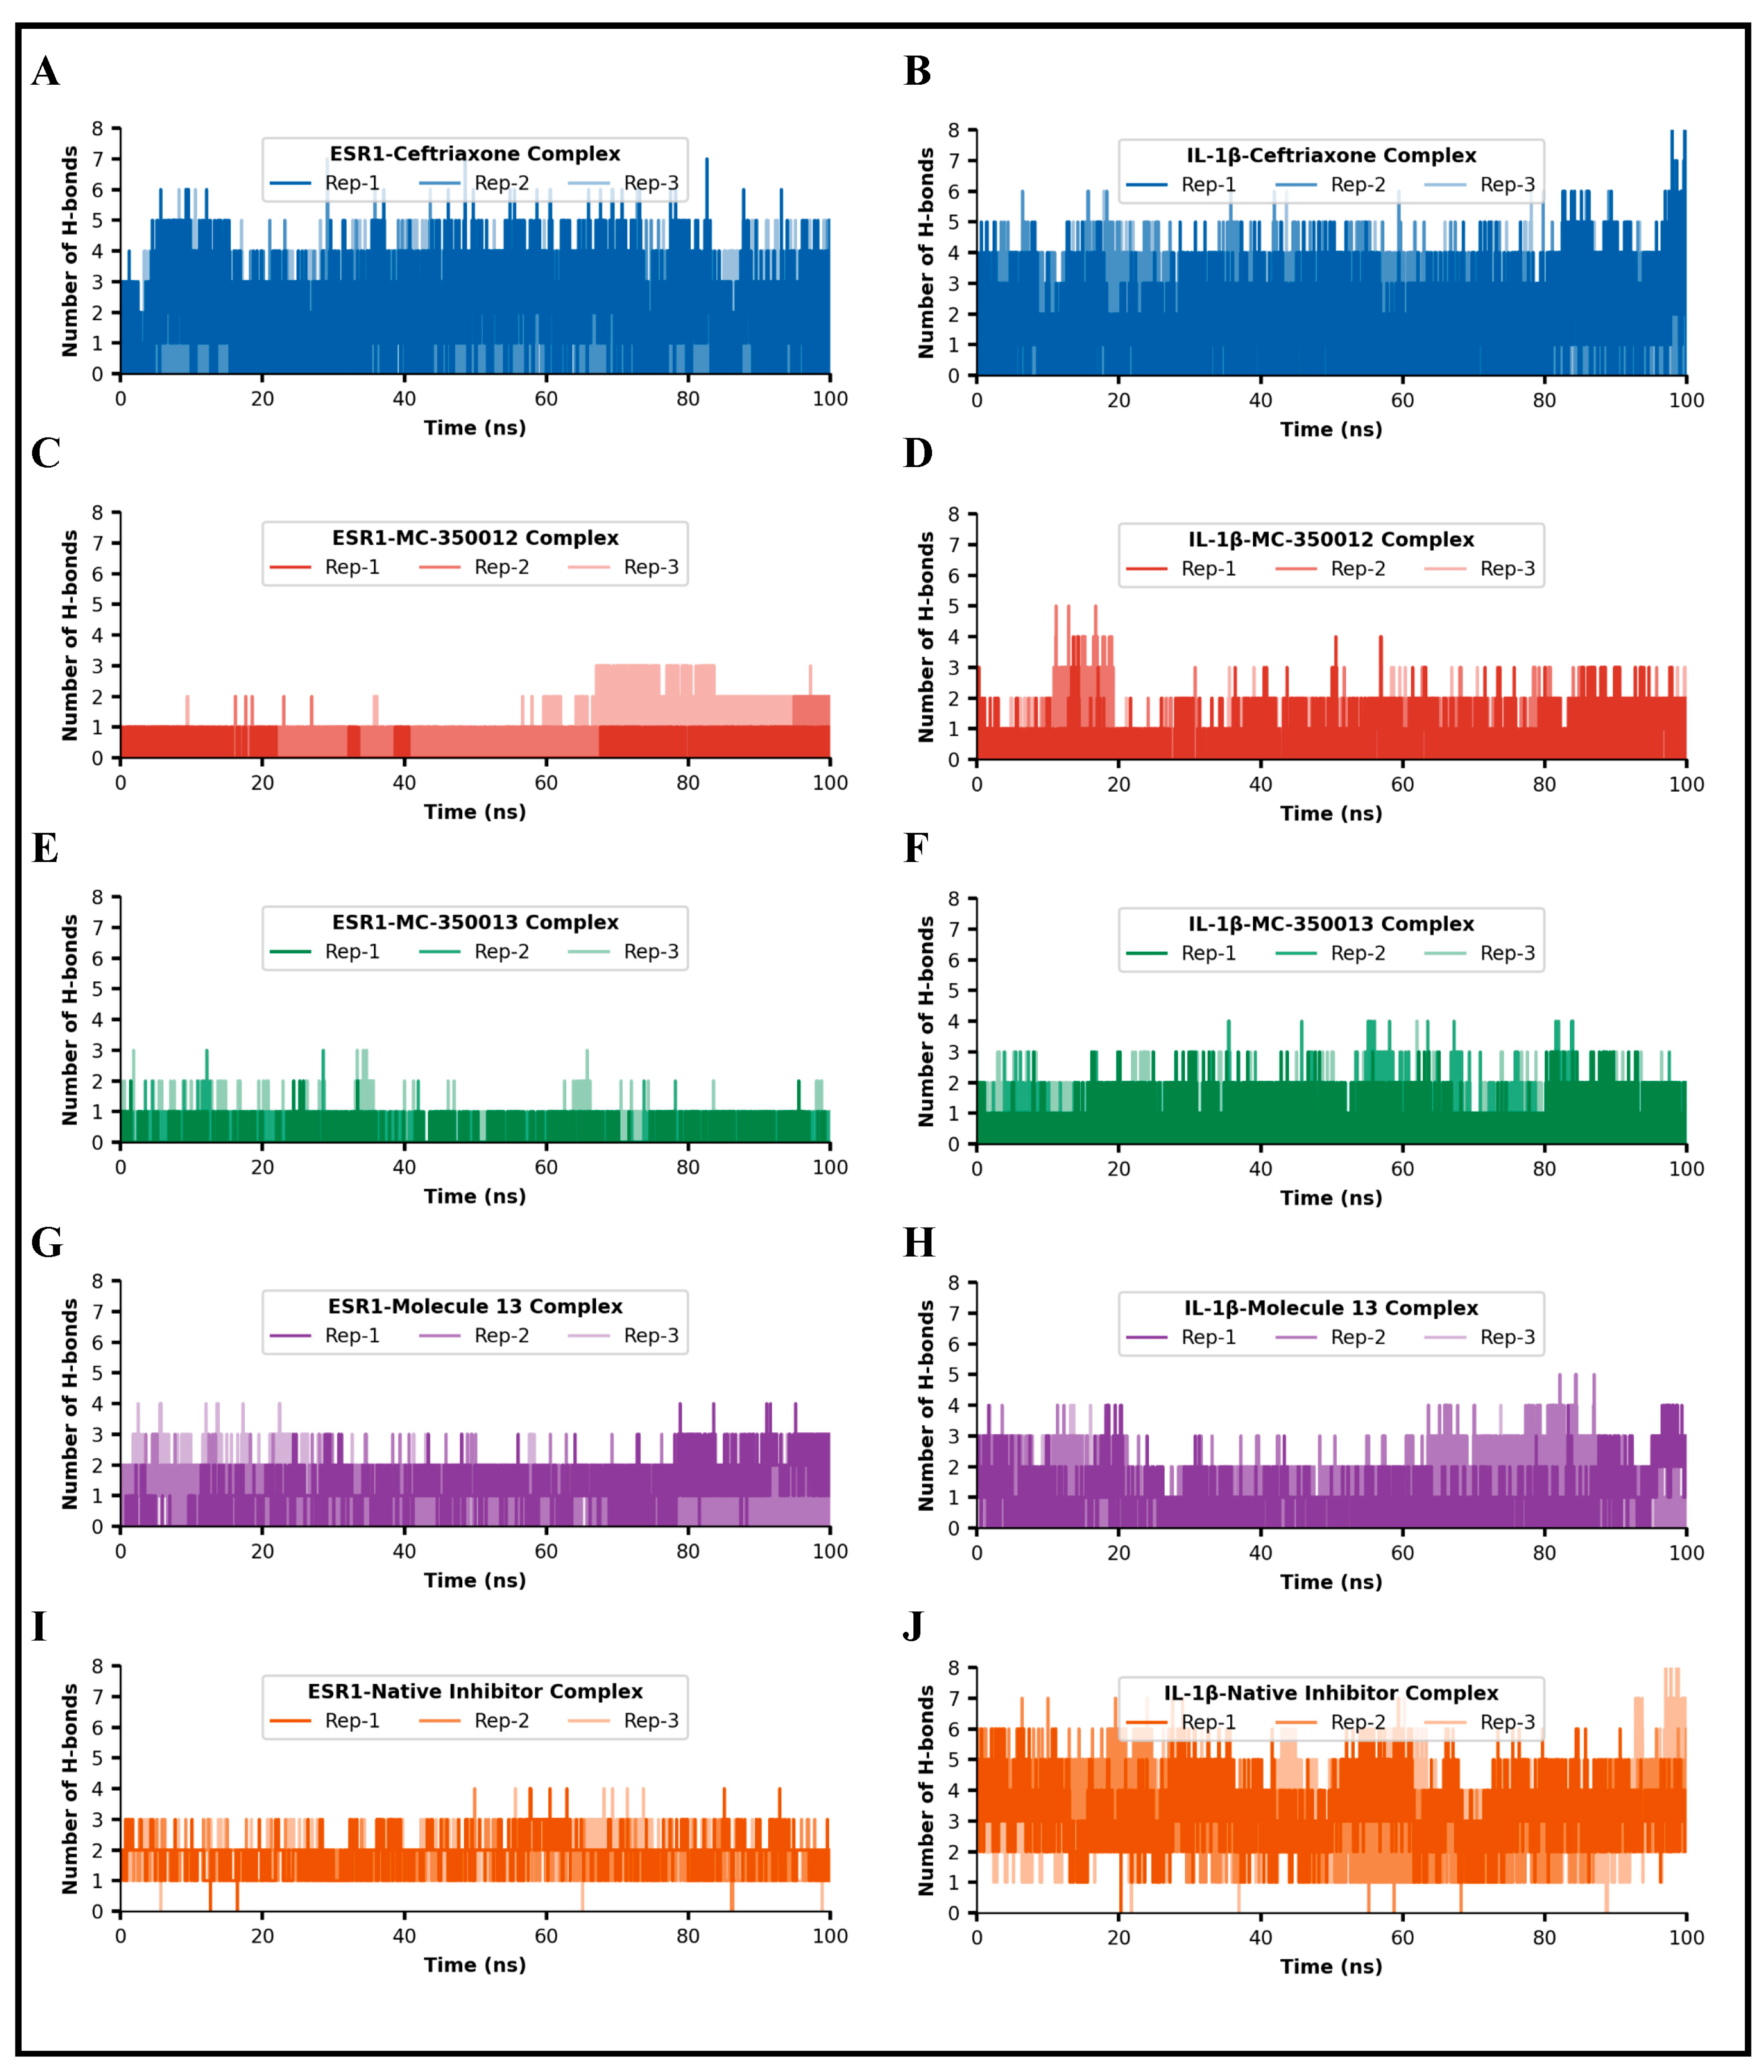
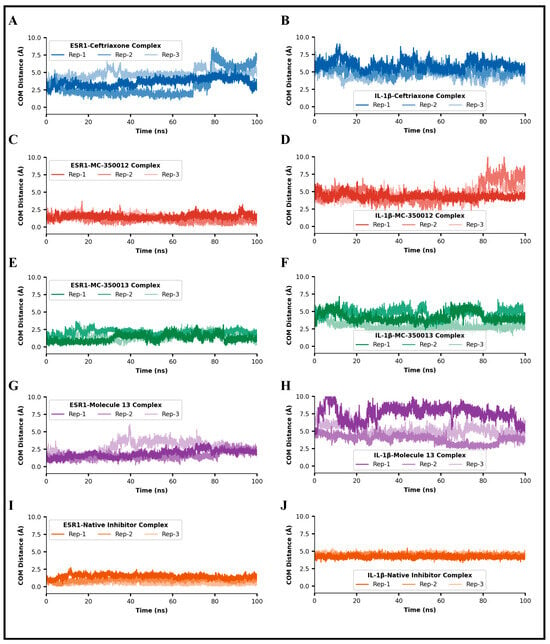
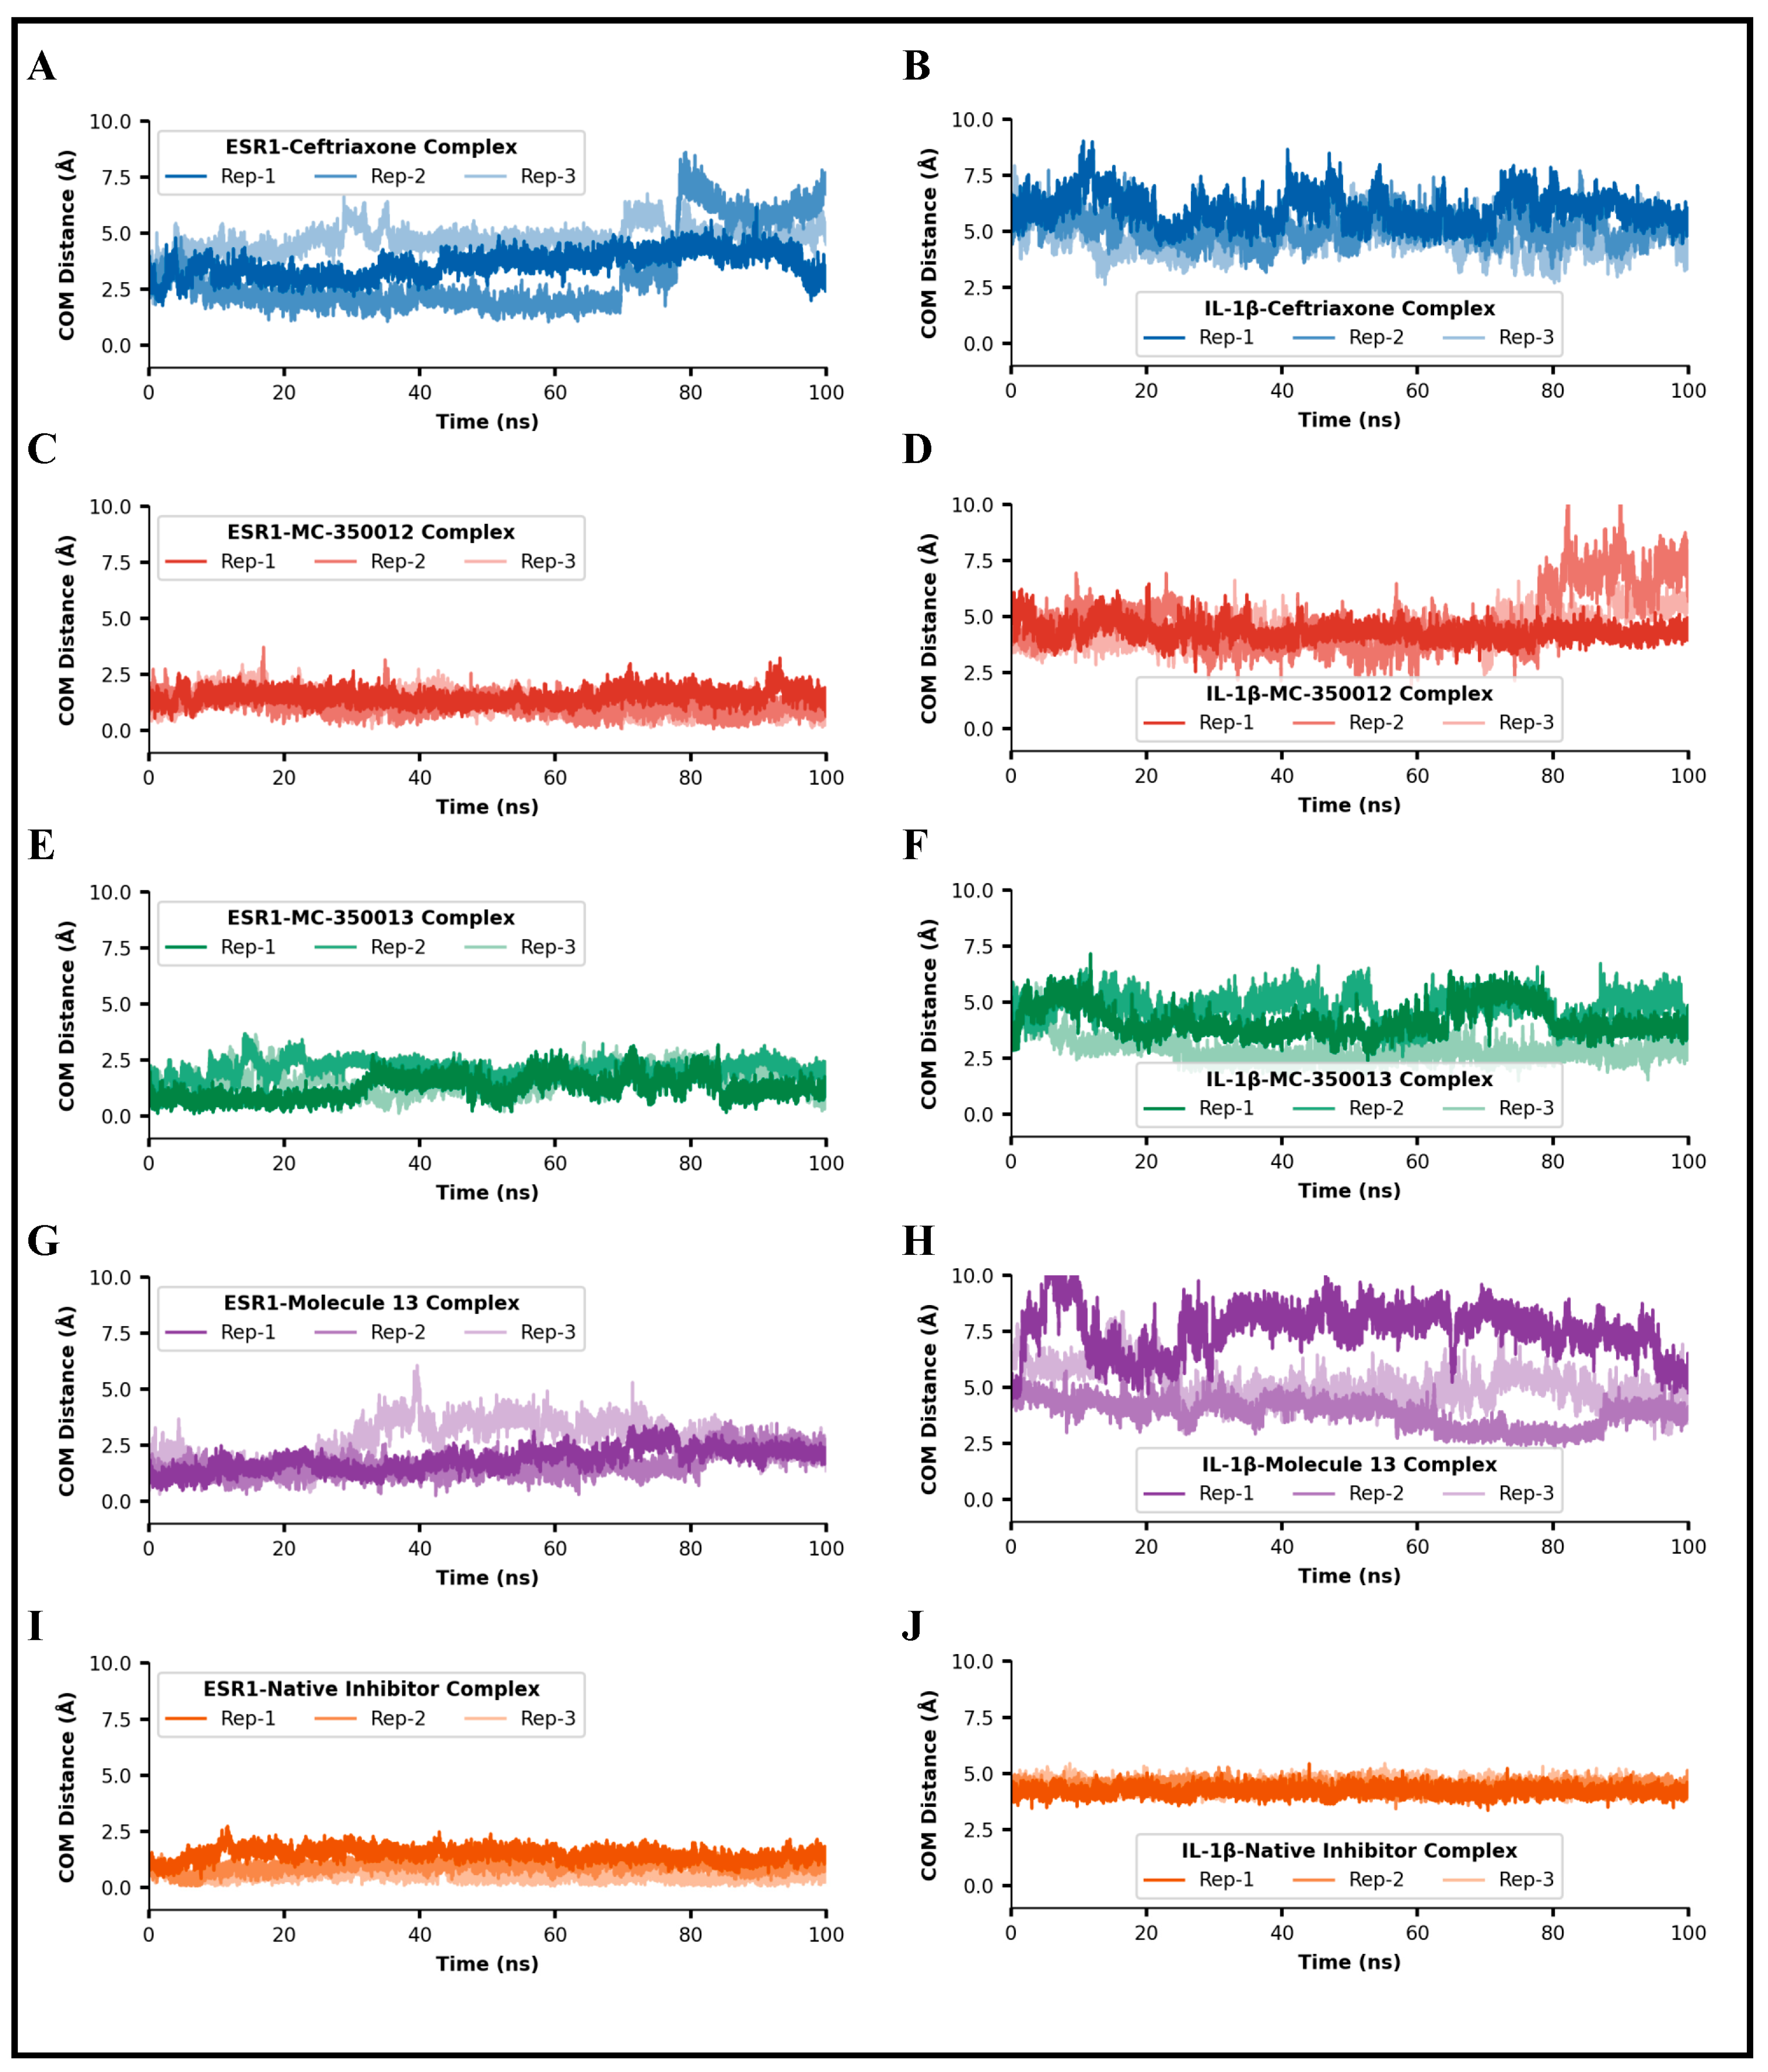
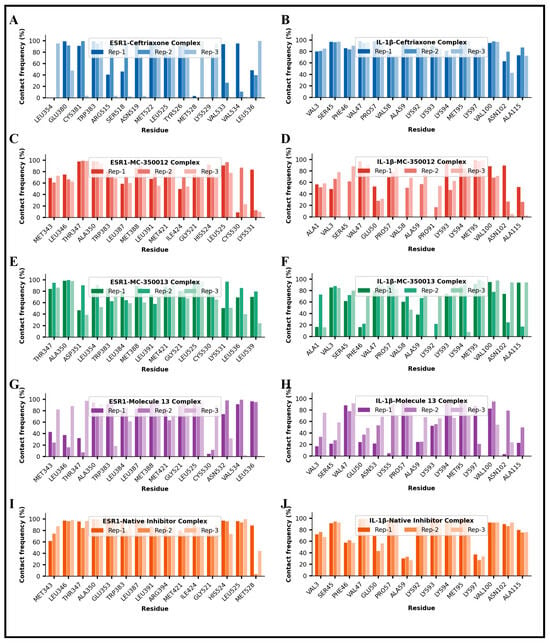
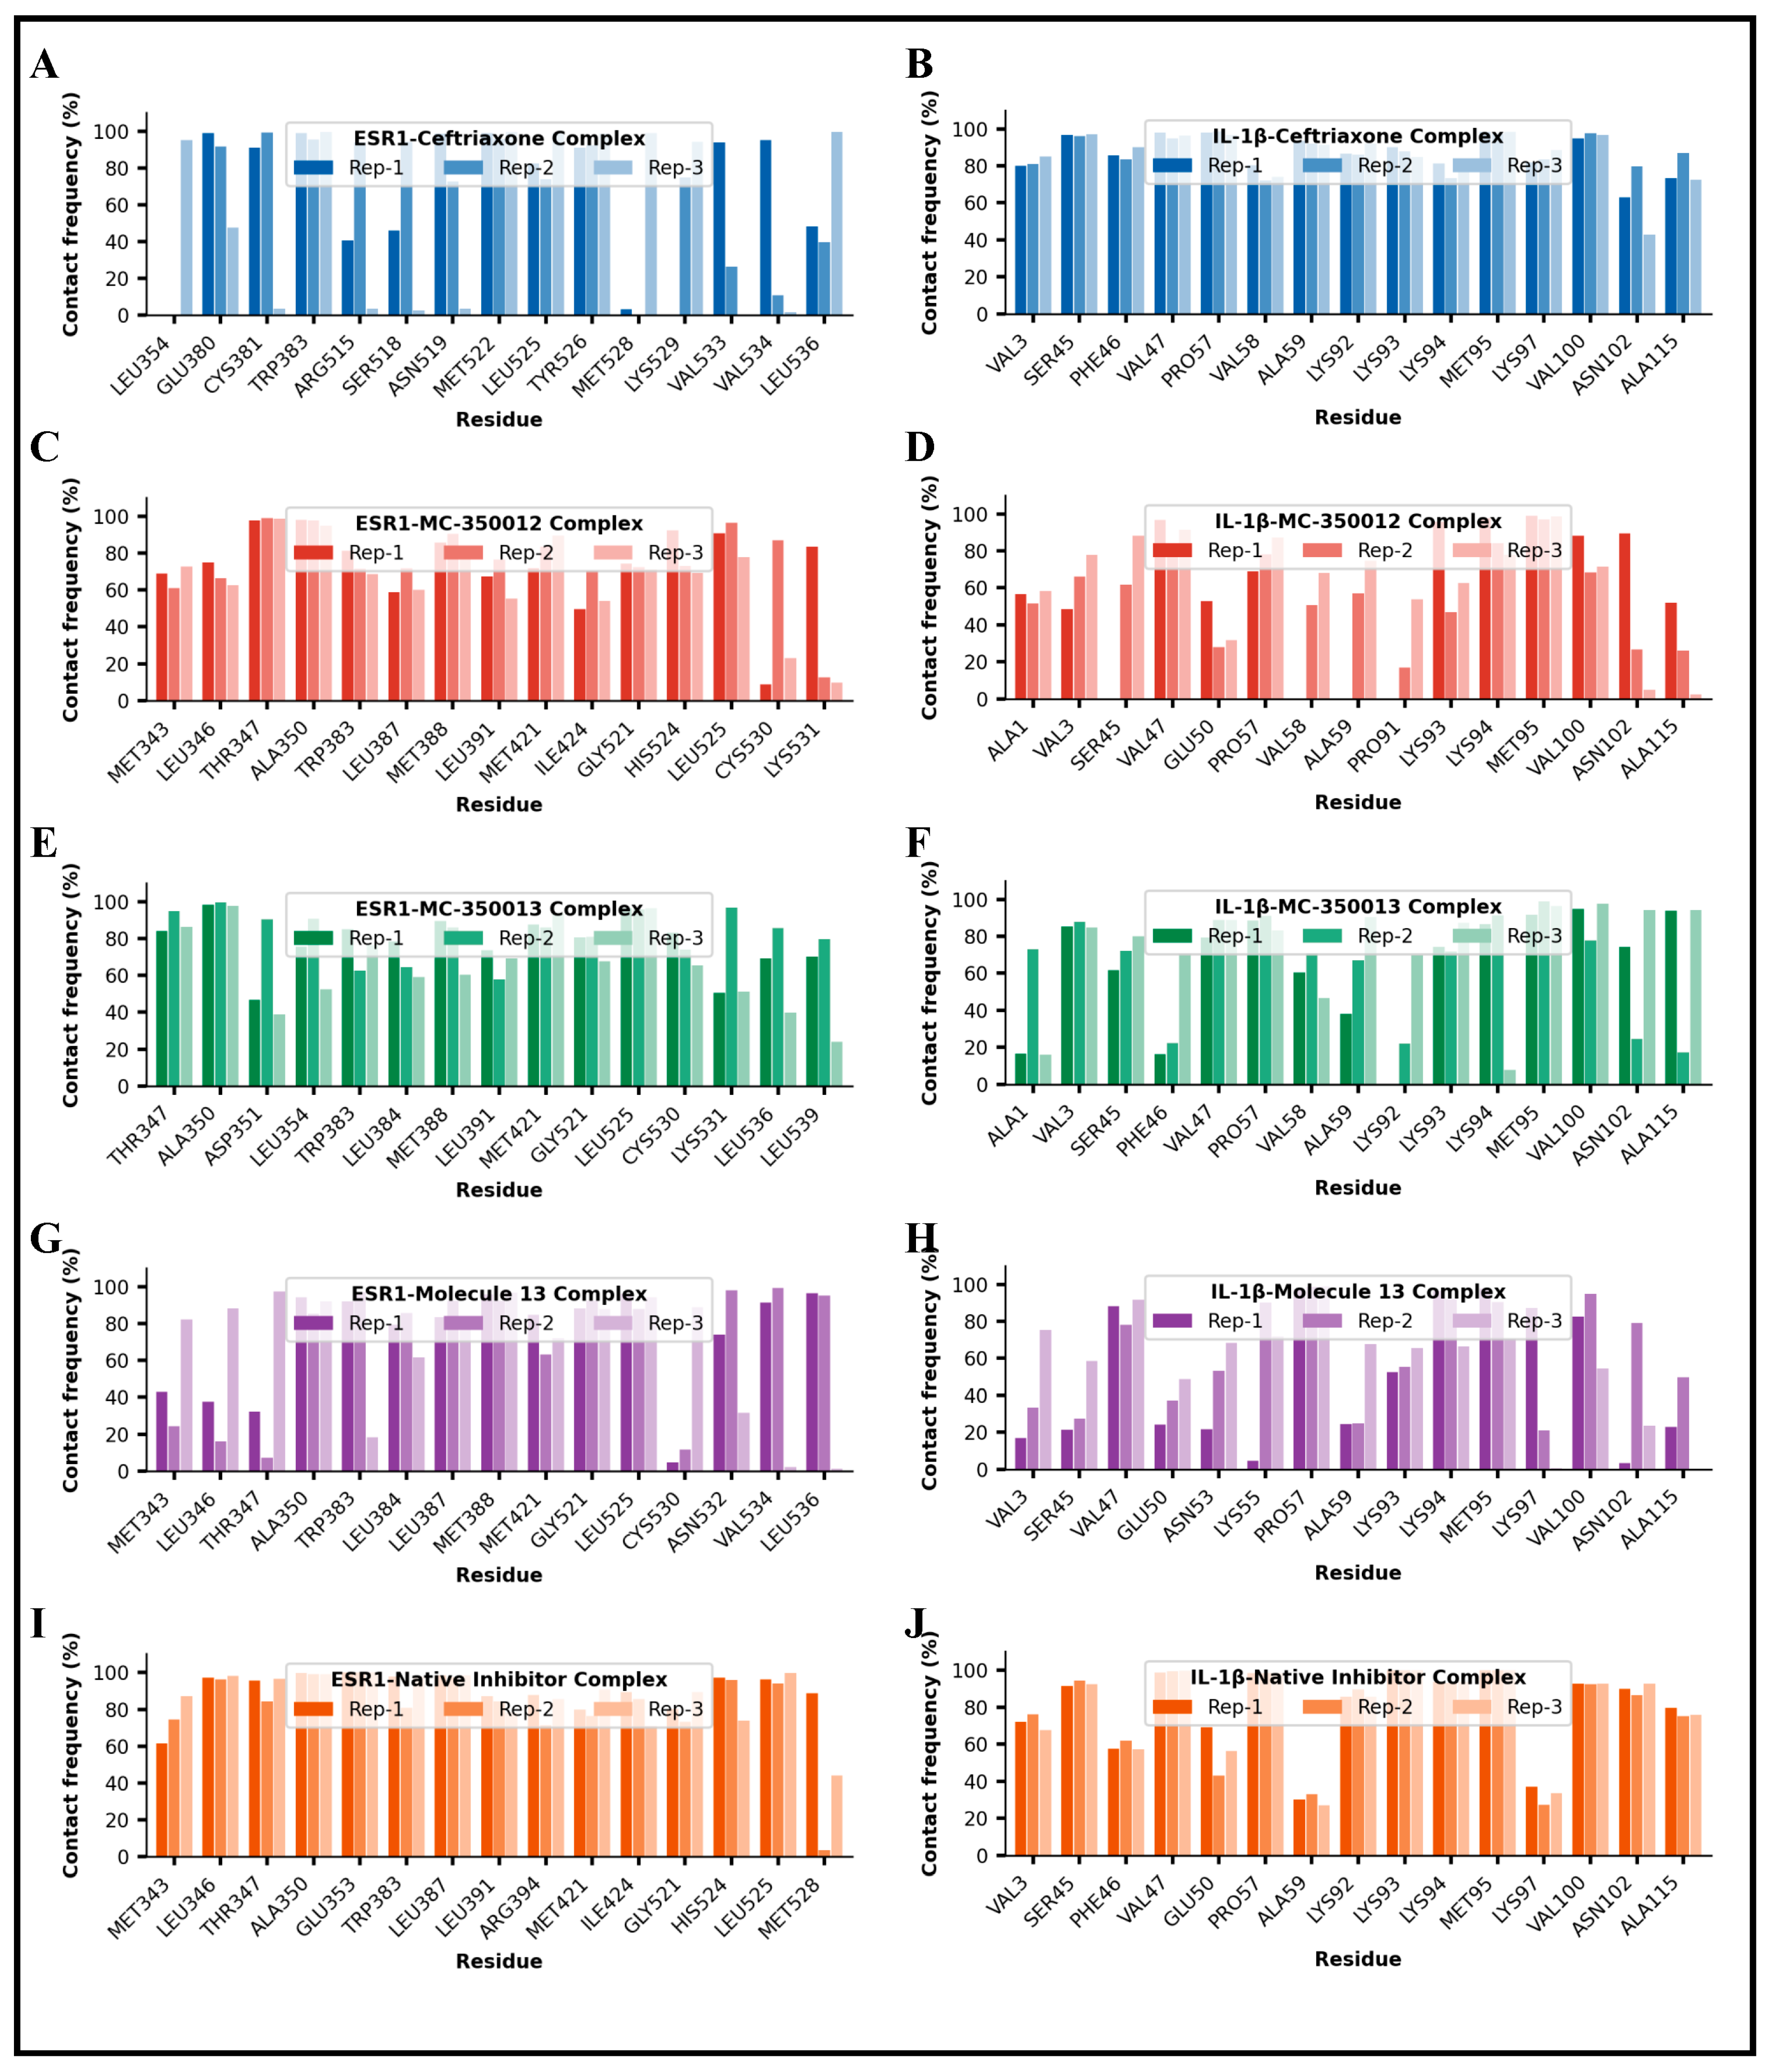
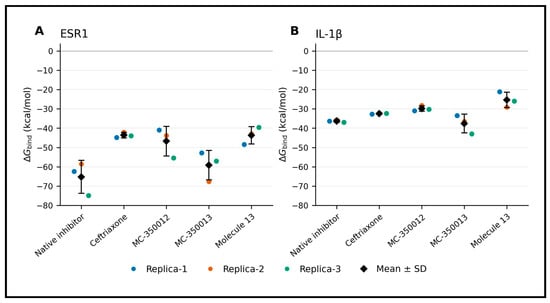
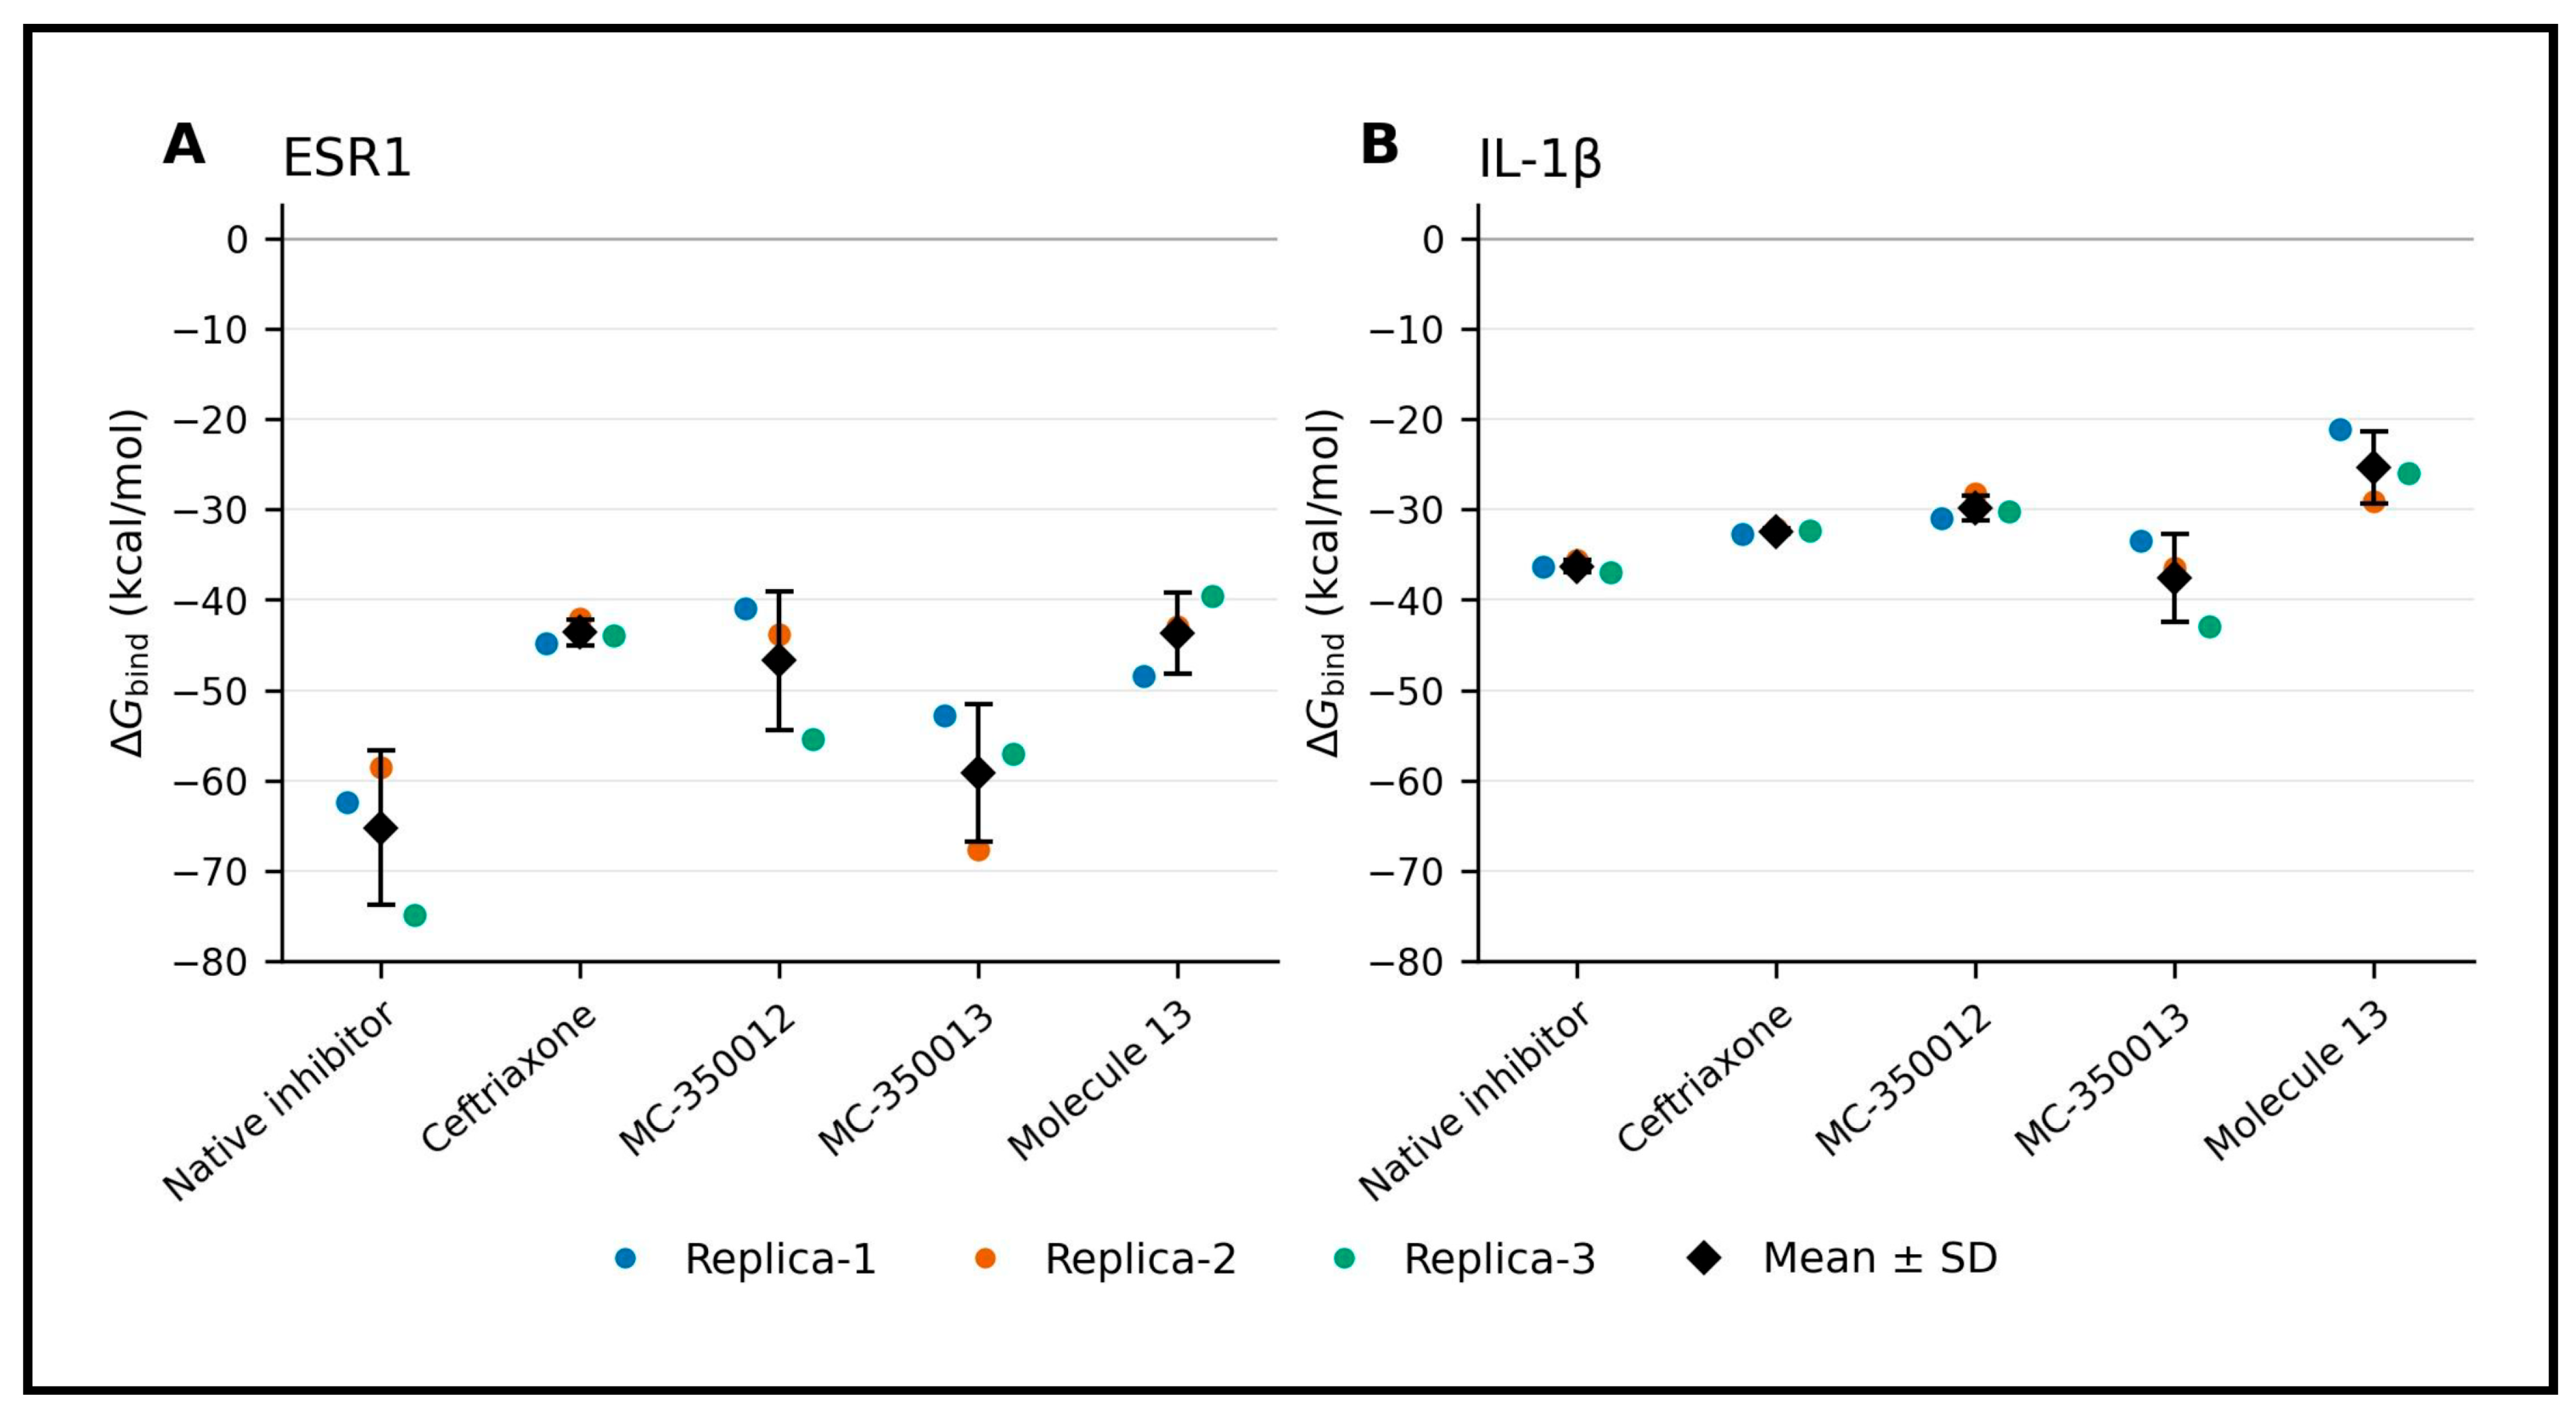
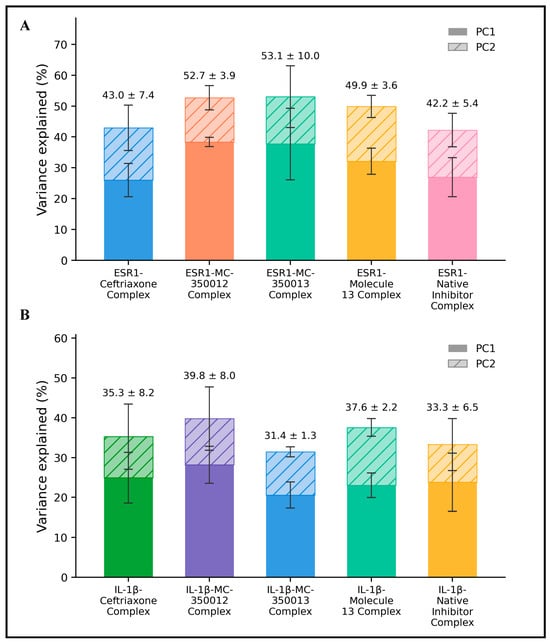
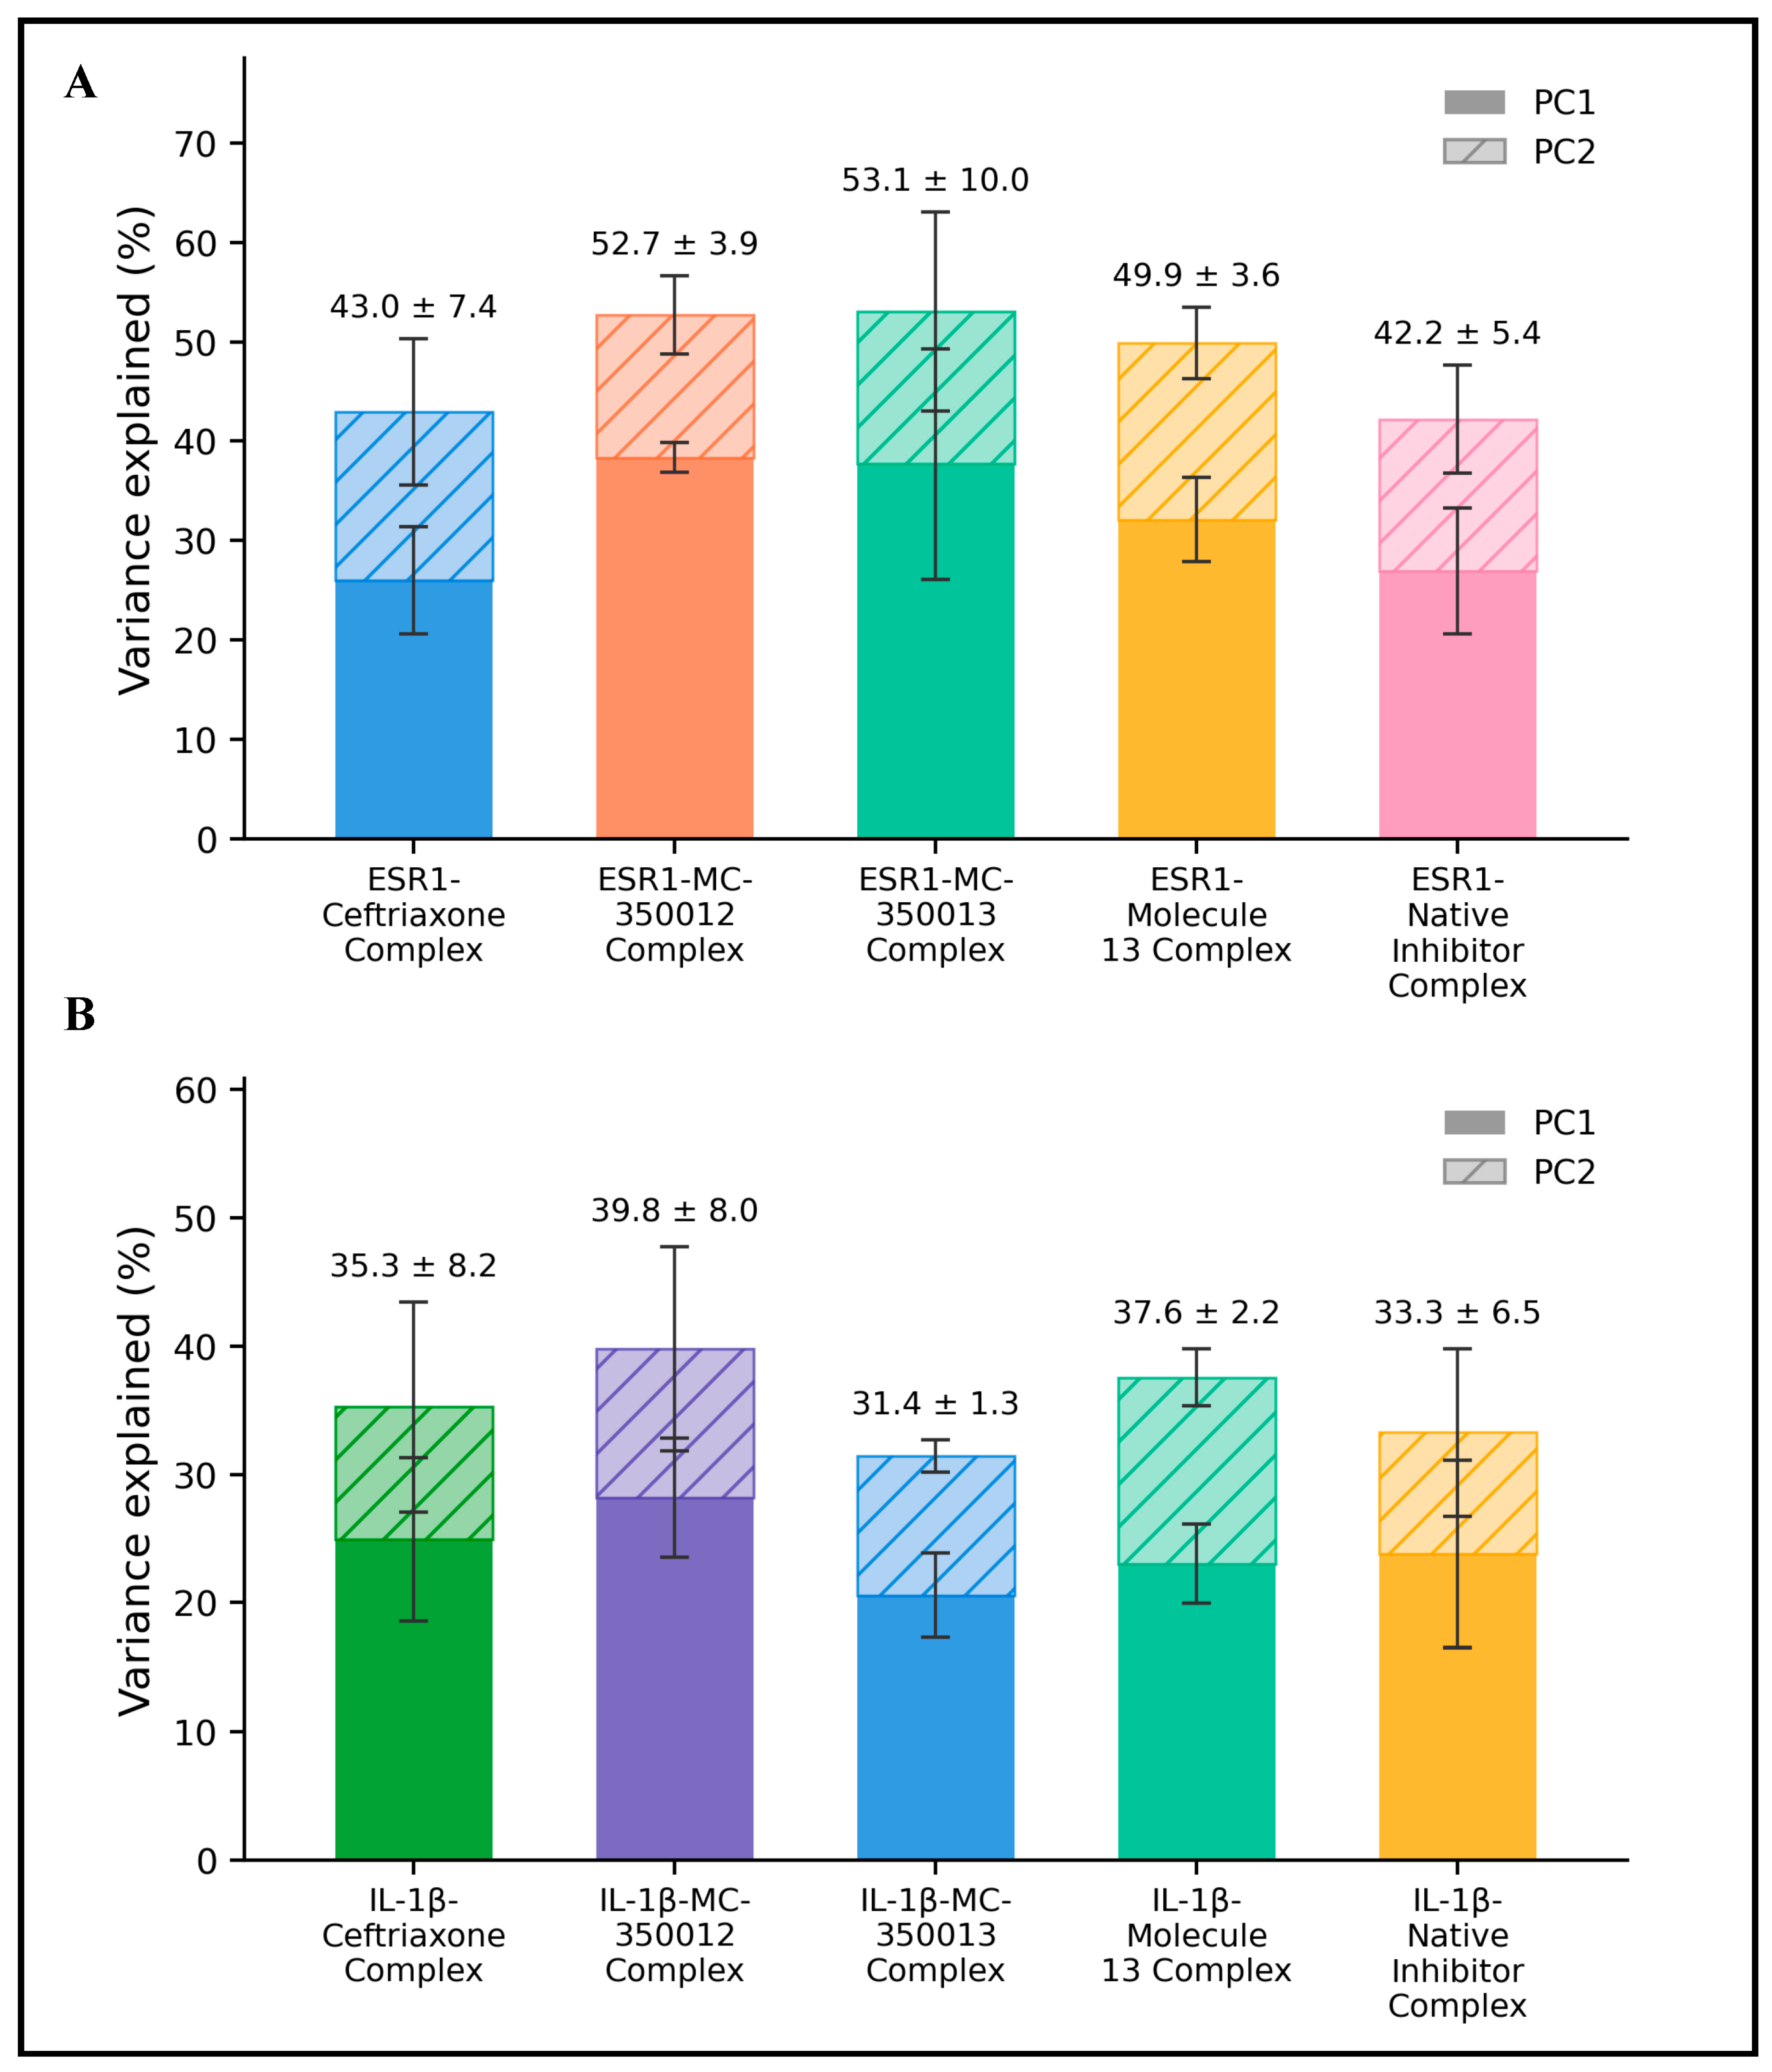

Disclaimer/Publisher’s Note: The statements, opinions and data contained in all publications are solely those of the individual author(s) and contributor(s) and not of MDPI and/or the editor(s). MDPI and/or the editor(s) disclaim responsibility for any injury to people or property resulting from any ideas, methods, instructions or products referred to in the content. |
© 2026 by the authors. Licensee MDPI, Basel, Switzerland. This article is an open access article distributed under the terms and conditions of the Creative Commons Attribution (CC BY) license.