


Abstract
Serrated colorectal lesions are important precursors of colorectal cancer, but their tissue proteomic and circulating metabolic characteristics remain incompletely defined. This exploratory study contextualised targeted proteomics in 17 paired lesion/non-lesional tissue samples using discovery proteomics from three conventional lesions, and examined two serrated lesions from the same patient (SSL and SSL with high-grade dysplasia). Targeted metabolomics was performed on 27 dried whole-blood spot (DBS) records; 16 patients had linked pre-colonoscopy proteomic and DBS measurements. The 13-protein panel comprised 35 quantified peptides. Within the single-patient SSL comparison, the difference in log2(lesion/non-lesional mucosa) between SSL-HGD and SSL was −0.833 for COL1A1, +0.176 for ITGB1 and +0.037 for RAB11B. Exploratory analysis of 15 inter-omic Spearman correlations revealed nominal associations between RAB11B and Phe/Tyr (rho = 0.612; p = 0.0118) and Val/Phe (rho = −0.518; p = 0.0400); neither remained significant after Benjamini–Hochberg correction. No groupwise DBS difference survived multiplicity correction. These descriptive findings suggest structural and metabolic heterogeneity but do not establish serrated-specific molecular progression, causal inter-omic coupling or clinical biomarker validity.
1. Introduction
The serrated pathway contributes to a substantial subset of colorectal cancers (CRCs) and is particularly relevant to post-colonoscopy CRCs, defined here as cancers diagnosed after a colonoscopy that did not identify CRC and before the next recommended screening examination [1,2]. Serrated colorectal precursor lesions comprise a heterogeneous group, including sessile serrated lesions (SSLs) and traditional serrated adenomas (TSAs), which differ from conventional adenomas in histological and molecular features. In particular, serrated lesions are frequently associated with BRAF mutations and the CpG island methylator phenotype (CIMP), defining a carcinogenic pathway distinct from the classical adenoma–carcinoma sequence [3,4,5,6].
Clinical and epidemiological studies have described a proximal colonic predominance for many serrated lesions and heterogeneity in their biological behaviour [2,7,8]. Despite extensive characterisation of the genetic and epigenetic foundations of serrated tumorigenesis [3,6,9], the functional protein and metabolic programmes associated with initiation, progression and malignant transformation remain incompletely understood.
Transcriptomic changes do not necessarily translate into equivalent differences in protein abundance or activity, owing to post-transcriptional regulation, post-translational modification and protein turnover. Metabolic activity is also regulated by mechanisms that cannot be inferred from gene expression profiles alone [10].
Pan-cancer proteogenomic resources illustrate the potential of complementary molecular layers [11]. Proteogenomic and metabolomic studies in colorectal or related tumour models describe amino acid metabolism and tissue organisation [12,13], with further mechanistic context from cancer metabolism and the microenvironment [14,15,16,17,18]. However, evidence derived from lung cancer [19] or other tumour models [20,21] is not direct evidence for serrated pathway specificity.
Beyond their genetic and epigenetic characteristics, serrated lesions present clinical challenges related to detection and heterogeneous biological behaviour [2,6,7]. How these molecular alterations are reflected in tissue proteins and systemic metabolic measurements remains less well characterised [3,5,6,9].
Single-cell studies suggest differences in epithelial states and immune–microenvironmental interactions in serrated lesions [8]. Such transcriptomic observations cannot, by themselves, establish the abundance or activity of the corresponding proteins.
Proteomic and metabolomic approaches can therefore provide complementary information by capturing active biological processes in tissues and at the systemic level. Proteomics directly assesses protein abundance and functional states, whereas metabolomics provides a readout of metabolic activity. In colorectal cancer, these approaches have identified alterations in extracellular matrix remodelling, cytoskeletal organisation, cell adhesion, mitochondrial function and amino acid metabolism [11,12,13,16,17,18,20,21]. Most studies, however, have focused on conventional colorectal neoplasia, and their applicability to the serrated pathway remains insufficiently explored.
Multiple molecular layers may provide a more complete view of tumour biology than single-omic approaches alone. Integrated multi-omic strategies can identify biologically coherent programmes across genomic, transcriptomic, proteomic and metabolic levels [22].
In this study, we applied an exploratory multi-omic approach specifically focused on the serrated pathway. Discovery proteomics from conventional lesions was used as a molecular reference context, whereas the principal biological question concerned protein patterns in serrated lesions, the intra-patient SSL/SSL-HGD comparison and their contextualisation using dried whole-blood spot (DBS) metabolomics. We aimed to explore changes in tissue architecture, adhesion and extracellular matrix organisation together with systemic metabolic alterations, without inferring a causal trajectory or claiming clinical biomarker validation.
2. Materials and Methods
2.1. Study Design and Samples
This observational study comprised distinct, partially overlapping analytical sets. Discovery tissue proteomics included three conventional colorectal lesions (one tubular adenoma, one tubulovillous adenoma and one pT1 adenocarcinoma) with paired histologically non-lesional mucosa (six tissue samples). The principal targeted proteomics (PRM) analysis included 17 lesion/reference pairs (34 tissue samples). Dried blood spot (DBS) metabolomics included 27 analytical records. Tissue proteomics commenced before the DBS metabolomics component was introduced; the cohorts were therefore not recruited simultaneously or systematically paired.
Historical sample-code traceability. The raw PRM export contains the instrumental label “22SA/22TU”, whereas a summary refers to row 23. These identifiers have not been automatically equated: the retained records do not independently establish a complete instrument-to-clinical crosswalk. The clinical correspondence identifies CCRHSE23 as a separate pT1 case in the targeted series and CCRHSE21/CCRHSE22 as exclusions from usable tissue PRM, but the historical instrumental-code discrepancy remains unresolved.
The seventeen principal PRM pairs comprised three tubular adenomas, three villous adenomas, seven tubulovillous adenomas, three pT1 adenocarcinomas and one sessile serrated lesion (SSL). The broader peptide-level records enabled descriptive assessment of six serrated lesions from five patients, including 01PSA (SSL) and 01PSE (SSL with high-grade dysplasia) from the same individual. These analytical subsets overlap and are not additive. Cases CCRHSE21 and CCRHSE22 lacked usable tissue proteomics but retained DBS measurements (records 8897 and 8898); CCRHSE23 was a separate pT1 case included in the targeted series.
Sixteen individuals had traceably linked PRM and DBS data collected before colonoscopy. Most had conventional lesions; only one SSL appeared in the principal linked dataset. Consequently, the cross-omic correlations are exploratory and cannot be attributed specifically to the serrated pathway (Table 1; Supplementary Table S3–S5).
Table 1.
Analytical cohorts and their role in this study.
2.2. Selection and Processing of FFPE Samples
Endoscopically resected specimens underwent the routine diagnostic histopathology pathway: fixation in formalin, dehydration through graded alcohols, clearing in xylene and paraffin embedding. A pathologist selected lesional regions and histologically non-lesional mucosa sampled at a distance; regions were microdissected. No systematic histomorphometric measurement of epithelial, stromal and inflammatory proportions was performed.
For proteomic analysis, FFPE sections were dewaxed using xylene and ethanol (100%, 96% and 70%), then extracted with SDT buffer (4% SDS, 0.1 M dithiothreitol and 0.3 M Tris-HCl, pH 7.6) at a tissue-to-buffer ratio of 1:10. Following 3 min of sonication and 5 min at 95 °C, proteins were quantified using BCA and digested using filter-aided sample preparation (FASP) with trypsin at 37 °C for approximately 16 h. Peptides were desalted using C18 before LC–MS/MS. The protocol included qualitative SDS–PAGE/Coomassie assessment. Individual fixation and storage times, extraction/digestion yields and analytical batch records could not all be retrospectively recovered; this limits assessment of sample-level pre-analytical variation, not identification of the experimental procedure.
2.3. Discovery Proteomics
Discovery proteomics was performed in paired tissue from three conventional colorectal lesions, with an EASY-nLC 1000 coupled to a Q Exactive quadrupole–Orbitrap mass spectrometer (Thermo Scientific, Waltham, MA, USA) operating in data-dependent acquisition (DDA; Full MS/dd-MS2) mode. Mass spectra were processed with Proteome Discoverer version 1.4 (Thermo Scientific), MaxQuant version 1.5.3.30 and Perseus (version series 1.5 and 1.6 are reported in the available information, but the exact historical releases could not be verified); relative protein quantification used label-free methods (MaxLFQ). Database searching employed human Swiss-Prot (2015_12), trypsin digestion, a minimum peptide length of seven amino acids, at most one missed cleavage, mass tolerances of 10 ppm for precursors and 0.05 Da for fragments, cysteine carbamidomethylation as fixed modification, and methionine oxidation and protein N-terminal acetylation as variable modifications. Peptide and protein identification FDRs were controlled at 1%. The reference matrix contained 1916 quantified proteins. Both discovery and PRM analyses used the same EASY-nLC 1000–Q Exactive platform but different acquisition settings; DDA and PRM are not separate instruments.
Protein annotation was checked against UniProtKB: QSOX1 is reported as O00391. The grouped RAB11A/RAB11B identification in discovery proteomics cannot be attributed exclusively to RAB11B and is distinct from the targeted single-peptide RAB11B measurement.
2.4. Targeted Proteomics and Peptide-Level Analysis
The targeted panel comprised 13 proteins involved in cell–cell adhesion, cell–matrix interactions, cytoskeletal organisation, extracellular matrix and intracellular trafficking. Its biological rationale drew on the colorectal carcinogenesis literature, protein functional annotations and the conventional discovery experiment as contextual evidence. The historical records do not establish a quantitative selection rule or a verifiable date on which the panel was selected before the serrated specimens were examined. Protein identities and peptide sequences were checked against UniProtKB. Supplementary Table S1 lists 35 peptides representing 13 proteins. TAGLN was quantified using two peptides (AAEDYGVIK and YDEELEER); RAB11B was represented by one peptide, and QSOX1 corresponds to O00391. The panel should not be presented as a prevalidated signature specific to the serrated pathway.
Synthetic stable isotope-labelled reference peptides (SpikeTides™ L, JPT Peptide Technologies GmbH, Berlin, Germany), with heavy C-terminal arginine (13C6, 15N4) or lysine (13C6, 15N2), were added in equal amounts after enzymatic digestion and peptide quantification, before PRM acquisition. Endogenous (light) peptide signals were normalised to their corresponding heavy references. As these standards were added after digestion, they do not correct for variation arising during FFPE extraction or proteolysis. The original quantitative workbook preserves peptide sequence, sample/biological replicate, total peak area, correction factor, corrected area and log2-corrected area, together with a Peptide_ratio worksheet. These records permit a peptide-level audit of the reported ratios; they do not themselves establish the historical rules for peak rejection or analytical precision.
Retrospective audit of the original targeted proteomics exports. The retained quantitative workbook records protein and peptide identifiers, sample condition, biological replicate, total peak area, correction factors, corrected area and log2-transformed corrected area. Its “Peptide_ratio” worksheet retains reference and lesional measurements for peptide-level comparisons, including 01PSA and 01PSE. These exports support retrospective inspection of reported peak areas and corrections, but do not establish the origin of every correction factor or permit recovery of all heavy/light ratios and prospective analytical precision criteria.
PRM was acquired on an EASY-nLC 1000 coupled to a Q Exactive instrument in Targeted-MS2 mode (precursor isolation 2.0 Th, normalised collision energy 28, maximum injection time 500 ms, AGC target 5 × 10⁵, Orbitrap resolution 17,500 at m/z 200). Chromatography used an Acclaim PepMap100 trap column (75 μm × 2 cm, Thermo Scientific, Waltham, MA, USA) and an Acclaim PepMap RSLC analytical column (50 μm × 15 cm, Thermo Scientific, Waltham, MA, USA), with a 5–30% acetonitrile gradient in 0.1% formic acid over 90 min at 300 nL/min. Proteome Discoverer version 1.4 and Skyline version 4.0 were used for identification and manual peak inspection/area export. A surviving SKYLINE worksheet contains three CDH1 precursor/product m/z pairs: GQVPENEANVVITTLK 856.4649/827.9542, NDVAPTLMSVPR 651.3496/1187.6020 and NTGVISVVTTGLDR 716.3937/1060.5997. These examples are not a full transition list, and the historical retention-time windows, interference rules and technical replicate CVs have not been independently reconstructed.
For each quantifiable peptide, the lesion-to-reference abundance ratio was expressed as log2(TU/SA), with positive values indicating higher abundance in the lesion. Protein-level descriptive estimates were derived from the mean of available peptide-level log2 ratios, retaining individual peptide values to assess agreement. The assay included 13 proteins represented by 35 peptides; a single RAB11B peptide cannot provide between-peptide concordance. Missing or low-intensity signal acceptance thresholds were not reconstructed where the instrumental processing records did not specify them.
2.5. Dried Blood Spot Metabolomics
Peripheral whole blood was applied to Whatman 903 Guthrie cards (Cytiva, Marlborough, MA, USA) and air-dried at room temperature for at least four hours away from direct sunlight. One 3 mm punch (approximately 3.1 μL of whole blood) was extracted with methanol containing deuterated internal standards. After evaporation and derivatisation with HCl in butanol, extracts were analysed by tandem mass spectrometry on an Agilent triple-quadrupole instrument (Agilent Technologies, Santa Clara, CA, USA). Free carnitine (C0), acylcarnitines, amino acids and selected metabolic ratios were measured. Concentrations are presented in μmol/L, in accordance with published DBS-MS/MS practice [23,24]; this unit could not be independently verified in the original instrument exports, and no numerical conversion was performed. The ratios C14:1/C12, C4/C8, C0/(C16 + C18), Phe/Tyr and Val/Phe are dimensionless exploratory measures and do not directly quantify enzyme activity or β-oxidation flux.
Each DBS record represents a peripheral blood sample measured using internal standards and analytical quality controls, not a paired lesional/reference mucosal specimen; therefore, no TU/SA ratio was calculated for DBS. Blood was collected before colonoscopy in the 16 participants with linked PRM–DBS data; the remaining samples were collected after the procedure, with exact intervals unavailable. Fasting status, medication and metabolic comorbidities were not uniformly documented across the 27 records. These factors were considered when interpreting the exploratory comparisons between histological groups. The descriptive group comparison is summarised in Table 2.
Table 2.
Exploratory comparison of dried blood spot (DBS) metabolites between serrated (n = 5) and conventional/pT1 lesions (n = 22).
2.6. Statistical Analysis and Exploratory Multi-Omic Integration
The analysis was exploratory, without a prospectively calculated confirmatory sample size. Descriptive contrasts preserved lesion/reference pairing through peptide-level log2(TU/SA). The within-patient comparison of SSL and SSL-HGD comprised two distinct lesions from one individual and was not treated as a longitudinal progression series. The results are presented descriptively with the individual measurements and analysis populations available in Supplementary Table S3–S5.
DBS comparisons involved five serrated and 22 conventional/pT1 records, using 19 two-sided Mann–Whitney tests with Benjamini–Hochberg (BH) adjustment across this family of 19 contrasts. In the 16 participants with linked PRM and DBS data, 15 Spearman correlations were calculated between three tissue proteins (COL1A1, ITGB1 and RAB11B) and five DBS variables (C0, C16, C18, Phe/Tyr and Val/Phe), with BH adjustment across the 15 tests. These retrospective exploratory comparisons were not prospectively prespecified clinical hypotheses. Group sizes, descriptive contrasts, rho, p and q are reported as appropriate. New inferential confidence intervals absent from the original exports were not constructed; statistical uncertainty and potential confounding are acknowledged. Instrument calibration standards were not treated as patient control groups, and lesion/reference tissue ratios were not applied to whole-blood DBS measurements.
Only documented patient-level measurements were directly correlated. Mechanistic links between extracellular matrix remodelling, cell adhesion and systemic metabolism were discussed as hypotheses, not measured causal relationships or validated serrated pathway-specific coordination. Clinical and pre-analytical confounding and tissue compartment heterogeneity were considered as limitations.
2.7. Dataset Overlap with Related Methodological Work
The conventional discovery data from cases 04–06 and the principal 17-pair targeted dataset overlap with the separate MIIEM methodological study; re-use is disclosed and is not interpreted as independent validation. The serrated-focused analyses, the additional SSL/SSL-HGD intra-patient comparison, the 27 DBS records and the 16-patient linked exploratory correlations address a distinct descriptive question. In discovery proteomics, a protein group annotated RAB11B/RAB11A does not establish RAB11B-specific validation. QSOX1 is reported as UniProtKB O00391 in the peptide supplement.
The specific contributions of the present manuscript are descriptive analyses of additional serrated lesions, including the within-patient SSL/SSL-HGD comparison (01PSA/01PSE), dried blood spot metabolomics (27 DBS records) and 15 exploratory PRM–DBS associations in 16 linked participants. Overlapping experimental datasets must not be treated as independent validation cohorts.
2.8. Author-Supervised Use of Generative AI
ChatGPT (model GPT-6 Sol; OpenAI, San Francisco, CA, USA) was used for linguistic editing and for the generation and refinement of schematic figures. The authors reviewed and edited all outputs and take full responsibility for the accuracy, originality and integrity of the final manuscript and figures.
3. Results
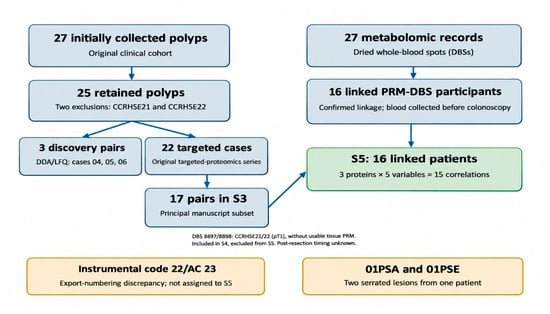
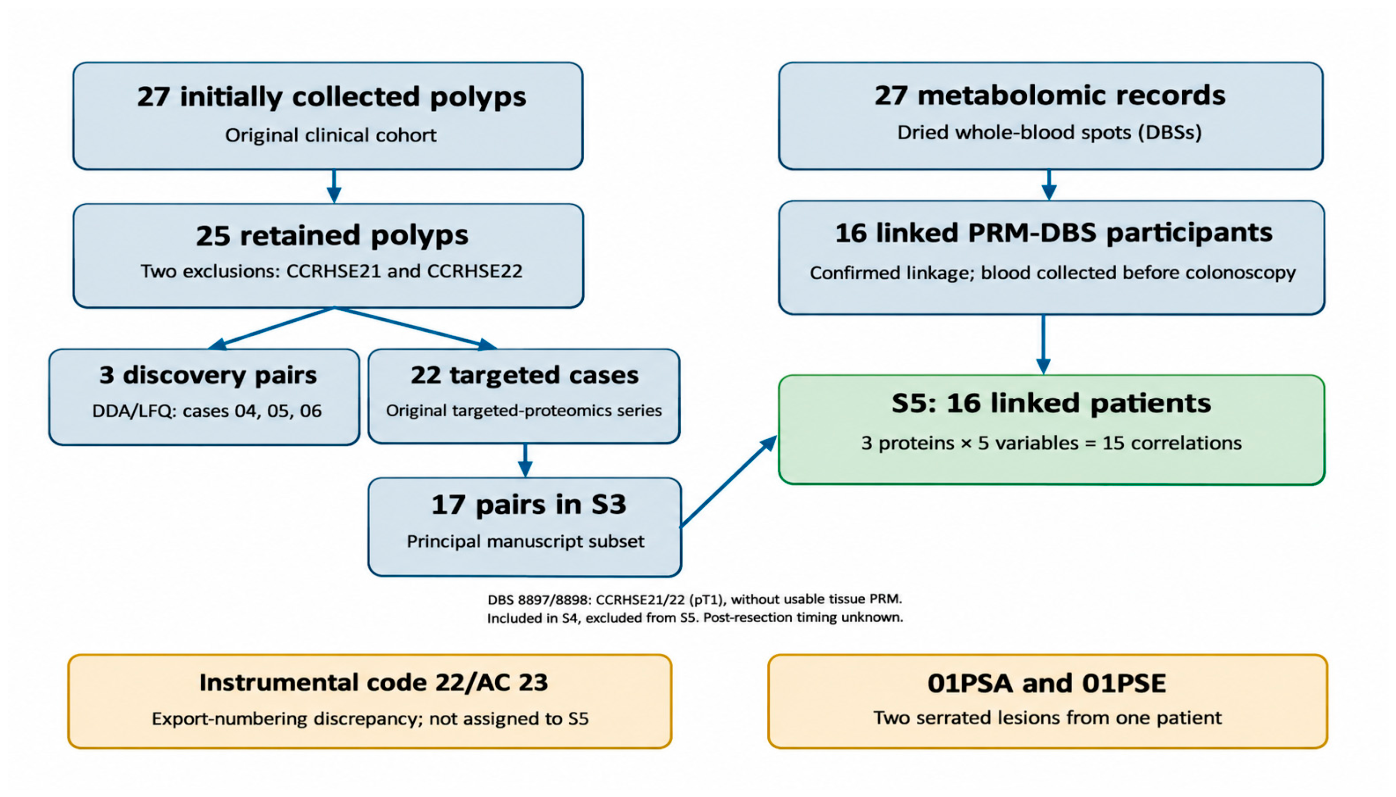
Analytical subsets and their denominators are summarised in Table 1 and their traceability is illustrated in Figure 1. The 17-pair PRM matrix, six serrated lesion entries from five patients and 16 patient-level linked PRM–DBS subset are overlapping analytical sets, not additive cohorts.
Figure 1.
Cohort traceability and cross-omic analytical subsets. Flow diagram of clinical lesions and analytical datasets. The 27 clinical polyps included 25 with usable tissue proteomics after exclusion of CCRHSE21 and CCRHSE22; these two cases retained DBS measurements. Discovery tissue proteomics comprised three cases, and the original targeted series comprised 22 cases. The principal targeted matrix contained 17 lesion/reference pairs; 16 individuals had traceably linked PRM–DBS measurements. The descriptive serrated set comprised six lesions from five patients; two lesions were sampled in the same patient (01PSA/01PSE). These subsets are not additive.
3.1. Proteomic Context and Targeted Panel
The 1916-protein discovery matrix was used as a molecular reference context for the selection and interpretation of processes related to epithelial adhesion, cell–matrix interaction, cytoskeletal organisation and extracellular matrix remodelling. Because the discovery cohort consisted of conventional pathway lesions, its TU/SA differences were not interpreted in this study as evidence of serrated progression. Complete values from the discovery proteomics dataset are presented in Supplementary Table S2.
The targeted proteomics panel included 13 proteins; their official nomenclature and UniProtKB accession numbers are shown in Table 3.
Table 3.
UniProtKB nomenclature of proteins included in the targeted proteomics panel.
The main PRM matrix includes 17 lesion/reference pairs. Additional serrated observations, including 01PSA (SSL) and 01PSE (SSL-HGD), were evaluated descriptively using peptide-level data; they are not independent participants. Numerical source data and protein/peptide annotation are provided in Supplementary Tables S1 and S3.
3.2. Descriptive Comparison Between the Conventional and Serrated Pathways
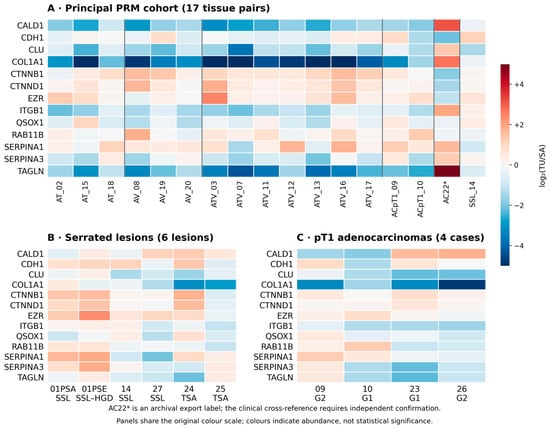
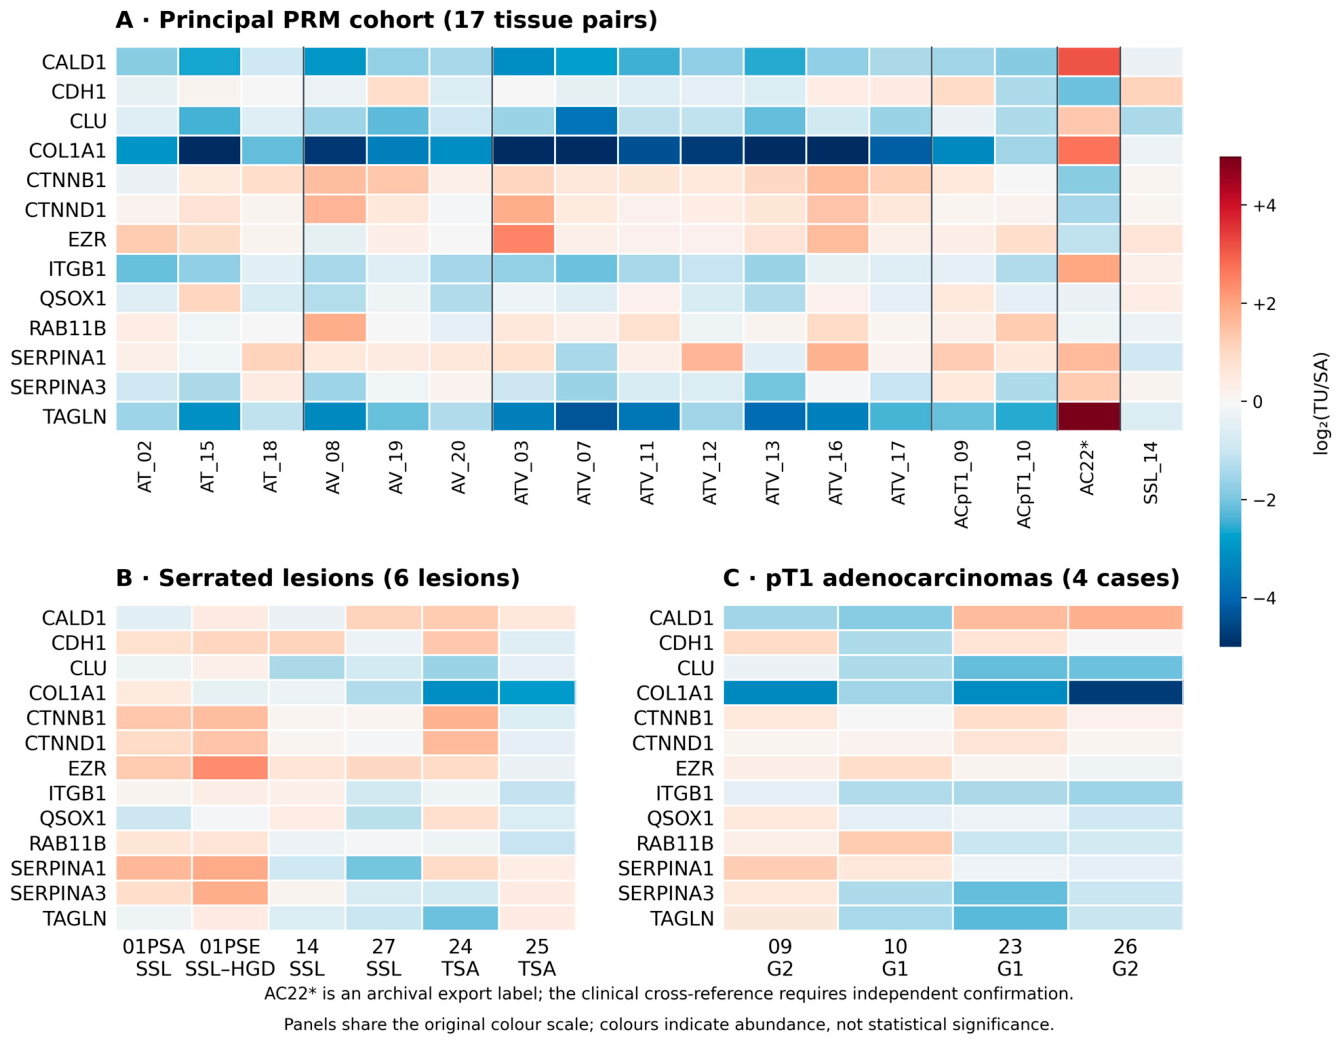
Protein-level abundance profiles across lesion categories were displayed on a common log2(TU/SA) scale (Figure 2). The principal 17 pairs and the descriptive serrated and pT1 panels are overlapping views of source measurements rather than independent cohorts.
Figure 2.
Targeted proteomics abundance profiles (log2[TU/SA]) of 13 proteins. (A) Seventeen principal PRM pairs; (B) six serrated lesions from five patients, including SSL and SSL-HGD from the same participant; and (C) four pT1 adenocarcinomas. The panels are descriptive, overlapping analytical views and are not additive. Colours do not imply statistical significance. Dark solid vertical lines separate sample blocks in panel A. All proteins, including COL1A1, ITGB1 and RAB11B, are identified by row labels in each panel. The raw export label AC22* in panel A has not been equated with clinical case 23 without independent documentation.
The observed patterns were heterogeneous across histological groups, including serrated lesions. Neither a coordinated ECM programme nor statistically robust serrated-specific signature was demonstrated by the present targeted panel.
3.3. Intra-Patient SSL/SSL-HGD Analysis
The lesions 01PSA (SSL without dysplasia) and 01PSE (SSL with high-grade dysplasia) arose in the same patient but were two distinct polyps. This cross-sectional comparison is not longitudinal and does not demonstrate that one lesion evolved into the other. The available clinical record does not document separate sizes for both lesions; anatomical metadata recorded jointly were not assigned individually to 01PSA or 01PSE without corroborating clinical evidence. Epithelial, stromal and inflammatory fractions were not quantified for either lesion.
The intra-patient change in log2(TU/SA), SSL-HGD minus SSL, was −0.833 for COL1A1 (+0.489 versus −0.344), +0.176 for ITGB1 (+0.141 versus +0.317), and +0.037 for RAB11B (+0.610 versus +0.647) (Table 4). Three COL1A1 peptides showed a concordant decrease, two ITGB1 peptides a concordant increase, and RAB11B was assessed with a single peptide. These are descriptive observations from one patient, not markers of dysplastic progression.
Table 4.
Intra-patient protein abundance in two distinct serrated lesions (01PSA, SSL; 01PSE, SSL-HGD).
3.4. Metabolomic Comparisons Between Histological Groups
The 27 DBS records comprised 5 serrated and 22 conventional/pT1 lesions, including 2 pT1 cases without usable PRM data. For C18, the median was 0.2571 in serrated cases versus 0.4470 in conventional/pT1 cases, a descriptive median difference of −0.1899 on the original export scale (two-sided Mann–Whitney test, p = 0.00488; Benjamini–Hochberg-adjusted q = 0.09273 across 19 comparisons). None of the 19 metabolites or ratios achieved q < 0.05. Neither these concentrations nor the ratios estimate β-oxidation flux. Table 2 summarises group measurements; individual values and all 19 comparisons are provided in Table S4. Comparisons involved blood measurements by histological group, not lesion-to-normal tissue ratios.
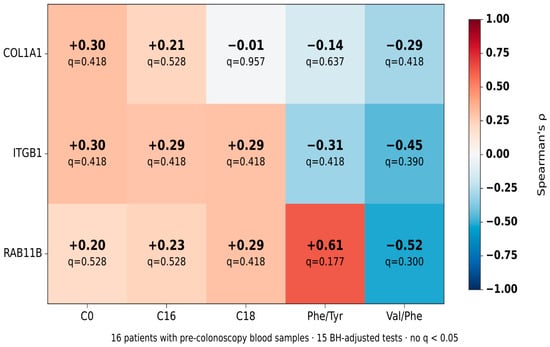
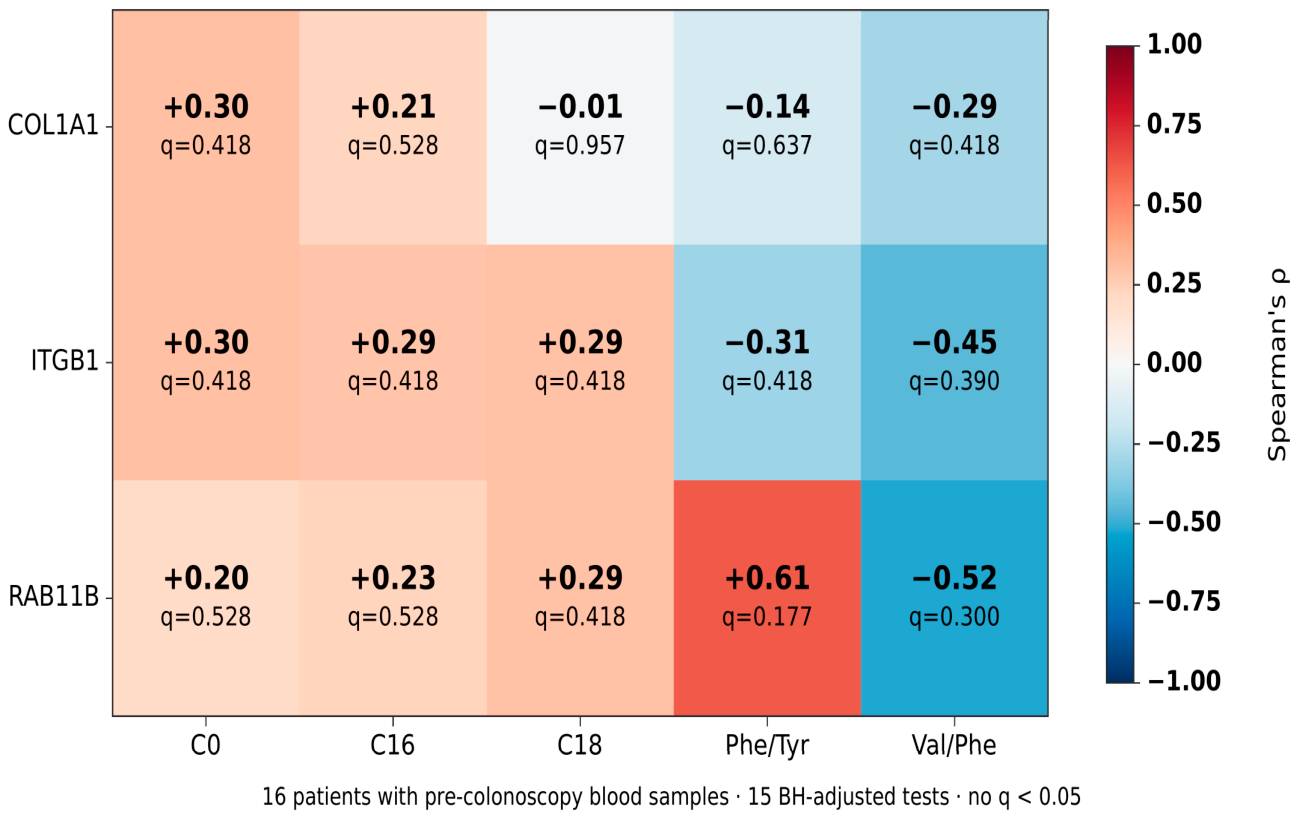
Sample sizes refer to genuinely independent analytical units. Inferential confidence intervals were not calculated for the comparison of two lesions from one patient, nor were new intervals created where they were absent from the original exports. COL1A1, ITGB1 and RAB11B represent different tissue processes, whereas DBS analytes are whole-blood measurements sensitive to systemic context. None of the 15 correlations established coordinated remodelling of stroma, adhesion, intracellular trafficking and metabolism; Figure 3 displays observed coefficients, not a causal mechanism.
Figure 3.
Exploratory correlations between three tissue proteins (COL1A1, ITGB1 and RAB11B) and five DBS variables (C0, C16, C18, Phe/Tyr and Val/Phe) in 16 participants with matched measurements. Values indicate Spearman’s rho and BH-adjusted q; no q value was below 0.05.
3.5. Exploratory Cross-Omic Correlations
Among 16 patients with linked PRM–DBS measurements and blood collected before colonoscopy, 15 Spearman correlations were calculated. RAB11B showed nominal associations with Phe/Tyr (rho = +0.612, p = 0.0118, q = 0.1768) and Val/Phe (rho = −0.518, p = 0.0400, q = 0.3000); neither survived Benjamini–Hochberg adjustment. The linked cohort mainly contained conventional lesions, so these analyses do not demonstrate a serrated pathway-specific cross-omic association. Table 5 summarises the inferential framework and S5 presents all the results.
Table 5.
Summary of analytical units, statistical comparisons and inferential scope.
Tissue profiles suggest heterogeneous contributions from epithelial adhesion, extracellular matrix and intracellular trafficking, whereas DBS profiles represent systemic metabolites that may vary with fasting, diet, renal function and other factors. These independent features should not be described as an experimentally established integrated pathway.
The present evidence is hypothesis-generating. It does not demonstrate a causal relationship between lesion-associated proteomic measurements and systemic metabolic changes, or predict clinical progression or validate biomarkers.
4. Discussion
This descriptive study provides evidence from two serrated lesions belonging to the same patient, alongside proteomic and DBS measurements linked in a predominantly conventional subset. The principal serrated observation is not a coordinated remodelling signature but heterogeneity in three functionally distinct proteins, interpreted in light of established genetic, epigenetic and single-cell evidence [3,4,8,9,25]. The absence of associations surviving multiplicity correction and the small number of serrated lesions preclude proposing biomarkers or a defined molecular progression trajectory. Foundational studies and histopathological guidance on the serrated pathway inform the clinical context [22,26,27]. The consensus molecular classification of colorectal cancer and the updated hallmarks framework provide further context for stromal and metabolic processes, but these data cannot assign a consensus molecular subtype to the lesions in this cohort [28,29].
The three discovery pairs and 17 principal PRM pairs are shared with the related methodological MIIEM manuscript. The distinct contribution of the present study is the descriptive evaluation of additional serrated lesions—including the cross-sectional 01PSA/01PSE contrast—the analysis of 27 dried blood spot records and the exploration of 15 associations in 16 linked individuals. This overlap is declared so that the same experimental material is not mistaken for two independent validations.
In whole tissue, COL1A1 reflects fibrillar collagen and is sensitive to stromal content; ITGB1 relates to cell–matrix adhesion and signalling and is not specific to neoplastic cells; RAB11B participates in recycling-endosome trafficking and epithelial polarity. The relevance of the microenvironment and extracellular matrix is well established [16,17,18], and studies of intestinal membrane recycling and the RAB11 family provide functional context [30,31]. Nevertheless, these studies do not validate RAB11B as a marker of serrated progression or justify direct extrapolation from RAB11A. In the intra-patient comparison, COL1A1 decreased rather than increasing alongside the other two proteins. The discovery-level RAB11A/RAB11B protein group does not independently validate PRM specificity for RAB11B, and QSOX1 is reported using UniProtKB accession O00391.
DBS metabolomics reflects systemic concentrations conventionally expressed in μmol/L or dimensionless ratios, rather than directly measuring intracellular fatty acid flux [12,23,24]. The C14:1/C12, C4/C8 and C0/(C16 + C18) ratios are relative analyte measures, not enzyme-specific read-outs of β-oxidation. Fasting status, diet, medication, renal function and comorbidity could not be retrospectively standardised; some DBS samples outside the pre-colonoscopy subset were collected after resection. Against this background, the nominal C18 difference and RAB11B correlations did not survive multiplicity correction and do not demonstrate a causal structural–metabolic link. DBS measures peripheral blood and therefore does not have a tissue-based TU/SA comparison.
Principal limitations include the small serrated representation (one SSL among the 17 principal PRM tissue pairs and two lesions from one patient in the specific serrated contrast), histological heterogeneity and the absence of systematic tissue compartment histomorphometry. Although routine pathology FFPE processing and subsequent proteomic preparation are documented, individual retrospective records of fixation and storage times, tissue mass, digestion yield and batch allocation are incomplete, limiting assessment of pre-analytical variability. Differences in DBS sampling times, potential systemic confounding and the lack of independent validation also constrain interpretation.
Future work should include independent, prospective SSL and SSL-HGD cohorts with lesion-level histological characterisation, uniform DBS sampling times, auditable PRM methods and prespecified statistical plans. Clinically adjusted cross-compartment analyses and external validation may determine whether any of these structural or metabolic hypotheses have mechanistic relevance or clinical utility [32].
5. Conclusions
The intra-patient SSL/SSL-HGD comparison revealed heterogeneous protein abundance changes: COL1A1 −0.833, ITGB1 +0.176 and RAB11B +0.037 (difference in log2[TU/SA], SSL-HGD minus SSL). Neither the 19 DBS group tests nor the 15 correlations in 16 linked individuals remained significant after BH correction. These findings do not demonstrate serrated-specific progression, causality or clinical biomarker performance; they warrant independent validation.
Supplementary Materials
The following supporting information can be downloaded at: https://www.mdpi.com/article/10.3390/cimb48111208/s1.
Author Contributions
J.L. and F.B. conceived this study and participated in its planning and supervision. F.B. was responsible for patient selection, clinical data collection, endoscopic procedures and biological sample collection. J.L. contributed to the conceptual guidance of the work, performed the statistical and formal analyses, and prepared the figures. P.G. contributed to the academic and scientific supervision of the project and to the critical revision of the manuscript. J.L. and F.B. drafted the original manuscript. All authors have read and agreed to the published version of the manuscript.
Funding
This work was funded by the Fundación Jesús de Gangoiti Barrera. The award decision was dated 16 November 2017.
Institutional Review Board Statement
This study was conducted in accordance with the Declaration of Helsinki and was approved by the Basque Country Clinical Research Ethics Committee (Comité de Ética de la Investigación Clínica del País Vasco) on 15 February 2016 (approval no. 2016/01), in accordance with Spanish regulations (Royal Decree 1090/2015).
Informed Consent Statement
Written informed consent was obtained from all participants before inclusion, including authorisation for the use of biological samples for research purposes.
Data Availability Statement
Original RAW and processed discovery/targeted proteomics data have been deposited with ProteomeXchange via PRIDE under accession PXD075102 (private until release on publication). Metabolomic DBS measurements are not included in this PRIDE deposit; anonymised results and exploratory analyses are provided in Supplementary Table S4. Access to additional clinical or instrumental records is subject to applicable ethics and privacy restrictions.
Acknowledgments
The authors thank the Proteomics Service of the University of the Basque Country (EHU) and the Metabolomics Platform of the Biobizkaia Health Research Institute for their technical support. During manuscript preparation, the authors used ChatGPT (model GPT-6 Sol; OpenAI, San Francisco, CA, USA) for linguistic editing and generation/refinement of schematic figures. All outputs were reviewed and edited by the authors, who take full responsibility for the final content.
Conflicts of Interest
The authors declare no conflicts of interest.
Abbreviations
AGC, automatic gain control; AT, tubular adenoma; ATV, tubulovillous adenoma; AV, villous adenoma; BH, Benjamini–Hochberg; CIMP, CpG island methylator phenotype; CRC, colorectal cancer; DBS, dried whole-blood spot; DDA, data-dependent acquisition; ECM, extracellular matrix; FASP, filter-aided sample preparation; FDR, false discovery rate; FFPE, formalin-fixed paraffin-embedded; HGD, high-grade dysplasia; LC–MS/MS, liquid chromatography–tandem mass spectrometry; LFQ, label-free quantification; MIIEM, multilayer integration of molecular evidence; PRM, parallel reaction monitoring; Q1–Q3, first and third quartiles; SA, histologically non-lesional reference mucosa; SSL, sessile serrated lesion; SSL-HGD, sessile serrated lesion with high-grade dysplasia; TSA, traditional serrated adenoma; TU, lesional or tumour tissue. The symbols and UniProtKB accessions of all 13 proteins appear in Table 3.
References
- Anderson, J.C.; Hisey, W.; Mackenzie, T.A.; Robinson, C.M.; Srivastava, A.; Meester, R.G.S.; Butterly, L.F. Clinically significant serrated polyp detection rates and risk for postcolonoscopy colorectal cancer: Data from the New Hampshire Colonoscopy Registry. Gastrointest. Endosc. 2022, 96, 310–317. [Google Scholar] [CrossRef] [Scilit] [PubMed]
- Yeh, J.-H.; Moi, S.-H.; Chen, C.-C.; Hsu, C.-W.; Yeh, W.-S.; Tseng, T.-N.; Lin, C.-P.; Liu, Y.-P.; Wang, J.-Y. Predominant serrated molecular signature in postcolonoscopy colorectal cancer: A systematic review and meta-analysis. Am. J. Gastroenterol. 2026, 121, 122–129. [Google Scholar] [CrossRef] [Scilit] [PubMed]
- Aiderus, A.; Barker, N.; Tergaonkar, V. Serrated colorectal cancer: Preclinical models and molecular pathways. Trends Cancer 2024, 10, 76–91. [Google Scholar] [CrossRef] [Scilit] [PubMed]
- Rzasa, P.; Whelan, S.; Farahmand, P.; Cai, H.; Guterman, I.; Palacios-Gallego, R.; Undru, S.S.; Sandford, L.; Green, C.; Andreadi, C.; et al. BRAF(V600E)-mutated serrated colorectal neoplasia drives transcriptional activation of cholesterol metabolism. Commun. Biol. 2023, 6, 962. [Google Scholar] [CrossRef] [Scilit] [PubMed]
- Kambara, T.; Simms, L.A.; Whitehall, V.L.J.; Spring, K.J.; Wynter, C.V.A.; Walsh, M.D.; Barker, M.A.; Arnold, S.; McGivern, A.; Matsubara, N.; et al. BRAF mutation is associated with DNA methylation in serrated polyps and cancers of the colorectum. Gut 2004, 53, 1137–1144. [Google Scholar] [CrossRef] [Scilit] [PubMed]
- Weisenberger, D.J.; Siegmund, K.D.; Campan, M.; Young, J.; Long, T.I.; Faasse, M.A.; Kang, G.H.; Widschwendter, M.; Weener, D.; Buchanan, D.; et al. CpG island methylator phenotype underlies sporadic microsatellite instability and is tightly associated with BRAF mutation in colorectal cancer. Nat. Genet. 2006, 38, 787–793. [Google Scholar] [CrossRef] [Scilit] [PubMed]
- Crockett, S.D.; Shaukat, A.; Delau, O.; Stoffel, E.M.; Church, T.R.; Syngal, S.; Bresalier, R. Risk factors for serrated polyps: Results from a large, multicenter colonoscopy-based study. Am. J. Gastroenterol. 2024, 119, 2532–2539. [Google Scholar] [CrossRef] [Scilit] [PubMed]
- Bettington, M.; Walker, N.; Rosty, C.; Brown, I.; Clouston, A.; McKeone, D.; Pearson, S.-A.; Leggett, B.; Whitehall, V. Clinicopathological and molecular features of sessile serrated adenomas with dysplasia or carcinoma. Gut 2017, 66, 97–106. [Google Scholar] [CrossRef] [Scilit] [PubMed]
- Hinoue, T.; Weisenberger, D.J.; Lange, C.P.E.; Shen, H.; Byun, H.M.; Van Den Berg, D.; Malik, S.; Pan, F.; Noushmehr, H.; van Dijk, C.M.; et al. Genome-scale analysis of aberrant DNA methylation in colorectal cancer. Genome Res. 2012, 22, 271–282. [Google Scholar] [CrossRef] [Scilit] [PubMed]
- Nicholson, J.K.; Lindon, J.C. Systems biology: Metabonomics. Nature 2008, 455, 1054–1056. [Google Scholar] [CrossRef] [Scilit] [PubMed]
- Li, Y.; Dou, Y.; Da Veiga Leprevost, F.; Geffen, Y.; Calinawan, A.P.; Aguet, F.; Akiyama, Y.; Anand, S.; Birger, C.; Cao, S.; et al. Proteogenomic data and resources for pan-cancer analysis. Cancer Cell 2023, 41, 1397–1406. [Google Scholar] [CrossRef] [Scilit] [PubMed]
- Avram, L.; Crișan, D.; Moldovan, R.C.; Bogos, L.G.; Iuga, C.A.; Andraș, D.; Crișan, S.; Bodolea, C.; Nemeş, A.; Donca, V. Metabolomic exploration of colorectal cancer through amino acids and acylcarnitines profiling of serum samples. Cancers 2025, 17, 427. [Google Scholar] [CrossRef] [Scilit] [PubMed]
- Zhang, B.; Wang, J.; Wang, X.; Zhu, J.; Liu, Q.; Shi, Z.; Chambers, M.C.; Zimmerman, L.J.; Shaddox, K.F.; Kim, S.; et al. Proteogenomic characterization of human colon and rectal cancer. Nature 2014, 513, 382–387. [Google Scholar] [CrossRef] [Scilit] [PubMed]
- Vander Heiden, M.G.; Cantley, L.C.; Thompson, C.B. Understanding the Warburg effect: The metabolic requirements of cell proliferation. Science 2009, 324, 1029–1033. [Google Scholar] [CrossRef] [Scilit] [PubMed]
- Pavlova, N.N.; Thompson, C.B. The emerging hallmarks of cancer metabolism. Cell Metab. 2016, 23, 27–47. [Google Scholar] [CrossRef] [Scilit] [PubMed]
- Joyce, J.A.; Pollard, J.W. Microenvironmental regulation of metastasis. Nat. Rev. Cancer 2009, 9, 239–252. [Google Scholar] [CrossRef] [Scilit] [PubMed]
- Pickup, M.W.; Mouw, J.K.; Weaver, V.M. The extracellular matrix modulates the hallmarks of cancer. EMBO Rep. 2014, 15, 1243–1253. [Google Scholar] [CrossRef] [Scilit] [PubMed]
- Lu, P.; Weaver, V.M.; Werb, Z. The extracellular matrix: A dynamic niche in cancer progression. J. Cell Biol. 2012, 196, 395–406. [Google Scholar] [CrossRef] [Scilit] [PubMed]
- Satpathy, S.; Krug, K.; Jean Beltran, P.M.; Savage, S.R.; Petralia, F.; Kumar-Sinha, C.; Dou, Y.; Reva, B.; Kane, M.H.; Avanessian, S.C.; et al. A proteogenomic portrait of lung squamous cell carcinoma. Cell 2021, 184, 4348–4371.e40. [Google Scholar] [CrossRef] [Scilit] [PubMed]
- Liu, X.; Sun, X.; Mu, W.; Li, Y.; Bu, W.; Yang, T.; Zhang, J.; Liu, R.; Ren, J.; Zhou, J.; et al. Autophagic flux-lipid droplet biogenesis cascade sustains mitochondrial fitness in colorectal cancer cells adapted to acidosis. Cell Death Discov. 2025, 11, 21. [Google Scholar] [CrossRef] [Scilit] [PubMed]
- Lin, Y.; Zhang, Y.; Huang, T.; Chen, J.; Li, G.; Zhang, B.; Xu, L.; Wang, K.; He, H.; Chen, H.; et al. Arginine deprivation induces quiescence and confers vulnerability to ferroptosis in colorectal cancer. Cancer Res. 2025, 85, 1663–1679. [Google Scholar] [CrossRef] [Scilit] [PubMed]
- Rex, D.K.; Ahnen, D.J.; Baron, J.A.; Batts, K.P.; Burke, C.A.; Burt, R.W.; Goldblum, J.R.; Guillem, J.G.; Kahi, C.J.; Kalady, M.F.; et al. Serrated lesions of the colorectum: Review and recommendations from an expert panel. Am. J. Gastroenterol. 2012, 107, 1315–1329. [Google Scholar] [CrossRef] [Scilit] [PubMed]
- Centers for Disease Control and Prevention (CDC). Using tandem mass spectrometry for metabolic disease screening among newborns: A report of a work group. MMWR Recomm. Rep. 2001, 50, 1–22. [Google Scholar] [PubMed]
- Miller, M.J.; Cusmano-Ozog, K.; Oglesbee, D.; Young, S.; ACMG Laboratory Quality Assurance Committee. Laboratory analysis of acylcarnitines, 2020 update: A technical standard of the American College of Medical Genetics and Genomics (ACMG). Genet. Med. 2021, 23, 249–258. [Google Scholar] [CrossRef] [Scilit] [PubMed]
- Zhou, Y.-J.; Lu, X.-F.; Chen, H.; Wang, X.-Y.; Cheng, W.; Zhang, Q.-W.; Chen, J.-N.; Wang, X.-Y.; Jin, J.-Z.; Yan, F.-R.; et al. Single-cell transcriptomics reveals early molecular and immune alterations underlying the serrated neoplasia pathway toward colorectal cancer. Cell Mol. Gastroenterol. Hepatol. 2023, 15, 393–424. [Google Scholar] [CrossRef] [Scilit] [PubMed]
- Leggett, B.; Whitehall, V. Role of the serrated pathway in colorectal cancer pathogenesis. Gastroenterology 2010, 138, 2088–2100. [Google Scholar] [CrossRef] [Scilit] [PubMed]
- Bettington, M.; Walker, N.; Clouston, A.; Brown, I.; Leggett, B.; Whitehall, V. The serrated pathway to colorectal carcinoma: Current concepts and challenges. Histopathology 2013, 62, 367–386. [Google Scholar] [CrossRef] [Scilit] [PubMed]
- Guinney, J.; Dienstmann, R.; Wang, X.; de Reyniès, A.; Schlicker, A.; Soneson, C.; Marisa, L.; Roepman, P.; Nyamundanda, G.; Angelino, P.; et al. The consensus molecular subtypes of colorectal cancer. Nat. Med. 2015, 21, 1350–1356. [Google Scholar] [CrossRef] [Scilit] [PubMed]
- Hanahan, D. Hallmarks of cancer: New dimensions. Cancer Discov. 2022, 12, 31–46. [Google Scholar] [CrossRef] [Scilit] [PubMed]
- Silvis, M.R.; Bertrand, C.A.; Ameen, N.; Golin-Bisello, F.; Butterworth, M.B.; Frizzell, R.A.; Bradbury, N.A. Rab11b regulates the apical recycling of the cystic fibrosis transmembrane conductance regulator in polarized intestinal epithelial cells. Mol. Biol. Cell 2009, 20, 2337–2350. [Google Scholar] [CrossRef] [Scilit] [PubMed]
- Ferro, E.; Bosia, C.; Campa, C.C. RAB11-mediated trafficking and human cancers: An updated review. Biology 2021, 10, 26. [Google Scholar] [CrossRef] [Scilit] [PubMed]
- Hasin, Y.; Seldin, M.; Lusis, A. Multi-omics approaches to disease. Genome Biol. 2017, 18, 83. [Google Scholar] [CrossRef] [Scilit] [PubMed]

Disclaimer/Publisher’s Note: The statements, opinions and data contained in all publications are solely those of the individual author(s) and contributor(s) and not of MDPI and/or the editor(s). MDPI and/or the editor(s) disclaim responsibility for any injury to people or property resulting from any ideas, methods, instructions or products referred to in the content. |
© 2026 by the authors. Licensee MDPI, Basel, Switzerland. This article is an open access article distributed under the terms and conditions of the Creative Commons Attribution (CC BY) license.