


Abstract
Nasopharyngeal carcinoma (NPC) is highly prevalent in Southeast Asia, including Indonesia, with most patients presenting at advanced clinical stages. Reliable, minimally invasive circulating biomarkers for monitoring treatment response are lacking. This study aimed to identify candidate blood-based transcriptomic biomarkers for advanced-stage NPC through integrative bioinformatic analysis and to evaluate the expression dynamics of a prioritised candidate gene, TSPAN32, in peripheral blood of patients undergoing chemoradiation. Differentially expressed genes (DEGs) were identified from the GEO microarray dataset GSE53819 (18 advanced-stage NPC tissues vs. 18 non-cancerous nasopharyngeal tissues) using GEO2R. Candidate DEGs were prioritised through protein–protein interaction (PPI) network analysis (STRING confidence ≥ 0.9), functional enrichment analysis (GO via Enrichr; KEGG pathway via ShinyGO v0.82), and survival analysis (Kaplan–Meier). Overlapping DEGs were identified against a previously published blood-based NPC transcriptomic dataset with 11 early-stage NPC patients, 11 advanced-stage NPC patients, and 11 healthy donors. Analysis of GSE53819 identified 943 upregulated and 1503 downregulated DEGs (|log2FC| ≥ 1; Padj < 0.05). Functional enrichment of upregulated DEGs was dominated by inflammatory response and cytokine activity pathways, while downregulated DEGs were enriched in B-cell activation and immunoglobulin receptor binding. Protein–protein interaction network construction (STRING confidence ≥ 0.9) and hub gene identification using the MCC algorithm identified six candidate genes among the downregulated DEGs: ADRA2A, SELP, TSPAN32, PEAR1, P2RX1, and DGKG. Kaplan-Meier survival analysis demonstrated that lower expression of SELP (HR = 0.57; p = 0.00053), TSPAN32 (HR = 0.56; p = 0.00025), and P2RX1 (HR = 0.48; p = 1.2 × 10⁻⁵) was significantly associated with shorter overall survival in head and neck carcinoma, supporting TSPAN32 as the primary candidate for clinical validation. RT-qPCR examination demonstrated that TSPAN32 transcript abundance in peripheral blood was significantly upregulated following chemoradiation in nine of ten patients (mean Log2FC = 2.08 ± SD 1.09, 95% CI 1.29–2.86; one-sample t-test t(9) = 6.01, p = 0.0002; Wilcoxon signed-rank test p = 0.002). Primer specificity for TSPAN32 and ACTB was confirmed by melt-curve analysis and in silico validation (Primer-BLAST, OligoAnalyzer, UCSC In-Silico PCR). RBC transfusion status did not significantly modulate the magnitude of TSPAN32 expression change (independent-samples t-test, t = 1.86, p = 0.101). This integrative study identifies TSPAN32 as a candidate circulating biomarker responsive to chemoradiation in advanced-stage NPC. These exploratory findings require confirmation in larger, prospective, longitudinal cohorts before clinical translation.
1. Introduction
Nasopharyngeal cancer, or nasopharyngeal carcinoma (NPC), is a malignant epithelial tumor located in the nasopharynx and is the most common malignant tumor in the ear, nose, and throat (ENT) area [1,2]. The causes of NPC are complex and not fully understood at this time, but carcinogenesis may occur due to genetic, environmental, and viral factors, particularly Epstein–Barr Virus (EBV) infection [3]. The prevalence of NPC varies greatly geographically. For example, in non-endemic areas such as the Americas and Europe, NPC is extremely rare, occurring at less than 1 case per 100,000 people [4]; meanwhile in Asia, specifically certain parts of China, the incidence rate is much higher, namely more than 21 cases per 100,000 people, contributing to around 18% of all types of cancer. NPC cases in the Asian population are predominantly in middle age, the fourth to sixth decades of life, whereas in Africa, specifically in areas where EBV infection is endemic, the majority of cases occur in children [3].
According to the Global Cancer Observatory (GLOBACAN), 83.3% of NPC cases and 83.6% of deaths occur in Asia, with the highest incidence rates in East Asia (52.6%), Southeast Asia (35.8%), and South-Central Asia (9.2%). Nine of the ten countries with the highest age-standardized incidence rate (ASIR) in the world are in Southeast Asia. Indonesia itself ranks second in the world for NPC incidence after China (18.8%) and has the third-highest ASIR (6.1%) [5,6]. One of the biggest challenges in managing NPC in Indonesia is that patients often come when their complaints get worse. Several studies show that the majority of patients (51–70.5%) come to the hospital with advanced-stage NPC, III-IV [7,8,9]. The behavior of patients who have just arrived at the final stage is usually caused by non-specific NPC symptoms such as nasal congestion, epistaxis, and a mass in the neck, which can be considered a benign condition [10].
Treatment for advanced NPC consists of chemotherapy and radiotherapy, typically with platinum agents combined with intensity-modulated radiotherapy (IMRT). This combination is known to be the mainstay of treatment because it is associated with high rates of local control [11]. Since this regimen is myelosuppressive and frequently induces anemia, red blood cell (RBC) transfusion is a standard supportive therapy [12,13]. Transfusion aims to correct anemia and potentially improve tumor oxygenation, thereby increasing radiosensitivity [13,14].
In advance-stage NPC, clinical management also becomes very challenging due to the variability in clinical presentation and the difficulty in linking predictions of disease progression to therapeutic outcomes. In recent years, biomarkers have been used as important monitoring tools in NPC management [15]. There are at least two general categories of NPC biomarkers: EBV-related biomarkers and cellular biomarkers. EBV-related biomarkers include EBNA1, LMP1/2, EBER 1/2, and BART miRNAs [16]. These biomarkers provide insight into the underlying tumor biology, aid in assessing prognosis, and inform treatment decision-making [15]. However, these biomarkers have several limitations. For example, in treatment monitoring, EBV biomarkers generally show little change, even after curative therapy [17]. In addition, not all NPC patients show detectable EBV reactivation and the lack of standardization in EBV DNA testing protocols, including detection equipment, DNA extraction methods, target DNA fragments, quality control, and especially threshold determination, remains a controversial issue [16,18]. Thus, these limitations indicate an unmet need for the development of more accurate biomarkers, particularly in assessing NPC disease progression.
In the past two decades, the emergence of omics technologies has brought about major changes in the understanding of biological systems. One such technology is transcriptomics, which studies gene expression in RNA, revealing which genes are expressed or inhibited under certain conditions [19]. Transcriptomic analysis is an excellent tool in the biomarker discovery process because it allows for comprehensive identification of gene expression patterns related to tumorigenesis, progression, and therapeutic response [16,20]. This approach allows the identification of unique gene expression patterns specific to a particular tumor, offering deeper insights into disease pathogenesis and potential therapeutic targets [16,19]. One of the most frequently used instruments in the field of transcriptomics is a repository called the Gene Expression Omnibus (GEO). GEO is a public functional genomics data repository created by the National Center for Biotechnology Information (NCBI) that archives and freely distributes high-throughput microarray and RNA-seq transcriptomic datasets [21]. In the context of transcriptomic research on NPC, most studies have focused on relatively more invasive tissue specimen collection and are limited in long-term serial monitoring during therapy [22,23]. This study aims to identify candidate biomarkers detectable through tissue and blood examination in advanced-stage NPC patients using the bioinformatics analysis approach.
2. Materials and Methods
2.1. Study Design
This study combines primary clinical samples from NPC patients at Cipto Mangunkusumo Hospital and secondary datasets from the GEO dataset that was conducted between September 2023 and March 2026. The study used a two-phase integrated biomarker discovery and clinical study design. Phase 1 included an in silico bioinformatic discovery phase that used publicly accessible transcriptome datasets to identify potential DEGs linked with advanced-stage NPC. Phase 2 was a prospective examination phase in which the expression of the key candidate gene was measured using RT-qPCR in peripheral blood samples obtained longitudinally from a prospective cohort of advanced-stage NPC patients undergoing chemoradiation. A healthy control comparator group was not included in the RT-qPCR examination cohort.
2.2. Study Population and Ethics
This study comprised two phases. The in silico bioinformatic analysis of publicly available transcriptomic datasets (GSE53819 and the referenced blood transcriptomic dataset) began in September 2023. The prospective clinical component, comprising peripheral blood sample collection and RT-qPCR examination in advanced-stage NPC patients, was conducted under institutional ethics approval (KET-219/UN2.F1/ETIK/PPM.00.02/2024).
Adult patients aged over 18 with histopathologically confirmed advanced-stage nasopharyngeal carcinoma (clinical stage III–IV) scheduled to undergo concurrent chemoradiation as initial therapy were deemed eligible for inclusion.
Inclusion criteria required complete medical records encompassing histopathological data as well as a willingness to submit and sign informed consent. Patients were excluded if they had (i) started chemoradiation before enrolling; (ii) clinically significant comorbidities that could confound blood transcriptomic profiles (active autoimmune disease, concurrent haematological malignancy, known primary immunodeficiency); or (iii) insufficient blood sample volume for RNA extraction at either time point.
2.3. Clinical Treatment and Blood Sample Collection
Patients were classified into transfusion and non-transfusion groups during chemoradiation. All groups of patients undergoing chemoradiation were collected 5 mL of blood into an EDTA tube for analyses requiring plasma or cellular components before undergoing chemoradiation and after chemoradiation, with a maximum time of up to 8 weeks.
A standardized research data sheet form or case report form for recording subject identification codes, demographic data, clinical characteristics, histopathological diagnosis, tumor stage, metastatic status, treatment history, RBC transfusion status and volume, hemoglobin level/anemia status, EBV status, and laboratory results.
2.4. RNA Extraction and Quality Control
Whole blood was centrifuged at 2500× g for 10 min at 25 °C. The buffy-coat layer was separated and used for RNA extraction. RNA was extracted using the Quick-RNA™ MiniPrep Plus kit (Cat. No. R1058, Zymo Research, Irvine, CA, USA) according to the manufacturer’s protocol. RNA purity was assessed using the 260/280 nm absorbance ratio on the Implen NanoDrop P300 (Implen, Munich, Germany). RNA concentration was measured using the Qubit 3.0 Fluorometer (Thermo Fisher Scientific, Waltham, MA, USA) and the Qubit RNA Assay Kit (Thermo Fisher Scientific, Waltham, MA, USA). For biomarker validation, the primer pair was designed using Primer-BLAST (https://www.ncbi.nlm.nih.gov/tools/primer-blast/ (accessed on 27 May 2025) and evaluated using OligoAnalyzer Tools (https://sg.idtdna.com/pages/tools/oligoanalyzer (accessed on 27 May 2025) and UCSC In Silico PCR (https://genome.ucsc.edu/cgi-bin/hgPcr (accessed on 27 May 2025). The target-gene expression was normalized to ACTB (β-actin) as the housekeeping gene. RNA was reverse-transcribed into cDNA using Vazyme HiScript III RT SuperMix for qPCR with following steps: RNA template 1 μL was mixed with 4xgDNA wiper 4 μL, and ddh2O 11 μL into pcr tube, the sample in pcr tube was qPCR was incubated in 42 °C for 2 min in thermo cycler (First step of PCR).
Preparation for reverse transcription was conducted by adding 5x Hiscript III qRT Supermix and PCR product from the first step. Subsequently, the sample was loaded into a thermo cycler with incubation temperature 37 °C for 15 min and 85 °C for 5 s (Second step of PCR). The qPCR reaction contained 1 μL cDNA at 15 ng/μL, 10 μL of 2× Vazyme SYBR Green PCR Master Mix, 0.8 μL each of forward and reverse primers at the concentration reported in the laboratory protocol, and ddH2O 8.2 μL to a final volume of 20 μL. Amplification was performed with these following conditions: initial denaturation 95 °C for 30 s, cycling reaction 95 °C for 10 s and 60 °C for 30 s, and melting curve 95 °C for 15 s, 60 °C for 60 s, and 95 °C for 15 s. All results were recorded and documented.
2.5. In Silico DEG Discovery Phase
2.5.1. Dataset Selection and DEG Identification
The DEGs biomarkers were analyzed by using the datasets available in Gene Expression Omnibus (GEO) database. The keyword “nasopharyngeal cancer” was entered to search the appropriate datasets. GSE53819 was used to compare 18 advanced-stage NPC tissues and 18 non-cancerous nasopharyngeal tissues. The platelet RNA-sequencing study by Yuanji Xu et al., comprising 11 early-stage NPC patients, 11 advanced-stage NPC patients, and 11 healthy donors, was used as a blood-based source of DEGs (Table S1) [24]. Several publicly available NPC transcriptomic datasets were reviewed during study, including GSE12452 and GSE118613, these were not used in the present analysis as they comprise different NPC stage compositions (e.g., mixed-stage or non-advanced-stage tumors) that did not match the advanced-stage-specific focus of this study.
Raw GEO data were processed using GEO2R. An adjusted p-value < 0.05 was used as the statistical threshold. For DEG selection, an absolute log2 fold change of at least 1 was applied; for miRNA profiling, the fold-change criterion reported in the analysis was at least 1.5. Upregulated and downregulated genes from tissue and blood sources were compared using Venny 2.1.0. Overlapping candidates were selected for further biological, survival, and molecular validation analyses.
The GSE53819 DEGs were entered into STRING for PPI analysis using a confidence score of 0.9. Networks were visualized in Cytoscape software (version 3.8.2) [25]. Molecular complex detection (MCODE) algorithm included a degree cutoff of 2, k-core/k-score of 2, maximum depth of 100, and node score cutoff of 0.2. Gene Ontology enrichment was analyzed using ENRICHR [26,27,28], KEGG pathway [29,30,31] enrichment was analyzed using ShinyGO version 0.82 [32], and downregulated miRNA sets were analyzed using TAM 2.0 [33].
2.5.2. Protein–Protein Interaction (PPI) Network Analysis
DEGs passing threshold criteria were submitted to the STRING database (v11; https://string-db.org/ (accessed on 21 May 2025)) [34] for protein–protein interaction (PPI) network construction. It seeks to facilitate the investigation of protein networks and their relationships with diverse biological processes. A minimum interaction confidence score of 0.9 (high confidence) was applied to ensure network quality. The resulting network was visualised using Cytoscape v3.8.2 [25]. Network clustering was performed using the Molecular COmplex DEtection (MCODE) algorithm with parameters: degree cut-off = 2, k-score = 2, maximum depth = 100, and node score cut-off = 0.2 [20].
2.5.3. Functional Enrichment Analysis
Gene ontology (GO) enrichment analysis was performed using Enrichr (https://maayanlab.cloud/Enrichr/ (accessed on 23 May 2025)) [26,27,28] covering Biological Process (BP) and Molecular Function (MF) categories. KEGG pathway [29,30,31] enrichment analysis was conducted using ShinyGO v0.82 (https://bioinformatics.sdstate.edu/go/ (accessed on 23 May 2025)) [32]. The significance threshold of Padj < 0.05 was applied for all enrichment analyses.
2.5.4. Survival Analysis
The prognostic significance of candidate DEGs was evaluated using Kaplan–Meier survival analysis with respect to overall survival (OS) in head and neck carcinoma, using the KM-Plotter tool (https://kmplot.com/ (accessed on 25 May 2025)) [35]. Log-rank p-values and hazard ratios (HR) with 95% confidence intervals were calculated. A significance threshold of p < 0.05 was applied. Only DEGs showing statistically significant OS associations were considered for downstream cross-referencing and experimental clinical analysis.
2.5.5. Cross-Reference with Blood-Based Transcriptomic Dataset
To identify DEGs that are concordantly expressed in both NPC tissue and peripheral blood, the GSE53819 DEGs were overlapped with the published blood-based NPC transcriptomic dataset reported by Yuanji Xu et al. [24]. Identical thresholds (|log2FC| ≥ 1; Padj < 0.05) were applied to both datasets to ensure comparability. Overlap was visualised using Venn diagram analysis (Venny 2.1.0; https://bioinfogp.cnb.csic.es/tools/venny/ (accessed on 26 May 2025)) [36]. Genes concordantly dysregulated across both compartments were considered candidate circulating biomarkers, as their detectability in accessible peripheral blood reflects the transcriptomic aberrations observed in NPC tissue.
Overlap between tissue-derived and blood-derived DEGs was defined as genes meeting the significance threshold (|log2FC| ≥ 1, Padj < 0.05) in both the GSE53819 tissue analysis and the reference peripheral blood transcriptomic dataset. Given the modest size of both source datasets, this comparison was expected to yield a limited number of overlapping candidates and was used as a prioritisation step.
2.6. RT-qPCR Examination
2.6.1. Primer Design
The candidate for biomarker reference sequence was obtained from NCBI (Gene ID: 10077). Primers for RT-qPCR amplification were designed using Primer-BLAST (https://www.ncbi.nlm.nih.gov/tools/primer-blast/ (accessed on 27 May 2025)) [37] and quality-checked using the IDT OligoAnalyzer Tool (https://sg.idtdna.com/pages/tools/oligoanalyzer (accessed on 27 May 2025)) [38] and the UCSC In Silico PCR tool (https://genome.ucsc.edu/cgi-bin/hgPcr (accessed on 27 May 2025)) [39]. Beta-actin (ACTB) was selected as the housekeeping gene reference following confirmation of stable expression across clinical samples, consistent with established practice in peripheral blood gene expression studies.
2.6.2. RT-qPCR and Relative Quantification
Complementary DNA (cDNA) synthesis was performed from 100 ng total RNA per sample using Vazyme HiScript III RT SuperMix for qPCR. RT-qPCR reactions were performed in duplicate technical replicates on each sample. Thermal cycling conditions and reaction composition followed standard protocols for SYBR Green-based detection. ACTB (β-actin) was used as the endogenous reference gene for RT-qPCR normalisation in all samples.
2.7. Statistical Analysis
TSPAN32 relative expression (2^−ΔΔCt, Livak method) was calculated for each patient using the pre-chemoradiation sample as the intra-patient calibrator. Because the pre-treatment value is fixed at ΔΔCt = 0 by design, the treatment effect across the ten paired patients was evaluated using a one-sample t-test on the log2-transformed fold-change (Log2FC) values, testing the null hypothesis that mean Log2FC = 0. Normality was assessed with the Shapiro–Wilk test. A Wilcoxon signed-rank test was performed as a non-parametric confirmatory analysis. Statistical significance was defined as p < 0.05. All statistical analyses were performed using IBM SPSS Statistics version 20 and JASP. Kaplan–Meier survival curves were generated using KM-Plotter and log-rank test p-values and hazard ratios with 95% CIs are reported.
3. Results
3.1. Subject Characteristics
The demographic and clinical characteristics of ten nasopharyngeal carcinoma (NPC) patients included in this study are summarized in Table 1. The mean age of the cohort was 52.1 ± 9.6 years, ranging from 36 to 70 years. Five patients (NPC 01, 02, 03, 08, 09) received red blood cell transfusions with volumes between 204 mL and 438 mL, while five patients did not undergo transfusion. Most cases were classified as stage III or IV according to TNM and WHO staging, indicating advanced disease at presentation. Two patients (NPC 04 and NPC 06) exhibited distant metastasis (M1), corresponding to stage IVc. All patients completed the planned chemoradiation course. RNA quality control confirmed acceptable purity (A260/A280: 1.8–2.0) and sufficient concentration (≥10 ng/μL) across all paired samples.
Table 1.
Characteristics of nasopharyngeal cancer patients * mean (SD) = 52.1 ± 9.6 years.
3.2. DEG Identification from GSE53819
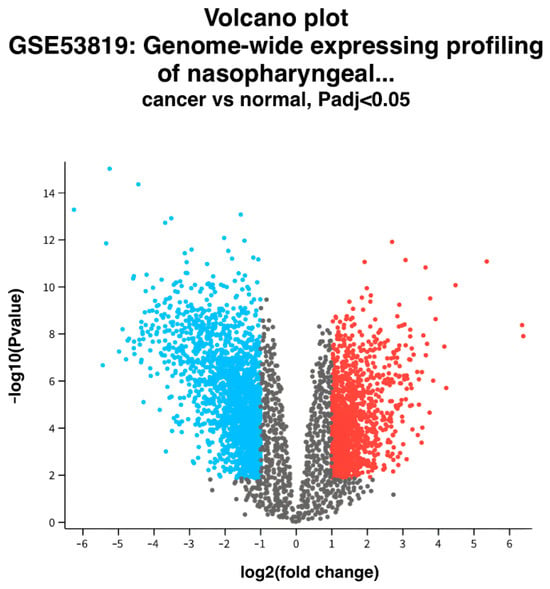
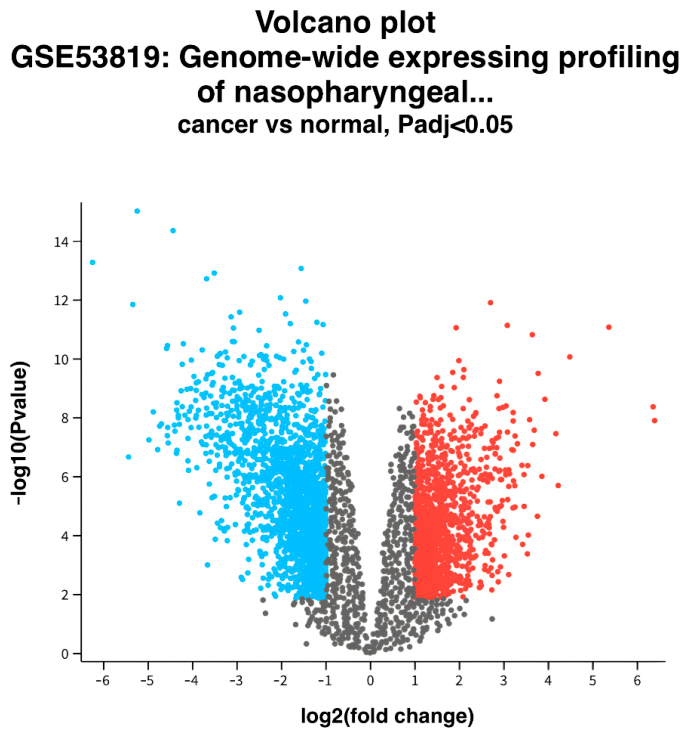
Analysis of the GSE53819 microarray dataset (18 advanced-stage NPC tissues vs. 18 non-cancerous nasopharyngeal tissues) identified a total of 2446 differentially expressed genes (DEGs) meeting the predefined thresholds (|log2FC| ≥ 1; Padj < 0.05), comprising 943 upregulated and 1503 downregulated genes. The distribution of DEGs is visualized in the volcano plot (Figure 1).
Figure 1.
Volcano plot of all DEGs from datasets GSE53819. Red dots visualized upregulated DEGs (log2FC > 1) and blue dots visualized downregulated DEGs (log2FC < −1). All the colored dots were statically significant (pAdj < 0.05).
3.3. PPI Network and Functional Enrichment Analysis
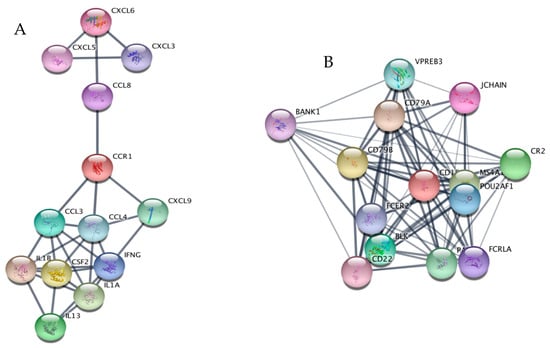
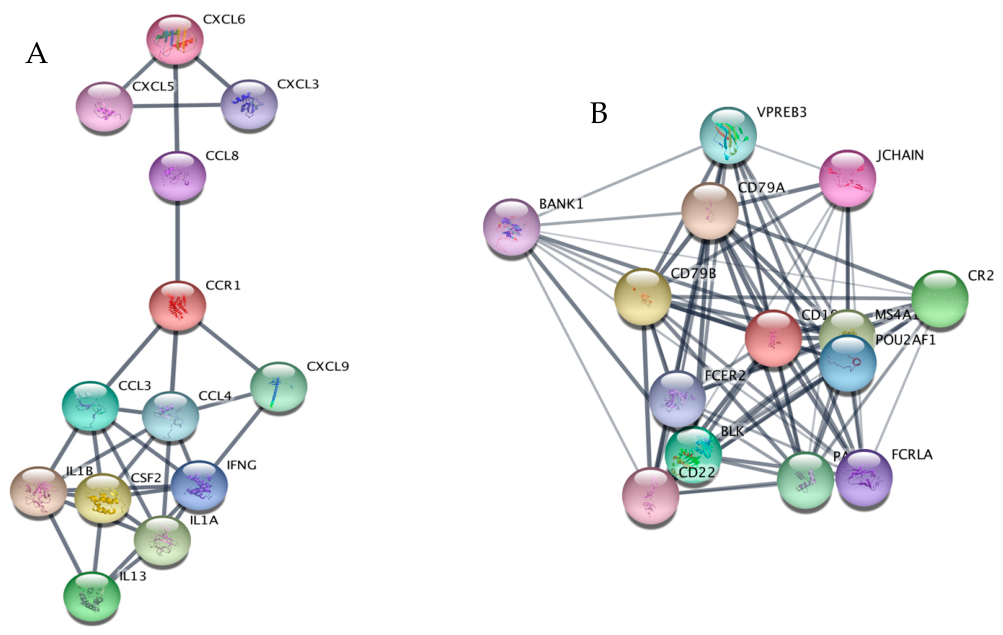
PPI network construction and hub gene identification using the MCC algorithm revealed two distinct interaction clusters: an upregulated network dominated by chemokine and cytokine-associated proteins (CXCL3, CXCL5, CXCL6, CXCL9, CCL3, CCL4, CCL8, CCR1, CSF2, IFNG, IL1A, IL1B, IL13), and a downregulated network enriched in B-cell signalling components (CD19, CD22, CD79A, CD79B, BLK, BANK1, FCRLA, JCHAIN, CR2, MS4A1, VPREB3, FCER2, POU2AF1) (Figure 2).
Figure 2.
PPI network of advanced-stage nasopharyngeal cancer (visualized in Cytoscape software version 3.8.2): (A). Upregulated DEGs and (B). Downregulated DEGs.
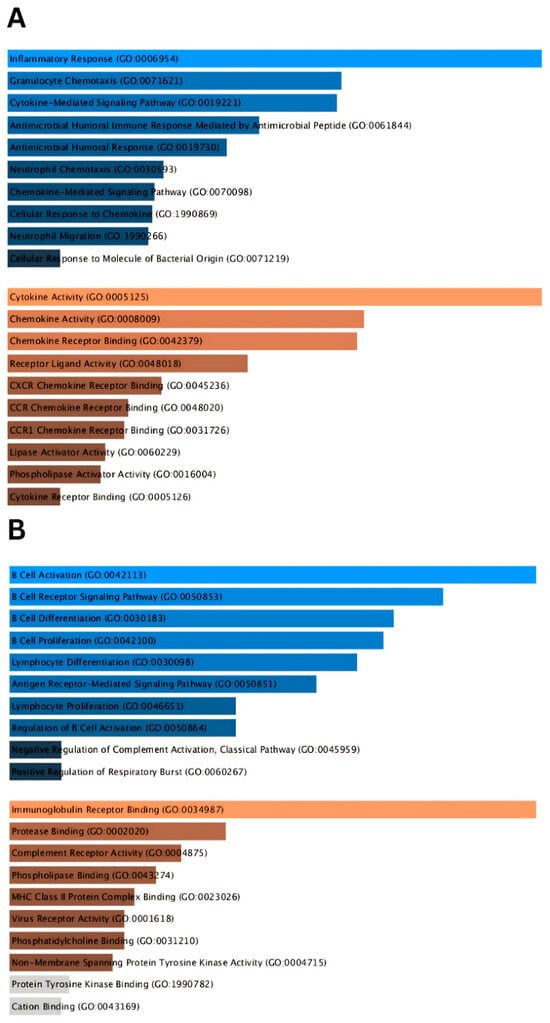
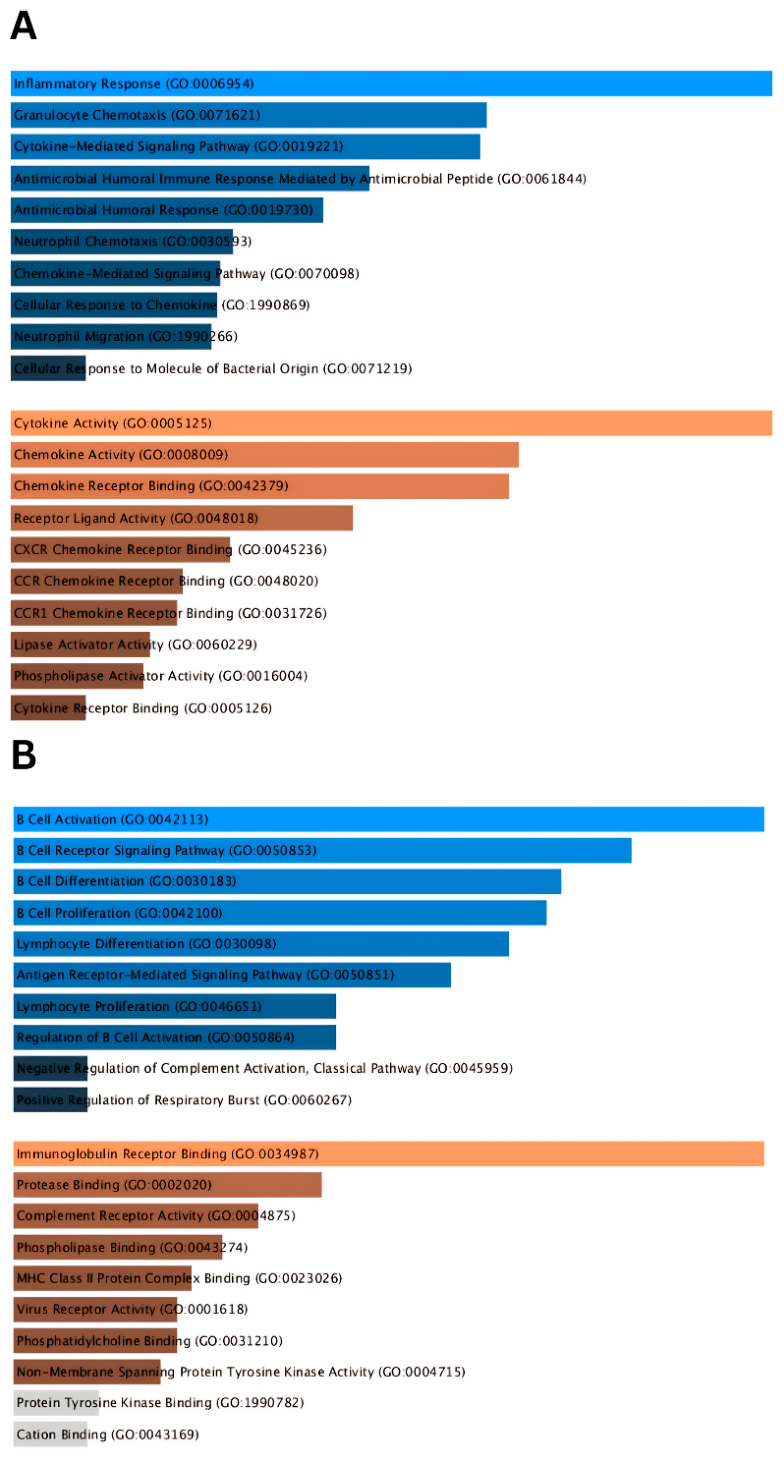
GO enrichment analysis confirmed that upregulated DEGs were predominantly enriched in inflammatory response (Biological Process, BP) and cytokine activity (Molecular Function, MF), while downregulated DEGs were most significantly enriched in B-cell activation (BP) and immunoglobulin receptor binding (MF) (Figure 3).
Figure 3.
Gene ontology of advanced-stage nasopharyngeal cancer (visualized using Enrichr): (A). Upregulated DEGs and (B). Downregulated DEGs. Blue bar = Biological Process (BP), Brown bar = Molecular Function (MF).
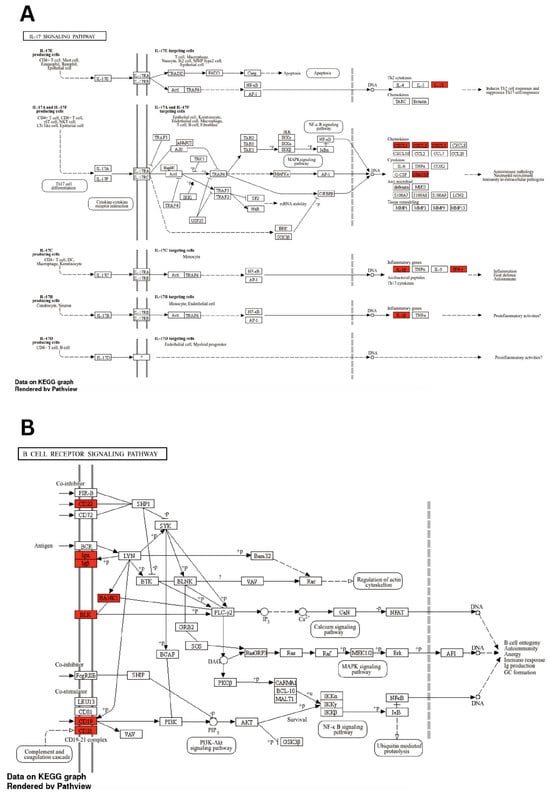
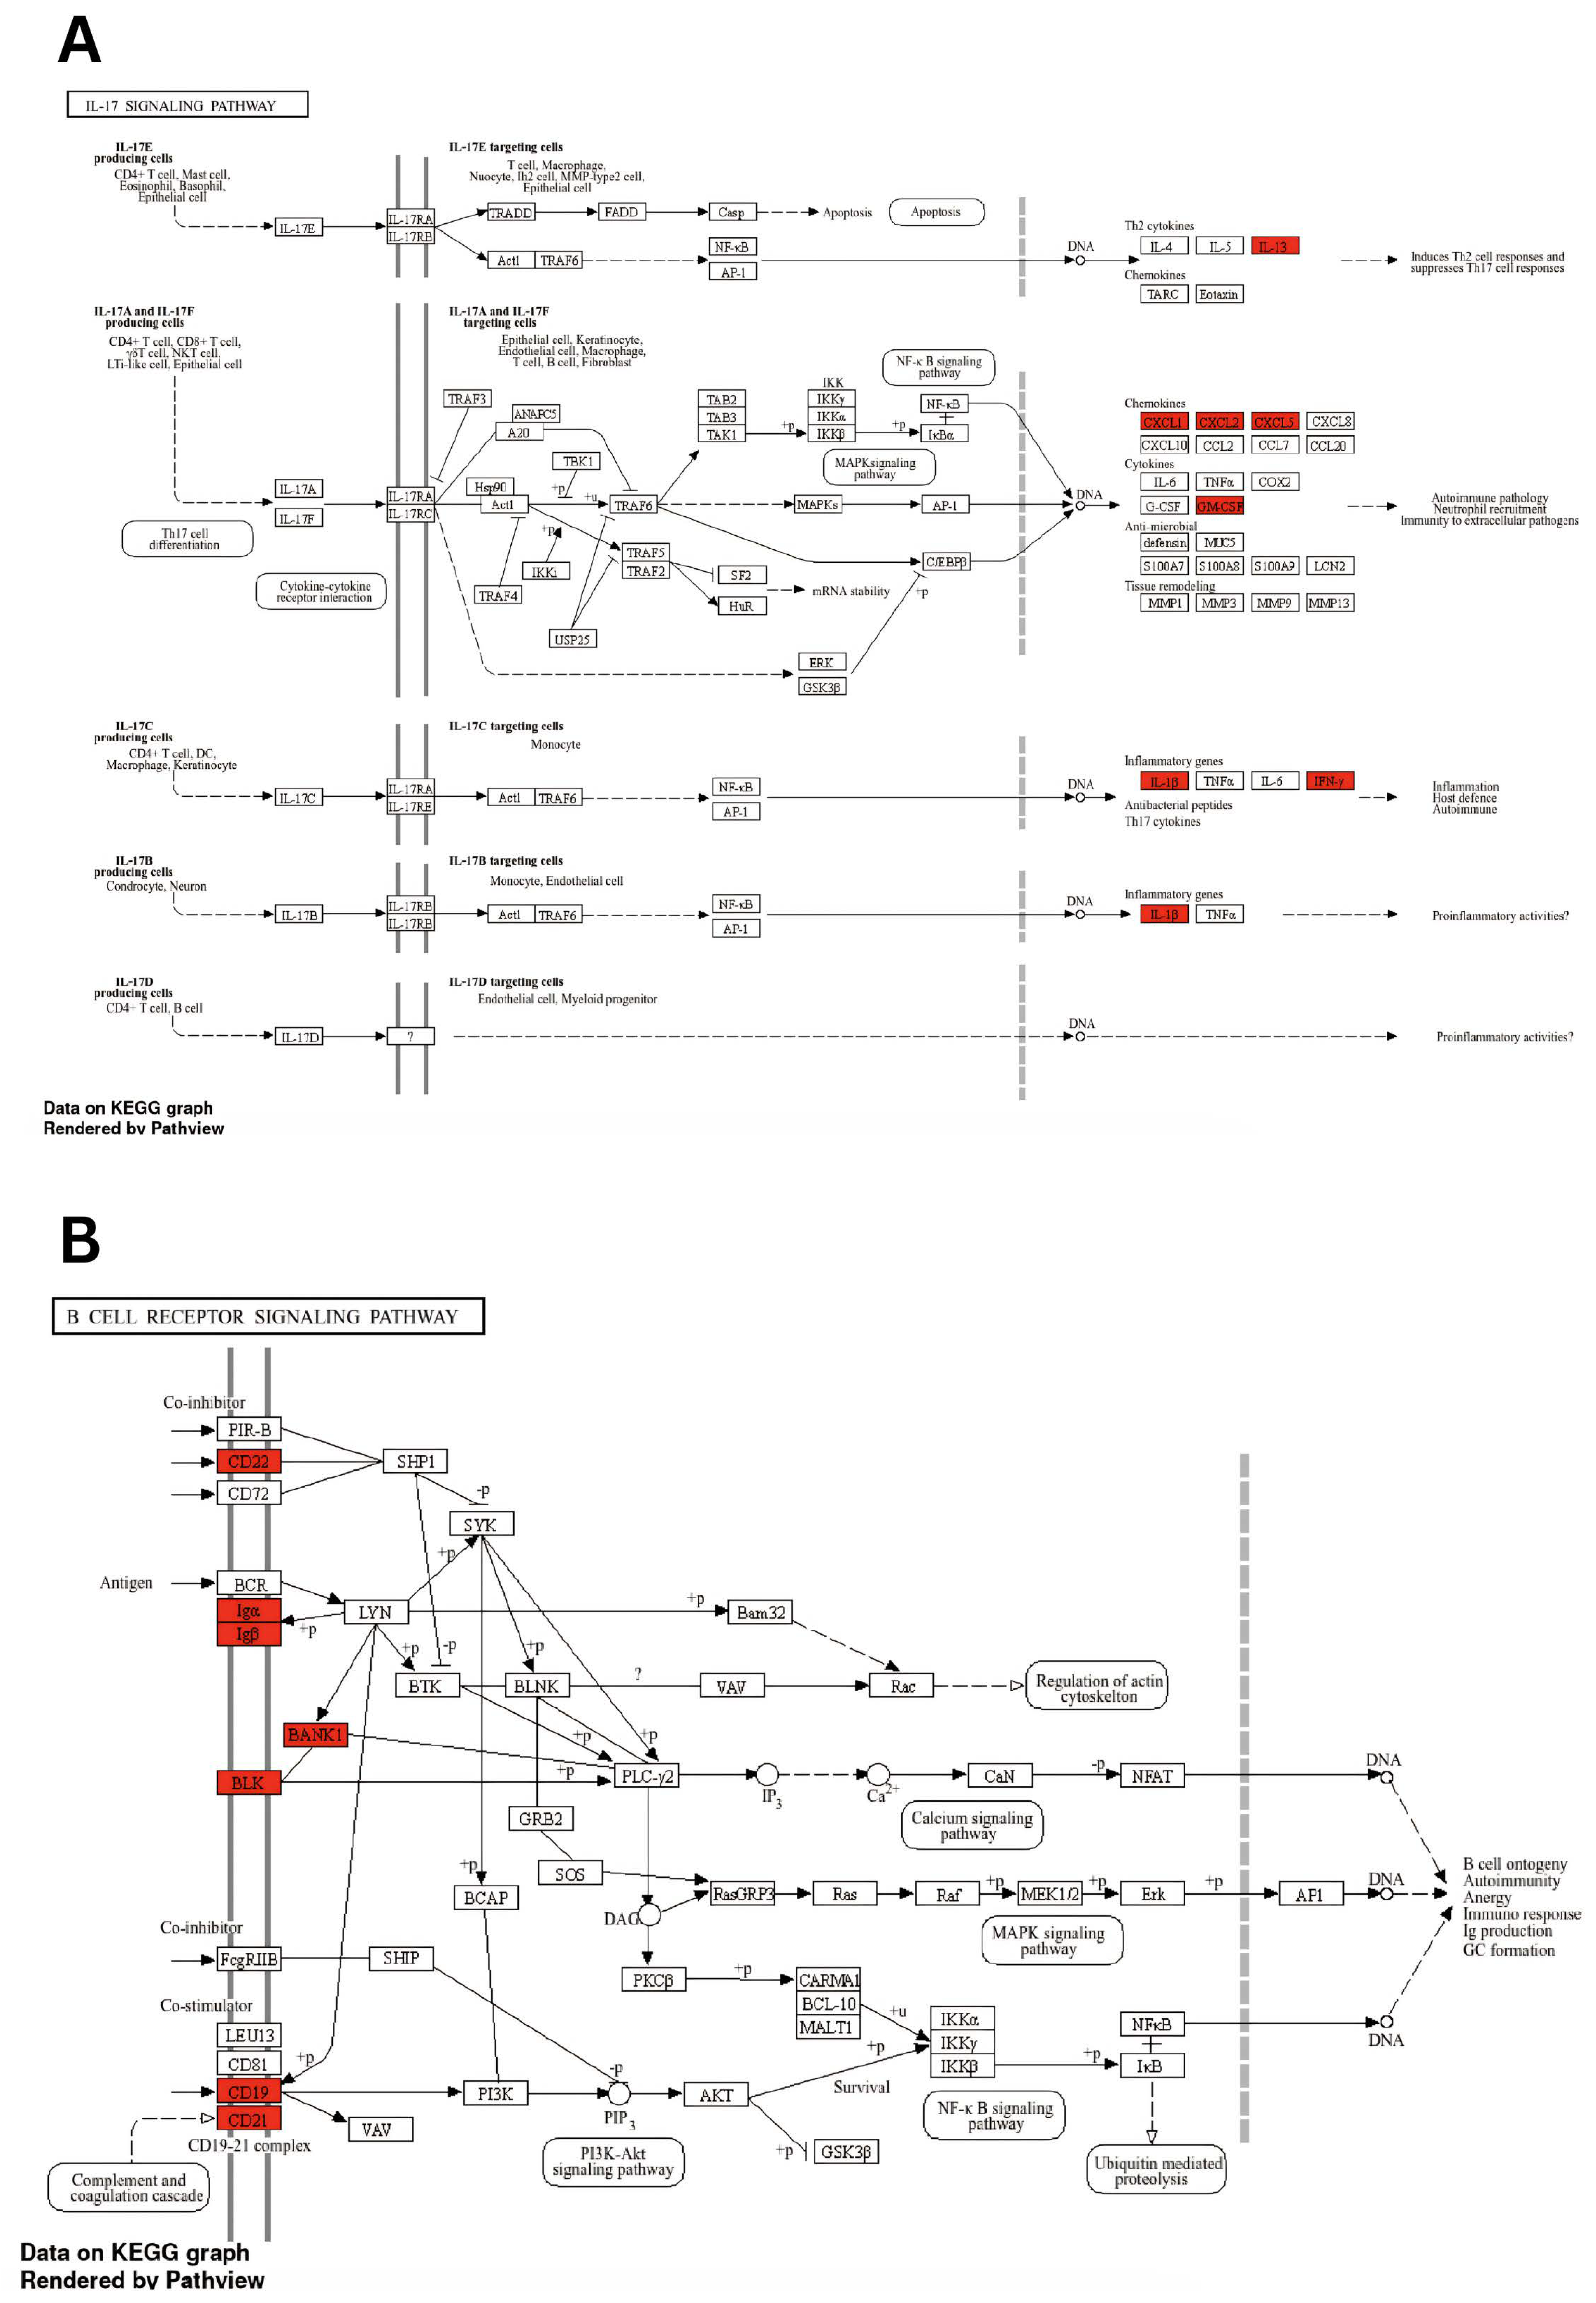
KEGG pathway analysis demonstrated that the most enriched pathway for upregulated DEGs was IL-17 signalling, while downregulated DEGs were primarily associated with the B-cell receptor (BCR) signalling pathway (Figure 4). These findings indicate that advanced-stage NPC is characterised by a paradoxical immune state which encompasses heightened pro-inflammatory cytokine activity alongside profound suppression of B-cell-mediated adaptive immunity.
Figure 4.
KEGG pathway of advanced-stage nasopharyngeal cancer (visualized using ShinyGO v.0.82). Solid arrows indicate direct molecular interactions (e.g., activation or binding), dashed arrows indicate indirect relations occurring through unlisted intermediate steps. Lines terminating in an open circle denote an expression relation, indicating downstream transcriptional activation of the listed genes. Red-shaded boxes represent genes identified as significantly upregulated/downregulated DEGs mapped onto the reference pathway; unshaded boxes represent canonical pathway components not identified as significantly altered in this dataset. (A). Upregulated DEGs and (B). Downregulated DEGs.
3.4. Identification of Candidate Blood-Based Biomarkers
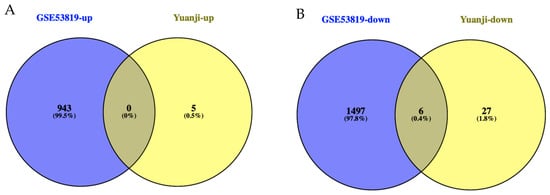
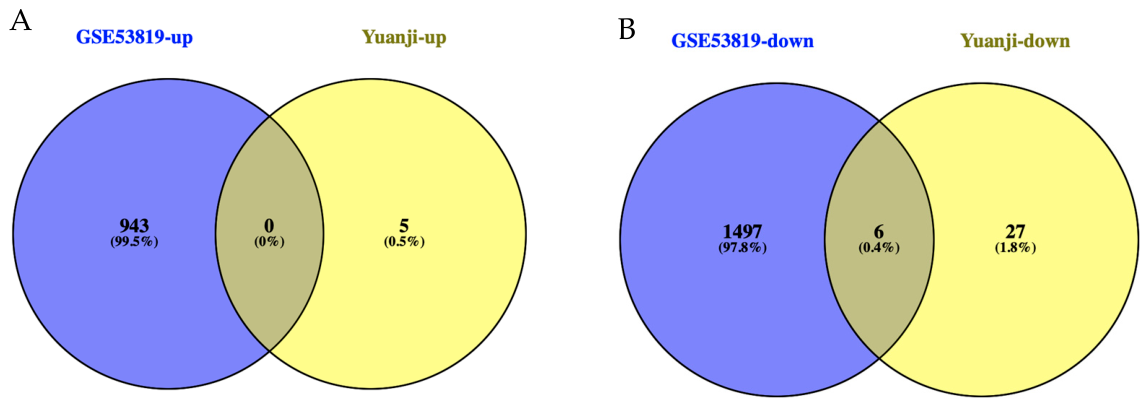
Cross-referencing of GSE53819 downregulated DEGs with the blood-based NPC transcriptomic dataset of Yuanji Xu et al. [24] identified six concordantly downregulated genes across both the tissue and peripheral blood compartments: ADRA2A, SELP, TSPAN32, PEAR1, P2RX1, and DGKG (Figure 5). No upregulated genes were concordantly identified in both compartments. These six genes represent candidates whose expression in peripheral blood mirrors the tissue-level downregulation observed in advanced-stage NPC, making them conceptually accessible as minimally invasive circulating biomarkers.
Figure 5.
Venn diagram of DEGs found in GSE53819 datasets (tissue samples from NPC biopsy; blue) and Yuanji Xu et al. datasets (blood samples from NPC patients; yellow) [24]: (A). Upregulated DEGs and (B). Downregulated DEGs.
3.5. Survival Analysis
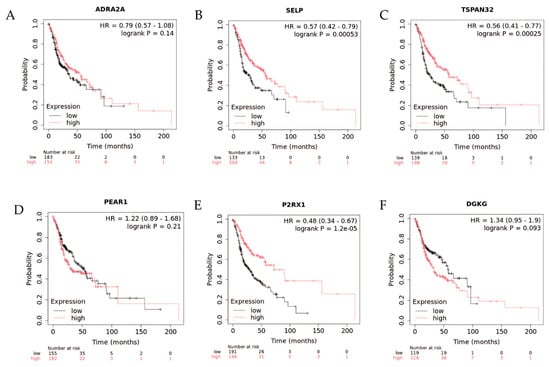
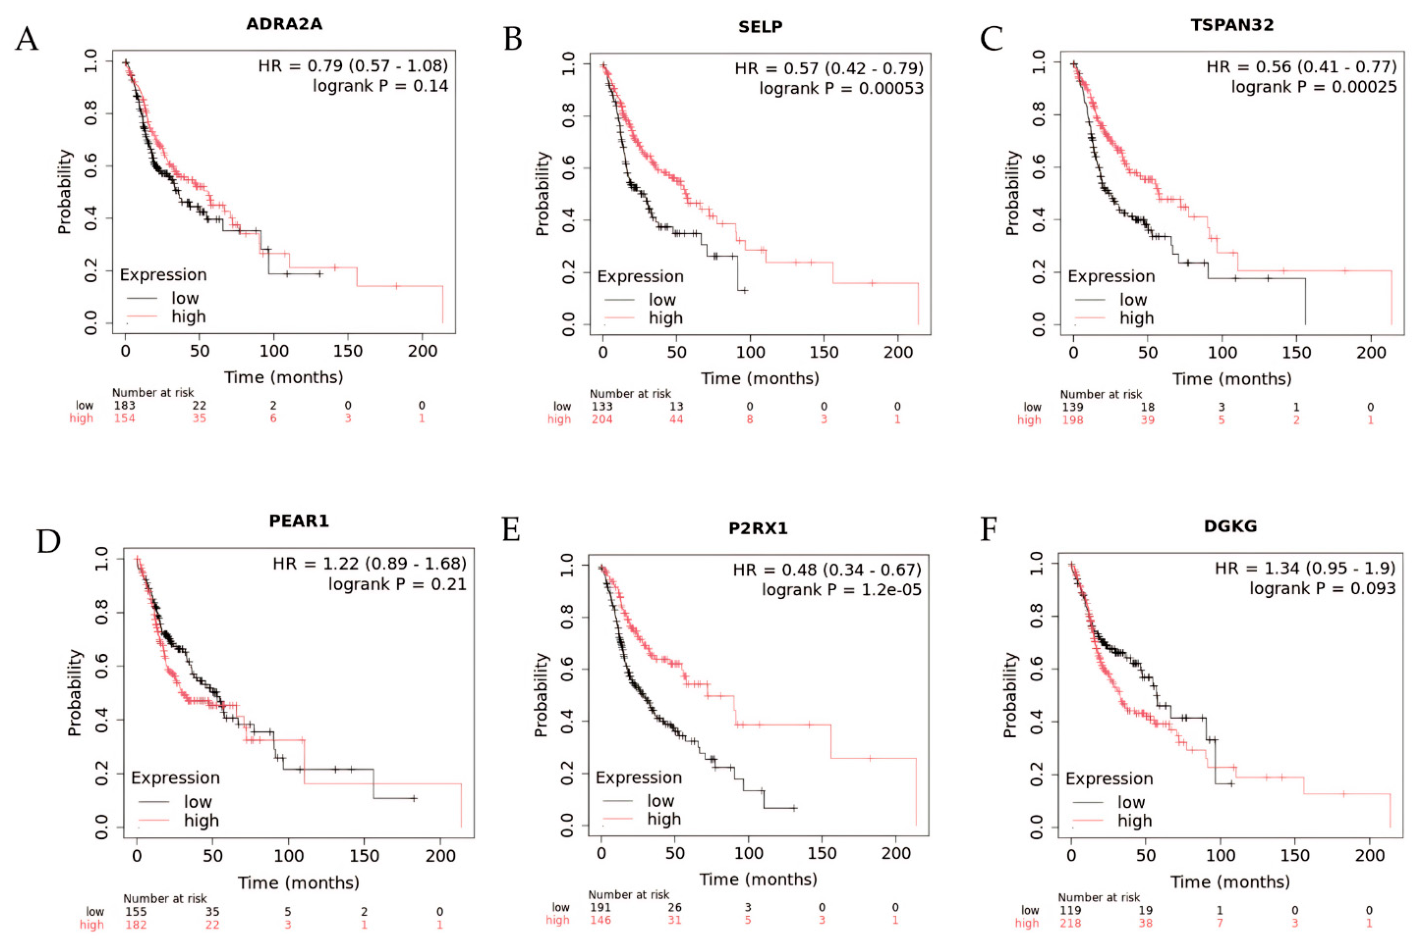
Kaplan–Meier survival analysis of the six overlapping candidate DEGs revealed that lower expression of three genes was significantly associated with shorter overall survival in head and neck carcinoma: SELP (HR = 0.57, 95% CI 0.42–0.79; log-rank p = 0.00053), TSPAN32 (HR = 0.56, 95% CI 0.41–0.77; log-rank p = 0.00025), and P2RX1 (HR = 0.48, 95% CI 0.34–0.67; log-rank p = 1.2 × 10⁻⁵). ADRA2A (HR = 0.79, p = 0.14), PEAR1 (HR = 1.22, p = 0.21), and DGKG (HR = 1.34, p = 0.093) did not reach statistical significance (Figure 6). The hazard ratios below 1.0 for SELP, TSPAN32, and P2RX1 indicate that patients with lower expression of these genes had shorter overall survival, affirming the prognostic relevance of their downregulation in advanced-stage disease.
Figure 6.
Kaplan–Meier plot of 6 overlapped DEGs of advanced-stage NPC: (A). ADRA2A gene, (B). SELP gene, (C). TSPAN32 gene, (D). PEAR1 gene, (E). P2RX1 gene, and (F). DGKG gene.
TSPAN32 was prioritized as the primary candidate for RT-qPCR examination based on: (i) a statistically significant and consistent survival association among the three significant candidates, with an effect size (HR = 0.56) comparable to SELP and P2RX1; (ii) its established functional role in B-cell activation and immune regulation, mechanistically coherent with the B-cell pathway suppression identified in the enrichment analyses; and (iii) prior published evidence of TSPAN32 downregulation in peripheral immune cell populations in inflammatory and immune-dysregulation [40].
3.6. TSPAN32 Primer Design
Primers for RT-qPCR quantification of TSPAN32 were designed and quality-validated as described in the Methods. The primer sequences, product size, and thermodynamic parameters are presented in Table 2. No hairpin or primer-dimer formation was predicted, confirming primer suitability for downstream RT-qPCR assays.
Table 2.
Designed primers of TSPAN32 gene.
3.7. TSPAN32 Expression in Peripheral Blood Following Chemoradiation
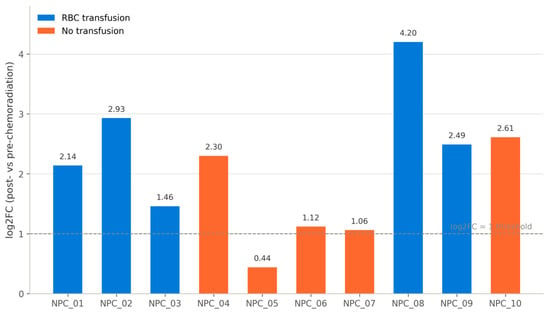
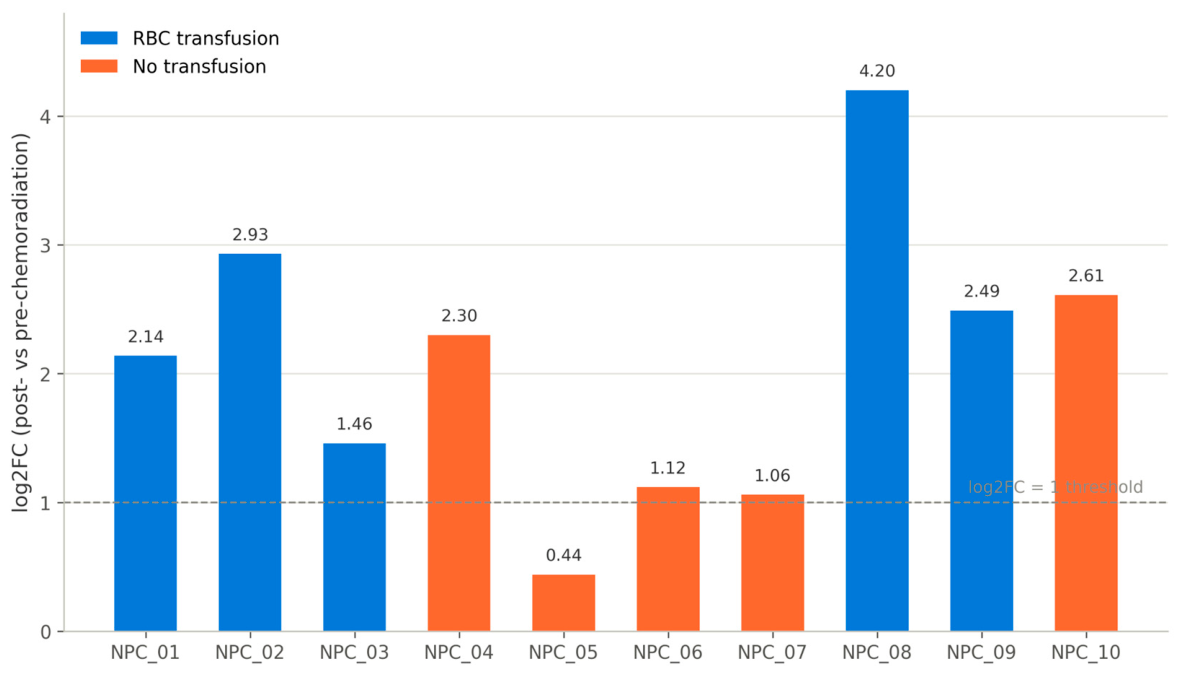
Across the ten paired peripheral blood samples, TSPAN32 transcript abundance increased following chemoradiation relative to each patient’s own pre-treatment baseline (mean Log2FC = 2.08 ± SD 1.09; 95% CI: 1.29 to 2.86) (Figure 7). Nine of ten patients (90%) showed a fold-change consistent with upregulation (Log2FC > 1); one patient (Patient 5, Log2FC = 0.44) did not meet this threshold (Table 3). This increase was statistically significant by one-sample t-test (t(9) = 6.01, p = 0.0002) and confirmed by Wilcoxon signed-rank test (p = 0.002). The melt-curve analysis for each patient was presented in Figure S1.
Figure 7.
The TSPAN32 expression changes in peripheral blood following chemoradiation among patients (n = 10).
Table 3.
TSPAN32 relative expression for per-patient Log2FC (post- vs. pre-chemoradiation).
3.8. Effect of RBC Transfusion on TSPAN32 Expression Change
As a secondary analysis, the effect of RBC transfusion on the magnitude of TSPAN32 expression change was assessed within the 10 patients clinical cohort (Table 4). The mean post-treatment log2FC was numerically higher in the transfusion group (n = 5; mean 2.64 ± 1.02) than in the non-transfusion group (n = 5; mean 1.51 ± 0.91), but this difference did not reach statistical significance (independent-samples t-test, t = 1.86, p = 0.101). Post-treatment relative expression likewise did not differ significantly between groups (Mann–Whitney U test, exact, U = 20.0, p = 0.151). These findings suggest that RBC transfusion during chemoradiation did not significantly modulate the magnitude of TSPAN32 expression change in this cohort, indicating that the observed post-chemoradiation upregulation of TSPAN32 is attributable primarily to treatment effects rather than transfusion-associated immune modulation.
Table 4.
Comparison of Pre-Treatment, Post-Treatment, and Delta Values among groups.
4. Discussion
Effective and suitable biomarkers for the early detection, diagnosis, and prognosis of NPC remain notably few [24,41]. The identification of reliable molecular biomarkers that are detectable in both tissue and peripheral blood remains an important and critical unmet need in NPC clinical management. While the advancement of high-throughput techniques, especially large-scale whole-genome sequencing and RNA sequencing, and the molecular signatures of NPC, including genomic alterations, susceptibility genes, gene expression patterns (both in host and EBV), host–virus interactions, and transcriptional features, have already been unveiled [42], proteins and transcripts that are concordantly dysregulated across both tissue and liquid biopsy compartments offer particular translational value as minimally invasive progression markers. Therefore, this study presents an integrative approach to circulating biomarker discovery in advanced-stage NPC, combining in silico transcriptomic analysis of a publicly available tissue dataset with cross-referencing against a blood-based NPC transcriptomic dataset and prospective RT-qPCR examination in peripheral blood.
Of the total patients diagnosed with NPC and undergoing chemoradiation at the hematology oncology outpatient clinic at Cipto Mangunkusumo Hospital, 10 NPC patients, consisting of 6 men (60%) and 4 women (40%), with an average age of 52.1 ± 9.6 years, ranging from 36 to 70 years. The observed male predominance is consistent with the well-established epidemiological pattern of NPC globally and in the Southeast Asian region. Several prior Indonesian studies have reported analogous sex distributions [1,43,44] and a large international surveillance encompassing 20 regions worldwide has documented that men experience approximately a three-fold higher incidence of NPC compared to women (2.2 vs. 0.8 cases per 100,000 person-years) [45]. The biological mechanisms underlying this disparity likely involve differences in EBV seroprevalence, hormonal modulation of immune responses, and occupational or lifestyle exposures that disproportionately affect men [46,47].
Differential gene expression analysis of the tissue-derived DEGs from GSE53819 successfully identified several upregulated as well as downregulated genes. The analysis of the GSE53819 dataset yielded 943 upregulated and 1503 downregulated DEGs under the same threshold criteria. Hierarchical clustering analysis consistently demonstrated that advanced-stage NPC was characterised by substantially greater transcriptomic deviation from the healthy baseline than early-stage disease, indicating that progressive molecular dysregulation accompanies tumour advancement. Functional enrichment via the GO and KEGG databases highlighted that upregulated DEGs were predominantly enriched in inflammatory response pathways (Biological Process, BP) and cytokine activity (Molecular Function, MF), with the interleukin (IL)-17 signalling pathway emerging as the most enriched KEGG pathway. This finding is consistent with other studies showing that bioinformatic studies on NPC utilizing the GEO dataset found IL-17 as one of the signaling pathways enriched in KEGG [48,49,50]. IL-17 is a pro-inflammatory cytokine produced by T helper cells (Th17) and has several subsets, namely IL-17A-F [29,51]. IL-17 has several roles in both acute and chronic host defense responses [31,52].
In a pathological context, IL-17 is a primary cytokine and therapeutic target in a number of infectious, autoimmune, inflammatory diseases, and cancers [51,52,53]. IL-17 signaling can activate the downstream NF-kB p76 pathway, a key mediator of NF-kB signaling, which triggers the production of inflammatory factors such as IL-1β, IL-6, and TNFα, thereby promoting inflammation [53]. In NPC, immune microenvironment studies have focused on T cells, which are known to undergo changes in response to EBV infection. IL-17 has been reported to promote the accumulation of polymorphonuclear myeloid-derived suppressor cells (PMN-MDSCs), while neutrophil-derived IL-17 also suppresses CD8+ T cell responses, both contributing to immunosuppression [54]. In addition, the cytokine IL-17, especially IL-17A, is known to play an important role in promoting NPC cell migration and invasion through the p38 mitogen-activated protein kinase/NF-κB signaling pathway, which subsequently upregulates the expression of metallopeptidase (MMP) 2 and MMP9 and increases epithelial–mesenchymal transition (EMT) [51,55]. Downregulated DEGs were most significantly enriched in B-cell activation (BP) and immunoglobulin receptor binding (MF), with the B-cell receptor signalling pathway as the corresponding KEGG pathway. This aligns with previous study findings demonstrating that B cell depletion is a hallmark feature of microenvironmental conditions exhibited in NPC progression [56]. This is clinically relevant given that high B cell infiltration, particularly naïve B cells, is associated with a better prognosis in NPC [57]. Therefore, the downregulation of B cell-related DEGs we identified in advanced stages may reflect the loss of this protective B cell population, which in turn contributes to immune evasion and tumor progression.
Cross-validation the GSE53819 tissue-based DEGs with the blood-based DEGs identified by Yuanji Xu et al. [24] revealed six concordantly downregulated genes across both compartments: ADRA2A, SELP, TSPAN32, PEAR1, P2RX1, and DGKG. The Kaplan–Meier survival analysis provides important prognostic context for these six candidate DEGs. The significant association between lower TSPAN32 expression and shorter overall survival (HR = 0.56; p = 0.00025) establishes prognostic relevance beyond the transcriptomic signature alone, and supports the hypothesis that TSPAN32 downregulation is not merely an epiphenomenon of tumour transcriptomics but reflects a biologically meaningful alteration in the immune microenvironment with consequences for disease outcome. The similar associations observed for SELP and P2RX1 suggest that the identified six-DEG cluster may represent a network of functionally related immune regulatory genes that are collectively dysregulated as NPC progresses, and whose combined suppression is associated with adverse clinical outcomes. However, this analysis is based on a general head and neck carcinoma dataset, not an NPC-specific dataset, so interpretation of the prognosis from TSPAN32 should be done with caution.
Based on the cross-validation results, TSPAN32 was prioritised as the candidate biomarker of most clinical interest [40,58]. TSPAN32 (also known as TSSC6) is a tetraspanin-family member encoded within the imprinted tumor-suppressor gene domain on chromosome 11p15.5, where it plays a role in the formation of membrane microdomains regulating cell migration, adhesion, signal transduction, and immune responses. It is preferentially expressed in lymphoid-lineage cells, including CD8+ T cells and natural killer cells, and its expression is downregulated upon T-cell activation, consistent with a negative regulatory role in lymphocyte proliferation and immune activation; TSPAN32-knockout models show normal hematopoiesis and B-cell responses but hyperproliferative T cells, further supporting an immunoregulatory function [59,60]. Beyond this immunological role, a study evaluating TSPAN32 as a biomarker associated with radiotherapy and immune microenvironment remodeling in lung adenocarcinoma showed that TSPAN32 was significantly downregulated, with low expression associated with more advanced stages and poor prognosis, suggesting its tumor-suppressive role. Overexpression of TSPAN32 inhibited migration, growth, clonogenic survival, and increased radiosensitivity in A549 and H1299 cells. Furthermore, TSPAN32 expression was also associated with immune/stromal scores and the abundance of T cells, B cells, and immune checkpoints. Notably, TSPAN32 overexpression promoted infiltration of CD8+ T cells, memory B cells, and dendritic cells [61]. This suggests a possible mechanistic link between TSPAN32 expression, radiotherapy response, and anti-tumor immune activity that may be relevant to the chemoradiation-associated expression change observed in the present study. However, to our knowledge, no prior study has examined TSPAN32 expression, prognostic value, or functional role specifically in NPC tissue or peripheral blood. The present findings therefore represent the first report identifying TSPAN32 as a candidate marker in this malignancy, and its mechanistic role in NPC pathogenesis remains to be functionally established.
RT-qPCR examination using primers designed for the TSPAN32 gene demonstrated a predominant trend of increased expression of TSPAN32 after treatment, with 9 out of 10 patients (90%) showing a log2 fold change (log2FC) greater than 1, indicating clearly elevated expression levels following therapy. One patient (10%) showed a mild positive change (log2FC between 0 and 1), and no patient exhibited a negative log2FC. This finding shows that TSPAN32 upregulation following treatment was consistent across nearly the entire cohort, with only minor variation in magnitude. This likely elucidates the function of TSPAN32, an integral part of a tumor-suppressing gene, wherein enhanced expression of this gene implies improved immune system activity following treatment [59,61]. Additionally, the RBC transfusion history did not significantly affect the magnitude of TSPAN32 expression change, with a numerically higher mean post-treatment log2FC in the transfusion group (2.64 ± 1.02) compared to the non-transfusion group (1.51 ± 0.91), but this difference did not reach statistical significance (independent-samples t-test, t = 1.86, p = 0.101). This suggests that the observed post-treatment upregulation pattern is attributable primarily to treatment effects rather than transfusion-associated immune modulation or iron loading from RBC transfusion. This finding has practical implications for future biomarker studies which explains if TSPAN32 expression monitoring is to be incorporated into clinical evaluation of NPC patients, the concurrent administration of RBC transfusion does not appear to substantially confound the interpretation of TSPAN32 expression dynamics, at least at the transfusion volumes and time observed in this study.
The integrative design of this study which combines tissue-based with blood-based validation through in silico and clinical approaches represents a methodological template that addresses a recognized gap in NPC biomarker research. However, several important limitations of this study must be acknowledged. First, the transcriptomic discovery phase relied on a single, relatively small, publicly available microarray dataset (GSE53819; n = 18 per group), chosen specifically for its advanced-stage-matched case composition; other available NPC datasets (e.g., GSE12452, GSE118613) include different stage distributions. Although downstream PPI and survival analyzes confirmed the DEGs, it was not tested against an independent as well as stage-specific NPC transcriptomic cohort. The potential genes identified here, including TSPAN32, should be considered proposed rather than confirmed, and future research combining additional stage-specific datasets, as they become available, are required to establish the robustness of this pattern. Second, the tissue-blood overlap examination compared two datasets characterized by different platforms and tissue compartments (tumor tissue versus peripheral blood), thereby diminishing the sensitivity of cross-identification; the blood-based reference dataset was exclusively derived from platelet RNA sequencing, while the RT-qPCR analysis in this study utilized RNA extracted from the buffy coat (leukocyte-enriched) fraction, representing biologically distinct circulating compartments. Third, the RT-qPCR analysis showed a significant treatment-associated increase in TSPAN32 expression. However, this design cannot exclude the possibility that this increase partly reflects non-specific elevation of circulating transcripts due to chemoradiation-induced tissue necrosis and cell debris release, rather than a TSPAN32-specific biological response, since no unrelated control transcript panel or non-destructive comparative condition were included. Fourth, matched tumor tissue was not sampled following chemoradiation in this cohort, as post-treatment biopsy is not part of routine clinical management for advanced-stage NPC treated with definitive chemoradiation; consequently, this study cannot determine whether the observed peripheral blood expression change corresponds to a change at the tumor level, nor establish the tissue of origin of the circulating signal. Fifth, this study did not include a healthy control comparator group in the RT-qPCR examination phase, so the data demonstrate a within-patient, treatment-associated change but do not establish how TSPAN32 expression in NPC patients compared to a healthy reference range. Future studies should validate candidate gene expression, including TSPAN32, through prospective peripheral blood sampling in matched pre- and post-treatment samples, ideally alongside matched tumor tissue, healthy control comparators, and a panel of unrelated control transcripts, to establish whether these candidates reflect a specific, clinically meaningful signal rather than generalised cell turnover.
5. Conclusions
This present bioinformatic discovery approach identified six genes that were downregulated in both NPC tissue and peripheral blood, with TSPAN32 having the strongest predictive correlation with overall survival. These findings provide preliminary evidence that TSPAN32 is a potential circulating biomarker in advanced-stage NPC, necessitating additional research in larger, longitudinal cohorts to demonstrate its therapeutic utility for treatment response monitoring and prognostic evaluation.
Supplementary Materials
The following supporting information can be downloaded at: https://www.mdpi.com/article/10.3390/cimb48101003/s1.
Author Contributions
Conceptualization, N.A.M. and R.I.P.; methodology, N.A.M.; software, R.I.P.; validation, S.I.W., A.W.S. and M.A.Y.; formal analysis, N.A.M.; investigation, N.A.M.; resources, R.I.P.; data curation, S.I.W.; writing—original draft preparation, N.A.M.; writing—review and editing, A.W.S.; visualization, R.I.P.; supervision, M.A.Y.; project administration, A.W.S.; funding acquisition, N.A.M. All authors have read and agreed to the published version of the manuscript.
Funding
This research received no external funding.
Institutional Review Board Statement
This study was conducted in accordance with the Declaration of Helsinki and was approved at 7 February 2024 by the Ethics Committee of the Faculty of Medicine, Universitas Indonesia [approval number: KET-219/UN2.F1/ETIK/PPM.00.02/2024].
Informed Consent Statement
Informed consent was obtained from all subjects involved in the study.
Data Availability Statement
The original contributions presented in this study are included in the article/Supplementary Material. Further inquiries can be directed to the corresponding author.
Conflicts of Interest
The authors declare no conflicts of interest.
Abbreviations
The following abbreviations are used in this manuscript:
| ASIR | Age-Standardized Incidence Rate |
| BCR | B-cell Receptor |
| BP | B-cell Activation Pathway |
| cDNA | Complementary DNA |
| DEG | Differentially Expressed Gene |
| DEM | Differentially Expressed miRNA |
| EBV | Epstein–Barr Virus |
| ENT | Ear, Nose, and Throat |
| EMT | Epithelial–Mesenchymal Transition |
| GEO | Gene Expression Omnibus |
| GLOBACAN | Global Cancer Observatory |
| IMRT | Intensity-Modulated Radiotherapy |
| log2FC | log2 fold change |
| MF | Molecular Function |
| MMP | Metallopeptidase |
| NCBI | National Center for Biotechnology Information |
| NPC | Nasopharyngeal Cancer |
| OS | Overall Survival |
| PMN-MDSCs | Polymorphonuclear Myeloid-Derived Suppressor Cells |
| PPI | Protein–Protein Interaction |
| RBC | Red Blood Cell |
| Th17 | T Helper Cell |
| TSPAN32 | Tetraspanin 32 |
References
- Nafisa, I.M.; Utama, M.S.; Sunardi, M.A.; Adibrata, A.A. Profile of nasopharyngeal cancer patients who underwent radiotherapy in Dr. Hasan Sadikin General Hospital Bandung. Indones. J. Cancer 2022, 16, 88–93. [Google Scholar] [CrossRef] [Scilit]
- Salehiniya, H.; Mohammadian, M.; Mohammadian-Hafshejani, A.; Mahdavifar, N. Nasopharyngeal cancer in the world: Epidemiology, incidence, mortality and risk factors. WCRJ 2018, 5, e1046. Available online: https://www.wcrj.net/article/1046 (accessed on 31 July 2026). [CrossRef] [Scilit]
- Sinha, S.; Winters, R.; Gajra, A. Nasopharyngeal cancer. In StatPearls; StatPearls Publishing: Treasure Island, FL, USA, 2026. Available online: http://www.ncbi.nlm.nih.gov/books/NBK459256/ (accessed on 31 July 2026). [PubMed]
- Liu, P.; Xue, X.M.; Zhang, C.; Zhou, H.W.; Ding, Z.W.; Jiang, Y.K.; Wang, L.; Shen, W.D.; Yang, S.M.; Wang, F.Y. Prognostic factor analysis in patients with early-stage nasopharyngeal carcinoma in the USA. Future Oncol. 2023, 19, 1063–1072. [Google Scholar] [CrossRef] [Scilit] [PubMed]
- Global Cancer Observatory: Cancer Today. Available online: https://gco.iarc.who.int/today (accessed on 31 July 2026).
- Chan, S.M.; Paterson, I.C.; Yap, L.F. Nasopharyngeal carcinoma in Southeast Asia: Current landscape and future priorities. Br. J. Biomed. Sci. 2025, 82, 15902. [Google Scholar] [CrossRef] [Scilit] [PubMed]
- Romdhoni, C.A.; Alkaff, F.F.; Kahdina, M.; Masturina, M.; Ramadhani, R.; Sovia, S. Clinical presentation of nasopharyngeal carcinoma in East Java, Indonesia. Pak. J. Med. Health Sci. 2024, 14, 942–946. [Google Scholar]
- Wildeman, M.A.; Fles, R.; Herdini, C.; Indrasari, R.S.; Vincent, A.D.; Tjokronagoro, M.; Stoker, S.; Kurnianda, J.; Karakullukcu, B.; Taroeno-Hariadi, K.W.; et al. Primary treatment results of Nasopharyngeal Carcinoma (NPC) in Yogyakarta, Indonesia. PLoS ONE 2013, 8, e63706. [Google Scholar] [CrossRef] [Scilit] [PubMed]
- Jayalie, V.F.; Paramitha, M.S.; Jessica, J.; Liu, C.A.; Ramadianto, A.S.; Trimartani, T.; Adham, M. Profile of nasopharyngeal carcinoma in Dr. Cipto Mangunkusumo National Hospital, 2010. EJournal Kedokt. Indones. 2016, 4, 62–156. [Google Scholar] [CrossRef] [Scilit]
- Ezra, M.A.; Rafli, R. Navigating delays: A study on diagnostic and treatment intervals in nasopharyngeal carcinoma patients. Indones. J. Cancer 2026, 20, 10–15. [Google Scholar] [CrossRef] [Scilit]
- Jiromaru, R.; Nakagawa, T.; Yasumatsu, R. Advanced nasopharyngeal carcinoma: Current and emerging treatment options. Cancer Manag. Res. 2022, 14, 2681–2689. [Google Scholar] [CrossRef] [Scilit] [PubMed]
- Mulansari, N.A. Serum Ferritin and Transferrin Saturation Changes in Nasopharyngeal Cancer Patients Undergoing Chemoradiation with Red Blood Cell Transfusion and Its Correlation with Oxidative Stress. Master’s Thesis, Universitas Indonesia, Jakarta, Indonesia, 2016. [Google Scholar]
- Lestarini, I.A.; Kadriyan, H.; Sulaksana, M.A.; Firdausy, M.S.A.P.; Harahap, I.L.; Karuniawati, T.P.; Wedayani, N. The trend of hemoglobin levels in nasopharyngeal cancer patients treated with chemotherapy in low human development index region in Indonesia. IOP Conf. Ser. Earth Environ. Sci. 2021, 712, 012015. [Google Scholar] [CrossRef] [Scilit]
- Kneuertz, P.J.; Patel, S.H.; Chu, C.K.; Maithel, S.K.; Sarmiento, J.M.; Delman, K.A.; Staley, C.A.; Kooby, D.A. Effects of perioperative red blood cell transfusion on disease recurrence and survival after pancreaticoduodenectomy for ductal adenocarcinoma. Ann. Surg. Oncol. 2011, 18, 1327–1334. [Google Scholar] [CrossRef] [Scilit] [PubMed]
- Krishnan, M.; Babu, S. Biomarkers in nasopharyngeal carcinoma (NPC): Clinical relevance and prognostic potential. Oral Oncol. Rep. 2024, 11, 100640. [Google Scholar] [CrossRef] [Scilit]
- Aziz, N.; Rahmawati, L.; Cho, J.Y. Identification of diagnostic and prognostic biomarkers in nasopharyngeal carcinoma using integrated transcriptomics and elastic net survival analysis. Open Bioinform. J. 2025, 18, e18750362408821. [Google Scholar] [CrossRef] [Scilit]
- Chan, K.C.A. Plasma Epstein-Barr virus DNA as a biomarker for nasopharyngeal carcinoma. Chin. J. Cancer 2014, 33, 598–603. [Google Scholar] [CrossRef] [Scilit] [PubMed]
- Pan, Y.X.; Huang, Q.; Xing, S.; Zhu, Q.Y. A novel serum protein biomarker for the late-stage diagnosis of nasopharyngeal carcinoma. BMC Cancer 2025, 25, 585. [Google Scholar] [CrossRef] [Scilit] [PubMed]
- Pasiana, A.D.; Rohmah, D.I.; Batmomolin, A.; Purnamasari, I.; Lefta, Y.; Putri, S.P.M.; Yulyani, S.R.; Jannah, S.N.; Maulina, N.T.A.; Kumalasari, D.T.; et al. Biologi Sel Dan Molekuler, 1st ed.; Perkumpulan Pendidikan dan Pelatihan Tenaga Kesehatan Progres Ilmiah Kesehatan: Kendari, Indonesia, 2025; pp. 106–182. [Google Scholar]
- Cho, W.C.-S. Nasopharyngeal carcinoma: Molecular biomarker discovery and progress. Mol. Cancer 2007, 6, 1. [Google Scholar] [CrossRef] [Scilit] [PubMed]
- Clough, E.; Barrett, T.; Wilhite, S.E.; Ledoux, P.; Evangelista, C.; Kim, I.F.; Tomashevsky, M.; A Marshall, K.; Phillippy, K.H.; Sherman, P.M.; et al. NCBI GEO: Archive for gene expression and epigenomics data sets: 23-year update. Nucleic Acids Res. 2023, 52, D138–D144. [Google Scholar] [CrossRef] [Scilit] [PubMed]
- Ko, J.M.Y.; Vardhanabhuti, V.; Ng, W.T.; Lam, K.O.; Ngan, R.K.C.; Kwong, D.L.W.; Lee, V.H.F.; Lui, Y.H.; Yau, C.C.; Kwan, C.K.; et al. Clinical utility of serial analysis of circulating tumour cells for detection of minimal residual disease of metastatic nasopharyngeal carcinoma. Br. J. Cancer 2020, 123, 114–125. [Google Scholar] [CrossRef] [Scilit] [PubMed]
- Hsu, C.L.; Chang, Y.S.; Li, H.P. Molecular diagnosis of nasopharyngeal carcinoma: Past and future. Biomed. J. 2025, 48, 100748. [Google Scholar] [CrossRef] [Scilit] [PubMed]
- Xu, Y.; Chen, L.; Chen, Y.; Ye, W.; Huang, X.; Ke, M.; Ye, G.; Lin, L.; Dong, K.; Lin, Z.; et al. Prediction of potential biomarkers in early-stage nasopharyngeal carcinoma based on platelet RNA sequencing. Mol. Biotechnol. 2023, 65, 1096–1108. [Google Scholar] [CrossRef] [Scilit] [PubMed]
- Shannon, P.; Markiel, A.; Ozier, O.; Baliga, N.S.; Wang, J.T.; Ramage, D.; Amin, N.; Schwikowski, B.; Ideker, T. Cytoscape: A software environment for integrated models of biomolecular interaction networks. Genome Res. 2003, 13, 2498–2504. [Google Scholar] [CrossRef] [Scilit] [PubMed]
- Chen, E.Y.; Tan, C.M.; Kou, Y.; Duan, Q.; Wang, Z.; Meirelles, G.V.; Clark, N.R.; Ma’Ayan, A. Enrichr: Interactive and collaborative HTML5 gene list enrichment analysis tool. BMC Bioinform. 2013, 14, 128. [Google Scholar] [CrossRef] [Scilit] [PubMed]
- Kuleshov, M.V.; Jones, M.R.; Rouillard, A.D.; Fernandez, N.F.; Duan, Q.; Wang, Z.; Koplev, S.; Jenkins, S.L.; Jagodnik, K.M.; Lachmann, A.; et al. Enrichr: A comprehensive gene set enrichment analysis web server 2016 update. Nucleic Acids Res. 2016, 44, W90–W97. [Google Scholar] [CrossRef] [Scilit] [PubMed]
- Xie, Z.; Bailey, A.; Kuleshov, M.V.; Clarke, D.J.B.; Evangelista, J.E.; Jenkins, S.L.; Lachmann, A.; Wojciechowicz, M.L.; Kropiwnicki, E.; Jagodnik, K.M.; et al. Gene set knowledge discovery with Enrichr. Curr. Protoc. 2021, 1, e90. [Google Scholar] [CrossRef] [Scilit] [PubMed]
- Kanehisa, M.; Goto, S. KEGG: Kyoto encyclopedia of genes and genomes. Nucleic Acids Res. 2000, 28, 27–30. [Google Scholar] [CrossRef] [Scilit]
- Kanehisa, M. Toward understanding the origin and evolution of cellular organisms. Protein Sci. Publ. Protein Soc. 2019, 28, 1947–1951. [Google Scholar] [CrossRef] [Scilit] [PubMed]
- Kanehisa, M.; Furumichi, M.; Sato, Y.; Matsuura, Y.; Ishiguro-Watanabe, M. KEGG: Biological systems database as a model of the real world. Nucleic Acids Res. 2025, 53, D672–D677. [Google Scholar] [CrossRef] [Scilit] [PubMed]
- Ge, S.X.; Jung, D.; Yao, R. ShinyGO: A graphical gene-set enrichment tool for animals and plants. Bioinformatics 2020, 36, 2628–2629. [Google Scholar] [CrossRef] [Scilit] [PubMed]
- Li, J.; Han, X.; Wan, Y.; Zhang, S.; Zhao, Y.; Fan, R.; Cui, Q.; Zhou, Y. TAM 2.0: Tool for MicroRNA set analysis. Nucleic Acids Res. 2018, 46, W180–W185. [Google Scholar] [CrossRef] [Scilit] [PubMed]
- Szklarczyk, D.; Kirsch, R.; Koutrouli, M.; Nastou, K.; Mehryary, F.; Hachilif, R.; Gable, A.L.; Fang, T.; Doncheva, N.T.; Pyysalo, S.; et al. The STRING database in 2023: Protein-protein association networks and functional enrichment analyses for any sequenced genome of interest. Nucleic Acids Res. 2023, 51, D638–D646. [Google Scholar] [CrossRef] [Scilit] [PubMed]
- Győrffy, B. Pharmacologically actionable transcriptomic signatures across immune infiltration subtypes in the KM-plotter breast cancer cohort. Adv. Transl. Res. 2026, 1, 193–204. [Google Scholar] [CrossRef] [Scilit]
- Oliver, J.C. Venny. An Interactive Tool for Comparing Lists with Venn’s Diagrams. 2007. Available online: https://bioinfogp.cnb.csic.es/tools/venny/index.html (accessed on 26 May 2025).
- Ye, J.; Coulouris, G.; Zaretskaya, I.; Cutcutache, I.; Rozen, S.; Madden, T.L. Primer-BLAST: A tool to design target-specific primers for polymerase chain reaction. BMC Bioinform. 2012, 13, 134. [Google Scholar] [CrossRef] [Scilit] [PubMed]
- SciTools: Web Tools for Oligo Design & More. Available online: https://www.idtdna.com/page/tools (accessed on 31 July 2026).
- Casper, J.; Speir, M.L.; Raney, B.J.; Perez, G.; Nassar, L.R.; Lee, C.M.; Hinrichs, A.S.; Gonzalez, J.N.; Fischer, C.; Diekhans, M.; et al. The UCSC genome browser database: 2026 update. Nucleic Acids Res. 2026, 54, D1331–D1335. [Google Scholar] [CrossRef] [Scilit] [PubMed]
- Fagone, P.; Mangano, K.; Di Marco, R.; Reyes-Castillo, Z.; Muñoz-Valle, J.F.; Nicoletti, F. Altered expression of TSPAN32 during B cell activation and systemic lupus erythematosus. Genes 2021, 12, 931. [Google Scholar] [CrossRef] [Scilit] [PubMed]
- Hsieh, H.T.; Zhang, X.Y.; Wang, Y.; Cheng, X.Q. Biomarkers for nasopharyngeal carcinoma. Clin. Chim. Acta 2025, 572, 120257. [Google Scholar] [CrossRef] [Scilit] [PubMed]
- Xu, M.; Yao, Y.; Chen, H.; Zhang, S.; Cao, S.M.; Zhang, Z.; Luo, B.; Liu, Z.; Li, Z.; Xiang, T.; et al. Genome sequencing analysis identifies Epstein-Barr virus subtypes associated with high risk of nasopharyngeal carcinoma. Nat. Genet. 2019, 51, 1131–1136. [Google Scholar] [CrossRef] [Scilit] [PubMed]
- Susetiyo, K.A.; Kusumastuti, E.H.; Yusuf, M.; Falerina, R. Clinicopathological profile of nasopharyngeal carcinoma in 2016-2019 at Dr. Soetomo General Hospital. Oto Rhino Laryngol. Indones. 2022, 52, 7–12. [Google Scholar] [CrossRef] [Scilit]
- Adham, M.; Kurniawan, A.N.; Muhtadi, A.I.; Roezin, A.; Hermani, B.; Gondhowiardjo, S.; Tan, I.B.; Middeldorp, J.M. Nasopharyngeal carcinoma in Indonesia: Epidemiology, incidence, signs, and symptoms at presentation. Chin. J. Cancer 2012, 31, 185–196. [Google Scholar] [CrossRef] [Scilit] [PubMed]
- Zhang, Y.; Gu, S.; Deng, H.; Shen, Z. Global epidemiological profile in nasopharyngeal carcinoma: A prediction study. BMJ Open 2024, 14, e091087. [Google Scholar] [CrossRef] [Scilit] [PubMed]
- Guo, X.; Qin, Y.; Feng, Z.; Li, H.; Yang, J.; Su, K.; Mao, R.; Li, J. Investigating the anti-inflammatory effects of icariin: A combined meta-analysis and machine learning study. Heliyon 2024, 10, e35307. [Google Scholar] [CrossRef] [Scilit] [PubMed]
- Su, X.Y.; Schroder, A.; Tse, L.A.; Yu, I.T.-S.; Xie, S.H. Hormonal and reproductive factors and risk of nasopharyngeal carcinoma in Chinese women: A case-control study. BMC Res. Notes 2025, 18, 483. [Google Scholar] [CrossRef] [Scilit] [PubMed]
- Chen, H.; Zhang, Z.; Yang, X.; Li, C. Bioinformatics analysis of immune-programmed cell death-related genes in nasopharyngeal carcinoma. Eye ENT Res. 2025, 2, 173–184. [Google Scholar] [CrossRef] [Scilit]
- Tai, J.; Park, J.; Han, M.; Kim, T.H. Screening key genes and biological pathways in nasopharyngeal carcinoma by integrated bioinformatics analysis. Int. J. Mol. Sci. 2022, 23, 15701. [Google Scholar] [CrossRef] [Scilit] [PubMed]
- Zou, Z.; Gan, S.; Liu, S.; Li, R.; Huang, J. Investigation of differentially expressed genes in nasopharyngeal carcinoma by integrated bioinformatics analysis. Oncol. Lett. 2019, 18, 916–926. [Google Scholar] [CrossRef] [Scilit] [PubMed]
- Amatya, N.; Garg, A.V.; Gaffen, S.L. IL-17 signaling: The yin and the yang. Trends Immunol. 2017, 38, 310–322. [Google Scholar] [CrossRef] [Scilit] [PubMed]
- Huangfu, L.; Li, R.; Huang, Y.; Wang, S. The IL-17 family in diseases: From bench to bedside. Signal Transduct. Target Ther. 2023, 8, 402. [Google Scholar] [CrossRef] [Scilit] [PubMed]
- Liu, H.; Yuan, S.; Zheng, K.; Liu, G.; Li, J.; Ye, B.; Yin, L.; Li, Y. IL-17 signaling pathway: A potential therapeutic target for reducing skeletal muscle inflammation. Cytokine 2024, 181, 156691. [Google Scholar] [CrossRef] [Scilit] [PubMed]
- Liu, W.; You, B.; Miao, Z.; Yu, J.; Ding, X.; Zhou, C. Neutrophils in nasopharyngeal carcinoma: From mechanisms to therapeutics. J. Transl. Med. 2026, 24, 428. [Google Scholar] [CrossRef] [Scilit] [PubMed]
- Wang, L.; Ma, R.; Kang, Z.; Zhang, Y.; Ding, H.; Guo, W.; Gao, Q.; Xu, M. Effect of IL-17A on the migration and invasion of NPC cells and related mechanisms. PLoS ONE 2014, 9, e108060. [Google Scholar] [CrossRef] [Scilit] [PubMed]
- Shi, X.; Pan, J.; Qiu, F.; Wu, L.; Zhang, X.; Feng, Y.; Gu, X.; Zhao, J.; Zheng, W. Multiscale transcriptomic integration reveals B-cell depletion and T-cell mistrafficking in nasopharyngeal carcinoma progression. Front. Cell Dev. Biol. 2022, 10, 857137. [Google Scholar] [CrossRef] [Scilit] [PubMed]
- Chen, C.; Zhang, Y.; Wu, X.; Shen, J. The role of tertiary lymphoid structure and B cells in nasopharyngeal carcinoma: Based on bioinformatics and experimental verification. Transl. Oncol. 2024, 41, 101885. [Google Scholar] [CrossRef] [Scilit] [PubMed]
- Scuderi, G.; Cocomero, L.; Cavalli, E.; Nicoletti, F.; Fagone, P. Evaluation of the diagnostic and prognostic role of TSPAN32 in B-cell acute lymphoblastic leukemia. Immunol. Lett. 2026, 279, 107151. [Google Scholar] [CrossRef] [Scilit] [PubMed]
- Scuderi, G.; Mangano, K.; Petralia, M.C.; Basile, M.S.; Di Raimondo, F.; Fagone, P.; Nicoletti, F. Comprehensive analysis of TSPAN32 regulatory networks and their role in immune cell biology. Biomolecules 2025, 15, 107. [Google Scholar] [CrossRef] [Scilit] [PubMed]
- Petersen, S.H.; Odintsova, E.; Haigh, T.A.; Rickinson, A.B.; Taylor, G.S.; Berditchevski, F. The role of tetraspanin CD63 in antigen presentation via MHC class II. Eur. J. Immunol. 2011, 41, 2556–2561. [Google Scholar] [CrossRef] [Scilit] [PubMed]
- Huang, G.; Hu, H.; Guo, L.; Xiao, M.; Chen, W.; Huang, Y.; Yang, X.; Li, Z.; Li, X.; Chen, M.; et al. TSPAN32 as a biomarker associated with radiotherapy and immune microenvironment remodeling in lung adenocarcinoma. Front. Oncol. 2026, 16, 1724489. [Google Scholar] [CrossRef] [Scilit] [PubMed]

Disclaimer/Publisher’s Note: The statements, opinions and data contained in all publications are solely those of the individual author(s) and contributor(s) and not of MDPI and/or the editor(s). MDPI and/or the editor(s) disclaim responsibility for any injury to people or property resulting from any ideas, methods, instructions or products referred to in the content. |
© 2026 by the authors. Licensee MDPI, Basel, Switzerland. This article is an open access article distributed under the terms and conditions of the Creative Commons Attribution (CC BY) license.