


Abstract
Background/Objectives: GluN2B subunits of N-methyl-D-aspartate (NMDA) receptors are therapeutic targets for neuropsychiatric disorders, but an effective positron emission tomography (PET) radioligand for human GluN2B brain imaging is still needed. We developed [11C]MeRo25, a 11C-methylated derivative of the GluN2B-preferring ligand Ro 25-6981, and evaluated its suitability as a GluN2B PET radioligand. Methods: MeRo25 was synthesized through methylation of Ro 25-6981, and affinities for GluN2B and σ1 receptors were determined in vitro. [11C]MeRo25 was prepared using [11C]methyl iodide. PET studies were performed in rats and monkeys at baseline and after challenge with GluN2B or σ1 receptor-directed ligands. In monkeys, regional total distribution volume (VT) was estimated through kinetic modeling. Results: MeRo25 showed low nanomolar affinity for GluN2B and σ1 receptors. [11C]MeRo25 was obtained with a radiochemical yield of 20–30%, a purity of >99%, and high molar activity. [11C]MeRo25 showed rapid and high brain uptake in rats and monkeys. Pretreatment with either GluN2B or σ1 receptor-directed ligands in monkeys markedly reduced brain radioactivity and regional VT, demonstrating contributions from both receptor populations. Conclusions: Despite favorable brain uptake and high GluN2B affinity, [11C]MeRo25 exhibits substantial σ1 receptor binding, producing a mixed GluN2B/σ1 receptor PET signal that precludes its use as a selective GluN2B radioligand. These findings emphasize the importance of in vivo pharmacological validation and reveal limitations of the Ro 25-6981 scaffold for selective GluN2B PET radioligand development. This study also cautions against the use of Ro 25-6981 as a pharmacological tool where binding to σ1 receptors may be of concern, for example as a challenge agent in PET studies.
1. Introduction
N-Methyl-D-aspartate (NMDA) receptors containing GluN2B subunits have long attracted interest in neuropsychiatric research because of their involvement in disorders such as chronic pain, stroke, traumatic brain injury, and schizophrenia [1,2,3,4,5]. Consequently, GluN2B became an early target for therapeutic drug development [5]. A PET radioligand capable of selectively measuring GluN2B subunit availability and target occupancy in the living human brain would therefore provide a valuable tool for studying GluN2B involvement in mental and neurodegenerative disorders and for facilitating the clinical development of GluN2B-directed therapeutics.
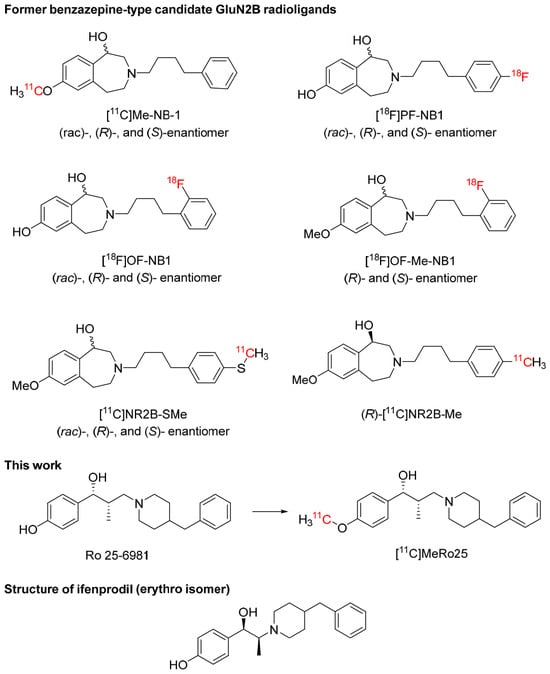
Despite decades of investigation, the development of successful PET radioligands for NMDA receptors has proven challenging [6,7,8,9]. To date, only benzazepine radioligands based on a 3-(4-phenylbutyl)-2,3,4,5-tetrahydro-1H-benzo[d]azepine-1,7-diol scaffold (Figure 1) have shown clearly blockable GluN2B-specific signals in rodents and non-human primates [9]. Of these, only (R)-[11C]Me-NB-1 [10] and (S)-[18F]OF-NB1 [11,12] (Figure 1) have progressed to evaluation in healthy human subjects. However, (R)-[11C]Me-NB-1 and related radioligands exhibit relatively high uptake in primate cerebellum. These findings are unexpected based on previous in vitro studies showing low GluN2B mRNA expression in the adult rat [13] and human brain [14], together with low GluN2B protein expression in the adult rat cerebellum [15,16,17].
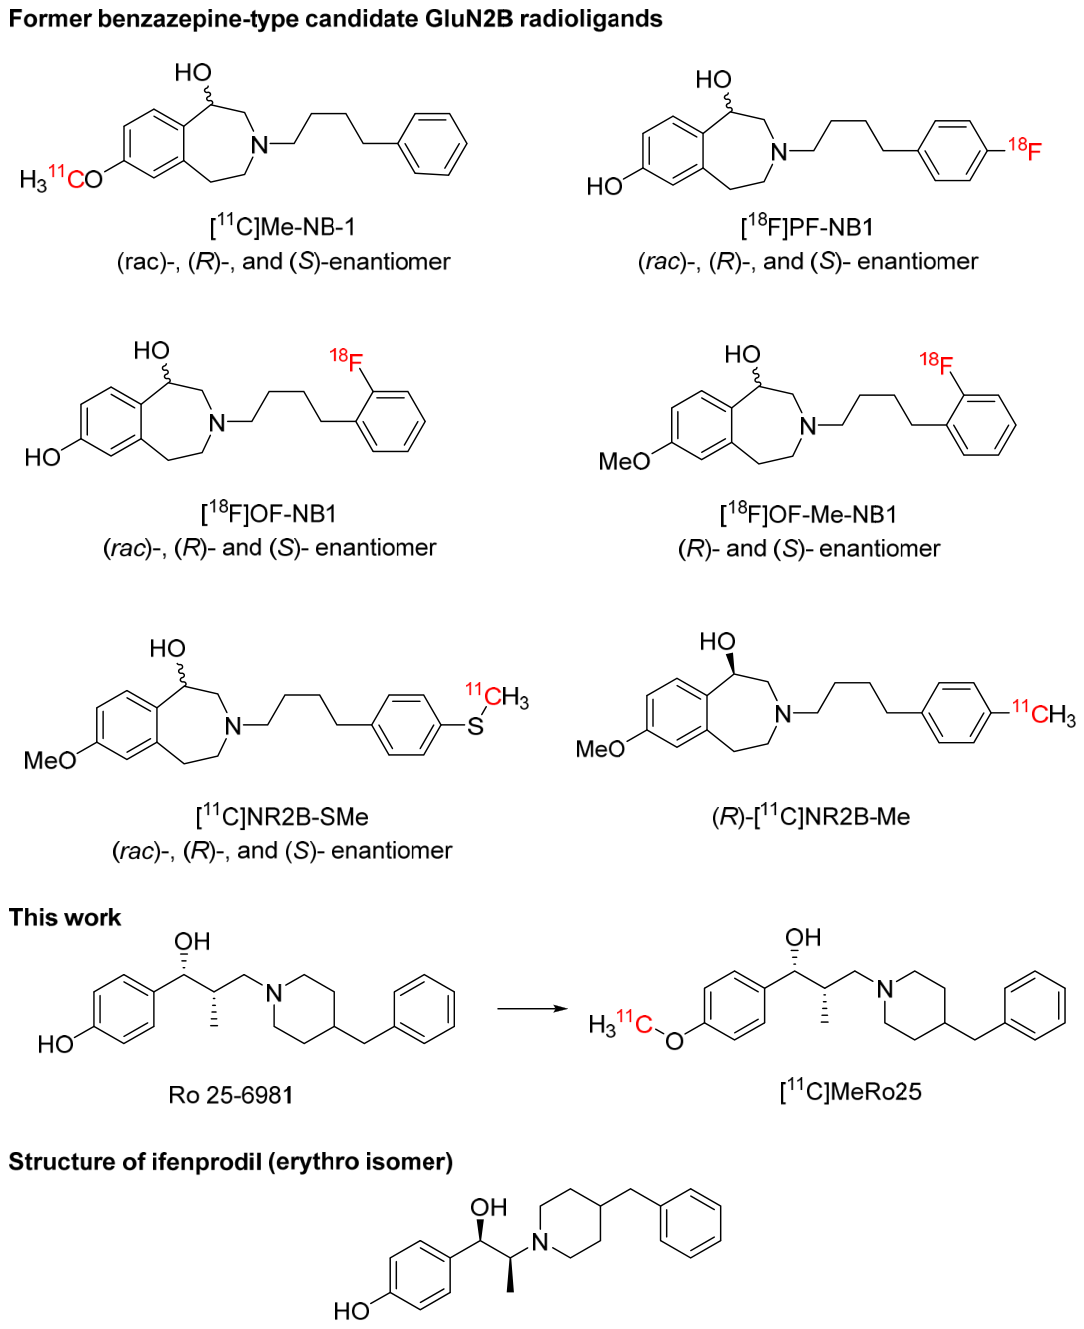
Figure 1.
Candidate radioligands evaluated for PET imaging of brain GluN2B in animals and humans, including benzazepine-type radioligands and [11C]MeRo25 in this study (the structure of ifenprodil is shown for comparison).
Benzazepine-type GluN2B radioligands appear to bind to at least one site other than GluN2B in vivo. Consistent with this interpretation, a recent PET study reports that [18F]OF-NB1 binds to off-target sites in the healthy human brain [12]. Off-site binding for benzazepine-type radioligands does not, however, appear to be to σ1 receptors. Thus, [3H]OF-NB1 has very low affinity for σ1 receptors in vitro (KI = 410 nM) [18], which would be inconsistent with detecting a σ1 receptor specific signal in vivo. Moreover, in vivo, [11C]NR2B-Me enantiomers (Figure 1) as candidate GluN2B radioligands are blocked by GluN2B ligands but not by σ1 receptor ligands, whereas the binding of the σ1-selective tracer [18F]FTC-146 [19] in the brain was vice versa unaffected by pretreatment with [11C]NR2B-Me enantiomers except at a very high dose [20]. [11C]NR2B-SMe enantiomer (Figure 1) binding in rat brain was similarly insensitive to blockade by FTC-146 [21]. The evaluation of structurally distinct GluN2B radioligands could therefore provide complementary tools for understanding the unexpected cerebellar uptake of former benzazepine-type candidate radioligands while facilitating the discovery of new radioligands with improved target selectivity.
Ro 25-6981 (Figure 1) is widely recognized as a potent and highly selective GluN2B-preferring ligand [22]. Accordingly, Ro 25-6981 represents an attractive starting point for developing a GluN2B PET radioligand from a chemotype distinct from the benzazepine class. In this study, we prepared and evaluated [11C]MeRo25, the O-methyl derivative of Ro 25-6981, as a candidate PET radioligand for imaging GluN2B subunits in the brain.
Although compounds derived from well-established pharmacological ligands may appear promising based on their reported in vitro affinity and selectivity, target specificity for PET imaging cannot be inferred solely from scaffold origin or in vitro pharmacology. Definitive target assignment requires direct pharmacological validation under in vivo imaging conditions.
To determine whether [11C]MeRo25 behaves as a selective GluN2B radioligand in vivo, we measured the affinity of MeRo25 for GluN2B receptors in vitro and performed PET imaging studies in rats and rhesus monkeys under baseline conditions and after pharmacological challenge with either MeRo25 or the GluN2B-directed ligand NR2B-Me [20]. Because Ro 25-6981 shares close structural similarity with the high-affinity σ1 receptor ligand ifenprodil (Figure 1), we also evaluated blockade with the highly selective σ1 receptor ligands BD1047 [23] and FTC-146 [19]. Contrary to our original expectation that [11C]MeRo25 might selectively image GluN2B receptors, its binding in the brain was substantially reduced by both GluN2B-directed and σ1-selective ligands, demonstrating mixed receptor engagement in vivo.
These findings identify an important limitation of [11C]MeRo25 as a GluN2B PET radioligand and illustrate a broader principle in radioligand development: high in vitro affinity and other promising properties do not necessarily predict efficacy in vivo. Rigorous pharmacological validation remains essential for establishing the target profile of candidate PET radioligands.
2. Results and Discussion
2.1. Chemistry and Pharmacology
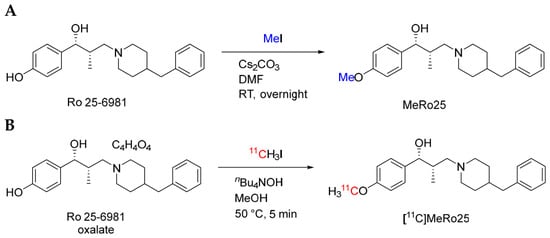
Ro 25-6981 free base was obtained from commercially available Ro 25-6981 maleate and methylated with iodomethane to produce MeRo25 (Figure 2A).
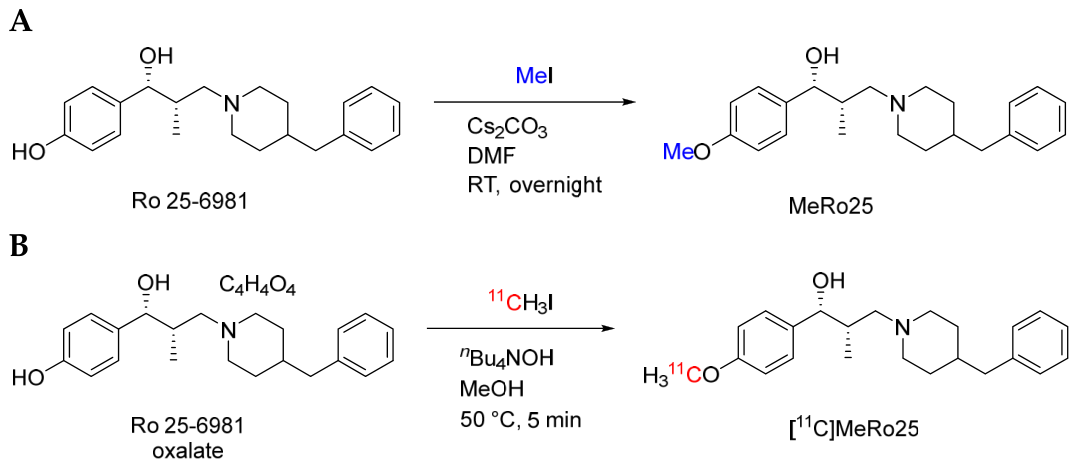
Figure 2.
Synthesis of MeRo25 (A) and [11C]MeRo25 (B).
In-house competition binding assays showed that Ro 25-6981 and MeRo25 had similarly high affinities for GluN2B, as determined using rat brain tissue with [3H]MK801 or [3H]ifenprodil as the radioligand (Table 1). Affinities of Ro 25-6981 and MeRo25 for σ1 and σ2 receptors, measured in Jurkat human T lymphocyte cells, were likewise similar, with MeRo25 showing a slightly higher affinity for σ1 receptors than for GluN2B. Both compounds showed a lower affinity for σ2 than σ1 receptors (Table 1). The findings for Ro 25-6981 are quite similar to those reported by Schoellerman et al. [24], namely, Ki values at σ1 and σ2 receptors of 2 and 189 nM, respectively.
Table 1.
Ki values for Ro 25-6981 and MeRo25 at GluN2B, σ1, and σ2 receptors 1.
Although these data affirmed that MeRo25 binds with high affinity to both GluN2B and σ1 receptors, receptor affinities determined in vitro alone cannot predict the relative contribution of each receptor to be expected in any observed PET signals across species. Binding affinities determined in vitro may depend on the species and temperature of measurement versus the physiological temperature. Moreover, brain receptor densities and regional distributions can substantially influence imaging outcomes. For these reasons, pharmacological validation of carbon-11 labeled MeRo25 with PET was still pursued. We were especially interested to establish whether this chemotype of GluN2B radioligand would show specific binding in cerebellum.
2.2. Radiochemistry
The precursor for [11C]MeRo25 synthesis was commercially available Ro 25-6981 maleate (Figure 2B). [11C]Methyl iodide was prepared as the labeling agent, as previously described [25]. [11C]MeRo25 was obtained ready for intravenous injection with an overall radiochemical yield of 20–30%, a radiochemical purity of >99% (Figure S5) and molar activities of 70–180 GBq/μmol, with radiosyntheses taking about 40 min.
2.3. Physicochemical Properties
Physicochemical properties, measured as described previously [26,27], were favorable for brain PET imaging. Apparent pKa and logD were 14.3 ± 2 (n = 3) and 2.3 ± 0.3 (n = 6), respectively, while the calculated topological polar surface area (tPSA) was 32.7 Å2, values which are all within ranges generally considered compatible with good brain penetration [28].
2.4. PET Imaging in Rats
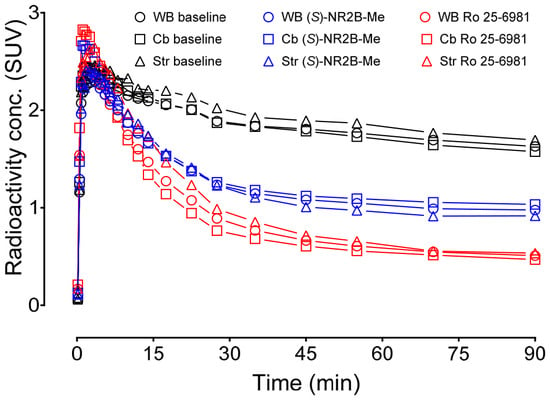
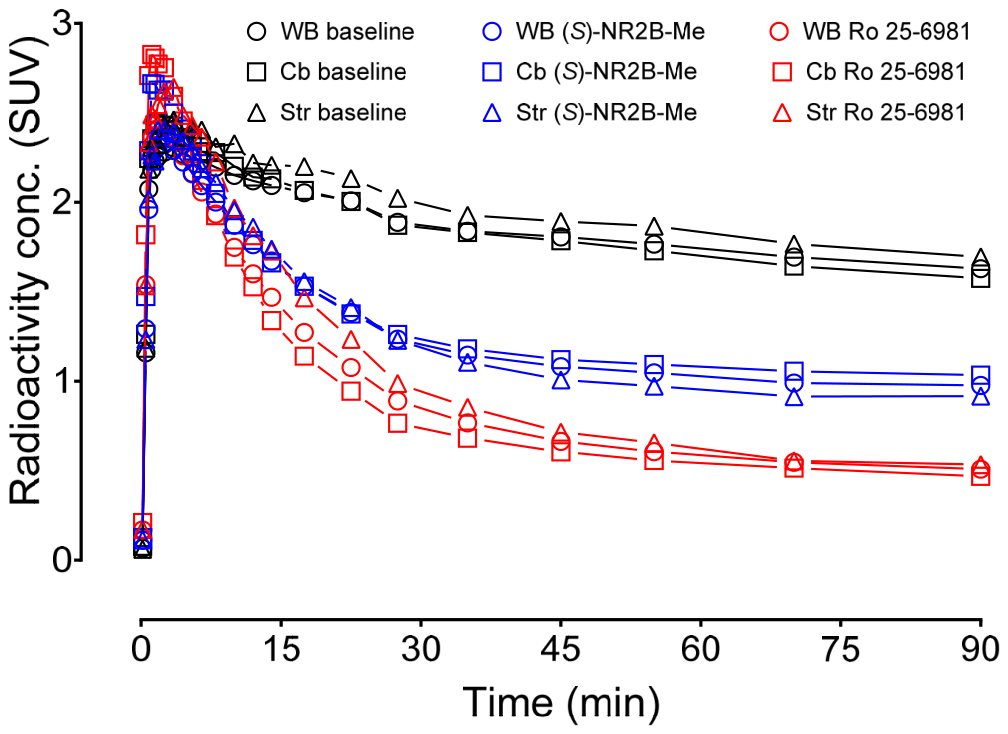
PET imaging in rats (n = 1, for each condition) was performed as an initial exploratory evaluation and demonstrated rapid brain uptake of [11C]MeRo25, with whole-brain radioactivity reaching almost 3 SUV within 5 min, followed by gradual washout over the 90-min scan (Figure 3). Pretreatment with either Ro 25-6981 (n = 1) or the GluN2B ligand (S)-NR2B-Me (n = 1) did not greatly alter the peak radioactivity uptake but substantially increased the washout, reducing residual brain radioactivity at 90 min relative to baseline. Ro 25-6981 caused a greater reduction than (S)-NR2B-Me. Similar kinetic behavior was observed across all analyzed brain regions, including the striatum and cerebellum.
Figure 3.
PET imaging of rat brain with [11C]MeRo25; representative regional time-activity curves (TACs) for whole brain (WB), striatum (Str), and cerebellum (Cb) at baseline and after challenge with (S)-NR2B-Me (blue) or Ro 25-6981 (red); n = 1 for each condition. Time points correspond to the middle value of each scan frame; scanning ended at 100 min. Lines are interpolations of the datapoints.
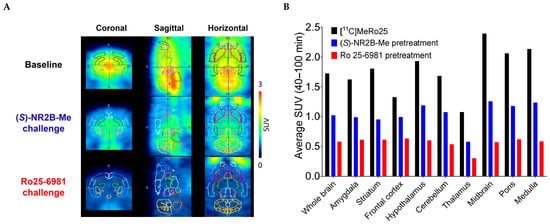
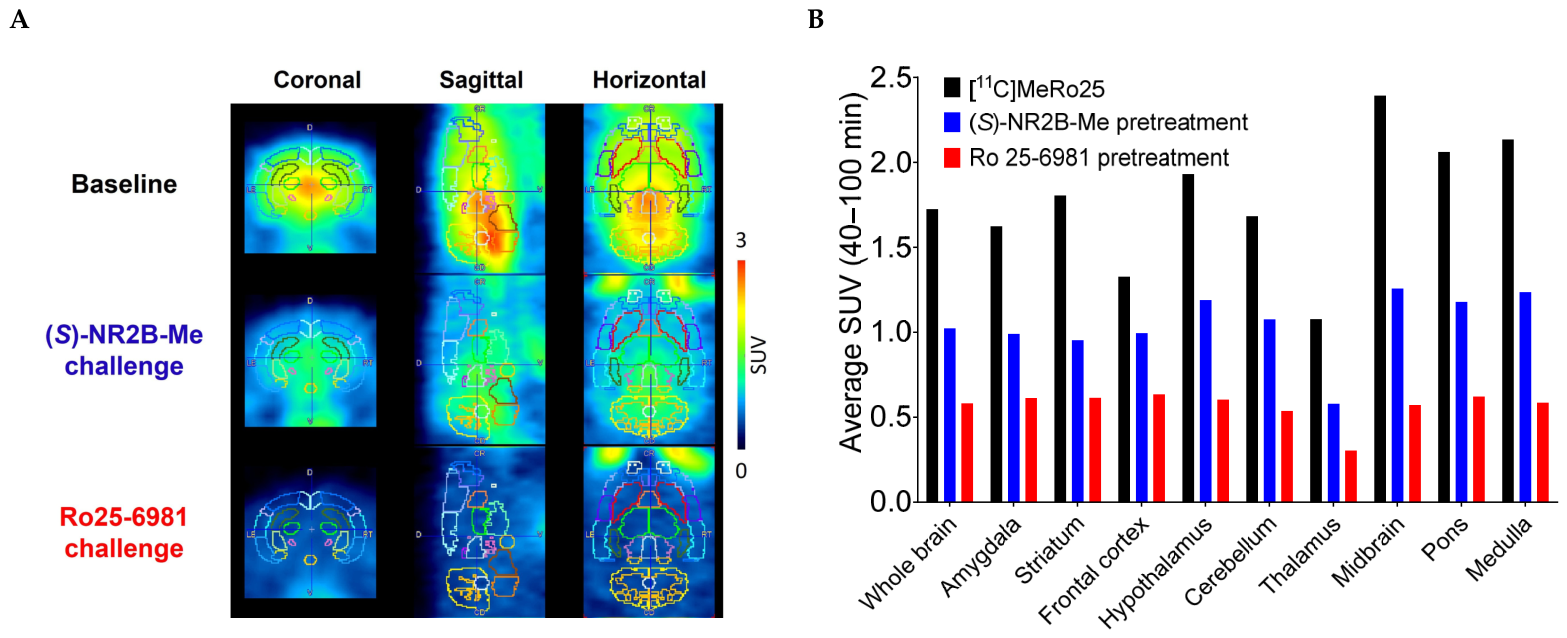
Summed PET images (40–100 min) showed the highest radioactivity uptake in the hypothalamus, midbrain, and medulla, with lower uptake in the cerebellum and frontal cortex (Figure 4A). Pretreatment with either challenge agent, Ro 25 6981 or (S)-NR2B-Me reduced radioactivity throughout the brain without producing marked regional differences (Figure 4B).
Figure 4.
PET imaging of rat brain with [11C]MeRo25. (A) Summed PET images (average SUV 40–100 min) of rat brain at baseline and after challenge with (S)-NR2B-Me or Ro 25-6981. The dotted boundaries on the PET images define the ROIs used for data in panel (B). (B) Average radioactivity concentrations in rat brain regions (SUV) between 40 to 100 min after injection of [11C]MeRo25 at baseline (black) and after pretreatment with (S)-NR2B-Me (blue) or Ro 25-6981 (red). n = 1 for each condition.
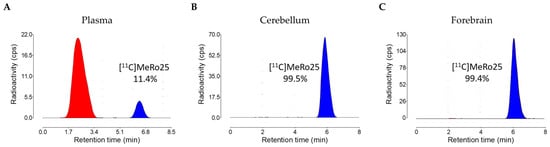
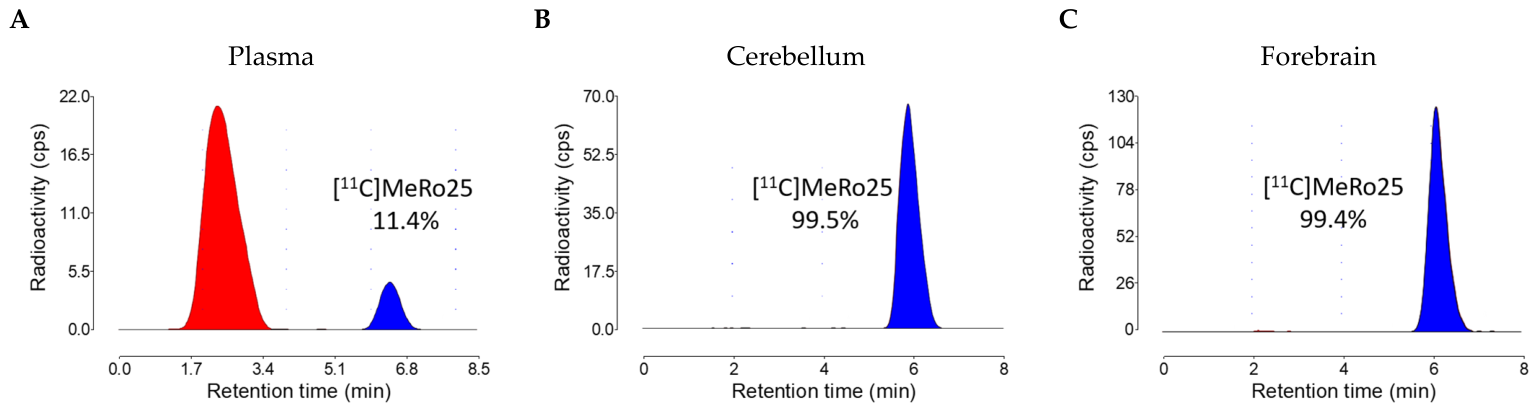
[11C]MeRo25 was stable in rat blood, plasma, and brain homogenates at room temperature (RT) for 1 h (Table S1), thereby allowing for accurate measures of the radioligand in these tissues. Ex vivo reversed phase radio-HPLC at 30 min after radioligand injection showed that more than 99% of the radioactivity in the forebrain and cerebellum corresponded to unchanged radioligand, whereas only 11.4% of the plasma radioactivity remained unchanged (Figure 5), showing that the polar radiometabolites formed in plasma, which eluted near the void volume, did not enter the brain.
Figure 5.
Radiochromatograms from the reversed phase ex vivo HPLC analyses of rat plasma (A), cerebellum (B), and forebrain (C) at 30 min after intravenous injection of [11C]MeRo25 (196–333 MBq; 28.1–139 MBq/nmol). Blue peaks are unchanged radioligand and red peaks are radiometabolites.
It should be noted that these rat experiments were exploratory; they are in a single animal under each condition and therefore lack statistical power. They do not on their own establish radioligand selectivity or signal magnitude. Nonetheless, they do demonstrate that [11C]MeRo25 readily enters rat brain (n = 3) and exhibits a substantial pharmacologically blockable component (n = 2), supporting further evaluation in a higher species.
2.5. PET Imaging in Monkeys
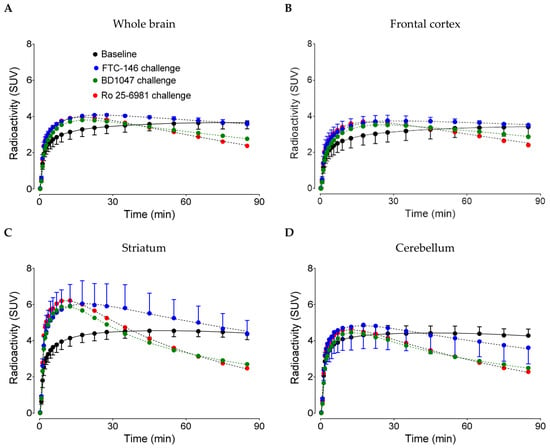
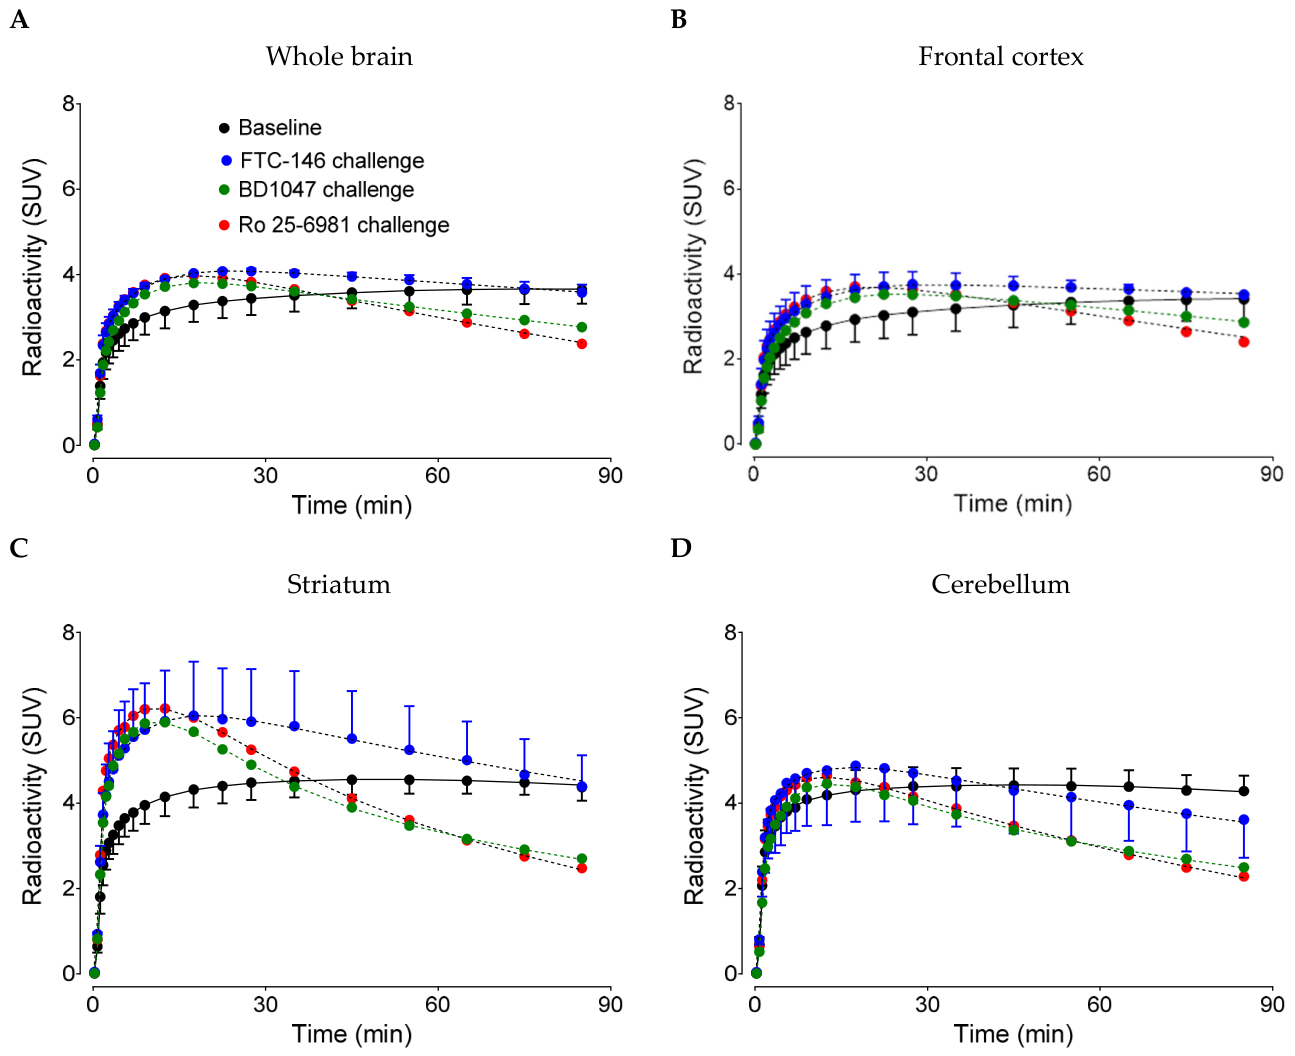
PET imaging of [11C]MeRo25 in rhesus monkeys at baseline showed rapid whole-brain radioactivity uptake, as in rats. Whole-brain radioactivity approached 4 SUV and slowly increased thereafter (Figure 6). TACs were similar in the frontal cortex (Figure 6B), striatum (Figure 6C), and cerebellum (Figure 6D). Pharmacological challenge with FTC-146, BD1047, or Ro 25-6981 resulted in a decline in radioactivity from the whole brain, frontal cortex, striatum, and cerebellum. Fast declines were observed in the striatum and cerebellum with all three challenge agents, indicating that [11C]MeRo25 binds to both GluN2B and σ1 receptors.
Figure 6.
PET imaging of [11C]MeRo25 in monkeys. TACs for whole brain (A), frontal cortex (B), striatum (C), and cerebellum (D) at baseline and after challenge with Ro 25-6981 (0.3 mg/kg, i.v.) and with σ1 receptor ligands, FTC-146 (0.03 mg/kg, i.v.) and BD1047 (0.3 mg/kg, i.v.). All solid and dashed curves are fits of the data from a two-tissue compartmental model (2TCM).
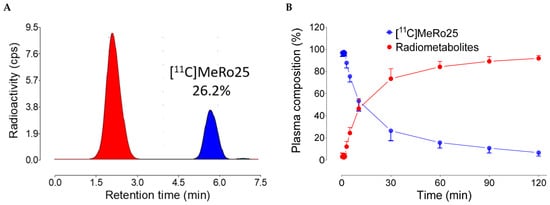
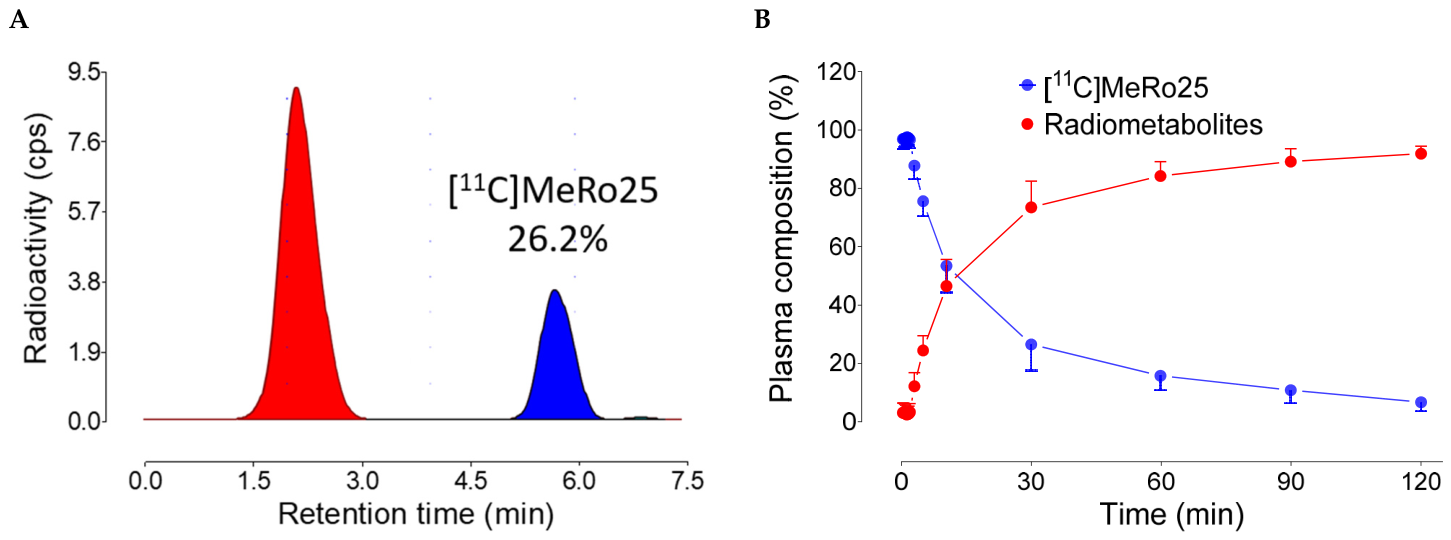
HPLC analysis of plasma sampled during [11C]MeRo25 PET scans showed only polar radiometabolites (Figure 7A), as seen in rats. By 12.6 min after radioligand injection, radiometabolites represented half of the total radioactivity in plasma (Figure 7B). Radiometabolite-corrected arterial input functions showed rapid clearance of [11C]MeRo25 from plasma (Figure S11).
Figure 7.
Emergence of radiometabolites of [11C]MeRo25 in monkey plasma. (A) Reversed phase HPLC analysis of plasma at 30 min after intravenous injection of [11C]MeRo25 (196–333 MBq; 28.1–139 MBq/nmol). Blue peak is unchanged radioligand and red peaks are radiometabolites. (B) Time course for the emergence of radiometabolites in plasma after intravenous injection of [11C]MeRo25. One-side error bars are SD for n = 3.
The total volume of distribution (VT) is the ratio of the unchanged radioligand concentration in brain to that in plasma at equilibrium and is the sum of specific (VS) and non-displaceable binding (VND). VND is normally constant across the brain. VT can therefore serve as an index of radioligand-specific binding. Whole-brain and cerebellum VT values decreased substantially following challenges with Ro 25-6981 or the σ1 ligand BD1047. Both reduced VT by about 80% in whole brain and cerebellum (Table 2). The σ1 receptor ligand FTC-146, evaluated at a dose of 0.03 mg/kg i.v., produced more moderate reductions of 53 and 51% in the whole brain and cerebellum, respectively. These data strongly imply that [11C]MeRo25 has a high proportion of specific binding to brain σ1 receptors in vivo. Because Ro 25-6981 turns out to have strong binding to σ1 receptors in addition to GluN2B, the exact proportion cannot be accurately determined from these experiments. The data nonetheless imply that chemotypes with low nanomolar affinity for σ1 receptors in vitro should be avoided in the development of PET radioligands for GluN2B.
Table 2.
Challenge effects on VT (mL/cm3) values for [11C]MeRo25 in the whole brain and cerebellum.
Radioligand free fraction (fP) was monitored in these experiments. The values were moderately high, in accord with the measured logD value [29], and did not vary by more than ±26% between baseline and challenge experiments (Tables S2 and S3).
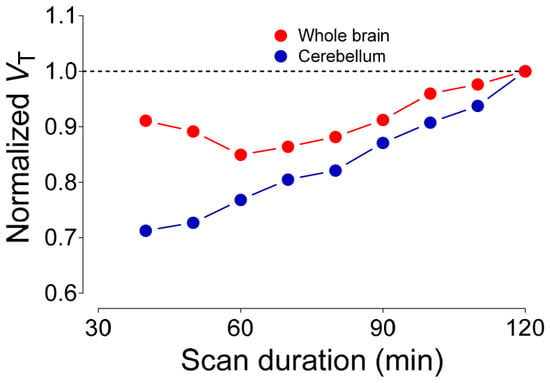
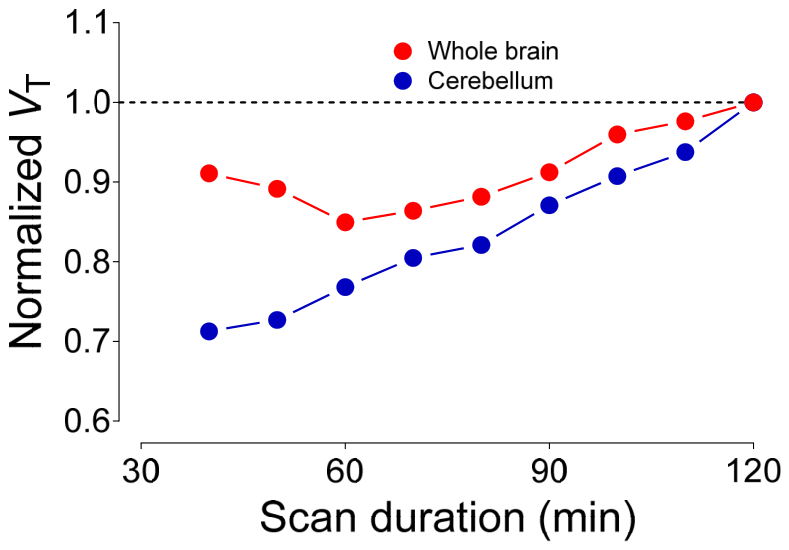
Kinetic analysis demonstrated that VT values for the whole brain and cerebellum steadily increased toward terminal 120-min values as the scan durations used for calculation were increased (Figure 8). This accords with the steadily rising brain time-activity curves at baseline (Figure 6) versus the declining radiometabolite-corrected arterial input functions. (Figure S11). These data may suggest that radiometabolites do gradually accumulate in brain, despite relatively polar radiometabolites being observed in plasma. It may be that radiometabolites are being generated in the brain or are entering from plasma. Further experiments would be needed to establish whether this is the case, such as administration of the radioligand to monkeys followed by radio-HPLC analysis of radioactivity in the brain after monkey euthanasia (as was carried out for rats; see Figure 5). Nonetheless, such experiments are not warranted for an unpromising radioligand. It should be noted that there are also other possibilities that might contribute to the time instability of VT measures, such as the lack of final pharmacokinetic equilibration of the radioligand in the brain, changing biological compartments, and invalid model assumptions.
Figure 8.
Time course of whole-brain and cerebellum VT measurements for [11C]MeRo25 in monkeys. Time points correspond to the end of each scan frame. The horizontal dashed line represents the normalized VT value at 120 minutes.
2.6. Ligand Docking
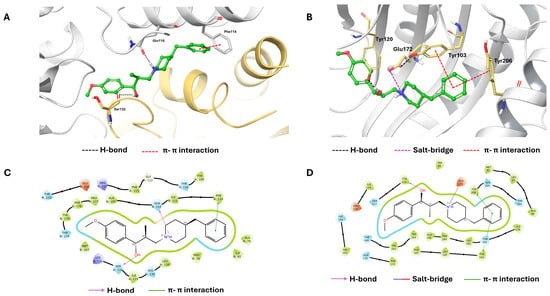
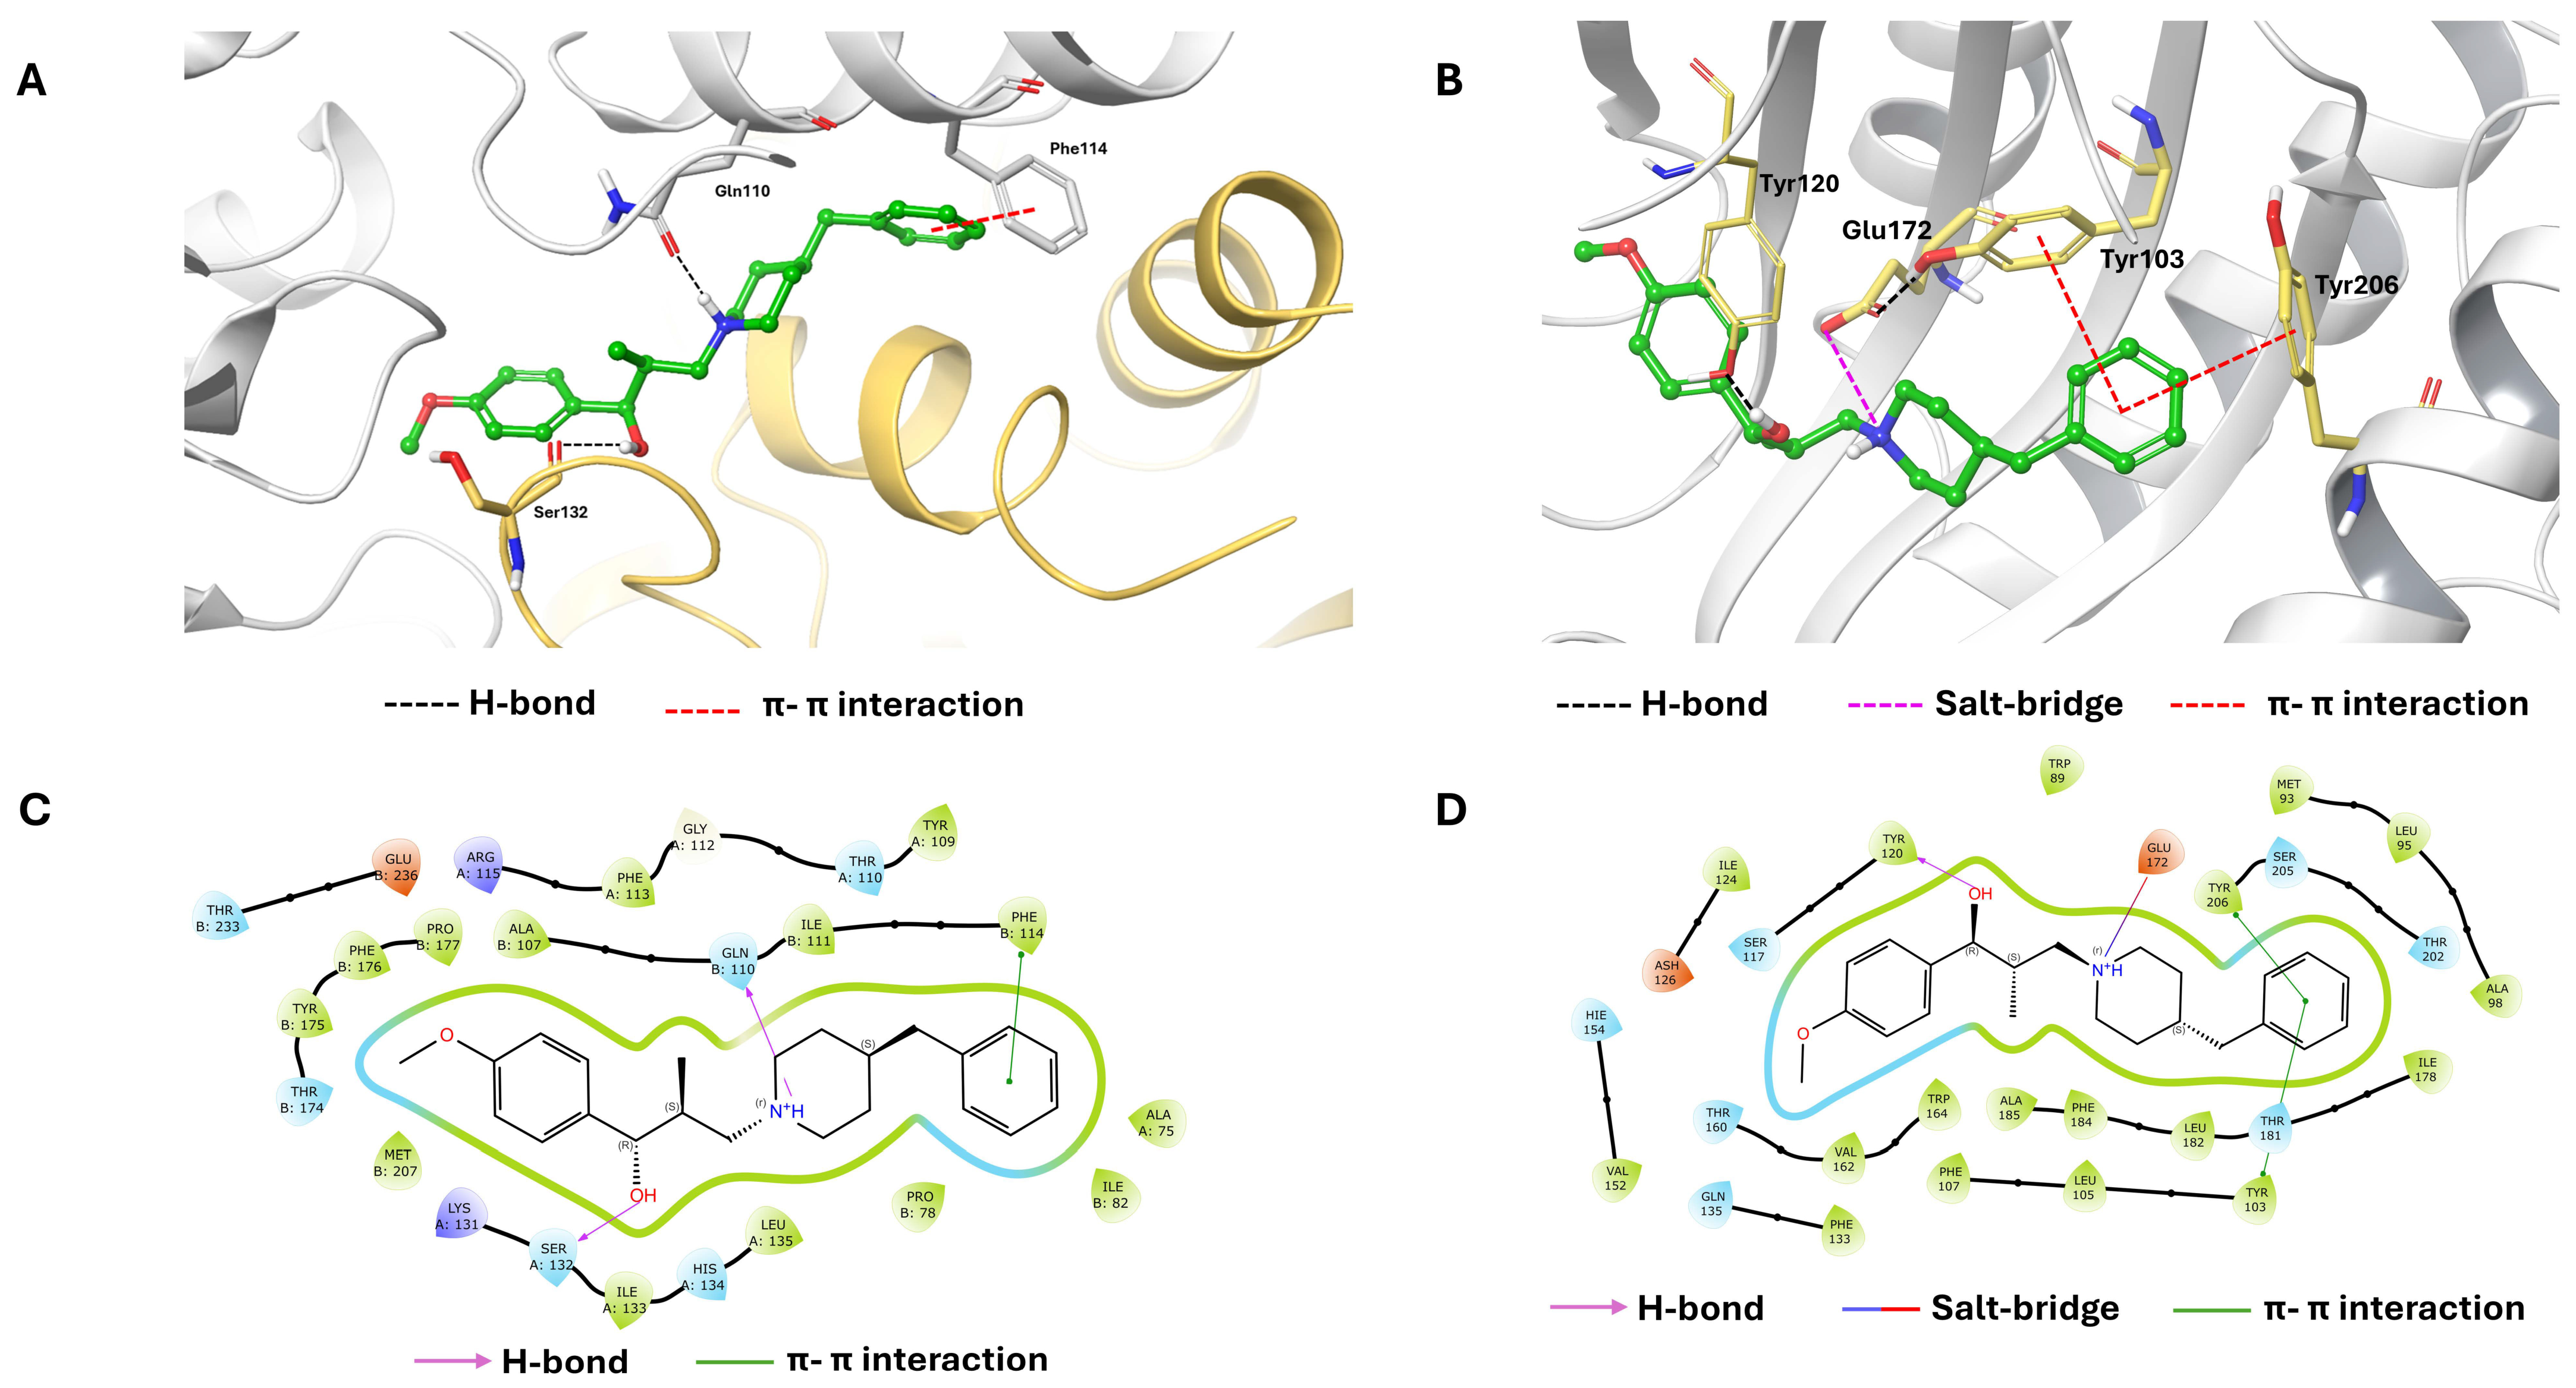
We have previously reported the docking of ifenprodil to the GluN1a-GluN2B interface [30]. Here, for comparison, we report the docking of Ro 25-6981 and MeRo25 to the same protein using the same method (Figures S6 and S7, respectively). Notably, each of the three ligands forms a hydrogen bond between the piperidinyl nitrogen and Gln110 of the GluN2B subunit. The secondary hydroxy group forms a hydrogen bond with Gln110 in the GluN2B subunit for ifenprodil, with Ser132 and Leu135 in the GluN1a for Ro 25-6981, and with Ser132 in the GluN1a subunit for MeRo25. The phenyl ring in each ligand forms a π–π interaction, with Phe176 of GluN2B for ifenprodil, and with Phe114 of GluN2B for Ro 25-6981 and MeRo25.
Ligand docking experiments for ifenprodil, Ro 25-6981, and MeRo25 additionally illustrate how these ligands may interact with σ1 receptors (Figures S8–S10, respectively). There are notable similarities and differences in ligand binding poses, involving several interactions. In each case, the receptor binding pocket features a hydrogen bond between Tyr103 and Glu172. Each of the three ligands forms a salt bridge between the nitrogen of its piperidinyl group with Glu172. The secondary hydroxy groups of ifenprodil and MeRo25 show a hydrogen bond to Tyr120, which is not seen in Ro 25-6981. Ifenprodil and MeRo25 also show a π–π interaction of a phenyl ring with Tyr206. MeRo25 also a π–π interaction of its phenyl ring with Tyr103, an interaction also shown by the phenyl ring of Ro 25-6981. Additionally, the phenolic group of Ro 25-6981 forms π–π interactions with His154 and Phe133. Figure 9 shows the binding poses of MeRo25 at the GluN1a-GluN2B complex and the σ1 receptor.
Figure 9.
Docking poses of MeRo25 in the GluN1a–GluN2B complex (PDB ID: 3QEM; (A,C)) and the σ1 receptor (PDB ID: 5HK1; (B,D)). (A,B) Three-dimensional interaction diagrams. Ligand carbon, oxygen, and nitrogen atoms are colored green, red, and blue, respectively. GluN1a and GluN2B are shown in yellow and gray, respectively; the σ1 receptor backbone is gray, with selected residue carbon atoms in yellow. Hydrogen bonds, π–π interactions, and salt bridges are indicated by black, red, and magenta dashed lines, respectively. (C,D) Two-dimensional interaction diagrams. Hydrophobic, polar, positively charged, and negatively charged residues are colored light green, cyan, purple, and orange, respectively; glycine is pale cream. Hydrogen bonds, π–π interactions, and salt bridges are indicated by magenta arrows, green lines, and blue–red lines, respectively.
3. Materials and Methods
3.1. General Methods
1H-NMR spectra were obtained at 400 MHz and 13C-NMR spectra at 101 MHz at RT on a multinuclear instrument (Bruker Biospin Corp; Billerica, MA, USA) in deuterated solvent. Tetramethylsilane (δ = 0 ppm) was used as an internal standard for 1H and 13C-NMR spectroscopy. The abbreviations s, d, t, m, and dd, denote singlet, doublet, triplet, multiplet, and double doublet, respectively. HRMS spectrometry was performed at the Mass Spectrometry Lab (University of Illinois Urbana-Champaign; scs.illinois.edu/research/mass-spectrometry-lab, accessed on 10 October 2026).
HPLC analyses of radioactive biological samples were performed on an X-Terra C18 column (10 µm, 7.8 × 300 mm; Waters Corp.; Milford, MA, USA) housed within a compression module (Radial-Pak RCM-100; Waters Corp.) with a sentry pre-column. The column was eluted with MeOH:H2O:Et3N (82.5:17.5:0.1 by vol.) at 4.0 mL/min (general method A) or 5 mL/min (general method B). Eluted compounds were detected in series with an in-line photodiode-array absorbance detector (λ = 245 nm; Beckman Coulter; Sykesville, MD, USA) and a flow-through Na(Tl) scintillation detector-rate-meter (Bioscan; Washington, DC, USA). Samples were injected onto the HPLC column using Iso-Disk nylon filters (13 mm × 0.45 µm; Supelco; Bellefonte, PA, USA). Recovery of all radioactivity from the HPLC column was checked by injection of absolute methanol (2 mL) at the end of chromatography, with continued monitoring for radioactivity. Radiochromatograms were collected and stored with Bio-Chrome Lite software (version 3.4.7.52; Bioscan Inc.; Washington, DC, USA) and analyzed after decay correction.
All radioactivity measurements were corrected for physical decay. Activities in tissue samples were expressed as standard uptake values (SUV), which were calculated according to the following formula:
SUV = [activity/tissue (g)]/[injected activity × body weight (g)]
Grouped data are presented as mean ± SD, unless otherwise stated.
3.2. Synthesis of (1R,2S)-3-(4-Benzylpiperidin-1-yl)-1-(4-methoxyphenyl)-2-methylpropan-1-ol (MeRo25)
4-((1R,2S)-3-(4-Benzylpiperidin-1-yl)-1-hydroxy-2-methylpropyl)phenol (Ro 25-6981; 100.5 mg, 0.296 mmol; AiFChem; Somerville, MA, USA) was dissolved in DMF (1.5 mL). Cesium carbonate (288.6 mg, 0.886 mmol) and iodomethane (22 μL, 0.353 mmol, 1.2 eq) were then added and stirred at RT for 23 h. The reaction mixture was extracted with ethyl acetate and washed twice with brine. The product was purified using silica gel flash chromatography with a gradient of 20–80% ethyl acetate in hexane. The purified product was collected and dried under vacuum to give MeRo25 (77.8 mg, yield 74%). Mp: 86–89 °C. 1H-NMR (CDCl3) (Figure S1): δ 7.30–7.26 (m, 3H, Ar-H), 7.21–7.14 (m, 5H, Ar-H), 6.88 (3JHH = 8.0 Hz, 2H, Ar-H), 4.76 (d, 3JHH = 4.0 Hz, 1H, CHOH), 3.80 (s, 3H, OCH3), 3.29 (d, 3JHH = 7.0 Hz, 1H), 2.88 (d, 3JHH = 7.0 Hz, 1H), 2.56–2.47 (m, 3H), 2.32 (t, 3JHH = 7.0 Hz, 1H), 2.06–1.99 (m, 2H), 1.80 (t, 3JHH = 7.0 Hz, 1H), 1.71 (m, 2H), 1.56 (m, 1H), 1.47–1.26 (m, 3H), 0.66 (d, 3JHH = 7.0 Hz, 3H). 13C{1H}-NMR (CDCl3) (Figure S2): δ. 158.48, 140.54, 133.96, 129.11 (CH), 128.24 (CH), 128.12 (CH), 125.89, 113.06 (CH), 78.61 (COH), 61.16 (CN), 55.70, 55.24 (OCH3), 53.32, 43.10, 37.91, 34.42, 32.63, 32.12, 15.66 (CCH3). HRMS calcd for C22H30NO3 [M + H]+: m/z = 354.2226, found 354.2223; error: –0.8 ppm. Chiral HPLC (Figure S3): tR = 15.04 min, purity 96.10%.
3.3. In Vitro Binding Assay Using [3H]Ifenprodil
This assay was used to evaluate the ability of MeRo25 and Ro 25-6981 to compete with the GluN2B-preferring radioligand [3H]ifenprodil in rat brain homogenates. Rat brain was homogenized in phosphate-buffered saline (PBS)-water (1:24, v/v), and the protein concentration was measured. The protein concentration used for the binding assay ranged from 0.8 to 3.5 mg/mL. Aliquots (100 μL) were added to each of 3 tubes (48 per rack) and assayed as described previously [29] using [3H]ifenprodil (2.22 TBq/mmol, 0.01 kBq/μL; ARC, https://www.arcincusa.com/, accessed on 23 October 2026).
3.4. In Vitro Binding Assay Using [3H]MK-801
Because [3H]MK-801 binds within the NMDA receptor channel complex, the assay was intended to serve as a comparative measure of GluN2B-associated pharmacology rather than as a definitive assessment of GluN2B selectivity.
Binding affinities of MeRo25 and Ro 25-6981 were evaluated in rat brain homogenates using a competitive displacement assay with [3H]MK-801. Rat brains were harvested, separated into cerebrum and cerebellum, homogenized in PBS, and stored at −20 °C until use. Before assay, homogenates were thawed and diluted with PBS to the desired concentration.
Aliquots of cerebrum homogenate (100 μL) were added to assay tubes in triplicate. [3H]MK-801 (2.22 TBq/mmol; PerkinElmer Life Sciences; Boston, MA, USA) was added in PBS (100 μL per tube). MK-801, Ro 25-6981, or MeRo25 was dissolved in DMSO and serially diluted to provide concentrations ranging from 10−9 to 10−1 M. Test compound solution (10 μL) was added to each tube. The final assay volume was adjusted to 1.0 mL with PBS containing 100 μM glutamine and 30 μM glycine. Samples were vortexed and incubated at 37 °C for 2 h.
Bound and free radioligand were separated using a cell harvester and Whatman GF/B glass-fiber filters (Cytvia Lab Equipment; Westborough, MA, USA) pretreated with 0.5% polyethyleneimine. Filters were washed three times with PBS (3 mL each), transferred to scintillation vials, mixed with scintillation cocktail (4 mL), and counted for radioactivity after overnight equilibration.
Competition curves were analyzed using Prism 8.1.1 Software (GraphPad; San Diego, CA, USA) with a one-site competition model. IC50 values were converted into Ki values according to the Cheng–Prusoff equation [31], where KD is the equilibrium dissociation constant of [3H]MK-801 determined independently using homologous displacement experiments.
3.5. Sigma Receptor Binding Assays
Binding affinities at σ1 and σ2 receptors were determined by Eurofins Discovery (https://www.eurofinsdiscovery.com/, accessed on 23 October 2026) using standard radioligand competition assays in Jurkat human T lymphocyte preparations. Detailed assay protocols are available from Eurofins.
3.6. GluN1a-GluN2B Receptor and σ1 Receptor-Ligand Docking Studies
The crystal structures of the σ1 receptor (PDB ID: 5HK1) and GluN1a-GluN2B complex (PDB ID: 3QEM) were obtained from the Protein Data Bank (PDB). Each receptor structure was prepared using the Protein Preparation Wizard in the Schrödinger Suite 2025-2 (New York, NY, USA). Protein preparation included the addition of missing atoms, reconstruction of missing regions, and removal of redundant solvent molecules at pH 7.4 ± 2.0. The prepared structure was subsequently subjected to energy minimization using the OPLS4 force field to optimize the protein geometry and remove unfavorable contacts. The docking grid was generated using the Receptor Grid Generation tool, with the binding site being defined on the basis of the position of the reference ligands (PD144418 for σ1 and Ro 25-6981 for GluN1a-GluN2B) in the respective crystal structures. MeRo25, Ro 25-6981, and ifenprodil structures were prepared for docking using the LigPrep module, including the generation of relevant protonation and tautomeric states at pH 7.0 ± 2.0. The van der Waals (vdW) radius scaling factor for ligand atoms was set at 0.8 with a partial charge cut-off of 0.15. Flexible ligand sampling was employed, while all other docking parameters were maintained at their default settings.
3.7. Radiosynthesis of [11C]MeRo25
Ro 25-6981 maleate (0.5 mg; 1.5 μmol) in methanol (0.40 mL) and tetra-n-butylammonium hydroxide in methanol (5 μL of 1 M stock solution; 5 μmol) were loaded into a septum-sealed tear-drop microvial (1.1 mL, Microsolv Technology Corp.; Wilmington, NC, USA) of a PETtrace Microlab module (GEMS PET Systems AB; Uppsala, Sweden). No-carrier-added [11C]methyl iodide (>37 GBq) was produced from cyclotron-produced [11C] carbon dioxide (~50 GBq) within the same module as previously described [25], swept with a stream of helium (15 mL/min) into the septum vial and heated at 50 °C for 5 min. [11C]MeRo25 was then separated by reversed phase HPLC on an XBridge column (10 μm, 10 × 250 mm, Waters Corp.) eluted at 6 mL/min for 30 min with TFA (0.1% w/v) in methanol-water (1:1 v/v). Eluate was monitored for absorbance at 273 nm as well as for radioactivity (Figure S4). The fraction containing [11C]MeRo25 (tR = 13.0 min) was collected in ascorbic acid solution (10 mg/mL; 0.1 mL) and then rotary evaporated to dryness (80 °C, water bath). The residue was dissolved in sterile saline for injection (USP; 4 mL) plus ethanol (USP; 1 mL) and aq. NaHCO3 solution (8.4% w/v; 40 µL). This solution (pH ~5.5) was then sterile-filtered into a sterile and pyrogen-free dose vial that had been preloaded with sterile saline for injection (USP; 5 mL).
The formulated product was analyzed with HPLC on an X-Bridge C18 column (10 μm, 4.6 × 250 mm; Waters Corp.) eluted for 20 min with TFA (0.1% w/v) in methanol-water (1:1 v/v) at 1.5 mL/min (Figure S5). Eluate was monitored for absorbance at 274 nm, as well as for radioactivity. The retention time of [11C]MeRo25 was 5.8 min. The response of the analytical system had been calibrated for the mass of MeRo25 to allow molar activity to be calculated. The radioligand was identified by analytical HPLC by verifying its co-mobility with the reference compound and by liquid chromatography-mass spectrometry (LC-MS) of residual carrier after full decay to compare its spectrum with that of the reference compound. The formulated radioligand had greater than 99% radiochemical purity.
3.8. LogD and pKa Measurement
LogD and pKa were determined for [11C]MeRo25 (99% radiochemically pure by HPLC), using methodology described previously [26,27]. Cyclohexane was used as the organic solvent in the pKa measurement method.
3.9. In Vitro Stability Studies in Rat Tissues
The radiochemical purity of [11C]MeRo25 used in these studies was 99.3%. The rat frontal brain, anticoagulated blood, and plasma were harvested and analyzed as follows.
3.9.1. For Brain
The rat brain (1.7 g) was homogenized in twice its volume of cold saline. Formulated [11C]MeRo25 (20 µL; 3.7 MBq) was added to the brain homogenate, incubated at 37 °C for 1 h, and then measured for radioactivity. Then, an aliquot (450 µL) of homogenate was placed in acetonitrile (720 µL) along with carrier MeRo25 (5 µg) and mixed well. Water (100 µL) was then added, mixed well, measured for radioactivity, and centrifuged at 10,000× g for 1 min. The clear supernatant liquid was analyzed with HPLC (general method A).
3.9.2. For Whole Blood
Formulated [11C]MeRo25 (10 µL; 1.85 MBq) was added to whole blood (200 µL). The sample was mixed well and incubated at 37 °C for 1 h. Water (300 µL) was added to lyse the cells by hypotonic shock. Then, an aliquot (450 µL) was removed to a new vial and acetonitrile (720 µL) was added. This mixture was mixed well and measured for radioactivity. The mixture was centrifuged at 10,000× g for 1 min. The clear supernatant was analyzed with HPLC (general method A).
3.9.3. For Plasma
Plasma was separated from blood cells. Formulated [11C]MeRo25 (10 µL; 1.85 MBq) was added to the plasma (500 µL), mixed well, and incubated at 37 °C for 1 h. The mixture was measured for radioactivity. Then, an aliquot (450 µL) of plasma was placed in acetonitrile (720 µL) along with carrier MeRo25 (5 µg) and mixed well. Water (100 µL) was then added, mixed well, measured for radioactivity, and centrifuged at 10,000× g for 1 min. The clear supernatant liquid was analyzed with HPLC (general method A).
The concentration (SUV) of any radioactive species (unchanged radioligand or radiometabolite) in tissue was calculated as the total radioactivity concentration in tissue (SUV) multiplied by the fraction of radioactivity represented by the radioactive species in the analytical HPLC radiochromatogram.
The stability of [11C]MeRo25 in rat tissues in vitro was calculated by dividing the percentage of parent radioligand in the tissue sample measured with HPLC by the initial radiochemical purity of the radioligand.
In all the tissue analyses described above, the precipitate obtained after centrifugation was measured for radioactivity to determine the recovery of radioactivity into the supernatant that had been injected onto HPLC.
3.10. Ex Vivo Rat Biodistribution and Radiometabolite Analysis
For these experiments, radio-HPLC analyses were performed using general method B.
Rats were anesthetized by 1.5% isoflurane. [11C]MeRo25, formulated in 10% ethanol with respect to 0.9% NaCl solution, was injected intravenously through the penile veins of 3 anesthetized rats. Other experimental parameters that governed this study are listed in Table S1. The rats were sacrificed via thoracotomy at 30 min after injection. Anticoagulated blood was drawn from the myocardium followed by decapitation and harvesting the brain. Each brain was removed, weighed, and immediately subjected to radio-HPLC analysis after counting its concomitant radioactivity. Whole-blood samples were removed and centrifuged to separate the plasma. Whole-blood (100 µL each) and plasma samples (100 µL each) were also quantified for radioactivity in an automatic γ-counter (model 2480 Wizard 2; PerkinElmer) with an electronic window set at 360–1800 keV (counting efficiency = 51.84%). Briefly, plasma samples (~450 µL) were deproteinated with acetonitrile treatment (720 µL). The radioactivity of various plasma and brain tissues were counted in the γ-counter. Brain tissues were then homogenized in 2.0–3.0 mL of acetonitrile using a handheld tissue Tearor (model 985-370; BioSpec Products Inc.; Bartlesville, OK, USA), followed by homogenization a second time in 1.0 mL of water. The homogenates were counted in the γ-counter to calculate the % recovery of radioactivity into the acetonitrile extracts. Decay corrections of all tissue assays were performed for physical decay with a half-life of 20.385 min [32]. The homogenates were then centrifuged at 10,000× g for 1 min. The clear supernates were analyzed with HPLC. Radioactivities in the resulting precipitates were used to calculate the percent recovery of activity in the acetonitrile supernates.
Five milliliters of anticoagulated blood and brain (1.6 g) were harvested from a control rat (~229 g) and used for the in vitro measurements. The brain was immediately weighed and homogenized with twice its weight (3.0 mL) of ice-cold 0.9% NaCl solution. Plasma was separated from whole-blood via centrifugation. A radioligand amount (370 kBq in 2 µL) was then added to these three tissue samples before incubation in a shaking water bath at 37 °C for 60 min. Following incubation, aliquots (450 µL) were removed and processed as detailed above for radio-HPLC analysis.
The total tissue radioactivity concentration, or parent tissue concentration, was calculated as the product of the radio-HPLC fraction and the total tissue dpm/mL and expressed as SUV.
The in vitro stability was calculated by dividing the relative composition of the blood or brain homogenate (radio-HPLC) by the radiochemical purity of the radioligand.
3.11. Plasma Free Fraction Measurements
A standard plasma free fraction (fP) was measured in a frozen aliquot of pooled human plasma and used as an internal standard to normalize the fP values of experimental samples. The fp value of [11C]MeRo25 was measured by ultrafiltration through a Centrifree membrane filter (MilliporeSigma; Burlington, MA, USA), as previously described [33].
3.12. PET Imaging in Rats
Dynamic PET scans were performed on a microPET Focus 220 scanner (Siemens Medical Solutions; Knoxville, TN, USA). Data were acquired in listmode. Images were reconstructed into a 128 × 128 × 95 matrix with a voxel size of 1.0 × 1.0 × 0.8 mm using Fourier rebinning, followed by 2D filtered back-projection, achieving a resolution of about 1.6 mm at the center of the field of view.
To prepare for radioligand injection into a male rat, a polyethylene catheter (PE 10) was inserted into the penile vein. The catheter was secured with tissue adhesive and tape. The head and body were fixed with tape and kept under 1.5% isoflurane anesthesia via a nose cone. The body temperature was monitored with a rectal probe and maintained between 36 and 37 °C.
Dynamic scanning began at the time of a one-minute intravenous bolus injection of [11C]MeRo25 (49.9 ± 1.7 MBq, volume 0.2 to 1.0 mL) via the penile vein catheter, followed by flush with heparinized saline (70 μL) (see Table S2 for full dosing details). Scanning lasted for 100 min. The injected mass dose was 3 ± 1 nmol/kg. Challenge agents, either Ro 25-6981 or (S)-NR2B-Me, were administered intravenously 10 min before the radioligand. A transmission scan using a 137Cs point source was acquired to correct for attenuation. Tomographic images were analyzed with PMOD (version 4.3; pixel-wise modeling computer software; PMOD Group; Zurich, Switzerland). Multiple regions of interest (ROIs) in the brain were delineated, and the TACs were calculated.
3.13. PET Imaging and Kinetic Modeling in Monkeys
3.13.1. PET Scanning
Dynamic brain scans with frame durations ranging from 30 s to 10 min were obtained on a PET/CT LFER150 camera (Mediso Medical Imaging Systems; Budapest, Hungary) in 64-bit list mode format and reconstructed into a 300 × 300 × 247 image matrix (voxel size 0.6 × 0.6 × 0.6 mm), using a 3D OSEM algorithm. The reconstructed image resolution was about 1.0 mm.
Before radioligand injection, a CT scan was acquired and used to correct for attenuation. A model-based scatter correction was applied. Male rhesus monkeys were used for all the experiments (see Tables S1 and S2 for monkey age and weight details). The monkey was initially immobilized with ketamine (15 mg/kg, i.v.) and subsequently anesthetized with isoflurane (1.5%) for the entire duration of the PET experiment that day. The monkey was placed supine in the camera. The electrocardiogram, body temperature, heart and respiration rates were measured throughout the experiment. Body temperature was controlled and monitored by a forced-air temperature management unit (Bair Hugger Model 505; Arizant Healthcare Inc.; Eden Prairie, MN, USA).
For each experiment, the monkey received two PET scans on the same day, separated by 3 h, to allow for radioactivity decay of the first radioligand dose over almost 9 half-lives down to a negligible level. Following intravenous administration of no-carrier-added [11C]MeRo25 (237–333 MBq) of high molar activity (low carrier content), a morning scan was acquired at baseline for 2 h, and an afternoon scan was acquired for 90 min with a second injection of radioligand after a drug challenge (Ro 25-6981, FT-146, or BD1407) (see Tables S1 and S2 for radioligand and drug dose details). The challenge drug was administered 15 min before the second radioligand injection. TACs were expressed in SUV units for each volume of interest, defined by a co-registered MRI template, and compared for uptake and washout between different brain regions. Further details on the monkey imaging experiments are provided in Tables S2 and S3.
3.13.2. Radiometabolite-Corrected Arterial Input Function
Blood samples (0.5 to 5.0 mL) were taken throughout each PET experiment from an implanted port in the femoral artery of the monkey at 15-s intervals for the first two minutes, followed by samples at 3, 5, 10, 30, 60, 90, and 120 min. Total radioactivity concentrations in sampled arterial whole blood and plasma were measured in a γ-counter.
Each plasma sample was analyzed with reversed phase radio-HPLC (general method B) to determine the fraction and amount of unmetabolized radioligand. The data were used to construct the radiometabolite-corrected arterial input function for the unchanged radioligand.
3.13.3. Kinetic Modeling
PET images were co-registered to a standardized rhesus monkey MRI template using PMOD software. Thirty-five predefined regions of interest (ROIs) from the monkey brain template were applied to the co-registered PET images to obtain regional TACs. A two-tissue compartmental model (2TCM) was used with the regional TACs and measured arterial input function to calculate the volume of distribution (VT) [34]. To assess the effect of the drug challenge, baseline scans were truncated to 90 min prior to VT calculation to compare with the blocked scan. The total blood volume fraction (Vb) was fixed at 5%.
VT values were then corrected for plasma free fraction (VT/fP) to account for interindividual variation in plasma protein binding and to allow for direct comparison of these output measures across scans and subjects.
To determine the minimum scan duration needed to reliably measure VT and to indirectly assess whether radiometabolites accumulated in the brain, the time stability of VT was examined with the baseline scan by progressively truncating the scan duration from 120 min to 40 min in 10-min decrements and recalculating VT at each step.
4. Conclusions
The experiments with [11C]MeRo25 in a few rats expediently provided initial exploratory and qualitative information to justify further exploration in monkeys. The principal finding of this study in monkeys is that [11C]MeRo25 does not behave as a selective GluN2B PET radioligand. Although MeRo25 was derived from the widely used GluN2B-preferring antagonist Ro 25-6981 and exhibited low nanomolar affinity for GluN2B in vitro, monkey PET studies demonstrated substantial blockade by both GluN2B-and σ1-directed ligands. Together with the affinity data and rat imaging results, these findings indicate that [11C]MeRo25 exhibits mixed GluN2B/σ1 binding in vivo. Because Ro 25-6981 and MeRo25 bind both targets, the blocking studies cannot determine the relative contribution of each receptor population to the PET signal. Nevertheless, they clearly establish that [11C]MeRo25 is unsuitable for selectively measuring GluN2B receptor availability.
The in vivo findings also contrast with previous in vitro autoradiography of rat brain, in which [3H]Ro 25-6981 was reported to show GluN2B-specific binding and no binding in the cerebellum [17]. In this study, [11C]MeRo25 showed high brain uptake in both rats and monkeys, and Ro 25-6981 substantially blocked [11C]MeRo25 uptake in monkey cerebellum. These in vivo observations are difficult to reconcile with the earlier autoradiography findings and underscore the potential for the pharmacological behavior of a ligand in vivo to differ from that inferred from in vitro studies.
More broadly, this study highlights the importance of rigorous pharmacological validation during PET radioligand development. High in vitro affinity and derivation from a well-characterized ligand scaffold are not sufficient to establish imaging specificity under in vivo conditions; appropriately designed blocking studies remain essential for defining the target profile of candidate tracers. Although [11C]MeRo25 proved unsuitable as a selective GluN2B PET radioligand, this negative result helps clarify the in vivo pharmacology of Ro 25-6981-derived compounds and may guide the development and validation of future GluN2B PET radioligands.
Furthermore, this study cautions against the use of Ro 25-6981 as a pharmacological tool where binding to σ1 receptors may be of concern, for example as a challenge agent in PET studies.
Supplementary Materials
The following supporting information can be downloaded at: https://www.mdpi.com/article/10.3390/ph19111713/s1, Figure S1: 1H-NMR spectrum of MeRo25. Figure S2: 13C-NMR spectrum of MeRo25. Figure S3: HPLC analysis of MeRo25. Figure S4: Radiochromatogram for HPLC separation of [11C]MeRo25. Figure S5: Radiochromatogram for HPLC analysis of [11C]MeRo25. Figure S6: Docking of Ro 25-6981 in the GluN1a-GluN2B complex. Figure S7: Docking of MeRo25 in the GluN1a-GluN2B complex. Figure S8: Docking of ifenprodil in the σ1 receptor. Figure S9: Docking of Ro 25-6981 in the σ1 receptor. Figure S10: Docking of MeRo25 in the σ1 receptor. Figure S11: Monkey radiometabolite-corrected arterial input functions. Table S1: Experimental parameters for in vitro and ex vivo rat studies with [11C]MeRo25. Table S2: Radioligand dosing parameters for PET imaging experiments in rats. Table S3: PET imaging conditions and outcomes for baseline scans and preblocking with MeRo25 or FTC-146 in rhesus (Mucaca mulatta) monkeys. Table S4: PET imaging conditions and quantitative outcomes for baseline scans and preblocking with FTC-146 or BD1047 in rhesus (Mucaca mulatta) monkeys.
Author Contributions
Conceptualization, L.C. and V.W.P.; methodology, X.Y., S.S.Z., J.-S.L., L.C., S.W.C., L.N.M., C.L.M., A.J.W., B.A. and Y.L.; validation, L.C., X.Y., S.S.Z., J.-S.L., S.W.C., L.N.M., C.L.M., A.J.W., Y.L. and S.S.Z.; formal analysis, L.C., B.A., S.W.C., L.N.M., C.L.M., Y.L., X.Y., S.S.Z., J.-S.L. and A.J.W.; investigation, X.Y., S.S.Z., J.-S.L., L.C., S.W.C., L.N.M., C.L.M. and A.J.W.; resources, V.W.P. and R.B.I.; data curation, L.C., S.W.C., L.N.M., C.L.M. and A.J.W.; writing—original draft preparation, L.C. and V.W.P.; writing—review and editing, L.C., S.S.Z., V.W.P. and R.B.I.; visualization, X.Y., S.S.Z. and V.W.P.; supervision, V.W.P. and R.B.I.; project administration, V.W.P. and R.B.I.; funding acquisition, V.W.P. and R.B.I. All authors have read and agreed to the published version of the manuscript.
Funding
This research was supported by the Intramural Research Programs of the National Institutes of Health (NIH) (projects: ZIAMH002793 to VWP and ZIAMH002795 to RBI). The contributions of the NIH authors were made as part of their official duties as NIH federal employees and comply with agency policy requirements. They are considered Works of the United States Government. However, the findings and conclusions presented in this paper are those of the authors and do not necessarily reflect the views of the NIH or the U.S. Department of Health and Human Services.
Institutional Review Board Statement
The animal study protocols were approved by the Animal Care and Use Committee (ACUC) of the National Institute of Mental Health: protocol #MIB-02 (monkey, date of approval 18 March 2025); protocol #MIB-03 (rat, date of approval 1 October 2025). All methods were carried out in accordance with the Guide for the Care and Use of Laboratory Animals (https://grants.nih.gov/grants/olaw/guide-for-the-care-and-use-of-laboratory-animals.pdf; accessed 23 October 2026). The study was carried out in compliance with the ARRIVE guidelines.
Informed Consent Statement
Not applicable.
Data Availability Statement
The original contributions presented in this study are included in the article/Supplementary Materials. Further inquiries can be directed to the corresponding authors.
Acknowledgments
We thank Peter Herscovitch (NIH Clinical PET Center) for carbon-11 production.
Conflicts of Interest
The authors declare no conflicts of interest.
Abbreviations
The following abbreviations are used in this manuscript:
| NMDA | N-methyl-D-aspartate |
| PBS | Phosphate-buffered saline |
| PDB | Protein data bank |
| PET | Positron emission tomography |
| ROI | Region of interest |
| RT | Room temperature |
| SUV | Standardized uptake value |
| TAC | Time-activity curve |
| 2TCM | Two-tissue compartmental model |
| TFA | Trifluoroacetic acid |
References
- Zhang, K.; Wen, M.; Nan, X.; Zhao, S.; Li, H.; Ai, Y.; Zhu, H. NMDA receptors in neurodegenerative diseases: Mechanisms and emerging therapeutic strategies. Front. Aging Neurosci. 2025, 17, 1604378. [Google Scholar] [CrossRef] [Scilit] [PubMed]
- Kim, K.; Nan, G.; Kim, H.Y.; Cha, M.; Lee, B.H. Targeting the insular cortex for neuropathic pain modulation: Insights into synaptic and neuronal mechanisms. FASEB J. 2025, 39, e70285. [Google Scholar] [CrossRef] [Scilit] [PubMed]
- Dauvermann, M.R.; Lee, G.; Dawson, N. Glutamatergic regulation of cognition and functional brain connectivity: Insights from pharmacological, genetic and translational schizophrenia research. Br. J. Pharmacol. 2017, 174, 3136–3160. [Google Scholar] [CrossRef] [Scilit] [PubMed]
- Liu, S.; Liu, C.; Xiong, L.; Xie, J.; Huang, C.; Pi, R.; Huang, Z.; Li, L. Icaritin Alleviates Glutamate-Induced Neuronal Damage by Inactivating GluN2B-Containing NMDARs Through the ERK/DAPK1 Pathway. Front. Neurosci. 2021, 15, 525615. [Google Scholar] [CrossRef] [Scilit] [PubMed]
- Chazot, P.L. The NMDA receptor NR2B subunit: A valid therapeutic target for multiple CNS pathologies. Curr. Med. Chem. 2004, 11, 389–396. [Google Scholar] [CrossRef] [Scilit] [PubMed]
- Kassenbrock, A.; Vasdev, N.; Liang, S.H. Selected PET Radioligands for Ion Channel Linked Neuroreceptor Imaging: Focus on GABA, NMDA and nACh Receptors. Curr. Top. Med. Chem. 2016, 16, 1830–1842. [Google Scholar] [CrossRef] [Scilit] [PubMed]
- Fu, H.; Chen, Z.; Josephson, L.; Li, Z.; Liang, S.H. Positron Emission Tomography (PET) Ligand Development for Ionotropic Glutamate Receptors: Challenges and Opportunities for Radiotracer Targeting N-methyl-D-aspartate (NMDA), alpha-Amino-3-hydroxy-5-methyl-4-isoxazolepropionic Acid (AMPA) and Kainate Receptors. J. Med. Chem. 2018, 62, 403–419. [Google Scholar] [CrossRef] [Scilit] [PubMed]
- Erlandsson, K.; Galovic, M. Recent Progress in NMDA Glutamate Receptor Imaging. In Molecular Imaging for Brain Diseases; Sone, D., Ed.; Humana: New York, NY, USA, 2025; Volume 222, pp. 1–20. [Google Scholar] [CrossRef] [Scilit]
- Kim, J.H.; Marton, J.; Ametamey, S.M.; Cumming, P. A Review of Molecular Imaging of Glutamate Receptors. Molecules 2020, 25, 4749. [Google Scholar] [CrossRef] [Scilit] [PubMed]
- Rischka, L.; Vraka, C.; Pichler, V.; Rasul, S.; Nics, L.; Gryglewski, G.; Handschuh, P.; Murgaš, M.; Godbersen, G.M.; Silberbauer, L.R.; et al. First-in-Humans Brain PET Imaging of the GluN2B-Containing N-methyl-d-aspartate Receptor with (R)-11C-Me-NB1. J. Nucl. Med. 2022, 63, 936–941. [Google Scholar] [CrossRef] [Scilit] [PubMed]
- Ahmed, H.; Wallimann, R.; Gisler, L.; Elghazawy, N.H.; Gruber, S.; Keller, C.; Liang, S.H.; Sippl, W.; Haider, A.; Ametamey, S.M. Characterization of (R)- and (S)-[18F]OF-NB1 in Rodents as Positron Emission Tomography Probes for Imaging GluN2B Subunit-Containing N-Methyl-d-Aspartate Receptors. ACS Chem. Neurosci. 2023, 14, 4323–4334. [Google Scholar] [CrossRef] [Scilit] [PubMed]
- Raval, N.R.; Zheng, M.-Q.; Dias, M.; Zeng, T.; Henry, S.; Zhang, H.; Kapinios, M.; Alluri, S.R.; Li, S.; Labaree, D.; et al. First-In-Human Evaluation and Test-Retest Reliability of the GluN2B Radioligand (S)-[18F]OF-NB1. In Proceedings of the Neuroreceptor Mapping Conference, Uppsala, Sweden, 27–30 June 2026. [Google Scholar]
- Monyer, H.; Burnashev, N.; Laurie, D.J.; Sakmann, B.; Seeburg, P.H. Developmental and regional expression in the rat brain and functional properties of four NMDA receptors. Neuron 1994, 12, 529–540. [Google Scholar] [CrossRef] [Scilit] [PubMed]
- Schito, A.M.; Pizzuti, A.; Di Maria, E.; Schenone, A.; Ratti, A.; Defferrari, R.; Bellone, E.; Mancardi, G.L.; Ajmar, F.; Mandich, P. mRNA distribution in adult human brain of GRIN2B, a N-methyl-D-aspartate (NMDA) receptor subunit. Neurosci. Lett. 1997, 239, 49–53. [Google Scholar] [CrossRef] [Scilit] [PubMed]
- Wang, Y.H.; Bosy, T.Z.; Yasuda, R.P.; Grayson, D.R.; Vicini, S.; Pizzorusso, T.; Wolfe, B.B. Characterization of NMDA receptor subunit-specific antibodies: Distribution of NR2A and NR2B receptor subunits in rat brain and ontogenic profile in the cerebellum. J. Neurochem. 1995, 65, 176–183. [Google Scholar] [CrossRef] [Scilit] [PubMed]
- Jin, D.H.; Jung, Y.W.; Ko, B.H.; Moon, I.S. Immunoblot analyses on the differential distribution of NR2A and NR2B subunits in the adult rat brain. Mol. Cells. 1997, 7, 749–754. [Google Scholar] [CrossRef] [Scilit]
- Mutel, V.; Buchy, D.; Klingelschmidt, A.; Messer, J.; Bleuel, Z.; Kemp, J.A.; Richards, J.G. In vitro binding properties in rat brain of [3H]Ro 25-6981, a potent and selective antagonist of NMDA receptors containing NR2B subunits. J. Neurochem. 1998, 70, 2147–2155. [Google Scholar] [CrossRef] [Scilit] [PubMed]
- Ahmed, H.; Gisler, L.; Elghazawy, N.H.; Keller, C.; Sippl, W.; Liang, S.H.; Haider, A.; Ametamey, S.M. Development and Validation of [3H]OF-NB1 for Preclinical Assessment of GluN1/2B Candidate Drugs. Pharmaceuticals 2022, 15, 960. [Google Scholar] [CrossRef] [Scilit] [PubMed]
- James, M.L.; Shen, B.; Zavaleta, C.L.; Nielsen, C.H.; Mesangeau, C.; Vuppala, P.K.; Chan, C.; Avery, B.A.; Fishback, J.A.; Matsumoto, R.R.; et al. New positron emission tomography (PET) radioligand for imaging sigma-1 receptors in living subjects. J. Med. Chem. 2012, 55, 8272–8282. [Google Scholar] [CrossRef] [Scilit] [PubMed]
- Cai, L.; Liow, J.-S.; Morse, C.L.; Telu, S.; Davies, R.; Manly, L.S.; Zoghbi, S.S.; Chin, F.T.; Innis, R.B.; Pike, V.W. Candidate 3-benzazepine-1-ol type GluN2B receptor radioligands (11C-NR2B-Me enantiomers) have high binding in cerebellum but not to sigma1 receptors. EJNMMI Res. 2023, 13, 28. [Google Scholar] [CrossRef] [Scilit] [PubMed]
- Cai, L.; Liow, J.S.; Morse, C.L.; Telu, S.; Davies, R.; Frankland, M.P.; Zoghbi, S.S.; Cheng, K.; Hall, M.D.; Innis, R.B.; et al. Evaluation of 11C-NR2B-SMe and Its Enantiomers as PET Radioligands for Imaging the NR2B Subunit Within the NMDA Receptor Complex in Rats. J. Nucl. Med. 2020, 61, 1212–1220, Erratum in J. Nucl. Med. 2021, 62, 1176. [Google Scholar] [CrossRef] [Scilit] [PubMed]
- Fischer, G.; Mutel, V.; Trube, G.; Malherbe, P.; Kew, J.N.; Mohacsi, E.; Heitz, M.P.; Kemp, J.A. Ro 25-6981, a highly potent and selective blocker of N-methyl-D-aspartate receptors containing the NR2B subunit. Characterization in vitro. J. Pharmacol. Exp. Ther. 1997, 283, 1285–1292. [Google Scholar] [CrossRef] [Scilit]
- de Costa, B.R.; Radesca, L.; Di Paolo, L.; Bowen, W.D. Synthesis, characterization, and biological evaluation of a novel class of N-(arylethyl)-N-alkyl-2-(1-pyrrolidinyl)ethylamines: Structural requirements and binding affinity at the sigma receptor. J. Med. Chem. 1992, 35, 38–47. [Google Scholar] [CrossRef] [Scilit] [PubMed]
- Schoellerman, J.; Lord, B.; Bhattacharya, A.; Stenne, B.; Wall, J.L.; Rech, J.; Letavic, M.; Bonaventure, P.; Balana, B. Characterization of tritiated JNJ-GluN2B-5 (3-[3H] 1-(azetidin-1-yl)-2-(6-(4-fluoro-3-methyl-phenyl)pyrrolo[3,2-b]pyridin-1-yl)ethanone), a high affinity GluN2B radioligand with selectivity over sigma receptors. J. Neurochem. 2024, 68, 2654–2670. [Google Scholar] [CrossRef] [Scilit] [PubMed]
- Jana, S.; Nerella, S.G.; Samanta, S.S.; Liow, J.-S.; Raso, I.; Montero-Santamaria, J.A.; Zoghbi, S.S.; Wu, S.; Innis, R.B.; Telu, S.; et al. Synthesis and Preclinical Evaluation of [11C]GNE-0877 as a Potential PET Radioligand for Imaging Brain Leucine-Rich Repeat Kinase 2. ACS Omega 2026, 11, 28923–28941. [Google Scholar] [CrossRef] [Scilit] [PubMed]
- Briard, E.; Zoghbi, S.S.; Imaizumi, M.; Gourley, J.P.; Shetty, H.U.; Hong, J.; Cropley, V.; Fujita, M.; Innis, R.B.; Pike, V.W. Synthesis and evaluation in monkey of two sensitive 11C-labeled aryloxyanilide ligands for imaging brain peripheral benzodiazepine receptors in vivo. J. Med. Chem. 2008, 51, 17–30. [Google Scholar] [CrossRef] [Scilit] [PubMed]
- Zoghbi, S.S.; Baldwin, R.M.; Seibyl, J.P.; Charney, D.S.; Innis, R.B. A radiotracer technique for determining apparent pKa of receptor-binding ligands. J. Label. Compd. Radiopharm. 1997, 40, 136–138. [Google Scholar] [CrossRef] [Scilit]
- Pike, V.W. Considerations in the Development of Reversibly Binding PET Radioligands for Brain Imaging. Curr. Med. Chem. 2016, 23, 1818–1869. [Google Scholar] [CrossRef] [Scilit] [PubMed]
- Zoghbi, S.S.; Anderson, K.B.; Jenko, K.J.; Luckenbaugh, D.A.; Innis, R.B.; Pike, V.W. On quantitative relationships between drug-like compound lipophilicity and plasma free fraction in monkey and human. J. Pharm. Sci. 2012, 101, 1028–1039. [Google Scholar] [CrossRef] [Scilit] [PubMed]
- Cai, L.; Millard, L.N.; Costner, S.W.; Wang, A.; Liu, Y.; Pike, V.W. A Study of 3-Substituted 7-Methoxy-2,3,4,5-tetrahydro-1H-benzo[d]azepin-1-ols Leading to Candidate PET Radioligands for Imaging Brain GluN2B: Design, Synthesis, and Structure–Activity Relationships. Molecules 2026, 31, 1541. [Google Scholar] [CrossRef] [Scilit] [PubMed]
- Cheng, Y.; Prusoff, W.H. Relationship between Inhibition Constant (K1) and Concentration of Inhibitor Which Causes 50 Per Cent Inhibition (I50) of an Enzymatic-Reaction. Biochem. Pharmacol. 1973, 22, 3099–3108. [Google Scholar] [CrossRef] [Scilit] [PubMed]
- Weber, D.; Eckerman, K.; Dillman, L.; Ryman, J. MIRD: Radionuclide Data and Decay Schemes; The Society of Nuclear Medicine: New York, NY, USA, 1989. [Google Scholar]
- Gandelman, M.S.; Baldwin, R.M.; Zoghbi, S.S.; Zea-Ponce, Y.; Innis, R.B. Evaluation of ultrafiltration for the free-fraction determination of single photon emission computed tomography (SPECT) radiotracers: ß-CIT, IBF, and iomazenil. J. Pharm. Sci. 1994, 83, 1014–1019. [Google Scholar] [CrossRef] [Scilit] [PubMed]
- Delforge, J.; Fujita, M.; Gjedde, A.; Gunn, R.N.; Holden, J.; Houle, S.; Huang, S.C.; Ichise, M.; Iida, H.; Ito, H.; et al. Consensus nomenclature for in vivo imaging of reversibly binding radioligands. J. Cereb. Blood Flow Metab. 2007, 27, 1533–1539. [Google Scholar] [CrossRef] [Scilit] [PubMed]

Disclaimer/Publisher’s Note: The statements, opinions and data contained in all publications are solely those of the individual author(s) and contributor(s) and not of MDPI and/or the editor(s). MDPI and/or the editor(s) disclaim responsibility for any injury to people or property resulting from any ideas, methods, instructions or products referred to in the content. |
© 2026 by the authors. Licensee MDPI, Basel, Switzerland. This article is an open access article distributed under the terms and conditions of the Creative Commons Attribution (CC BY) license.