


Highlights
What are the main findings?
- Theta-band power increased significantly during the simulated flight phases, with the highest values observed during the most cognitively demanding scenario (SIM2).
- Post-task theta power remained significantly elevated compared with the initial baseline, while its correlation with subjective mental workload showed substantial inter-individual variability.
What are the implications of the main findings?
- Theta-band EEG activity may provide an objective measure of changes in cognitive workload during high-fidelity flight simulation.
- The variability between EEG and NASA-TLX responses supports the use of complementary physiological and subjective measures for a more comprehensive assessment of pilot workload.
Abstract
Aviation operates within a highly cognitively demanding environment, where assessing pilot workload is essential for preventing errors and accidents associated with excessive or insufficient cognitive demand. This study presents a neurophysiological experiment designed to assess pilot brain activity using electroencephalography (EEG) in a high-fidelity Pilatus PC-21 flight simulator. The study focuses on the theta frequency band (4–8 Hz), given its association with mental effort and cognitive engagement. EEG signals were recorded from eight scalp locations in ten pilots during baseline conditions and three flight simulation modules with different levels of task difficulty. Subjective workload was assessed using the NASA-TLX questionnaire, completed after each simulation phase. The results showed higher theta power during the most cognitively demanding flight phase, particularly across frontal, temporal, and occipital regions. NASA-TLX results similarly indicated increased mental demand, effort, and frustration in the scenario associated with the highest cognitive workload. However, correlation analysis revealed a weak and inconsistent relationship between subjective workload ratings and EEG-derived theta measures across participants, with no clear or statistically significant overall association at the group level. These preliminary results indicate that scalp-recorded theta activity is sensitive to changes in task difficulty during flight simulation. However, given the exploratory nature of the study, the absence of flight-performance metrics, and the lack of strong correlation with subjective ratings, theta-band modulation should be interpreted as an index of task demand rather than a fully consolidated operational workload estimator.
1. Introduction
In the field of aviation, pilots routinely face highly demanding environments that require a high level of mental workload and concentration. Cognitive or mental workload is defined as the combination of task demands and the operator’s capacity to respond [1]. An imbalance in this load, whether due to excess or deficiency, can have critical consequences. When cognitive effort approaches or exceeds the pilot’s capacity, performance may deteriorate, increasing the risk of errors or accidents. At the other extreme, a workload that is too low can also be detrimental, as it may lead to boredom and a decline in vigilance [2]. Therefore, maintaining an optimal workload is an essential factor in ensuring both operational efficiency and safety in the cockpit. Similarly, the study of workload in land vehicle drivers is of particular importance, as safety factors, cognitive demands and attentional requirements analogous to those present in the aviation sector are involved [3,4].
Traditionally, a pilot’s workload has been assessed using subjective rating instruments, such as the NASA Task Load Index (NASA-TLX) [5]. Although this measure allows pilots to reflect on various dimensions of workload (mental demand, physical demand, etc.) after a mission or simulation, it has significant limitations, as it is retrospective (collected after the tasks have been completed) and cannot capture the rapid fluctuations in workload during flight. Furthermore, as it relies on the pilot’s self-assessment, the results may be biased or inaccurate [6].
To complement subjective ratings, some authors have focused on measuring physiological changes in pilots [7] or drivers [8] whilst workload is manipulated during simulated flights or driving sessions. By measuring various physiological parameters such as heart rate or eye-tracking metrics (blink rate or pupillometry), it is possible to reliably distinguish between conditions that define high and low workload [9]. However, to date, the use of these parameters has a significant limitation relating to their feasibility for real-time measurement, due to the lack of sensors capable of operating reliably in aviation operational environments [10,11].
Neurophysiological measures, particularly electroencephalography (EEG), offer significant promise for evaluating cognitive states [12]. EEG provides a non-invasive recording of brain electrical activity via scalp electrodes, characterized by oscillations across various frequencies that reflect synchronized neuronal activity and map onto specific cognitive processes [13]. Although the characteristic bands in awake adults span from delta to gamma, theta (4–8 Hz), alpha (8–13 Hz), and beta (13–30 Hz) are of primary relevance during task performance due to their marked modulation in response to mental effort, attention, and arousal [14]. However, these three frequency bands reflect partially distinct neurophysiological mechanisms: while alpha activity is primarily associated with attentional allocation, cortical inhibition, and sensory processing, and beta activity relates to sensorimotor and cortical activation, frontal midline theta (fmθ) activity is specifically linked to cognitive control, executive functions, task monitoring, and working memory demands. This fmθ rhythm reflects the recruitment of frontal networks, including the anterior cingulate cortex, under high cognitive demand. Consequently, given that the present study focuses on the cognitive processing demands associated with flight simulation—specifically navigation, task monitoring, and decision-making—theta-band power was selected a priori as the primary neurophysiological index of cognitive workload.
The EEG allows brain activity to be recorded directly with high temporal resolution; it is sensitive to variations in cognitive state and can be used non-invasively even in operational settings [15]. In this context, Taheri et al. [16] recorded EEG signals under real flight conditions in order to distinguish periods associated with different levels of workload during piloting tasks.
Various studies have shown that theta oscillatory activity in the EEG is directly involved in higher-order cognitive functions, such as working memory, executive control and focused attention [17,18]. In line with these findings, increases in theta power constitute a robust marker of greater cognitive demands [19].
The variation in theta power as a function of mental workload has been studied tactical simulation environments. Specifically, in 2020, Díaz-Piedra et al. [20] examined theta activity as an indicator of workload during a tactical driving simulation. The results of this study showed that total power in the Theta band was significantly higher in command scenarios involving greater task complexity. The increase in theta activity was evident across various cortical regions, including the frontal, temporal and occipital areas, and was associated with a decline in performance (a higher number of driving errors) and a greater subjective perception of workload, as measured by the NASA-TLX. These results reinforce previous findings in civilian driving studies [21] and suggest that theta-band activity acts as a sensitive index of task demand even in trained and physically fit personnel. It is worth noting that, in the same study, Díaz-Piedra et al. investigated whether the increase in theta activity could be attributed to accumulated mental fatigue. When comparing EEG readings in baseline states before and after the driving simulation, they found some evidence that fatigue might contribute to this increase (the authors assessed whether Theta increased in the post-task, given that fatigue can elevate Theta activity); however, they concluded that the main factor responsible for the changes in Theta was the immediate task demand imposed by the various scenarios.
Within the aviation context, EEG monitoring has established itself as a benchmark tool for the objective assessment of pilots’ neurophysiological state. This technique enables the non-invasive characterisation of brain activity associated with various cognitive processes, providing quantifiable indicators of variables such as attention, fatigue and mental workload. Studies such as that carried out by Smith et al. [22] have demonstrated the ability of EEG signals to quantify workload during flight simulation tasks, enabling a reliable distinction to be made between conditions of low and high cognitive demand. In 2024, Zhao et al. [23] investigated the modulation of the theta band whilst performing tasks in a flight simulator. The experiment involved 24 subjects with no previous experience of flying aircraft, who were monitored via EEG and other physiological variables whilst performing supervised tasks. The results showed significant decreases in theta power in the frontal regions of the scalp during the most basic flight tasks. The authors interpreted these data as indicating that high theta power in frontal regions is an indicator of cognitive load and control. Therefore, a decrease in theta activity in these regions suggests a lower demand for cognitive control associated with less complex tasks. These results are consistent with the findings of previous work by Borghini et al. [24], which included a correlation between this power and the pilot’s heart rate and subjective pilot reports.
Recently, Li et al. [25] examined the effects of high mental workload induced by multitasking in a simulated flight environment, using variations in EEG signal power. The study involved 36 participants, and the workload was manipulated via the number of subtasks performed simultaneously. In line with previous studies, the results confirm that high mental workload correlates with an increase in theta-band power and a decrease in alpha-band power [26].
These findings have driven the development of EEG-based workload indices. These advances highlight the great potential of the EEG as a real-time physiological biomarker of a pilot’s cognitive state. This facilitates the implementation of adaptive systems that could generate proactive alerts or provide dynamic assistance to the operator when a state of cognitive overload or underload is identified.
However, the controlled manipulation of cognitive workload in applied environments, such as the flight deck or flight simulators, poses a considerable methodological challenge. This difficulty stems from the multifactorial nature of the workload, which is determined by the interaction of numerous operational, environmental and human factors that can simultaneously influence its level and temporal evolution. These factors can be grouped into two broad categories: those associated with the individual’s intrinsic characteristics and those arising from the operator’s interaction with the demands and characteristics of the task. The former include relatively stable attributes, such as cognitive abilities, prior experience or level of training, whilst the latter are related to the specific requirements of the activity, such as its complexity, duration, information load and time constraints [10]. For example, various studies conducted in the field of driving have shown that individuals with greater working memory capacity—an intrinsic characteristic of the operator—experience lower levels of mental workload whilst performing driving tasks compared with those who have lower cognitive capacity [27,28].
In terms of the operator’s experience, in aviation environments it is particularly important to distinguish between experience accumulated through flight hours and that acquired through specific training programmes which include, amongst other things, the management of emergency situations or the execution of complex manoeuvres. This hypothesis finds significant empirical support in the 2026 study by De Voogt et al. [29], which found that experience accumulated solely through the total number of flight hours is not a statistically significant predictor of operational success or safety in rotary-wing missions. In contrast, the results showed that experience specific to the operational context, as well as training focused on specific tasks, plays a decisive role in the correct execution of critical manoeuvres. These findings suggest that the quality and relevance of the experience gained may be more influential than the mere accumulation of flight hours when it comes to ensuring safe and effective performance.
There is a third group of factors that may influence the cognitive demands of tasks, namely those relating to environmental contexts. Thus, Armougum et al. [30] suggest that whilst, generally speaking, information processing is cognitively less demanding for expert personnel—due to their high level of prior knowledge and the considerable number of mental schemas they possess beforehand—an increase in the complexity of information in sub-optimal contexts could lead to an expertise reversal effect [31].
In this context, it is of particular interest to have objective indicators that enable the assessment of how mental workload varies in highly complex operational scenarios. To this end, the present study aims to contribute to the advancement of this line of research through the quantitative assessment of EEG indicators related to mental workload in a cohort of young aviation students. Specifically, patterns of brain activity have been analysed both under baseline conditions and whilst performing immersive tasks in a high-fidelity flight simulator, with the aim of characterising the neurophysiological variations associated with different levels of cognitive demand.
Theta-band power has been consistently associated with mental workload, manifesting predominantly in the frontal cortical areas [20,32]. Building on this approach, the main objective of the study is to characterise the properties of theta band power, quantifying the changes it undergoes during the transition between different baseline states and whilst performing flight tasks in a Pilatus PC-21 simulator. In addition, a secondary objective is to evaluate the validity of theta band activity as an EEG indicator through bivariate correlation with the subjective workload ratings reported by the subjects, using the NASA-TLX measurement questionnaire.
To fulfil the research objectives, three fundamental hypotheses are established. Firstly, it is hypothesised that there are significant differences in theta-band power during the simulated flight phases compared with baseline states. Secondly, it is hypothesised that post-flight baseline states (BOE2) will exhibit an increase in theta power compared with pre-task baselines, reflecting persistent neurocognitive effects (such as fatigue or residual task engagement) following demanding simulation phases. Finally, a positive correlation is suggested between theta band power and self-reported mental workload, as assessed using the dimensions of the NASA-TLX instrument.
2. Materials and Methods
2.1. Ethical Approval
The study and its experimental protocol received ethical approval from the Ethics Committee of the Polytechnic University of Cartagena (Favourable report CE25-009-SEFYCU 3603674).
The collection of medical data was carried out in accordance with the ethical and legal principles set out in the Declaration of Helsinki and the applicable legislation in force. Data processing was carried out with the participants’ informed, free and explicit consent, in accordance with ethical protocols. Full voluntariness was guaranteed, with no academic consequences for refusal, and participants were provided with detailed information regarding the aims of the study and their right to withdraw at any time.
2.2. Subjects
This study included an initial sample of 10 participants, all of whom were male student pilots in their fourth academic year at the Air and Space General Academy in San Javier (Murcia, Spain). The subjects were aged between 21 and 23 and had between 50 and 100 h of flying experience, placing them at an intermediate level of proficiency within their training programme.
All subjects were in good general health, in excellent physical condition and had no history of neurological disorders, brain damage, visual impairments or learning difficulties. Furthermore, none of the participants was undergoing long-term pharmacological treatment at the time of the study.
During the data collection phase, the records corresponding to the subject identified as SJ2 were excluded due to a loss of signal continuity. Consequently, the final cohort for statistical analysis consisted of 9 highly homogeneous subjects.
2.3. Pilatus PC-21 Simulator
Training in the field of aviation is based on the creation of highly complex controlled environments, frequently through the use of simulators, which enable operators to prepare for situations that are highly demanding both cognitively and emotionally, and which are difficult or impossible to replicate under real-world conditions. In this study, signal acquisition was carried out whilst using a Pilatus PC-21 flight simulator within the Pilatus PC-21 Ground-Based Training System (GBTS), running Pilatus’s proprietary avionics and simulation software (E.27 configuration; exact internal version number is restricted). This platform features a fully replicated cockpit environment that includes multifunction displays, an integrated flight management system, an inertial navigation system, a head-up display and a cockpit interface system that faithfully replicates the design and functionality of the actual aircraft.
2.4. Experimental Protocol
Two days prior to EEG signal acquisition, the subjects completed forms regarding personal details, health screening and informed consent. On the day of the experiment, participants completed the Stanford Sleepiness Scale (SSS) questionnaire, a self-report instrument designed to assess the subjective level of sleepiness, ranging from alertness to intense drowsiness [33].
Before entering the simulator, each participant was given a personalised explanation of the study’s objectives and the experimental procedure, in order to ensure a proper understanding of the tasks and to guarantee compliance with the ethical principles of informed participation.
2.4.1. Sensor Layout
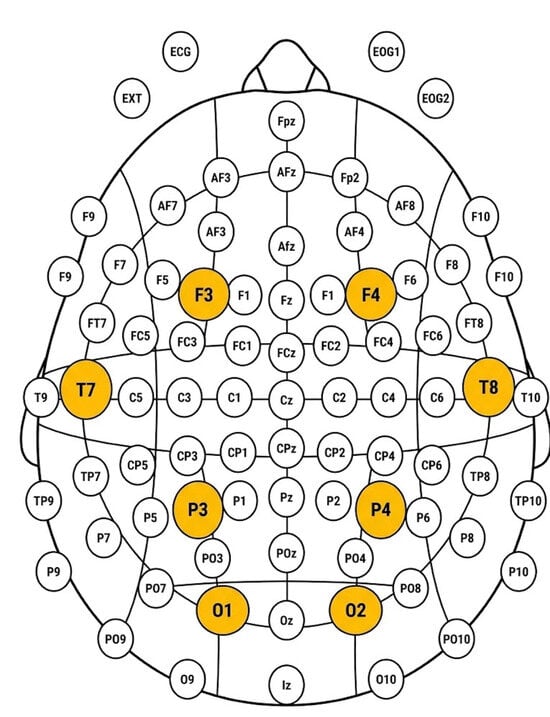
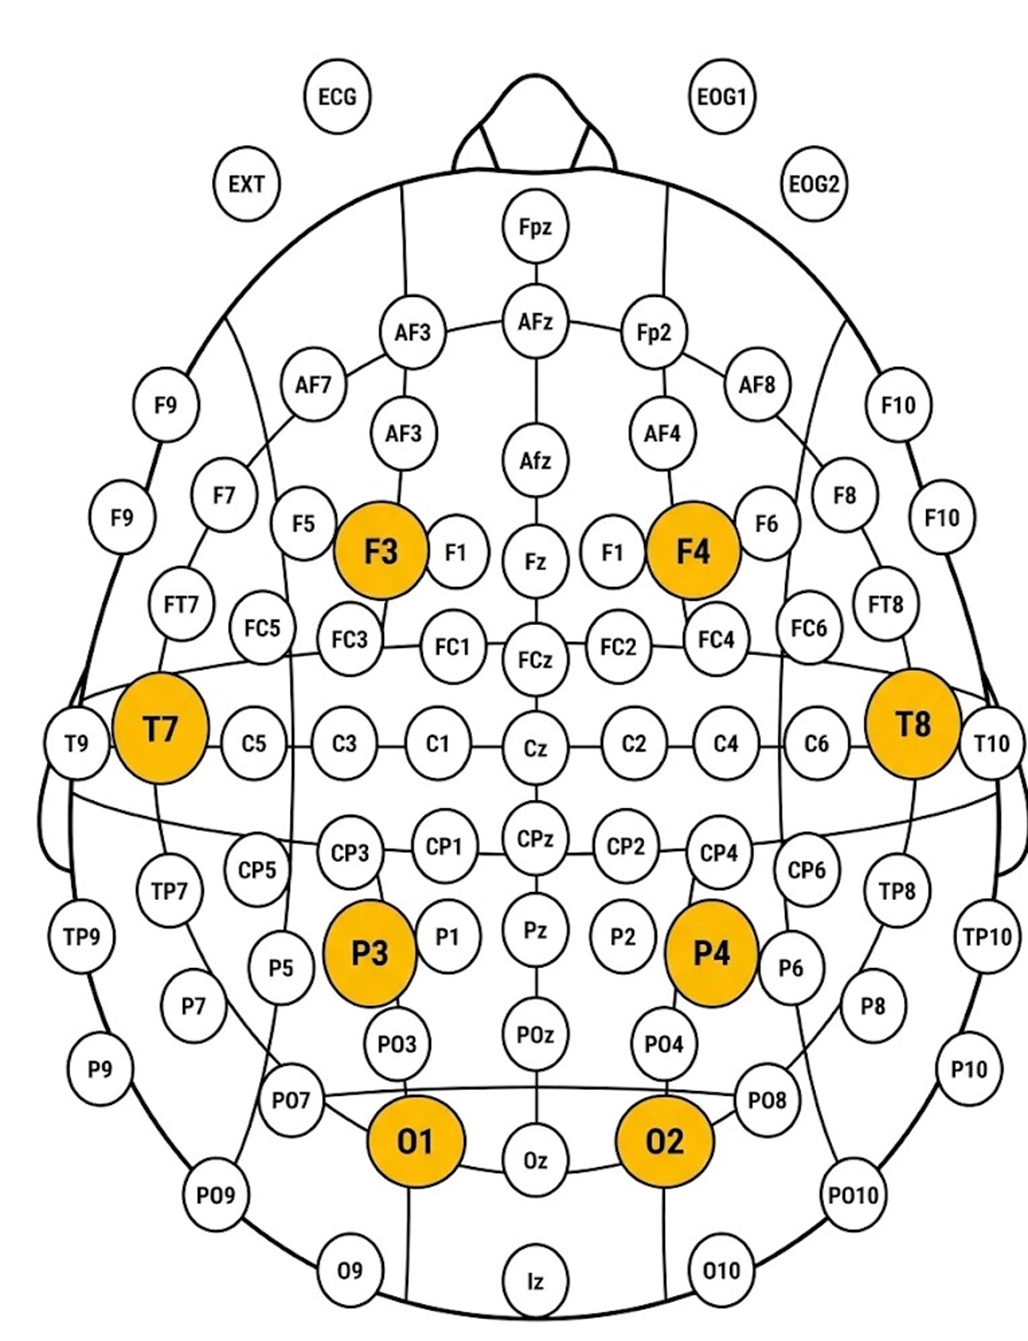
The spatial arrangement of the electrodes on the scalp is a critical aspect of the experimental design. The electrode configuration was selected based on the functional relevance of the cortical regions involved in processing cognitive load, prioritising those areas related to sustained attention, executive control and the monitoring of mental effort, in accordance with the existing neurophysiological literature: F3, F4, O1, O2, P3, P4, T7 and T8 (Figure 1). The reference electrode was placed at Cz, whilst the ground electrode was placed at Fz. Wet electrodes with conductive gel were used for signal acquisition, with the aim of minimising noise and improving the signal-to-noise ratio, thereby ensuring the quality of the electroencephalographic recordings. The functional rationale for each electrode is summarised below:
Figure 1.
Configuration of the eight-channel setup on the Enobio 8 system. The coloured electrodes indicate the cortical positions selected for recording cognitive load during the experimental protocol.
- F3, F4 (frontal): situated over the frontal cortex, these are sensitive to activity in the frontal lobe associated with executive function, attention and theta activity in the midline frontal region. They constitute a key indicator of cognitive workload.
- P3, P4 (parietal): located on the parietal cortex, these are relevant to visuospatial processing, sensorimotor integration and the allocation of attention.
- O1, O2 (occipital): located over the visual cortex, their main purpose is to capture the occipital alpha and beta rhythms and their changes, which are sensitive to general arousal and visual engagement. They help to quantify differences between baseline states with eyes closed and open, and changes in theta activity during active flight.
- T7, T8 (temporal): located over the temporal lobe, involved in auditory processing and memory. These were included to enrich the dataset and allow for broader exploratory analyses.
2.4.2. Data Recording Phases
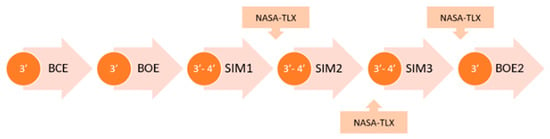
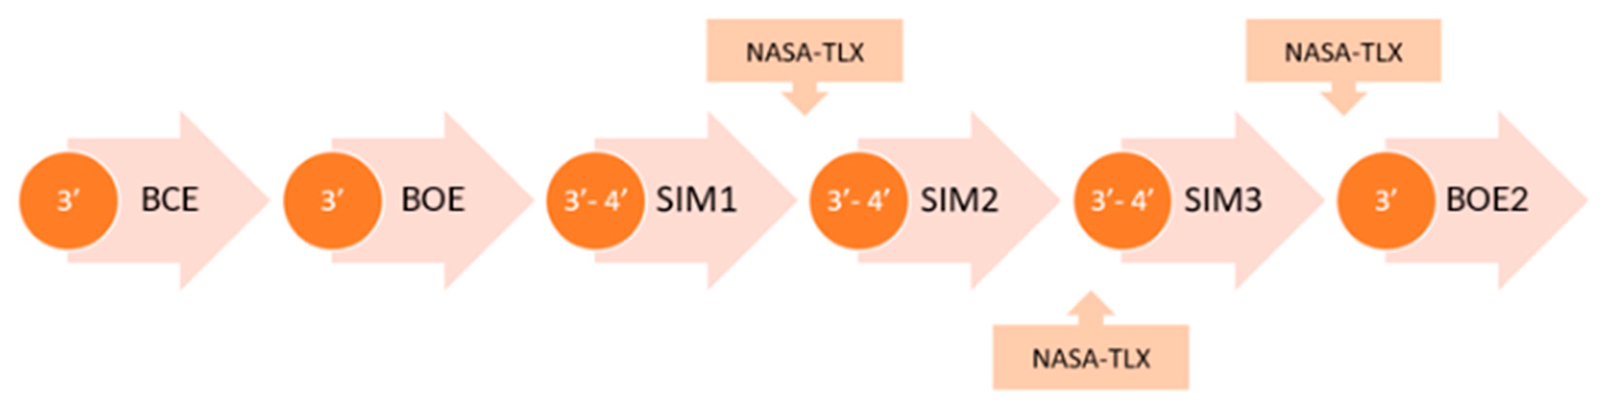
Signal acquisition was carried out using the ENOBIO 8 device (Neurolectrics Barcelona SLU, Barcelona, Spain), in a single session lasting approximately 1 h per subject, divided into six phases of 3–4 min each. The phases were designed to induce a progressive increase in cognitive load, followed by a recovery period (Figure 2). EEG signals were recorded continuously throughout the session:
Figure 2.
Diagram of the experimental protocol, showing the sequential phases of the study, including baseline conditions, flight tasks and subjective assessment intervals.
- Baseline Closed Eyes (BCE): the subject remains seated in the simulator with their eyes closed and without any mental or physical activity, to establish a baseline in a state of minimal cognitive activity. Duration: 3 min.
- Baseline Open Eyes (BOE): under conditions identical to those of the BCE phase, but with the eyes open. Duration: 3 min.
- Take-off (SIM1): standard take-off procedure following the routine flight protocol. This phase marks the start of motor planning, procedural execution and situational awareness. Duration: between 3 and 4 min.
- Difficult Flight Scenario (SIM2): This is a demanding situation designed to simulate cognitively challenging flight conditions; navigation in severe weather, emergency system failures, execution of complex flight manoeuvres, etc. This phase is intended to induce the peak cognitive workload and mental stress within the session. Duration: between 3 and 4 min.
- Landing (SIM3): a standard sequence of runway approach and landing. Although this phase is procedural and routine for trained pilots, it requires sustained attention and fine motor control. Duration: between 3 and 4 min.
- Post-Task Baseline with Open Eyes (BOE2): This phase is used to assess residual changes in brain activity following the tasks and to detect any persistent effects of cognitive fatigue or arousal resulting from the preceding flight tasks. Duration: 3 min.
It should be noted that these phases were not strictly synchronised across participants, nor were they assigned predefined or fixed durations. Instead, the flight instructor determined the timing of each phase at their discretion, depending on the progression of the simulation session and each participant’s performance.
No external interruptions were permitted, and visual and auditory stimuli were standardised. At the end of each flight simulation phase, the subjects completed the NASA-TLX questionnaire.
2.5. EEG Signal Recording and Processing
The free NICv2 (Neuroelectrics Instrument Controller, version 2) software interface was used to acquire electroencephalographic data, which is compatible with the Neuroelectrics© ENOBIO 8 device, which was used to record EEG activity. The sampling rate used for EEG signal acquisition was 500 Hz. The software allowed for the insertion of event markers in real time to segment the EEG signals according to the different baseline states and phases of the simulated flight. During recording, the impedance and connectivity of all electrodes were checked to ensure the quality of the acquired signal. At the end of each experimental session, the raw electrophysiological data were exported in .easy format and structured using Microsoft Excel solely for file format transfer and data import into MATLAB R2024b, where all signal processing and cleaning were performed.
To isolate neural activity and mitigate contamination from non-physiological artifacts (e.g., power grid interference) and physiological artifacts (e.g., muscle movements), a multi-stage offline processing workflow was implemented in MATLAB [34,35]:
Filtering: A zero-phase 4th-order Butterworth band-pass filter between 2 Hz and 40 Hz was applied across the entire dataset to eliminate low-frequency baseline drifts and high-frequency electromyographic (EMG) noise [34]. Additionally, a 50 Hz notch filter was used to suppress mains powerline interference [35].
Continuous EEG signals were preprocessed using a zero-phase fourth-order Butterworth band-pass filter between 2 and 40 Hz (via MATLAB’s filtfilt), followed by a 50 Hz notch filter to eliminate residual powerline noise from simulator equipment. The filtered continuous signals were then segmented into fixed, non-overlapping 2-s epochs in accordance with standard workload spectral analysis protocols [20,22].
Quality control criteria were applied to each segment to identify artifacts; epochs with maximum absolute amplitude exceeding extreme power values exceeding negative power values, or flatline/discontinuity intervals were flagged as corrupt. Valid epochs were used to calculate absolute bandpower ( in the theta (4–8 Hz) and alpha (8–12 Hz) frequency bands using MATLAB’s bandpower function.
Artifact Correction: Flagged transient artifacts were corrected using localized linear interpolation across adjacent temporal samples. Severe, unrecoverable signal disruptions led to complete exclusion of the affected dataset (as detailed in Section 2.2 for participant SJ2).
Finally, spectral power within the theta frequency band (4–8 Hz) was extracted for each 2-s epoch using a 4th-order Butterworth band-pass filter, calculated as the squared amplitude of the filtered signal. The resulting theta power values were concatenated to compute the overall mean theta power per channel and phase for subsequent spatial and temporal comparisons.
2.6. Subjective Assessment of Workload (NASA-TLX)
After each active flight phase (SIM1, SIM2, SIM3), the subjects completed a NASA-TLX questionnaire assessing perceived workload across six dimensions: mental demand, physical demand, performance, effort, temporal demand and frustration [6]. The rating scale ranges from 0 to 20, with higher values indicating a greater workload. These questionnaires were collected for subsequent analysis.
3. Results
3.1. Theta Power Results
In order to investigate the association between theta band power and mental workload, the average theta power for each subject was calculated for each phase of the experiment, taking into account all electrode locations.
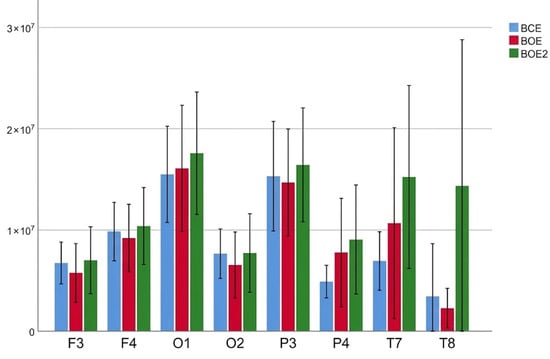
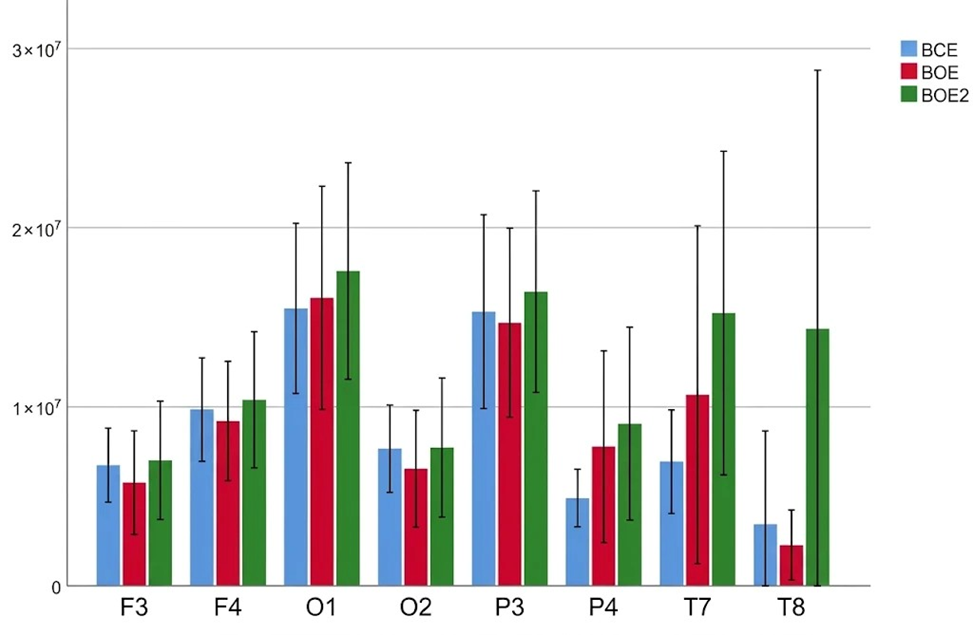
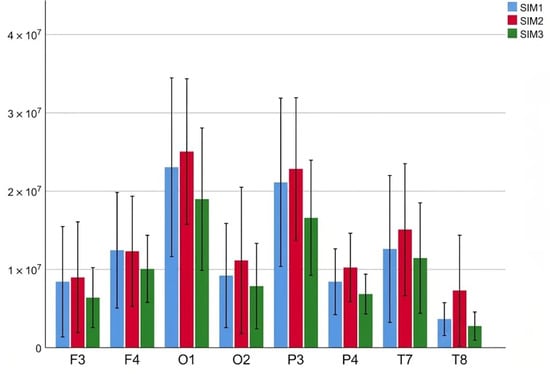
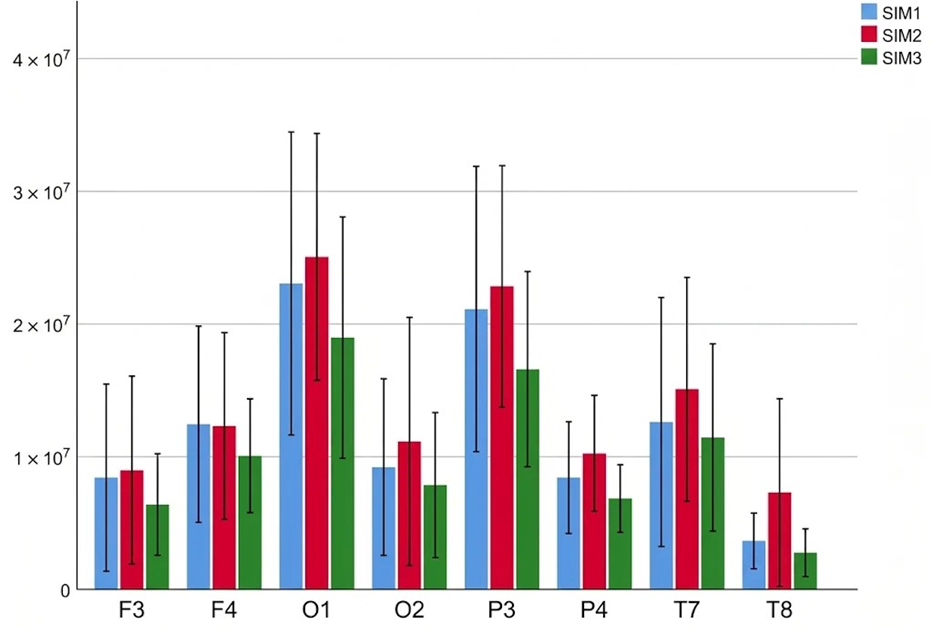
Figure 3 shows the mean theta-band power levels (µV2/Hz) recorded at eight electrodes (F3, F4, O1, O2, P3, P4, T7, and T8) during the baseline states preceding the BCE (blue) and BOE (red) phases and during the BOE2 (green) post-task recovery state. The error bars represent the 95% confidence intervals for each baseline condition. Figure 4 shows the mean power levels in the theta band (μV2/Hz) across the three flight simulation phases (SIM1, SIM2 and SIM3) for all the electrodes analysed.
Figure 3.
Mean power in the theta band (μV2) recorded at each electrode during the three baseline states (BCE, BOE and BOE2) for the sample analysed (n = 9).
Figure 4.
Mean power of the theta band (μV2) recorded at each electrode during the three simulated flight phases (SIM1, SIM2 and SIM3) for the sample analysed (n = 9).
In order to test the assumption of normality for the theta power distribution variable across the different phases, the Shapiro–Wilk test—which is suitable for small sample sizes—was applied. The results showed that none of the distributions for the six phases analysed followed a normal distribution (p < 0.05). Specifically, the following values were obtained: BCE (W = 0.930; p = 0.001), BOE (W = 0.829; p < 0.001), SIM1 (W = 0.770; p < 0.001), SIM2 (W = 0.847; p < 0.001), SIM3 (W = 0.826; p < 0.001) and BOE2 (W = 0.890; p < 0.001). As the assumption of normality was not met, it was decided to use non-parametric statistical procedures.
The initial analysis comprised 72 repeated-measurement series, corresponding to the eight EEG electrodes recorded from each of the nine participants across the six experimental phases. To address the potential dependence between electrode measurements within the same participant, a second analysis was performed using participant-level data. For this purpose, theta power was averaged across the eight electrodes for each participant and experimental phase, yielding nine independent participant-level observations per phase. The Friedman test was subsequently applied to assess differences in theta power across the six experimental phases. The results confirmed statistically significant differences between phases (χ2(5) = 38.41, p < 0.001), demonstrating that the observed phase-related variations remained significant when the participant, rather than the individual electrode, was considered the experimental unit.
In order to identify specifically between which phases the observed differences occurred, post hoc pairwise comparisons were carried out using the Wilcoxon signed-rank test for related samples. The Bonferroni correction was applied to adjust the significance level and thus control for the increase in Type I error, ensuring that only truly robust differences are considered significant. In particular, the differences between the baseline states (BCE, BOE and BOE2) and between the different simulation phases (SIM1, SIM2 and SIM3) were analysed separately, enabling the identification of the specific points at which statistically significant changes occurred.
- Post hoc test: baseline states BCE–BOE
No statistically significant differences were found between the two measurements (asymptotic significance = 0.565), a value above the critical alpha level of 0.05. The null hypothesis is therefore retained: no differences between the distributions of BCE and BOE were detected.
- Post hoc test: baseline BOE–BOE2
Between BOE and BOE2, by contrast, the differences were highly significant (asymptotic significance p < 0.001), well below the critical threshold of 0.05. The null hypothesis is rejected, indicating that theta power during BOE2 differs significantly from that recorded during the initial BOE condition.
- Post hoc test for simulation phases SIM1–SIM2
A significant difference also emerged between SIM1 and SIM2 (asymptotic significance = 0.001 < 0.05), leading to rejection of the null hypothesis. The behaviour of the indicator therefore changes significantly as the task transitions from SIM1 to SIM2.
- Post hoc test for simulation phases SIM1–SIM3
Comparing SIM1 with SIM3 yielded an even stronger effect (asymptotic significance p < 0.001), again below the 0.05 threshold. Rejecting the null hypothesis here confirms that theta power in SIM3 differs markedly from that observed in SIM1.
- Post hoc test for simulation phases SIM2–SIM3
Finally, SIM2 and SIM3 differ significantly from one another as well (asymptotic significance p < 0.001, below the critical alpha threshold). Rejection of the null hypothesis confirms a statistically significant change in theta power between these two simulation phases.
3.2. Analysis of Subjective Assessment of Workload (NASA-TLX)
Table 1 presents the average scores obtained for each of the six dimensions of the NASA-TLX questionnaire throughout the three simulated flight phases (SIM1, SIM2 and SIM3) for the 9 subjects.
Table 1.
Mean values of the NASA-TLX questionnaire dimensions (n = 9).
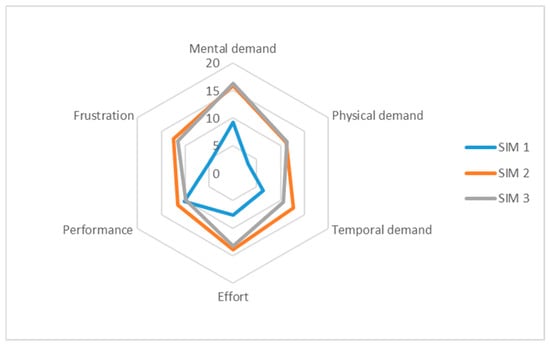
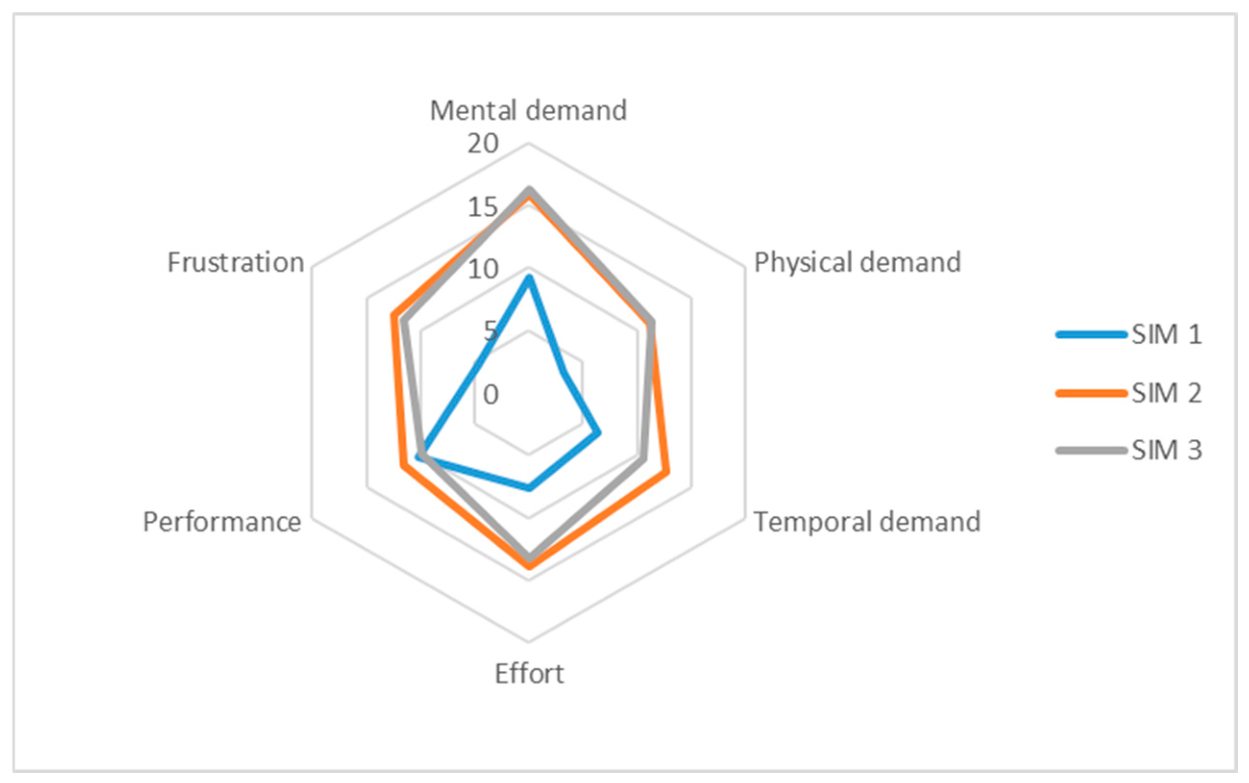
Overall, the analysis of the NASA-TLX results indicates that the SIM 2 and SIM 3 simulations imposed a higher subjective workload compared with SIM 1, with SIM 2 exhibiting the highest values across most evaluated dimensions. As expected, SIM 1 recorded the lowest scores in all dimensions—with the exception of Performance, which remained relatively stable across conditions (see Figure 5).
Figure 5.
Multidimensional profile of perceived workload (n = 9). The radial graph illustrates the average values obtained in the six dimensions of the NASA-TLX questionnaire for each of the simulation phases.
3.3. Correlation Between Theta Activity and Subjective Workload Ratings
The association between electroencephalogram (EEG) theta power and perceived mental demand, assessed using the Mental Demand dimension of the NASA-TLX questionnaire, was analyzed using Spearman’s rank correlation coefficient. This method was chosen for its suitability in evaluating monotonic associations without requiring a bivariate normal distribution, as well as its applicability to variables with non-normal distributions or those susceptible to outliers [36,37]. The coefficients were interpreted according to their magnitude and direction, along with their corresponding statistical significance values. Correlations were calculated separately for each electrode and simulation phase.
The Spearman correlation coefficient data shown in Table 2 did not reveal statistically significant associations between the NASA-TLX mental demand score and the corresponding theta power for the same simulation phase in any of the cases. In simulation task SIM1, a moderate-to-high negative association was observed (ρ = −0.638; p = 0.064), while in SIM2 the association was moderate and positive (ρ = 0.519; p = 0.152). For SIM3, the correlation was practically nonexistent (ρ = 0.043; p = 0.913). Overall, the results do not provide sufficient statistical evidence to confirm a consistent correspondence between the mental demand provided by the NASA-TLX test and theta power in the three situations analyzed. This interpretation is limited by the small sample size and the need to correct for multiple comparisons.
Table 2.
Correlation analysis between NASA-TLX mental demand scores and EEG theta power across the three simulated flight scenarios.
4. Discussion
The analysis of this study’s results must be interpreted in the light of its methodological design, the characteristics of which allow for strict control of intervening variables, thereby reinforcing the robustness of the conclusions drawn.
Firstly, the sample size (n = 9) is small by conventional statistical criteria. Although this number exceeds the minimum threshold (n > 5) reported in the methodological literature [38] for obtaining valid significance values with non-parametric approaches, and the Bonferroni correction limits the risk of false positives, no a priori power analysis was performed. Furthermore, although the differences were highly significant in most phase comparisons (p < 0.001 and p = 0.001), this does not in itself demonstrate adequate statistical power: effects detected in small samples tend to overestimate the true effect size, and the 72 observations used in the Friedman test (eight electrodes per participant) are not fully independent. The results should therefore be considered exploratory and interpreted with caution. Secondly, the sample comprises a very specific cohort of male trainee pilots at an advanced stage of training. This homogeneity drastically reduces inter-subject variability associated with differences in experience, prior training and cognitive strategies, which constitutes a crucial methodological advantage in terms of experimental control and the consistency of physiological and neuroergonomic measures.
Consequently, the use of a highly trained population represents a particularly relevant context for applied neuroergonomics and defence operational environments, where the reduction of noise or uncontrolled variability allows for a much more precise and refined characterisation of neurophysiological responses to workload. In this regard, the results provide valuable empirical evidence within highly cognitively demanding scenarios and realistic operational conditions.
Finally, future research should validate these findings by replicating the experimental paradigm in larger and more diverse samples (incorporating different crew profiles and gender variables), as well as in real operational or semi-operational flight environments, with the aim of assessing the robustness, temporal stability and generalisability of the proposed approach.
4.1. Relationship Between the EEG Theta Frequency Band and Cognitive Workload
The results obtained in this study provide strong support for the first of the research hypotheses, which posited that power density in the theta band would undergo significant fluctuations depending on the demand for cognitive resources. Specifically, analysis of the recordings revealed an increase in theta power during active flight phases (SIM1–SIM3), in contrast to the values found in the baseline states (BCE, BOE, BOE2). In the latter, significantly reduced levels of theta power were identified, suggesting a state of low cognitive demand.
It is particularly important to note that the highest theta power value was recorded during the execution of the SIM2 simulated flight scenario. This increase is directly related to the experimental design of this phase, which was deliberately configured as the most operationally demanding and cognitively challenging environment.
This peak in theta power during SIM2 offers an insightful contrast to the NASA-TLX results (Table 1), where subjective mental demand was rated slightly higher in SIM3. While self-report scores reflect an integrated retrospective perception—likely elevated in SIM3 by continuous visuomotor control and perceptual concentration—EEG theta power acts as a continuous neurophysiological metric sensitive to transient executive processing and acute stress. Thus, whereas SIM3 required sustained procedural effort, SIM2 placed objectively greater demands due to immediate incident resolution under acute stress, capturing cognitive strain that subjective measures may not fully isolate.
One methodological consideration of the present experimental design is the use of a fixed sequence for the simulation phases (SIM1, SIM2, and SIM3). While establishing a standardized, fixed order consistent with the structure of a generic flight mission (takeoff, emergency resolution, and landing) is necessary, this may introduce order effects, such as cognitive fatigue. Furthermore, although the overall sequence of the simulation phases remained constant across participants, the sequence of events and situations within each phase was not strictly predefined or standardized. Instead, the flight instructor introduced the different scenarios and operational situations at their discretion, adapting them to the development of the simulation and each participant’s performance.
Regarding temporal processing, phase-level epoch averaging (fixed 2-s windows) was deliberately maintained as the standard and robust approach for evaluating macro-level spectral shifts across defined operational flight scenarios. This procedure minimizes the impact of transient artifacts and provides a stable index of global cognitive demand per phase. However, we acknowledge that phase-level aggregation naturally smooths continuous microstate transitions. Recent advances in EEG spatiotemporal dynamics [39] and advanced spatiotemporal modeling for E/MEG source reconstruction [40] highlight the value of high-resolution temporal tracking and source reconstruction, approaches that represent a promising complementary avenue for future research to unravel non-stationary neural states during continuous flight tasks.
4.2. Post-Flight Residual Neural Activation
The second hypothesis proposed an increase in theta power during the post-simulation baseline state (BOE2) compared with the initial baseline states (BCE and BOE). Statistical analysis confirmed significantly higher theta power during BOE2 compared with BOE.
In the neuroergonomic literature, sustained increases in theta activity following task performance are typically interpreted as indicators of accumulated cognitive fatigue. However, given the multifaceted nature of EEG spectral dynamics, this post-flight modulation could also involve residual cognitive processing, the maintenance of attention, or an altered state of arousal following exposure to highly demanding situations. Although subjective fatigue was not reassessed following the experiment, the significant modulation observed in BOE2 demonstrates that the neurocognitive system remains in a heightened state of arousal or recovery, rather than immediately returning to initial baseline levels.
Future studies incorporating post-task questionnaires on subjective fatigue, alongside autonomic markers, will help to analyse in greater detail the specific contributions of fatigue as opposed to residual cognitive activity.
4.3. Relationship Between Theta Activity and Subjective Workload Ratings
The data obtained reflect marked inter-individual heterogeneity in the correlation values between theta power and the subjective ratings of the mental demand dimension obtained from the NASA-TLX test. The average correlation coefficient obtained, ρ = −0.13, indicates a statistically weak and inconsistent association, which highlights the inherent limitations of subjective self-assessments and reinforces the need for objective metrics.
These results point to a fundamental limitation in the use of self-assessment tools for quantifying workload. The lack of a robust and systematic correlation suggests that the subjective perception of cognitive effort is susceptible to bias, particularly in dynamic and mentally demanding environments such as flight simulators or, by extension, real-world aviation operations.
The discrepancy observed between electrophysiological recordings and subjective metrics can be attributed to various cognitive and contextual factors. Firstly, metacognitive limitations come into play, whereby pilots may have an inaccurate or incomplete awareness of their actual cognitive states. Added to this is emotional and motivational interference, as the presence of variables such as stress, confidence or performance feedback can distort subjective judgements. Furthermore, administering the NASA-TLX test immediately after each task makes it susceptible to reconstruction biases and memory effects. Finally, the marked inter-individual variability hinders the standardisation of these subjective self-assessments, reinforcing the argument that neurophysiological markers—specifically the power of the theta band—offer a more stable and trans-individual basis for comparison when assessing safety in aviation environments.
5. Conclusions
This study has provided empirical evidence validating the effectiveness of the electroencephalogram as an objective tool for assessing and monitoring pilots’ brain activity. The research demonstrates that, in high-fidelity flight simulation environments, the analysis of electroencephalographic activity allows for the capture of nuances in functional state that traditional assessment methods often overlook.
The results show an increase in theta power as the cognitive workload intensifies, which is particularly noticeable during the SIM2 flight simulation scenario, designed specifically for emergency management and critical fault resolution. Furthermore, the correlation analysis between theta band power and the subjective mental demand dimension of the NASA-TLX revealed a weak and inconsistent relationship across participants, with no clear or statistically significant overall association. These findings highlight the limitations of subjective workload assessments and suggest the potential value of incorporating objective physiological measures, such as EEG, to complement subjective evaluations. Finally, the persistent theta elevation observed in the post-task baseline (BOE2) provides evidence of prolonged neurocognitive activation following demanding simulated flight scenarios. While consistent with post-task cognitive strain and fatigue, these findings also highlight residual cognitive engagement, underscoring the necessity of adequate post-flight recovery intervals in pilot training protocols.
Taken together, these preliminary findings highlight the potential of EEG monitoring for assessing neurophysiological responses in realistic flight training scenarios, suggesting that task-dependent modulations in the theta band reflect changes in cognitive demand experienced by pilots.
The significance of this study extends beyond passive monitoring, as it may lay the methodological foundations for the development of adaptive, neuro-informed training programmes that optimise human performance by modulating the difficulty of scenarios in real time, based on the trainee’s functional state. This approach would help prevent operational errors related to states of mental saturation, resulting from mental overload, or to states of hypovigilance associated with excessively low cognitive demand.
Recommendations for Future Research
Whilst this study makes a significant contribution to our understanding of cognitive workload through the analysis of EEG signals in a high-fidelity flight simulator environment, several considerations have been identified that should be addressed in future studies:
- More comprehensive spectral analyses: the inclusion of analyses of the alpha (8–13 Hz), beta (13–30 Hz) and gamma (>30 Hz) bands would provide a deeper understanding of sensorimotor processing and high-level cognitive engagement, particularly during the performance of high-precision tasks.
- Larger sample size and experience-based comparisons: it would be advisable to increase the sample size and include cohorts comprising experienced pilots, as well as trainee pilots. This comparison could reveal experience-related differences in EEG patterns, providing valuable information for adaptive and operator-state-based training designs.
- Multimodal assessment: the integration of behavioural performance metrics (e.g., error rate, accuracy, reaction time) alongside physiological measures (fractal and spectral EEG quantifiers, eye tracking, heart rate variability) would provide a more comprehensive and robust assessment of workload. The lack of correlation observed in this study between theta power and the NASA-TLX test during the simulation phases highlights the need for additional EEG markers or multimodal assessments.
- Fixed order effects: It would be interesting for future studies to implement sequences with random order to unequivocally identify order-dependent effects, such as time fatigue on the task and procedural adaptation.
Author Contributions
Conceptualization and methodology, G.R.B., M.V.S.G. and E.N.P.; software, G.R.B., E.N.P. and H.S.B.; validation, G.R.B., M.V.S.G. and E.N.P.; formal analysis, G.R.B., M.V.S.G., H.S.B. and E.N.P. investigation, G.R.B., M.V.S.G., H.S.B. and E.N.P.; resources, G.R.B., M.V.S.G., H.S.B. and E.N.P.; data curation, H.S.B. and E.N.P. writing original draft preparation, G.R.B., M.V.S.G., H.S.B. and E.N.P. ; writing—review and editing, visualization, G.R.B., M.V.S.G., and E.N.P. supervision, G.R.B., M.V.S.G.; project administration, G.R.B., M.V.S.G.; funding acquisition, G.R.B., M.V.S.G. All authors have read and agreed to the published version of the manuscript.
Funding
This research was supported by the research projects “Electroencephalogram Signal Analysis of Pilots During Flight Simulation” (ASESIVU), R28/24, funded by the Centro Universitario de la Defensa de San Javier; “Cerebral electroencephalographic activity in attention processes associated with flight simulation” (CUD_2025_15), funded by the Centro Universitario de la Defensa de Zaragoza.
Data Availability Statement
The data presented in this study are not publicly available due to strict data protection and confidentiality requirements, which prevent the public sharing of participants' personal information and associated research data.
Acknowledgments
The Spanish Air and Space Force has neither edited, reviewed, nor validated the content of this document and shall under no circumstances be held responsible for the information, analyses, or results contained therein, nor does it express or imply any assessment or opinion of any kind regarding the document.
Conflicts of Interest
The authors declare no conflict of interest.
References
- Young, M.S.; Stanton, N.A.; Harris, D. State of science: Mental workload in ergonomics. Ergonomics 2015, 58, 1–17. [Google Scholar] [CrossRef] [Scilit] [PubMed]
- Pütz, S.; Mertens, A.; Chuang, L.; Nitsch, V. Physiological measures of operators’ mental state in supervisory process control tasks: A scoping review. Ergonomics 2024, 67, 345–362. [Google Scholar] [CrossRef] [Scilit] [PubMed]
- Meteier, Q.; Capallera, M.; De Salis, E.; Angelini, L.; Carrino, S.; Widmer, M.; Sonderegger, A.; Marino, F.; Bressoud, E.; Abou Khaled, O.; et al. Classification of drivers’ workload using physiological signals in conditional automation. Front. Psychol. 2021, 12, 596038. [Google Scholar] [CrossRef] [Scilit] [PubMed]
- Lohani, M.; Payne, B.R.; Strayer, D.L. A review of psychophysiological measures to assess cognitive states in real-world driving. Front. Hum. Neurosci. 2019, 13, 57. [Google Scholar] [CrossRef] [Scilit] [PubMed]
- Hart, S.G.; Staveland, L.E. Development of NASA-TLX (Task Load Index): Results of empirical and theoretical research. In Human Mental Workload; Hancock, P.A., Meshkati, N., Eds.; North-Holland: Amsterdam, The Netherlands, 1988; Volume 52, pp. 139–183. [Google Scholar] [CrossRef] [Scilit]
- Hart, S.G. NASA Task Load Index (NASA-TLX); 20 years later. In Proceedings of the Human Factors and Ergonomics Society Annual Meeting; SAGE Publications: Los Angeles, CA, USA, 2006; Volume 50, pp. 904–908. [Google Scholar] [CrossRef] [Scilit]
- Feltman, K.A.; Randles, L.; Goldie, C.; Bernhardt, K.A. A new approach to manipulating aviator workload: A case for individualising workload manipulations. Appl. Ergon. 2022, 102, 103736. [Google Scholar] [CrossRef] [Scilit] [PubMed]
- Cao, S.; Feng, P.; Kang, W.; Chen, Z.; Wang, B. Optimised driver fatigue detection method using multimodal neural networks. Sci. Rep. 2025, 15, 86709. [Google Scholar] [CrossRef] [Scilit] [PubMed]
- Luzzani, G.; Buraioli, I.; Demarchi, D.; Guglieri, G. A review of physiological measures for mental workload assessment in aviation. Aeronaut. J. 2024, 128, 115–142. [Google Scholar] [CrossRef] [Scilit]
- Wickens, C.D. Multiple resources and performance prediction. Theor. Issues Ergon. Sci. 2002, 3, 159–177. [Google Scholar] [CrossRef] [Scilit]
- Charles, R.L.; Nixon, J. Measuring mental workload using physiological measures: A systematic review. Appl. Ergon. 2019, 74, 221–232. [Google Scholar] [CrossRef] [Scilit] [PubMed]
- Wascher, E.; Alyan, E.; Karthaus, M.; Getzmann, S.; Arnau, S.; Reiser, J.E. Tracking drivers’ minds: Continuous evaluation of mental load and cognitive processing in a realistic driving simulator scenario by means of the EEG. Heliyon 2023, 9, e17904. [Google Scholar] [CrossRef] [Scilit] [PubMed]
- Balani, S.O.; Hoseini, S.M.; Mahmoudi, M.; Rahmani, A. Exploring brain activity in different mental cognitive workloads. Iran. J. Psychiatry 2024, 19, 356–366. [Google Scholar] [CrossRef] [Scilit] [PubMed]
- Sharpley, C.F.; Evans, I.D.; Bitsika, V.; Arnold, W.M.; Jesulola, E.; Agnew, L.L. Frontal alpha asymmetry argues for the heterogeneity of psychological resilience. Brain Sci. 2023, 13, 1354. [Google Scholar] [CrossRef] [Scilit] [PubMed]
- Cao, Z.; Chuang, C.H.; King, J.K.; Lin, C.T. Multi-channel EEG recordings during a sustained-attention driving task. Sci. Data 2019, 6, 19. [Google Scholar] [CrossRef] [Scilit] [PubMed]
- Taheri Gorji, H.; Wilson, N.; VanBree, J.; Hoffmann, B.; Petros, T.; Tavakolian, K. Using machine learning methods and EEG to discriminate aircraft pilot cognitive workload during flight. Sci. Rep. 2023, 13, 29647. [Google Scholar] [CrossRef] [Scilit] [PubMed]
- Biel, A.L.; Minarik, T.; Sauseng, P. EEG cross-frequency phase synchronisation as an index of memory matching in visual search. NeuroImage 2021, 235, 117971. [Google Scholar] [CrossRef] [Scilit] [PubMed]
- Herweg, N.A.; Solomon, E.A.; Kahana, M.J. Theta oscillations in human memory. Trends Cogn. Sci. 2020, 24, 208–227. [Google Scholar] [CrossRef] [Scilit] [PubMed]
- Cavanagh, J.F.; Frank, M.J. Frontal theta as a mechanism for cognitive control. Trends Cogn. Sci. 2014, 18, 414–421. [Google Scholar] [CrossRef] [Scilit] [PubMed]
- Díaz-Piedra, C.; Sebastián, M.V.; Di Stasi, L.L. EEG theta power activity reflects workload among army combat drivers: An experimental study. Brain Sci. 2020, 10, 199. [Google Scholar] [CrossRef] [Scilit] [PubMed]
- Di Flumeri, G.; Borghini, G.; Aricò, P.; Sciaraffa, N.; Lanzi, P.; Pozzi, S.; Babiloni, F. EEG-based mental workload neurometric to evaluate the impact of different traffic and road conditions in real driving settings. Front. Hum. Neurosci. 2018, 12, 509. [Google Scholar] [CrossRef] [Scilit] [PubMed]
- Smith, M.E.; Gevins, A.; Brown, H.; Karnik, A.; Du, R. Monitoring task loading with multivariate EEG measures during complex forms of human–computer interaction. Hum. Factors 2001, 43, 366–380. [Google Scholar] [CrossRef] [Scilit] [PubMed]
- Zhao, M.; Zhang, Y.; Liu, X.; Wang, H.; Chen, L. Monitoring pilot trainees’ cognitive control under a simulator-based training process with EEG microstate analysis. Sci. Rep. 2024, 14, 24632. [Google Scholar] [CrossRef] [Scilit] [PubMed]
- Borghini, G.; Astolfi, L.; Vecchiato, G.; Mattia, D.; Babiloni, F. Measuring neurophysiological signals in aircraft pilots and car drivers for the assessment of mental workload, fatigue and drowsiness. Neurosci. Biobehav. Rev. 2014, 44, 58–75. [Google Scholar] [CrossRef] [Scilit] [PubMed]
- Li, W.; Cheng, S.; Dai, J.; Chang, Y. Effects of mental workload manipulation on electroencephalography spectrum oscillation and microstates in multitasking environments. Brain Behav. 2025, 15, e70216. [Google Scholar] [CrossRef] [Scilit] [PubMed]
- Rodríguez-Bermúdez, G.; Naret, B.; Teixeira, A.R. Analysis of P300 evoked potentials to determine pilot cognitive states. Sensors 2025, 25, 6201. [Google Scholar] [CrossRef] [Scilit] [PubMed]
- Radüntz, T. The effect of planning, strategy learning, and working memory capacity on mental workload. Sci. Rep. 2020, 10, 63897. [Google Scholar] [CrossRef] [Scilit] [PubMed]
- Broadbent, D.P.; D’Innocenzo, G.; Ellmers, T.J.; Parsler, J.; Szameitat, A.J.; Bishop, D.T. Cognitive load, working memory capacity and driving performance: A preliminary fNIRS and eye-tracking study. Transp. Res. Part F Traffic Psychol. Behav. 2023, 92, 121–132. [Google Scholar] [CrossRef] [Scilit]
- De Voogt, A.; Koh, T.C.; Lu, Y. Low-level helicopter flights: Safety and operational specificity. Safety 2026, 12, 48. [Google Scholar] [CrossRef] [Scilit]
- Armougum, A.; Gaston-Bellegarde, A.; Joie-La Marle, C.; Piolino, P. Physiological analysis of cognitive load variations during complex information processing. Eur. Transp. Res. Rev. 2025, 17, 692. [Google Scholar] [CrossRef] [Scilit]
- Kalyuga, S. The expertise reversal effect and its implications for learner-tailored instruction. Educ. Psychol. Rev. 2007, 19, 509–539. [Google Scholar] [CrossRef] [Scilit]
- Schacter, D.L. EEG theta waves and psychological phenomena: A review and analysis. Biol. Psychol. 1977, 5, 47–82. [Google Scholar] [CrossRef] [Scilit] [PubMed]
- Mwengue Gimbada, B.; Rodenstein, D. Assessment of sleepiness. Arch. Bronconeumol. 2009, 45, 349–351. [Google Scholar] [CrossRef] [Scilit] [PubMed]
- Cohen, M.X. Analysing Neural Time Series Data: Theory and Practice; MIT Press: Cambridge, MA, USA, 2014. [Google Scholar]
- Widmann, A.; Schröger, E.; Maess, B. Digital filter design for electrophysiological data—A practical approach. J. Neurosci. Methods 2015, 250, 34–46. [Google Scholar] [CrossRef] [Scilit] [PubMed]
- Schober, P.; Boer, C.; Schwarte, L.A. Correlation coefficients: Appropriate use and interpretation. Anesth. Analg. 2018, 126, 1763–1768. [Google Scholar] [CrossRef] [Scilit] [PubMed]
- de Winter, J.C.F.; Gosling, S.D.; Potter, J. Comparing the Pearson and Spearman correlation coefficients across distributions and sample sizes: A tutorial using simulations and empirical data. Psychol. Methods 2016, 21, 273–290. [Google Scholar] [CrossRef] [Scilit] [PubMed]
- De Winter, J.C.F. Using the Student’s t-test with extremely small sample sizes. Pract. Assess. Res. Eval. 2013, 18, 10. [Google Scholar] [CrossRef]
- Zhang, L.; Xu, Y.; Zheng, Q.; He, K.; Pan, X.; Zhang, H.; Xie, B.; Feng, S.; Hu, F. Spatiotemporal EEG dynamics of state anxiety regulation via active audio-visual closed-loop interaction. IEEE Trans. Affect. Comput. 2026, 1–19. [Google Scholar] [CrossRef] [Scilit]
- Feng, Z.; Guan, C.; Zheng, R.; Sun, Y. STARTS: A self-adapted spatio-temporal framework for automatic E/MEG source imaging. IEEE Trans. Med. Imaging 2025, 44, 1230–1242. [Google Scholar] [CrossRef] [Scilit] [PubMed]

Disclaimer/Publisher’s Note: The statements, opinions and data contained in all publications are solely those of the individual author(s) and contributor(s) and not of MDPI and/or the editor(s). MDPI and/or the editor(s) disclaim responsibility for any injury to people or property resulting from any ideas, methods, instructions or products referred to in the content. |
© 2026 by the authors. Licensee MDPI, Basel, Switzerland. This article is an open access article distributed under the terms and conditions of the Creative Commons Attribution (CC BY) license.