


Highlights
What are the main findings?
- Dual measurement on plasmon switching effect configuration is explored to increase sensor performances.
- Adapted demodulation processing is used to decrease sensitivity to optical noise.
What are the implications of the main findings?
- Detection sensitivity is increased by 59% compared to single measurement.
- An LOD as low as 9.85 × 10⁻⁸ RIU is reached.
Abstract
This work aims to develop a highly sensitive and compact SPR sensor based on a low-loss plasmon energy transfer effect between the 0th and −1st diffraction orders by a deep metal grating; this is a plasmonic effect we have previously investigated and published. We demonstrated here that this approach is fully compatible with dual measurement to improve performance and sensor versatility and functionality. We designed a grating enabling this effect using laser interference lithography (LIL) on a photoresist material followed by the deposition of a thin gold layer via thermal evaporation. The combination of two modulated TM-polarized laser diode sources and a double-sensitivity measurement approach, together with an adapted signal processing method, enabled us to achieve a limit of detection (LOD) of 9.85 × 10⁻⁸ RIU.
1. Introduction
The aim of this work is to detect physical events with high sensitivity using surface plasmon polaritons (SPPs). SPPs are electromagnetic surface waves coupled to a collective oscillation of electrons that propagate along a metal–dielectric interface, the evanescent field of which is sensitive to the refractive index of the dielectric media. Many SPP detection methods have been demonstrated in previous works for electrochemical potential measurement [1] and for biosensing [2]. In these studies, the Kretschmann–Raether configuration [3] has been employed: this configuration relies on evanescent coupling under the total internal reflection (TIR) condition between the incident wave and SPP by a high refractive index prism. The change in analyte concentration is then detected by the wavelength or an angular shift of the surface plasmon resonance (SPR) peak. This is a mature detection method, still widely used; however, it faces challenges in integration and portability due to the use of a bulky prism. SPR sensing as also been developed in metallic-coated fiber-based platforms, which offer compactness and remote sensing capabilities but may suffer from fabrication complexity and limited reproducibility [4]. The grating coupling approach [5], also called grating coupling surface plasmon resonance (GC-SPR), addresses these limitations by providing a compact SPR coupling and potential for large-scale fabrication. In GC-SPR, the grating period is carefully chosen to provide a momentum matching between the incident wave and SPP mode. Classic GC-SPR has been widely used during the last two decades but seems to have reached a limitation in terms of sensitivity and the limit of detection (LOD) [6]. In particular, the performance of these sensors is limited by the broad resonance peaks induced by the large absorption loss of metallic materials (except for the case considering long-range plasmon modes [7]). More recently, the performance of GC-SPR sensors has been improved through studies focusing on grating geometry, material selection, and interrogation methods [8]. New kinds of GC-SPR based on metamaterial structures [9], bi-layered metals configurations [10] or graphene hybrid structures [11,12,13] have been recently studied to enhance their detection sensitivity. However, such structures generally increase fabrication complexity and need more complex optical interrogation setups, involving for instance angular or wavelength tuning. We thus position our approach as a response to these limitations with a 1D GC-SPR leading to a quasi-lossless energy transfer between two reflected orders and a dual measurement. Our GC-SPR period is designed to obtain two counter-propagative SPP modes for the considered wavelength and produce two propagative reflected orders (0th and −1st orders). This work is therefore based on an original deep grating coupling method that enables reaching a theoretical LOD as low as 10−7 RIU by monitoring both 0th and −1st diffraction order efficiencies [14]. The sensor principle is based on energy transfer between these two diffracted orders when tuning the incidence angle. Its underlying effect was discovered a few years ago and was already described in [15]. It was recently exploited to detect biological species [16] or hydrogen [17], refractive index change [18] and magnetic fields [19], with high sensitivity. The present article aims to go further to improve these already established detection sensitivities and to fully exploit the potential of this method through dual measurement. We will first present briefly the principle of the method and the setups used to characterize the transducer and the sensor, along with the dedicated signal processing. Then, we describe the achieved performance including measurement results used to determine sensitivity and limit of detection (LOD). Finally, we discuss and compare these results with other measurement architectures and conclude on its relevance.
2. Materials and Methods
2.1. Principle of Plasmon Energy Transfer Effect
The phenomenon of energy transfer between two diffracted orders occurs in a deep metal grating with a period illuminated under a monochromatic TM-polarized beam of wavelength at an oblique incidence varying from 0 to 90°. The structure respects usual coupling schemes where the surface plasmon can be excited by an evanescent diffraction order m under resonant angle θr, by matching the plasmon propagation constant and the incident beam transversal component kinc with the K grating vector (), as described in Equation (1):
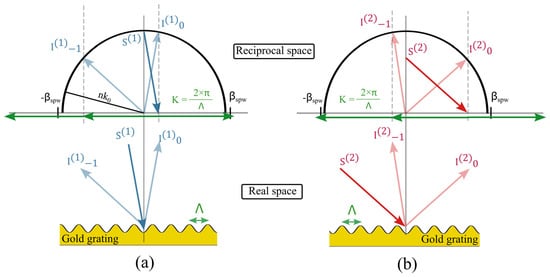
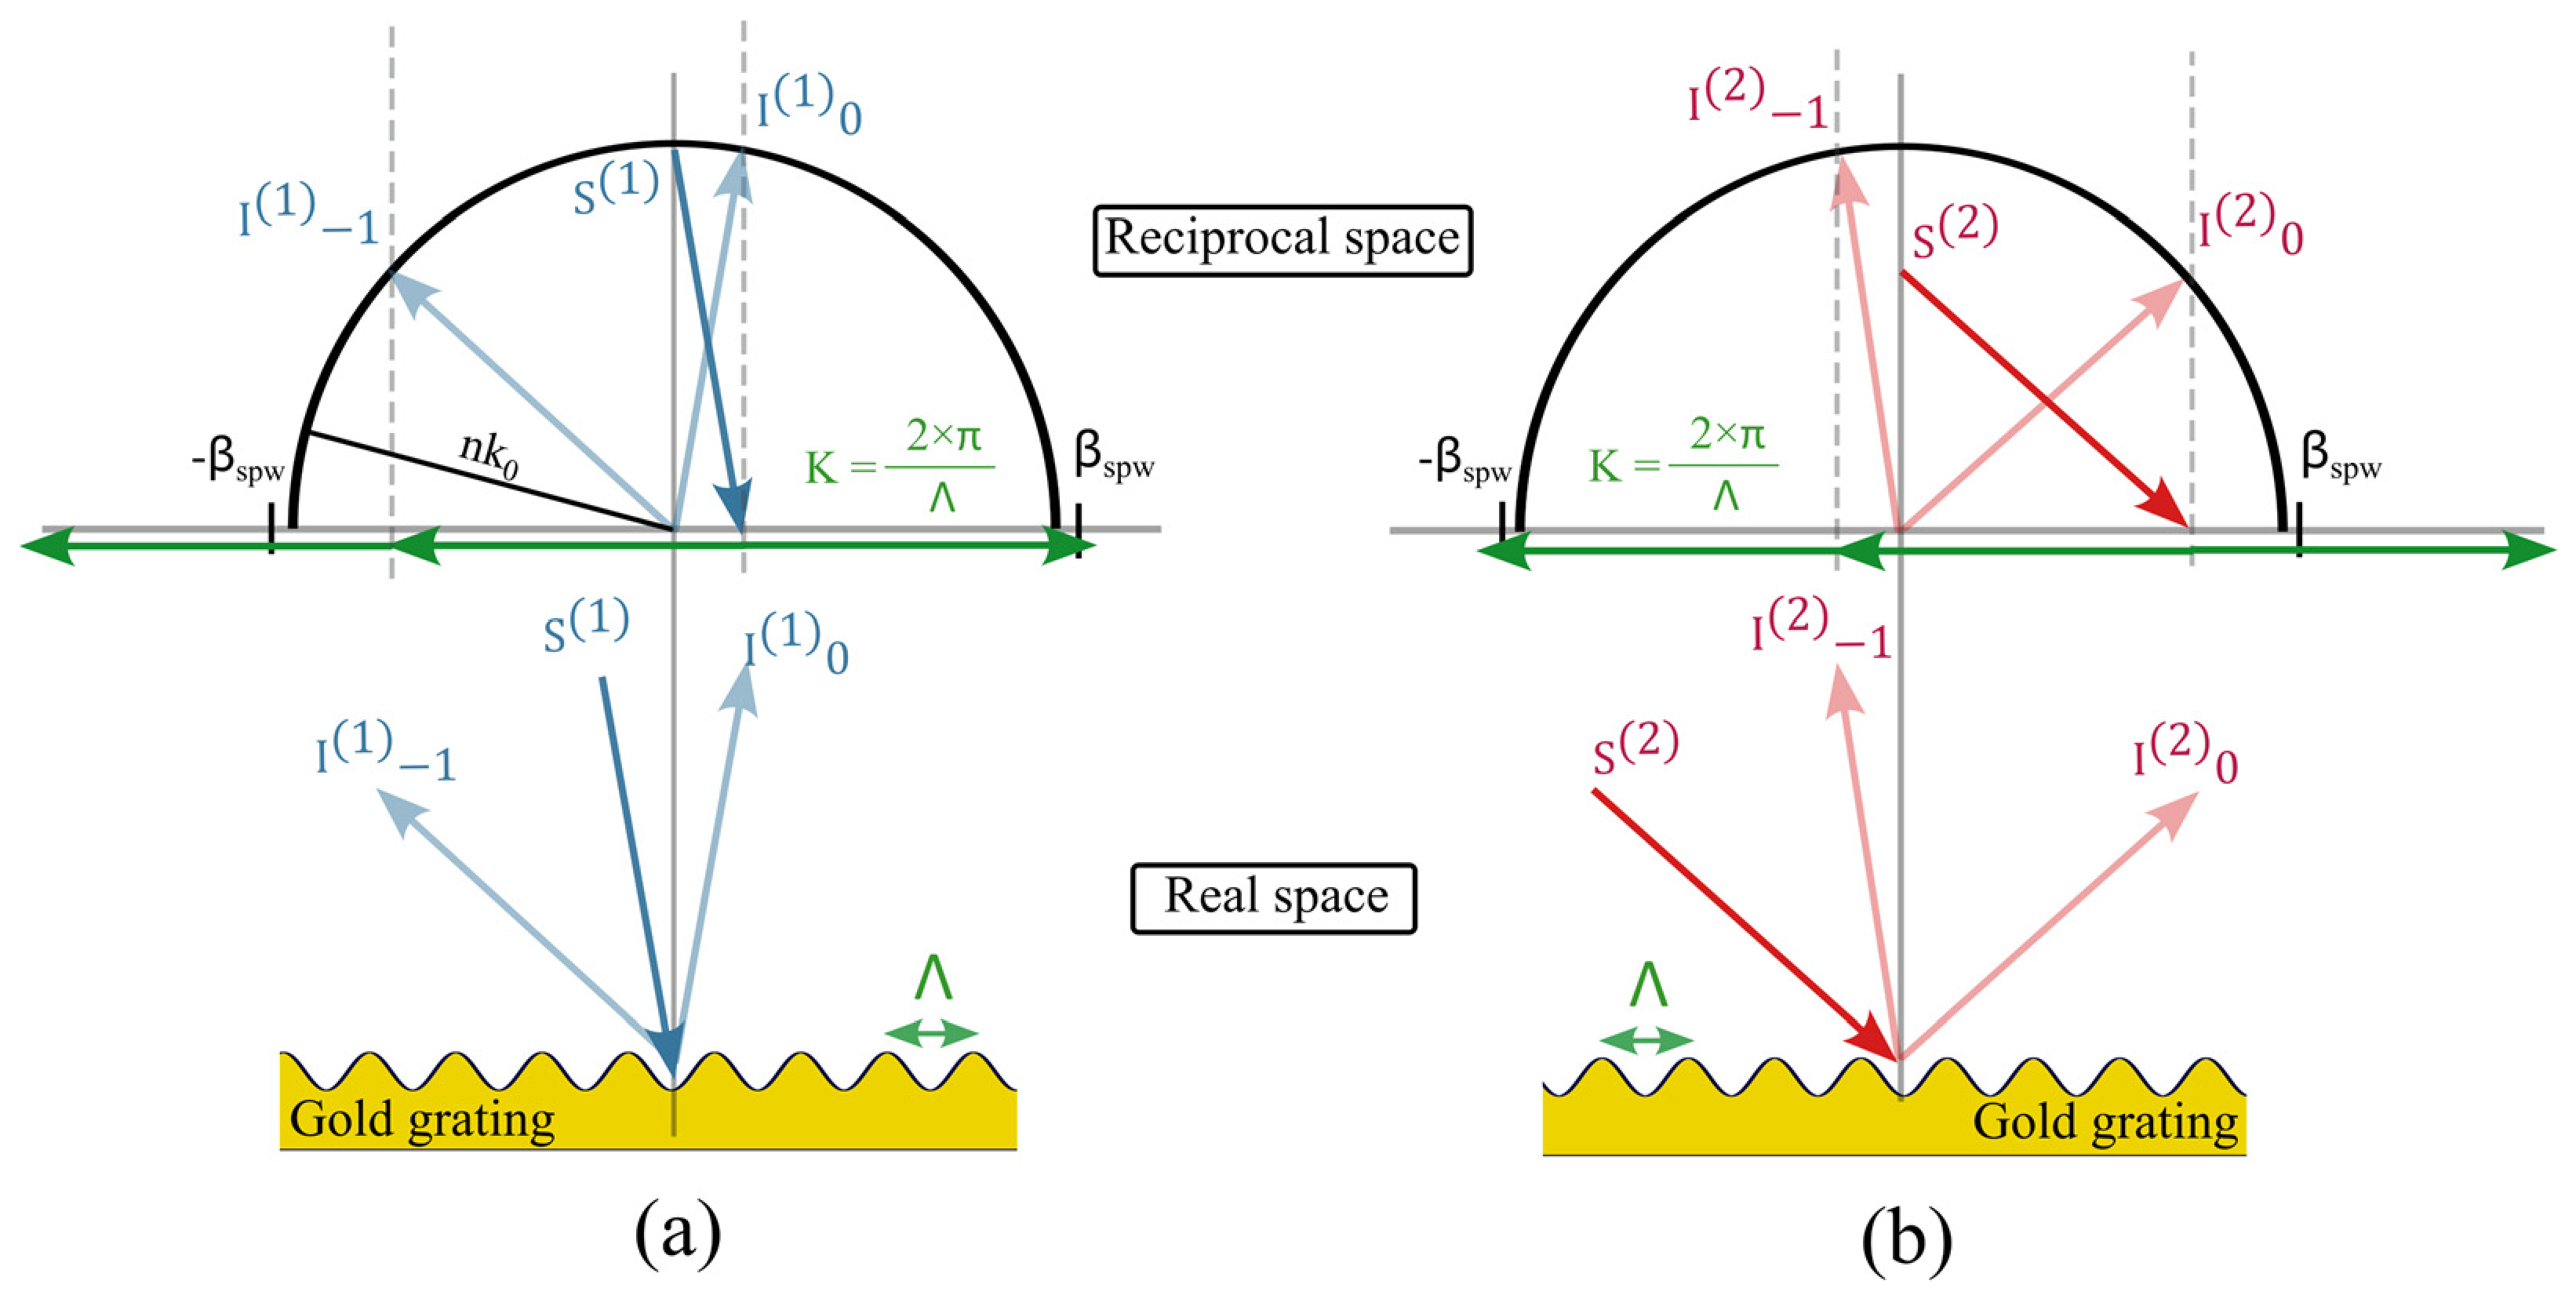
Compared to a classical grating coupler, where only one surface plasmon is excited and observed by a reflectance dip at a defined wavelength or incidence angle, the energy transfer effect involves two reflection orders (0th and −1st). They share their energy through the coupling of two counter-propagative surface plasmons, respectively excited by the 1st and the −2nd grating evanescent orders. The grating period is then chosen to satisfy the condition 3K > 2β, ensuring that phase matching between the forward propagative plasmon mode and the 1st evanescent order as well as between the backward propagative plasmon mode and the −2nd evanescent mode (Figure 1) is possible. This configuration leads to two major differences compared to classical GC-SPR. First, the grating depth d is non-negligible and must be larger than the ones found in most plasmonic applications [18]. Also, it is qualified as a quasi-lossless phenomenon since the surface plasmons have a short propagating length of only a few tens of micrometers before being re-coupled and re-radiated into propagative orders via the −3rd grating order [20], limiting the energy absorbed by the metal.
Figure 1.
Structure parameters and conditions for plasmon excitation. (a) Coupling condition for the propagative plasmon mode with a +1st grating order. (b) Coupling condition for the counter-propagative plasmon mode with a −2nd grating order.
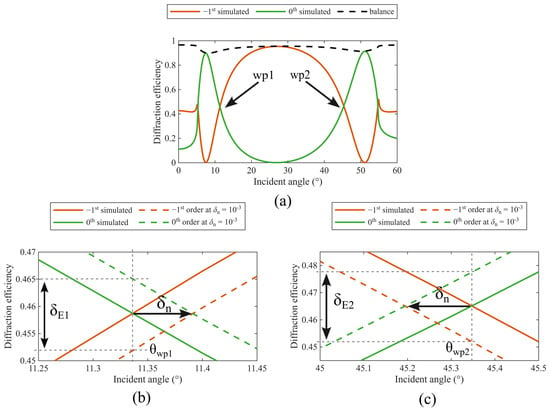
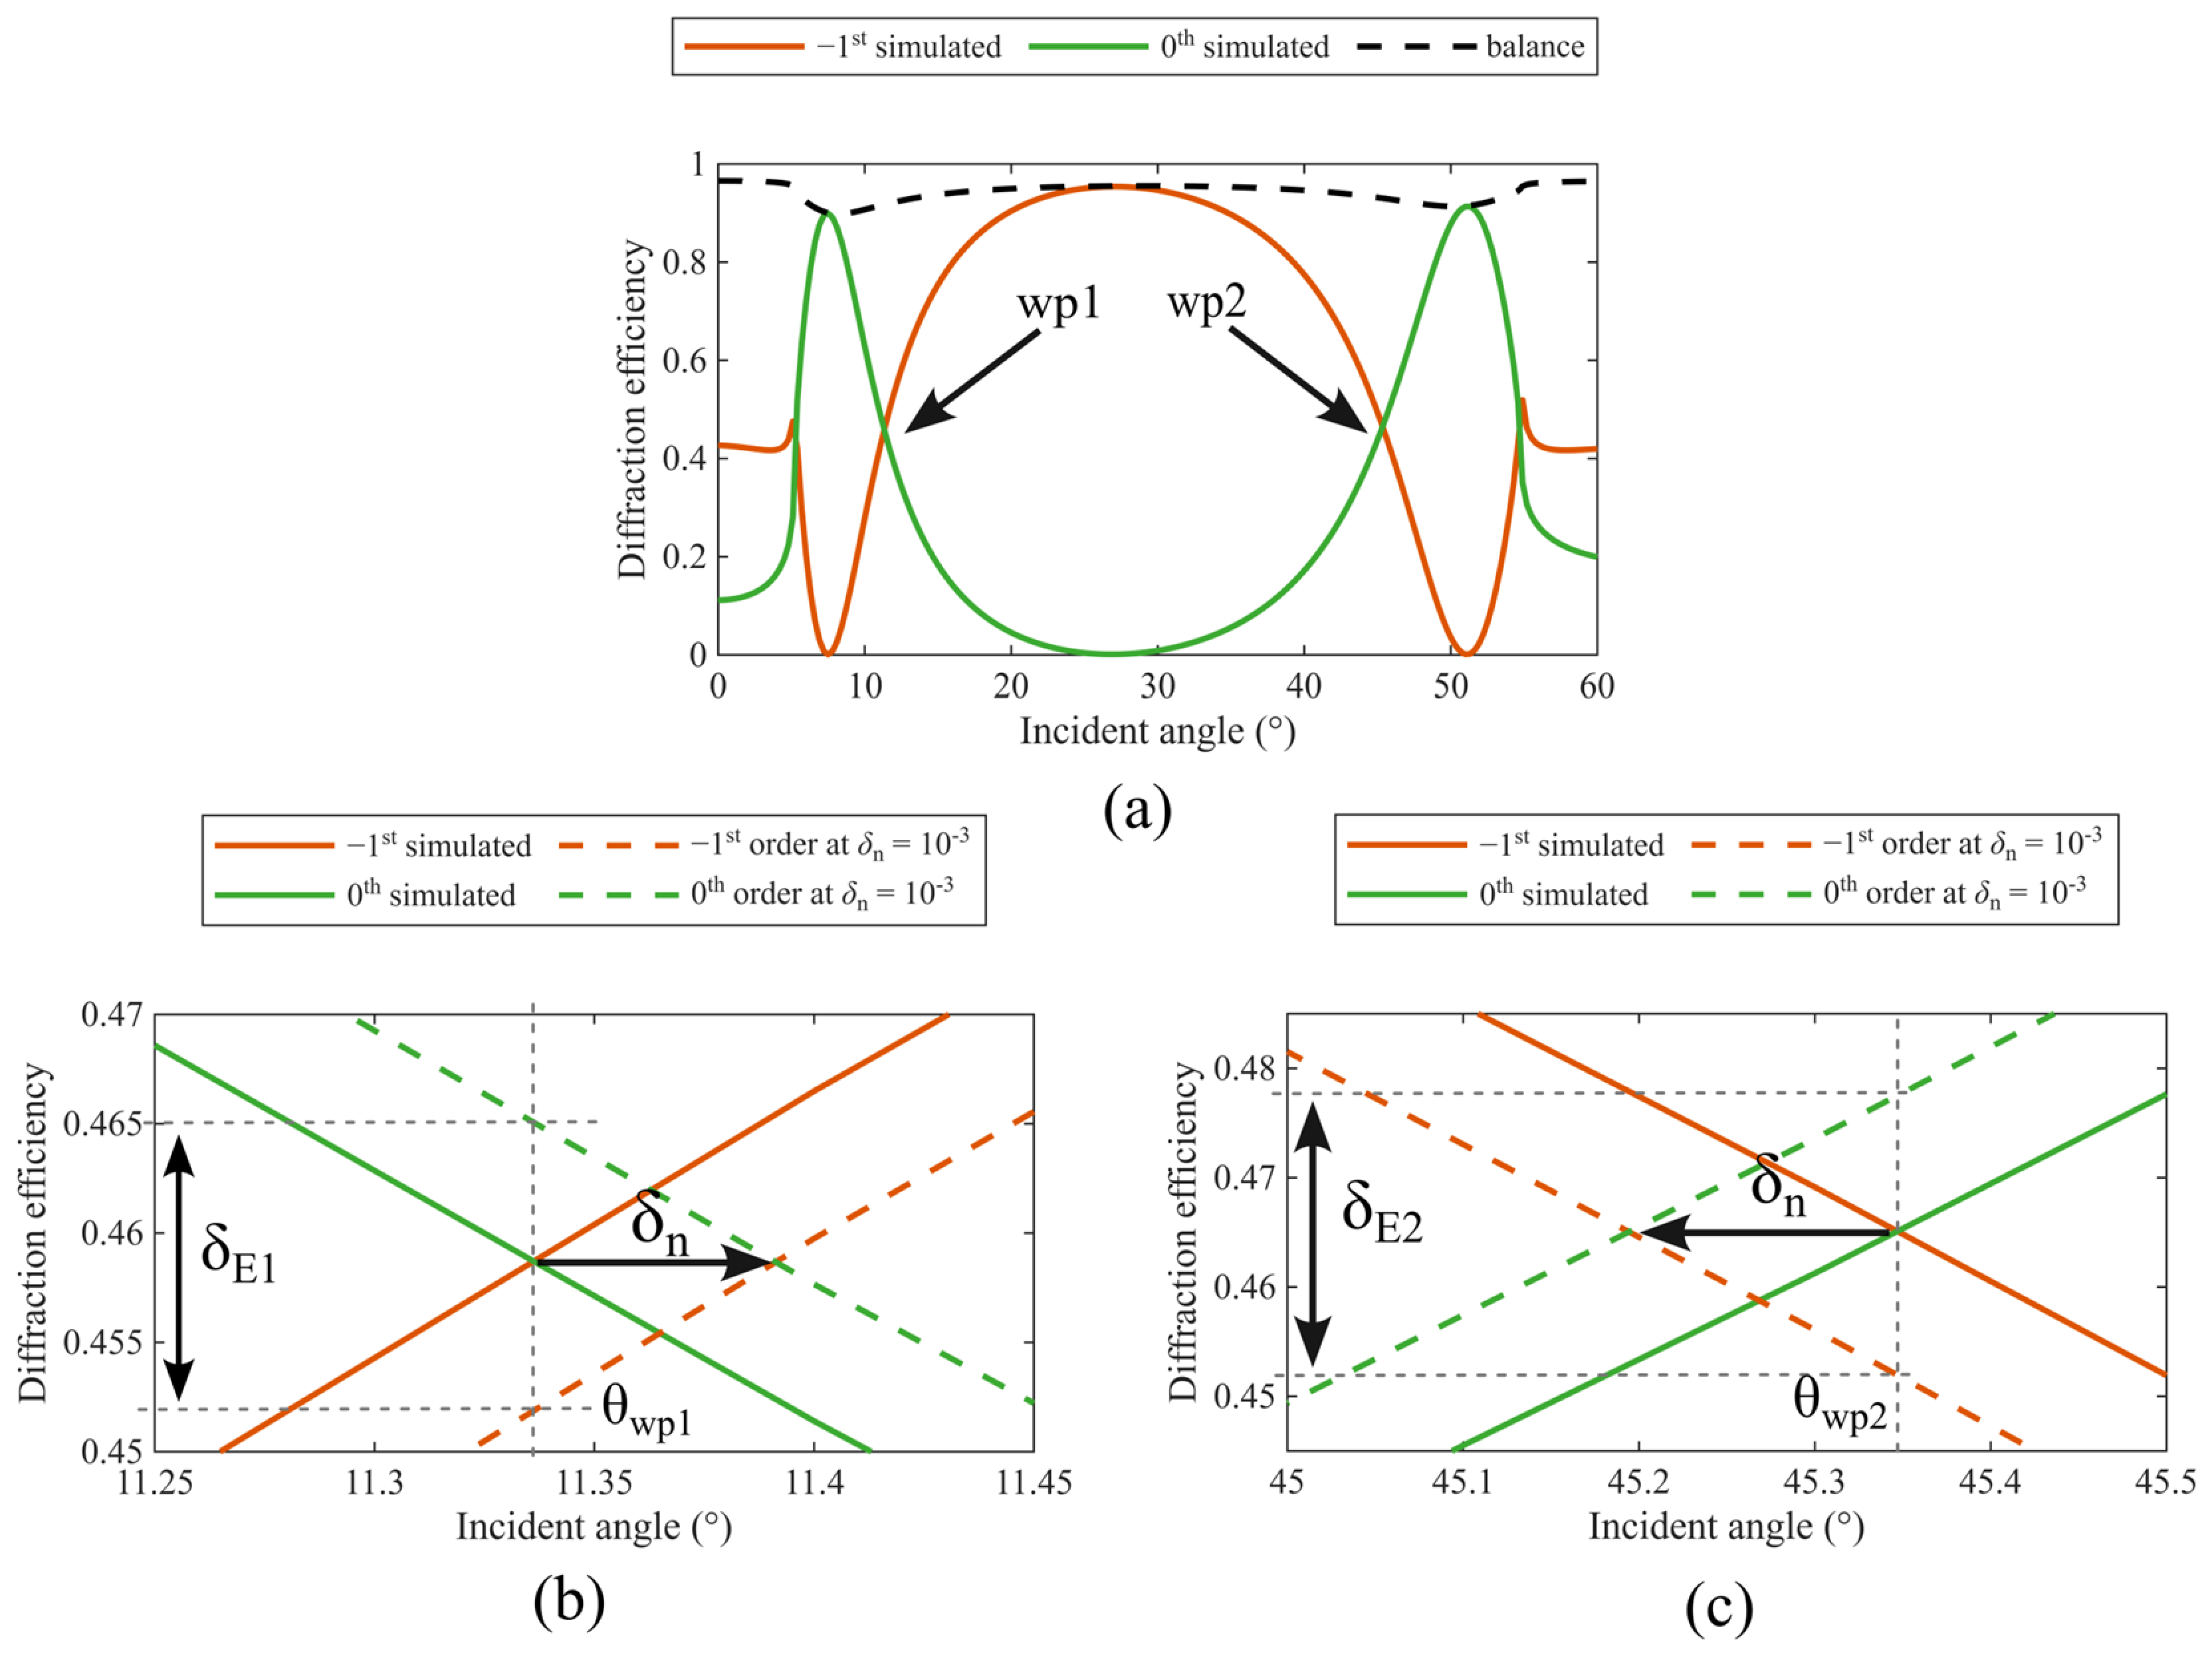
As an example, the surface of a sinusoidal grating made of gold can propagate two plasmons modes (backward and forward) in the near-infrared range under TM polarization for two particular resonance angles if the period satisfies the phase matching condition given above. For λ = 850 nm, a grating period of Λ = 935 nm satisfies this condition and a sufficiently large grating depth (d = 300 nm), compared to the period, leads to the energy transfer effect between the propagative 0th and −1st diffracted orders. Figure 2a demonstrates this aspect by showing the corresponding angular reflectance spectra simulations made using the Chandezon method [21,22] on the MC grating software (version 2026-05-25, General Physics Institute, Moscow, https://mcgrating.com, accessed on 4 November 2026) [23]. This method is particularly adapted and outperforms Rigorous Coupled Wave Analysis (RCWA) when considering deep sinusoidal gratings [24]. The simulated spectra exhibit three maxima (two for the 0th reflected order and one for the −1st order) and three minima (two for the −1st diffracted order and one for the 0th order). The two 0th maxima and −1st minima at 9° and 50° correspond to surface plasmons excitation by the +1st and the −2nd orders, respectively. Finally, at 27°, which corresponds to the Littrow angle for which the reflected −1st order is superposed to the incident wave, the −1st order shows a maximum efficiency, whereas the 0th order efficiency shows a minimum; this situation illustrates well the energy transfer effect over the angular range. Two crossing points, denoted as wp1 (θwp1 = 11.33°) and wp2 (θwp2 = 45.35°), respectively, are marked by black arrows in Figure 2a, and zoom plots around wp1 and wp2 are shown in Figure 2b,c. As also illustrated in these last figures, for a refractive index variation δn of 10−3 RIU, the 0th and −1st order efficiencies are slightly shifted. Thus, differential efficiency measurements δE can be performed at the fixed angles θwp1 and θwp2, allowing linear responses with respective theoretical sensitivities at each of these angles of Swp1 = 12 RIU−1 and Swp2 = 25.9 RIU−1.
Figure 2.
(a) Angular simulated efficiency responses of the 0th and −1st orders; (b) zoom around wp1 (θwp1 = 11.33°) and Swp1 = 12 RIU−1; (c) wp2 (θwp2 = 45.35°) and Swp2 = 25.9 RIU−1. The dashed boxes in (b,c) and arrows illustrate the amplitude of differential efficiency measurement δE for a refractive index change δn of 10−3 RIU.
2.2. Production and Characterization of the Diffraction Grating
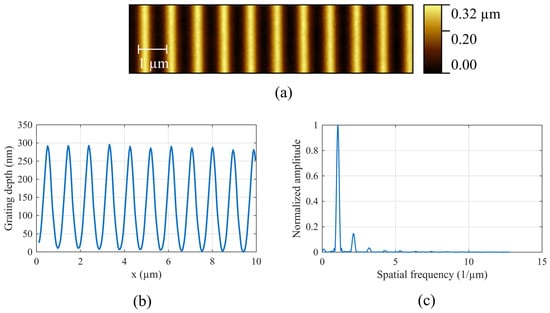
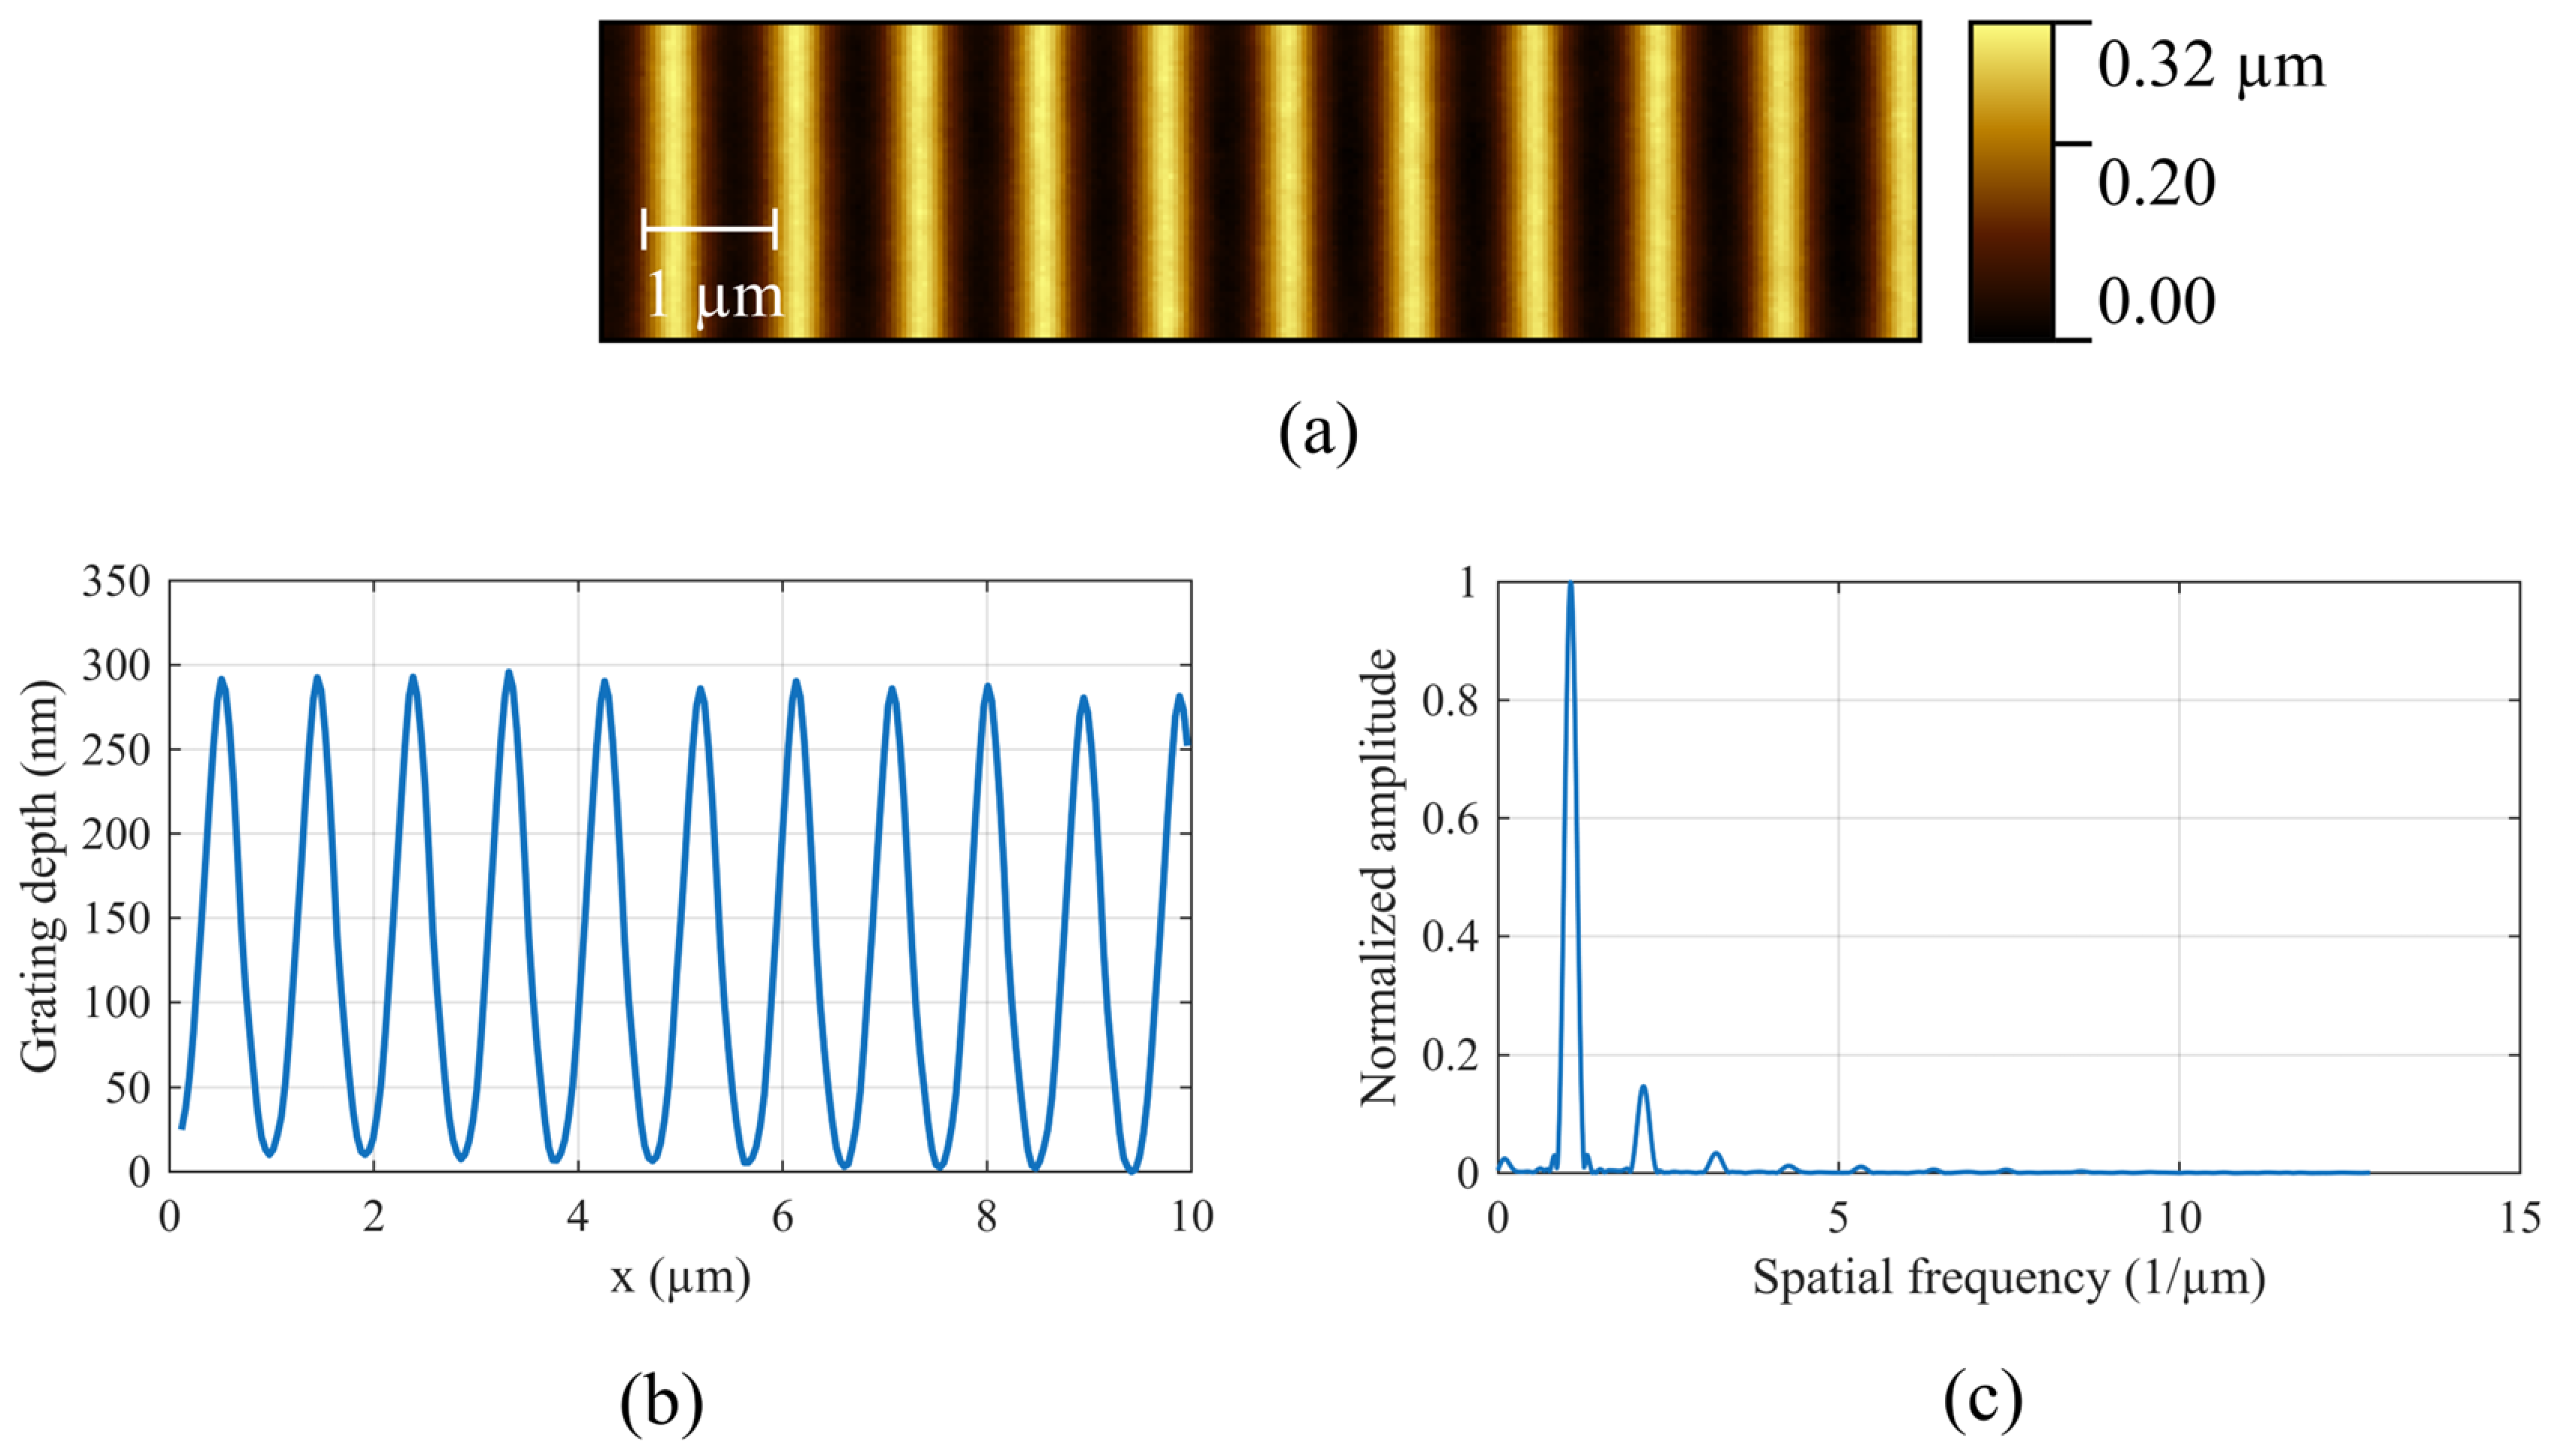
The sample used in this experiment is a sinusoidal grating in photoresist with a 935 nm period and a 300 nm depth made by laser interference lithography (LIL) and coated with a gold layer of thickness of 120 nm by thermal evaporation. Atomic force microscope (AFM) measurements were done to check the grating quality and are shown in Figure 3. The grating period measurement was performed in a Littrow configuration bench [25], ensuring a better accuracy than using the AFM profile.
Figure 3.
(a) 2D AFM scan of the sinusoidal grating after gold deposition. (b) Corresponding average sectional profile. (c) Computed Fast Fourier Transform (FFT) of the profile.
2.3. Angular Characterization Setup
The angular characterization of this grating was performed under ambient conditions, using an automated setup driven by LabVIEW (2025 Q1) software. The grating is fixed and installed at the center of the setup. A TM-polarized, collimated 850 nm laser diode (FP-D-850-5M-C-C, Laser Components, Meudon, France) mounted on a rotative stage (URS100BPP, Newport, Irvine, CA, USA) scans all angles in the [4°; 70°] range by steps of 1°. The detector, a Si photodiode (BP104, Vishay, Malvern, PA, USA), is mounted on another rotative stage and positioned automatically, for each incident angle, in the direction of the 0th order and then of the −1st order to measure intensities diffracted by the grating [17]. Photodiode signals are amplified with a JFET (TL071, Texas Instruments, Dallas, TX, USA) amplifier and acquired with an analog-to-digital convertor (ADC) (USB-6008, National Instruments, Austin, TX, USA). This angular characterization was performed on different areas of the sample (called here North, Center, South) to ensure the homogeneity of the energy transfer effect at the locations where the two refractometric measurements will be performed.
2.4. Refractometric Measurement Setup
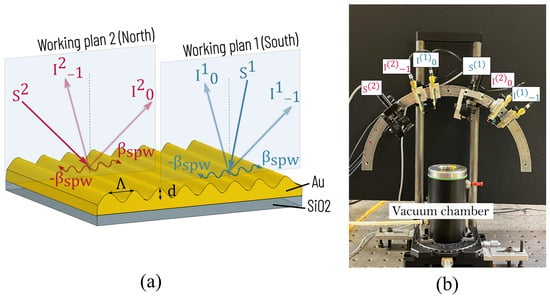
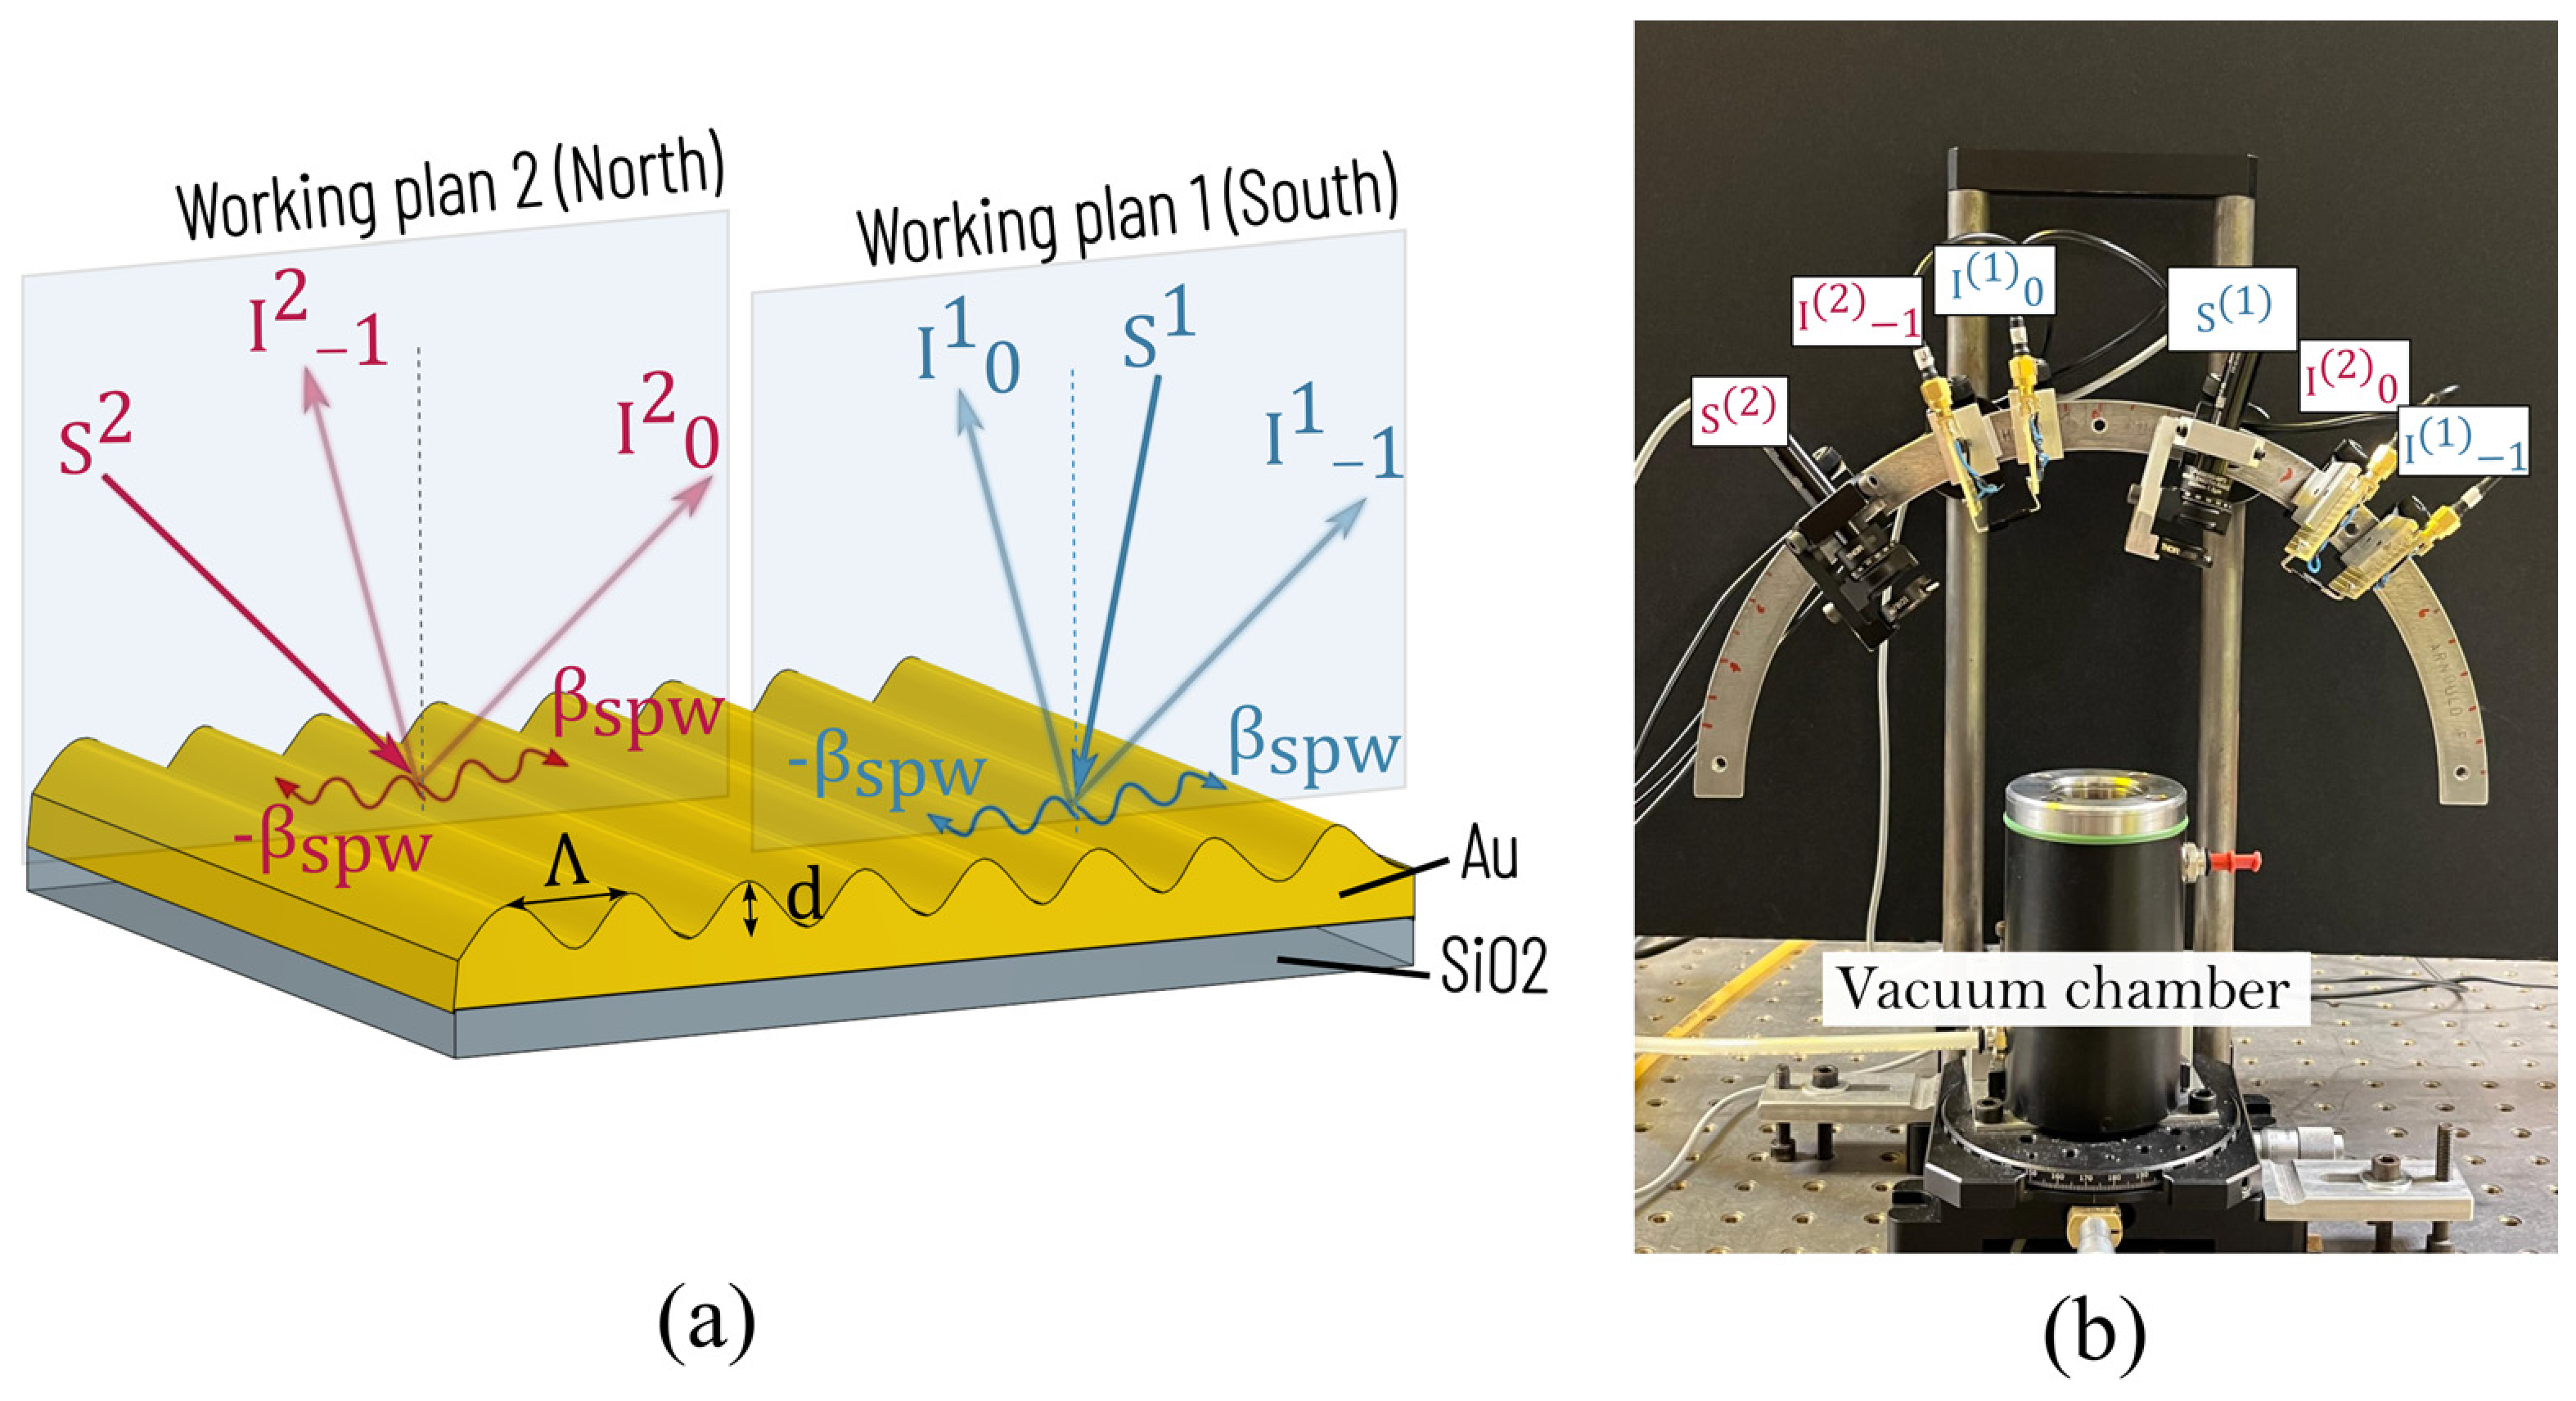
To perform the sensing experiment, we first placed the sample (fixed with plastic screws to avoid deformation during pressure variation) into a vacuum chamber equipped with a glass window. The vacuum chamber is an aluminum cylinder with a thickness of 12 mm, leading to an estimated maximum stress of 1 MPa under a 400 mbar pressure difference. The glass window has been chosen to be sufficiently thick (4 mm) to ensure estimated deflections smaller than 1 µm under the same pressure difference. Thus, vacuum chamber and window deformations have been neglected in the present study. Air pressure of the sensing medium variates while all reflected orders are measured with Si photodiodes, placed outside the vacuum chamber. Two TM-polarized collimated 850 nm laser diodes (FP-D-850-5M-C-C, Laser Components, Meudon, France) and four Si photodiodes (BPW34FA, ams OSRAM, Premstätten, Austria) were placed on an angularly graduated metal arch to accurately control the light sources and photodiode positions in order to collect signals at both crossing points, as shown in Figure 4. To avoid crosstalk between the two working plans, a few precautions were considered: the incident collimated beams were diaphragmed to control the spot sizes (∼1 mm), ensuring optimal collection of the diffracted orders on their respective photodiodes (photosensitive area ∼36 mm2). In practice, one laser diode and the two corresponding photodiodes were set slightly forward by a distance of 1 cm. Then, intensity measurements and (i = 1 or 2 for wpi) were performed on the South area and on the North area for wp1 and wp2, respectively. These precautions are intended to minimize crosstalk in the present proof of concept. Although no crosstalk was apparent during visual inspection, its absence was not experimentally verified. To ensure its complete elimination, modulating the laser diodes at different frequencies would be preferable in a future work.
Figure 4.
(a) Graphical representation of measurement areas. (b) Photograph of the experimental setup for refractometric measurements.
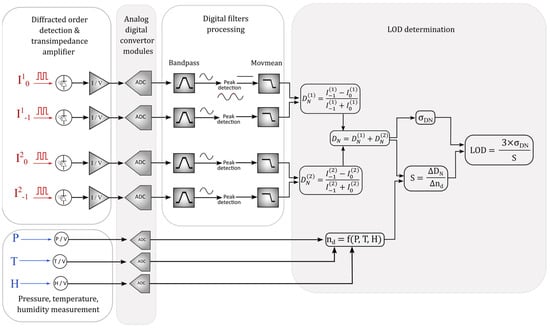
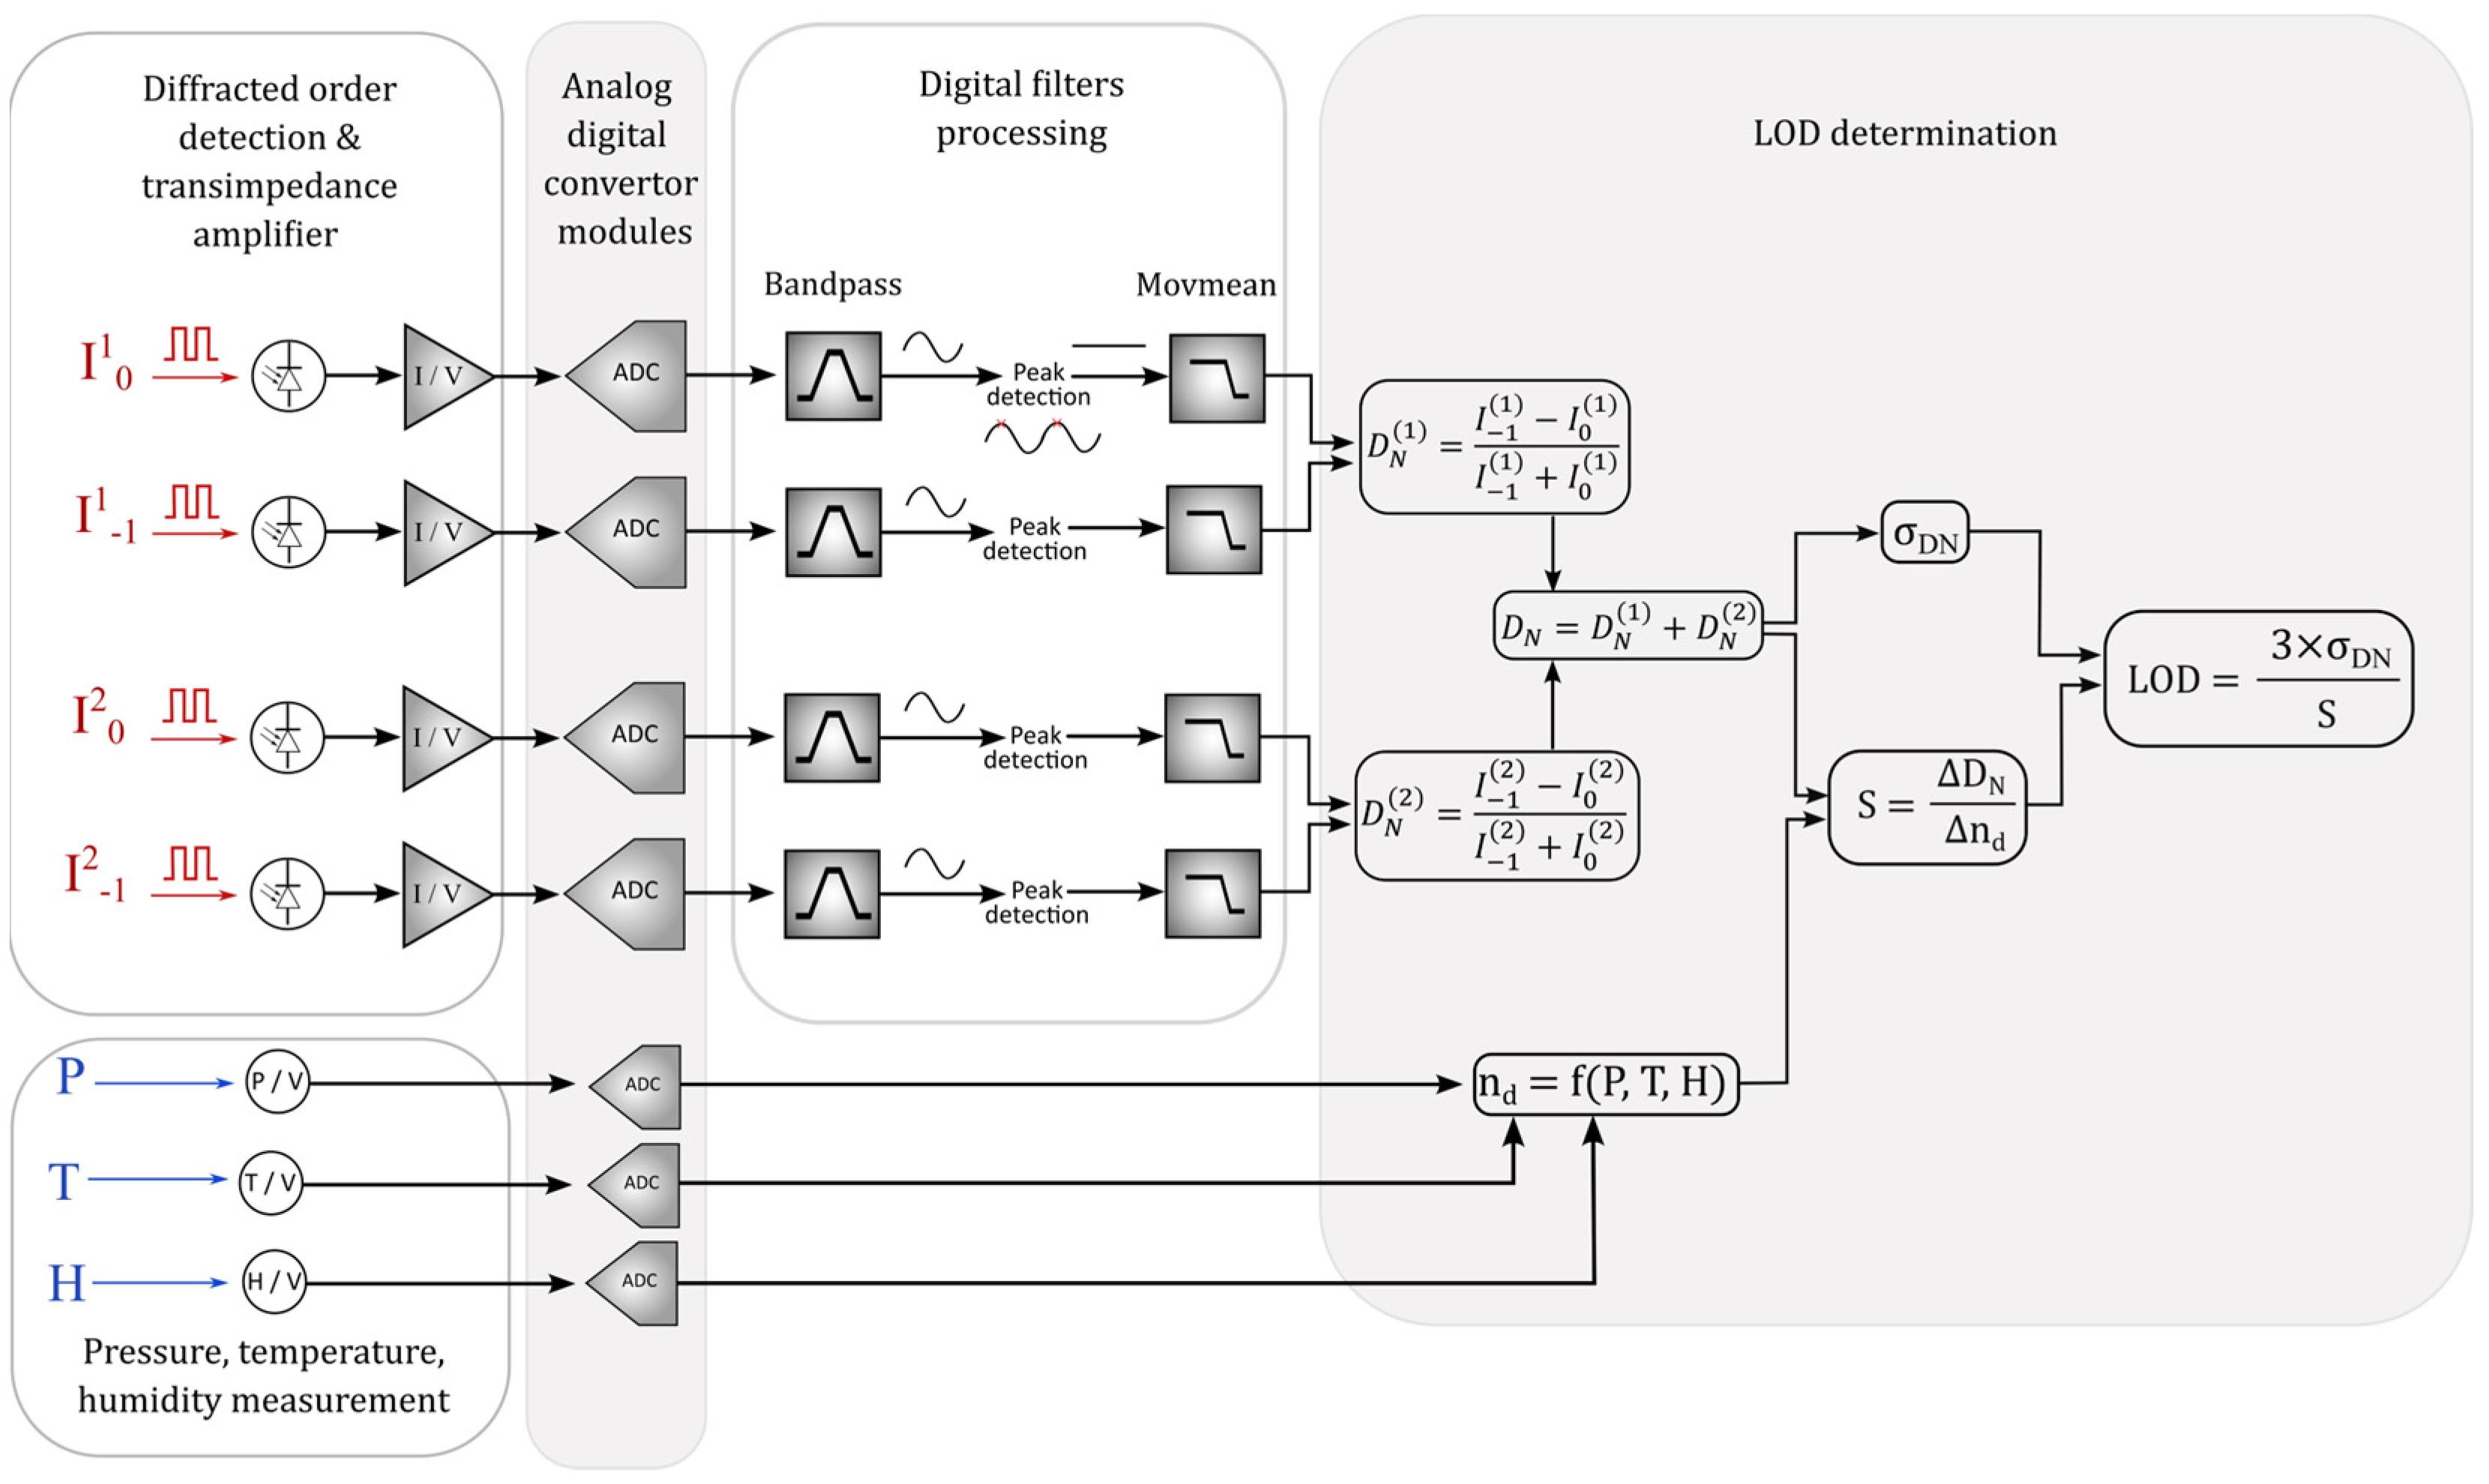
The schematic diagram of signal acquisition and processing is presented in Figure 5. The two laser diodes with an output power of 5 mW were modulated with a TTL signal at a frequency fm = 250 Hz with a duty cycle DC = 0.5. Wavelength stabilization and TTL-induced chirp have not been investigated in this study. The intensities collected by the photodiodes are converted into voltages via a transimpedance amplifier. Analog voltages (including those measured for pressure, temperature and humidity) are then acquired at a sampling frequency of 50 kHz and converted into digital data using a 37-pin D-SUB Terminal Blok (NI-9923, National Instrument, Austin, TX, USA). Thereafter, digital filter post-processing was used to improve the signal-to-noise ratio of the photodiodes. First, the fundamental harmonic was extracted using an infinite impulse response (IIR) band-pass filter with a cut-off band frequency equal to [fm − 50; fm + 50] Hz, a stop-band attenuation of 60 dB and a filter order of 10. The envelope of the modulated signal (which carries the sensing information) was extracted using peak maxima detection and was finally low-pass filtered and processed with a sliding average with a window of 4000 points. In-phase and quadrature (IQ) demodulation could have been explored as an alternative, offering improved noise rejection and simultaneous amplitude and phase measurements [26,27]. However, IQ requires a stable phase reference and a more complex implementation. Since the measurement relies only on the amplitude of the modulated signal, the selected method is sufficient to accurately track its temporal variations while remaining simple and independent of phase synchronization. This allows us to obtain the values of the normalized efficiencies differences that are calculated for each crossing point wpi (i = 1 and 2) as follows:
Figure 5.
Diagram of signal acquisition and processing.
This normalized difference calculation is independent from variations in the laser source, unlike simple differential measurement of efficiencies δE [18]. Indeed, normalized difference, defined as the difference between the intensity signals divided by their sum, inherently cancels out variations in the laser source intensity, thereby providing a self-referenced measurement (see Supplementary Materials). The sum was used to define the global sensitivity to the surrounding medium refractive index variation. We emphasize that common-mode noise suppression applies individually to each normalized difference, and , but not on their sum DN, since both signals originate from different sources. To obtain the refractive index change Δn in the chamber over time, the Edlén equation [28] was used, modeling the refractive index of air inside the chamber to the pressure (MPX5100DP, Freescale Semiconductor, Austin, TX), temperature and humidity (HC2A-S, Rotronic, Bassersdorf, Switzerland) measurements. The measurement uncertainties are ±25 mBar, ±0.8% HR and ±0.1K for pressure, humidity and temperature, respectively. The CO2 concentration was not measured inside the chamber and was therefore assumed to be 450 ppm as a reference value. Finally, the LOD was determined from sensitivity and noise measurement through the following formula:
3. Results
The first step consists of measuring the angular response of the transducer to experimentally determine the angle of the two crossing points wp1 and wp2 and compare the results with the theoretical predictions. Then, refractometric measurements at these fixed angles are performed, enabling the determination of the sensitivity and LOD. The results are discussed afterwards.
3.1. Angular Measurements
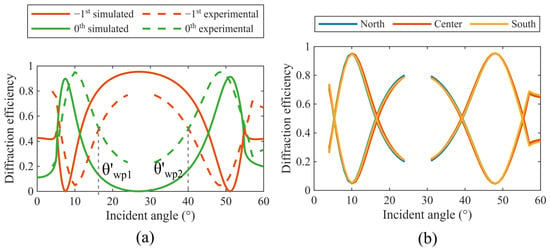
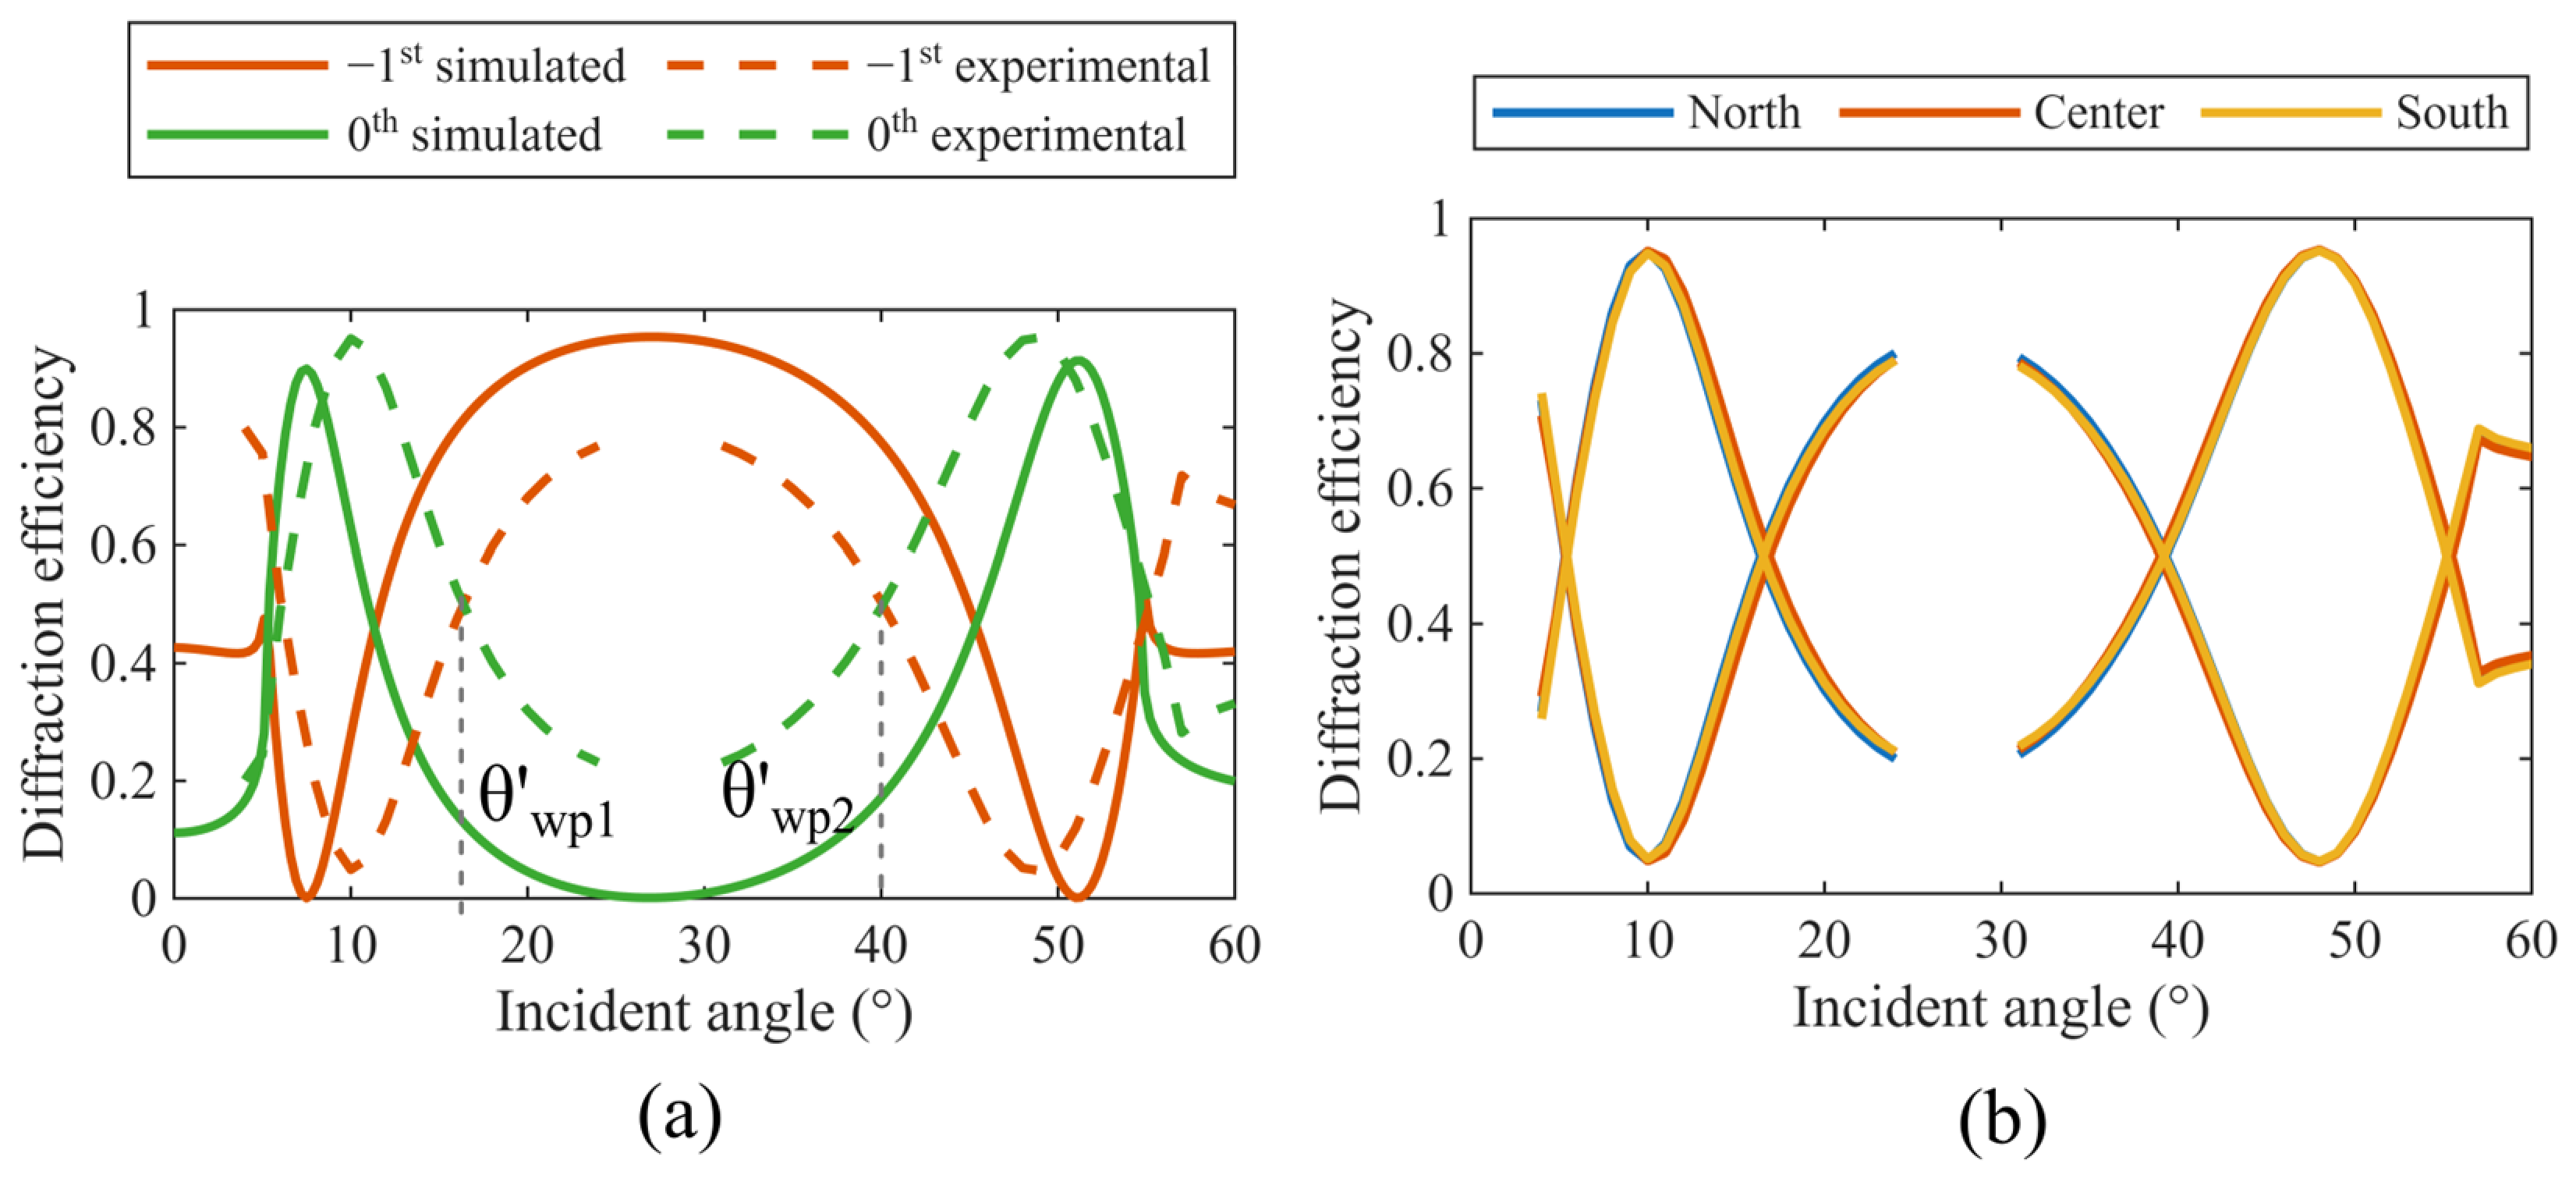
According to the procedure detailed in Section 2.3, the diffraction intensities of the 0th and −1st reflection orders are plotted in Figure 6a for the center area of the grating. A comparison with the simulation is also shown on the same graph. The gap in the experimental curve around 27° (Littrow angle) is due to the fact that, at this position, the incident source and the photodiode are perfectly aligned, the latter screening the former. Furthermore, we observe that the experimental curves are slightly compressed compared to the simulated ones due to a shift in the surface plasmon mode resonances on either side of the Littrow angle. This difference can be explained by the surface roughness induced by the gold layer; this parameter has a significant impact on the angular response of deep metallic gratings, as previously reported in [29]. In addition, the FFT of the grating profile, presented in Figure 3c, shows several non-negligible harmonics, which may affect its angular response. Both the imperfect sinusoidal profile and the roughness of the grating modify the effective index and angular resonance of the surface plasmon modes and thus the positions of the two crossing points. Finally, we performed the same angular characterization for the North and South sample areas, plotted in comparison to the center area in Figure 6b. The excellent homogeneity between North and South satisfies the condition of a double measurement, ensuring the same behavior during refractometric sensing.
Figure 6.
Angular response of the grating: (a) Comparison between measured and the simulated efficiencies of the 0th and −1st orders when the grating is illuminated at the center area, with angles of experimental crossing points and are highlighted with blacked dashed lines; (b) 0th and −1st orders measured efficiencies for the three grating areas North, center and South.
The two working points were then chosen at angles = 16° and = 40°, corresponding to the experimental values where the 0th and −1st order efficiencies are equal. The variations in efficiency at these angles, induced by change in the refractive index of the external medium, allow us to evaluate the normalized difference variation ΔDN as well as the sensitivity S and the limit of detection LOD, as presented in Section 3.2.
3.2. Refractometric Measurements
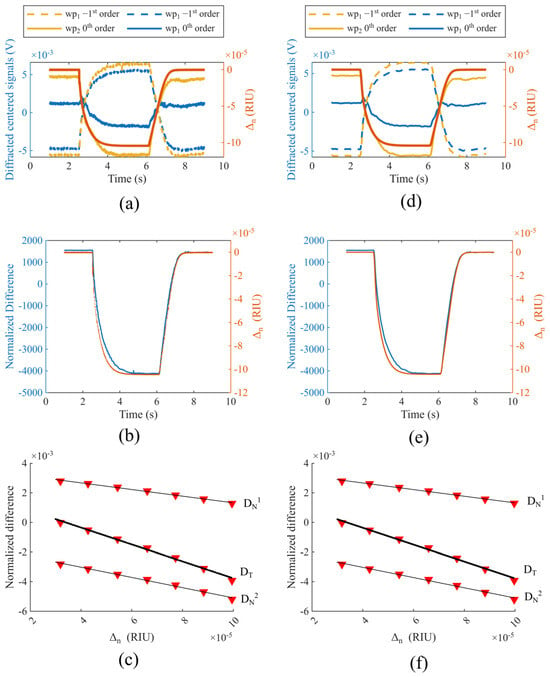
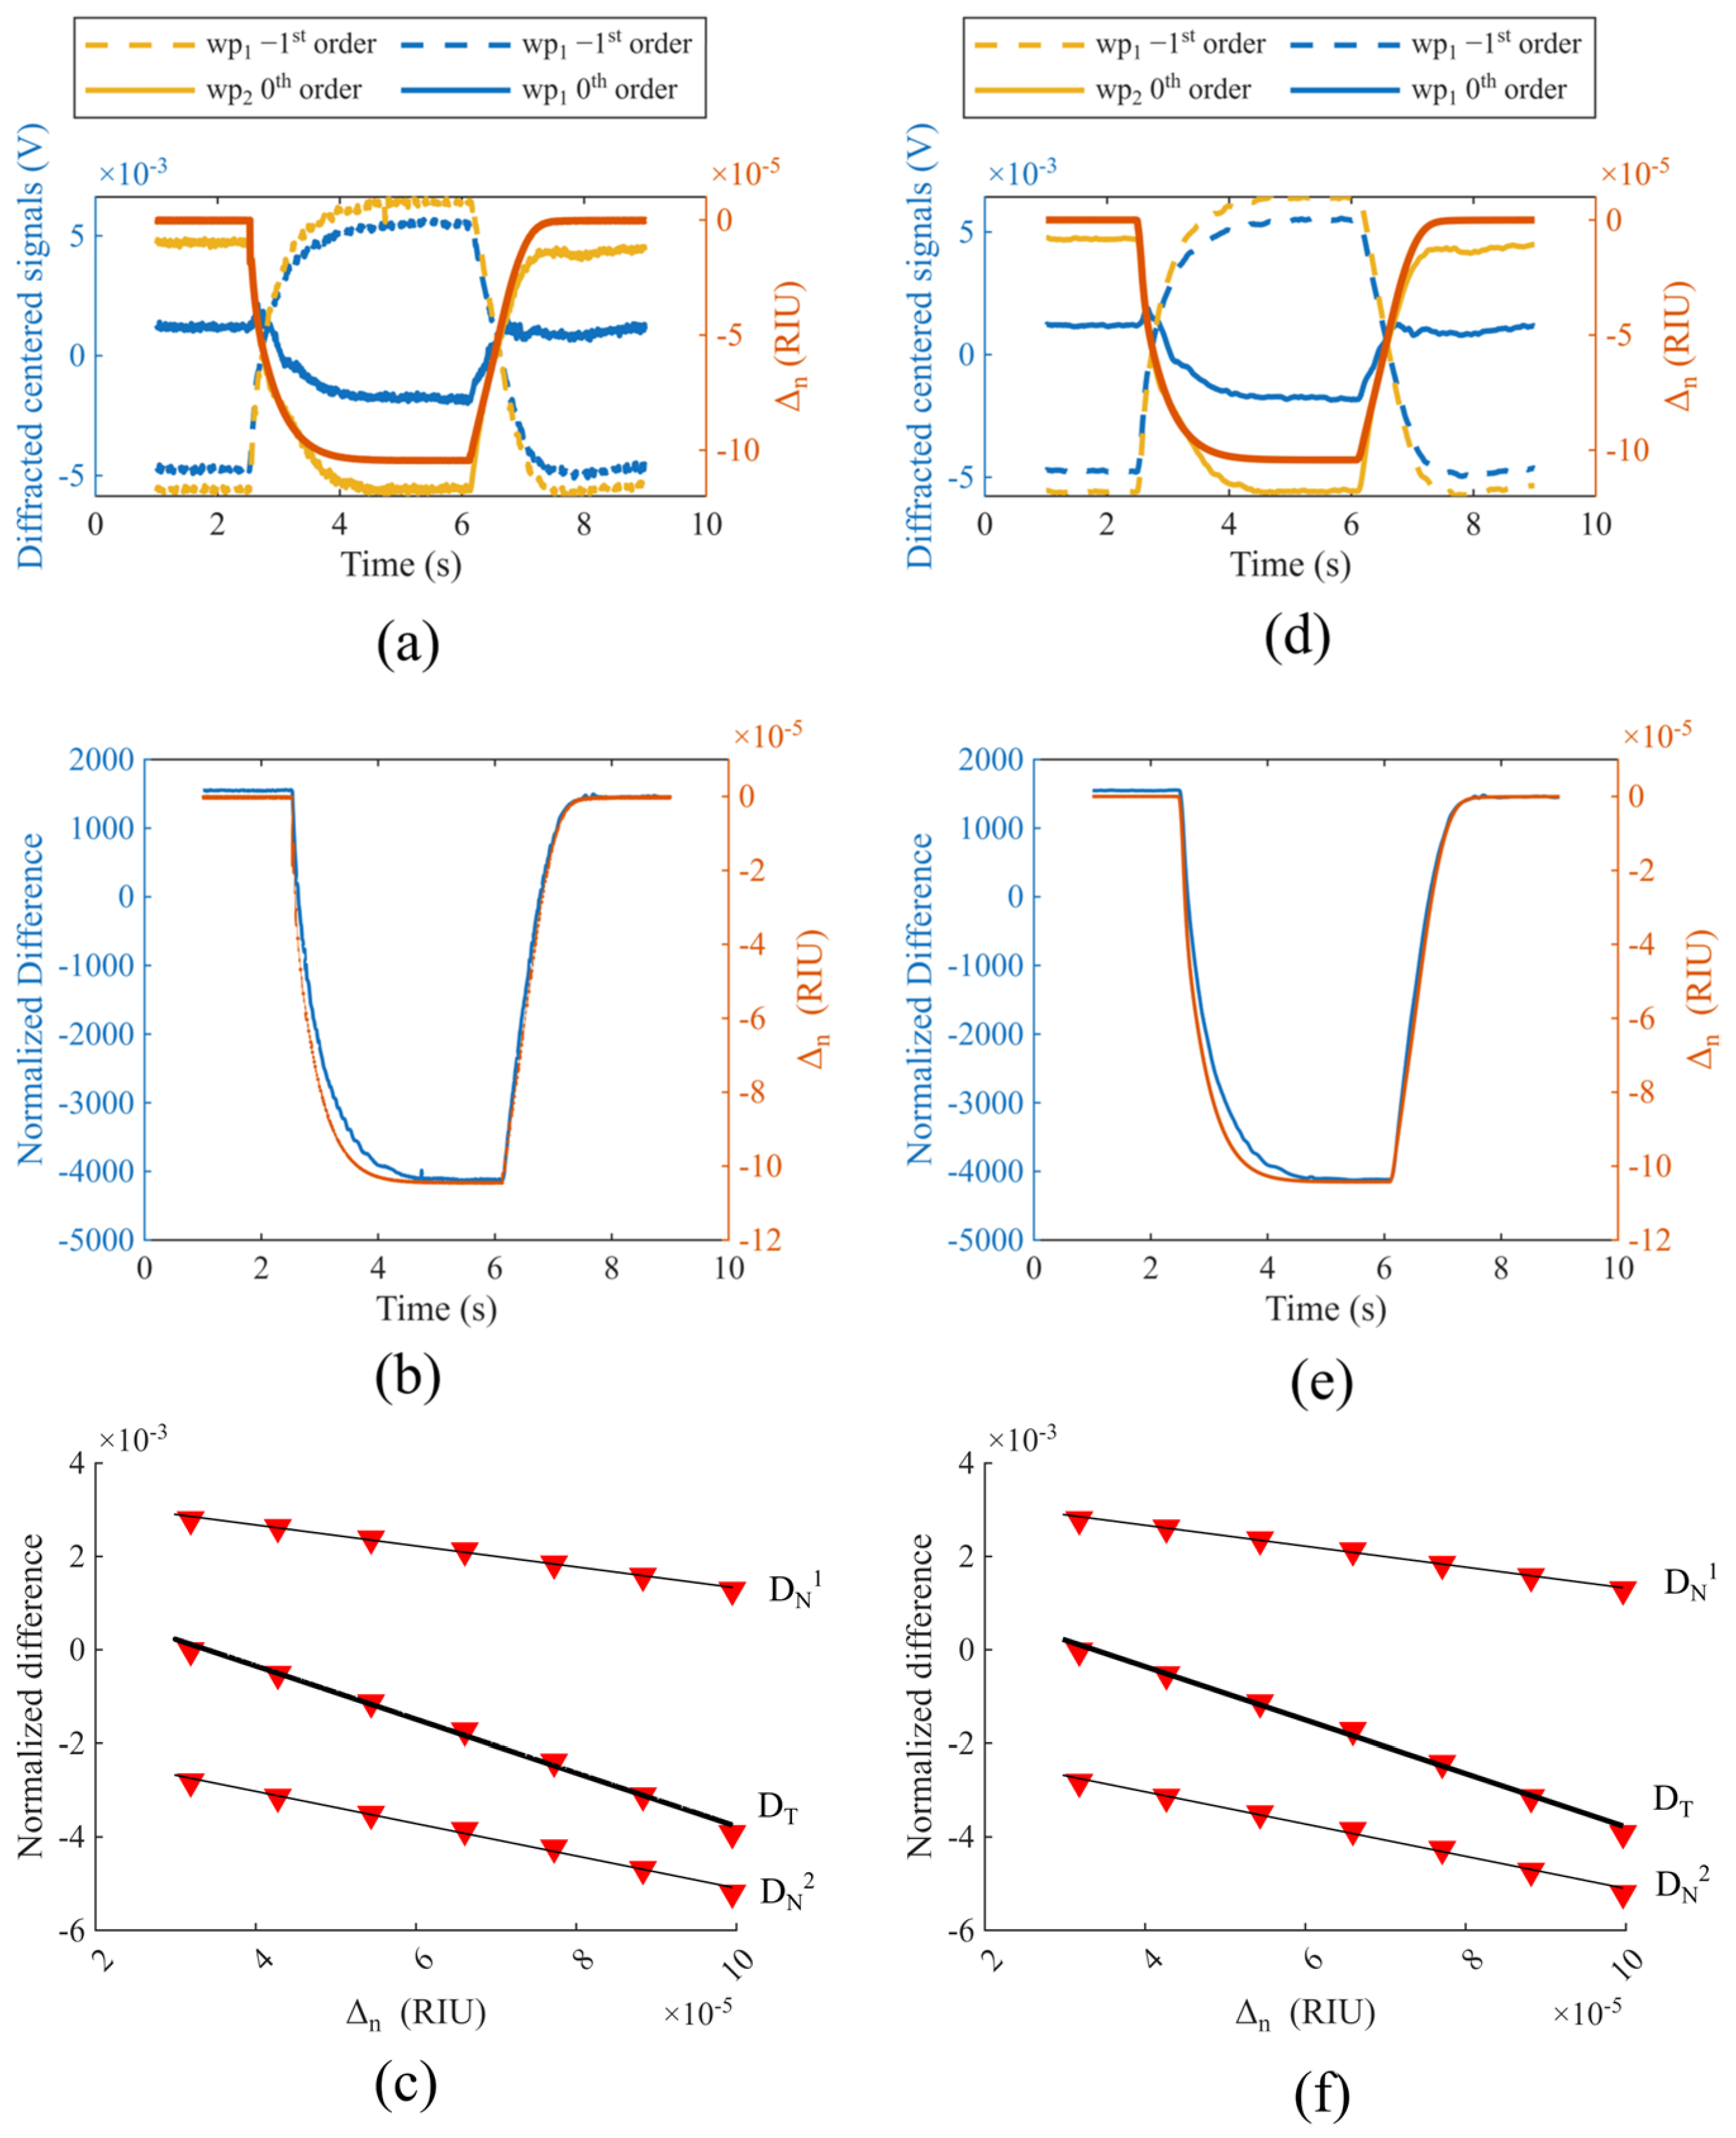
Figure 7a plots the 0th and −1st order intensities and acquired by photodiodes at both angles θwpi and the total normalized difference variations ΔDN resulting from a pressure variation ΔP in the vacuum chamber. The pressure varied from atmospheric pressure (t ∈ [0;3] s, and [7;10] s) to 650 mBar (t ∈ [4;6] s). In Figure 7b, we observe a good correlation between normalized difference and pressure variations. Evaluation of the noise 3σ was performed on the baseline at atmospheric pressure (t ∈ [1;2.5] s), and the sensitivity was evaluated in the time range (t ∈ [6;7] s) using the Edlén equation as described in Section 2.4. Figure 7c represents the normalized difference variation as a function of the refractive index variation and indicates that acquired data can be accurately modeled with a linear fit. The sensitivities, i.e., slopes of the linear models at the two working points wp1 and wp2, are Swp1 = 19.5 RIU−1 and Swp2 = 32.9 RIU−1, respectively, leading to a total sensitivity of S = 52.4 RIU−1. From here it is important to notice that the total sensitivity comes from the sum of two signals acquired at the same time. The slight differences between these experimental measurements and the simulation (Swp1 = 12 RIU−1 and Swp2 = 25.9 RIU−1, cf. Section 2.1) could be explained by uncertainties on the detection areas of photodiodes or in the vacuum chamber’s sealing. More detailed results of signal processing are displayed in Table 1 and Table 2, respectively, with and without sliding average filtering. This second case shows the lowest LOD, with a value of 9.85 × 10⁻⁸ RIU.
Figure 7.
Results without (left column) and with (right column) contribution of a sliding average filter: (a,d) 0th and −1st order intensities and and total normalized difference variations ΔDN as a function of time t during the experiment; (b,e) comparison between normalized difference ΔDN and pressure variations ΔP as a function of time t; (c,f) normalized difference ΔDN as a function of refractive index variation Δn during the experiment, in the time range (t ∈ [6;7] s); dual measurements ΔDT are highlighted with a thick black line.
Table 1.
Results after the demodulation process only (Figure 7c).
Table 2.
Results with the sliding average filter (Figure 7f).
4. Discussion
Working with modulated signals (cf. Section 2.4) allowed us to improve the robustness of the system to variations in ambient light conditions. Regarding only the demodulation part (Figure 7a–c, Table 1), we observe that the band-pass filter coupled with peak maxima detection leads to a noise 3σ = 1.2 × 10⁻⁵ for the sum of the two normalized differences, leading to an LOD of 2.2 × 10⁻⁷ RIU. The addition of a sliding average filter (Figure 7d–f, Table 2) on the demodulated signals allowed us to reduce the noise to 3σ = 5.16 × 10⁻⁶, enabling an LOD 9.85 × 10⁻⁸ RIU, half of the previous result.
Table 3 compares the experimental performance of several SPR-based sensors. The interrogation method used in this work differs significantly from those most commonly reported in the literature, making it challenging to compare sensitivities directly. Nevertheless, results demonstrate that the proposed method achieves an excellent LOD while maintaining a compact design and good manufacturability.
Table 3.
Comparison of recent works providing experimental LOD for SPR refractometric sensor.
5. Conclusions
In this study, we demonstrated a dual measurement on a GC-SPR sensor based on the energy transfer effect using a modulated laser diode to reduce noise. Demodulation processing enabled an LOD of 2.2 × 10⁻⁷ RIU, further reduced to 9.85 × 10⁻⁸ RIU by adding a moving average filter.
The dual measurement setup investigated in this article did improve the LOD compared to individual measurements, but the amount of this improvement remains limited. While the two sensitivities at each crossing point can be summed, inducing a decrease in the LOD, the total standard deviation also increases at the same time, since both sources do not come from the same laser diode. In this regard, a theoretical metrology study has been performed to evaluate the influence on the LOD of using two illuminations issued from the same source: when considering the same intensities for both illuminations, it is possible to reduce the LOD by a factor of , leading to a theorical LOD of 7 × 10⁻⁸ RIU.
Some limitations of these experimental results also need to be addressed. The reported experimental LOD of 9.85 × 10⁻⁸ RIU was estimated according to (3) with a noise 3σ evaluated from the baseline over the (t ∈ [1;2.5] s) window, so that slow drift is ignored. This value characterizes the short-term repeatability of the measurement and should not be interpreted as absolute accuracy. Moreover, laser wavelength instability and TTL-induced chirp could add further systematic error. A more complete characterization, including Allan deviation, long-term stability and repeatability, should be performed in further work.
Although the performance improvement was limited compared to expectations, this dual measurement approach demonstrates the feasibility and interest of implementing such a configuration. This proof of concept also paves the way for multiplexed detection, where each pair of detectors would provide a normalized differential signal dedicated to a specific target (gas or biological species). In this context, the proposed optical sensor is a possible route for the development of new, compact surface plasmon resonance imaging (SPRi)-based sensors. By using an extended collimated source coupled with CMOS detectors to image 0th and −1st reflected diffraction orders, such sensors could enable simultaneous and selective detection of multiple targets, similarly to SPRi systems.
Supplementary Materials
The following supporting information can be downloaded at https://www.mdpi.com/article/10.3390/s26227241/s1, Simple difference versus normalized difference in the plasmon energy transfer effect measurement.
Author Contributions
Methodology, V.D. and I.G.; software, A.M. and F.C.; numerical simulation, P.G. and V.D.; sample fabrication, N.A.; writing—original draft preparation, V.D.; writing—review and editing, I.V., M.R., P.G. and H.B.; supervision, Y.J. All authors have read and agreed to the published version of the manuscript.
Funding
Support for this study was provided by the RAVEN project funded by the European Union’s Horizon Europe research and innovation program under grant agreement number 10 113 5787; Région Auvergne-Rhône-Alpes (CAPTHY project, Pack Ambition Recherche 2021–2024).
Data Availability Statement
All data underlying the results of the paper are present in the paper.
Acknowledgments
Lithography, gold deposition and AFM measurements were performed in the NanoSaintÉtienne platform (Laboratoire Hubert Curien, Saint-Étienne), part of the Renatech+ nanofabrication network.
Conflicts of Interest
The authors declare no conflicts of interest.
Abbreviations
The following abbreviations are used in this manuscript:
| SPR | Surface plasmon resonance |
| SPP | Surface plasmon polariton |
| LIL | Laser lithography interference |
| LOD | Limit of detection |
| TIR | Total internal reflection |
| GC | Grating coupler |
| AFM | Atomic force microscope |
| ADC | Analog to digital |
| DN | Normalized efficiency difference |
| Wp | Working point |
| RIU | Refractive index unit |
| TM | Transverse magnetic |
| RCWA | Rigorous Coupled Wave Analysis |
| FFT | Fast Fourier Transform |
| SPRi | Surface plasmon resonance imaging |
References
- Gordon, J.G., II; Ernst, S. Surface plasmons as a probe of the electrochemical interface. Surf. Sci. 1980, 101, 499–506. [Google Scholar] [CrossRef] [Scilit]
- Liedberg, B.; Nylander, C.; Lunström, I. Surface plasmon resonance for gas detection and biosensing. Sens. Actuators 1983, 4, 299–304. [Google Scholar] [CrossRef] [Scilit]
- Kretschmann, E.; Raether, H. Radiative Decay of Non Radiative Surface Plasmons Excited by Light. Z. Für Naturforschung A 1968, 23, 2135–2136. [Google Scholar] [CrossRef] [Scilit]
- Lv, J.; Wang, J.; Yang, L.; Liu, W.; Fu, H.; Chu, P.K.; Liu, C. Recent advances of optical fiber biosensors based on surface plasmon resonance: Sensing principles, structures, and prospects. Sens. Diagn. 2024, 3, 1369–1391. [Google Scholar] [CrossRef] [Scilit]
- Tiefenthaler, K.; Lukosz, W. Integrated optical switches and gas sensors. Opt. Lett. 1984, 9, 137. [Google Scholar] [CrossRef] [Scilit] [PubMed]
- Piliarik, M.; Homola, J. Surface plasmon resonance (SPR) sensors: Approaching their limits? Opt. Express 2009, 17, 16505. [Google Scholar] [CrossRef] [Scilit] [PubMed]
- Jourlin, Y.; Tonchev, S.; Tishchenko, A.V.; Parriaux, O. Sharp Plasmon-Mediated Resonant Reflection From an Undulated Metal Layer. IEEE Photonics J. 2014, 6, 4801906. [Google Scholar] [CrossRef] [Scilit]
- Murugan, D.; Tintelott, M.; Narayanan, M.S.; Vu, X.; Kurkina, T.; Rodriguez-Emmenegger, C.; Schwaneberg, U.; Dostalek, J.; Ingebrandt, S.; Pachauri, V. Recent Advances in Grating Coupled Surface Plasmon Resonance Technology. Adv. Opt. Mater. 2024, 12, 2401862. [Google Scholar] [CrossRef] [Scilit]
- Kim, R.M.; Lee, S.M.; Han, J.H.; Cho, S.H.; Lv, J.; Im, S.W.; Ha, I.H.; Lee, Y.H.; Lim, D.; Kim, H.; et al. Helicoid Grating-Coupled Surface Plasmon Resonance Sensor. Nano Lett. 2024, 24, 15668–15675. [Google Scholar] [CrossRef] [Scilit] [PubMed]
- Saxena, S.; Rastogi, Y.; Sharma, N.K. Theoretical Analysis of Diffraction Grating-Based SPR Sensor Using the Rigorous Coupled Wave Analysis Method. Plasmonics 2025, 20, 7495–7507. [Google Scholar] [CrossRef] [Scilit]
- Kong, L.; Lv, J.; Gu, Q.; Ying, Y.; Jiang, X.; Si, G. Sensitivity-Enhanced SPR Sensor Based on Graphene and Subwavelength Silver Gratings. Nanomaterials 2020, 10, 2125. [Google Scholar] [CrossRef] [Scilit] [PubMed]
- Wu, L.; Chu, H.S.; Koh, W.S.; Li, E.P. Highly sensitive graphene biosensors based on surface plasmon resonance. Opt. Express 2010, 18, 14395. [Google Scholar] [CrossRef] [Scilit] [PubMed]
- Choi, S.H.; Kim, Y.L.; Byun, K.M. Graphene-on-silver substrates for sensitive surface plasmon resonance imaging biosensors. Opt. Express 2011, 19, 458. [Google Scholar] [CrossRef] [Scilit] [PubMed]
- Bruhier, H.; Verrier, I.; Brunet, J.; Varenne, C.; Celle, F.; Jourlin, Y. Theoretical Investigation of Refractive Index Detection Limit in the Surface Plasmon Resonance-Triggered Switch Effect. IEEE Sens. J. 2024, 24, 40659–40668. [Google Scholar] [CrossRef] [Scilit]
- Sauvage-Vincent, J.; Jourlin, Y.; Petiton, V.; Tishchenko, A.V.; Verrier, I.; Parriaux, O. Low-loss plasmon-triggered switching between reflected free-space diffraction orders. Opt. Express 2014, 22, 13314. [Google Scholar] [CrossRef] [Scilit] [PubMed]
- Laffont, E.; Crespo-Monteiro, N.; Valour, A.; Berini, P.; Jourlin, Y. Differential Sensing with Replicated Plasmonic Gratings Interrogated in the Optical Switch Configuration. Sensors 2023, 23, 1188. [Google Scholar] [CrossRef] [Scilit] [PubMed]
- Giraud, P.; Varenne, C.; Brunet, J.; Ndiaye, A.; Verrier, I.; Bruhier, H.; Meyer, A.; Girault, I.; Arnould, F.; Celle, F.; et al. Ppb detection level’s hydrogen sensor using a SPR grating in the triggered switching configuration. Opt. Express 2025, 33, 29648. [Google Scholar] [CrossRef] [Scilit] [PubMed]
- Bruhier, H.; Dutems, J.; Laffont, E.; Crespo-Monteiro, N.; Verrier, I.; Parriaux, O.; Berini, P.; Jourlin, Y. Common-mode plasmon sensing scheme as a high-sensitivity compact SPR sensor. Opt. Lett. 2023, 48, 3733. [Google Scholar] [CrossRef] [Scilit] [PubMed]
- Bsawmaii, L.; Giraud, P.; El Haber, G.; Halagacka, L.; Chatelon, J.-P.; Jamon, D.; Jourlin, Y.; Royer, F. Magneto-plasmonic “switch” device for magnetic field detection. Nanophotonics 2024, 13, 3689–3698. [Google Scholar] [CrossRef] [Scilit] [PubMed]
- Tishchenko, A.V.; Parriaux, O. Coupled-Mode Analysis of the Low-Loss Plasmon-Triggered Switching Between the 0 th and -1 st Orders of a Metal Grating. IEEE Photonics J. 2015, 7, 4800909. [Google Scholar] [CrossRef] [Scilit]
- Chandezon, J.; Raoult, G.; Maystre, D. A new theoretical method for diffraction gratings and its numerical application. J. Opt. 1980, 11, 235–241. [Google Scholar] [CrossRef] [Scilit]
- Li, L.; Chandezon, J.; Granet, G.; Plumey, J.-P. Rigorous and efficient grating-analysis method made easy for optical engineers. Appl. Opt. 1999, 38, 304. [Google Scholar] [CrossRef] [Scilit] [PubMed]
- Lyndin, N.M.; Usievich, B.A. MC Grating Software, version 2026-05-25; General Physics Institute: Moscow, Russia, 2026; Available online: https://mcgrating.com (accessed on 4 November 2026).
- Edee, K.; Plumey, J.P.; Chandezon, J. On the Rayleigh–Fourier method and the Chandezon method: Comparative study. Opt. Commun. 2013, 286, 34–41. [Google Scholar] [CrossRef] [Scilit]
- Lawall, J.; Bao, Y.; Gorman, J.J. Accurate measurement of the photonic crystal slab period using diffraction in the Littrow configuration. Opt. Express 2021, 29, 37091. [Google Scholar] [CrossRef] [Scilit] [PubMed]
- Leal-Junior, A.; Silveira, M.; Kepak, S.; Nedoma, J.; Martinek, R.; Marques, C. Comprehensive review of distributed acoustic sensing technology: Principles, configurations, applications and emerging trends. Opto-Electron. Adv. 2026, 9, 250290. [Google Scholar] [CrossRef] [Scilit]
- Wu, J.; Xu, Z.; Shi, Y.; Liang, Y.; Sun, Q. Phase matching sampling algorithm for sampling rate reduction in time division multiplexing optical fiber sensor system. Opto-Electron. Technol. 2025, 1, 250006. [Google Scholar] [CrossRef] [Scilit]
- Stone, J.; Zimmerman, J. Index of Refraction of Air, Index of Refraction of Air. 2001. Available online: http://emtoolbox.nist.gov/Wavelength/Documentation.asp (accessed on 7 October 2026).
- Bruhier, H.; Verrier, I.; Gueye, T.; Varenne, C.; Ndiaye, A.; Parriaux, O.; Veillas, C.; Reynaud, S.; Brunet, J.; Jourlin, Y. Effect of roughness on surface plasmons propagation along deep and shallow metallic diffraction gratings. Opt. Lett. 2022, 47, 349. [Google Scholar] [CrossRef] [Scilit] [PubMed]
- Yu, S.; Cao, K.; Cao, J.; Kong, Y.; Zheng, Y.; Wan, W. Portable SPR sensor with laser interference lithography –Fabricated Ag nanogratings for high-sensitivity biosensing. Sens. Actuators Phys. 2026, 399, 117399. [Google Scholar] [CrossRef] [Scilit]
- Long, S.; Wang, E.; Wu, M.; Zhu, H.; Xu, N.; Wang, Y.; Cao, J. Sensing absorptive fluids with backside illuminated grating coupled SPR sensor fabricated by nanoimprint technology. Sens. Actuators Phys. 2022, 337, 113416. [Google Scholar] [CrossRef] [Scilit]
- Vashistha, N.; Abuleil, M.J.; Shrivastav, A.M.; Bajaj, A.; Abdulhalim, I. Real-Time Ellipsometric Surface Plasmon Resonance Sensor Using Polarization Camera May Provide the Ultimate Detection Limit. Biosensors 2023, 13, 173. [Google Scholar] [CrossRef] [Scilit] [PubMed]
- Koresawa, H.; Seki, K.; Nishimoto, K.; Hase, E.; Tokizane, Y.; Yano, T.-A.; Kajisa, T.; Minamikawa, T.; Yasui, T. Real-time hybrid angular-interrogation surface plasmon resonance sensor in the near-infrared region for wide dynamic range refractive index sensing. Sci. Rep. 2023, 13, 15655. [Google Scholar] [CrossRef] [Scilit] [PubMed]
- Xu, X.; Xie, P.; Ren, J.; Wang, G. Realization and optimization of the gold-mesoporous silica based bimodal surface plasmon resonance sensor with digital Gaussian filter. Meas. Sci. Technol. 2024, 35, 125118. [Google Scholar] [CrossRef] [Scilit]
- Li, W.; Li, J.; Li, R.; Chen, G.J.; Shum, P.P.; Zou, Y.; Chen, R.T.; Dong, Y.; Xu, X. Breaking the Bottleneck in Limit of Detection of Surface Refractive Index Sensing by Harnessing Meta-Waveguide Microring Resonators. Adv. Sci. 2026, 13, e75339. [Google Scholar] [CrossRef] [Scilit] [PubMed]
- Valero, M.; Northfield, H.; Choi, H.; Mayoral-Astorga, L.-A.; Killaire, G.; Weck, A.; De Leon, I.; Ray, M.; Berini, P. Fabrication of surface plasmon interferometric sensors exploiting multimode nanoslits. J. Phys. Photonics 2025, 7, 035018. [Google Scholar] [CrossRef] [Scilit]
- Fotiadis, K.; Chatzianagnostou, E.; Spasopoulos, D.; Simos, S.; Bellas, D.V.; Bhalerao, O.; Suckow, S.; Schall-Giesecke, A.L.; Lemme, M.; Weeber, J.-C.; et al. High-Sensitivity Bimodal Plasmo-Photonic Refractive Index Sensor. ACS Photonics 2023, 10, 2580–2588. [Google Scholar] [CrossRef] [Scilit]

Disclaimer/Publisher’s Note: The statements, opinions and data contained in all publications are solely those of the individual author(s) and contributor(s) and not of MDPI and/or the editor(s). MDPI and/or the editor(s) disclaim responsibility for any injury to people or property resulting from any ideas, methods, instructions or products referred to in the content. |
© 2026 by the authors. Licensee MDPI, Basel, Switzerland. This article is an open access article distributed under the terms and conditions of the Creative Commons Attribution (CC BY) license.