


Abstract
Human nails are a durable, non-invasively collected keratin matrix that records exposure over months. We assessed whether attenuated total reflection Fourier transform infrared (ATR FT-IR) spectroscopy of intact fingernail clippings, combined with machine learning, can discriminate self-reported smokers from non-smokers. Spectra (n = 3681) from 87 donors (42 smokers, 45 non-smokers) were second-derivative transformed, truncated to the informative regions and L2-normalized. PLS-DA and a radial-basis-function support-vector-machine discriminant analysis (SVM-DA) were developed with fully nested, donor-grouped tuning and evaluated over ten repeated 20-donor hold-outs at the spectrum and donor levels. Aggregating spectra per donor improved discrimination (+0.07–0.09 AUROC). SVM-DA on all nails reached a donor-level AUROC of 0.86 (95% CI 0.75–0.98; balanced accuracy 0.77, specificity 0.91, sensitivity 0.62); PLS-DA, logistic regression and random forest reached 0.79–0.84, with no statistically significant differences. Smokers were older and predominantly male: sex and age alone gave an AUROC of 0.79; adding the spectral score raised it to 0.89, an uncertain gain (95% CI −0.04 to 0.23), and SVM-DA retained an AUROC of 0.79 in male donors only. ATR FT-IR of nails carries a smoking-associated signal, but confirmation in a demographically matched, biochemically verified, independent cohort is required before forensic use.
1. Introduction
Fingernail and toenail clippings have emerged as a capable alternative matrix for drug and exposure monitoring. As the nail grows, the germinal matrix continuously incorporates circulating compounds into the keratin, so that xenobiotics and their metabolites accumulate and are retained for months, providing a long-term record of exposure [1,2]. Because nails are mechanically robust, easily and non-invasively collected, stable at room temperature, and require little sample preparation, they are increasingly attractive for forensic toxicology [2,3].
A wide range of drugs and metabolites, including nicotine, opioids, cannabinoids, cocaine, and amphetamines, has been detected in nail clippings [3,4]. Beyond drugs, a nail’s biochemical composition reflects nutrition, disease, and environmental exposure, making it a broadly informative investigative substrate [5]. Tobacco smoke is a particularly relevant exposure: nicotine and its metabolite cotinine are deposited into keratinized tissues, and nail nicotine is a validated biomarker of cumulative tobacco smoke exposure with a longer look-back window than urine or saliva [6,7]. Current approaches to establishing smoking status nevertheless have practical limitations. Self-reporting is inexpensive but systematically under-reports smoking [8]; biochemical verification relies on targeted quantification of nicotine, cotinine or other tobacco-specific analytes by chromatographic or immunochemical methods [9], which, for keratinized matrices, requires washing, digestion or extraction, consumes the specimen, and is laboratory-bound [3,6]. Vibrational spectroscopy has already differentiated smokers from non-smokers from oral-fluid Raman spectra [10]. Most directly, two very recent studies detected cotinine in fingernails by ATR FT-IR after alkaline extraction, using targeted band analysis and, in one case, PCA and PLS-DA to fully discriminate e-cigarette users from non-users [11,12]; tobacco-induced infrared changes have likewise been reported in serum [13]. These approaches target a specific extracted analyte at low concentration, whereas we ask whether chronic smoking imparts a detectable change to the intact nail’s keratin fingerprint, which would allow rapid, non-destructive screening of the clipping itself, leaving it available for confirmatory analysis.
A plausible biochemical basis for such a change exists, although it has not been established for nails. Tobacco smoke delivers reactive oxygen and nitrogen species and stable free radicals that cause systemic oxidative stress [14], and smoking is a recognized cause of premature skin aging through oxidative damage and altered extracellular matrix turnover [15]. In keratinized tissue, oxidation of cysteine and other side chains, altered disulfide cross-linking, and changes in incorporated lipids could modify hydrogen bonding and protein conformation, which would be reported by the conformation-sensitive Amide A, I and II bands and by the C–H stretching and bending bands of lipids [16]. Such changes would be small, broad and non-specific. They therefore have to be distinguished from spectral variation associated with donor sex and age, which is itself detectable in nail spectra [17,18,19], and from nutrition, disease, environmental and occupational exposures, and cosmetic treatment [5,20,21].
ATR FT-IR spectroscopy is well suited to interrogating such fingerprints, providing reproducible, non-destructive spectra with minimal sample preparation [22]. It has been applied across forensic science to gunshot residue [22], hair differentiation [23], and donor age estimation from blood [24], and reviewed extensively [25]. For nails specifically, chemometric ATR FT-IR has monitored keratin glycation [20] and chlorine exposure [21]; our group has screened long-term alcohol consumption [26], donor sex [18], donor age [19] and fentanyl use [27], and an independent group has classified sex [17], in each case at the donor level.
Partial least-squares discriminant analysis (PLS-DA) is the established chemometric tool for this matrix [26,28], but biological spectra can contain non-linear class structures that a kernel method such as support-vector-machine discriminant analysis (SVM-DA) with a radial-basis-function (RBF) kernel [29] may capture. We hypothesized that chronic smoking produces a reproducible, multivariate change in the ATR FT-IR spectrum of intact nail keratin that is detectable at the donor level after aggregation of replicate spectra and is not explained by donor sex and age alone. The main contributions of this study are: (i) a whole-matrix, extraction-free approach to smoking-status classification, in contrast to targeted cotinine detection, which requires chemical extraction and isolates a single analyte band [11,12]; (ii) a characterization of the smoking-related spectral pattern, separating the descriptive group difference from the spectral regions that support classification; (iii) a comparison of linear (PLS-DA, logistic regression) and non-linear (SVM-DA, random forest) classifiers under identical, fully nested, donor-grouped validation, with uncertainty estimates that account for the dependence between repeated hold-outs; (iv) a quantification of the benefit of donor-level aggregation of replicate spectra; (v) a comparison of the dorsal and ventral nail surfaces; and (vi) an explicit assessment of demographic confounding.
2. Materials and Methods
2.1. Participants and Sample Collection
Nail clippings were collected from adult volunteers under Texas Tech University IRB approval (No. IRB2022-211); the samples and the spectra analyzed here were acquired as part of a doctoral dissertation [30]. Donors were recruited by snowball sampling, and samples were collected anonymously; only age, sex and smoking status were recorded. Smoking status was self-reported and was not biochemically verified. Smokers were daily smokers of at least 3–5 cigarettes per day and smoked tobacco only in paper-wrapped form (manufactured or hand-rolled cigarettes), not in pipes or electronic cigarettes; some smokers additionally used smokeless tobacco products held in the mouth. Non-smokers did not use tobacco in any form and were either never-smokers or had not smoked for at least one year before sample collection; because a fingernail is fully replaced within approximately six months [1,2], clippings from these donors consisted of nails formed after any former smoking. Smoking duration was not recorded. Information on alcohol use, medication and occupational exposure was not collected. Samples were collected in two batches that differed in collection time: donors BD-1 to BD-79 and donors BD-80 to BD-95 (all smokers); the latter is referred to as batch B. The eligibility criterion was healthy nails; donors with nail disease or nail polish were excluded. Each donor contributed one or more fingernail clippings (length ≥ 1 mm; up to eight per surface, as recorded in the file names), measured on both the dorsal (upper) and ventral (under) surfaces; samples were cleaned with reagent-grade 70% isopropyl alcohol and stored in coded zip-lock bags. Handling followed the protocol established for this matrix in our laboratory [18,26].
2.2. ATR FT-IR Spectroscopic Analysis
Spectra were recorded on a Nicolet iS20 (Thermo Fisher Scientific, Waltham, MA, USA) spectrometer with a single-reflection diamond ATR accessory, controlled by OMNIC 9.12 software (Thermo Fisher Scientific, Waltham, MA, USA). Each spectrum was the average of 32 scans at 4 cm−1 nominal resolution over 4000–400 cm−1 (data spacing 0.482 cm−1); a background was recorded before each sample, and several spots were measured per clipping and surface to sample matrix heterogeneity. The crystal was cleaned with isopropanol between samples, and reproducible optical contact was ensured with the pressure tower of the ATR accessory, whose slip-clutch mechanism limits the applied force so that the same pressure is applied to every sample [26]. Spectra were inspected visually for insufficient contact (low absorbance) and contamination before export. Instrumental repeatability was not assessed separately; instead, replicate spectra from several spots and clippings of each donor were acquired, and their variability was carried into the analysis (Section 2.4). Isopropyl alcohol (70%) is volatile and was allowed to evaporate before measurement; because all included samples were cleaned identically, any residual effect of the cleaning step (e.g., partial removal of surface lipids) applies equally to both groups. Band assignments (Table 1) are taken from established literature on nail and hair keratin and proteins [16,17,31,32,33].
Table 1.
Principal ATR FT-IR bands of human nails and their assignments [16,17,31,32,33], with the smoker − non-smoker difference observed in this study. Differences are computed from per-donor mean dorsal spectra (40 smokers, 45 non-smokers), L2-normalized over the modeled regions (3800–2669 and 1711–600 cm−1), in units of 10−3 normalized absorbance; the ratio is the difference divided by its standard error, and p is from Welch’s t-test. The analysis is exploratory: p-values are unadjusted for the ten bands listed and for the many wavenumbers inspected, and they should not be interpreted as evidence for an effect at any individual band. Because the spectra are L2-normalized, the differences are relative (band-shape) changes, not absolute changes in abundance.
2.3. Data Set and Preprocessing
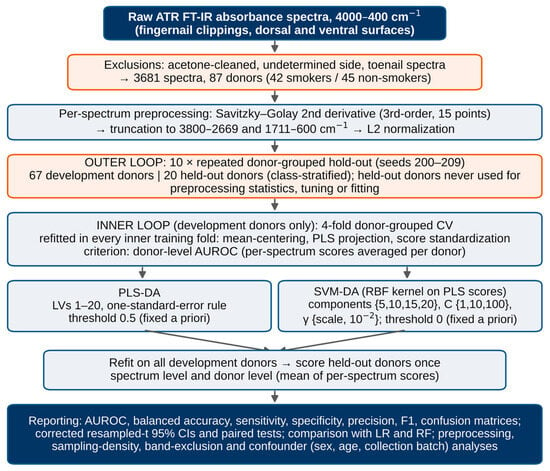
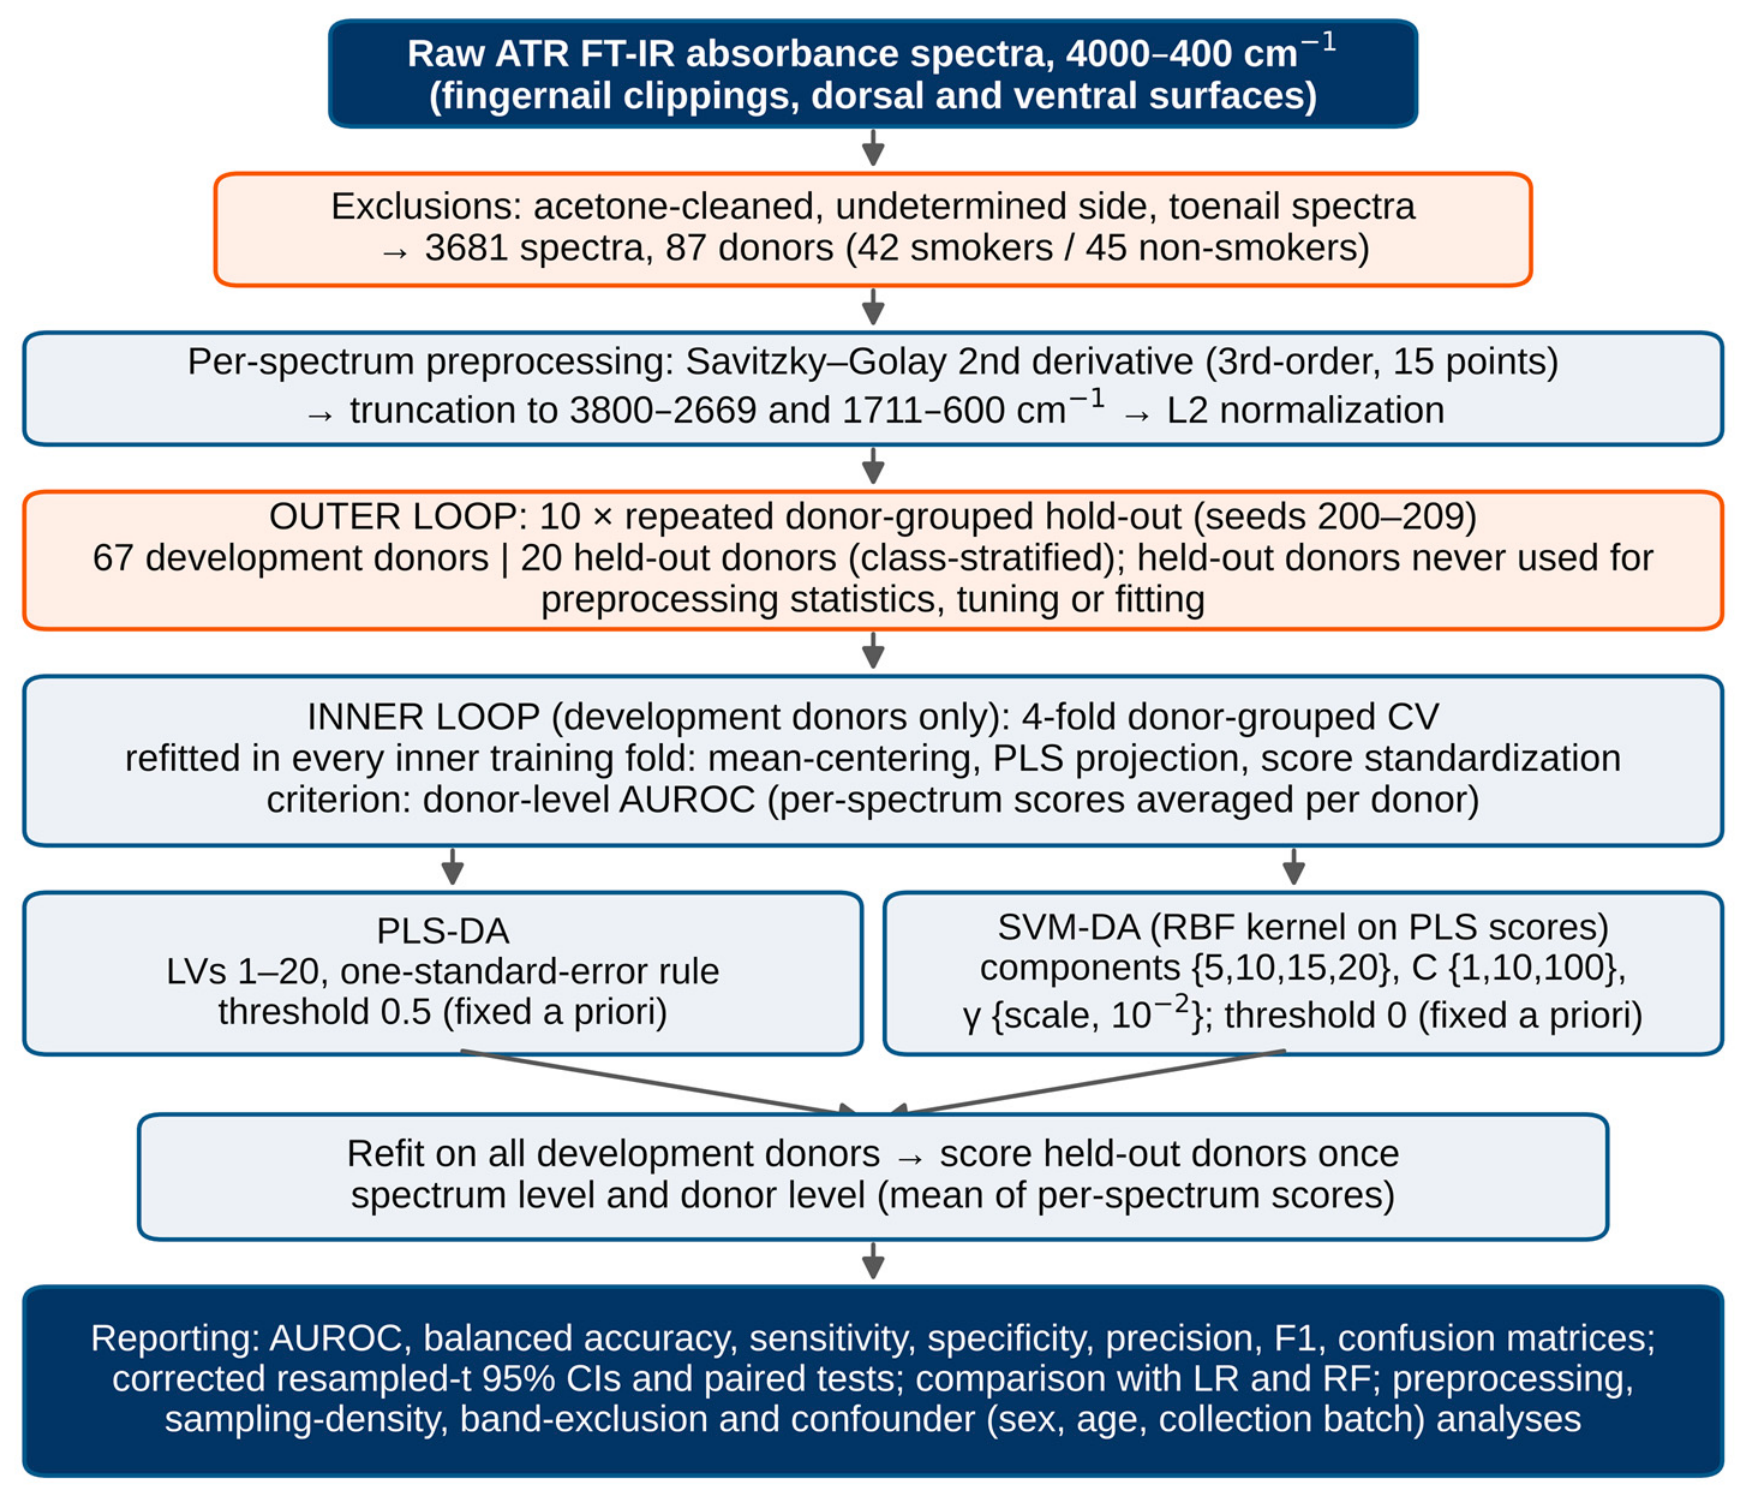
Of 4198 exported spectra from 93 donors, spectra labeled as acetone-cleaned (inconsistent with the isopropanol cleaning protocol; 409 spectra, five donors removed entirely), of undetermined nail side (49 spectra) and of a toenail (59 spectra, one donor) were excluded, leaving 3681 fingernail spectra from 87 donors (42 smokers, 45 non-smokers): 1866 dorsal spectra from 85 donors and 1815 ventral spectra from 85 donors (Table 2). Preprocessing comprised three per-spectrum steps, applied identically to every spectrum and therefore requiring no information from other samples (Figure 1): (i) a second-order Savitzky–Golay derivative [34] (third-order polynomial, 15-point window, i.e., 6.8 cm−1 at the 0.482 cm−1 data spacing, comparable to the nominal resolution), computed on the full acquired spectrum so that no filter window straddles the junction of the two retained regions (polynomial extrapolation was used at the 4000 and 400 cm−1 edges, which lie outside the retained regions); (ii) truncation to 3800–2669 and 1711–600 cm−1, removing the diamond-crystal absorption region and the noisy spectral edges, as in our prior nail studies [18,19]; and (iii) L2 (vector) normalization. The derivative removes constant and linear baseline offsets and sharpens overlapping bands, whereas the L2 normalization compensates for multiplicative intensity differences, such as those caused by variable optical contact [35]. Mean-centering was the only data-dependent preprocessing step and was estimated within each training partition (Section 2.4). To support the choice of preprocessing, four alternatives were evaluated with identical splits, tuning and classifiers: absorbance spectra without baseline correction; asymmetric least-squares (AsLS) baseline-corrected absorbance [36] (λ = 105, p = 0.01, applied separately to each retained region); a Savitzky–Golay first derivative (15 points); and the second derivative with 9-, 25- and 35-point windows; all were followed by L2 normalization.
Table 2.
Donor characteristics and dataset structure after exclusions. Age is given as mean ± SD (median; range). One smoker (BD-91) had no recorded age or sex.
Figure 1.
Analytical workflow. Spectra were second-derivative transformed over the full acquired range, truncated and L2-normalized per spectrum; all data-dependent steps (mean-centering, PLS projection, standardization) and hyperparameter tuning were performed within donor-grouped training partitions only, and performance was estimated over ten repeated 20-donor hold-outs drawn from the same cohort.
2.4. Validation Strategy
Because each donor contributes many spectra, the effective sample size is the number of donors, and the spectra of the same donor must never be split between training and evaluation [37]. Performance was estimated by repeated donor-grouped hold-out validation: in each of ten repeats (random seeds 200–209) 20 donors (10 smokers, 10 non-smokers; class-stratified) were withheld entirely, and the remaining 67 donors (32 smokers, 35 non-smokers) formed the development set. Because the hold-outs were drawn independently, they overlap: across the ten repeats, 81 of the 87 donors were held out at least once (median two times, range 1–6) and six were never held out. All repeats are drawn from the same cohort, so this design estimates internal generalization to new donors from the same population and is not an independent external validation [38]. Within each development set, hyperparameters were tuned by 4-fold donor-grouped, class-stratified cross-validation (inner loop), and every data-dependent transformation (mean-centering, the PLS projection, standardization of PLS scores or of spectral variables) was refitted within each inner training fold, so that inner validation donors never influenced the transformations used to score them [39]. The tuning criterion was the donor-level AUROC of the inner validation folds. The selected configuration was refitted on all development donors and applied once to the held-out donors. Evaluation was performed at two levels: the spectrum level (AUROC over individual spectra) and the forensically relevant donor level, at which the per-spectrum decision scores (the predicted response for PLS-DA, the decision-function value for SVM-DA and logistic regression, and the class-1 probability for random forest) of a donor were averaged to a single score [26]. Classification thresholds were fixed a priori and were never estimated from held-out data: 0.5 for PLS-DA (midpoint of the 0/1 class coding), 0 for SVM-DA and logistic regression, and 0.5 for random forest probabilities. Model fitting was performed on individual spectra, so donors with more spectra contributed more weight; to test whether this, or the unequal numbers of spectra per donor and surface, affected the results, all models were re-evaluated with at most eight randomly selected spectra per donor (equalized sampling) in both development and held-out sets. All analyses were executed on the same ten donor partitions.
2.5. Classifiers
Four classifiers were evaluated. PLS-DA [28] performs supervised dimension reduction into latent variables (LVs) that maximize covariance with the 0/1 class label. SVM-DA used an RBF kernel [29] on standardized PLS scores, the PLS projection serving as supervised dimension reduction; the number of PLS components, the regularization constant C and the kernel width γ were tuned. To establish whether a non-linear model offers a meaningful advantage, two further classifiers were added: an L2-penalized logistic regression (LR) on standardized spectral variables (penalty C tuned) as a simple linear baseline, and a random forest (RF) [40] of 500 trees with √p variables per split and otherwise default settings (not tuned). Spectra were exported with PLS_Toolbox 9.0 (Eigenvector Research, Manson, WA, USA) in MATLAB R2024b (MathWorks, Natick, MA, USA); all analyses were performed in Python 3.13 with NumPy 2.5.3, SciPy 1.18.1 and scikit-learn 1.9.1 [41]. PLS was implemented as the NIPALS PLS1 algorithm, numerically identical (maximum difference <10−13) to scikit-learn’s PLSRegression without scaling.
2.6. Hyperparameter Tuning
Hyperparameters were selected by grid search in the inner loop (Section 2.4). For PLS-DA, all models with 1–20 LVs were evaluated, and the smallest number of LVs whose mean inner AUROC was within one standard error of the maximum was selected (one-standard-error rule [42]), to limit over-fitting with ~2800 development spectra from 67 donors; the upper bound of 20 exceeded the number selected in every repeat for all three surface subsets. For SVM-DA, the number of PLS components was searched over {5, 10, 15, 20}, C over {1, 10, 100} and γ over {scale, 10−2} (scale = 1/number of components for standardized inputs), and the combination with the highest mean inner AUROC was selected. For LR, C was searched over {10−4, 10−3, 10−2, 10−1}. This nested procedure, including re-tuning, was repeated within each of the ten hold-outs, so that reported performance reflects the variability of the entire develop-and-deploy pipeline, not a single tuned model. The selected PLS-DA models had a median of 11 LVs (range 2–16) for all nails; SVM-DA used 10–20 (mostly 15–20) PLS components, whereas the selected C and γ varied between repeats.
2.7. Statistical Analysis and Model Interpretation
For each configuration, AUROC [43], balanced accuracy, sensitivity (smokers correctly classified), specificity, precision and F1-score were computed on the held-out donors of each repeat at the fixed thresholds and are reported as mean ± SD over the ten repeats; confusion matrices were pooled over repeats (200 donor-level predictions for all nails (10 × 20), 195 for dorsal and 193 for ventral nails; two donors without dorsal and two without ventral spectra (5 and 7 held-out occurrences) were omitted from the corresponding single-surface analyses, in both development and held-out sets). The SD describes the variation of single hold-out estimates, not the uncertainty of their mean. Because the repeated hold-outs share donors and development sets, the naive standard error of the mean underestimates this uncertainty; 95% confidence intervals and paired comparisons between configurations (computed on the same partitions) therefore used the corrected resampled t-test, which inflates the variance by the factor (1/J + ntest/ntrain) for J = 10 repeats [44], where ntest and ntrain are the mean numbers of held-out and development donors of the given analysis (20 and 67 for all nails, 19.5 and 65.5 for dorsal, 19.3 and 65.7 for ventral nails, and correspondingly fewer in the restricted analyses). To identify the spectral regions supporting classification, variable importance in projection (VIP) scores were computed from a PLS-DA model fitted to all donors with the median selected number of LVs (descriptive), and a band-exclusion analysis repeated the complete validation with each of six spectral regions removed in turn. Confounding by donor sex, age and collection batch was examined in three ways: (i) a logistic model of sex and age alone, fitted on development donors and evaluated on the same held-out donors; (ii) the same model with the SVM-DA donor score added, in which the development-donor scores were the inner-loop out-of-fold scores of the selected configuration, so that held-out donors were not used; and (iii) re-running the complete validation restricted to male donors, to donors outside batch B, and to male donors outside batch B. One smoker (BD-91) without recorded age and sex was excluded from analyses (i)–(iii).
3. Results
3.1. Donor Characteristics
The two groups differed in sex, age and collection batch (Table 2). Smokers were predominantly male (37 of 41 with recorded sex vs. 24 of 45 non-smokers; Fisher’s exact p < 0.001) and older (median 38 vs. 27 years; Mann–Whitney p = 0.015). The age difference persisted among male donors (median 38 vs. 23.5 years; p < 0.001). All 15 batch-B donors were smokers and were older than batch-A smokers (median 50 vs. 36 years). Outside batch B, smokers and non-smokers had similar ages (p = 0.48), but none of the remaining smokers was female. Non-smokers contributed more spectra per donor than smokers (median 42 vs. 34; p = 0.009).
3.2. Group Mean Spectra
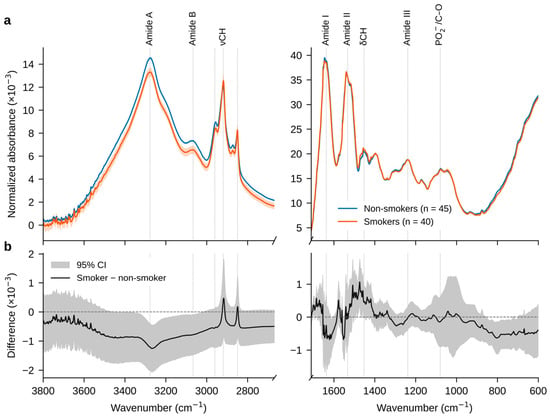
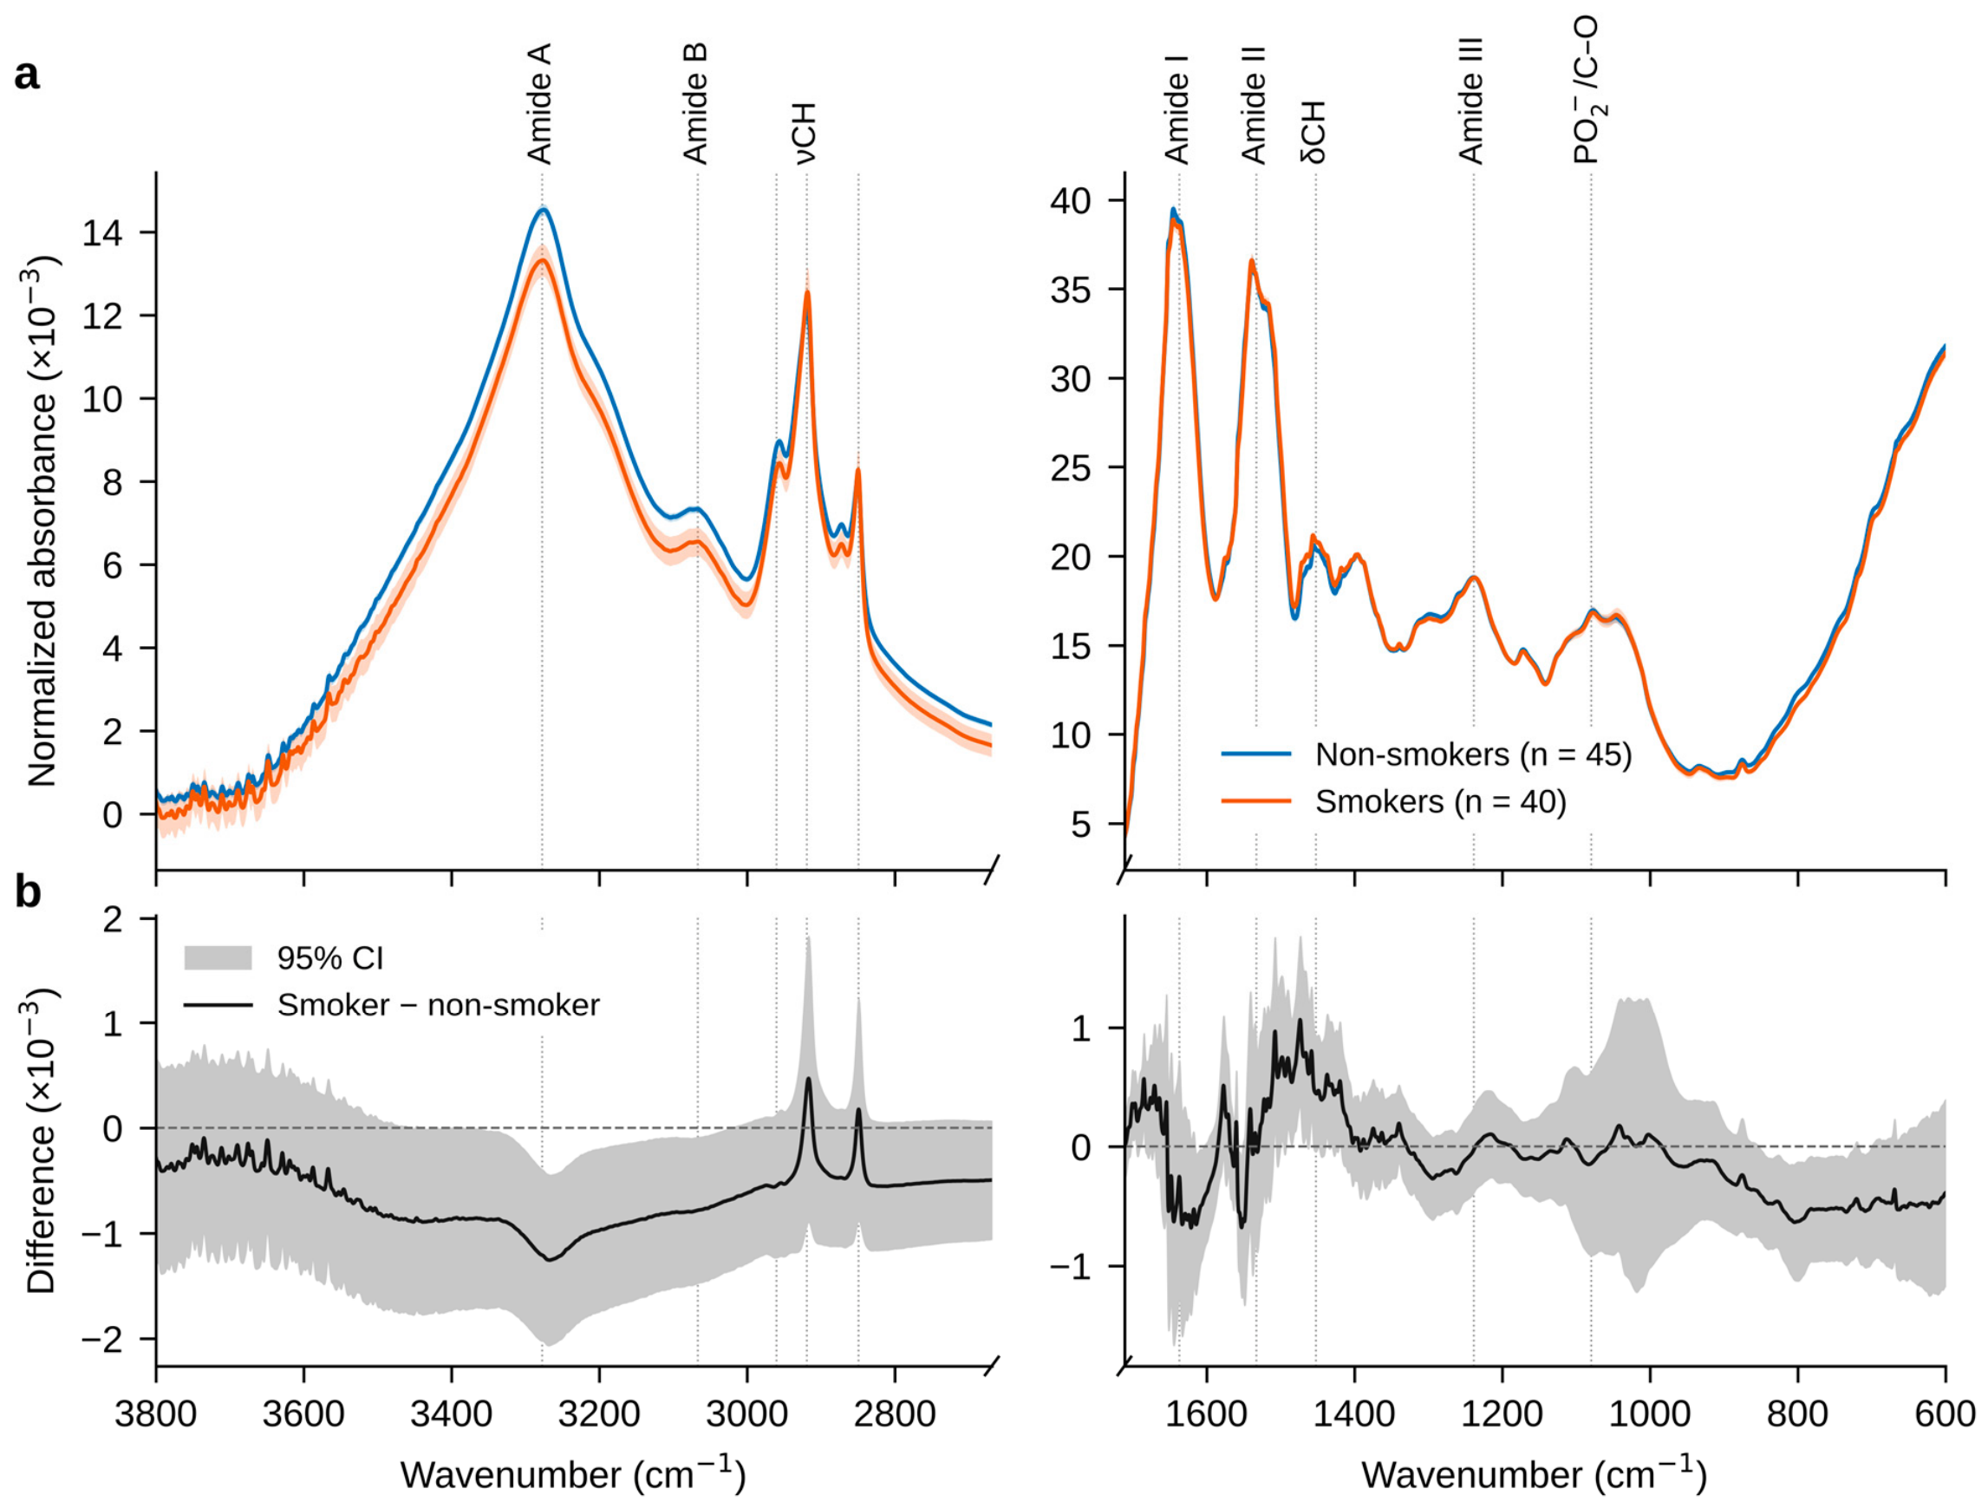
The mean dorsal spectra of the two groups are visually near-identical (Figure 2a), confirming that differentiation is impossible by inspection and requires multivariate analysis, as previously observed for alcohol [26] and fentanyl [27] in the same matrix. The difference in the L2-normalized mean spectra (Figure 2b; Table 1) is band-specific: smokers show a lower relative intensity of the Amide A (3278 cm−1; difference-to-SE ratio 2.9, p = 0.005) and Amide B (3067 cm−1; ratio 2.2, p = 0.03) bands, as well as of the CH3 asymmetric stretching band (2961 cm−1; ratio 1.6), and a slightly higher relative intensity in the CH2/CH3 bending region (1452 cm−1; ratio 1.8), whereas the Amide I, Amide II, Amide III and phosphate bands differ little. Because the spectra are L2-normalized, these are relative band-shape differences: a lower normalized Amide A intensity may reflect altered N–H hydrogen bonding of keratin, a change in water or lipid content, or differences in optical contact, and does not by itself establish a change in keratin secondary structure or lipid abundance. These univariate differences are descriptive; the spectral regions that support classification are examined separately in Section 3.7.
Figure 2.
Mean dorsal-nail ATR FT-IR spectra by smoking status. (a) Per-donor mean absorbance spectra, L2-normalized over the modeled regions (3800–2669 and 1711–600 cm−1; the diamond-absorption region and the spectral edges are not shown), averaged over donors (±1 SE; non-smokers n = 45, smokers n = 40 donors with dorsal spectra). (b) Smoker − non-smoker difference with its 95% confidence band. Dotted lines mark the bands listed in Table 1.
3.3. Spectrum- and Donor-Level Classification
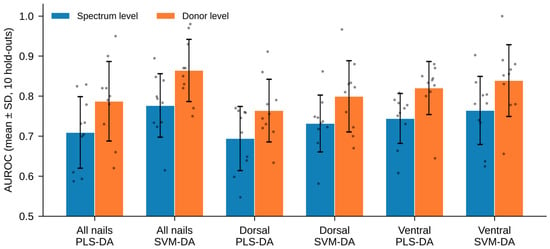
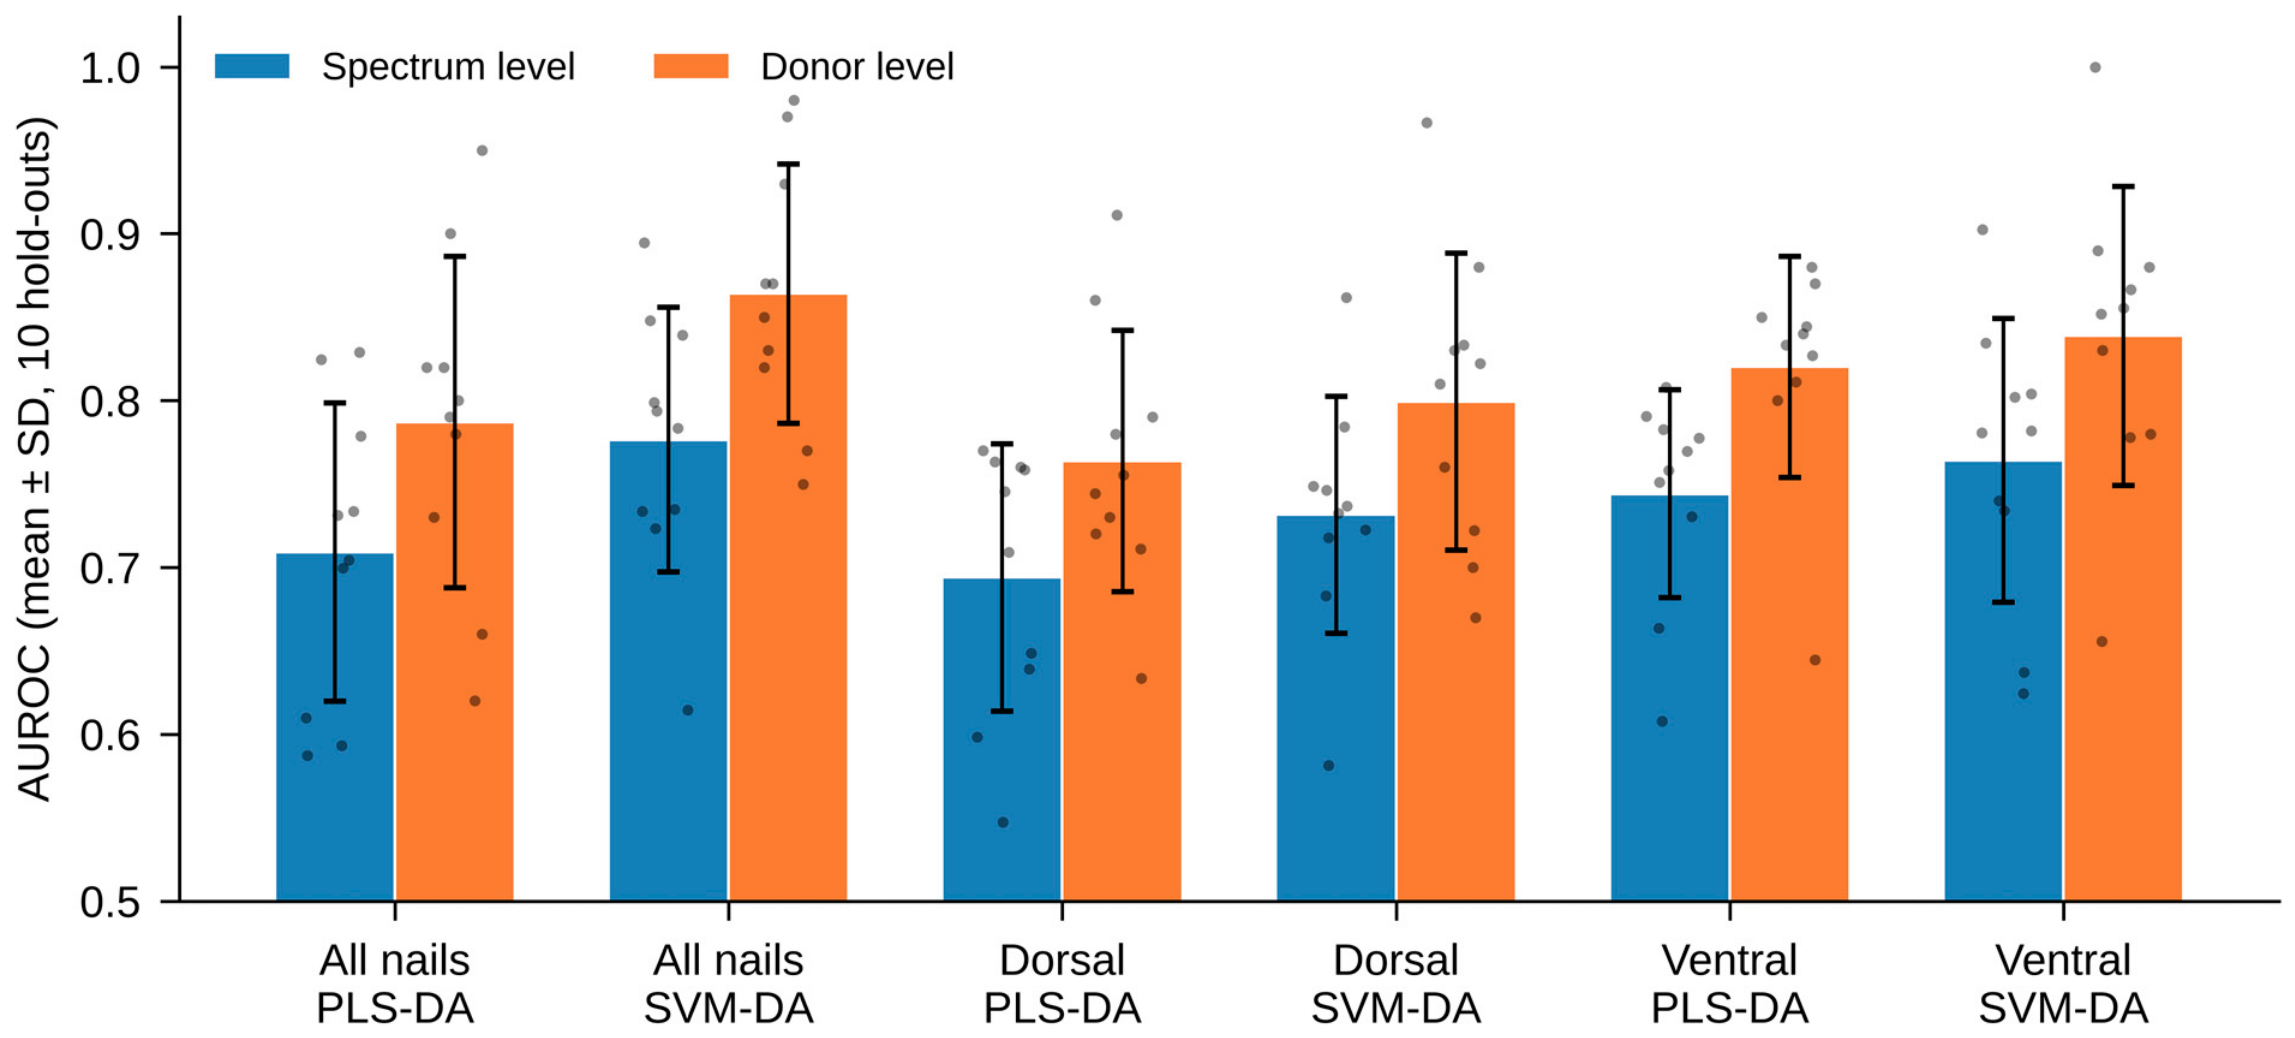
Classifying individual spectra gave moderate performance, with spectrum-level AUROC ranging from 0.69 (dorsal PLS-DA) to 0.78 (all-nail SVM-DA) (Table 3). Aggregating the per-spectrum scores into one score per donor raised the AUROC in every configuration (Figure 3), by 0.078 (95% CI 0.027–0.129; p = 0.007) for PLS-DA and 0.088 (0.029–0.146; p = 0.008) for SVM-DA on all nails, with similar gains on the ventral (0.075–0.076) and dorsal (0.068–0.070; p = 0.05–0.07) surfaces, because averaging many spectra suppresses per-measurement noise.
Table 3.
Spectrum- and donor-level AUROC and donor-level balanced accuracy over ten repeated 20-donor hold-outs (mean ± SD across repeats; the SD describes the variation between single hold-outs). The 95% CI of the mean donor-level AUROC is from the corrected resampled t-test, which accounts for the overlap between repeated hold-outs drawn from the same cohort; the variability therefore reflects repeated internal hold-outs, not independent validation cohorts. AUROC, area under the receiver operating characteristic curve; LR, logistic regression; RF, random forest.
Figure 3.
Spectrum-level (blue) versus donor-level (orange) AUROC for each nail side and classifier (bars indicate mean ± SD over the ten hold-outs; points indicate individual hold-outs). Donor-level aggregation raised the AUROC in every configuration.
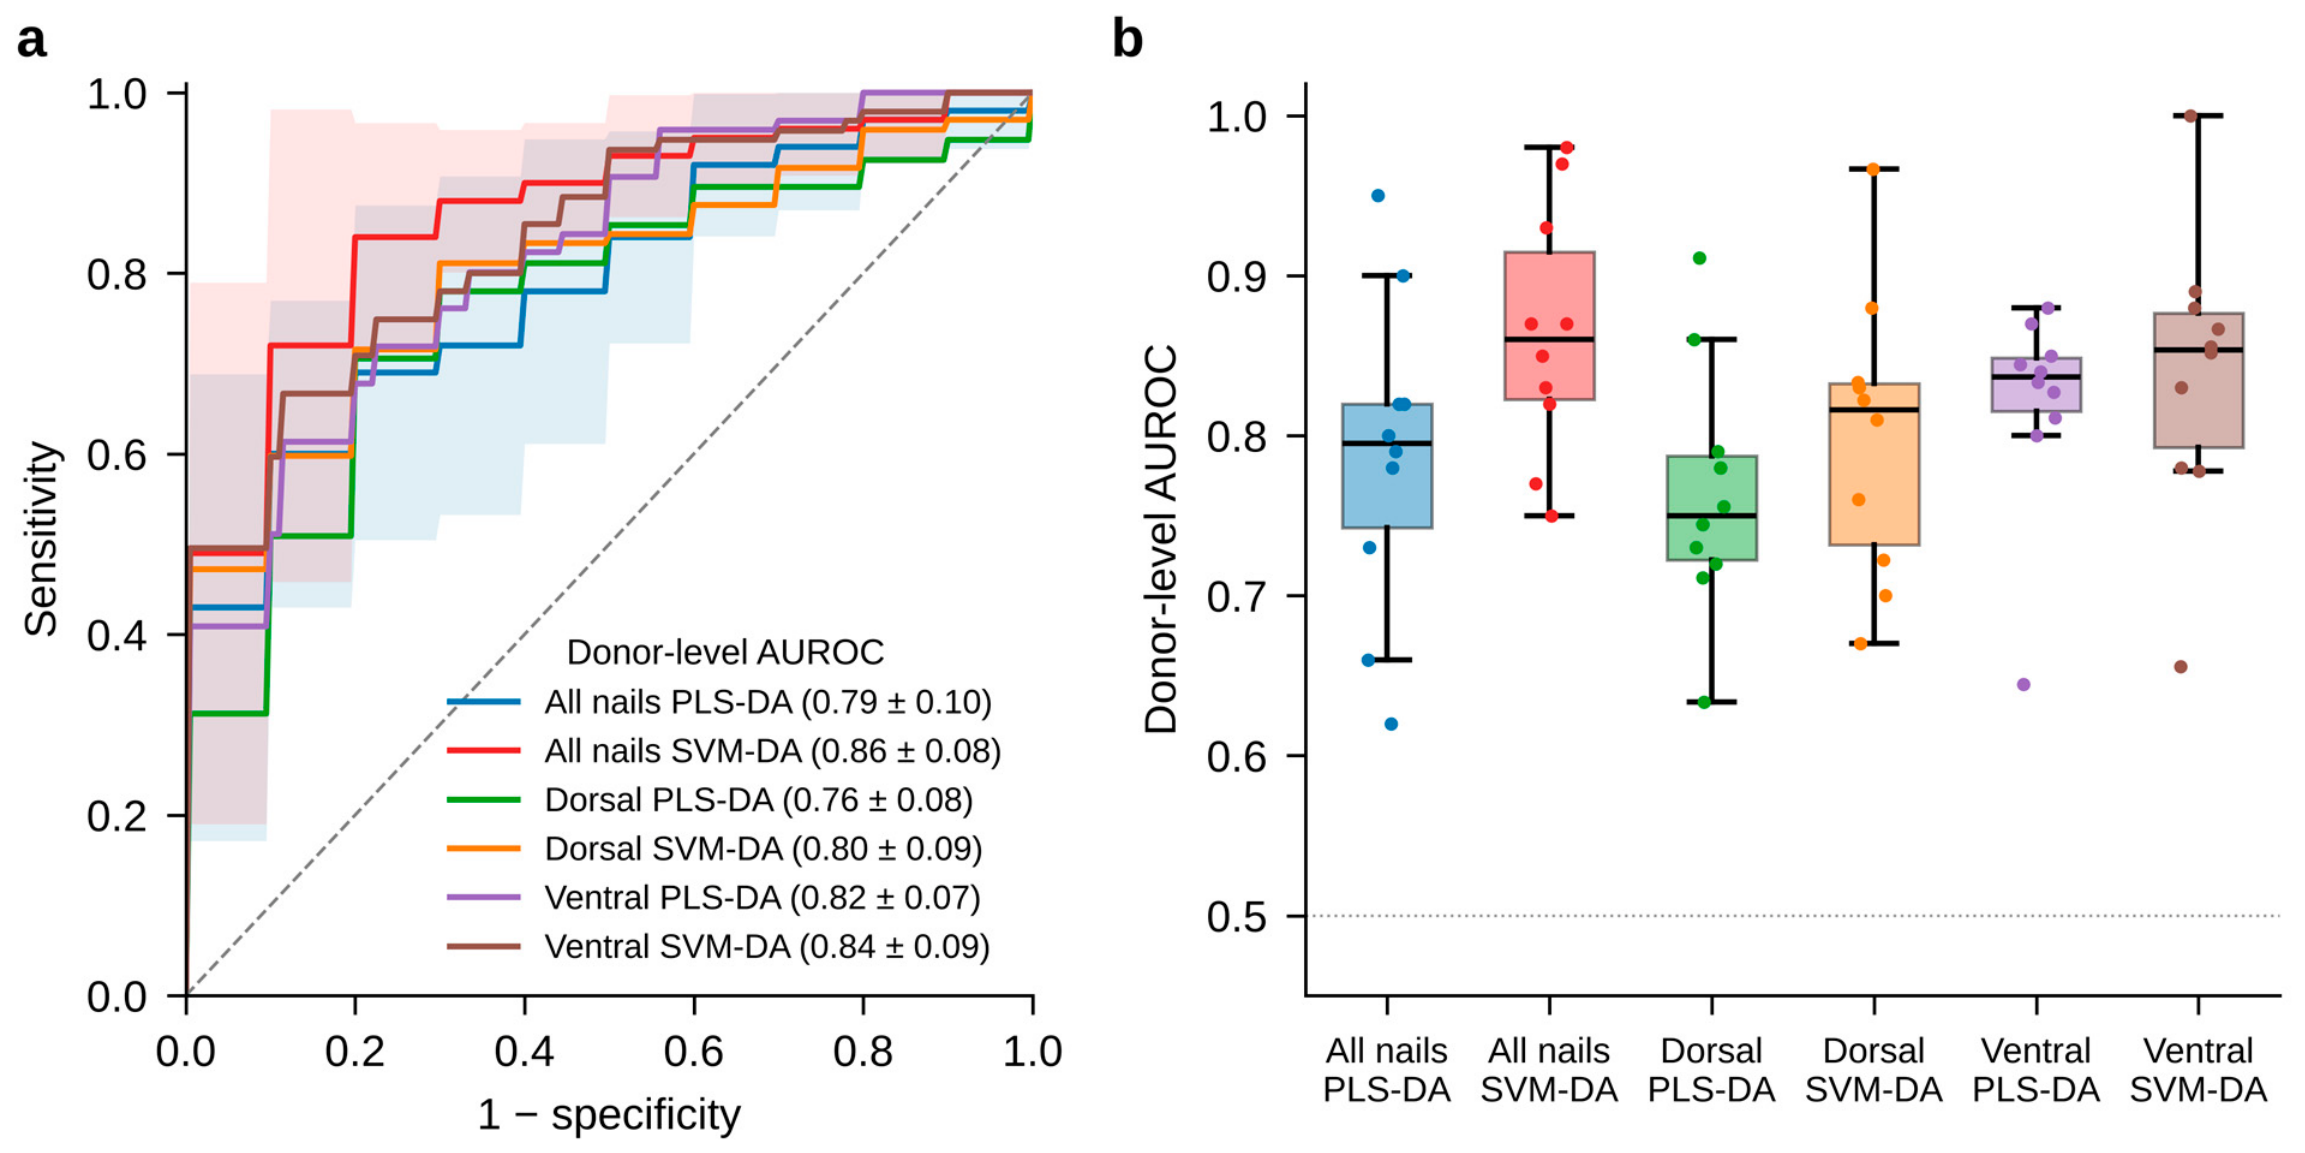
At the donor level, SVM-DA on all nails gave the highest mean AUROC, 0.864 ± 0.078 (95% CI 0.753–0.975), with a balanced accuracy of 0.765 ± 0.082, specificity 0.91, sensitivity of 0.62, precision of 0.88 and F1-score of 0.72 (Table 3 and Table 4). SVM-DA had a higher mean AUROC than PLS-DA on every surface, but the paired differences were not statistically significant (all nails +0.077, 95% CI −0.127 to 0.281, p = 0.42; dorsal +0.036, p = 0.60; ventral +0.019, p = 0.63). Random forest reached 0.843 ± 0.104, and logistic regression reached 0.798 ± 0.079, neither differing significantly from SVM-DA (+0.021, p = 0.77; +0.066, p = 0.35). Given the width of the confidence intervals, the classifier comparison is inconclusive: it shows neither a difference nor equivalence. Across all classifiers, specificity (0.85–0.97) exceeded sensitivity (0.47–0.64). This reflects where the a priori thresholds fall relative to the score distributions rather than a property of the classifiers; moving the threshold would trade specificity for sensitivity (Figure 4a).
Table 4.
Donor-level sensitivity (smokers classified as smokers), specificity, precision and F1-score at the a priori thresholds (mean ± SD over ten repeated hold-outs) and confusion counts pooled over the ten repeats (200 donor-level predictions for all nails, 195 for dorsal and 193 for ventral nails; TP, smokers classified as smokers; FN, smokers classified as non-smokers; TN, non-smokers classified as non-smokers; FP, non-smokers classified as smokers).
Figure 4.
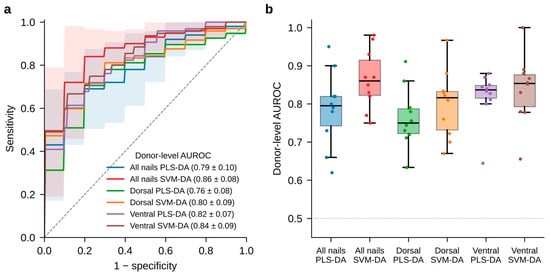
(a) Mean donor-level ROC curves across the ten repeated hold-outs (pointwise average of true-positive rates on a common false-positive-rate grid; descriptive, because the held-out sets overlap) for each of the six configurations (legend: AUROC mean ± SD); shaded bands show ±1 SD for the two all-nail models. (b) Distribution of donor-level AUROC across the ten repeats for each configuration (colors as in (a)); boxes show median and interquartile range, while points represent individual hold-outs.
Figure 4a shows the donor-level receiver operating characteristic (ROC) curve of each of the six configurations. Rather than displaying a single, possibly unrepresentative, hold-out, each curve is the average of the ten repeated hold-outs: for every repeat, a ROC curve was computed from the donor-level scores of the 20 held-out donors, linearly interpolated onto a common grid of 201 false-positive rates (0 to 1 in steps of 0.005), and the true-positive rates were averaged pointwise over the ten repeats. Because the ten test sets overlap, the averaged curves are descriptive summaries, not independent replicates. The curves, therefore, summarize how well each model separates smokers from non-smokers as the decision threshold is varied; their step-like shape reflects the small number of donors scored in each hold-out, and the repeat-to-repeat spread (Figure 4b; donor-level AUROC from 0.75 to 0.98 for all-nail SVM-DA) illustrates why single small hold-outs are unreliable.
3.4. Dorsal Versus Ventral Surfaces
Both surfaces carried a usable signal (Table 3). The ventral surface gave a higher mean donor-level AUROC than the dorsal surface for both classifiers (SVM-DA 0.839 vs. 0.799; PLS-DA 0.820 vs. 0.764), and pooling both surfaces gave the highest mean for SVM-DA (0.864), but none of these differences was statistically significant (ventral − dorsal: SVM-DA +0.039, p = 0.39; PLS-DA +0.056, p = 0.43; all nails − dorsal, SVM-DA: +0.065, p = 0.13), and the repeat-to-repeat spread was similar on all surfaces (SD 0.07–0.10; Figure 4b). We therefore do not read the differences as a robust ordering. Pooling both surfaces gave the highest mean AUROC and maximized the number of spectra averaged per donor, but it doubled the measurement effort, and its advantage over a single surface was not significant, so a single surface may suffice where measurement time matters.
3.5. Effect of Preprocessing
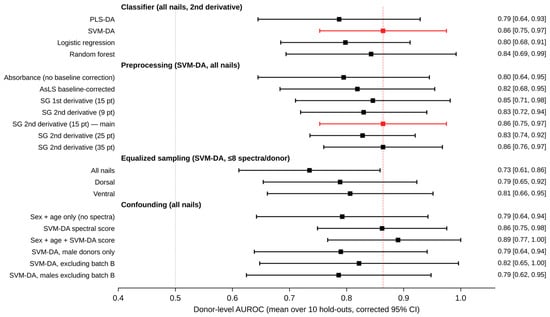
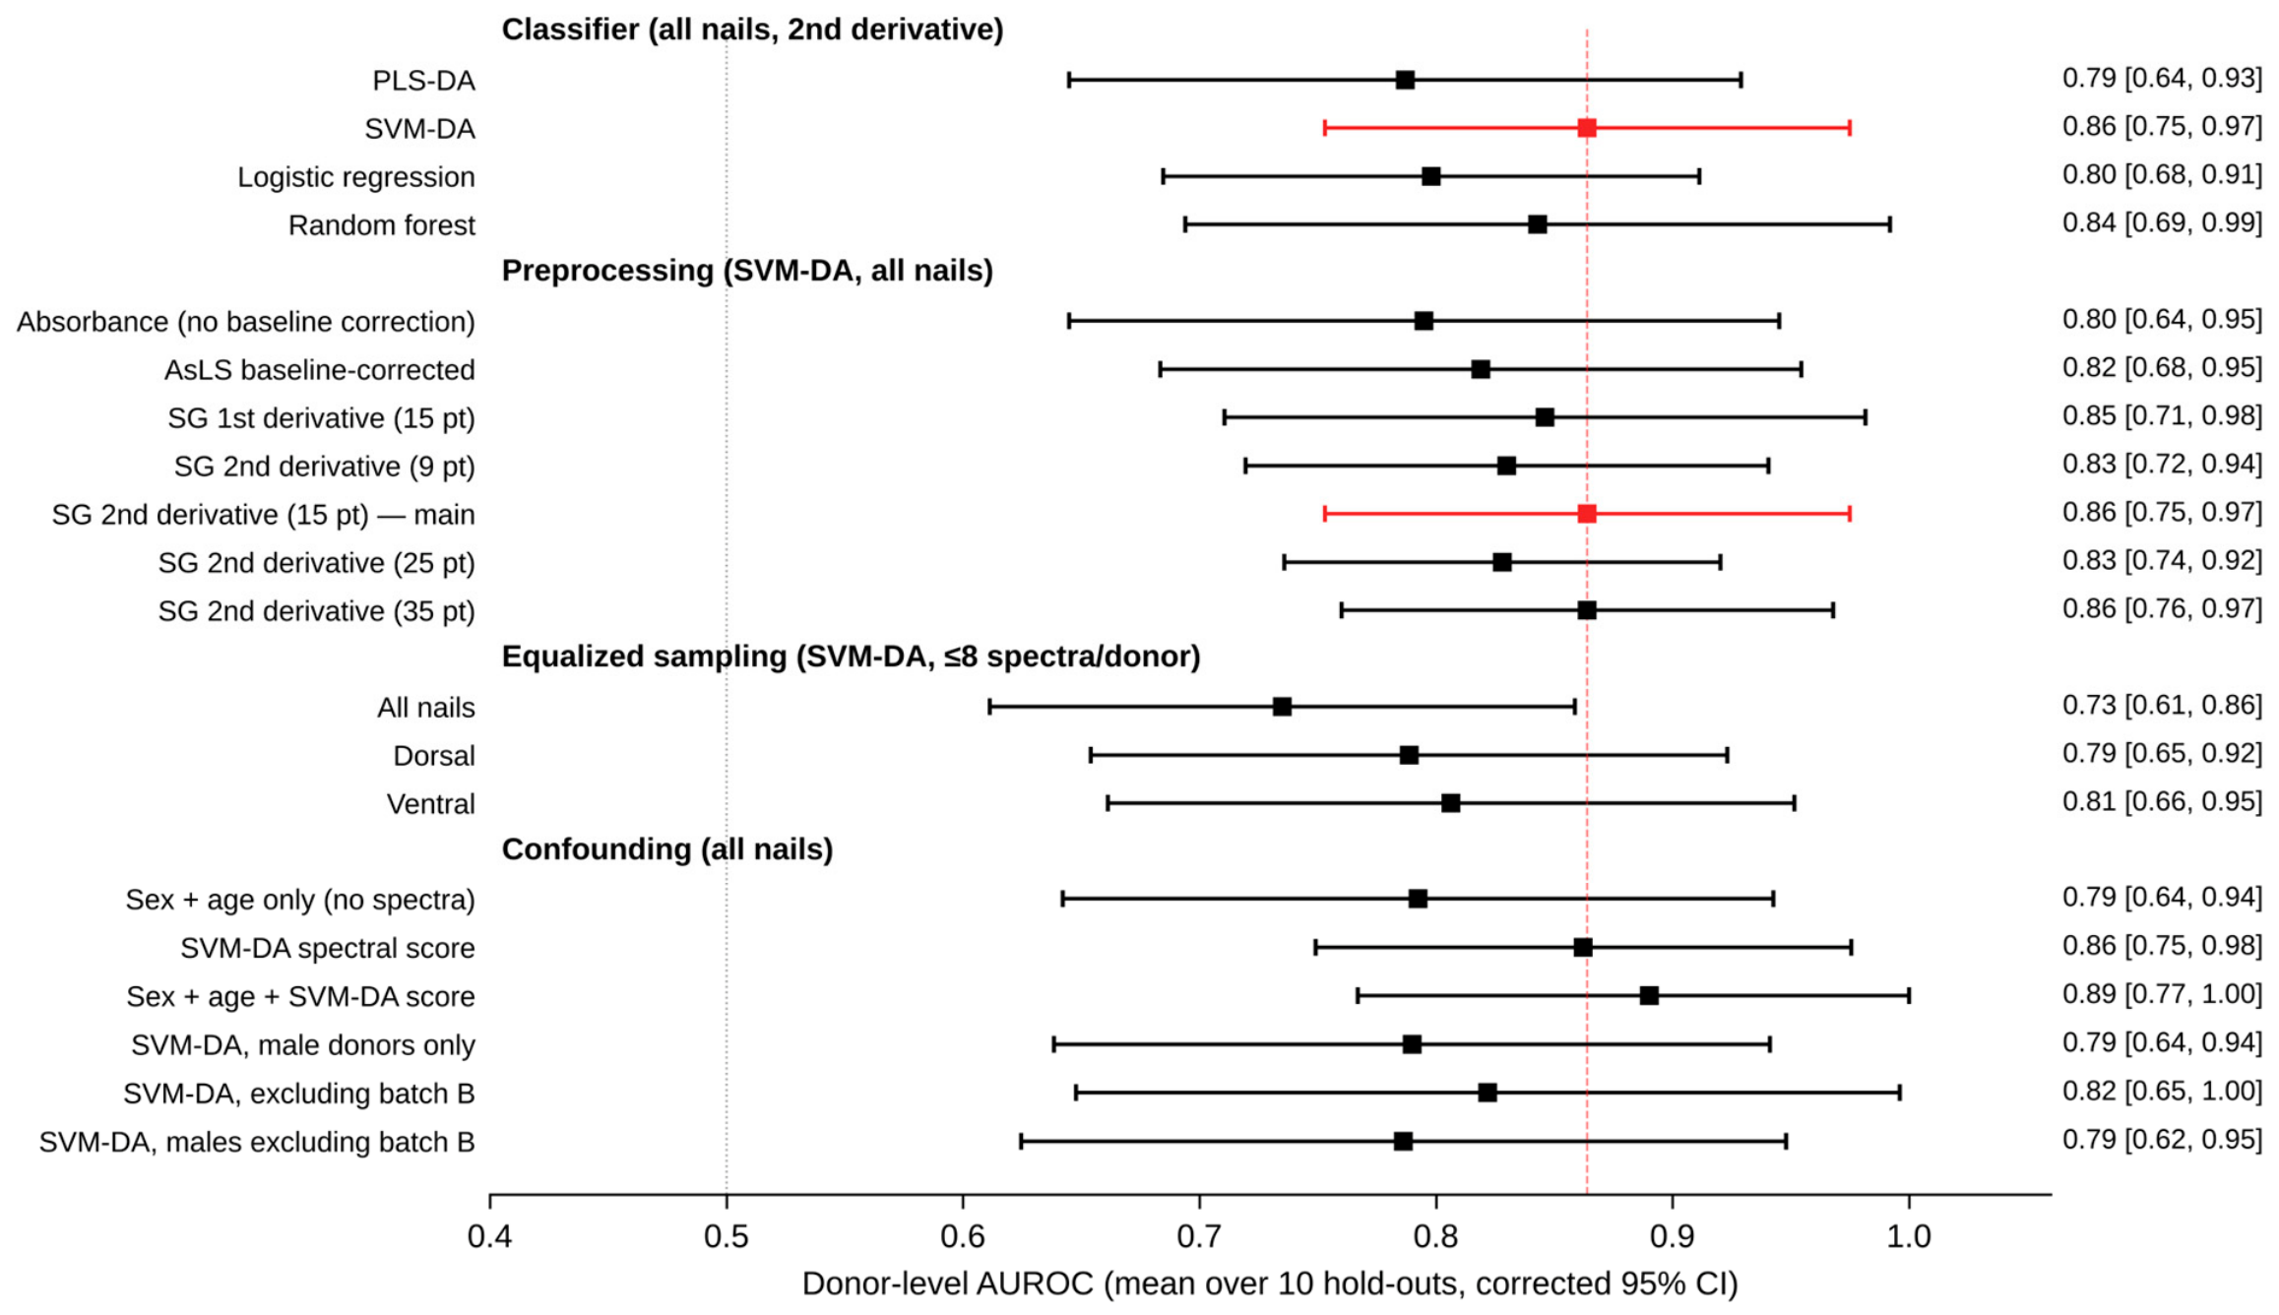
With identical splits and tuning, second-derivative preprocessing gave the highest or joint-highest donor-level AUROC for SVM-DA (0.864), compared with 0.795 for absorbance spectra without baseline correction, 0.819 for AsLS baseline-corrected spectra and 0.846 for the first derivative (Figure 5). These gains (+0.069, +0.045 and +0.018) were not statistically significant (p = 0.20, 0.32 and 0.67), and for PLS-DA, the second derivative (0.787) did not outperform the baseline-corrected (0.795) or first-derivative (0.813) spectra. Results were insensitive to the Savitzky–Golay window: SVM-DA reached 0.830, 0.864, 0.828 and 0.864 with 9-, 15-, 25- and 35-point windows (all differences p ≥ 0.22). Removing the baseline therefore helps the kernel model, but the choice among baseline-insensitive representations is not critical.
Figure 5.
Donor-level AUROC (mean over the ten repeated hold-outs with corrected 95% CI) for the classifier comparison, the preprocessing variants, equalized sampling (≤8 spectra per donor) and the confounding analyses. The covariate analyses exclude one smoker without recorded age and sex. Batch B includes donors BD-80 to BD-95 (all smokers). The dashed line marks the main SVM-DA result.
3.6. Equalized Sampling per Donor
Limiting every donor to at most eight randomly selected spectra did not materially change the single-surface results (SVM-DA: dorsal 0.789, ventral 0.806; PLS-DA: 0.760 and 0.782; all differences from the full data p ≥ 0.32) or the all-nail PLS-DA result (0.787; Figure 5). For all-nail SVM-DA, the AUROC decreased from 0.864 to 0.735 (difference 0.129, 95% CI −0.014 to 0.272; p = 0.07). Because the cap was applied to both development and held-out donors, this analysis cannot separate the effect of the training weight of donors with many spectra from the benefit of averaging more spectra per held-out donor, and the cause of this decrease remains uncertain. The dorsal–ventral comparison was unchanged under equalized sampling.
3.7. Spectral Regions Supporting Classification
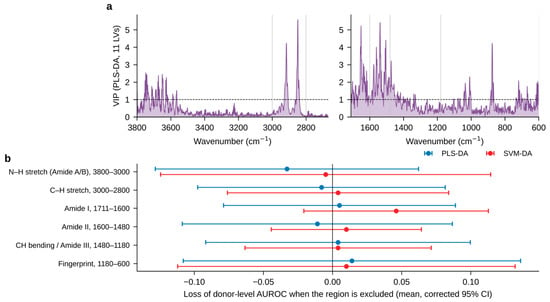
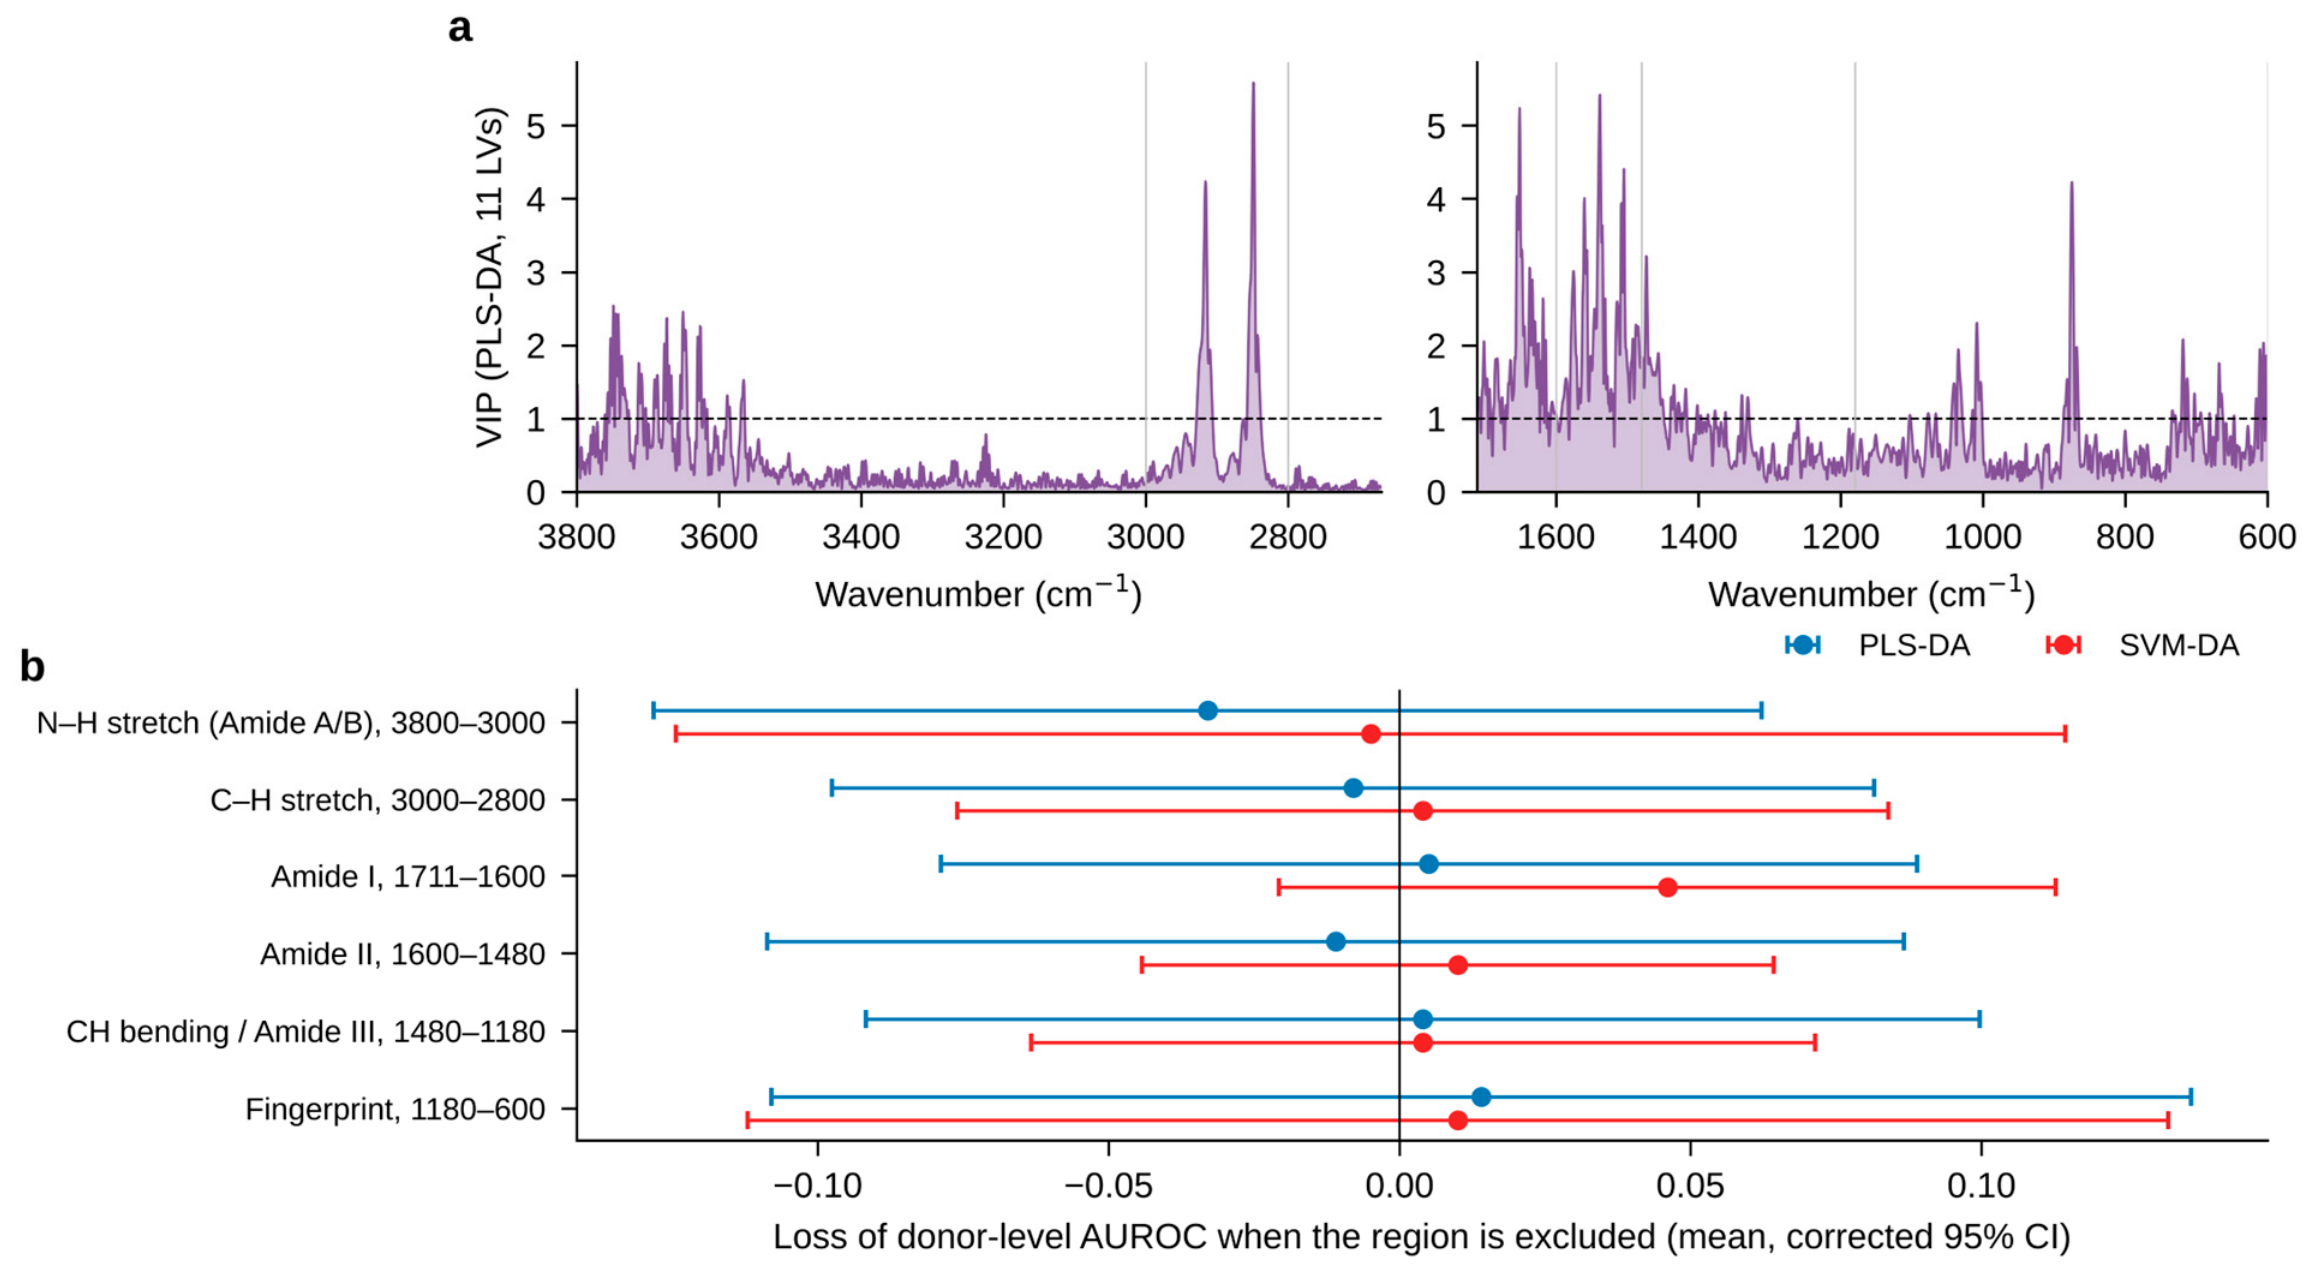
VIP scores (Figure 6a) were highest for the CH2 symmetric and asymmetric stretching bands (2849 and 2916 cm−1) and for multiple features in the Amide I (1651–1618 cm−1) and Amide II (1576–1505 cm−1) regions, followed by the CH2 scissoring region (~1473 cm−1) and isolated features at 1009 and 875 cm−1. The important variables thus differ from the bands with the largest descriptive group differences (Amide A/B; Table 1), illustrating that the univariate difference spectrum does not identify the features used by the multivariate models. Elevated VIP values between 3800 and 3550 cm−1 coincide with the rotational lines of atmospheric water vapor, which a second derivative accentuates; vapor lines also overlap the Amide I/II region. In the band-exclusion analysis (Figure 6b), removing any single region changed the donor-level AUROC by less than 0.05, and no change was statistically significant: the largest loss occurred for SVM-DA without the Amide I region (0.046, 95% CI −0.021 to 0.113; p = 0.15), while excluding the entire 3800–3000 cm−1 region, including the water-vapor lines, did not reduce performance (0.869 vs. 0.864). The discriminating information is therefore distributed redundantly across several regions rather than concentrated in a single marker band, and classification does not depend on the vapor-affected high-wavenumber region.
Figure 6.
Spectral regions supporting classification. (a) VIP scores of a PLS-DA model (11 LVs) fitted to all donors (all nails, second-derivative spectra); the dashed line marks VIP = 1. (b) Loss of donor-level AUROC (full model minus model without the region) when each region is excluded and the complete nested validation is repeated (positive values = loss of performance; mean and corrected 95% CI over the ten hold-outs).
3.8. Demographic Confounding
Because smoking status was associated with sex, age and batch, these variables could themselves discriminate the groups. To test whether sex and age alone could explain the classification, we fitted a logistic model with only these two variables (no spectral data) on the development donors and evaluated it on the same held-out donors. This demographic model reached a donor-level AUROC of 0.792 (95% CI 0.642–0.943), compared with 0.862 (0.749–0.976) for the SVM-DA spectral score evaluated on the same donors (excluding the one donor without recorded age and sex; Figure 5). For the combined model, all three predictors (a male indicator, age and the SVM-DA donor score) were standardized with the development-donor means and SDs before the logistic model was fitted on the development donors; held-out donors were scored with the SVM-DA model refitted on all development donors, and their predictors were standardized with the same parameters. Adding the spectral score to sex and age increased the AUROC to 0.890 (0.767–1.00), and the spectral coefficient was positive in all ten repeats, but the paired gain (+0.098, 95% CI −0.037 to 0.233; p = 0.14) was not significant, and its confidence interval includes no improvement. The data are therefore consistent with, but do not establish, spectral information beyond sex and age. When the complete validation was restricted to male donors (37 smokers, 24 non-smokers), SVM-DA reached 0.790 (0.639–0.941) and PLS-DA 0.712; excluding batch B gave 0.822 (0.648–0.996) and 0.759; and restricting to male donors outside batch B gave 0.786 (0.625–0.948) and 0.731. Within the held-out smokers, batch-B donors received higher SVM-DA scores than batch-A donors (within-group AUROC 0.83), and among held-out non-smokers, male donors scored slightly higher than female donors (0.60). Part of the all-donor performance may therefore reflect batch, sex or age differences, while a smoking-associated signal (AUROC ≈ 0.79–0.82) persisted in the restricted analyses.
4. Discussion
ATR FT-IR of intact nail keratin carries a smoking-associated signal that machine learning can exploit at the donor level, with a mean repeated hold-out AUROC of 0.86 for SVM-DA on all nails. Three methodological findings shape this result. First, the donor is the right unit: aggregating a donor’s spectra improved the AUROC by 0.07–0.09 in every configuration (Figure 3). Because each spectrum is a single noisy contact measurement, averaging a donor’s spectra recovers a cleaner estimate; this also matches the forensic question, which concerns the person, not an individual measurement, and the same donor-level gain underlies the donor-level accuracies reported for alcohol [26], sex [18] and fentanyl [27] in this matrix. Second, the classifier comparison is inconclusive. SVM-DA had the highest mean AUROC, but random forest, logistic regression and PLS-DA were within 0.02–0.08, and none of the differences was significant once the dependence between repeated hold-outs was accounted for. With 87 donors, the confidence intervals are too wide either to rank the classifiers or to establish their equivalence. Third, removing the baseline helped the kernel model, but the benefit of the second derivative over first-derivative or baseline-corrected spectra was small and not significant (Section 3.5), so the choice among baseline-insensitive representations is less critical than donor-level aggregation.
The molecular interpretation must be cautious. The descriptive difference spectrum shows lower relative Amide A/B and CH3 stretching intensities in smokers (Table 1), whereas the multivariate models draw on the C–H stretching, Amide I/II and CH2 bending regions (Figure 6a) and do not depend on any single region (Figure 6b). No discrete nicotine or cotinine absorption is expected at the low concentrations present in nails [6,11], and none was observed. Smoking-associated oxidative modification of keratin and altered lipid incorporation [14,15] would be consistent with changes in these protein and lipid bands, but the present data, which are relative (L2-normalized) spectra from a small cohort, do not establish altered keratin secondary structure or lipid content. We present these mechanisms as hypotheses to be tested, for example, by relating spectral features to measured nail nicotine or cotinine and to oxidative damage markers.
Compared with related work, the donor-level performance is below that reported for alcohol, sex and fentanyl in the same matrix [18,26,27]. We hypothesize that smoking leaves a subtler keratin signature than these targets, but cross-study comparisons cannot establish this, because cohorts, sample sizes and validation designs differ. Recent ATR FT-IR work reported complete discrimination (AUROC 1.0) of e-cigarette users from non-users [11]; that study extracted cotinine from the nails of 30 e-cigarette users and 30 non-smokers, classified the FT-IR spectra of the extracts by PCA and PLS-DA, and separately quantified cotinine from the 1277 cm−1 band, an approach that requires sample preparation, in contrast to the extraction-free classification of conventional smokers directly from the whole keratin spectrum performed here. The two approaches are complementary: the extraction route offers analyte specificity and quantification, and the direct route offers speed and leaves the clipping intact for confirmatory analysis.
This study has important limitations. First, the cohort is small (87 donors); any single 20-donor hold-out is unstable (donor-level AUROC 0.75–0.98 across repeats for the same model), confidence intervals are wide, and all repeats are drawn from one cohort, so the estimates describe internal generalization and are not an independent population-level validation. Second, smoking status was self-reported and not biochemically verified, smoking intensity was recorded only as a range (at least 3–5 cigarettes per day) and duration was not recorded, so misclassification is possible [8] and dose–response relationships could not be examined. Third, and most importantly, smokers and non-smokers differed in sex, age and collection batch. Sex and age alone discriminated the groups with an AUROC of 0.79, and the model scores were associated with batch among smokers. Adding the spectral score to sex and age raised the AUROC to 0.89, but this gain was uncertain (95% CI −0.04 to 0.23); a signal persisted in male donors and outside batch B (AUROC 0.79–0.82), but residual confounding by age, batch, measurement session and unrecorded factors (passive smoking, e-cigarette use, alcohol, medication, nutrition, occupational exposure and nail condition) cannot be excluded. Fourth, all spectra were acquired on one instrument in one laboratory from one population. Whether the model generalizes across demographic groups, populations, sampling periods, smoking intensities, environmental conditions and instruments is therefore unknown, and the higher specificity than sensitivity at the a priori thresholds indicates that thresholds would need calibration for the intended application. Before forensic use, the approach requires replication in a larger, independent cohort that is matched for sex and age, collected and measured in randomized order, with biochemically verified exposure and recorded smoking intensity.
5. Conclusions
ATR FT-IR spectroscopy of intact fingernail clippings, combined with donor-level aggregation of replicate spectra and machine learning, discriminates self-reported smokers from non-smokers, with a mean repeated-hold-out AUROC of 0.86 (95% CI 0.75–0.98) for SVM-DA. Differences from linear and ensemble classifiers were not significant and remain inconclusive. Donor-level evaluation adds measurable value, whereas the advantages of a non-linear kernel, a particular nail surface and second-derivative preprocessing are small and not statistically significant. Because sex and age alone discriminated the groups with an AUROC of 0.79, the result is best regarded as a proof of concept. A smoking-associated signal persisted in sex- and batch-restricted analyses, but validation in an independent, demographically matched cohort with biochemically verified exposure is required before ATR FT-IR of nails can be considered for forensic lifestyle inference.
Author Contributions
Conceptualization, L.H.; methodology, B.M. and L.H.; software, B.M. and L.H.; validation, B.M. and L.H.; formal analysis, B.M. and L.H.; investigation, B.M.; data curation, B.M.; writing—original draft preparation, B.M.; writing—review and editing, L.H.; visualization, B.M. and L.H.; supervision, L.H. All authors have read and agreed to the published version of the manuscript.
Funding
This research received no external funding.
Institutional Review Board Statement
The study was approved by the Institutional Review Board of Texas Tech University (No. IRB2022-211).
Informed Consent Statement
Informed consent was obtained from all subjects involved in the study.
Data Availability Statement
The data presented in this study and the complete analysis code are available on request from the corresponding author.
Conflicts of Interest
L.H. is a Guest Editor of the Special Issue “Spectral Sensing Techniques in Biological Detection and Analysis” of Sensors; she was not involved in the editorial handling or decision on this manuscript. The authors declare no other conflicts of interest.
References
- Daniel, C.R., III; Piraccini, B.M.; Tosti, A. The nail and hair in forensic science. J. Am. Acad. Dermatol. 2004, 50, 258–261. [Google Scholar] [CrossRef] [Scilit] [PubMed]
- Solimini, R.; Minutillo, A.; Kyriakou, C.; Pichini, S.; Pacifici, R.; Busardò, F.P. Nails in forensic toxicology: An update. Curr. Pharm. Des. 2018, 23, 5468–5479. [Google Scholar] [CrossRef] [Scilit] [PubMed]
- Cappelle, D.; Yegles, M.; Neels, H.; van Nuijs, A.L.N.; De Doncker, M.; Maudens, K.; Covaci, A.; Crunelle, C.L. Nail analysis for the detection of drugs of abuse and pharmaceuticals: A review. Forensic Toxicol. 2015, 33, 12–36. [Google Scholar] [CrossRef] [Scilit]
- Sagar, G. Nail as evidence in forensic toxicology. Int. Med.-Leg. Rep. J. 2021, 8, 99–106. [Google Scholar]
- Grover, C.; Bansal, S. The nail as an investigative tool in medicine. Indian J. Dermatol. Venereol. Leprol. 2017, 83, 635–643. [Google Scholar] [CrossRef] [Scilit] [PubMed]
- Al-Delaimy, W.K. Toenail nicotine levels as a biomarker of tobacco smoke exposure. Cancer Epidemiol. Biomark. Prev. 2002, 11, 1400–1404. [Google Scholar]
- Go, D.M.; Al-Delaimy, W.K.; Schilling, D.; Vuylsteke, B.; Mehess, S.; Spindel, E.R.; McEvoy, C.T. Hair and nail nicotine levels of mothers and their infants as valid biomarkers of exposure to intrauterine tobacco smoke. Tob. Induc. Dis. 2021, 19, 100. [Google Scholar] [CrossRef] [Scilit] [PubMed]
- Connor Gorber, S.; Schofield-Hurwitz, S.; Hardt, J.; Levasseur, G.; Tremblay, M. The accuracy of self-reported smoking: A systematic review of the relationship between self-reported and cotinine-assessed smoking status. Nicotine Tob. Res. 2009, 11, 12–24. [Google Scholar] [CrossRef] [Scilit] [PubMed]
- Benowitz, N.L.; Bernert, J.T.; Foulds, J.; Hecht, S.S.; Jacob, P.; Jarvis, M.J.; Joseph, A.; Oncken, C.; Piper, M.E. Biochemical verification of tobacco use and abstinence: 2019 update. Nicotine Tob. Res. 2020, 22, 1086–1097. [Google Scholar] [CrossRef] [Scilit] [PubMed]
- Al-Hetlani, E.; Halámková, L.; Amin, M.O.; Lednev, I.K. Differentiating smokers and nonsmokers based on Raman spectroscopy of oral fluid and advanced statistics for forensic applications. J. Biophotonics 2020, 13, e201960123. [Google Scholar] [CrossRef] [Scilit] [PubMed]
- Yu, Y.G.; Kamaruzaman, P.D.I.; Ganaprakasam, S.W.; Abu Bakar, N.A.; Rohmatul Amin, E.S.; Mohd Yusof, M.J. Chemometric analysis of Fourier transform infrared spectra for the detection of cotinine in fingernails of e-cigarette users. Molecules 2026, 31, 791. [Google Scholar] [CrossRef] [Scilit] [PubMed]
- Yu, Y.G.; Kamaruzaman, P.D.I.; Ganaprakasam, S.W.; Abu Bakar, N.A.; Rohmatul Amin, E.S.; Mohd Yusof, M.J. Optimisation of cotinine extraction from fingernails using response surface methodology for Fourier transform infrared spectroscopy analysis. Chemistry 2026, 8, 5. [Google Scholar] [CrossRef] [Scilit]
- Borden, J.T.; Man, A.; Scott, D.A.; Liu, K.Z. Tobacco-induced alterations to the Fourier-transform infrared spectrum of serum. J. Mol. Med. 2003, 81, 788–794. [Google Scholar] [CrossRef] [Scilit]
- Valavanidis, A.; Vlachogianni, T.; Fiotakis, K. Tobacco smoke: Involvement of reactive oxygen species and stable free radicals in mechanisms of oxidative damage, carcinogenesis and synergistic effects with other respirable particles. Int. J. Environ. Res. Public Health 2009, 6, 445–462. [Google Scholar] [CrossRef] [Scilit] [PubMed]
- Morita, A. Tobacco smoke causes premature skin aging. J. Dermatol. Sci. 2007, 48, 169–175. [Google Scholar] [CrossRef] [Scilit] [PubMed]
- Barth, A. Infrared spectroscopy of proteins. Biochim. Biophys. Acta 2007, 1767, 1073–1101. [Google Scholar] [CrossRef] [Scilit] [PubMed]
- Sharma, A.; Verma, R.; Kumar, R.; Chauhan, R.; Sharma, V. Chemometric analysis of ATR-FTIR spectra of fingernail clippings for classification and prediction of sex in forensic context. Microchem. J. 2020, 159, 105504. [Google Scholar] [CrossRef] [Scilit]
- Mitu, B.; Trojan, V.; Halámková, L. Sex determination of human nails based on attenuated total reflection Fourier transform infrared spectroscopy in forensic context. Sensors 2023, 23, 9412. [Google Scholar] [CrossRef] [Scilit] [PubMed]
- Mitu, B.; Trojan, V.; Hrib, R.; Halámková, L. Attenuated total reflection Fourier transform infrared spectroscopy (ATR-FTIR) analysis of human nails: Implications for age determination in forensics. J. Forensic Sci. 2025, 70, 150–160. [Google Scholar] [CrossRef] [Scilit] [PubMed]
- Coopman, R.; Van de Vyver, T.; Kishabongo, A.S.; Katchunga, P.; Van Aken, E.H.; Cikomola, J.; Monteyne, T.; Speeckaert, M.M.; Delanghe, J.R. Glycation in human fingernail clippings using ATR-FTIR spectrometry, a new marker for the diagnosis and monitoring of diabetes mellitus. Clin. Biochem. 2017, 50, 62–67. [Google Scholar] [CrossRef] [Scilit] [PubMed]
- Toprak, S.; Kahriman, F.; Dogan, Z.; Ersoy, G.; Can, E.; Akpolat, M.; Can, M. The potential of Raman and FT-IR spectroscopic methods for the detection of chlorine in human nail samples. Forensic Sci. Med. Pathol. 2020, 16, 633–640. [Google Scholar] [CrossRef] [Scilit] [PubMed]
- Bueno, J.; Sikirzhytski, V.; Lednev, I.K. Attenuated total reflectance FT-IR spectroscopy for gunshot residue analysis: Potential for ammunition determination. Anal. Chem. 2013, 85, 7287–7294. [Google Scholar] [CrossRef] [Scilit] [PubMed]
- Manheim, J.; Doty, K.C.; McLaughlin, G.; Lednev, I.K. Forensic hair differentiation using ATR FT-IR spectroscopy. Appl. Spectrosc. 2016, 70, 1109–1117. [Google Scholar] [CrossRef] [Scilit] [PubMed]
- Giuliano, S.; Mistek-Morabito, E.; Lednev, I.K. Forensic phenotype profiling based on ATR FT-IR spectroscopy of blood: Chronological age of the donor. ACS Omega 2020, 5, 27026–27031. [Google Scholar] [CrossRef] [Scilit] [PubMed]
- Weber, A.; Hoplight, B.; Ogilvie, R.; Muro, C.; Khandasammy, S.R.; Pérez-Almodóvar, L.; Sears, S.; Lednev, I.K. Innovative vibrational spectroscopy research for forensic application. Anal. Chem. 2023, 95, 167–205. [Google Scholar] [CrossRef] [Scilit] [PubMed]
- Mitu, B.; Cerda, M.; Hrib, R.; Trojan, V.; Halámková, L. Attenuated total reflection Fourier transform infrared spectroscopy for forensic screening of long-term alcohol consumption from human nails. ACS Omega 2023, 8, 22203–22210. [Google Scholar] [CrossRef] [Scilit] [PubMed]
- Barney, A.; Trojan, V.; Hrib, R.; Newland, A.; Halámek, J.; Halámková, L. From spectra to signatures: Detecting fentanyl in human nails with ATR-FTIR and machine learning. Sensors 2025, 25, 227. [Google Scholar] [CrossRef] [Scilit] [PubMed]
- Barker, M.; Rayens, W. Partial least squares for discrimination. J. Chemom. 2003, 17, 166–173. [Google Scholar] [CrossRef] [Scilit]
- Cortes, C.; Vapnik, V. Support-vector networks. Mach. Learn 1995, 20, 273–297. [Google Scholar] [CrossRef] [Scilit]
- Mitu, B.A. Classification, Characterization, and Phenotype Profiling of Human Nails by Using ATR FT-IR Spectroscopy and Multivariate Chemometric Analysis. Doctoral Dissertation, Texas Tech University, Lubbock, TX, USA, 2024. [Google Scholar]
- Selvam, J.P.; Gunasekaran, S. Biological analysis of fingernails of healthy and thyroid-disordered subjects by FTIR-ATR spectroscopic technique. Int. J. PharmTech Res. 2018, 11, 242–252. [Google Scholar] [CrossRef] [Scilit]
- Sundaram, K.; Gunasekaran, S.; Sailatha, E.; Marthandam, P.K.; Kuppuraj, P. FTIR-ATR spectroscopic technique on human single intact hair fibre, a case study of thyroid patients. Int. J. Adv. Sci. Technol. Eng. Manag. Sci. 2016, 2, 1–6. [Google Scholar]
- Bantignies, J.L.; Fuchs, G.; Carr, G.L.; Williams, G.P.; Lutz, D.; Marull, S. Organic reagent interaction with hair spatially characterized by infrared microspectroscopy using synchrotron radiation. Int. J. Cosmet. Sci. 1998, 20, 381–394. [Google Scholar] [CrossRef] [Scilit] [PubMed]
- Savitzky, A.; Golay, M.J.E. Smoothing and differentiation of data by simplified least squares procedures. Anal. Chem. 1964, 36, 1627–1639. [Google Scholar] [CrossRef] [Scilit]
- Rinnan, Å.; van den Berg, F.; Engelsen, S.B. Review of the most common pre-processing techniques for near-infrared spectra. TrAC Trends Anal. Chem. 2009, 28, 1201–1222. [Google Scholar] [CrossRef] [Scilit]
- Eilers, P.H.C.; Boelens, H.F.M. Baseline Correction with Asymmetric Least Squares Smoothing; Leiden University Medical Centre Report: Leiden, The Netherlands, 2005. [Google Scholar]
- Guo, S.; Bocklitz, T.; Neugebauer, U.; Popp, J. Common mistakes in cross-validating classification models. Anal. Methods 2017, 9, 4410–4417. [Google Scholar] [CrossRef] [Scilit]
- Beleites, C.; Neugebauer, U.; Bocklitz, T.; Krafft, C.; Popp, J. Sample size planning for classification models. Anal. Chim. Acta 2013, 760, 25–33. [Google Scholar] [CrossRef] [Scilit] [PubMed]
- Varma, S.; Simon, R. Bias in error estimation when using cross-validation for model selection. BMC Bioinform. 2006, 7, 91. [Google Scholar] [CrossRef] [Scilit] [PubMed]
- Breiman, L. Random forests. Mach. Learn 2001, 45, 5–32. [Google Scholar] [CrossRef] [Scilit]
- Pedregosa, F.; Varoquaux, G.; Gramfort, A.; Michel, V.; Thirion, B.; Grisel, O.; Blondel, M.; Prettenhofer, P.; Weiss, R.; Dubourg, V.; et al. Scikit-learn: Machine learning in Python. J. Mach. Learn. Res. 2011, 12, 2825–2830. [Google Scholar]
- Hastie, T.; Tibshirani, R.; Friedman, J. The Elements of Statistical Learning: Data Mining, Inference, and Prediction, 2nd ed.; Springer: New York, NY, USA, 2009. [Google Scholar]
- Fawcett, T. An introduction to ROC analysis. Pattern Recognit. Lett. 2006, 27, 861–874. [Google Scholar] [CrossRef] [Scilit]
- Nadeau, C.; Bengio, Y. Inference for the generalization error. Mach. Learn. 2003, 52, 239–281. [Google Scholar] [CrossRef] [Scilit]

Disclaimer/Publisher’s Note: The statements, opinions and data contained in all publications are solely those of the individual author(s) and contributor(s) and not of MDPI and/or the editor(s). MDPI and/or the editor(s) disclaim responsibility for any injury to people or property resulting from any ideas, methods, instructions or products referred to in the content. |
© 2026 by the authors. Licensee MDPI, Basel, Switzerland. This article is an open access article distributed under the terms and conditions of the Creative Commons Attribution (CC BY) license.