
Partial Discharge Monitoring in Power Transformers Using Low-Cost Piezoelectric Sensors

 , ,
, ,  ,
,
Abstract
:1. Introduction
2. Partial Discharges
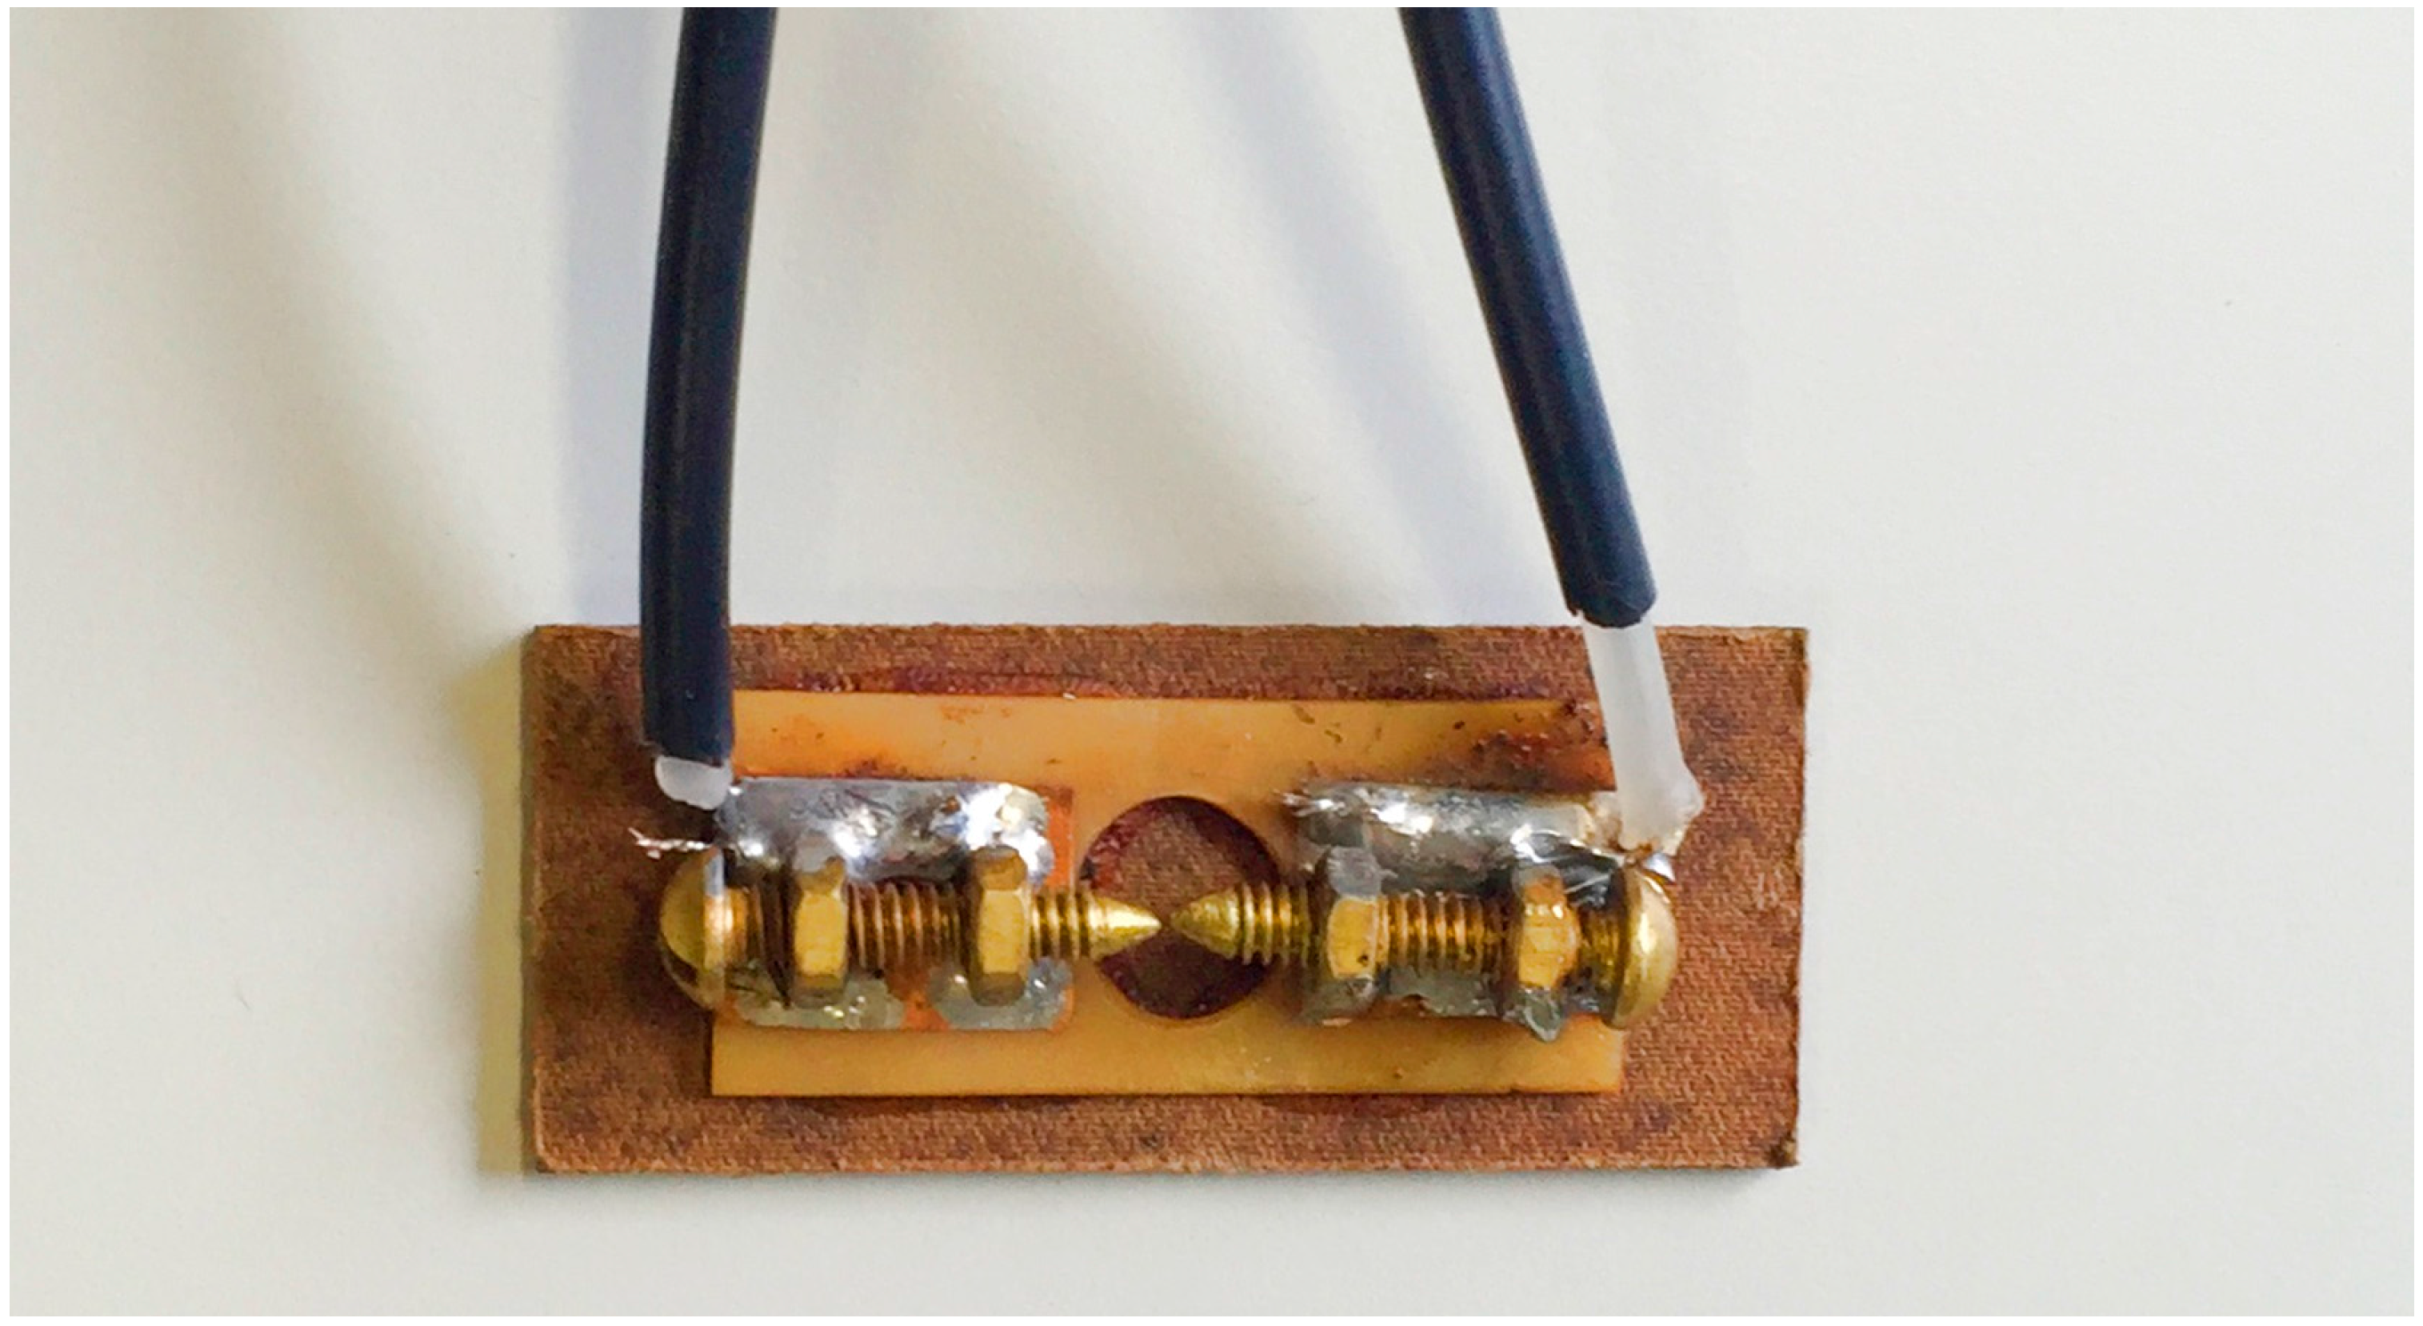
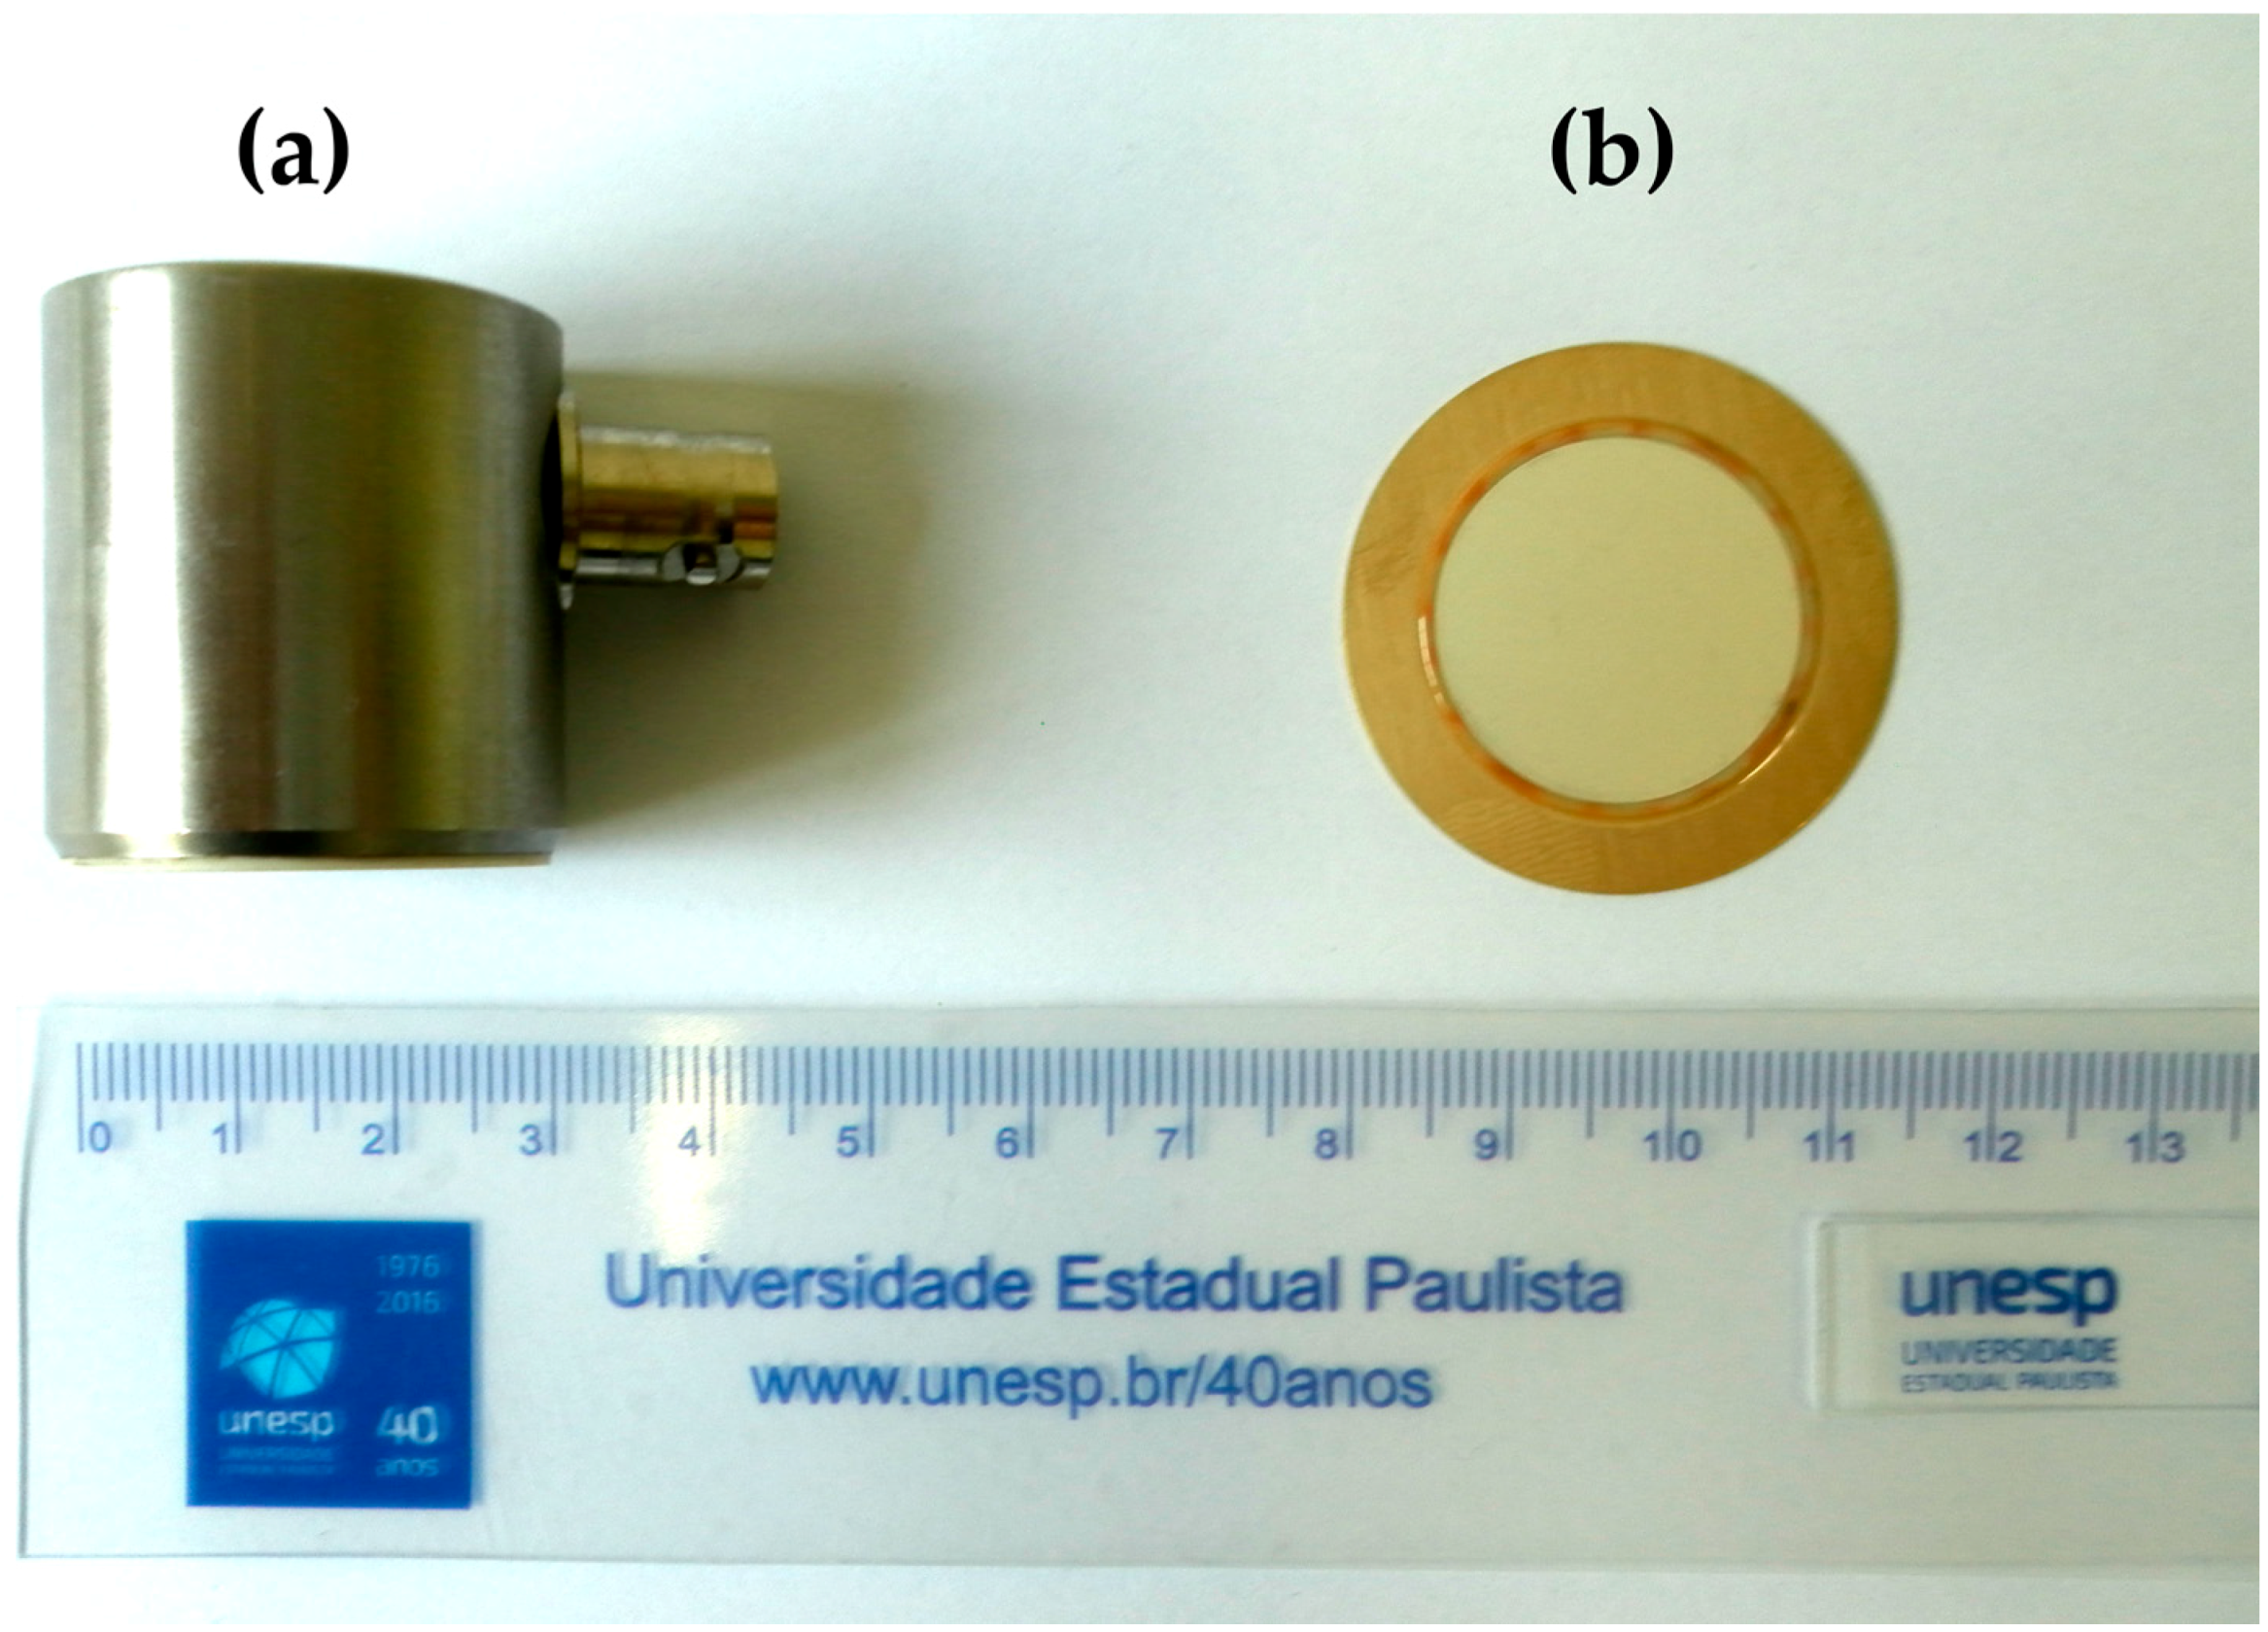
3. Piezoelectric Sensors
4. Materials and Methods
4.1. Initial Characterization
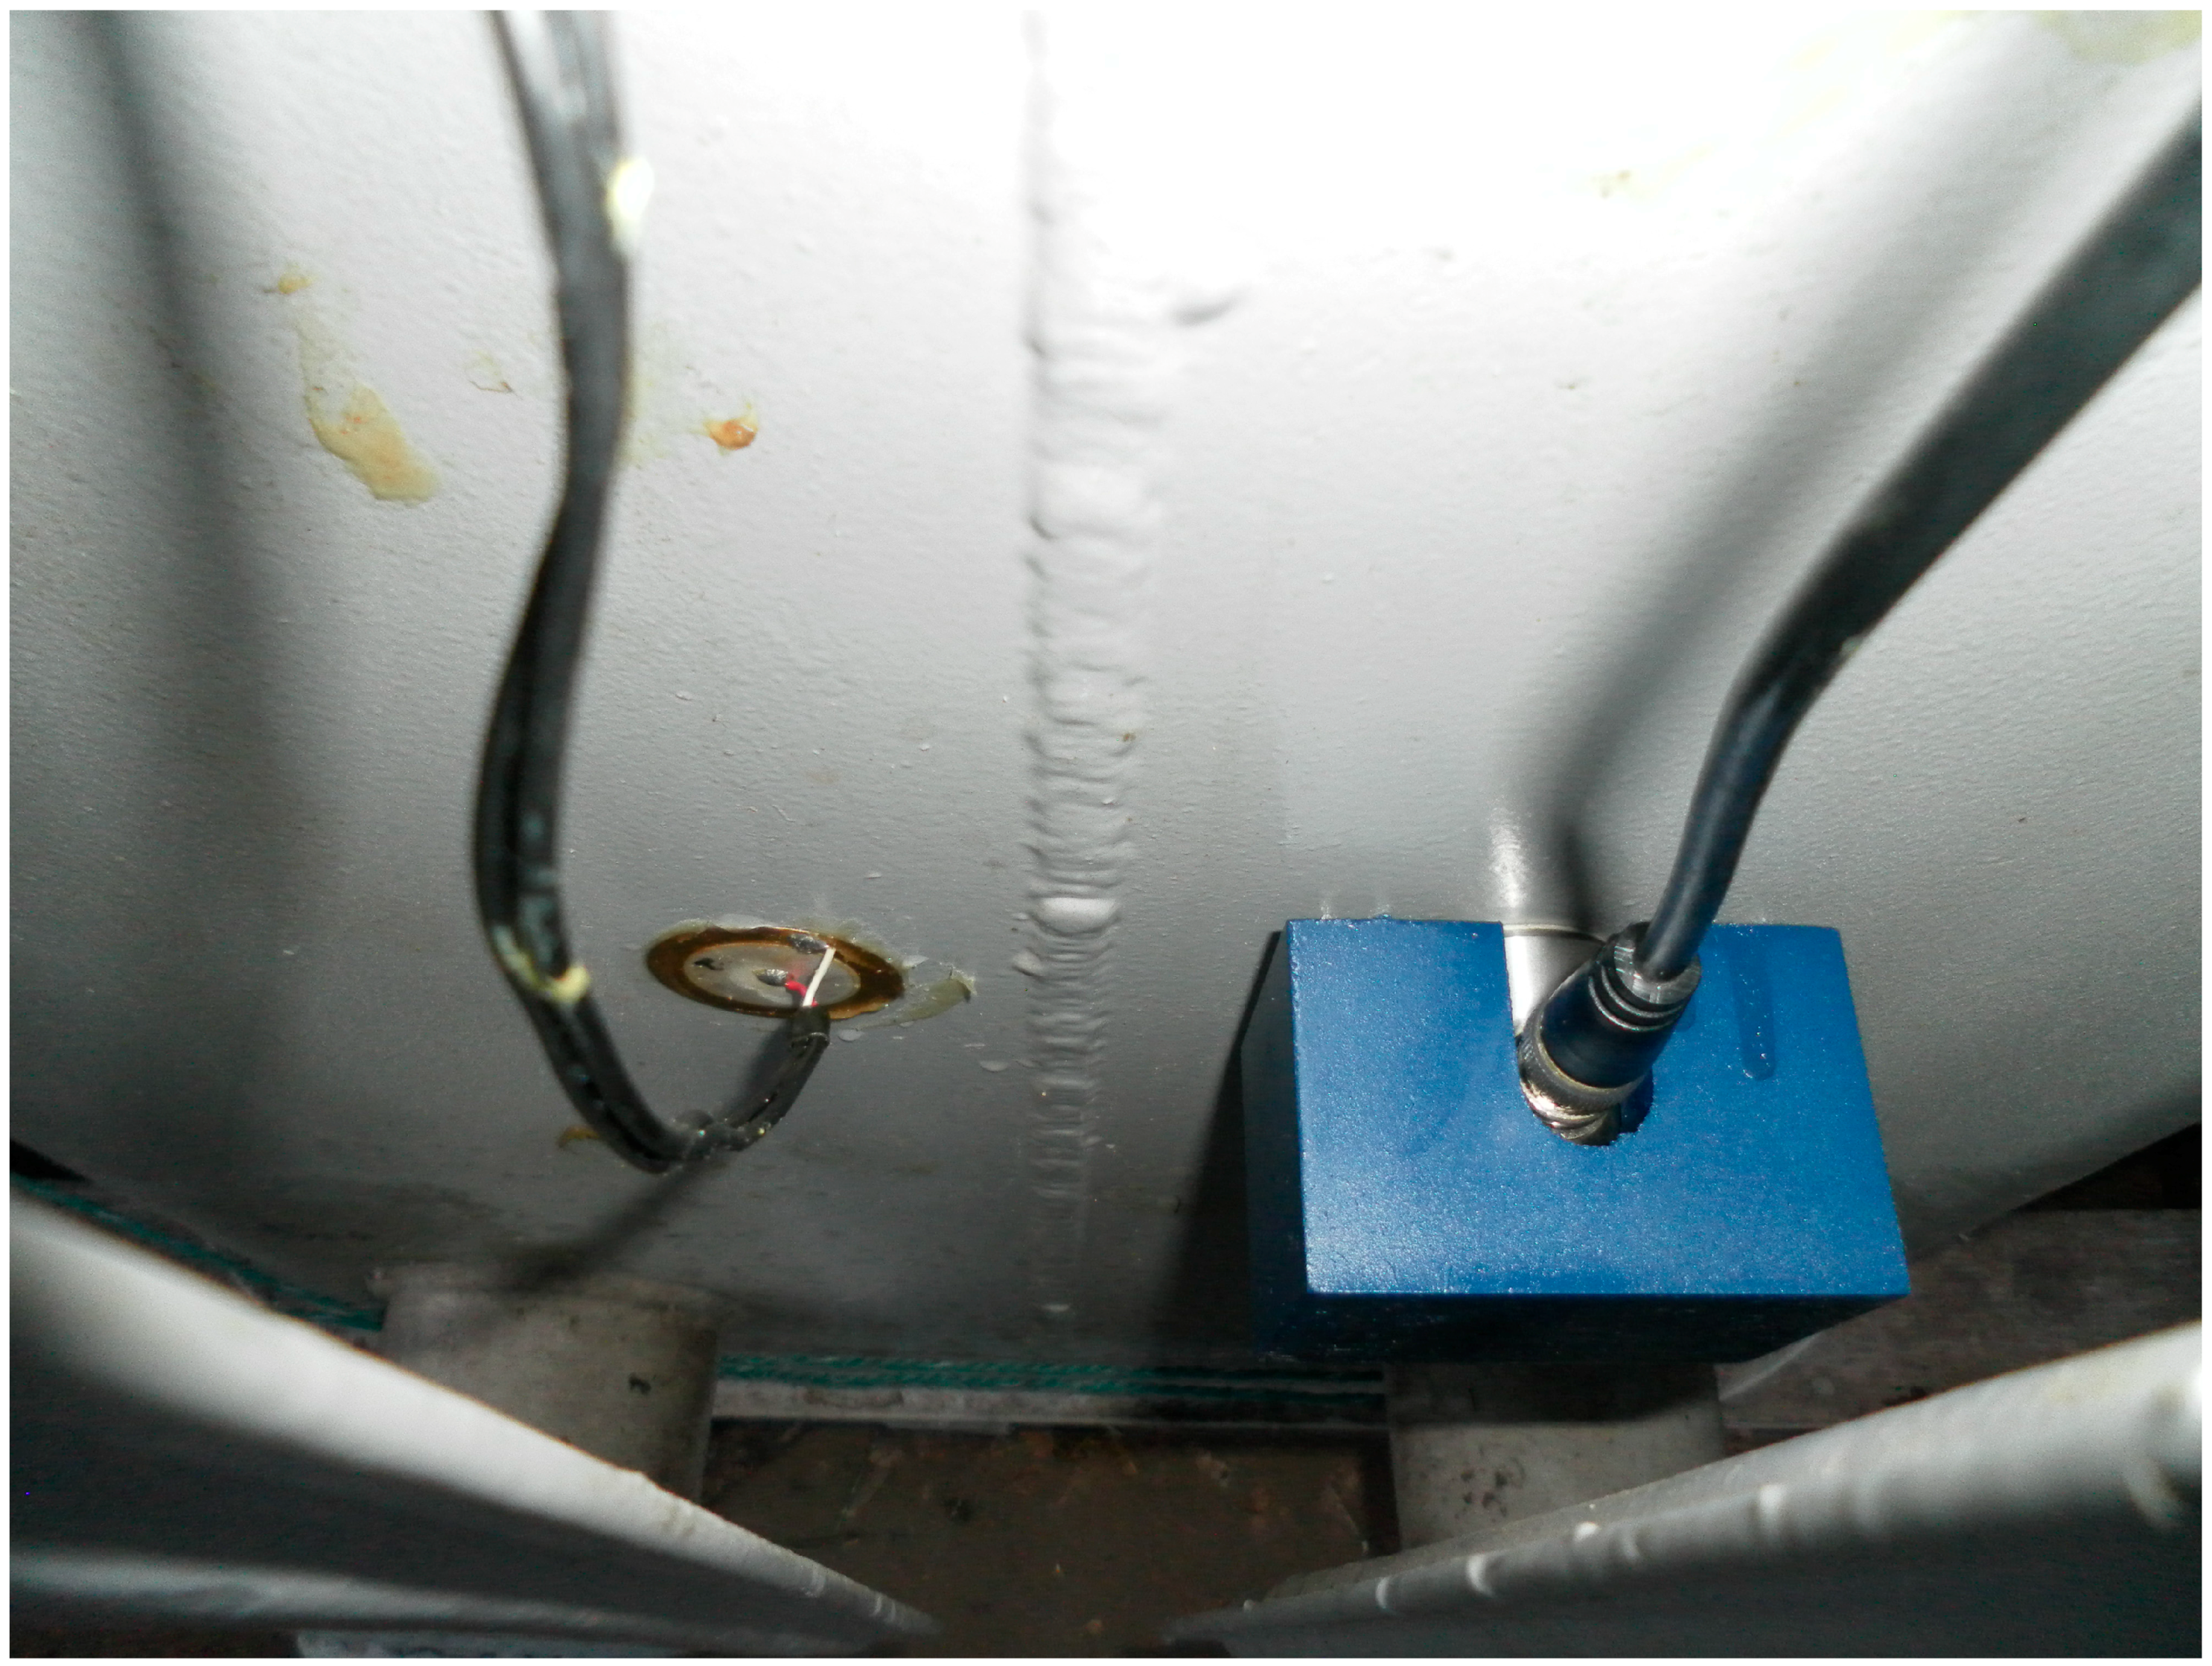
4.2. Partial Discharge Monitoring
4.3. Signal Processing Parameters
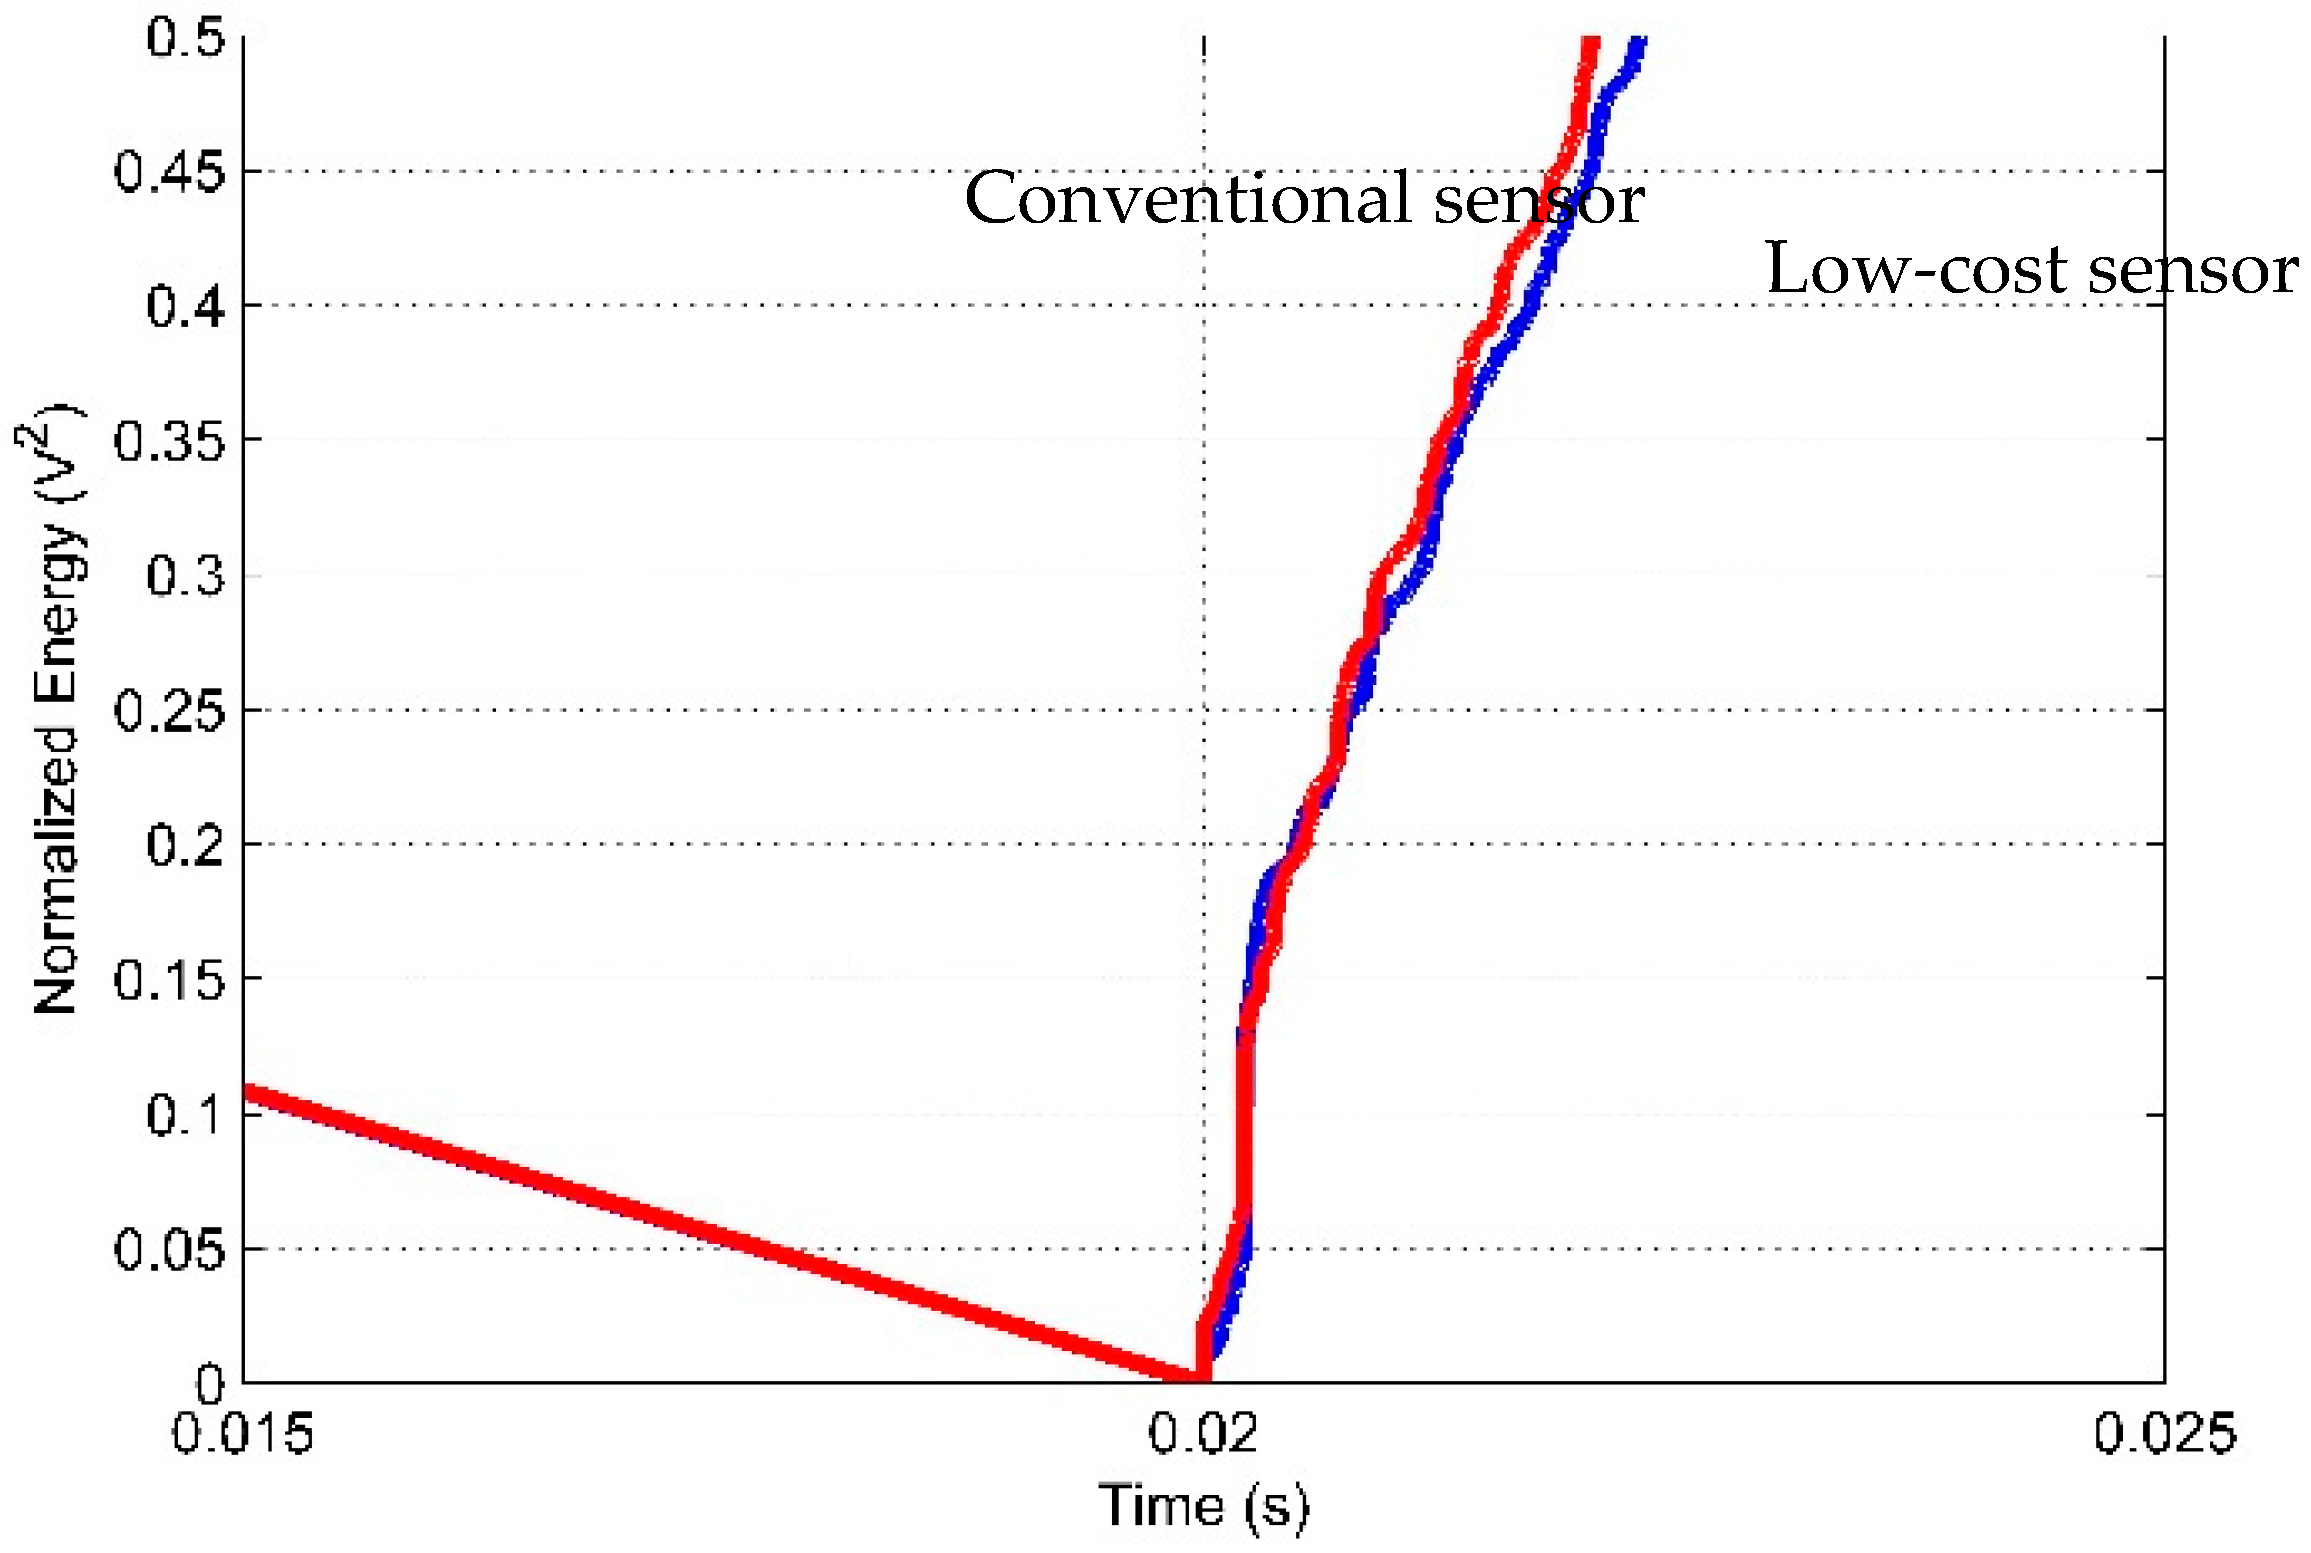
4.3.1. Energy Criterion
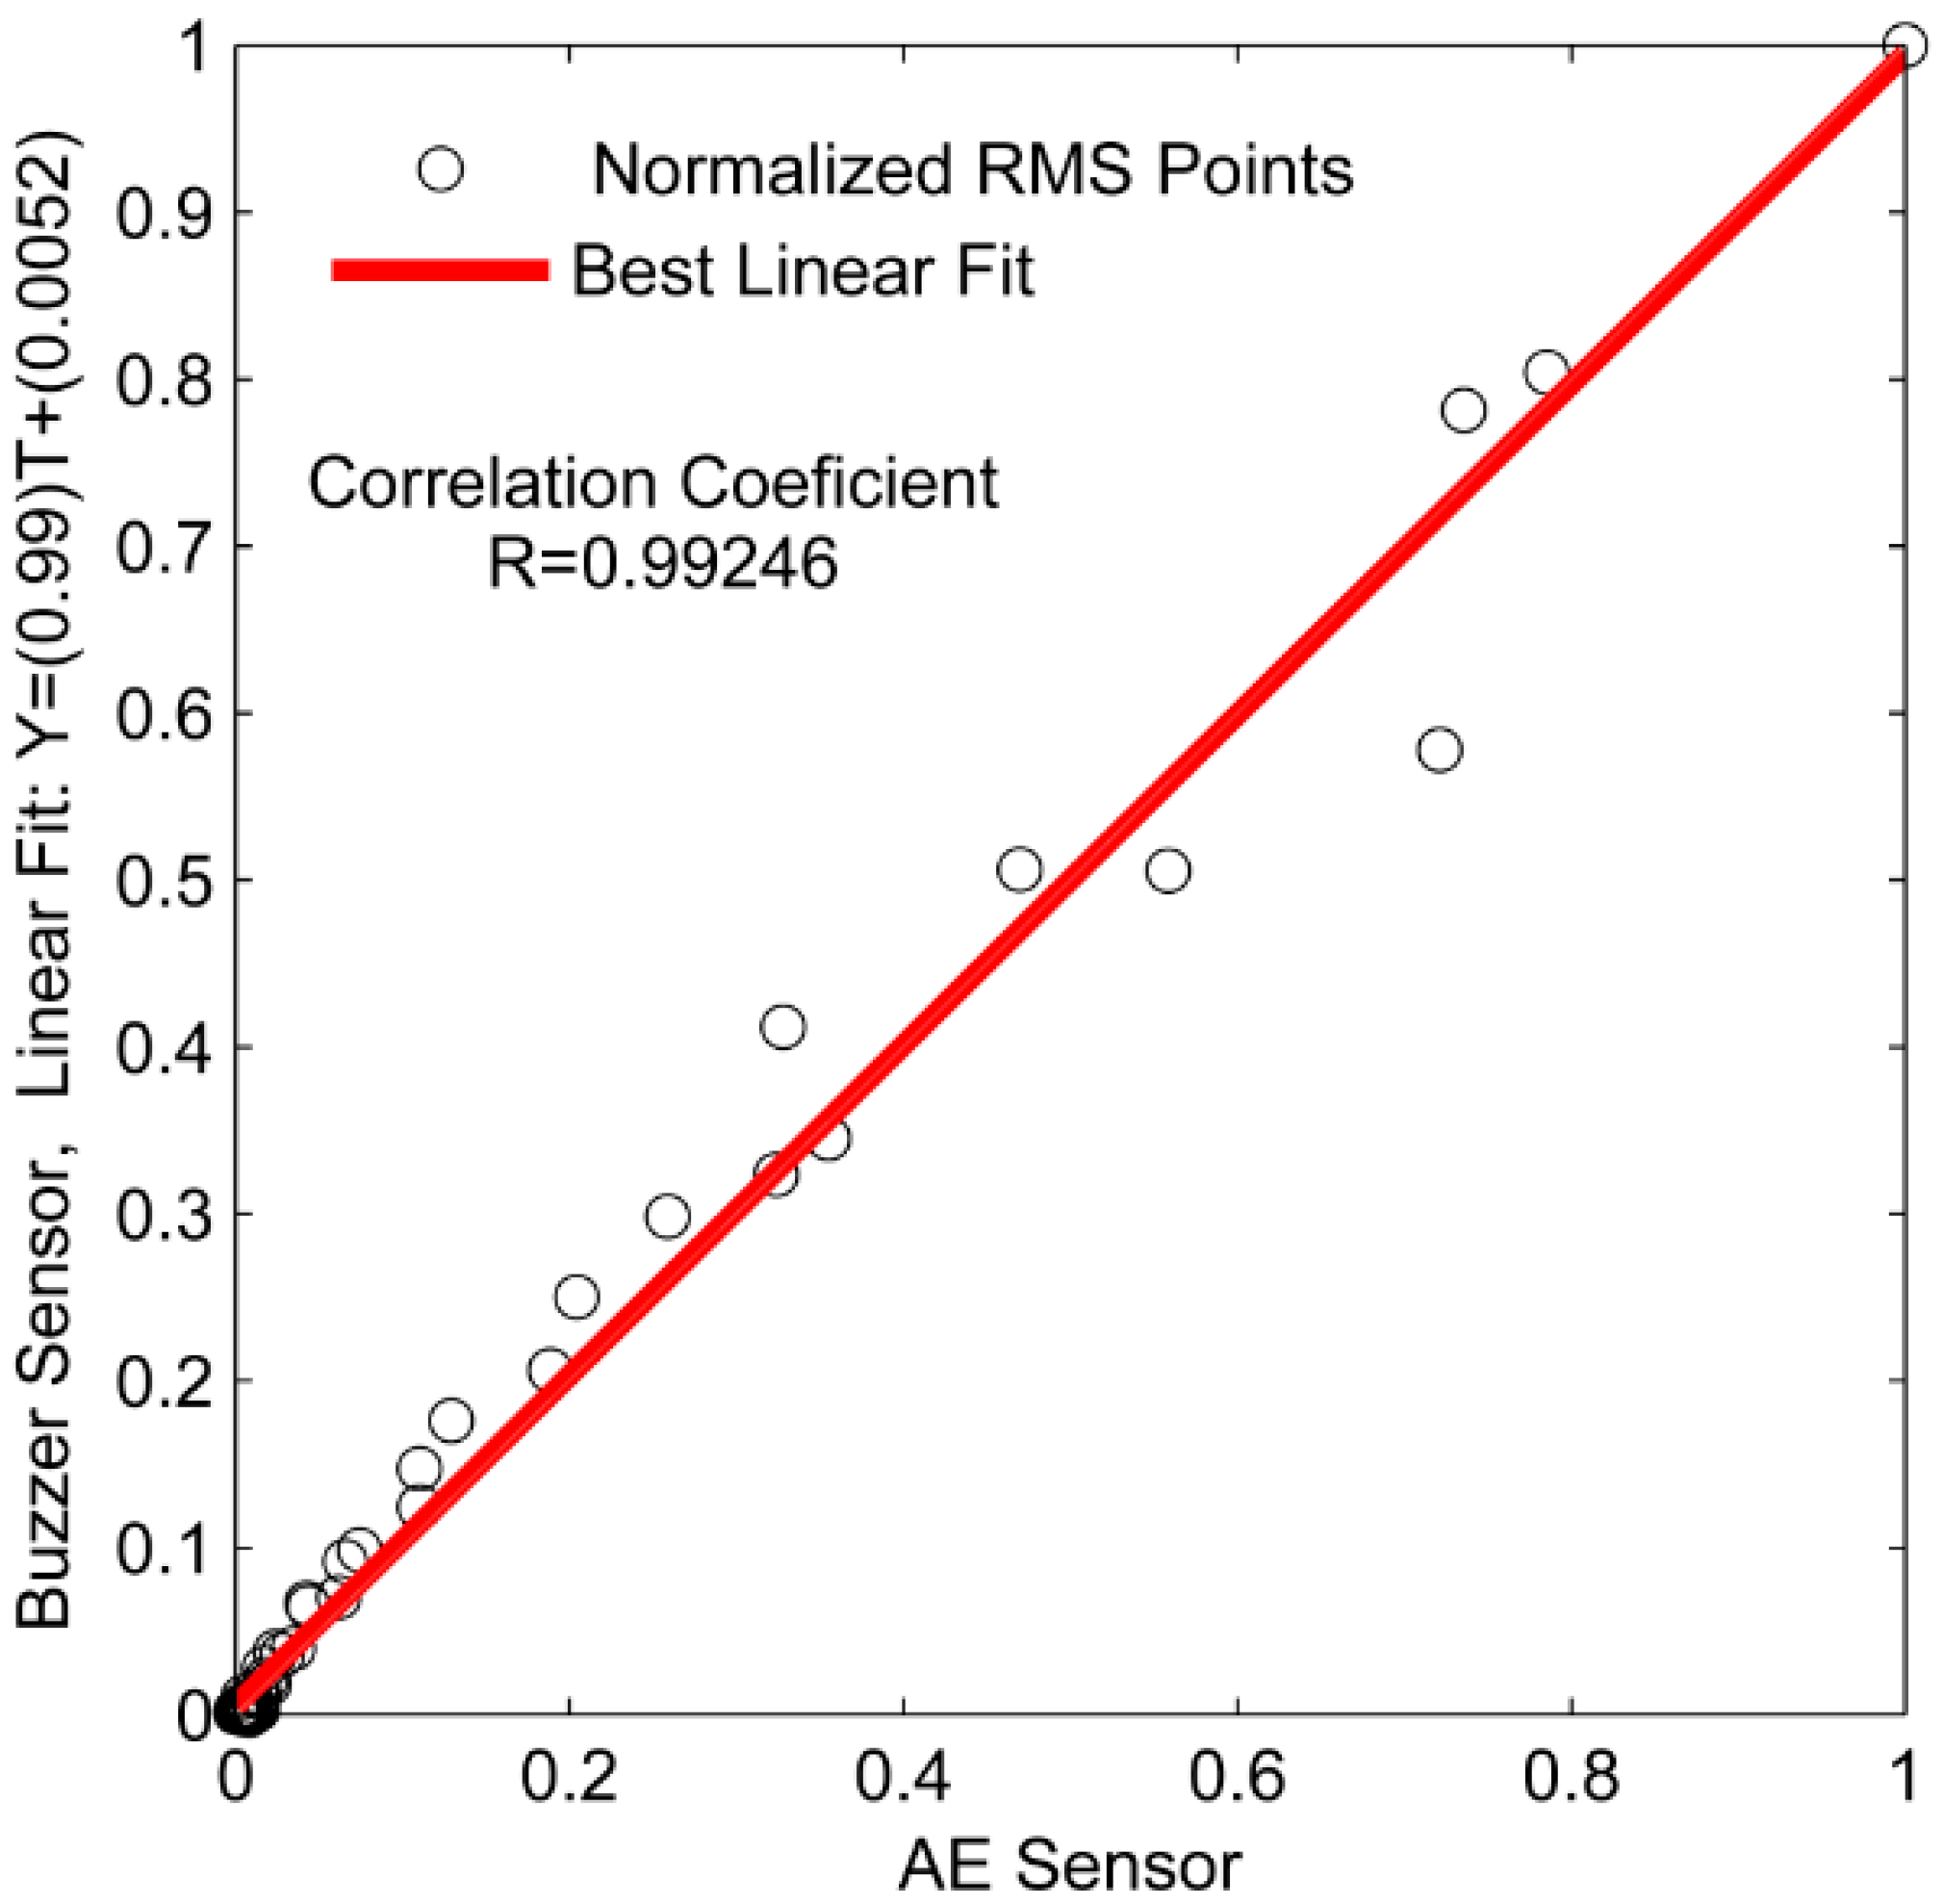
4.3.2. Root Mean Square (RMS) Criterion
5. Results and Discussion
5.1. Initial Characterization
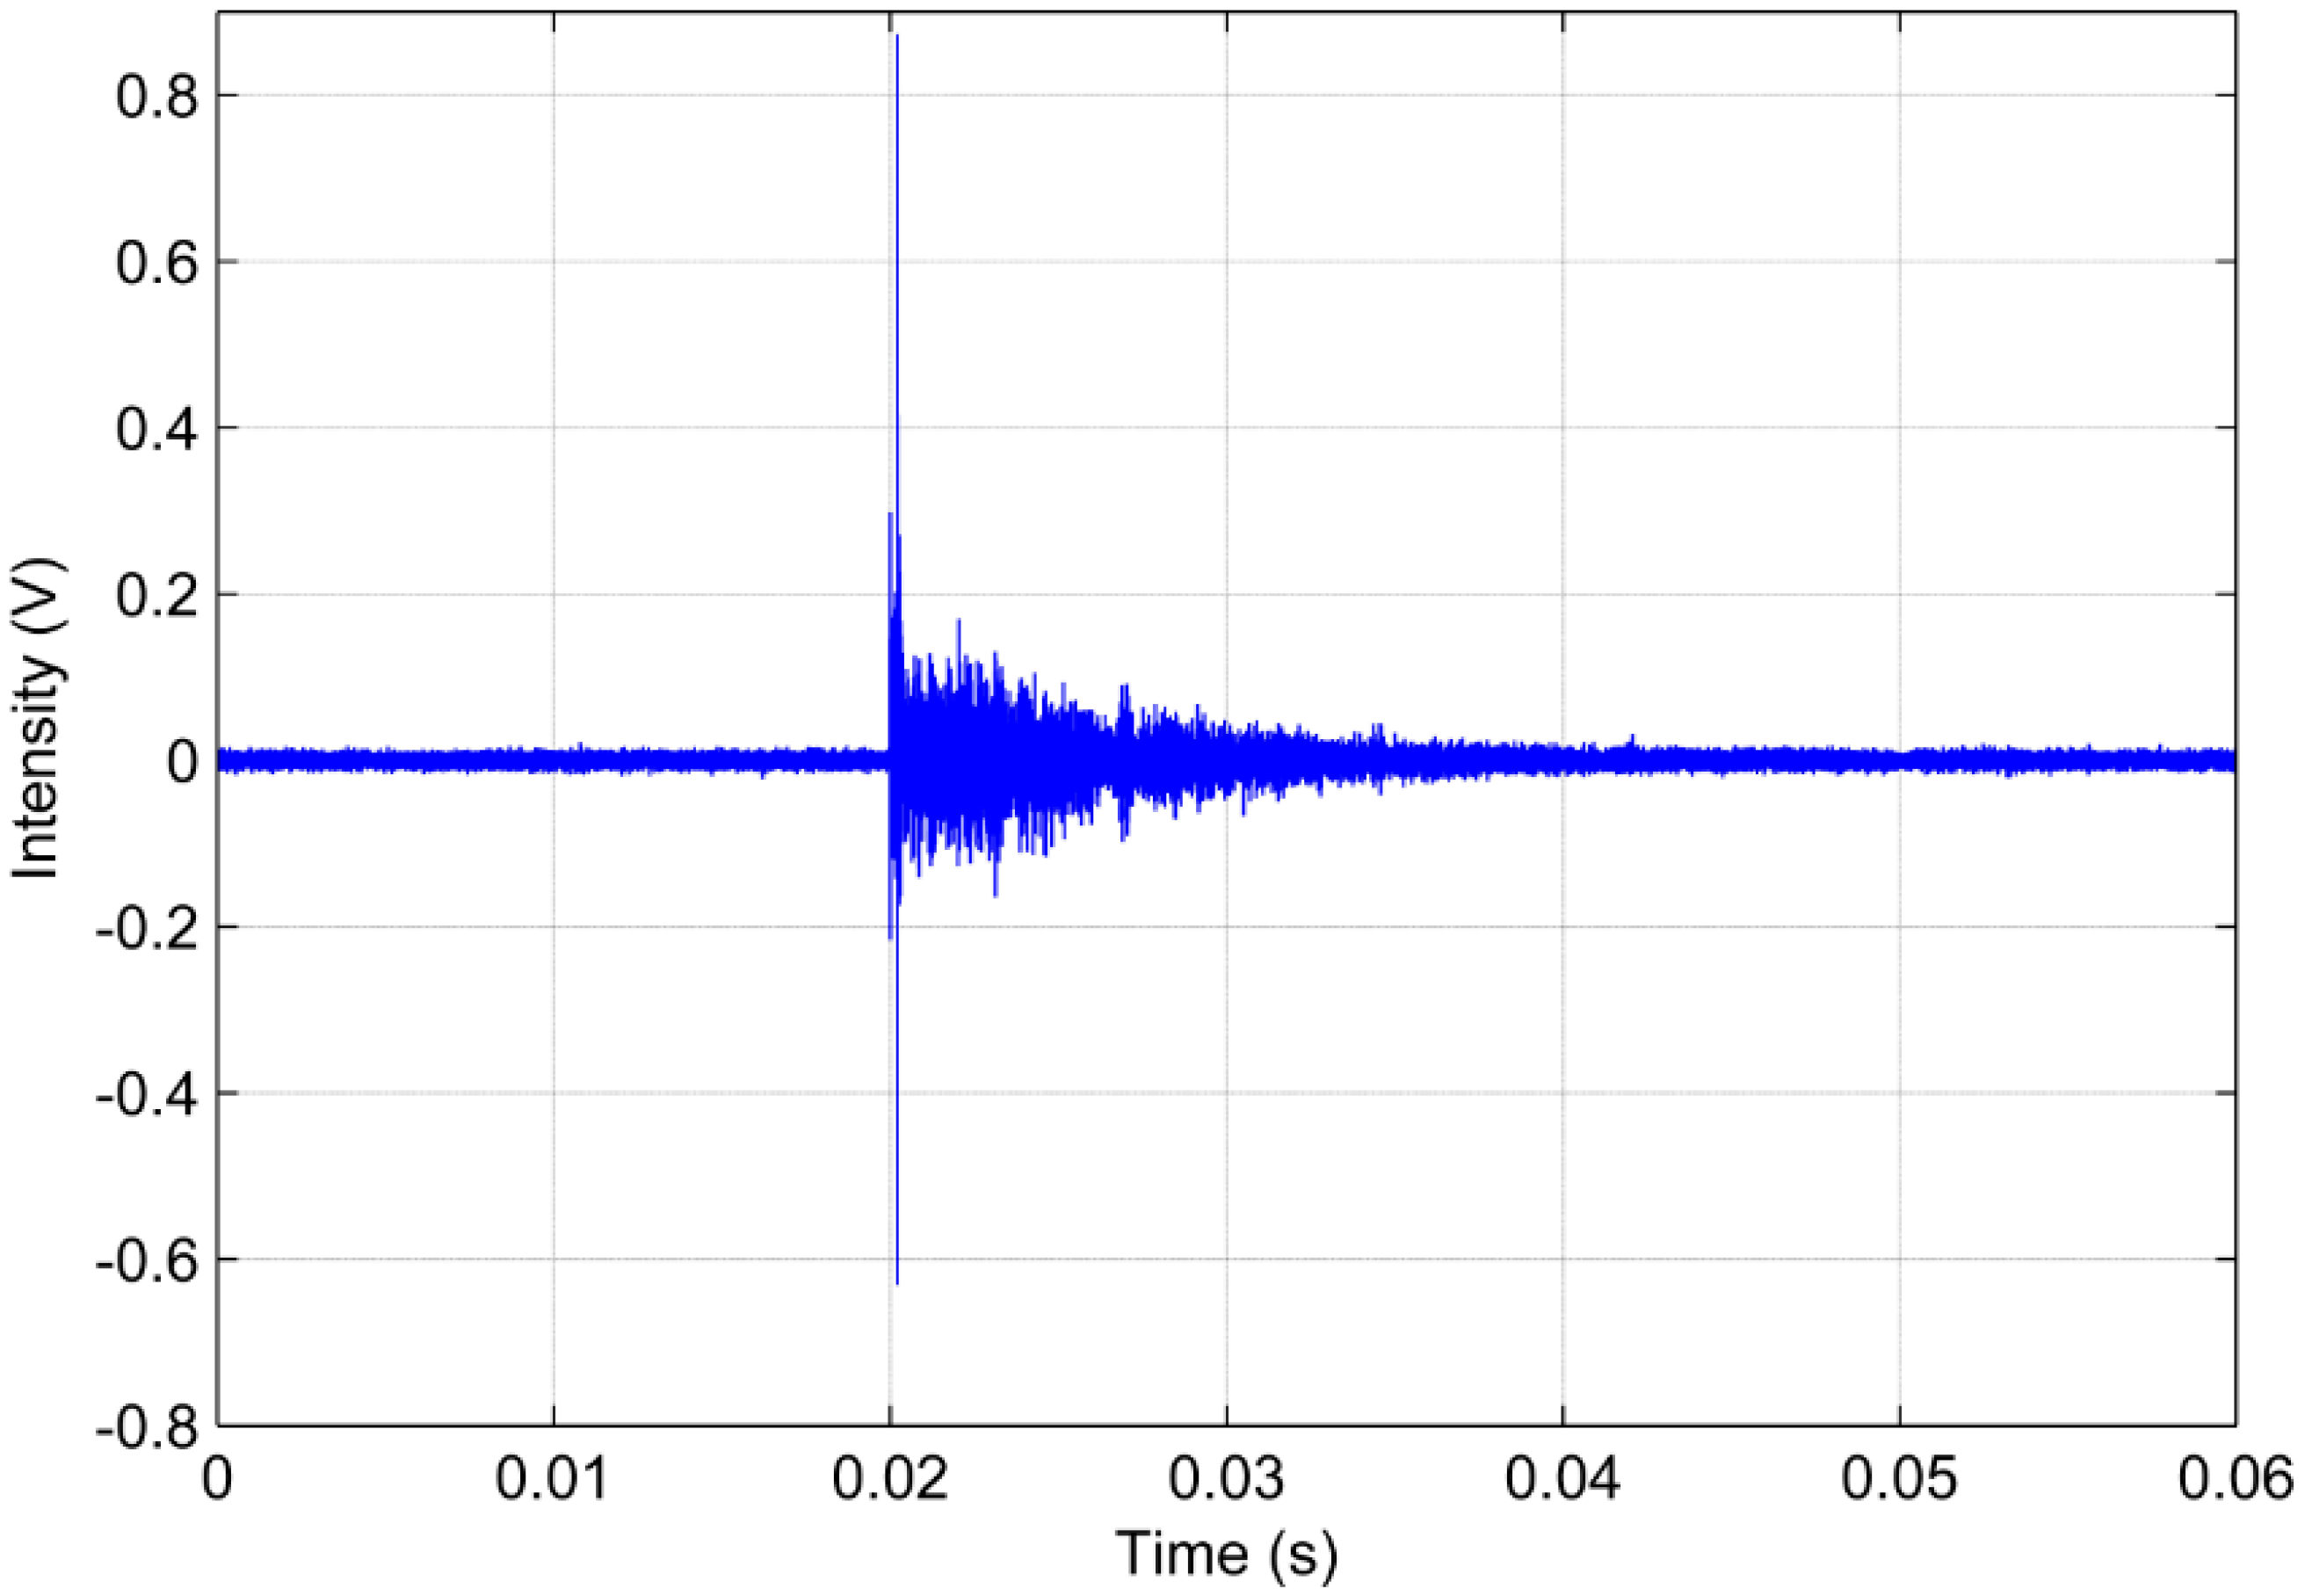
5.2. Analysis of PD Signals
6. Conclusions
Acknowledgments
Author Contributions
Conflicts of Interest
References
- Liu, J.; Zhang, G.; Dong, J.; Wang, J. Study on miniaturized UHF antennas for partial discharge detection in high-voltage electrical equipment. Sensors 2015, 15, 29434–2945. [Google Scholar] [CrossRef] [PubMed]
- Ardila-Rey, J.A.; Rojas-Moreno, M.V.; Martínez-Tarifa, J.M.; Robles, G. Inductive sensor performance in partial discharges and noise separation by means of spectral power ratios. Sensors 2014, 14, 3408–3427. [Google Scholar] [CrossRef] [PubMed]
- Boggs, S. Partial discharge: Overview and signal generation. IEEE Electr. Insul. Mag. 1990, 6, 33–39. [Google Scholar] [CrossRef]
- Mohammadi, E.; Niroomand, M.; Rezaeian, M.; Amini, Z. Partial discharge localization and classification using acoustic emission analysis in power transformer. In Proceedings of the 31st International Telecommunications Energy Conference (INTELEC 2009), Incheon, Korea, 18–22 October 2009.
- Silva, I.N.; Gonzales, C.G.; Flauzino, R.A.; Silva, P.G.; Fernandes, R.A.S.; Silveira, E.; Spatti, D.H.; Ulson, J.A.C. Intelligent Systems for the Detection of Internal Faults in Power Transmission Transformers. In Advances in Expert Systems; Vizureanu, P., Ed.; INTECH: Rijeka, Croatia, 2012; pp. 3–27. [Google Scholar]
- Danouj, B.; Tahan, S.A.; David, E. Using a new generation of piezoelectric sensors for partial discharge detection. Measurement 2013, 46, 660–666. [Google Scholar] [CrossRef]
- Àlvarez, F.; Garnacho, F.; Ortego, J.; Uran, M.A.S. Application of HFCT and UHF sensors in on-line partial discharge measurements for insulation diagnosis of high voltage equipment. Sensors 2015, 15, 7360–7387. [Google Scholar] [CrossRef] [PubMed]
- Kweon, D.J.; Chin, S.B.; Kwak, H.R. The analysis of ultrasonic signals by partial discharge and noise from the transformer. IEEE Trans. Power Deliv. 2005, 20, 1976–1983. [Google Scholar] [CrossRef]
- Veloso, G.F.C.; da Silva, L.E.B.; Lambert-Torres, G.; Pinto, J.O.P. Localization of Partial Discharges in Transformers by the Analysis of the Acoustic Emission. In Proceedings of IEEE International Symposium on Industrial Electronics, Montreal, QC, Canada, 9–13 July 2006; pp. 537–541.
- High-Voltage Test Techniques-Partial Discharge Measurement, 2nd ed.; IEC Publication: Geneva, Switzerland, 2000.
- Krueger, F.H. Partial Discharge Detection in High-Voltage Equipment; Butterworth-Heinemann: London, UK, 1989. [Google Scholar]
- Sarathi, R.; Singh, P.D.; Danikas, M.G. Characterization of partial discharges in transformer oil insulation under AC and DC voltage using acoustic emission technique. J. Electr. Eng. 2007, 58, 91–97. [Google Scholar]
- Lundgaard, L.E. Partial Discharge–Part XIV: Acoustic Partial Discharge Detection–Practical Application. IEEE Electr. Insul. Mag. 1992, 8, 34–43. [Google Scholar] [CrossRef]
- Stone, G.C. Partial discharge diagnostics and electrical equipment insulation condition assessment. IEEE Trans. Dielectr. Electr. Insul. 2005, 12, 891–904. [Google Scholar] [CrossRef]
- Bartnikas, R.A. Comment concerning the rise times of partial discharge pulses. IEEE Trans. Dielectr. Electr. Insul. 2005, 12, 196–202. [Google Scholar] [CrossRef]
- Boczar, T.; Borucki, S.; Cichon, A.; Zmarzly, D. Application possibilities of artificial neural networks for recognizing partial discharges measured by the acoustic emission method. IEEE Trans. Dielectr. Electr. Insul. 2009, 16, 214–223. [Google Scholar] [CrossRef]
- Markalous, S.M. Detection and Location of Partial Discharges in Power Transformers Using Acoustic and Electromagnetic Signals. Ph.D. Thesis, Stuttgart University, Stuttgart, Germany, November 2006. [Google Scholar]
- Phung, B.T.; Blackburn, T.R.; Liu, Z. Acoustic measurements of partial discharge signals. J. Electr. Electron. Eng. 2001, 21, 41–47. [Google Scholar]
- IEEE Standard on Piezoelectricity: An American National Standard; IEEE-ANSI: New York, NY, USA, 1987.
- R15I-AST Sensor-Integral Preamplifier Sensor. Available online: http://www.physicalacoustics.com/content/literature/sensors/Model_R15I-AST.pdf (accessed on 27 July 2016).
- Piezoelectric Sound Components. Available online: www.murata.com (accessed on 27 July 2016).
- Tinoco, H.A.; Marulanda, D.J. Damage identification in active plates with indices based on Gaussian confidence ellipses obtained of the electromechanical admittance. J. Nondestruct. Eval. 2015, 34, 1–16. [Google Scholar] [CrossRef]
- Freitas, E.S.; Baptista, F.G. Experimental analysis of the feasibility of low-cost piezoelectric diaphragms in impedance-based SHM applications. Sens. Actuators A Phys. 2016, 238, 220–228. [Google Scholar] [CrossRef]
- Liang, R.; Wang, Q. High sensitivity piezoelectric sensors using flexible PZT thick-film for shock tube pressure testing. Sens. Actuators A Phys. 2015, 235, 317–327. [Google Scholar] [CrossRef]
- Ilg, J.; Rupitsch, S.J.; Lerch, R. Impedance-based temperature sensing with piezoceramic devices. IEEE Sens. J. 2013, 13, 2442–2449. [Google Scholar] [CrossRef]
- Baptista, F.G.; Budoya, D.E.; Almeida, V.A.D.; Ulson, J.A.C. An experimental study on the effect of temperature on piezoelectric sensors for impedance-based structural health monitoring. Sensors 2014, 14, 1208–1227. [Google Scholar] [CrossRef] [PubMed]
- ASTM E976-15, Standard Guide for Determining the Reproducibility of Acoustic Emission Sensor Response; ASTM International: West Conshohocken, PA, USA, 2015.
- Sause, M.G.R. Investigation of pencil lead breaks as acoustic emission sources. J. Acoust. Emiss. 2011, 29, 184–196. [Google Scholar]
- Almeida, V.A.D.; Baptista, F.G.; Aguiar, P.R. Piezoelectric transducers assessed by the pencil lead break for impedance-based structural health monitoring. IEEE Sens. J. 2015, 15, 693–702. [Google Scholar] [CrossRef]
- Robles, G.; Fresno, J.M.; Tarifa, J.M.M. Separation of radio sources and localization of partial discharges in noise environments. Sensors 2015, 15, 9882–9898. [Google Scholar] [CrossRef] [PubMed]
- Aguiar, P.R.; Bianchi, E.C.; Canarim, R.C. Monitoring of grinding burn by acoustic emission. In Acoustic Emission; Sikorski, W., Ed.; Intech: Rijeka, Croatia, 2012; pp. 341–364. [Google Scholar]


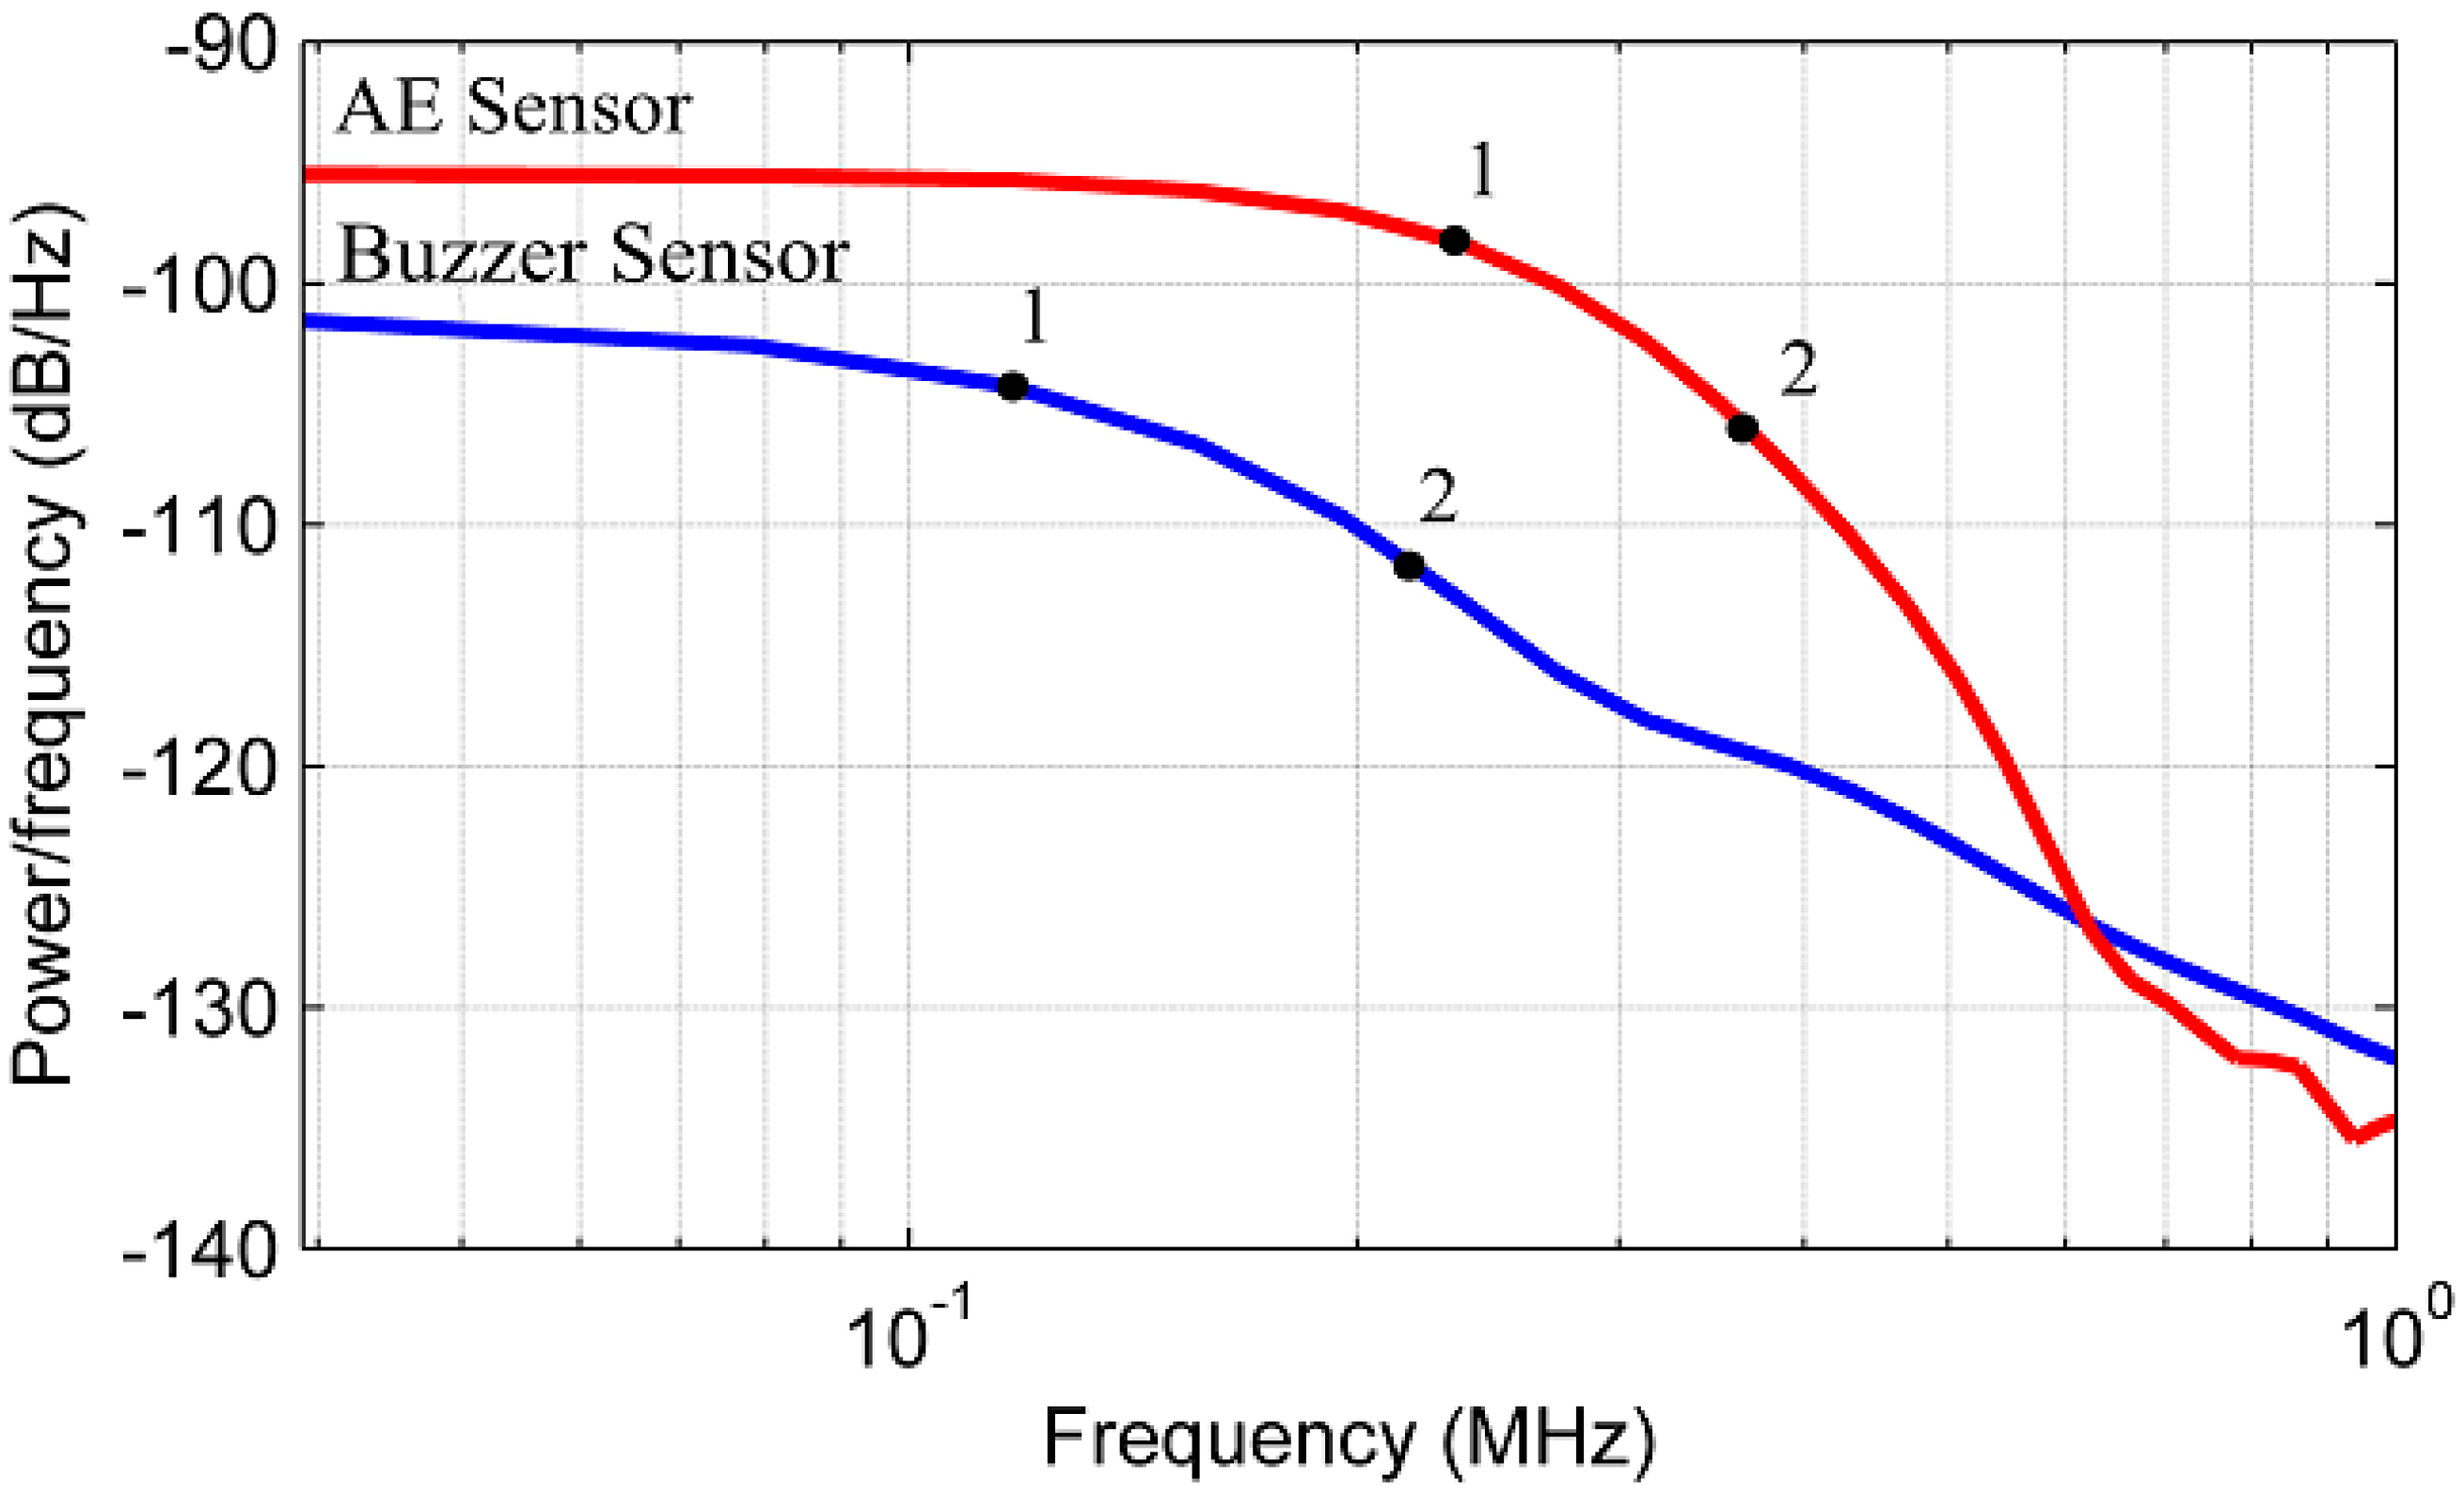
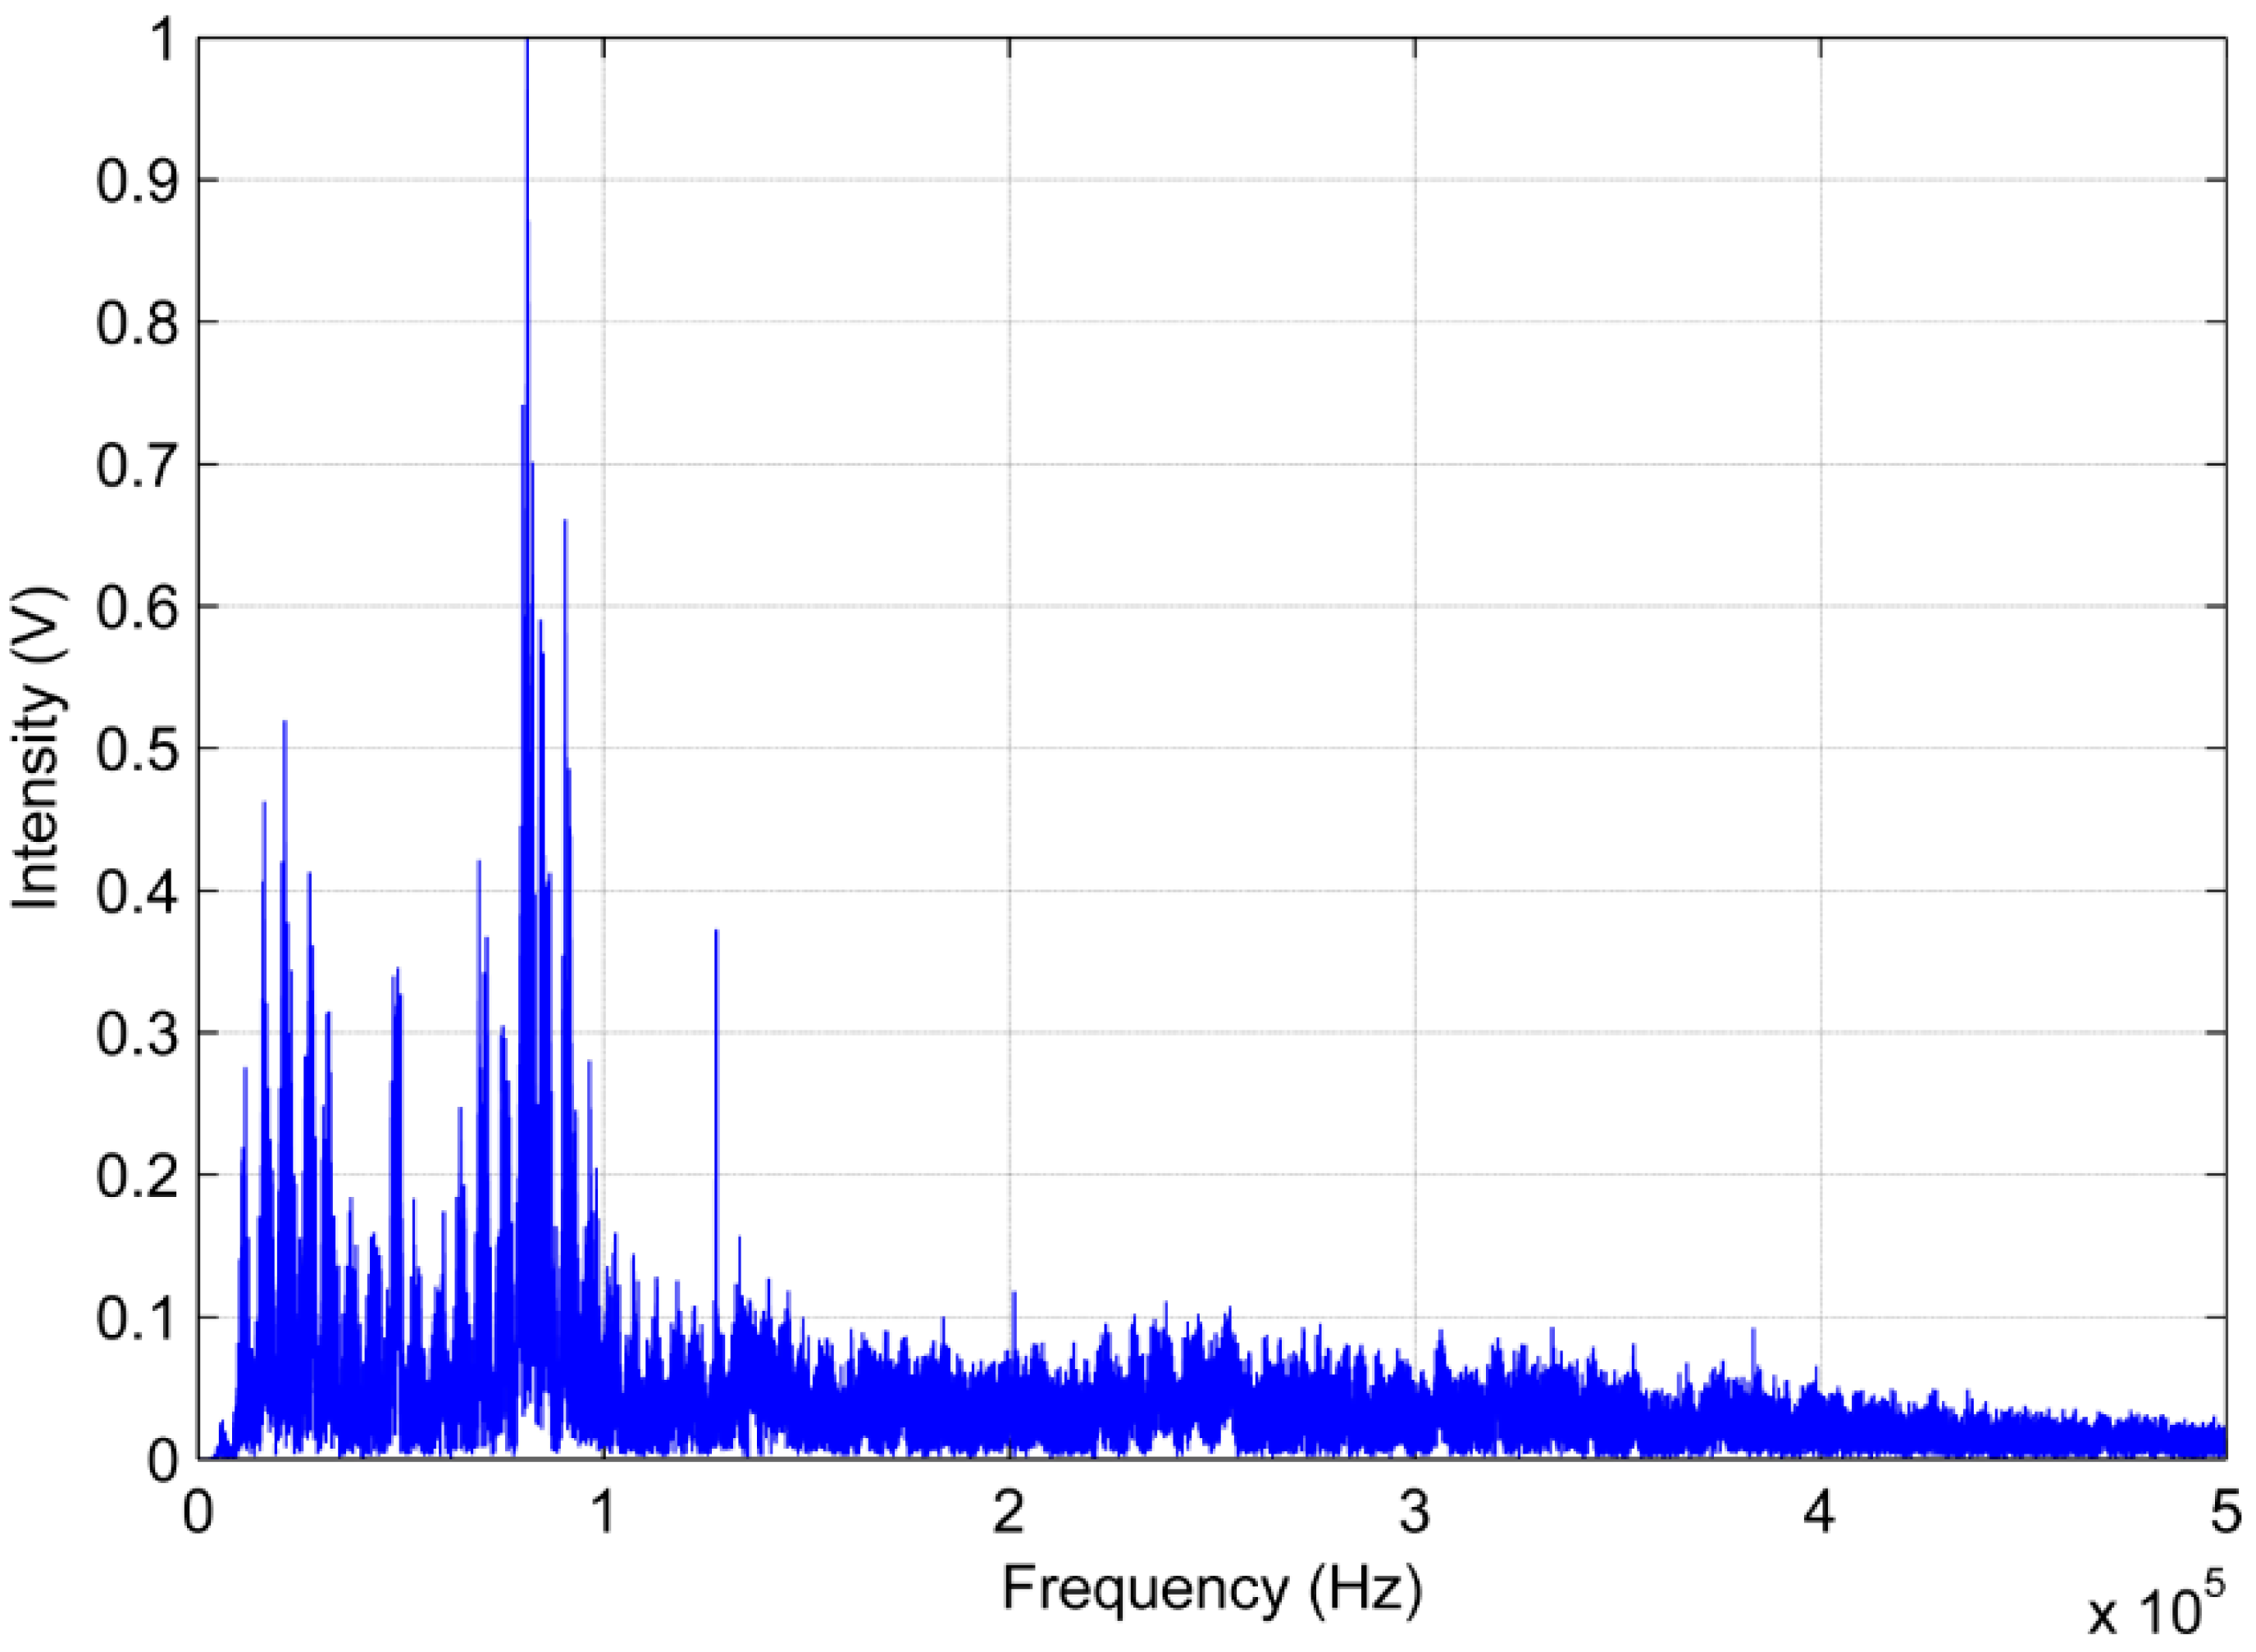
| Sensor | Point | Attenuation (dB) | PSD (dB/Hz) | Frequency (kHz) |
|---|---|---|---|---|
| Diaphragm | 1 | 3 | 104.6 | 120 |
| 2 | 10 | 111.6 | 215 | |
| Conventional | 1 | 3 | 98.5 | 237 |
| 2 | 10 | 105.5 | 357 |
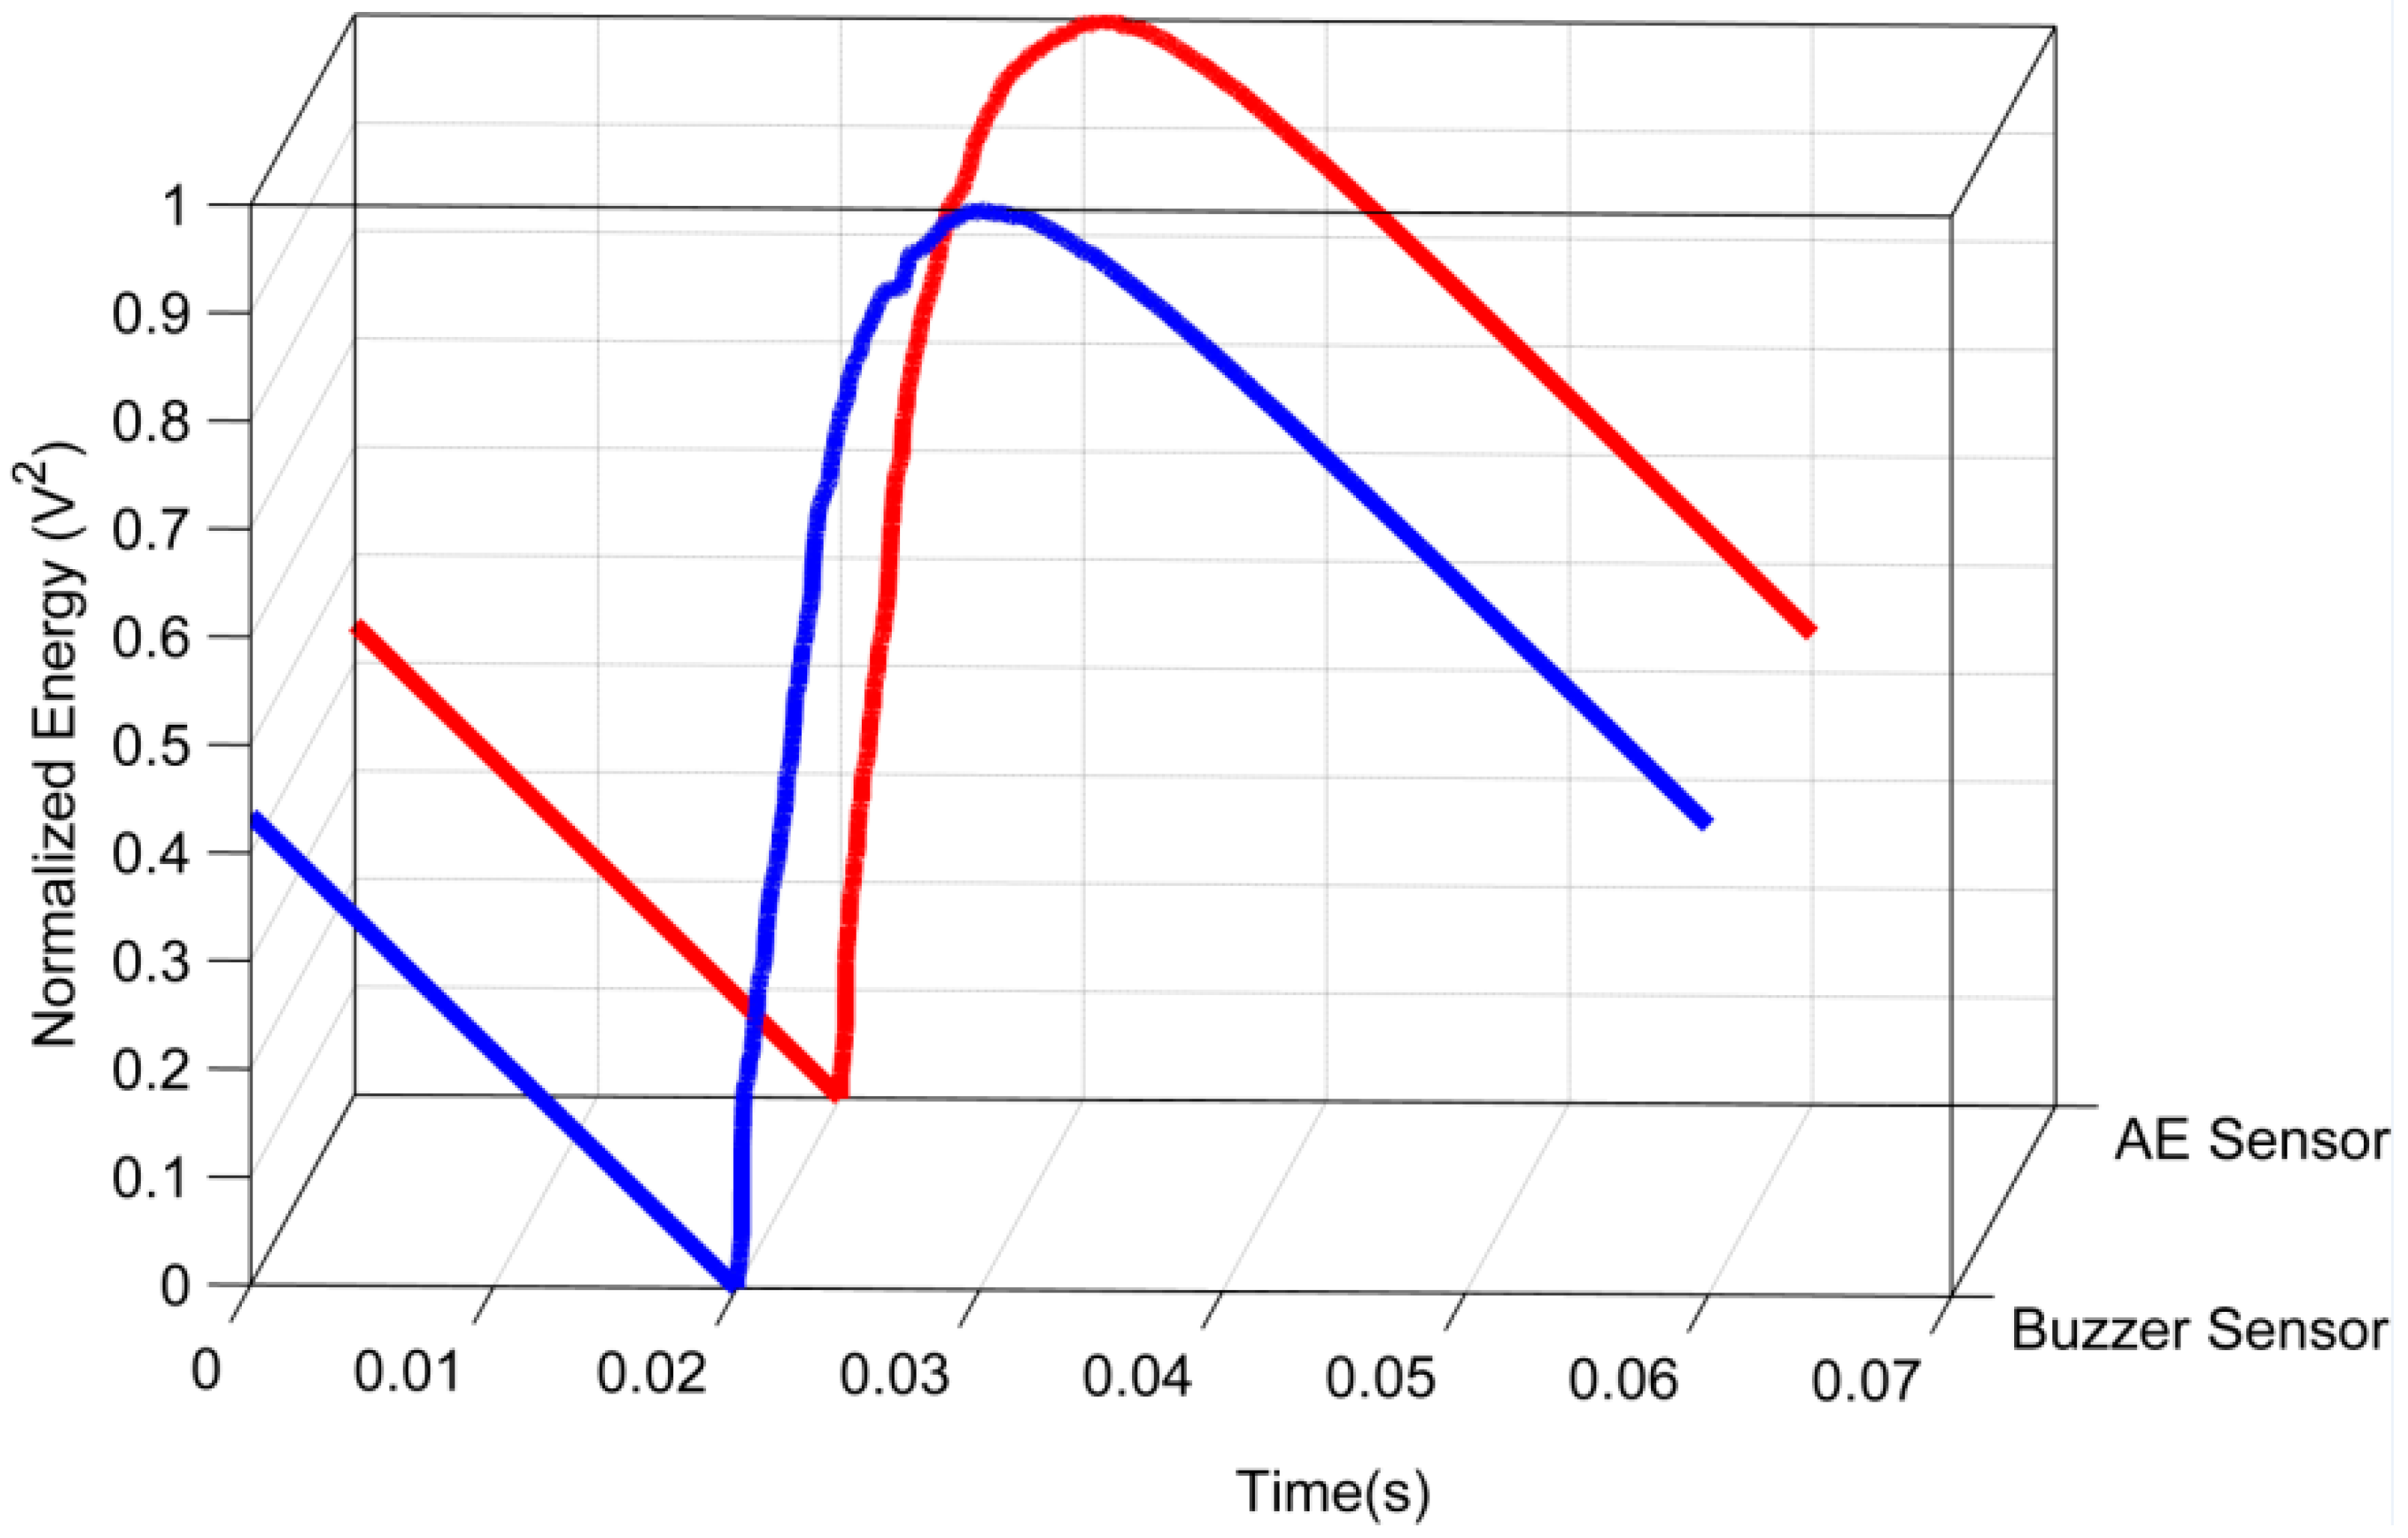
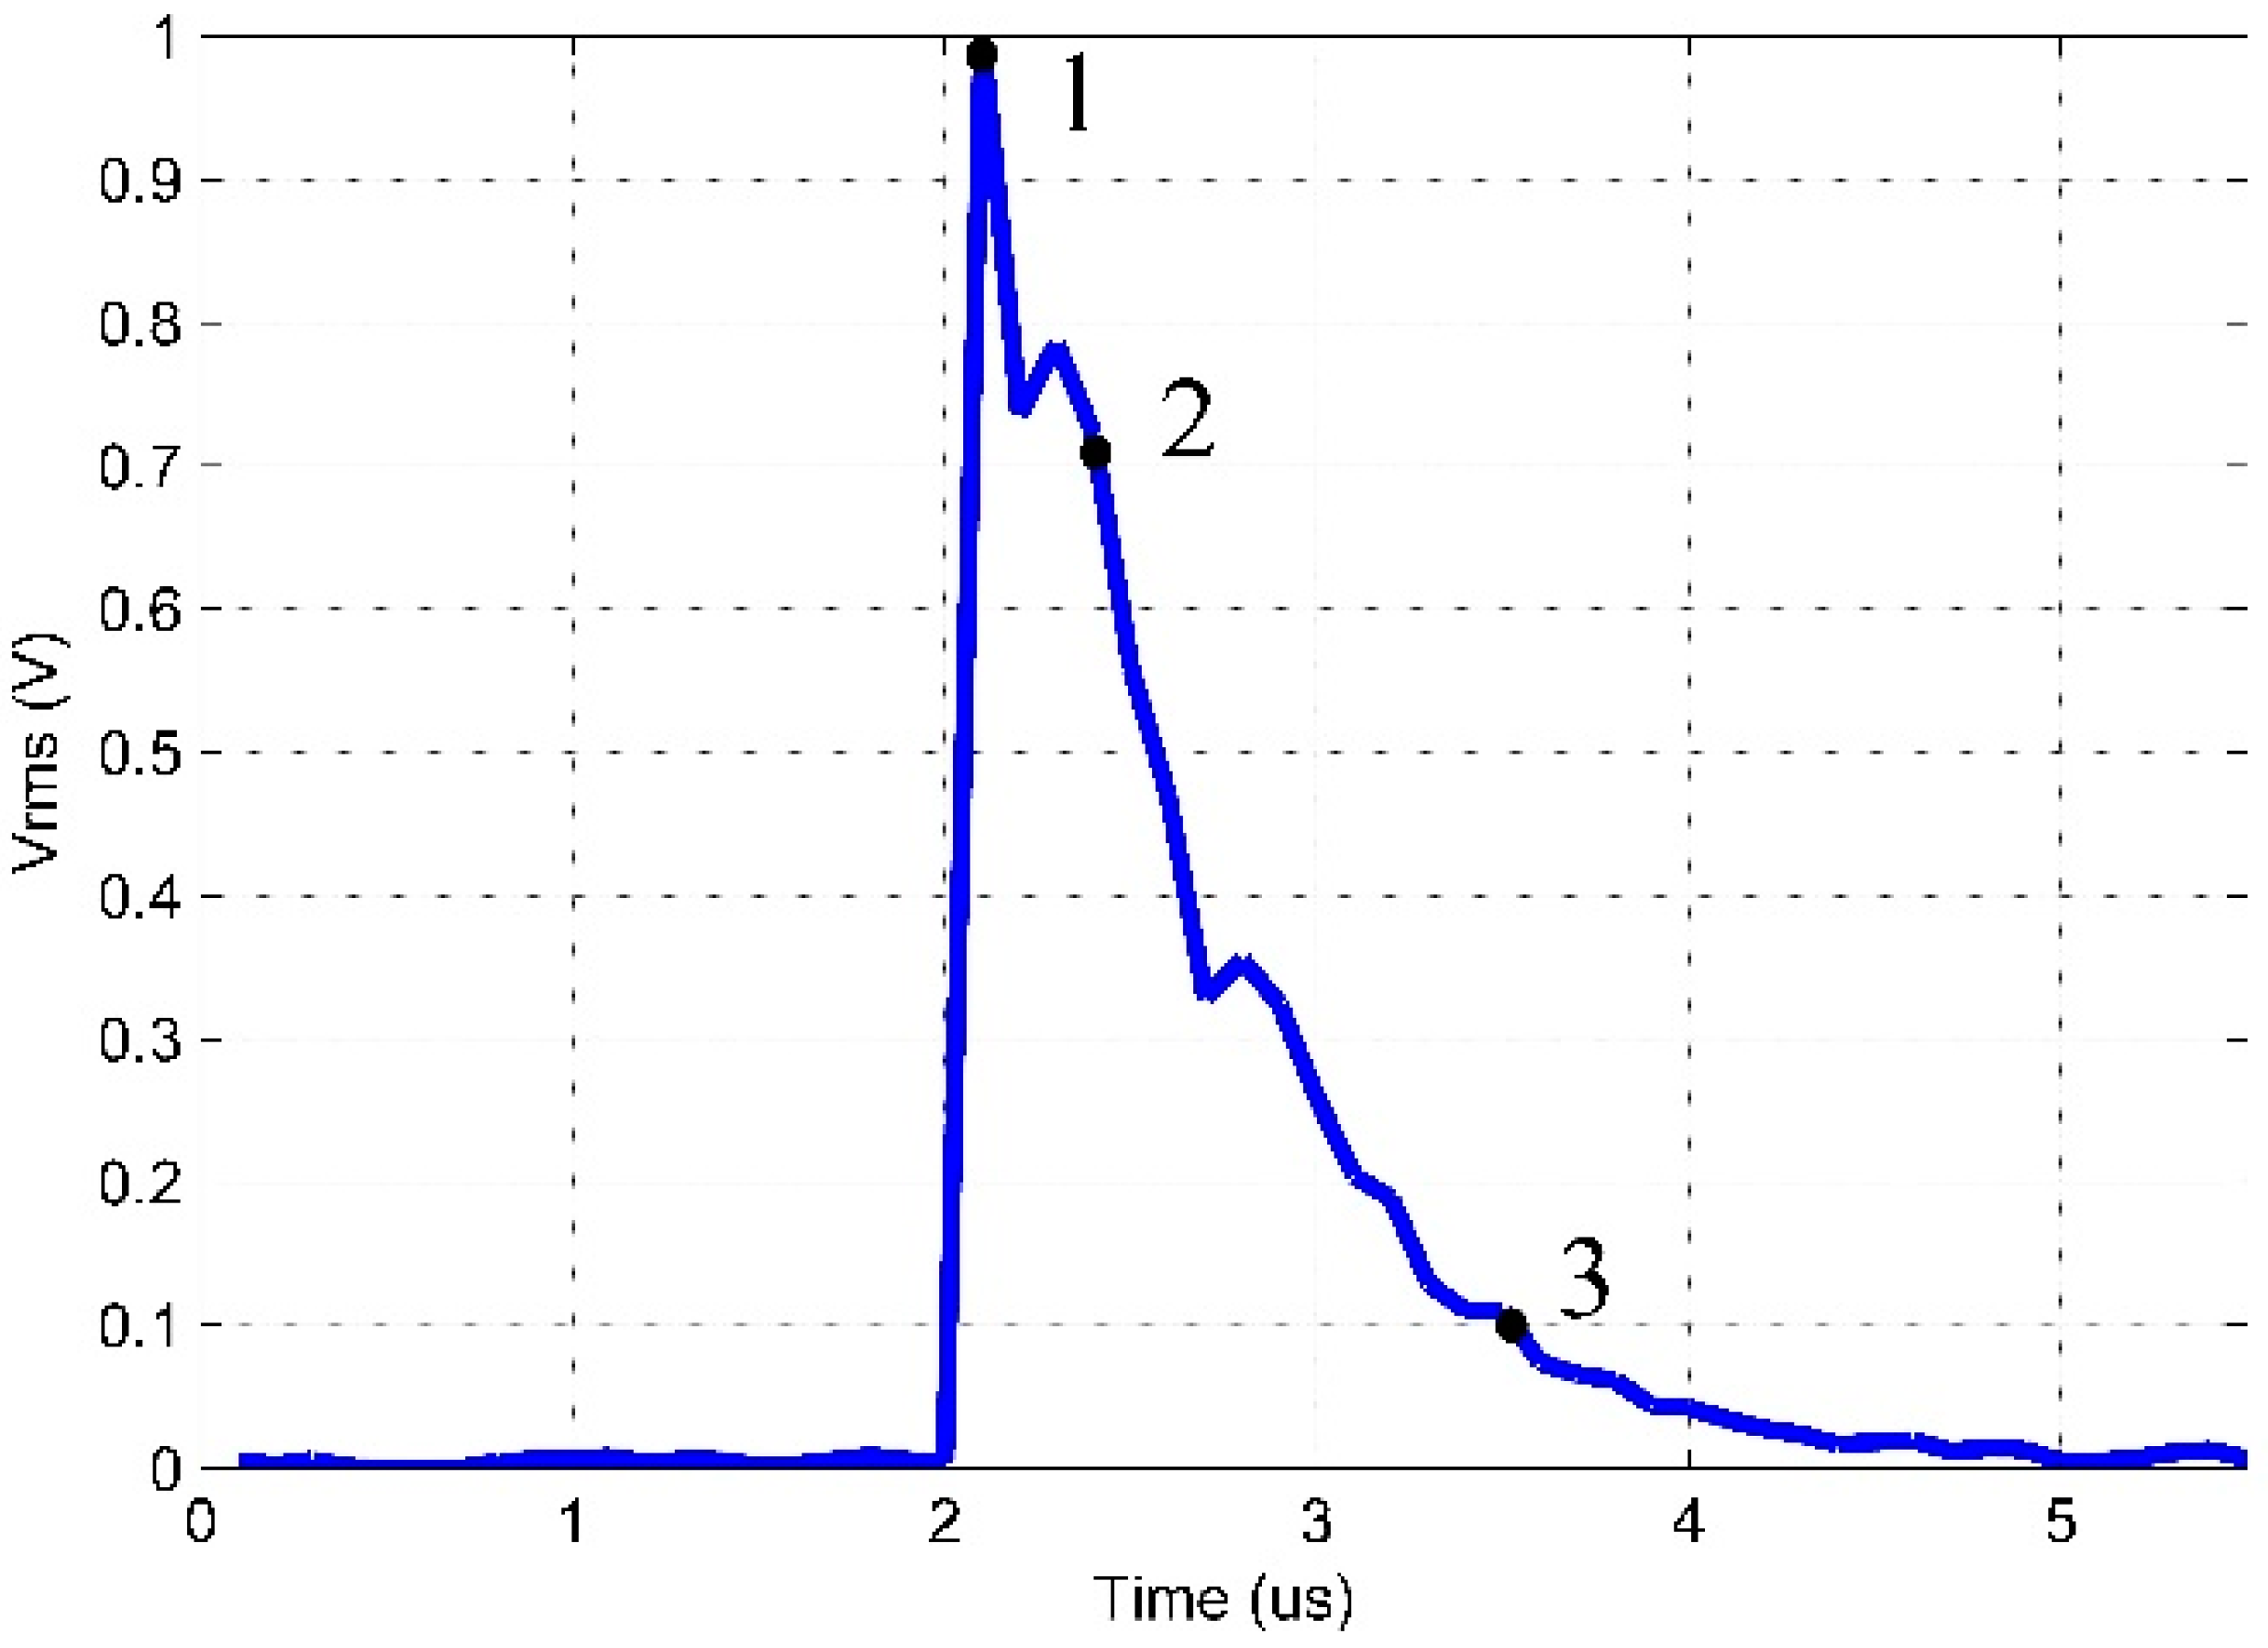
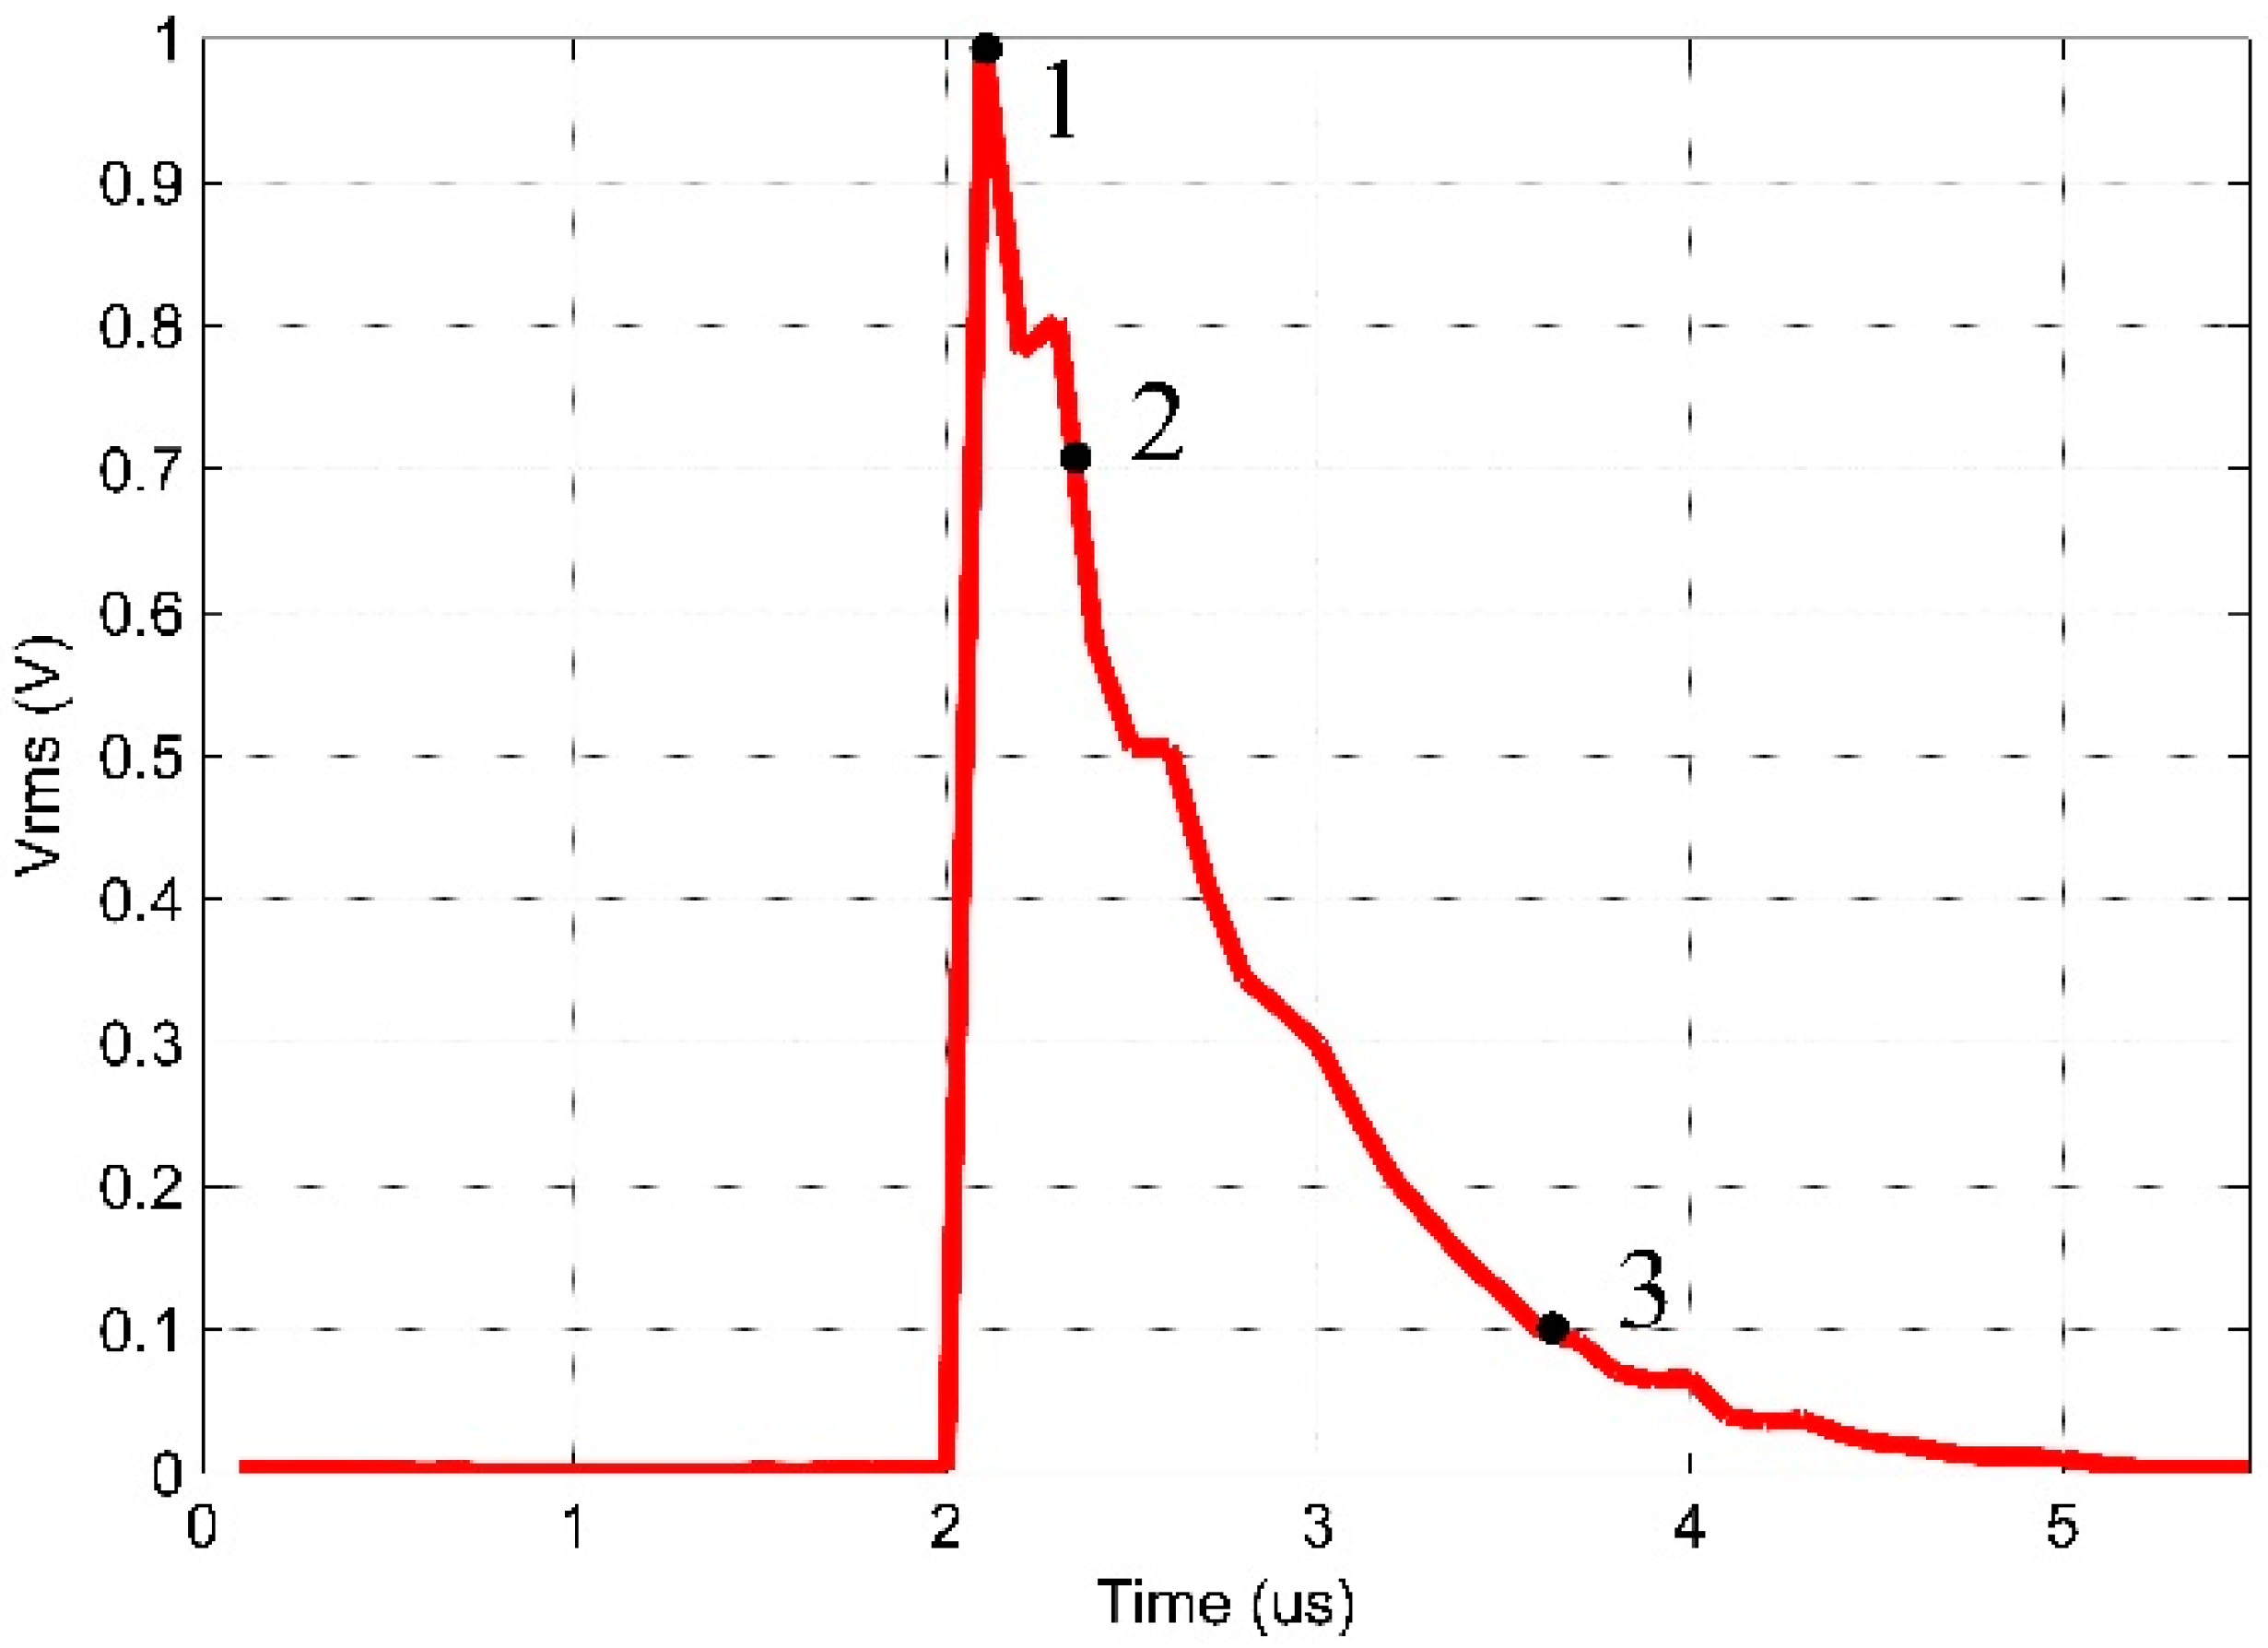
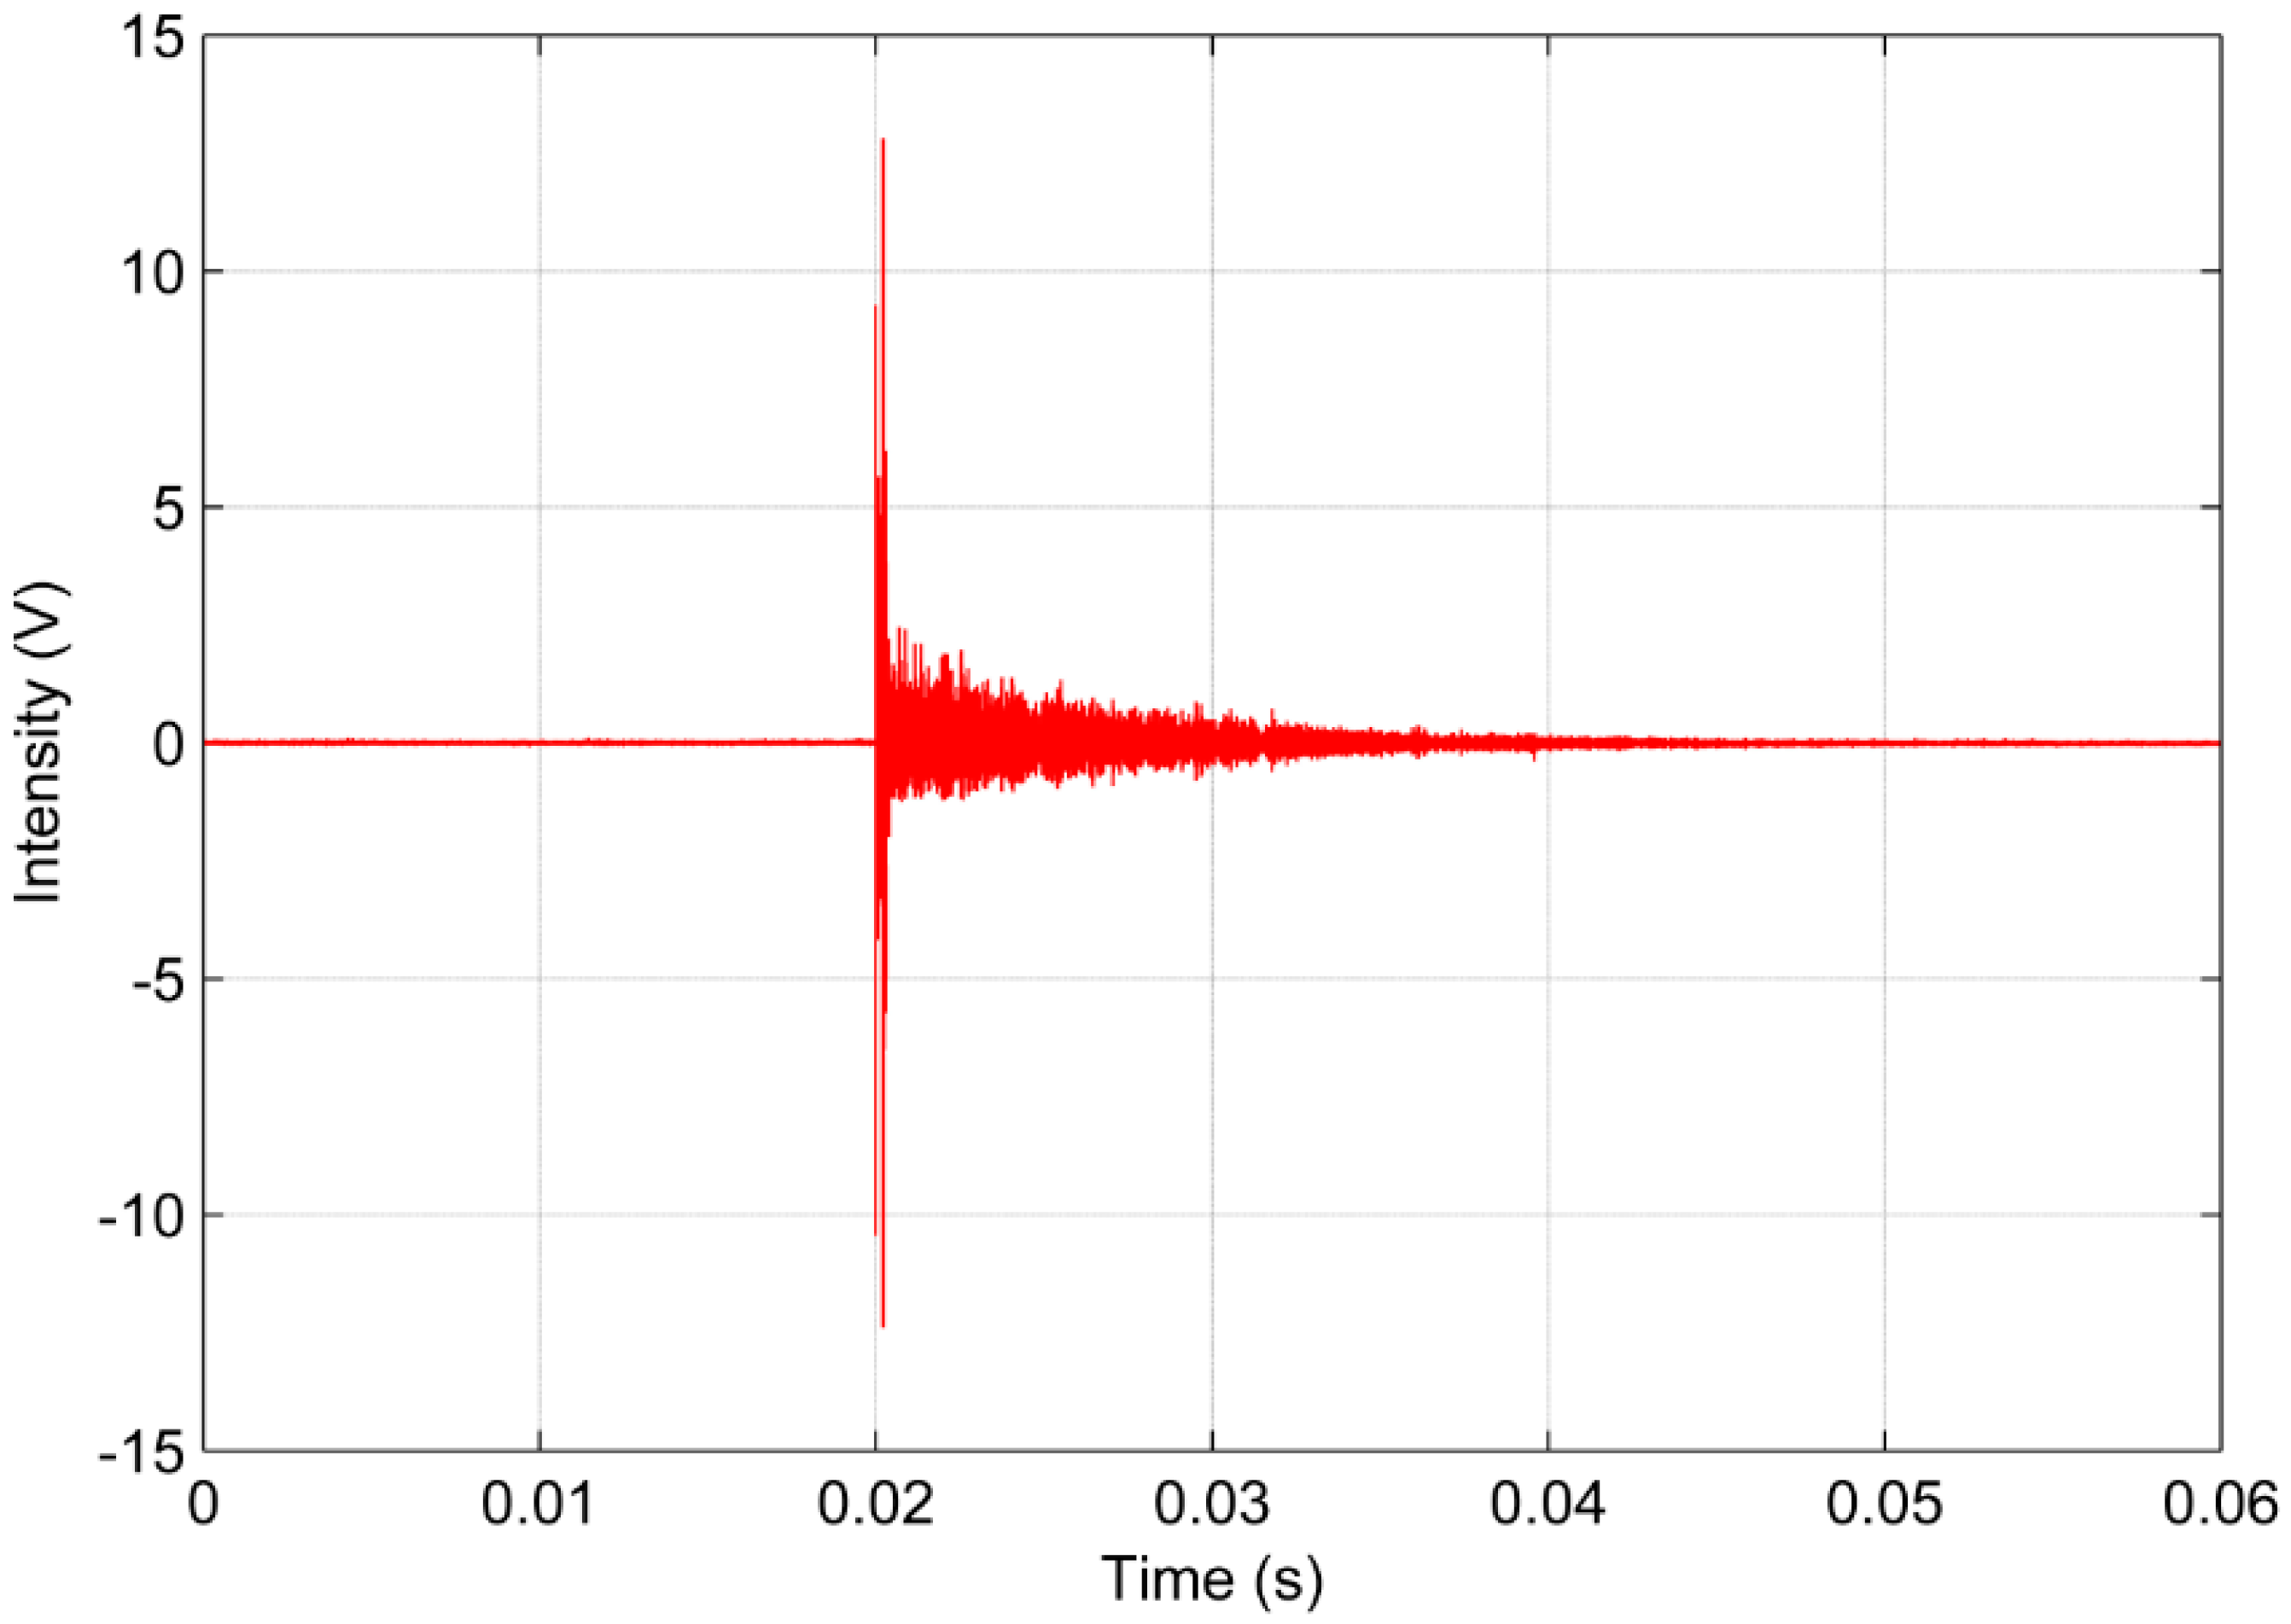
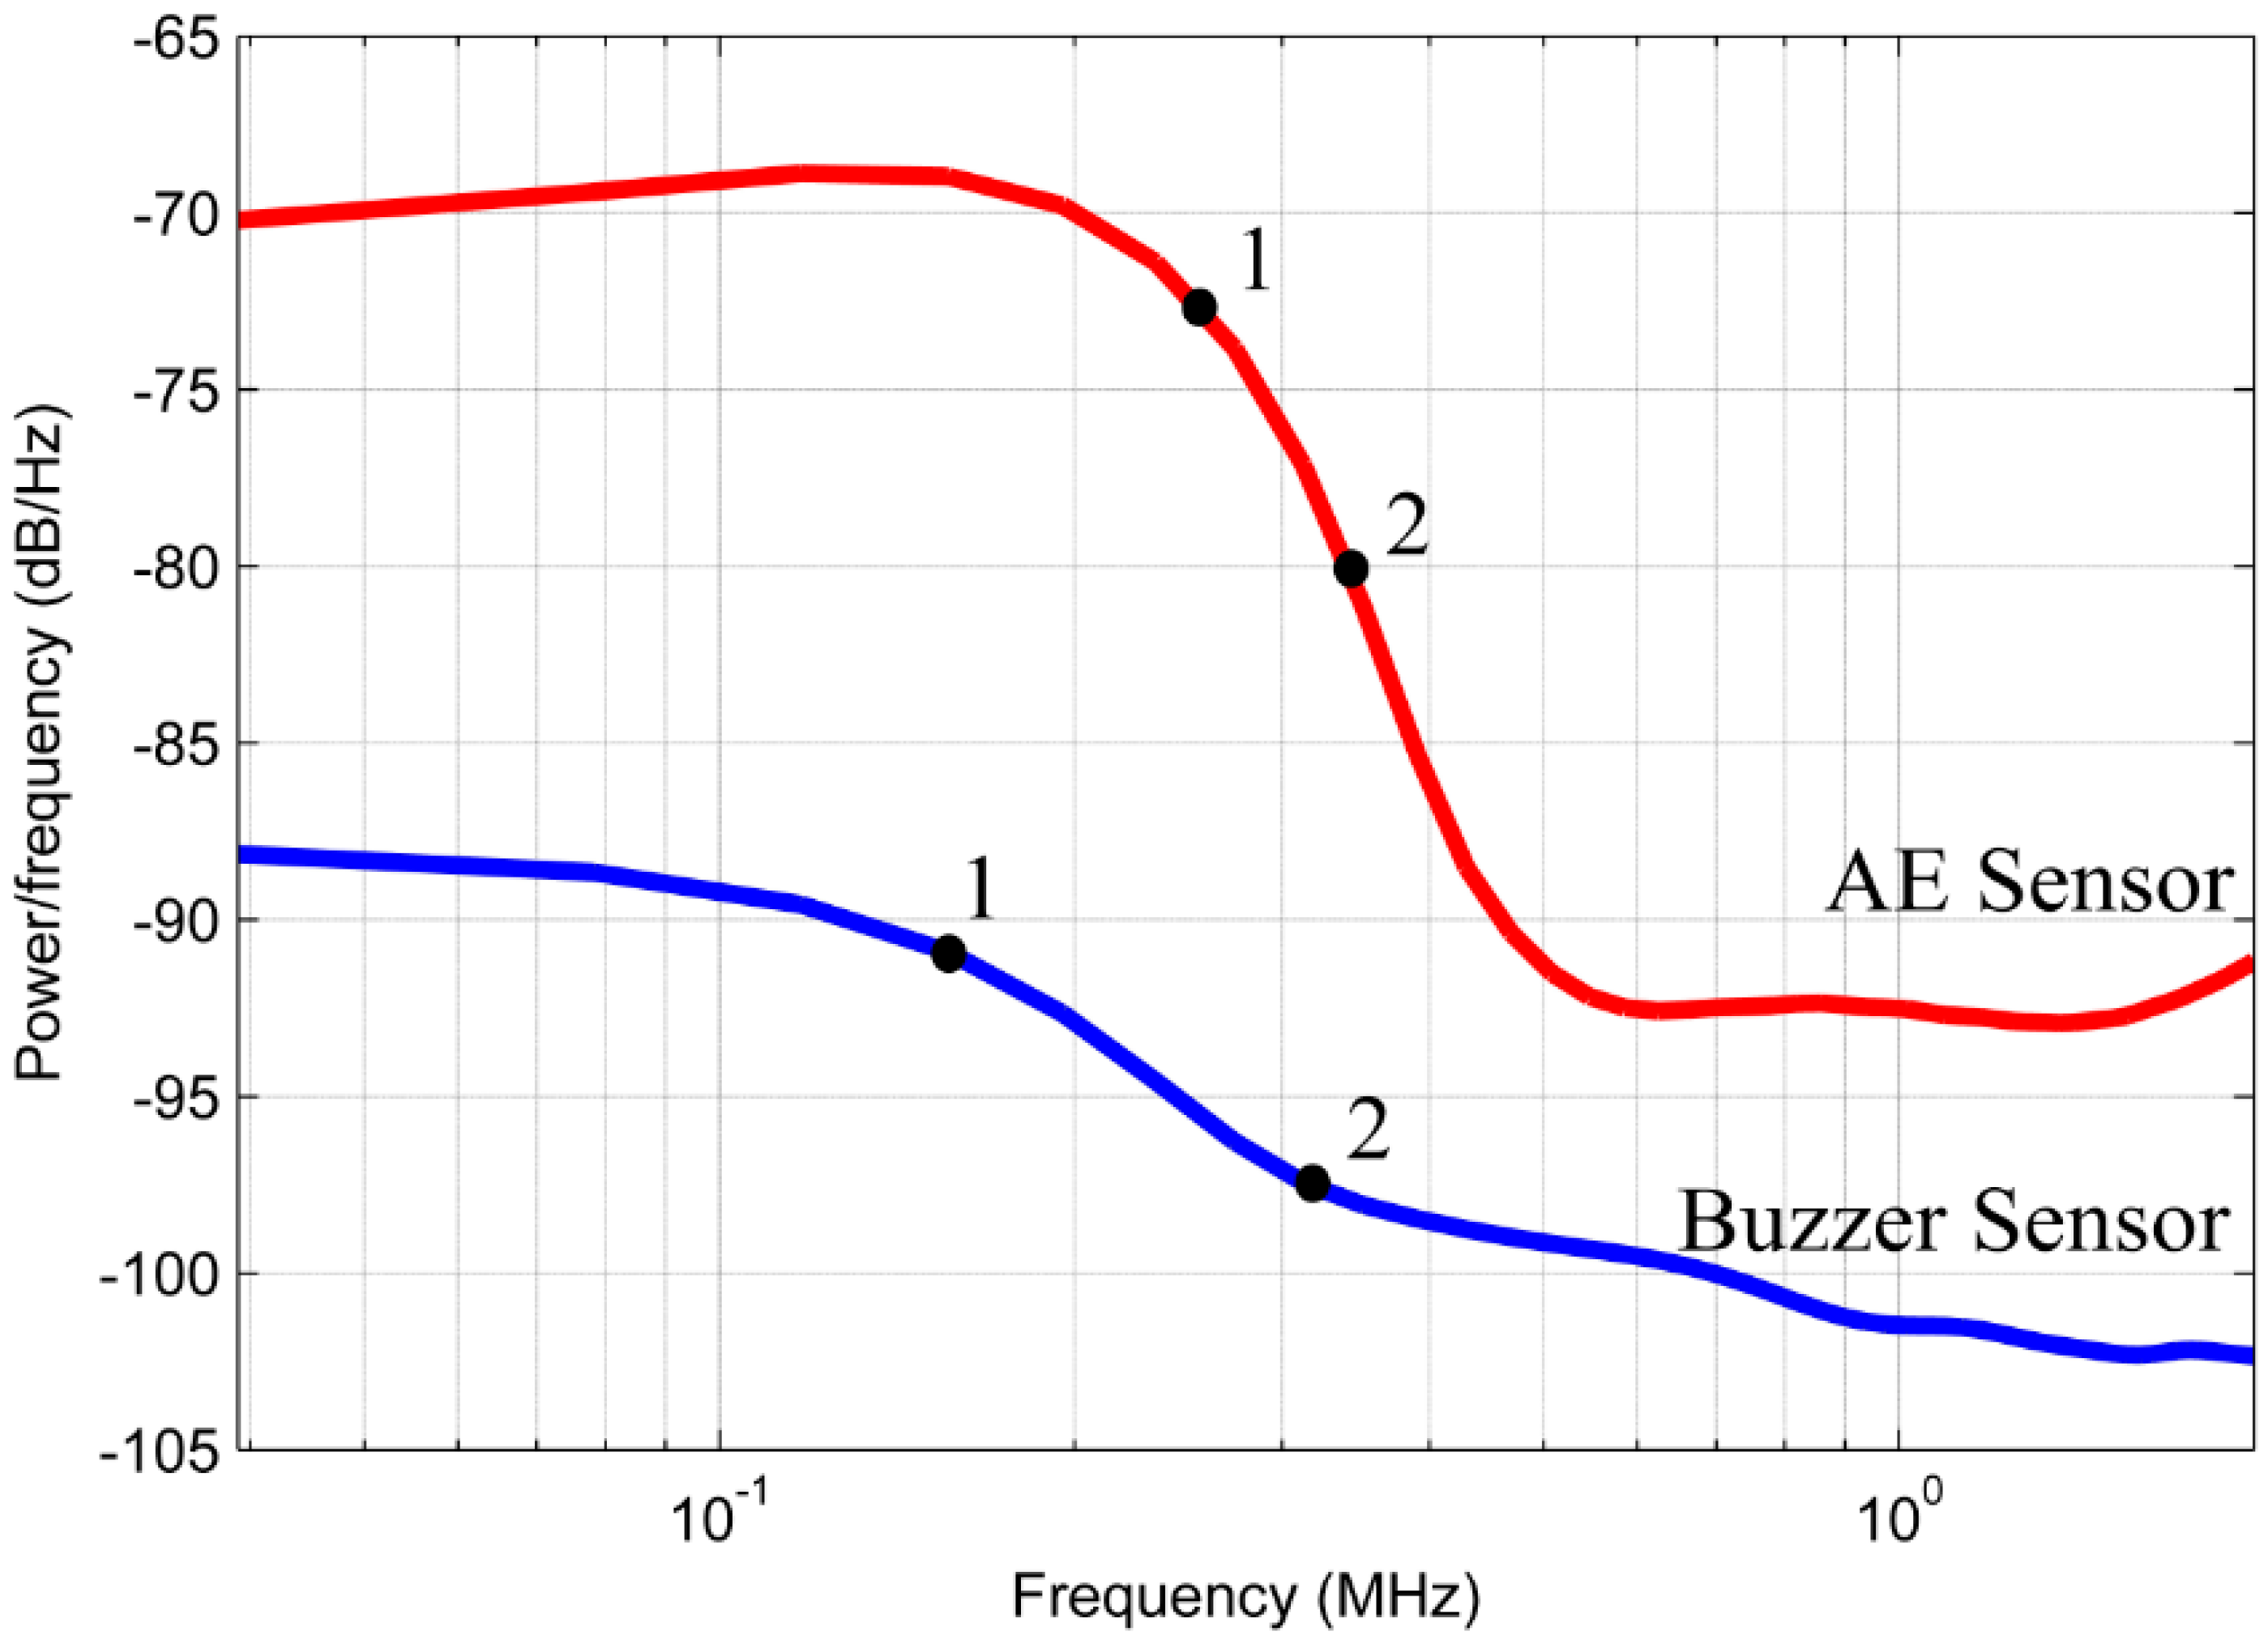
| Point | RMS Peak (Vrms) | Diaphragm Sensor Time (µs) | Conventional Sensor Time (µs) |
|---|---|---|---|
| 1 | 100% | 2.1 | 2.1 |
| 2 | 70.7% | 2.4 | 2.3 |
| 3 | 10% | 3.6 | 3.5 |
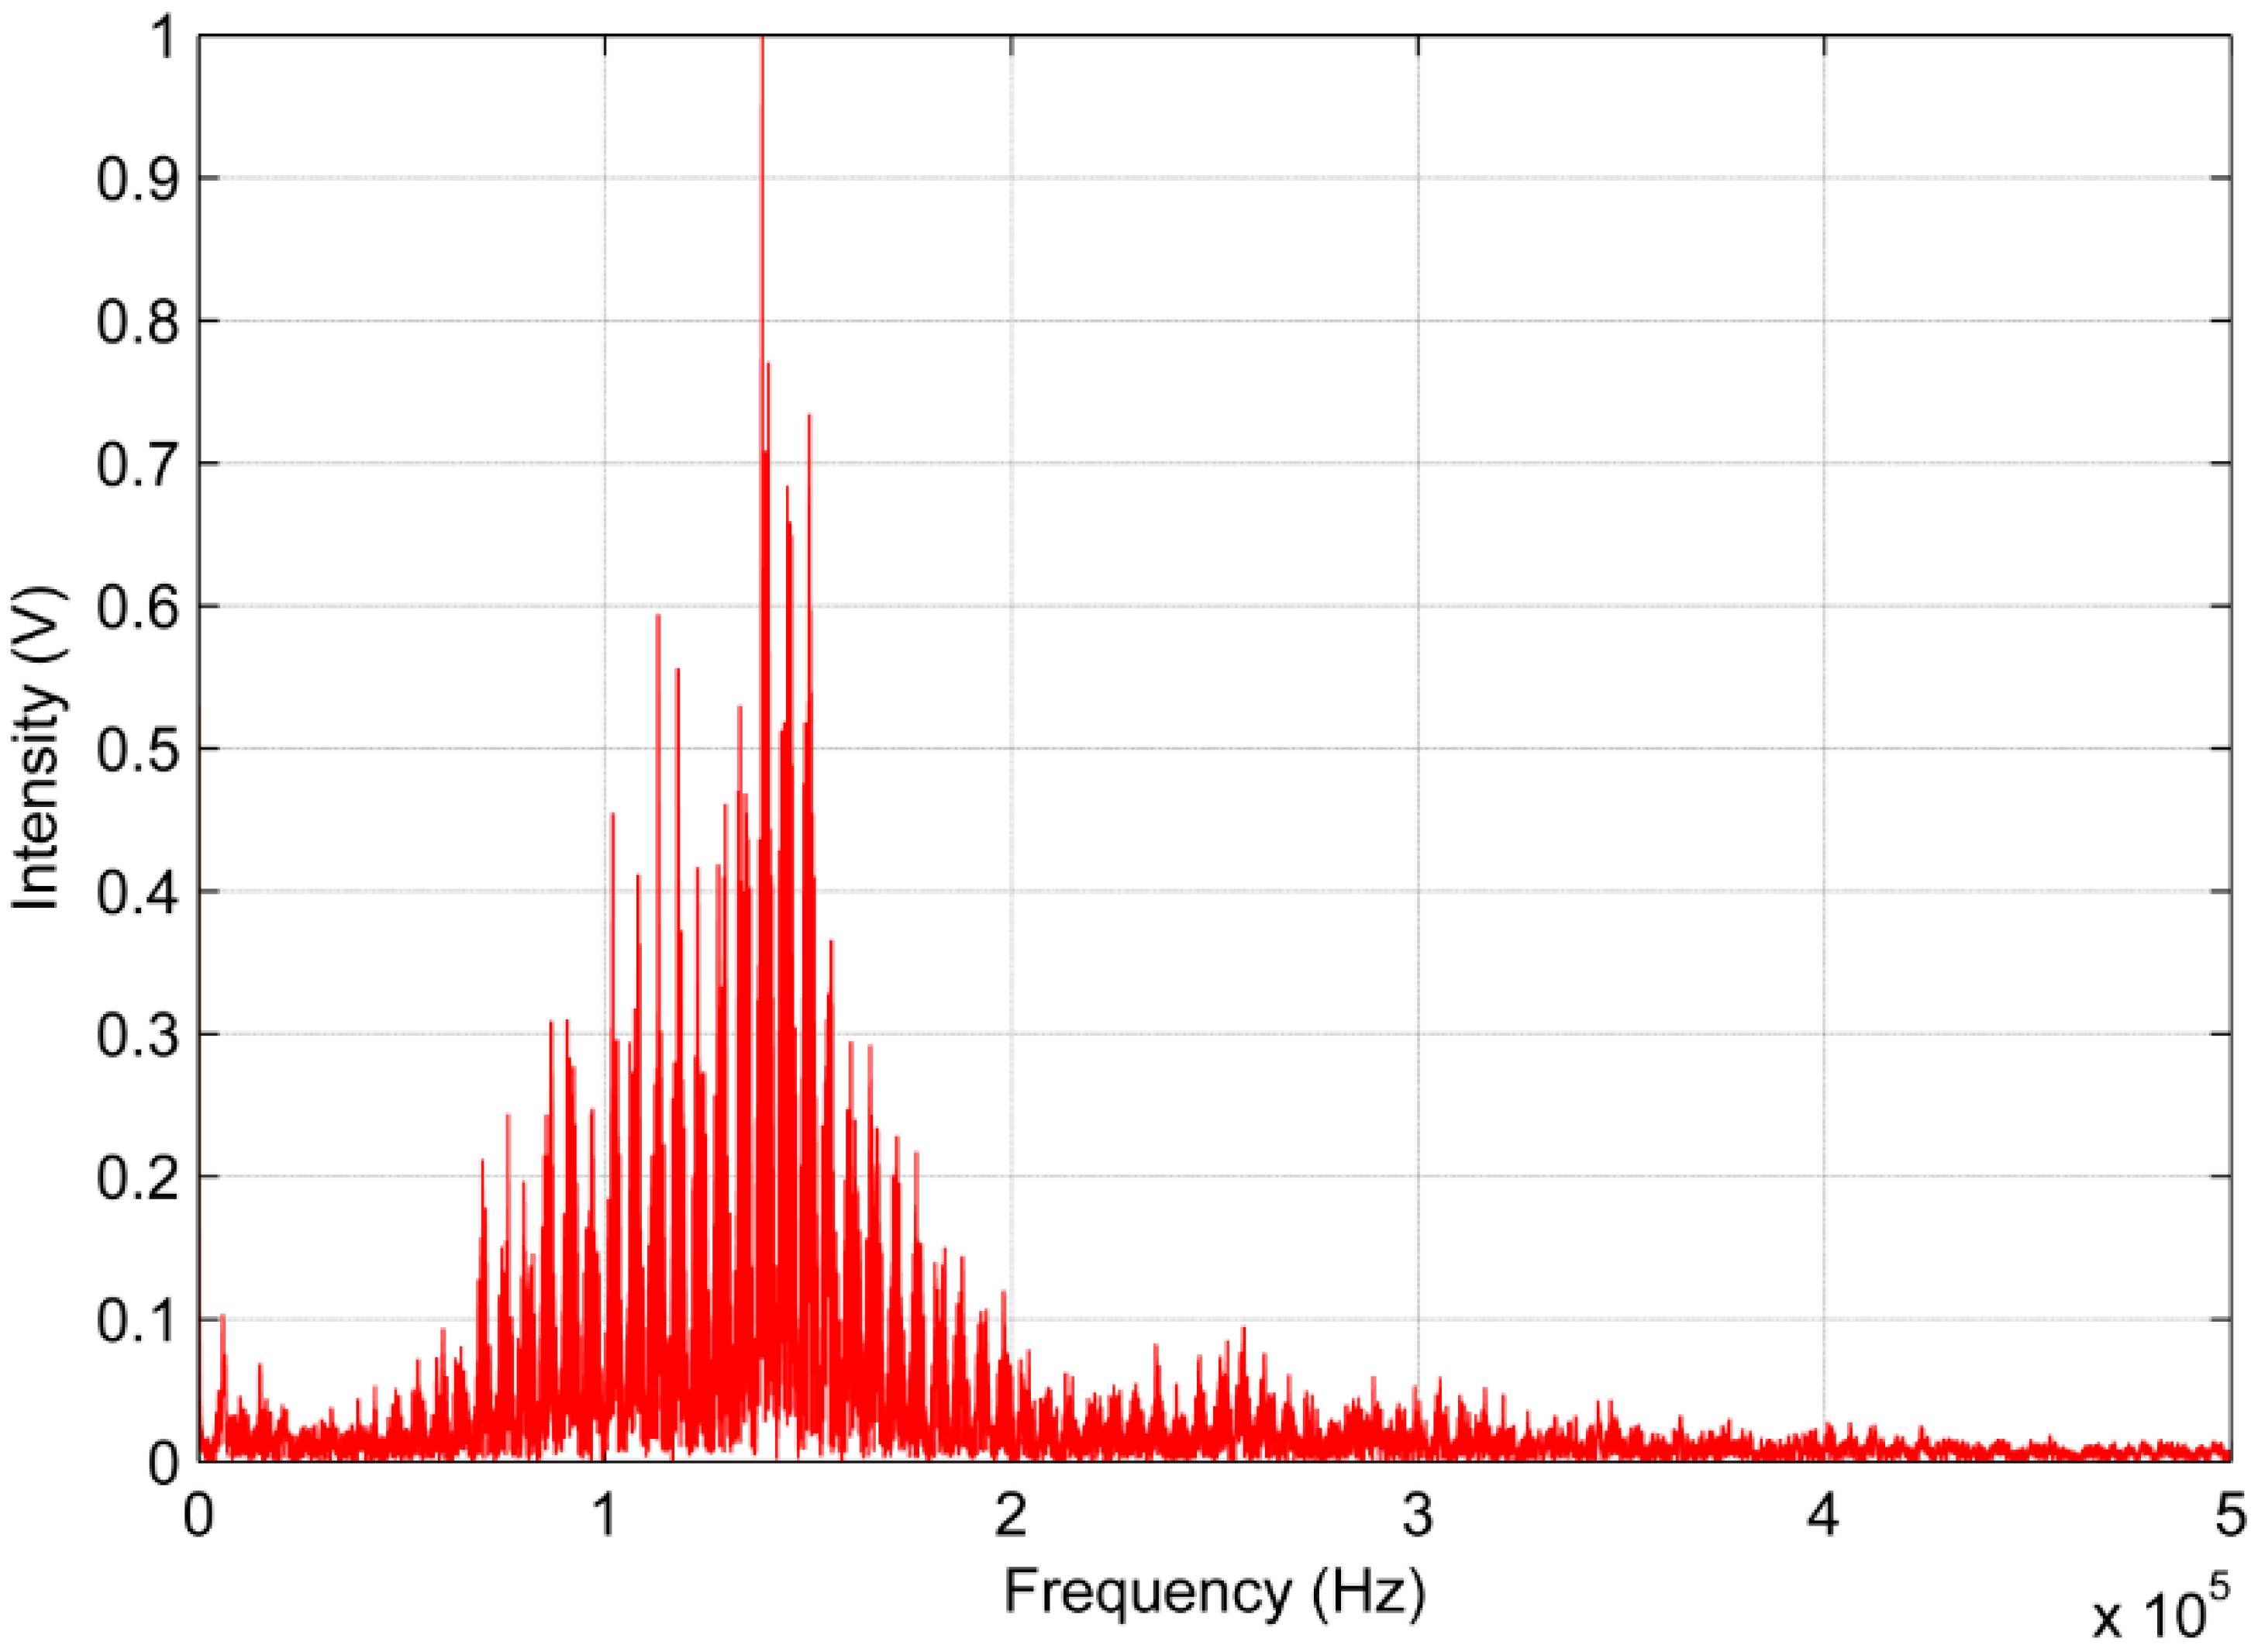
| Sensor | Point | Attenuation (dB) | PSD (dB/Hz) | Frequency (kHz) |
|---|---|---|---|---|
| Diaphragm | 1 | 3 | 91.5 | 160 |
| 2 | 10 | 98.15 | 310 | |
| Conventional | 1 | 3 | 73.21 | 260 |
| 2 | 10 | 80.21 | 340 |
© 2016 by the authors; licensee MDPI, Basel, Switzerland. This article is an open access article distributed under the terms and conditions of the Creative Commons Attribution (CC-BY) license (http://creativecommons.org/licenses/by/4.0/).
Share and Cite
Castro, B.; Clerice, G.; Ramos, C.; Andreoli, A.; Baptista, F.; Campos, F.; Ulson, J. Partial Discharge Monitoring in Power Transformers Using Low-Cost Piezoelectric Sensors. Sensors 2016, 16, 1266. https://doi.org/10.3390/s16081266
Castro B, Clerice G, Ramos C, Andreoli A, Baptista F, Campos F, Ulson J. Partial Discharge Monitoring in Power Transformers Using Low-Cost Piezoelectric Sensors. Sensors. 2016; 16(8):1266. https://doi.org/10.3390/s16081266
Chicago/Turabian StyleCastro, Bruno, Guilherme Clerice, Caio Ramos, André Andreoli, Fabricio Baptista, Fernando Campos, and José Ulson. 2016. "Partial Discharge Monitoring in Power Transformers Using Low-Cost Piezoelectric Sensors" Sensors 16, no. 8: 1266. https://doi.org/10.3390/s16081266
APA StyleCastro, B., Clerice, G., Ramos, C., Andreoli, A., Baptista, F., Campos, F., & Ulson, J. (2016). Partial Discharge Monitoring in Power Transformers Using Low-Cost Piezoelectric Sensors. Sensors, 16(8), 1266. https://doi.org/10.3390/s16081266