


Abstract
Citizen science has extended the spatial and temporal scope of biodiversity data, yet questions remain regarding how these data can elucidate ecological interaction networks. Plant–pollinator networks are a comprehensive framework for assessing community structure, specialization, and resilience, but they are sensitive to sampling methodology and network composition. Here, we analyzed ten years of citizen science observations to characterize plant–pollinator network structure across four major insect orders, including Hymenoptera, Lepidoptera, Diptera, and Coleoptera. Key network metrics, including connectance, nestedness, linkage density, interaction evenness, specialization (H2′), and modularity, were calculated to analyze network structure, including potential biases in the representation of specialist taxa (d′). To compare citizen science with standardized field observations, an Anthophila-only subset of the citizen science dataset was compared at the genus level with a traditionally sampled bee–flower network. Citizen science-based networks captured measurable specialization and connectance across four insect orders, exhibited significant spatial structure, and revealed that retained genera had significantly higher observed specialization than genera excluded by rare-taxon filtering, although the effect size was small. Within the Anthophila-only comparison, citizen science networks consistently exhibited higher linkage density and interaction evenness, whereas differences in connectance, nestedness, specialization, and modularity depended on whether complete, rarefied, or shared-genus networks were evaluated. These results indicate that inferred plant–pollinator network structure differed between sampling regimes and was sensitive to interaction count, taxonomic breadth, network dimensions, and spatial and temporal coverage. Citizen science captured broader spatial and taxonomic variation across a larger, temporally expansive dataset, whereas traditional sampling provided a more standardized snapshot of local bee–flower interaction structure.
1. Introduction
Pollinators play a fundamental role in the reproductive success of flowering plants, with an estimated 87.5% of species relying on animal pollination, making them indispensable for maintaining natural ecosystem productivity, plant diversity, and ecological function [1]. The diversity within pollinator communities not only supports more robust and stable plant–pollinator interactions but also contributes to ecosystem resilience by ensuring functional redundancy, where different species can fulfill similar roles under varying environmental conditions [2,3]. This is particularly important given that pollinator assemblages differ widely in their morphology, behavior, and ecological roles. Understanding these differences highlights why maintaining taxonomic and functional diversity among pollinators is essential for the long-term stability of plant–pollination networks. Pollinator diversity is also vital for ecosystem services, particularly in agricultural settings where a variety of pollinators can lead to improved crop yields and fruit quality; high pollinator richness is often associated with improved pollination efficiency and network stability [4,5]. Pollinator diversity varies across regions and land use types, and citizen science datasets offer a powerful means of capturing these patterns despite inherent observational noise [6,7], highlighting the need for approaches that move beyond species presence to examine how pollinators and plants interact within ecological communities.
Plant–pollinator networks provide a quantitative framework for examining how interactions between plants and pollinators are organized within ecological communities. Although these interactions may appear disorganized at first glance, they exhibit consistent, non-random structural patterning shaped by ecological and evolutionary processes [8]. Network-based analyses allow researchers to move beyond species lists by characterizing interaction structure, including the degree of specialization, connectivity, and compartmentalization within communities. As a result, network approaches have become essential tools for conservation planning and for understanding how ecological communities respond to environmental change [9,10].
Ecological monitoring has long relied on structured, researcher-led data collection to understand species distributions, ecosystem dynamics, and biodiversity trends. In documenting plant–pollinator networks, methods typically involve field surveys conducted by trained scientists using standardized protocols to ensure data accuracy and replicability. While these approaches have yielded critical insights, they are often constrained by limited geographic coverage, time, and funding [11]. In contrast, citizen science, defined as the participation of non-professionals in scientific research, has emerged as a transformative tool in ecology. Citizen science has the additional advantage of being publicly accessible within online platforms, potentially involving simultaneous expert input and reducing the time involved in resolving taxonomy within diverse communities.
By mobilizing the general public to collect and share data, citizen science projects expand the spatial and temporal scale of biodiversity monitoring [12]. Platforms like iNaturalist, eBird, and Bumble Bee Watch have made data collection more accessible to the public, significantly expanding the volume and scope of ecological research datasets. While concerns remain regarding data quality and taxonomic accuracy, many studies highlight that with appropriate design, training, and data validation, citizen science initiatives can produce valuable ecological data that complement traditional scientific efforts and contribute meaningfully to biodiversity monitoring and conservation [13,14].
Studies comparing citizen science and traditional sampling approaches suggest that these data sources often provide complementary, rather than identical, representations of insect communities. Turley et al. [15] compared iNaturalist bee records to a collection-based dataset and found that the collection-based methodology yielded over twice as much biodiversity. Additionally, the iNaturalist records showed strong biases towards large-bodied and non-native species [15]. Diaz-Calafat et al. [16] also investigated differences between academic and citizen science insect datasets. Researchers found that both datasets encompassed taxonomic, spatial, temporal, and environmental biases; however, these biases differed between data sources. Citizen science records were found to provide broader and less spatially clustered coverage than academic records, whereas academic records were more concentrated around protected areas and cities [16]. Other studies have investigated plant–insect interactions more directly. Viser et al. [17] compared bee–flower networks, one derived from citizen science records and one from academic surveys; these networks showed compositional differences, indicating they were not capturing the same interaction structure. The resulting interaction networks also had differing conservation recommendations as a result of different interactions being captured. This study suggests that bee–flower networks are sensitive to sampling methodology [17].
Collectively, these studies suggest that citizen science and traditional sampling approaches are likely to differ not only in the taxa they detect but also in the interactions and network structures they recover. Because iNaturalist observations are opportunistic and photo-based, we expected citizen science records to capture a broader spatial and temporal range of observations and to include more total plant and insect genera, particularly conspicuous and frequently photographed taxa. However, based on documented biases toward large-bodied and identifiable insects, we expected citizen science records to underrepresent small-bodied, cryptic, or specialist bee taxa relative to traditional field sampling. Because plant–pollinator networks are sensitive to sampling effort and missing interactions, we further expected citizen science and traditional sampling datasets to differ in network structure, including metrics related to interaction richness, specialization, nestedness, and modularity.
Together, previous studies suggest that citizen science datasets can provide valuable information on insect diversity and plant–pollinator interactions, but that these records may also reflect methodological biases associated with opportunistic sampling, observer behavior, taxonomic detectability, and uneven spatial coverage. Because plant–pollinator networks depend not only on which taxa are observed but also on which interactions are recorded, these biases may influence estimates of network structure and ecological specialization. The citizen science dataset, therefore, was used to ask whether opportunistic observations captured broad plant–pollinator interaction patterns across multiple insect orders, while also evaluating potential sources of bias within the dataset. Specifically, specialization was examined because specialist taxa and specialized interactions may be less frequently represented in citizen science records if they are rare, seasonally restricted, host-specific, or less likely to be photographed and identified. Spatial structure was also examined because citizen science observations may cluster around accessible or frequently visited locations, potentially influencing patterns of taxonomic representation across the landscape. Finally, citizen science-derived and traditionally sampled bee–flower networks were compared to determine whether differences in sampling methodology influenced observed richness, interaction overlap, and network-level metrics.
Based on these expectations, we tested four hypotheses. H1: Each order-specific network would exhibit non-random interaction structure, while raw network architecture was expected to vary descriptively among orders. H2: Genera excluded by the minimum-observation filter would exhibit greater specialization than retained genera, indicating that rare-taxon filtering may disproportionately remove specialist interactions. H3: The proportional representation of insect orders would differ among spatial grid cells across the study region, reflecting spatial structuring in citizen science observations. H4: The citizen science and traditionally sampled Anthophila networks would differ in taxonomic richness, interaction composition, and network architecture, with citizen science expected to recover broader taxonomic and interaction coverage because of its greater spatial and temporal extent. Because the two datasets differed in geographic and temporal scope, this final comparison was interpreted as a contrast between sampling regimes rather than as an isolated test of sampling methodology alone.
2. Materials and Methods
This study combined citizen science observations and standardized field data to construct and compare plant–pollinator interaction networks. The citizen science records were acquired from iNaturalist and represented observations made at Lubbock Lake Landmark from 2014 to 2023. The dataset was downloaded 11 January 2024. Observations were classified by iNaturalist as either Research Grade or Needs ID at the time of the download; records involving insects photographed on plants were subsequently selected for analysis. Associated flowering plants were identified by the dataset curator using Research Grade plant observations from Lubbock Lake Landmark as a reference. Insect identifications were retained from the original iNaturalist observations and were not independently reviewed by the dataset curator. Each record included taxonomic identifications for the insect and associated flowering plant, as well as date, time, geographic coordinates, identification status, and a link to the original iNaturalist observation. Records were filtered to only include Coleoptera, Diptera, Hymenoptera, and Lepidoptera. Duplicate records of the same observed specimen were removed. Taxonomic identifications were standardized to genus before network construction. The final dataset contained 1936 independent interaction records encompassing 63 flowering plant species and 247 insect taxa prior to genus-level standardization. At the time of download, 889 of the 1936 retained interaction records (45.9%) were classified by iNaturalist as Research Grade, whereas 1047 records (54.1%) were classified as Needs ID. The proportion of Research Grade observations differed among insect orders, ranging from 26.3% in Hymenoptera to 82.6% in Lepidoptera. Records lacking an insect identification at the genus level were excluded before network construction.
Interaction records were reformatted into plant–pollinator pairs and aggregated into quantitative bipartite interaction matrices. In these matrices, rows represented plant genera, columns represented insect genera, and cell values reflected interaction frequency. Separate matrices were constructed for Coleoptera, Diptera, Hymenoptera, and Lepidoptera. Network analyses were conducted in R version 4.3.3 using the bipartite package version 2.20. Weighted nestedness, quantified using weighted NODF (Nestedness metric based on Overlap and Decreasing Fill), linkage density, interaction evenness, and network-level specialization (H2′) were calculated using networklevel(). The same weighted NODF implementation and scale were used for all order-specific and Anthophila networks. Connectance was calculated as the proportion of possible plant–insect links that were realized. Modularity was estimated using the weighted bipartite label-propagation algorithm implemented in DIRT_LPA_wb_plus(), with 10 repetitions for each matrix.
Fixed-margin null models were generated separately for each insect order to determine whether the observed metrics differed from expectations based on network dimensions and marginal interaction frequencies. For each observed matrix, 999 randomized matrices were calculated using Patefield’s algorithm through stats::r2dtable(), preserving the observed row and column totals. All six network metrics were recalculated for each randomized matrix. We calculated standardized effect size by comparing each observed value with the mean and standard deviation of the corresponding null distribution; positive values indicated metrics above null expectations, whereas negative values indicated metrics below null expectations. Two-sided empirical probabilities were then calculated using a plus-one correction and adjusted across the six metrics within each order using the Benjamini–Hochberg false discovery rate procedure. With 999 randomizations, the minimum two-sided empirical probability was 0.002.
To evaluate the sensitivity of the order-specific results to iNaturalist identification status, the analyses were repeated using only observations classified as Research Grade at the time of download. Research-Grade-only interaction matrices were constructed separately for Coleoptera, Diptera, Hymenoptera, and Lepidoptera. The six network metrics were recalculated for each matrix, and each Research-Grade-only network was compared with 999 fixed-margin null matrices generated using Patefield’s algorithm. Standardized effect sizes, two-sided empirical probabilities with a plus-one correction, and Benjamini–Hochberg-adjusted probabilities were calculated using the same procedures applied to the complete order-specific networks. Because restricting the dataset to Research Grade observations also reduced interaction totals, taxonomic richness, and matrix dimensions, this analysis was interpreted as a sensitivity analysis rather than as an isolated test of identification accuracy.
To assess for potential sources of bias and internal structure within the citizen science dataset, analyses were conducted to evaluate both taxonomic representation and spatial patterning. Genus-level specialization values () were calculated from the full plant genus × insect genus citizen science network. Insect genera were classified according to whether they were retained by the minimum-observation filter, defined by having at least three observations, or excluded by the filter due to having fewer than three observations. Continuous values were compared between retained and excluded genera using a two-sided Wilcoxon rank-sum test. Effect size was calculated to evaluate the significance of the difference between groups. Spatial variation in insect order composition was evaluated by dividing the geographic extent of the citizen science observations into a 10 × 10 latitude–longitude grid. All 1936 retained interaction records contained the complete taxonomic and spatial information required for the genus-level spatial analysis. Each observation was assigned to a grid cell, and a contingency table was constructed using grid cell as the spatial category and insect order as the taxonomic category. Empty grid cells were excluded from the analysis. To determine whether the proportional representation of Coleoptera, Diptera, Hymenoptera, and Lepidoptera differed among the occupied grid cells, a Monte Carlo chi-squared test with 9999 simulations was used. Cramer’s was calculated to describe the strength of the spatial association. To evaluate sensitivity to grid cell size, the analysis was repeated using 5 × 5 and 20 × 20 grids. Continuous spatial density surfaces were generated solely for visualization and were not used to define the categorical units included in the chi-squared tests.
To better evaluate plant–pollinator networks developed from citizen science data, standardized field observations and sampling were conducted during the summer of 2024 at Lubbock Lake Landmark (LLL) conservation area (Lubbock, TX, USA), focusing on Anthophila species. Within LLL, five 50 m × 50 m plots were delineated for plant–pollinator observations and sampling. Within each plot, observers and samplers randomly selected flowering plants and conducted observations for two minutes. The dataset represented 1181 min of recorded observation effort. Foraging bees were collected using hand nets where necessary for identification purposes and preserved. Insects identifiable in situ (e.g., honey bees and bumble bees) were only counted, not collected or preserved. Because these taxa followed different detection and identification pathways, the traditional dataset may also be biased toward large, conspicuous bees and should not be treated as a bias-free reference.
Collected bee specimens were identified to genus, and plant genus identifications were confirmed in the laboratory. All citizen science and traditional bee and plant records were standardized to the genus level prior to analysis. Records lacking an identified plant or bee genus were removed. Repeated bee–plant combinations were retained because their frequencies represented the number of recorded interactions. Following filtering, the traditional dataset contained 270 interaction records representing 25 bee genera and 21 flowering plant genera. A corresponding Anthophila subset of the 2014–2023 citizen science dataset contained 657 interaction records representing 34 bee genera and 47 flowering plant genera. Quantitative interaction matrices were constructed for each dataset, with plant genera represented as rows, bee genera as columns, and cell values representing observed interaction frequencies. The citizen science and traditional datasets were not matched in spatial or temporal extent: citizen science records spanned ten years and were distributed across a broader portion of Lubbock Lake Landmark, whereas traditional sampling was restricted to five plots within the same conservation area during a single summer. Consequently, the comparison represents two distinct sampling regimes and cannot isolate the effect of sampling methodology from ecological variation among locations, seasons, and years.
Network analyses were conducted in R version 4.3.3 using the bipartite package version 2.20. Weighted nestedness based on weighted NODF, linkage density, interaction evenness, and network-level specialization () were calculated using the networklevel() function. Connectance was calculated as the proportion of possible plant–bee links that were realized. Modularity was estimated using the weighted bipartite label-propagation algorithm implemented in DIRT_LPA_wb_plus(), with 10 repetitions performed for each interaction matrix. Because the complete citizen science and traditional datasets differed substantially in taxonomic richness, spatial extent, and temporal coverage, their complete-network metrics were interpreted as descriptive summaries of the network structure recovered by each sampling regime rather than as a fully controlled comparison of sampling methodology. To evaluate the influence of unequal numbers of interaction records, the citizen science dataset was rarefied to the 270 interactions contained in the traditional dataset. Citizen science observations were randomly sampled without replacement, and network metrics were recalculated for 4999 rarefied networks. Modularity was calculated for 999 rarefied networks because of its greater computational requirements. This procedure standardized interaction record totals but did not assume that taxonomic richness or matrix dimensions were equalized. Observed traditional network values were compared with the rarefied citizen science distribution for each metric using two-sided empirical probabilities with a plus one correction. Resulting probabilities were adjusted across the six network metrics using the Benjamini–Hochberg false discovery rate procedure. Because empirical probabilities were estimated from finite resampling distributions, the minimum attainable two-sided -value was 0.0004 for metrics based on 4999 rarefactions and 0.002 for modularity based on 999 rarefactions.
As an additional sensitivity analysis, both datasets were restricted to plant genera and bee genera recorded by both sampling approaches. This produced dimension-matched matrices containing the same 17 plant genera and 20 bee genera. The shared-genus citizen science and traditional networks contained 353 and 242 interaction records, respectively. Network metrics were recalculated for these matrices to determine whether structural differences remained when node identities and matrix dimensions were held constant. Because the datasets still differed in interaction totals, spatial coverage, and temporal coverage, this analysis was interpreted as a taxonomically controlled sensitivity analysis rather than as an experimental test of sampling method alone.
Finally, fixed-margin null models were used to evaluate whether observed network structures differed from random expectations while accounting for each network’s interaction frequency distribution. For the complete and shared-genus networks, 999 randomized matrices were generated using Patefield’s algorithm through r2dtable(), which preserved the row and column marginal totals of each observed matrix. All network metrics were recalculated for each randomized matrix. Standardized effect sizes were then calculated by comparing each observed metric with the mean and standard deviation of its corresponding null distribution. Positive standardized effect sizes indicated values greater than expected under the fixed-margin null model, whereas negative values indicated values lower than expected. Two-sided empirical probabilities were calculated using a plus-one correction and adjusted across metrics using the Benjamini–Hochberg false discovery rate procedure.
3. Results
3.1. Order-Specific Differences in Citizen Science Plant–Pollinator Networks
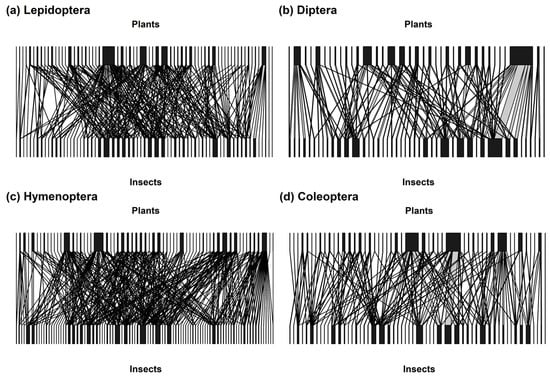
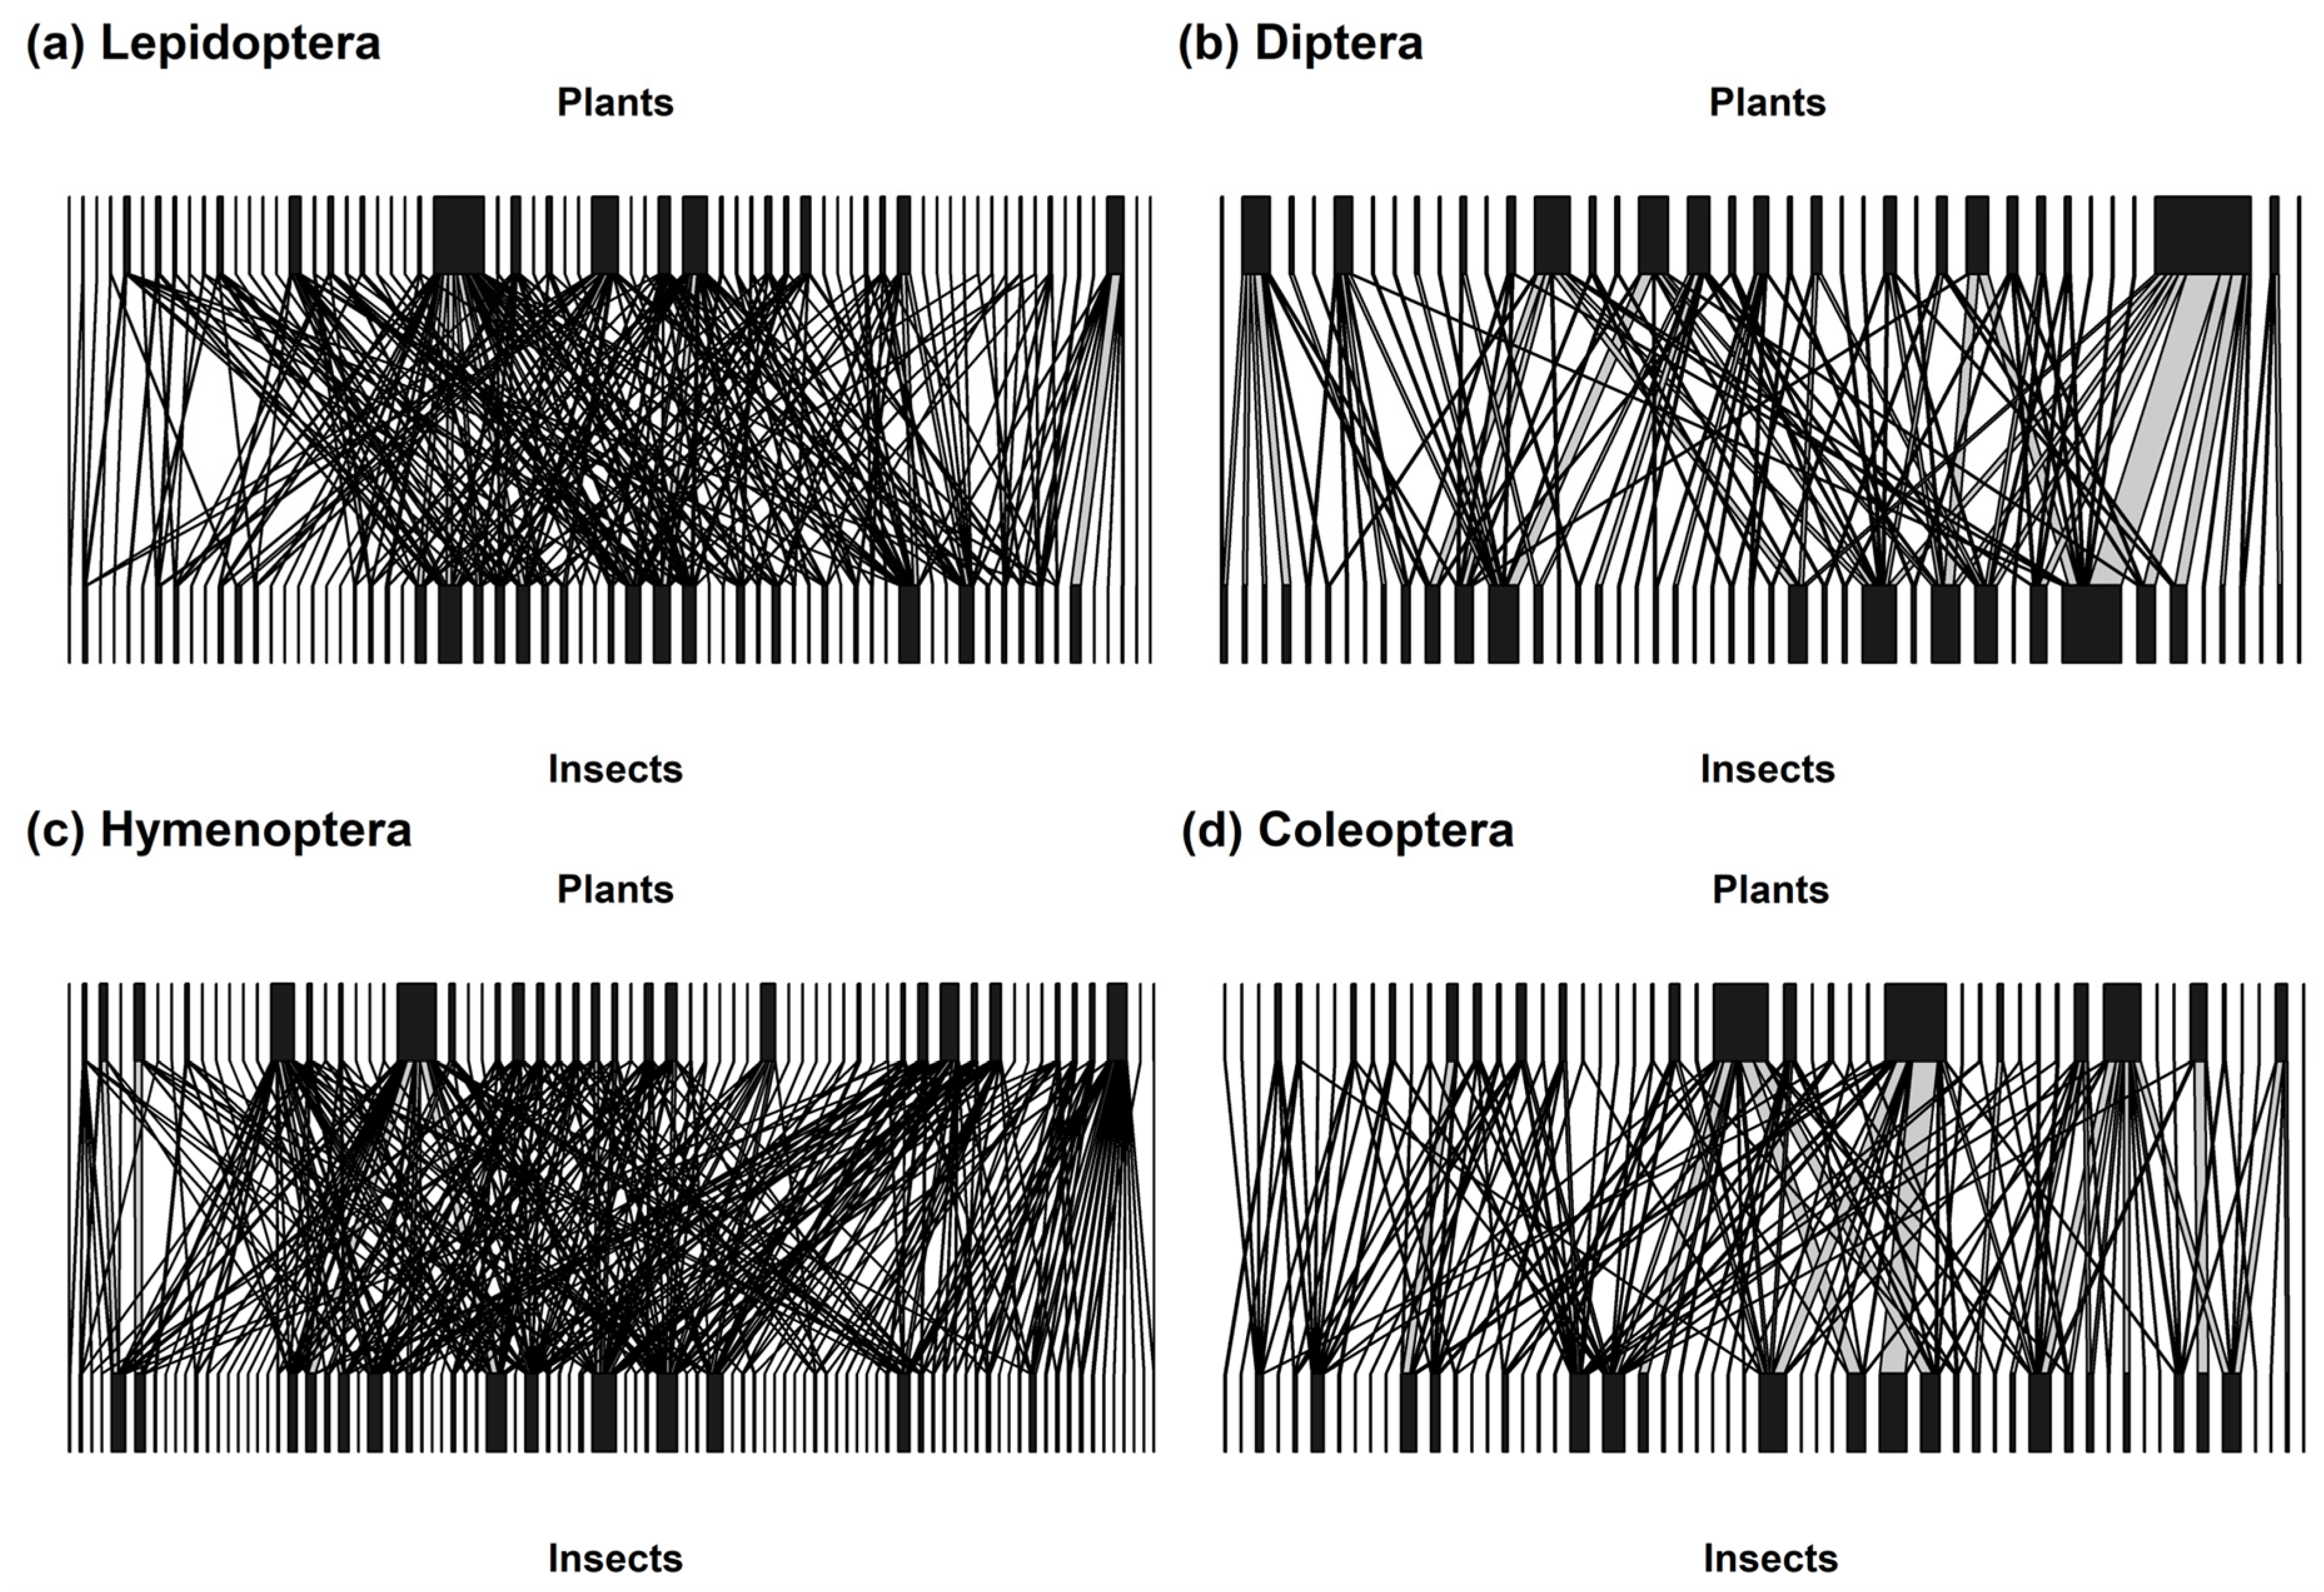
Community-level network structure varied among insect orders, with differences evident in connectivity, interaction distribution, specialization, and modularity (Table 1; Figure 1). Connectance was relatively similar across orders, ranging from 0.071 in Coleoptera to 0.081 in Diptera. Weighted NODF was highest in Hymenoptera (11.804) and lowest in Diptera (6.339), whereas linkage density was greatest in Hymenoptera (8.117) and Lepidoptera (8.101) and lower in Coleoptera (5.365) and Diptera (4.730). Interaction evenness was highest in Lepidoptera (0.637), network-level specialization () was highest in Coleoptera (0.484) and lowest in Lepidoptera (0.342), and modularity was highest in Coleoptera (0.578) and lowest in Lepidoptera (0.448).
Table 1.
Summary of community-level network metrics for plant–pollinator interactions recorded via citizen science data from 2014–2023, separated by insect order. Observed values are followed by standardized effect sizes in parentheses. All departures from fixed-margin null expectations remained significant after Benjamini–Hochberg correction (pFDR = 0.002).
Figure 1.
Plant–pollinator networks generated from citizen science observations (2014–2023) for four insect orders: (a) Lepidoptera; (b) Diptera; (c) Hymenoptera; and (d) Coleoptera. Each bipartite graph illustrates the frequency and specificity of interactions between flowering plant genera in the top layer and insect genera in the bottom layer. Thicker lines represent more frequently recorded interactions.
Fixed-margin null models indicated that all four order-specific networks differed strongly from random expectations based on their observed marginal interaction totals. Across all orders, observed connectance, weighted NODF, linkage density, and interaction evenness were lower than their corresponding null expectations, whereas and modularity were higher than expected. All departures remained significant following Benjamini–Hochberg correction (, the minimum attainable two-sided empirical probability with 999 randomized matrices). Standardized effect sizes and observed metric values are reported in Table 1.
Identification status varied substantially among insect orders. Of the 1936 retained interaction records, 889 were classified as Research Grade and 1047 as Needs ID at the time of download. Research Grade observations accounted for 51.4% of Coleoptera records, 34.5% of Diptera records, 26.3% of Hymenoptera records, and 82.6% of Lepidoptera records. Restricting the analysis to Research Grade observations reduced interaction totals, taxonomic richness, and realized link richness, particularly for Diptera and Hymenoptera. Nevertheless, all four Research-Grade-only networks exhibited the same direction of departure from fixed-margin null expectations as the complete networks. Connectance, weighted NODF, linkage density, and interaction evenness remained below null expectations, whereas network-level specialization and modularity remained above expectations. All departures remained significant following false discovery rate correction (FDR-adjusted p ≤ 0.006; Table A1 and Table A2).
3.2. Sensitivity of Genus-Level Specialization to Rare-Taxon Filtering
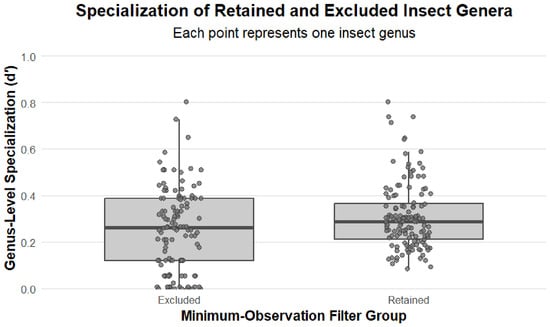
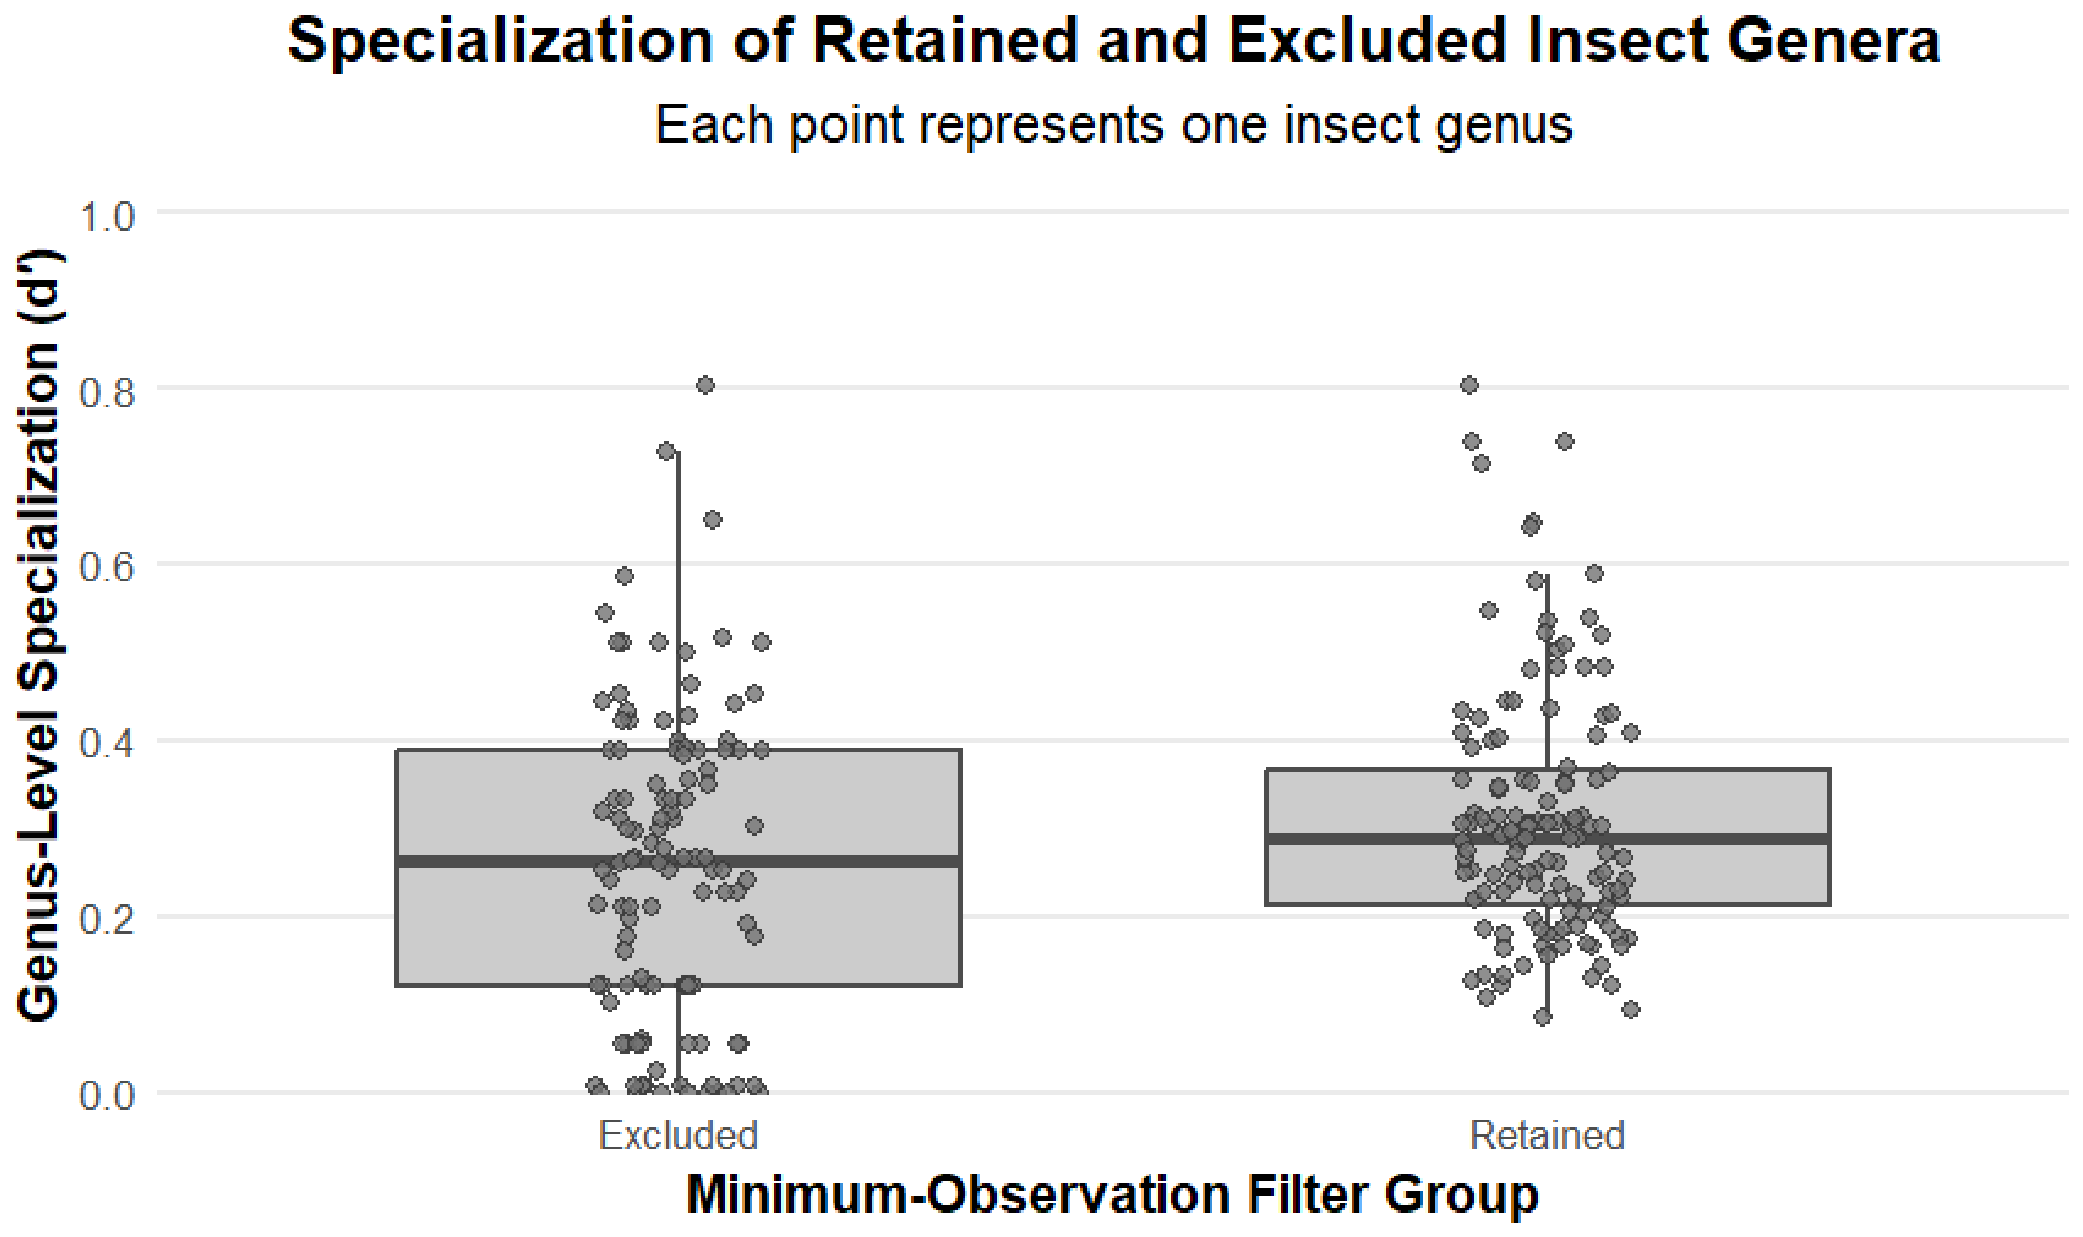
Genus-level specialization differed between insect genera retained and excluded by the minimum-observation filter (Figure 2). Genera excluded because they had fewer than three observations had a median d′ of 0.263 (n = 116), whereas retained genera had a median d′ of 0.289 (n = 131). Retained genera exhibited significantly higher observed specialization than excluded genera (Wilcoxon rank-sum test, W = 6348, p = 0.0258), although the effect size was small (r = 0.142). Thus, filtering altered the distribution of observed specialization, but not in the predicted direction: genera removed by the filter generally exhibited lower, rather than higher, specialization values.
Figure 2.
Genus-level specialization values for insect genera retained and excluded by the minimum observation filter. Each point represents one insect genus, and boxplots summarize the distribution of values for genera excluded because they had fewer than three observations () and genera retained because they had at least three observations (). Retained genera exhibited significantly higher values than excluded genera, although the effect size was small.
3.3. Spatial Structure of Citizen Science Observations
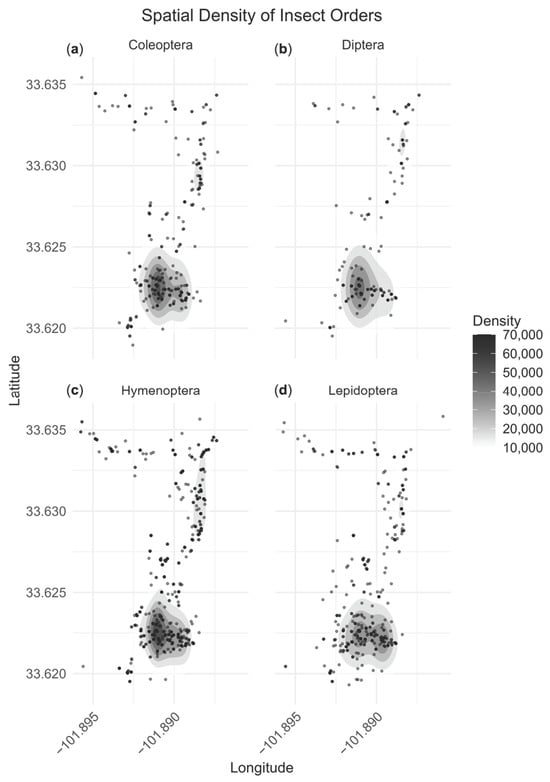
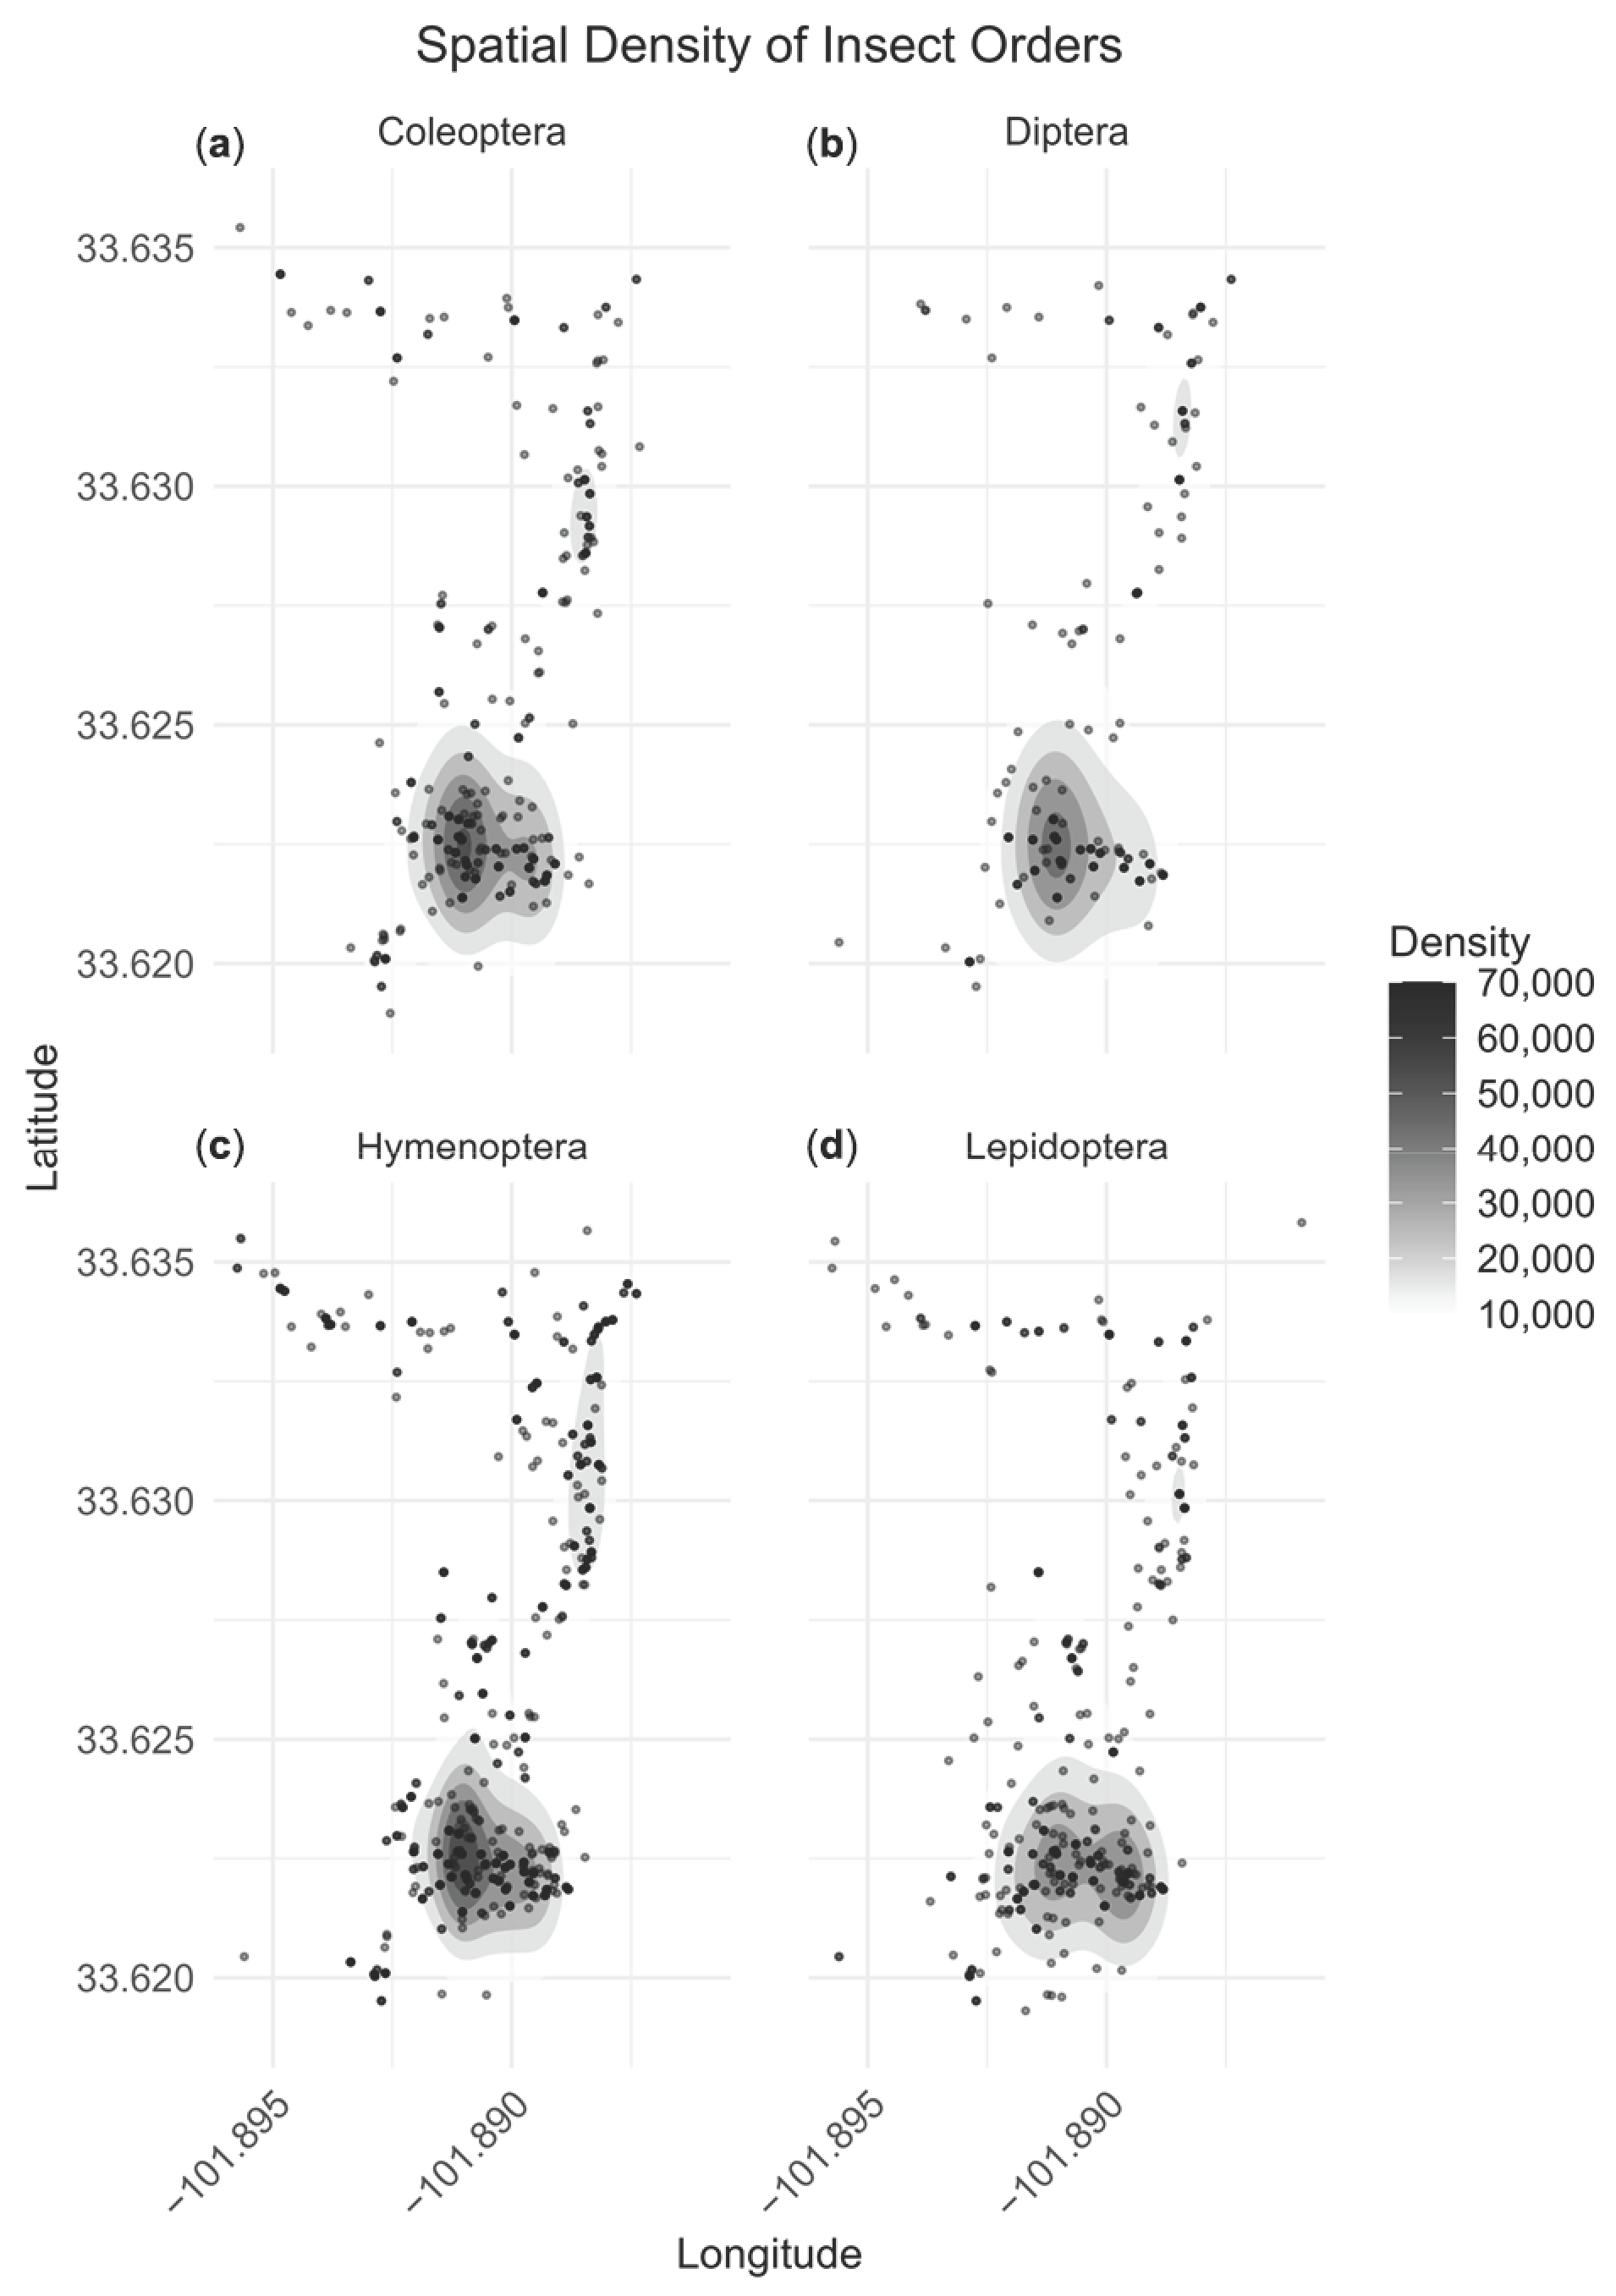
The proportional representation of insect orders differed significantly among the 56 occupied cells of the 10 × 10 spatial grid (Monte Carlo , , Cramer’s ). The conclusion was robust to grid cell size, with significant spatial associations also detected using the 5 × 5 grid (, , Cramer’s ) and the 20 × 20 grid (, , Cramer’s ). Although statistical evidence for spatial structure was consistent across resolutions, the estimated strength of association increased as grid cells became smaller. Spatial density maps illustrate the geographic clustering of observations by insect order (Figure 3).
Figure 3.
Spatial density maps of insect orders recorded through citizen science from 2014–2023: (a) Coleoptera; (b) Diptera; (c) Hymenoptera; and (d) Lepidoptera. Density surfaces illustrate the geographic clustering of 1936 observations with complete taxonomic and spatial information. These continuous surfaces were used for visualization and were separate from the discrete latitude–longitude grid cells used in the Monte Carlo chi-squared analyses.
3.4. Comparison of Citizen Science and Traditional Sampling Networks
The complete citizen science and traditional sampling networks differed substantially in interaction count, taxonomic richness, and network dimensions. The citizen science network contained 657 interaction records representing 47 plant genera, 34 bee genera, and 204 realized bee–plant links, whereas the traditional network contained 270 interaction records representing 21 plant genera, 25 bee genera, and 72 realized links. Each network was, therefore, assessed separately against 999 fixed-margin null matrices generated using Patefield’s algorithm, preserving the total interaction frequencies of each plant and bee genus. Standardized effect sizes showed the same general pattern in both networks: observed connectance, weighted NODF, linkage density, and interaction evenness were lower than their respective null expectations, whereas network-level specialization and modularity were higher than expected.
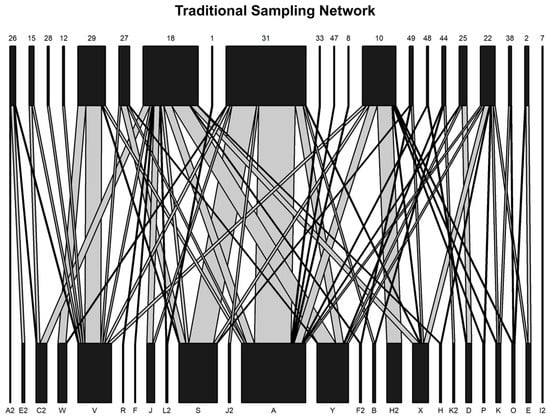
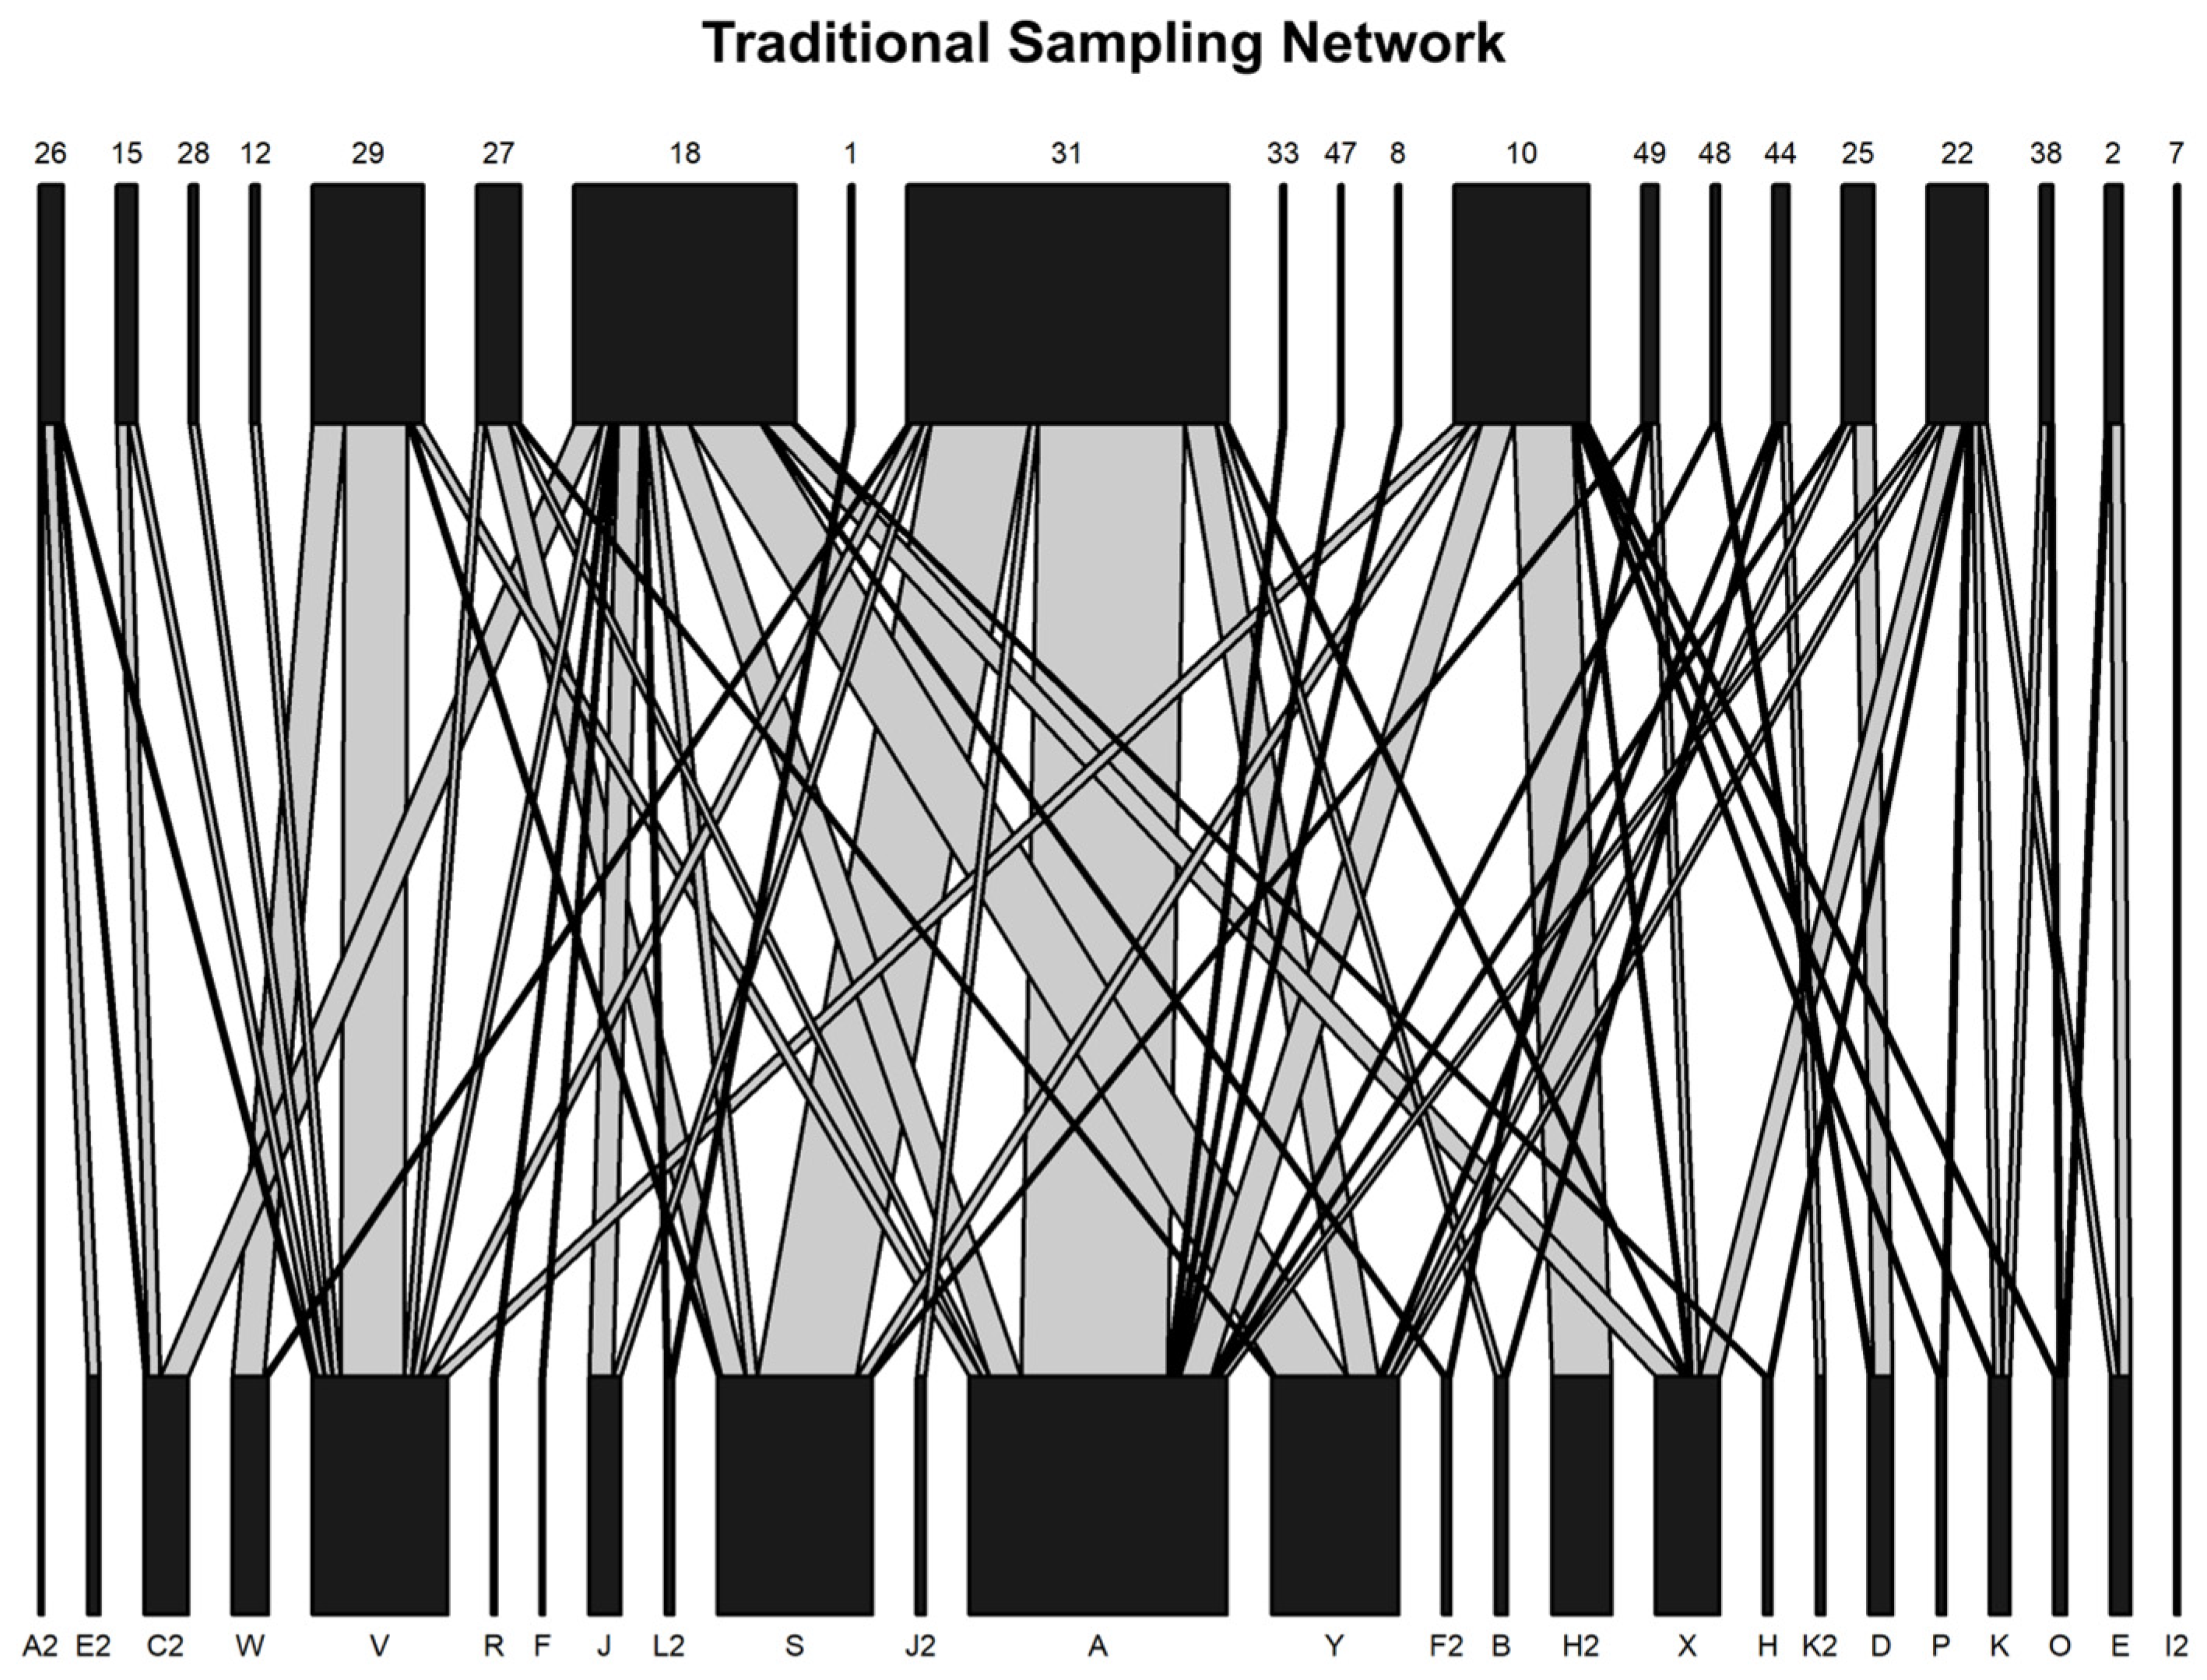
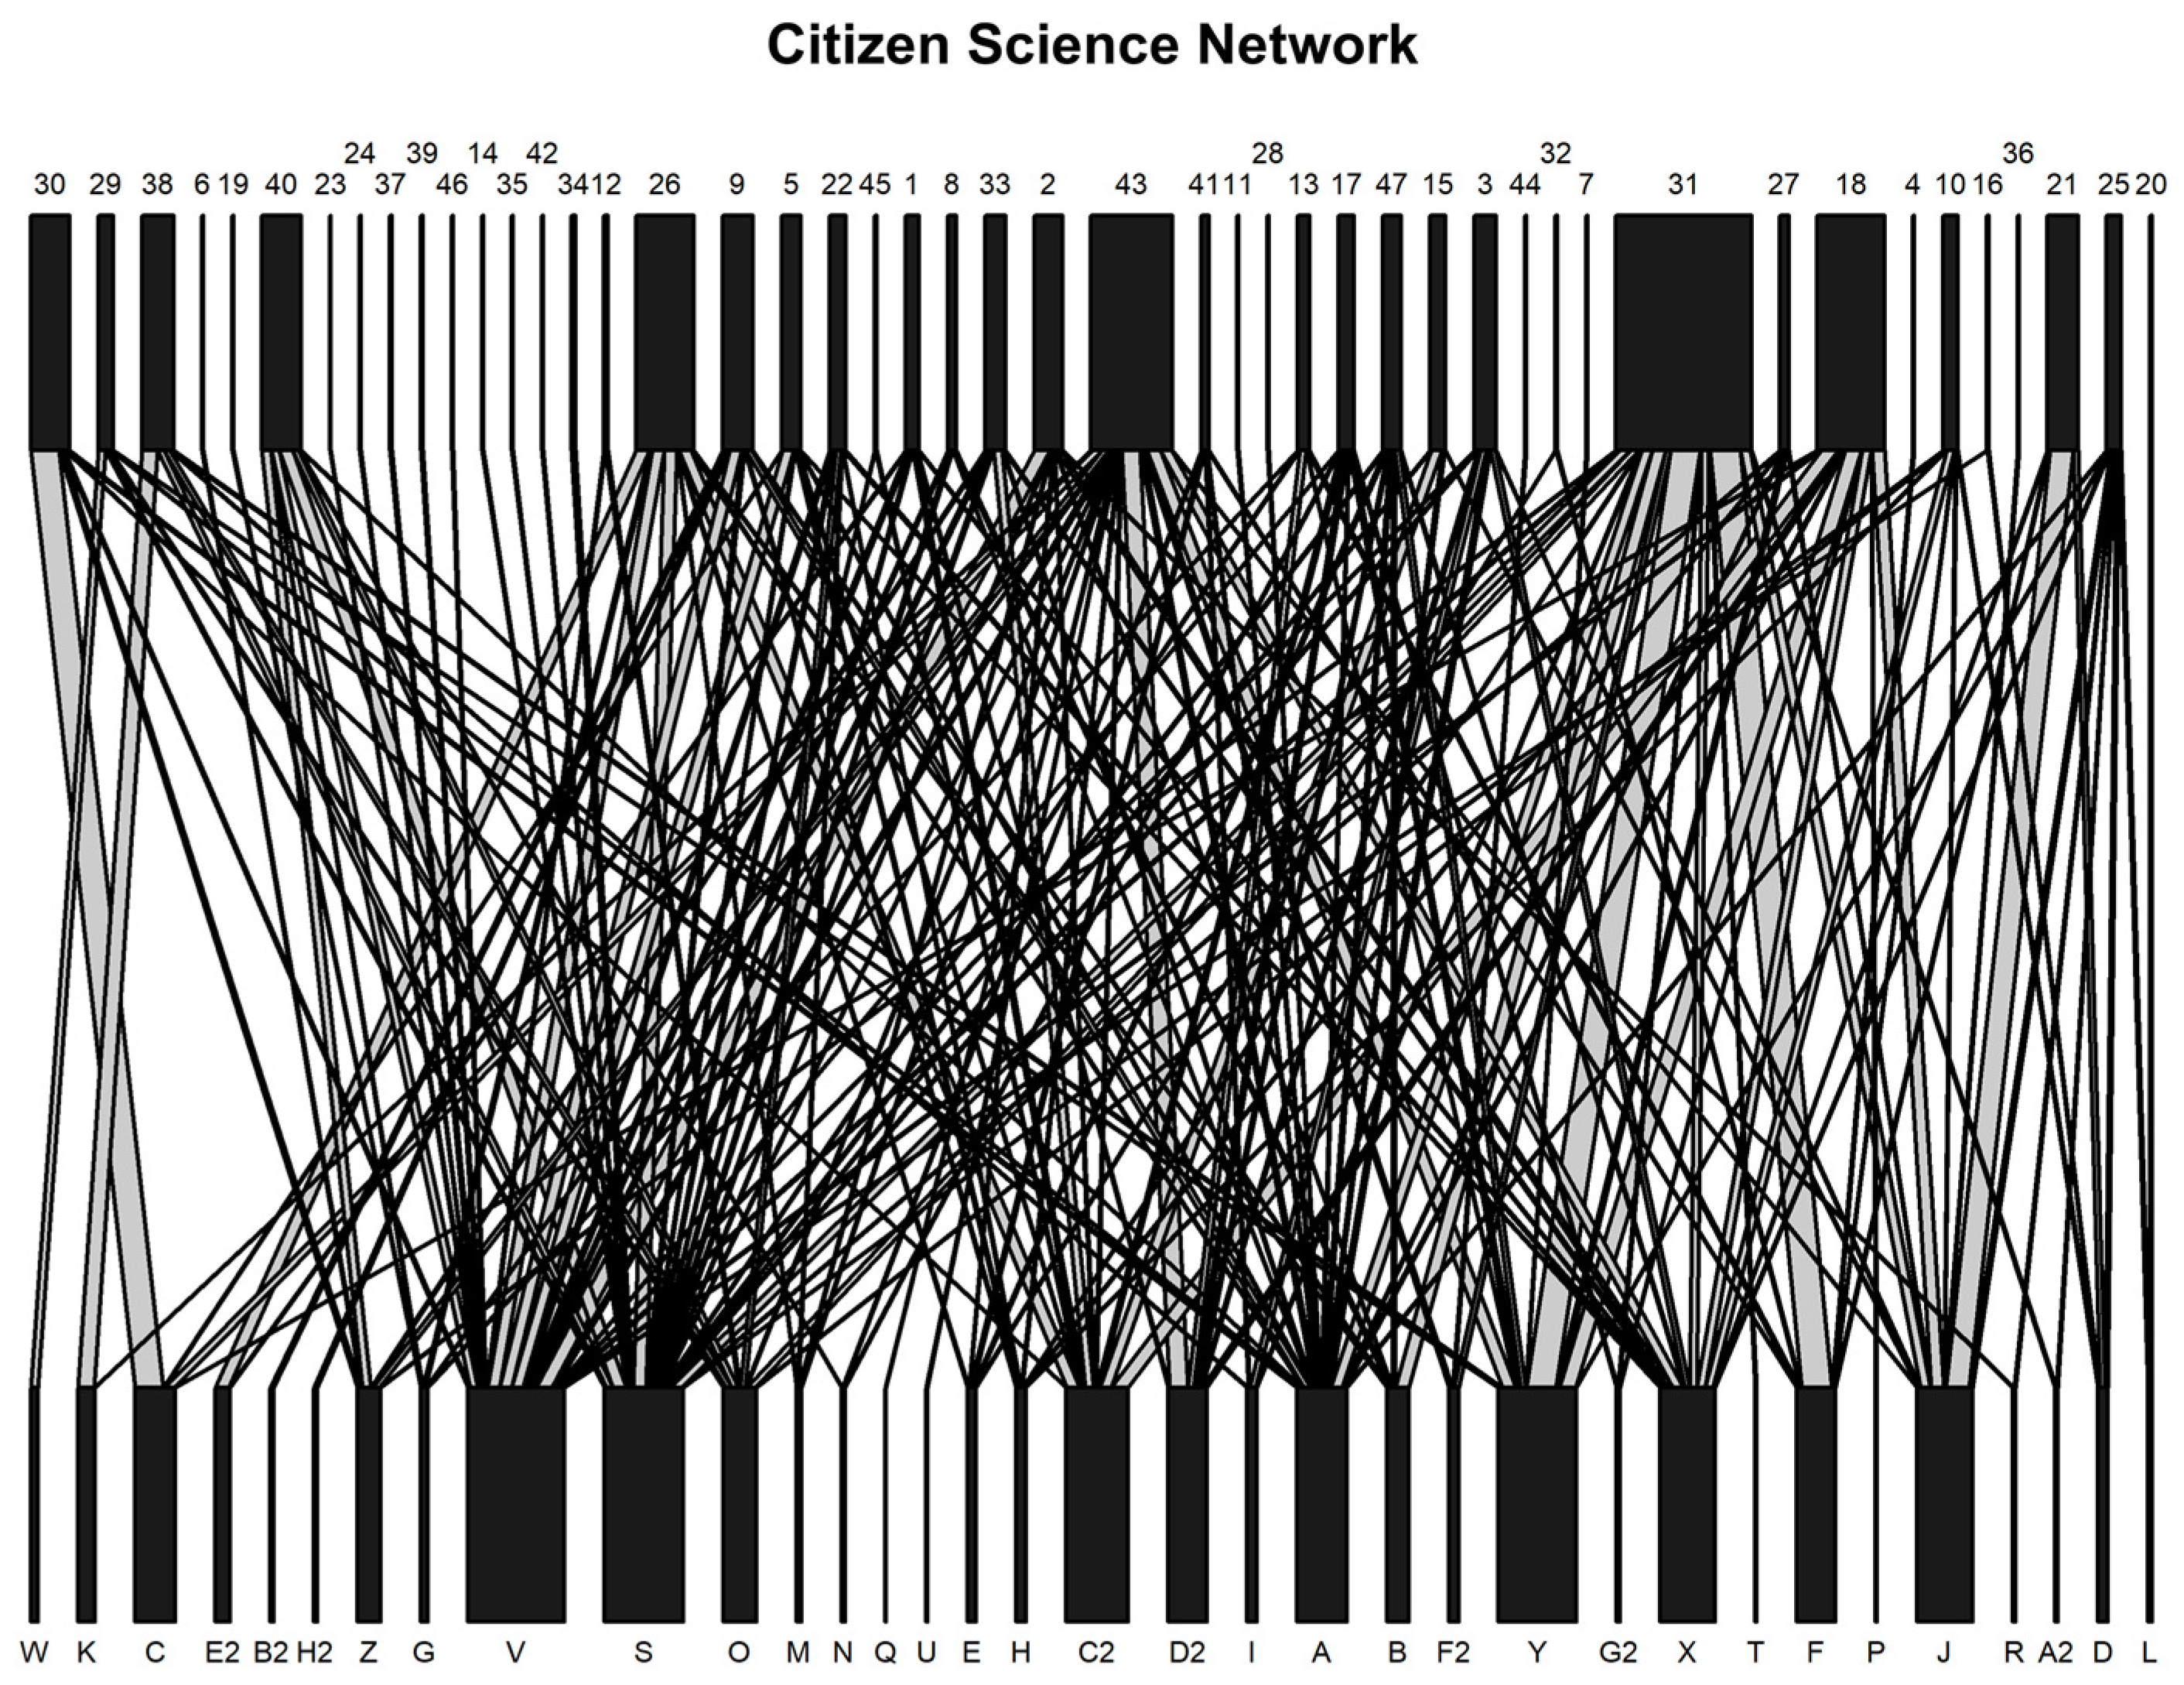
All departures from null expectations remained significant after false discovery rate correction for both complete networks (FDR-adjusted p = 0.002; Table 2). The structures of the traditionally sampled and citizen-science networks are shown in Figure 4 and Figure 5, respectively. These results indicate that both sampling regimes recovered non-random interaction structure in which interactions were more concentrated among particular partners and modules than expected under randomized interaction allocation. However, the magnitude of the standardized departures differed between networks, and comparisons of their raw metric values remain descriptive because the datasets differed in taxonomic breadth, interaction count, network dimensions, and spatial and temporal coverage.
Table 2.
Complete-network metrics for citizen science and traditionally sampled Anthophila–plant networks compared with fixed-margin null expectations. Observed values are shown with standardized effect sizes in parentheses, and null expectations are reported as mean ± SD from 999 Patefield randomizations preserving row and column totals. Negative SES values indicate metrics below null expectations, whereas positive values indicate metrics above expectations. All departures remained significant after FDR correction (p = 0.002).
Figure 4.
Plant–pollinator network derived from traditional field sampling conducted during summer 2024 at Lubbock Lake Landmark. The network contains 270 Anthophila–plant interaction records involving 25 bee genera and 21 plant genera.
Figure 5.
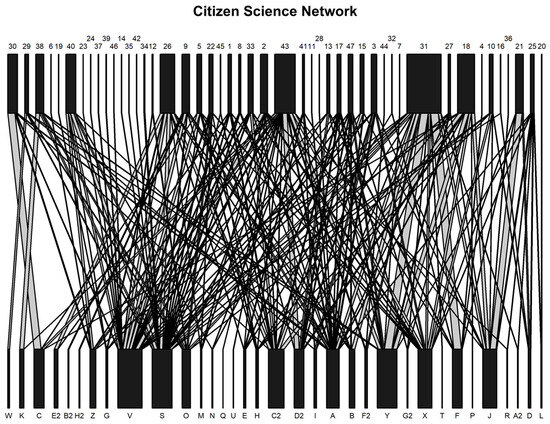
Plant–pollinator network constructed from citizen science observations collected from 2014–2023 and filtered to include only Anthophila records. The network contains 657 interaction records involving 34 bee genera and 47 plant genera.
Rarefaction of the citizen science dataset to 270 interaction records standardized interaction record totals but did not equalize taxonomic richness, realized link richness, or network dimensions. Even after standardizing interaction record totals, rarefied citizen science networks retained more plant genera, bee genera, and realized links than the traditional network. Comparison of the traditional network values with the rarefied citizen science distributions showed that the traditional network had higher connectance and weighted NODF, whereas the rarefied citizen science networks had higher linkage density and interaction evenness. These differences remained supported after false discovery rate correction.
These results indicate that equalizing the number of recorded interactions alone did not remove all structural differences between the two sampling regimes. However, because rarefaction did not standardize taxonomic richness, realized link richness, or matrix dimensions, the remaining contrasts cannot be attributed solely to sampling methodology. Instead, they likely reflect a combination of differences in sampling design, taxonomic breadth, and the spatial and temporal scope of the two datasets. In contrast, differences in network-level specialization and modularity were not supported, and the traditional values fell within the corresponding 95% rarefaction intervals (Table 3).
Table 3.
Comparison of the traditionally sampled Anthophila–plant network with citizen science networks rarefied to 270 interaction records. Rarefied citizen science values are reported as means and 95% intervals from 4999 resampled networks, except modularity, which was based on 999 resamples. Empirical probabilities were adjusted across metrics using the Benjamini–Hochberg procedure. Rarefaction standardized interaction totals but not taxonomic richness or network dimensions.
Restricting both datasets to the same 17 plant genera and 20 bee genera standardized node identities and matrix dimensions, although the networks still differed in interaction frequency and realized link richness. The shared-genus citizen science network contained 353 interaction records and 89 realized links, whereas the traditional network contained 242 interaction records and 61 realized links. Within this common taxonomic pool, the citizen science network exhibited higher connectance, linkage density, and interaction evenness. The traditional network exhibited higher weighted NODF and modularity, while network-level specialization was nearly identical between sampling regimes.
Fixed-margin null models generated using Patefield’s algorithm showed that both shared-genus networks departed from random expectations in the same general direction. Observed connectance, weighted NODF, linkage density, and interaction evenness were lower than their respective null means, whereas H2′ and modularity were higher than expected. All departures remained significant after false discovery rate correction for both networks (FDR-adjusted p = 0.002; Table 4). Thus, both sampling regimes recovered non-random interaction structure even after plant and bee identities and matrix dimensions were standardized. However, because interaction totals, realized link richness, and spatial and temporal coverage remained unequal, differences in the raw metric values cannot be attributed to sampling methodology alone.
Table 4.
Shared-genus network metrics for citizen science and traditionally sampled Anthophila–plant networks restricted to the same 17 plant genera and 20 bee genera. Observed values are shown with standardized effect sizes in parentheses, and null expectations are reported as mean ± SD from 999 Patefield randomizations preserving marginal totals. All departures from null expectations remained significant after FDR correction (p = 0.002).
4. Discussion
This study demonstrated that large-scale citizen science datasets can capture meaningful ecological patterns in plant–pollinator network structure. Raw network metrics differed among Coleoptera, Diptera, Hymenoptera, and Lepidoptera, while fixed-margin null models showed that the interaction networks recovered for all four orders were non-randomly organized. Citizen science observations also showed significant spatial structure. Rare-taxon filtering significantly altered the distribution of observed specialization, although retained genera were only slightly more specialized than excluded genera and the effect size was small. Comparison with standardized field sampling showed that inferred network properties varied between sampling regimes, reflecting differences in observation design, taxonomic breadth, interaction frequency, network dimensions, and spatial and temporal coverage. Among Anthophila, linkage density and interaction evenness were consistently higher in the citizen science network, whereas differences in the remaining metrics varied among the complete, rarefied, and shared-genus analyses.
Previous research has demonstrated that citizen science flower visitor observations can reveal broad ecological patterns. For example, Deguines et al. [6] used citizen science records to identify differences in flower visitor assemblages among land use types. Here, opportunistic observations also recovered non-random structure in plant–insect interaction networks. Raw metrics differed among insect orders, but all four networks departed from their fixed-margin null expectations in the same direction. Specifically, observed connectance, weighted nestedness, linkage density, and interaction evenness were lower than expected, whereas network-level specialization and modularity were higher than expected. Together, these departures indicate that interactions were concentrated among particular plant–insect associations and taxonomic groups rather than distributed evenly across all available combinations. The citizen science data, therefore, captured not only broad differences in flower visitor assemblages, as shown in previous research, but also structured patterns in how plants and insects interacted.
The Research-Grade-only sensitivity analysis further supported the principal order-level conclusion. Although restricting the dataset to Research Grade observations substantially reduced interaction totals and taxonomic breadth—particularly in Diptera and Hymenoptera—all four networks retained the same directional departures from fixed-margin null expectations. Thus, the inference that the order-specific networks were non-randomly organized was robust to the exclusion of Needs ID records. However, Research Grade filtering simultaneously altered sample size, taxonomic composition, realized link richness, and matrix dimensions. Differences in raw metric values between the complete and Research-Grade-only networks, therefore, cannot be attributed to identification status alone.
Spatial analyses also revealed broad ecological patterning while underscoring the limitations of opportunistic records. The relative representation of insect orders differed among grid cells, and this association remained significant across the 5 × 5, 10 × 10, and 20 × 20 grid resolutions. Cramer’s V increased at finer grid resolutions, indicating that the estimated strength of the spatial association was scale-dependent. Geographic clustering may reflect ecological differences in habitat, land use, floral resource availability, or insect distributions, but it may also result from variation in observer activity, accessibility, or sampling effort. Citizen science records can reveal broad spatial patterns in flower visitor assemblages, but these data alone cannot distinguish ecological mechanisms from observer and sampling effects.
Rare-taxon filtering altered the observed distribution of genus-level specialization in the citizen science network. Genus-level specialization was evaluated using d′, a network-based index that measures how restricted a taxon’s observed interactions are relative to the available interaction partners in the network. Contrary to our prediction, genera removed because they had fewer than three observations had lower median d′ values than retained genera, although the difference was small. This indicates that filtering altered the specialization distribution, but in the opposite direction from that predicted.
Previous studies indicate that iNaturalist records can contain taxonomic and trait-based biases. Turley et al. [15] found that iNaturalist bee observations were biased toward larger-bodied and non-native species compared with a collections-based monitoring dataset, while Pereira et al. [18] reported greater representation of large, conspicuous, and readily identifiable bees. In our dataset, however, the three-observation filter did not preferentially exclude genera with high observed specialization. Because d′ is calculated from recorded interactions, it is sensitive to sampling depth, taxonomic resolution, and missing interactions. This result should, therefore, be interpreted as a sensitivity analysis of the filtering procedure, not as evidence that citizen science captures all specialist taxa without bias. The comparison with traditional sampling nevertheless showed that inferred network structure was sensitive to differences in sampling scope and taxonomic composition.
The Anthophila comparison showed that conclusions about network structure changed as differences in sampling effort and taxonomic composition were addressed through successive analytical treatments. The complete citizen science network contained 34 bee genera, 47 plant genera, and 204 realized links, whereas the traditional network contained 25 bee genera, 21 plant genera, and 72 realized links. In the complete networks, citizen science had higher weighted NODF, linkage density, and interaction evenness. Connectance, network-level specialization, and modularity were higher in the traditional network. Rarefaction altered several of these contrasts: after the citizen science dataset was reduced to the same number of interaction records as the traditional dataset, the traditional network had higher connectance and weighted NODF, while citizen science retained higher linkage density and interaction evenness. Rarefaction did not support differences in specialization or modularity. When both datasets were restricted to the same plant and bee genera, citizen science had higher connectance, linkage density, and interaction evenness, while the traditional network had higher weighted NODF and modularity; network-level specialization was nearly identical. Only linkage density and interaction evenness remained consistently higher in the citizen science network across all three analytical treatments. The other contrasts changed with interaction totals, taxonomic composition, and matrix dimensions.
Despite these differences in raw metrics, fixed-margin null models showed that both sampling regimes recovered non-randomly structured networks. In the complete and shared-genus analyses, connectance, weighted NODF, linkage density, and interaction evenness were lower than null expectations, whereas specialization and modularity were higher. This shared pattern indicates that interactions in both datasets were concentrated among particular partners and groups of taxa rather than distributed randomly across all possible bee–plant combinations. The null model results, therefore, show that both datasets contained ecological structure, even though their raw metric values differed. Higher raw linkage density or interaction evenness in the citizen science network does not by itself indicate greater ecological connectivity or stability, and higher modularity in the traditional network does not establish that the local community is intrinsically more modular. These values may also have been influenced by the number and identity of taxa observed, interaction frequencies, and the spatial and temporal scope of sampling.
The consistently higher linkage density and interaction evenness in the citizen science networks may partly reflect the broader interaction coverage accumulated across a larger area and ten-year period. Citizen science recorded more plant genera, bee genera, and realized links, with interaction frequencies distributed more evenly among those links. By contrast, standardized field sampling represented one localized community observed during a single season, producing a smaller and more temporally constrained network. Some structural differences persisted in the shared genus analysis, even after node identities and matrix dimensions were standardized. However, the datasets still differed in interaction totals, realized link richness, and spatial and temporal coverage. The remaining contrasts, therefore, cannot be attributed to observation method alone.
These findings are consistent with previous studies showing that citizen science and academic datasets provide complementary rather than interchangeable representations of insect communities. Turley et al. [15] and Díaz-Calafat et al. [16] found that citizen science and academic datasets differed in the taxa, traits, and spatial patterns they represented, while Visser et al. [17] showed that bee–flower survey methods produced distinct interaction networks and conservation interpretations. Our results further show that methodological and taxonomic differences can affect both the magnitude and direction of commonly used network metrics. Citizen science provided broader taxonomic and interaction coverage. Traditional sampling offered a more standardized representation of one local network. Neither approach is complete or free of bias; each captures a different component of plant–pollinator interaction structure.
The largest limitation of this comparison is the mismatch in spatial and temporal coverage between datasets. The citizen science network combined observations collected over ten years and across a broad geographic area, whereas the traditional network represented one site during a single field season. Neither sampling regime quantified floral abundance, bloom timing, or the spatial distribution of flowering resources. Recorded interaction frequencies, therefore, reflect both pollinator use and the availability and detectability of flowering taxa and should not be interpreted as direct measures of plant preference. The citizen science dataset also contained observations classified as either Research Grade or Needs ID when downloaded. Associated flowering plants were identified using Research Grade plant observations from Lubbock Lake Landmark as a reference. Insect identifications, however, were retained from the original iNaturalist records and were not independently verified for this study. Remaining taxonomic uncertainty may, therefore, have influenced the composition and inferred structure of the citizen science network. A sensitivity analysis restricted to observations classified as Research Grade produced the same directional departures from fixed-margin null expectations as the complete dataset for all four insect orders. However, Research Grade filtering also substantially reduced interaction totals and taxonomic coverage, particularly for Diptera and Hymenoptera, so differences in raw metric values cannot be attributed to identification status alone. Rarefaction and shared-genus analyses reduced differences in interaction count and taxonomic composition, but they could not resolve the spatial and temporal mismatch or uncertainty in insect identifications. The results should, therefore, be interpreted as differences between sampling regimes rather than as effects of sampling methodology alone.
Future studies should pair broad-scale citizen science observations with standardized field sampling across multiple sites, seasons, years, and habitat types. More closely matching the spatial and temporal extent of the datasets would help determine whether the observed differences persist. Analyses should also incorporate environmental and sampling effort variables, including seasonality, climatic conditions, observer density, accessibility, and survey duration, to better distinguish ecological patterning from observer and sampling bias. Comparisons of networks that differ in taxonomic scope should use rarefaction, shared-genus analyses, and dimension-controlled null models to account for differences in interaction frequency, richness, and matrix size. Evaluating networks at the genus, species, and functional group levels may also clarify how identification uncertainty affects estimates of network structure. Together, these approaches would help identify when opportunistic observations reliably capture ecological structure and when targeted field sampling remains necessary.
Author Contributions
Conceptualization, J.L.; methodology, J.L.; software, J.L.; validation, J.L.; formal analysis, J.L.; investigation, J.L.; data curation, J.L.; writing—original draft preparation, J.L.; writing—review and editing, J.L. and S.L.; visualization, J.L.; supervision, S.L.; project administration, J.L.; resources, S.L.; funding acquisition, S.L. All authors have read and agreed to the published version of the manuscript.
Funding
This project was funded by a Texas Tech University Davis College Catalyst Grant. No grant number was assigned.
Data Availability Statement
The original contributions presented in this study are included in the article. Further inquiries can be directed to the corresponding author.
Acknowledgments
A special thank you goes to Catherine Galley for compiling and providing the citizen science interaction data from Lubbock Lake Landmark. We thank Shelby Hernandez, Annie Catlett, Madeline Jordan-Hadaway, and Jack Carlin for their assistance with field collections.
Conflicts of Interest
The authors declare no conflicts of interest.
Appendix A. Research-Grade Sensitivity Analysis
Table A1.
Identification status and network dimensions for complete and Research-Grade-only citizen science datasets, separated by insect order.
Table A2.
Observed network metrics, fixed-margin null expectations, standardized effect sizes, and adjusted empirical probabilities for Research-Grade-only citizen science networks. Null distributions were generated from 999 randomized matrices using Patefield’s algorithm while preserving row and column marginal totals. Positive SES values indicate metrics above null expectations, whereas negative values indicate metrics below expectations. Empirical probabilities were two-sided and adjusted across the six metrics within each order using the Benjamini–Hochberg procedure.
References
- Ollerton, J.; Winfree, R.; Tarrant, S. How many flowering plants are pollinated by animals? Oikos 2011, 120, 321–326. [Google Scholar] [CrossRef] [Scilit]
- Winfree, R.; Bartomeus, I.; Cariveau, D.P. Native pollinators in anthropogenic habitats. Annu. Rev. Ecol. Evol. Syst. 2011, 42, 1–22. [Google Scholar] [CrossRef] [Scilit]
- Miñarro, M.; García, D. Complementarity and redundancy in the functional niche of cider apple pollinators. Apidologie 2018, 49, 789–802. [Google Scholar] [CrossRef] [Scilit]
- Garibaldi, L.A.; Steffan-Dewenter, I.; Winfree, R.; Aizen, M.A.; Bommarco, R.; Cunningham, S.A.; Kremen, C.; Carvalheiro, L.G.; Harder, L.D.; Afik, O.; et al. Wild pollinators enhance fruit set of crops regardless of honey bee abundance. Science 2013, 339, 1608–1611. [Google Scholar] [CrossRef] [Scilit]
- Klein, A.M.; Vaissière, B.E.; Cane, J.H.; Steffan-Dewenter, I.; Cunningham, S.A.; Kremen, C.; Tscharntke, T. Importance of pollinators in changing landscapes for world crops. Proc. R. Soc. B 2007, 274, 303–313. [Google Scholar] [CrossRef] [Scilit]
- Deguines, N.; Julliard, R.; de Flores, M.; Fontaine, C. The whereabouts of flower visitors: Contrasting land-use preferences revealed by a country-wide survey based on citizen science. PLoS ONE 2012, 7, e45822. [Google Scholar] [CrossRef] [Scilit]
- Isaac, N.J.B.; van Strien, A.J.; August, T.A.; de Zeeuw, M.P.; Roy, D.B. Statistics for citizen science: Extracting signals of change from noisy ecological data. Methods Ecol. Evol. 2014, 5, 1052–1060. [Google Scholar] [CrossRef] [Scilit]
- Bascompte, J.; Jordano, P. Plant–animal mutualistic networks: The architecture of biodiversity. Annu. Rev. Ecol. Evol. Syst. 2007, 38, 567–593. [Google Scholar] [CrossRef] [Scilit]
- Dormann, C.F.; Fründ, J.; Blüthgen, N.; Gruber, B. Indices, graphs and null models: Analyzing bipartite ecological networks. Open Ecol. J. 2009, 2, 7–24. [Google Scholar] [CrossRef] [Scilit]
- Kaiser-Bunbury, C.N.; Mougal, J.; Whittington, A.E.; Valentin, T.; Gabriel, R.; Olesen, J.M.; Blüthgen, N. Ecosystem restoration strengthens pollination network resilience and function. Nature 2017, 542, 223–227. [Google Scholar] [CrossRef] [Scilit]
- Conrad, C.C.; Hilchey, K.G. A review of citizen science and community-based environmental monitoring: Issues and opportunities. Environ. Monit. Assess. 2011, 176, 273–291. [Google Scholar] [CrossRef] [Scilit]
- Devictor, V.; Whittaker, R.J.; Beltrame, C. Beyond scarcity: Citizen science programmes as useful tools for conservation biogeography. Divers. Distrib. 2010, 16, 354–362. [Google Scholar] [CrossRef] [Scilit]
- Kosmala, M.; Wiggins, A.; Swanson, A.; Simmons, B. Assessing data quality in citizen science. Front. Ecol. Environ. 2016, 14, 551–560. [Google Scholar] [CrossRef] [Scilit]
- Newman, G.; Wiggins, A.; Crall, A.; Graham, E.; Newman, S.; Crowston, K. The future of citizen science: Emerging technologies and shifting paradigms. Front. Ecol. Environ. 2012, 10, 298–304. [Google Scholar] [CrossRef] [Scilit]
- Turley, N.E.; Kania, S.E.; Petitta, I.R.; Otruba, E.A.; Biddinger, D.J.; Butzler, T.M.; Sesler, V.V.; López-Uribe, M.M. Bee monitoring by community scientists: Comparing a collections-based program with iNaturalist. Ann. Entomol. Soc. Am. 2024, 117, 220–233. [Google Scholar] [CrossRef] [Scilit]
- Díaz-Calafat, J.; Jaume-Ramis, S.; Soacha, K.; Álvarez, A.; Piera, J. Revealing biases in insect observations: A comparative analysis between academic and citizen science data. PLoS ONE 2024, 19, e0305757. [Google Scholar] [CrossRef] [Scilit]
- Visser, J.J.T.C.; Marshall, L.; Hadrava, J.; Vanormelingen, P.; Dielens, A.; Molenberg, J.-M.; Vereecken, N.J. Different bee–flower survey methods impact conservation recommendations: Comparing citizen science and academic surveys. J. Pollinat. Ecol. 2025, 38, 171–182. [Google Scholar] [CrossRef] [Scilit]
- Pereira, F.W.; Zamoner, M.; Gonçalves, R.B. The potential of iNaturalist for bee conservation research—A study case in a southern Brazilian metropolis. Insect Conserv. Divers. 2024, 17, 386–395. [Google Scholar] [CrossRef] [Scilit]

Disclaimer/Publisher’s Note: The statements, opinions and data contained in all publications are solely those of the individual author(s) and contributor(s) and not of MDPI and/or the editor(s). MDPI and/or the editor(s) disclaim responsibility for any injury to people or property resulting from any ideas, methods, instructions or products referred to in the content. |
© 2026 by the authors. Licensee MDPI, Basel, Switzerland. This article is an open access article distributed under the terms and conditions of the Creative Commons Attribution (CC BY) license.