


Abstract
Understanding the mechanisms that sustain plant diversity in arid regions is a current focus of ecological research. This study focused on the Gurbantunggut Desert, China’s largest fixed and semi-fixed desert, and systematically investigated the plant community diversity and its environmental drivers on fixed, semi-fixed, and mobile dunes. Data analysis was conducted using non-metric multidimensional scaling (NMDS) ordination, redundancy analysis (RDA), boosted regression tree (BRT), and structural equation modeling (SEM). The results indicated that taxonomic diversity (TD), functional diversity (FD), and phylogenetic diversity (PD) all exhibited consistent gradient patterns: fixed dunes > semi-fixed dunes > mobile dunes. The Net Relatedness Index (NRI) and the Nearest Taxon Index (NTI) primarily exhibited phylogenetic clustering, and habitat filtering was the dominant process in community assembly. Soil water content (SWC) and soil organic carbon (SOC) are the key drivers regulating plant diversity in this region. SWC and SOC directly and significantly influence FD and PD; however, their indirect effects on TD are weak, suggesting that species composition is also jointly constrained by abiotic processes such as dispersal limitation and interspecific competition. This study offers a theoretical foundation for differentiated ecological management of fixed, semi-fixed, and mobile dunes in the Gurbantunggut Desert.
1. Introduction
Plant diversity is a multidimensional concept, in which taxonomic diversity (TD), functional diversity (FD), and phylogenetic diversity (PD) characterize the composition and structure of plant communities from the perspectives of species abundance, ecological functional traits, and evolutionary history, respectively. TD reflects the number of species (species richness) and their relative abundances within a community; FD, through the range and degree of variation in plant functional traits, is directly linked to species’ ability to access resources and to ecosystem processes [1,2]; PD, meanwhile, uses evolutionary relationships among species to infer the influence of ecological processes on community assembly [3]. In global arid regions, where environmental stresses are severe and competition for water is exceptionally intense, the use of a multidimensional diversity framework to study community assembly has become a frontier in contemporary ecology [4,5].
Community assembly is jointly regulated by multiple ecological processes, among which habitat filtering, dispersal limitation, and interspecific competition are three widely discussed core mechanisms [6]. According to the habitat filtering hypothesis, organisms that can adapt to their local environments are chosen by abiotic environmental factors, leading to functional similarity among community species [7]. Furthermore, this process manifests directly as phylogenetic clustering in phylogenetically conserved traits [8]. The dispersal limitation hypothesis emphasizes that species’ ability to migrate and colonize is constrained by spatial distance and dispersal barriers, leading to greater differences in community species composition between geographically distant populations [9]; the interspecific competition hypothesis posits that coexisting species must possess sufficient niche differentiation to avoid competitive exclusion, leading to trait divergence and phylogenetic overdispersion among species within a community [10]. In arid regions, where water is the primary limiting factor for plant survival, habitat filtering is typically considered the dominant driver of community assembly [7]. However, recent research in the Atacama Desert has revealed that even in extremely arid environments, environmental heterogeneity and competition are equally important drivers of plant community assembly [11]. FD and PD differ in their sensitivity to habitat filtering, and the two often provide complementary information for community assembly [12].
In arid regions, soil environmental factors are the most direct determinants of plant diversity. Soil water content (SWC) is the primary limiting factor for the survival and regeneration of desert plants, while soil organic carbon (SOC) and nutrient content influence plant metabolic activity and competitive ability [8]. Numerous surveys conducted in the Gurbantunggut Desert indicate that species composition and plant community diversity covary significantly with SWC and SOC, which serve as primary environmental drivers shaping vegetation spatial patterns [8,13]. In addition to natural factors, human disturbance is also a major driver of vegetation changes in the Gurbantunggut Desert. Historically, this desert served as an important winter pasture in Northern Xinjiang; however, in recent years, grazing activities have begun to extend into the desert’s interior during spring and summer, resulting in significant changes in surface properties and vegetation cover [14]. Studies have shown that grazing disturbance significantly reduces surface vegetation and bio-crust coverage, intensifies sand surface activity, and alters soil physicochemical properties [15]. In addition to grazing, the intensifying oil development in the Junggar Basin has also led to severe engineering disturbances, such as soil compaction, vegetation removal, sand burial and oil contamination, which directly cause damage to desert vegetation [16]. Excessive land reclamation in areas surrounding the desert, as well as historically large-scale and excessive firewood harvesting, has similarly exacerbated vegetation degradation [17]. Different human disturbances show spatially heterogeneous impacts on plant communities across fixed, semi-fixed, and mobile dunes. As confirmed by regional landscape pattern analysis of desert-oasis ecotone, human activities create divergent ecological effects on desert ecosystems [18]. This means that the effects of human disturbance are superimposed on the natural environmental gradient. However, there is currently a lack of systematic quantitative analysis regarding whether the pathways through which these environmental factors influence different dimensions of diversity are direct or indirect. In recent years, non-metric multidimensional scaling (NMDS) has been widely used to visualize differences in community species composition [19]; redundancy analysis (RDA) can identify environmental factors that significantly influence diversity and quantify their explanatory power [20], and structural equation modeling (SEM) offers the advantage of distinguishing between direct and indirect causal pathways, making it particularly suitable for analyzing complex ecological processes involving multiple factors and pathways [21].
The Gurbantunggut Desert is China’s largest fixed and semi-fixed desert, with fixed and semi-fixed dunes accounting for 87% of its total area [22]. The plant communities in this desert are dominated by annuals and perennial ephemerals, with Haloxylon ammodendron and Haloxylon persicum serving as the dominant species; regarding community assembly mechanisms, recent studies indicate that habitat filtering is the dominant process in the formation of this desert’s plant communities [8]. PD is significantly higher in fixed dunes than in semi-fixed and mobile dunes, with SWC and SOC serving as key influencing factors [8]. Furthermore, intraspecific and interspecific competition, spatial patterns, and regeneration characteristics of the two Haloxylon species were systematically investigated [23], finding that fixed dunes are more suitable for H. ammodendron, while H. persicum is better adapted to semi-fixed and mobile dunes. However, systematic comparative studies on TD, FD, and PD across different dune types in this desert remain scarce, and the relative importance of habitat filtering, dispersal limitation, and interspecific competition remains unclear. This study systematically investigated plant community composition and soil physicochemical properties on fixed, semi-fixed, and mobile dunes. We calculated TD, FD, and PD and employed methods such as NMDS, RDA, boosted regression tree (BRT), and SEM to address the following questions: (1) How do TD, FD, and PD vary along the dune stability gradient? (2) Is the assembly of this desert plant community dominated by habitat filtering, dispersal limitation, or interspecific competition? (3) Do SWC and SOC exert direct effects on the three dimensions of diversity, or do they influence them indirectly through FD or PD? The results of this study will give the Gurbantunggut Desert’s multifaceted biodiversity conservation and dune ecosystem management a solid scientific foundation.
2. Materials and Methods
2.1. Overview of the Study Area
The Gurbantunggut Desert (44°11′–46°21′ N, 84°31′–90°00′ E) is located in the central part of the Junggar Basin in northern Xinjiang Uygur Autonomous Region, China. Covering an area of approximately 48,800 square kilometers, it is China’s second-largest desert and the country’s largest fixed and semi-fixed desert [24], with 87% of its dunes in a stable or semi-stable state [22]. The desert’s elevation ranges from 300 to 600 m [25]. The average annual temperature across the region is 5.0–5.7 °C. Summers are hot and dry, with extreme maximum temperatures reaching 41.7 °C, while winter extreme minimum temperatures can drop to −42.2 °C [26]. Annual precipitation in the desert is less than 150 mm, with winter precipitation accounting for approximately 30% of the annual total, and evaporation exceeding 1400 mm.
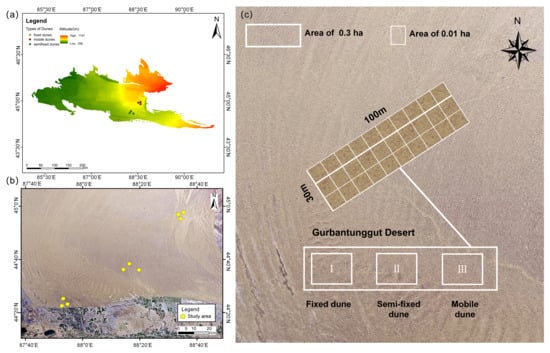
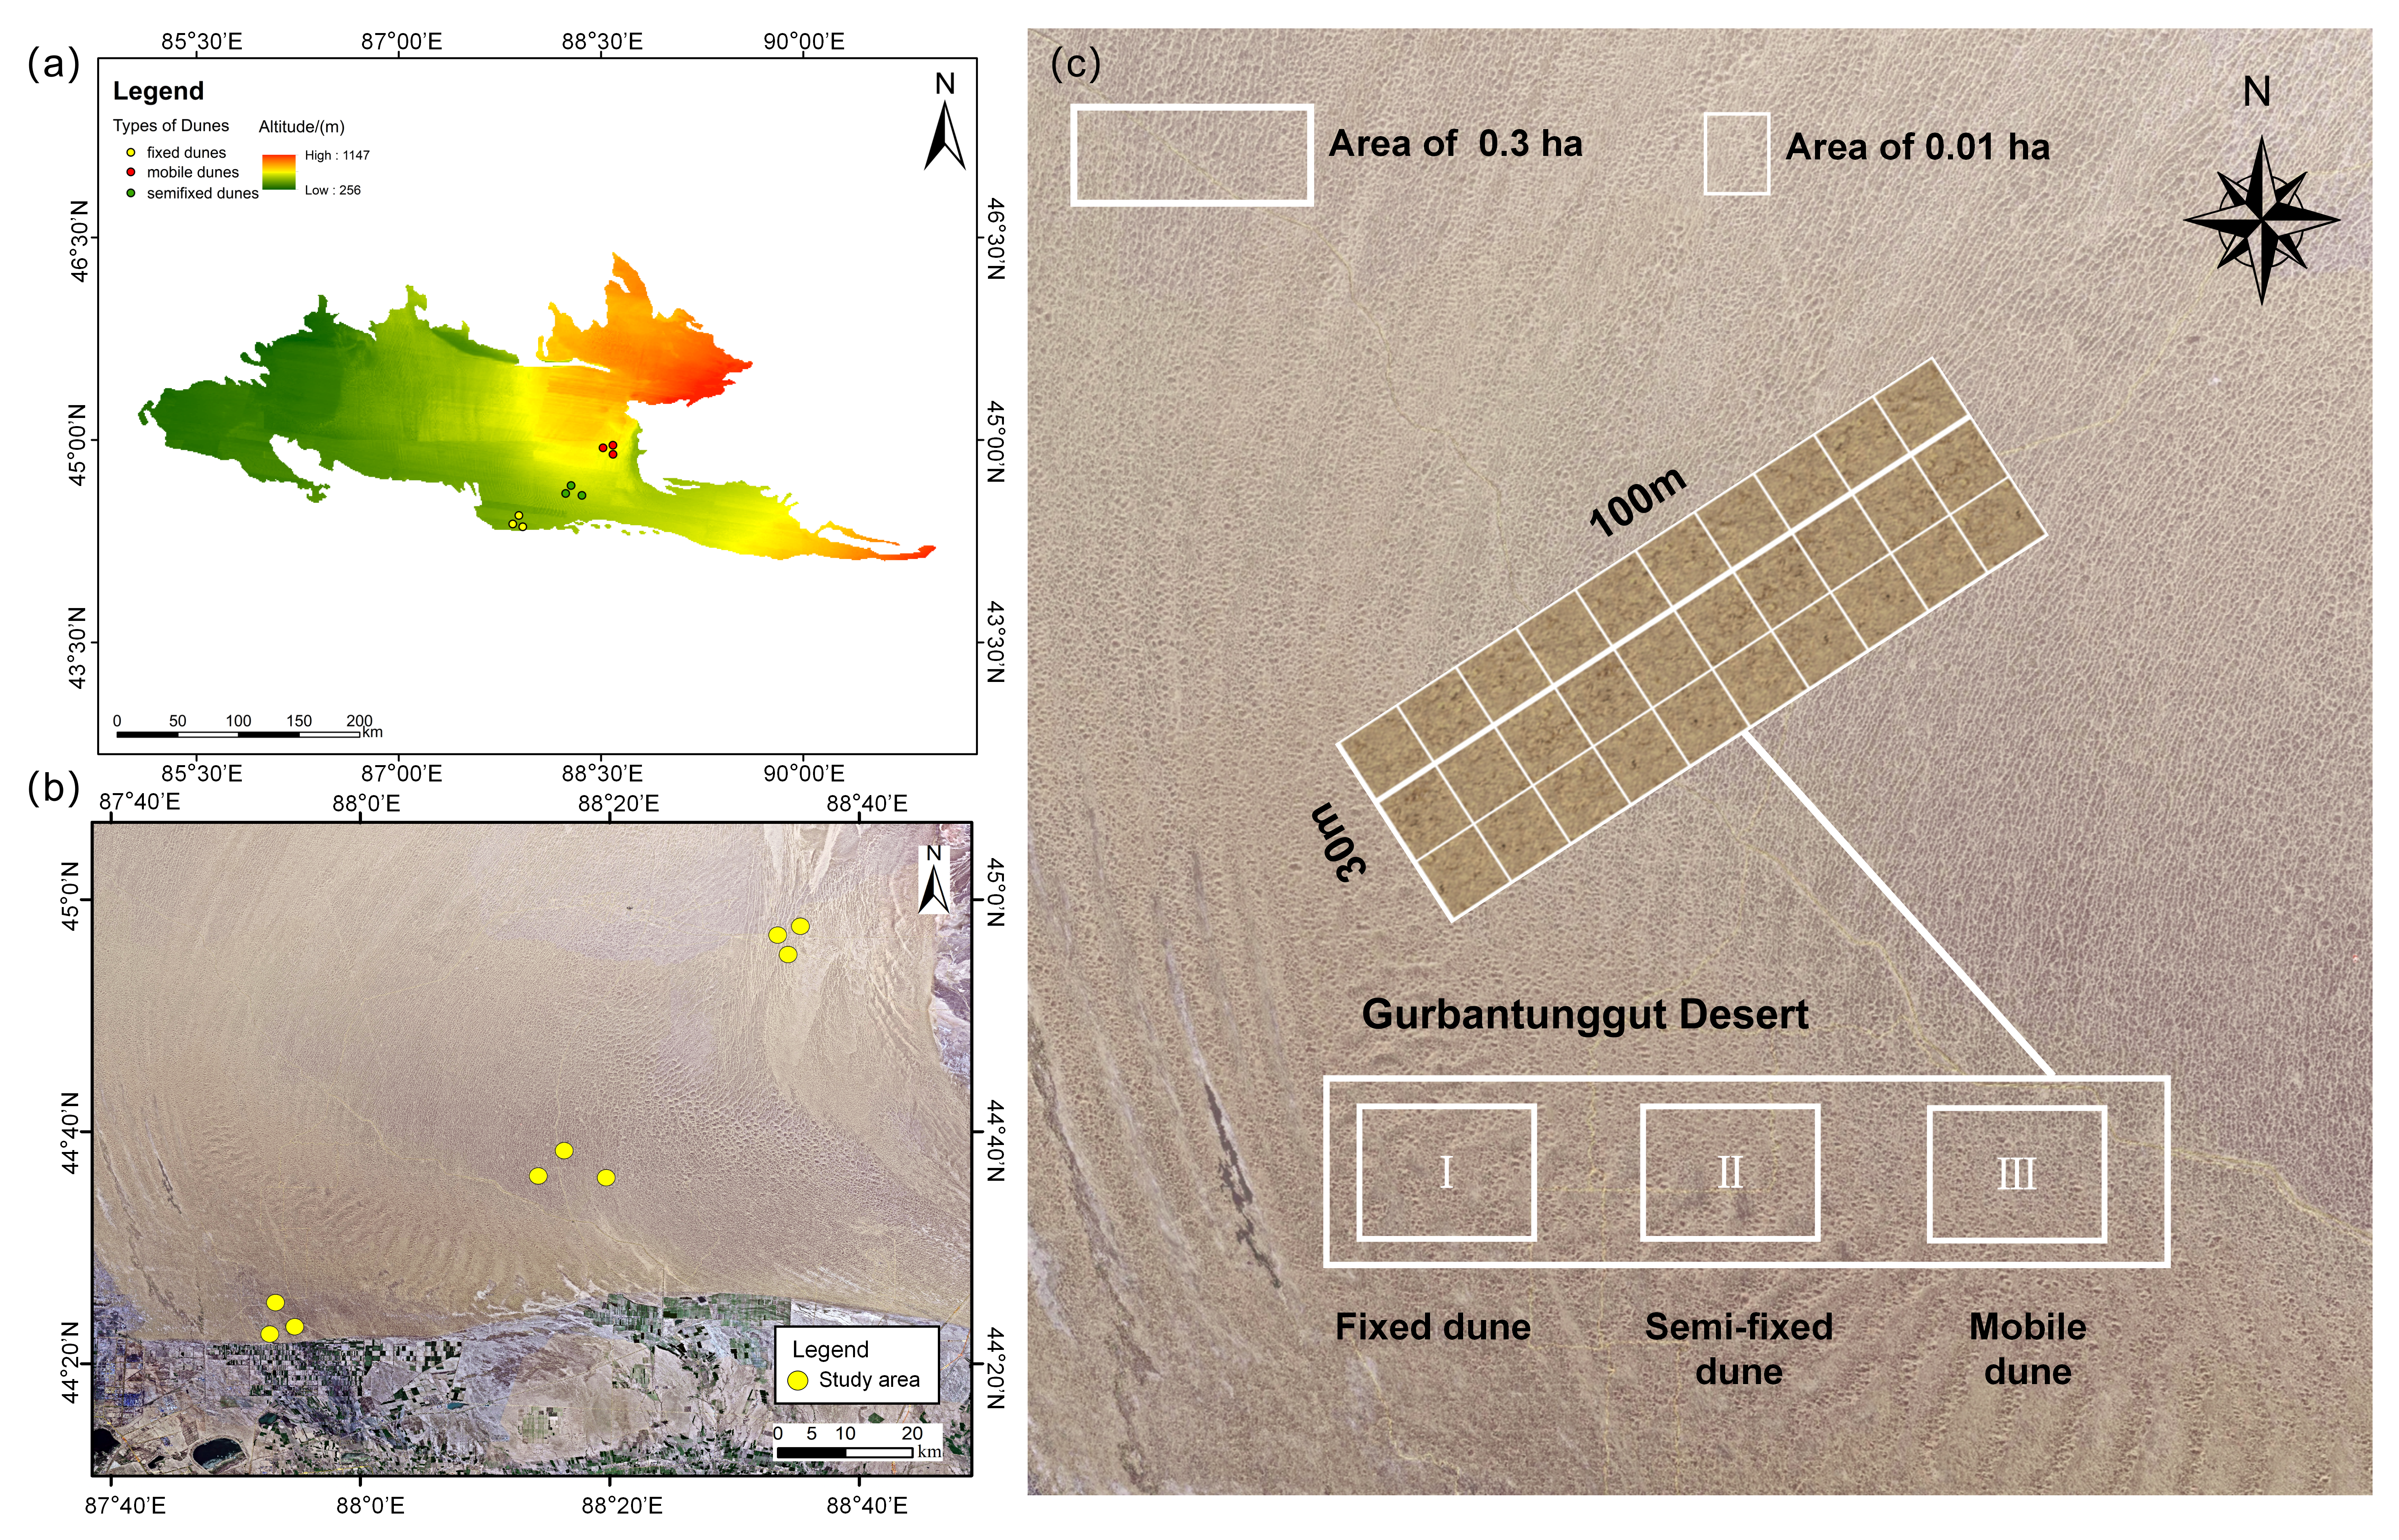
The maximum snow depth in the region ranges from 20 to 30 cm, with stable snow cover persisting for 100 to 150 days. The snow melts primarily in early to mid-March of the following year, and the main source of water for the germination of early-spring herbaceous plants is snowmelt [27]. Spring rainfall provides additional soil moisture. The regional topography is dominated by dendritic sand ridges oriented roughly north–south, with ridge heights ranging from 10 to 50 m. The soil is predominantly eolian, with stabilized eolian soils concentrated in the depressions between ridges and in the middle to lower parts of the ridges, while semi-stabilized aeolian soils are mostly found in the middle to upper parts of the ridges. The vegetation consists primarily of xerophytic and hyperxerophytic shrubs and subshrubs, with H. ammodendron and H. persicum as the dominant species, accompanied by shrubs such as Ceratoides latens and Calligonum spp., as well as various short-lived herbaceous plants [8,23]. Historically, the study area has served as an important winter pasture in Northern Xinjiang; in recent years, however, it has been increasingly affected by grazing activities (especially in spring and summer) and disturbances caused by oil development projects in the Junggar Basin. Land-use changes such as land reclamation and over-harvesting of desert shrubs have also occurred in the areas surrounding the desert [16,28]. A schematic map of the study area has been annotated with the coordinates of the sampling sites, as shown in Figure 1.
Figure 1.
A schematic map of the study area (a), distribution of sampling points (b), and dune topography (c).
2.2. Field Sampling, Vegetation Survey, and Soil Physicochemical Analysis
Field surveys and sample collection were conducted from May to June 2025. Based on topography, dune type, and vegetation distribution characteristics, three sites with well-preserved native vegetation were selected from each of the following categories: fixed dunes, semi-fixed dunes, and mobile dunes, resulting in a total of nine large plots measuring 30 m × 100 m. Within each large plot, 30 subplots measuring 10 m × 10 m were established using the adjacent grid method, resulting in a total of 270 subplots. Within each small plot, all plant species were individually identified and recorded. Morphological parameters such as shrub height and crown width were measured for each shrub, along with the average height and cover of the herbaceous layer. Additionally, aboveground parts of key species were collected for biomass determination; samples were brought back to the laboratory, oven-dried at 85 °C until reaching a constant mass, followed by weighing procedures. A soil auger was used to gather surface soil samples at a depth of 0–20 cm. At each sampling location, about 500 g of soil was gathered, put in sealed bags, and brought to the lab. Following grinding, air drying, and sieving (2 mm), the samples were used for physicochemical analysis. SWC was determined using the oven-drying method; pH was measured using a potentiometer (soil-to-water ratio of 1:2.5); electrical conductivity (EC) was determined using the conductivity method; and the potassium dichromate external heating method was used to determine SOC. The concentrations of soluble ions (K+, Na+, Mg2+, Cl−) were determined using ion chromatography. The determination of the aforementioned soil physicochemical parameters was conducted in accordance with Soil Agrochemical Analysis [29].
2.3. Diversity Calculations
2.3.1. Taxonomic Diversity Calculations
This study employed two commonly used TD indices, the Gleason abundance index (D) and the Shannon–Weiner diversity index (H’), which are calculated as follows:
where S represents the number of species, A represents the survey area, Pi represents the proportion of individuals of species i among all individuals, Ni denotes the individual count for species i, and N is defined as the cumulative abundance integrating all species within the community.
2.3.2. Functional Diversity Calculations
Functional evenness (FEve) is calculated using the method proposed by Villéger et al. [30]. Functional dissimilarity (FDis) and Rao’s second-order entropy (Rao) are calculated using the distance framework developed by Laliberté & Legendre [31]:
where S represents the number of species, PEWb represents the locally weighted average evenness, EWb represents the weighted average evenness, wi denotes the proportional representation of species i, whereas dij quantifies the Euclidean separation between species i and species j within the trait space.
where c denotes the weighted centroid of the community; wj refers to the proportional abundance associated with species j; xik corresponds to the measured value of trait k for species i; and zj quantifies the weighted distance separating species j from the centroid c.
where S denotes the total species count within the assemblage; dij quantifies the Euclidean distance separating species i from species j; and wi and wj correspond to the proportional abundances of species i and j, respectively.
2.3.3. Phylogenetic Diversity Calculations
The PD index is measured using the Net Relatedness Index (NRI) and the Nearest Taxon Index (NTI) [32].
where NRIsample, NTIsample, MPDsample, and MNTDsample are calculated from actual observed values; MPDrandsample and MNTDrandsample represent the averages obtained after randomly combining all species at the ends of the phylogenetic tree 999 times; and sd denotes the standard deviation. If NRI and NTI are significantly greater than 0, the phylogenetic structure exhibits phylogenetic clustering; conversely, if they are significantly less than 0, it exhibits phylogenetic overdispersion; if neither value deviates significantly from 0, the phylogenetic structure is considered random.
2.4. Data Analysis
To compare differences in diversity indices among different dune types, a one-way analysis of variance (ANOVA) followed by Tukey’s HSD post hoc test was performed, with the significance level set at p < 0.05. Additionally, a one-sample t-test was conducted to evaluate whether the mean scores of the Net Relatedness Index (NRI) and the Nearest Taxon Index (NTI) were significantly greater than 0, to characterize the underlying phylogenetic architecture [32].
To visualize the differences in community species composition, non-metric multidimensional scaling (NMDS) ordination was performed based on a Bray–Curtis dissimilarity matrix using the metaMDS function in the vegan package in R [19]. The ordination was deemed acceptable when the stress value was below 0.2. A Shepard diagram was used to assess the goodness-of-fit of the NMDS ordination by comparing the original dissimilarities against the ordination distances. To evaluate whether compositional disparities across distinct dune morphotypes reached statistical significance, a permutational multivariate analysis of variance (PERMANOVA) was performed based on a Bray–Curtis dissimilarity matrix using the adonis2 function in the vegan package in R, with 999 permutations. The envfit function was used to project environmental vectors onto the NMDS ordination space. The significance of each environmental factor was assessed using a permutation test (999 permutations), and the goodness-of-fit was quantified by the correlation coefficient (R2).
Redundancy analysis (RDA) was conducted to identify soil environmental factors that significantly influence plant diversity [27]. Following the data preprocessing guidelines of Le Bagousse-Pinguet et al. [33], only non-pH environmental factors were Z-score standardized prior to analysis; variables with VIF > 10 were excluded to address multicollinearity; significant environmental factors were selected based on 999 Monte Carlo permutation tests (p < 0.05) [27].
To partition the proportional contributions of various environmental factors and components of plant diversity to TD, we further employed the boosted regression tree (BRT) model. BRT is an ensemble learning method that iteratively generates multiple regression trees and continuously fits the residuals of the previous tree, enabling effective handling of nonlinear relationships and interactions among variables [34]. In R, the BRT model was constructed using the “gbm” and “dismo” packages with the following parameter settings: tree complexity set to 3 to allow for the modeling of interactions among multiple variables; learning rate set to 0.005; and random subsampling rate set to 0.5. The optimal number of iterative trees was automatically determined via 10-fold cross-validation. The model outputs the relative influence (%) of each predictor variable, which is used to measure the strength of each factor’s ability to explain diversity variation.
Finally, structural equation modeling (SEM) was used to analyze both direct and indirect pathways through which environmental variables influence diversity patterns [21]. Model fit was assessed using the two-index strategy proposed previously [35], where a Comparative Fit Index (CFI) ≥ 0.95 and a Standardized Root Mean Square Residual (SRMR) ≤ 0.08 were considered acceptable. The χ2/df ratio was not used as a mandatory criterion but only as a supplementary reference. The significance of path coefficients was tested using the bootstrap method (1000 repetitions).
The above statistical analyses were performed in R 4.2.1, Canoco 5, and SPSS 26.0.
3. Results
3.1. Characteristics of Taxonomic, Functional, and Phylogenetic Diversity in Dune Plants
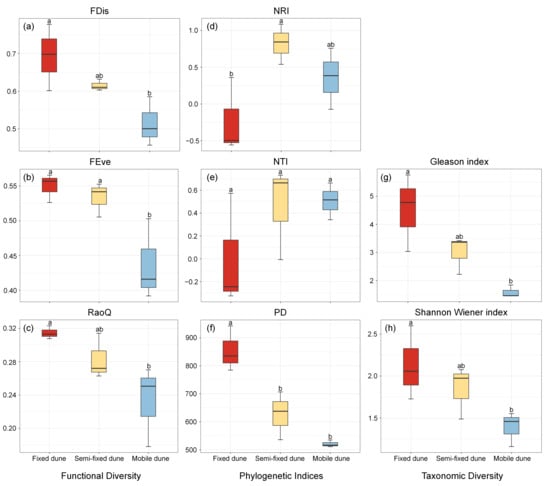
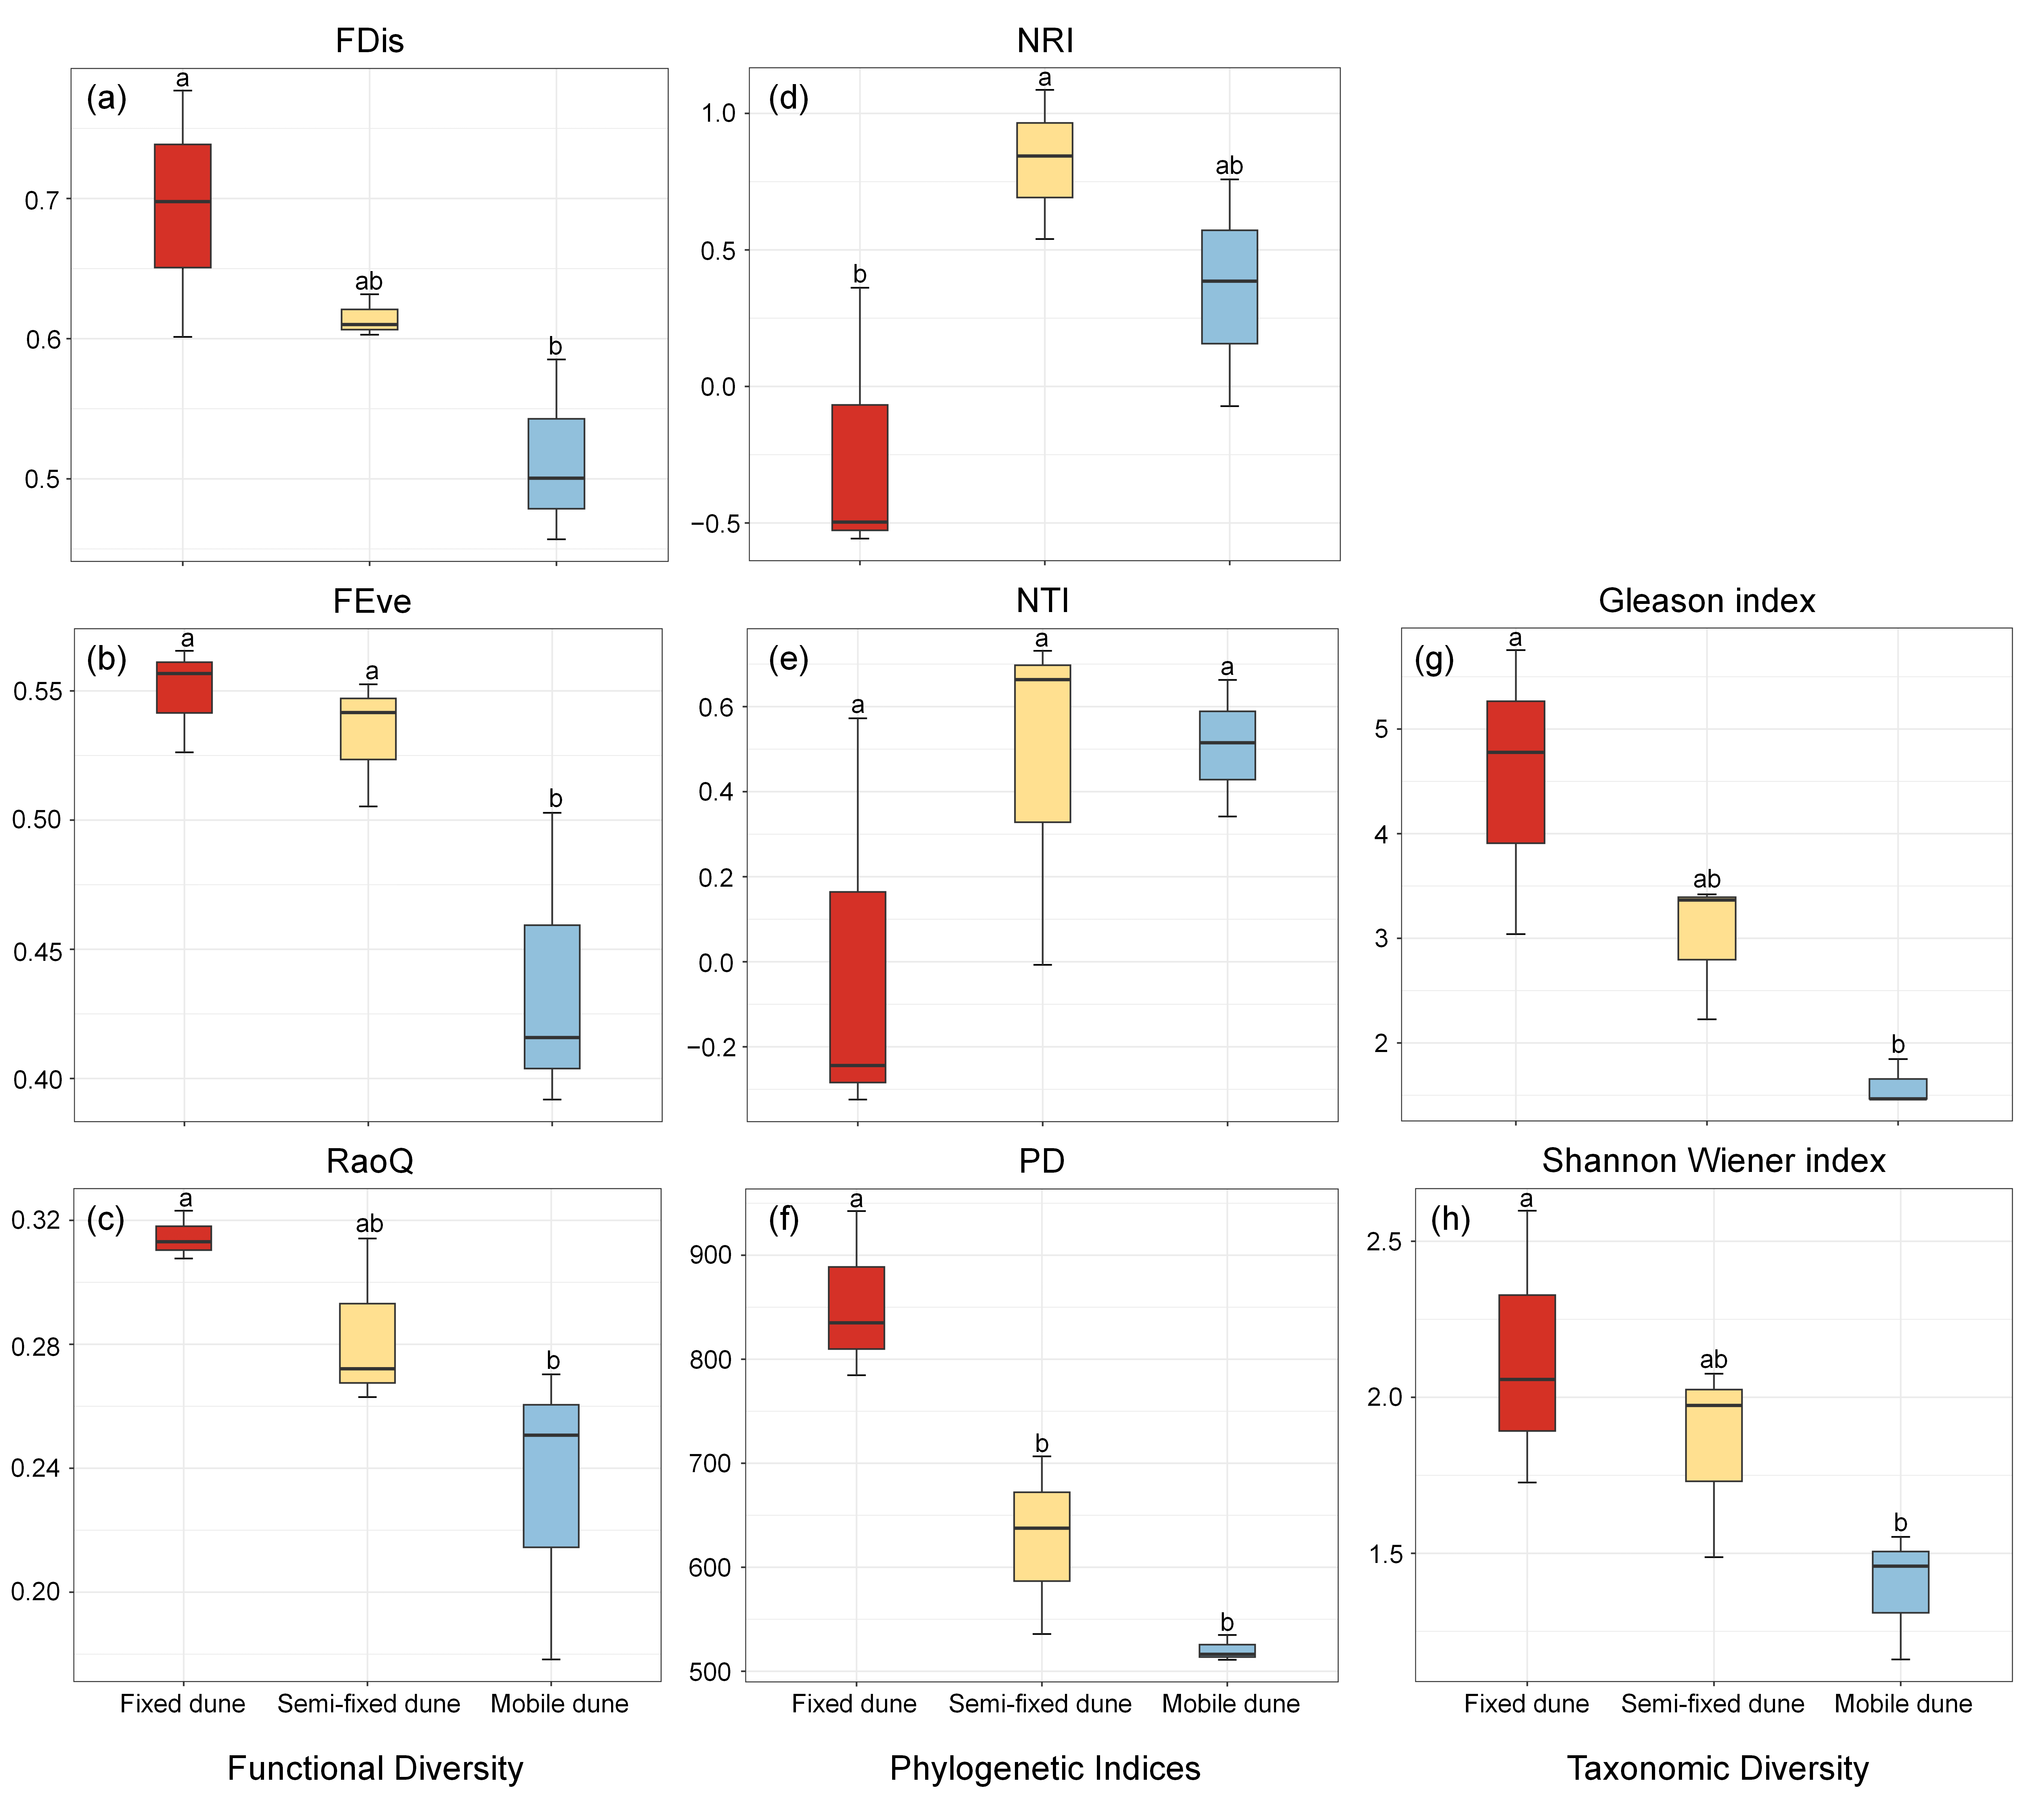
TD, FD, and PD all showed a significant decreasing trend along the dune stability gradient (fixed → semi-fixed → mobile) (Figure 2a–c,f–h). For FD indices, FDis and the RaoQ index both exhibited a gradual decline from fixed to mobile dunes, whereas FEve remained relatively stable in fixed and semi-fixed dunes but decreased significantly in mobile dunes (Figure 2a–c). PD also decreased continuously as dune mobility increased, with fixed dune communities exhibiting the highest overall phylogenetic diversity and mobile dunes the lowest (Figure 2f).
Figure 2.
Box plots comparing FD, PD, and TD indices across three dune stabilization stages: fixed dune (red boxes), semi-fixed dune (yellow boxes), and mobile dune (blue boxes). Subplots (a–c) display three FD metrics: FDis, FEve, and RaoQ, respectively. Subplots (d,e) show the phylogenetic community structure indices: NRI and NTI. Subplot (f) represents PD. Subplots (g,h) show TD indicators: Shannon and Gleason indices. Different lowercase letters above individual boxes indicate statistically significant differences among dune types from post hoc multiple comparisons (p < 0.05).
The NRI and NTI indices, which reflect phylogenetic community structure (Figure 2d,e), showed significant differences among the three types of dunes: for fixed dunes, medians of both indices were less than 0, indicating phylogenetic overdispersion; for semi-fixed and mobile dunes, the medians of both NRI and NTI were greater than 0, suggesting a predominance of phylogenetic clustering. Such divergent patterns reveal that community assembly mechanisms differ across different dune habitats.
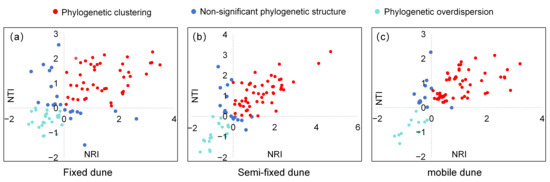
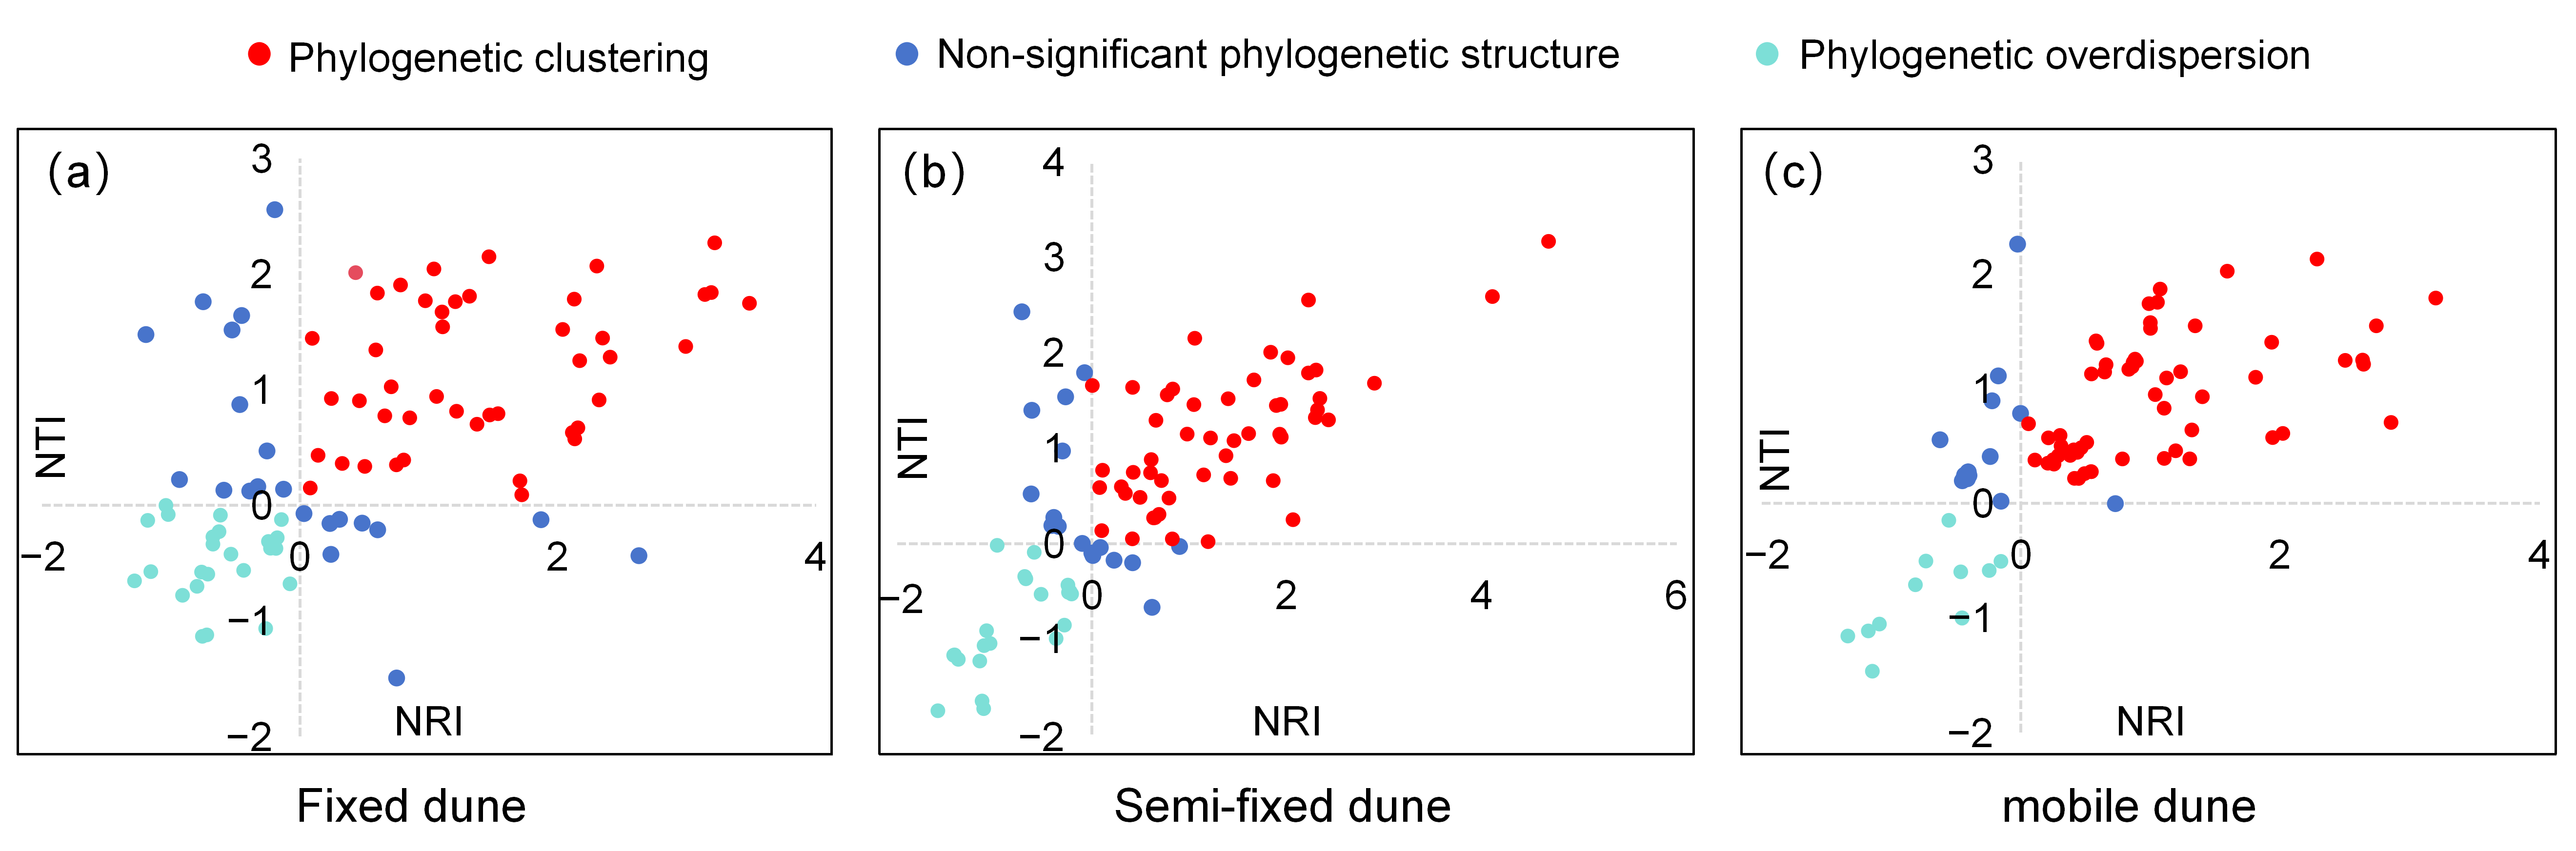
Based on a comprehensive analysis of all sample plots, more than half of the plots (57.8%) exhibited phylogenetic clustering (both NRI and NTI > 0) (Figure 3), while approximately one-fifth of the plots (21.1%) showed phylogenetic overdispersion (both NRI and NTI < 0). t-test results showed that the mean NRI and NTI values for the three types of dune communities were all highly significantly greater than 0 (p < 0.001) (Table 1), indicating that habitat filtering is the dominant driver of plant community assembly in this region.
Figure 3.
Scatter plots of NRI versus NTI for plant communities across three dune types: (a) fixed dune, (b) semi-fixed dune, and (c) mobile dune. Red dots represent plots with significant phylogenetic clustering (NRI > 0, NTI > 0, p < 0.05); light cyan dots indicate plots with significant phylogenetic overdispersion (NRI < 0, NTI < 0, p < 0.05); blue dots denote sampling plots with non-significant phylogenetic community structure (p ≥ 0.05). The dashed zero lines on both axes separate the three types of phylogenetic assembly patterns.
Table 1.
One-sample t-test results of NRI and NTI against a mean value of zero for plant communities on fixed, semi-fixed, and mobile dunes.
3.2. NMDS Ordination of Community Species Composition
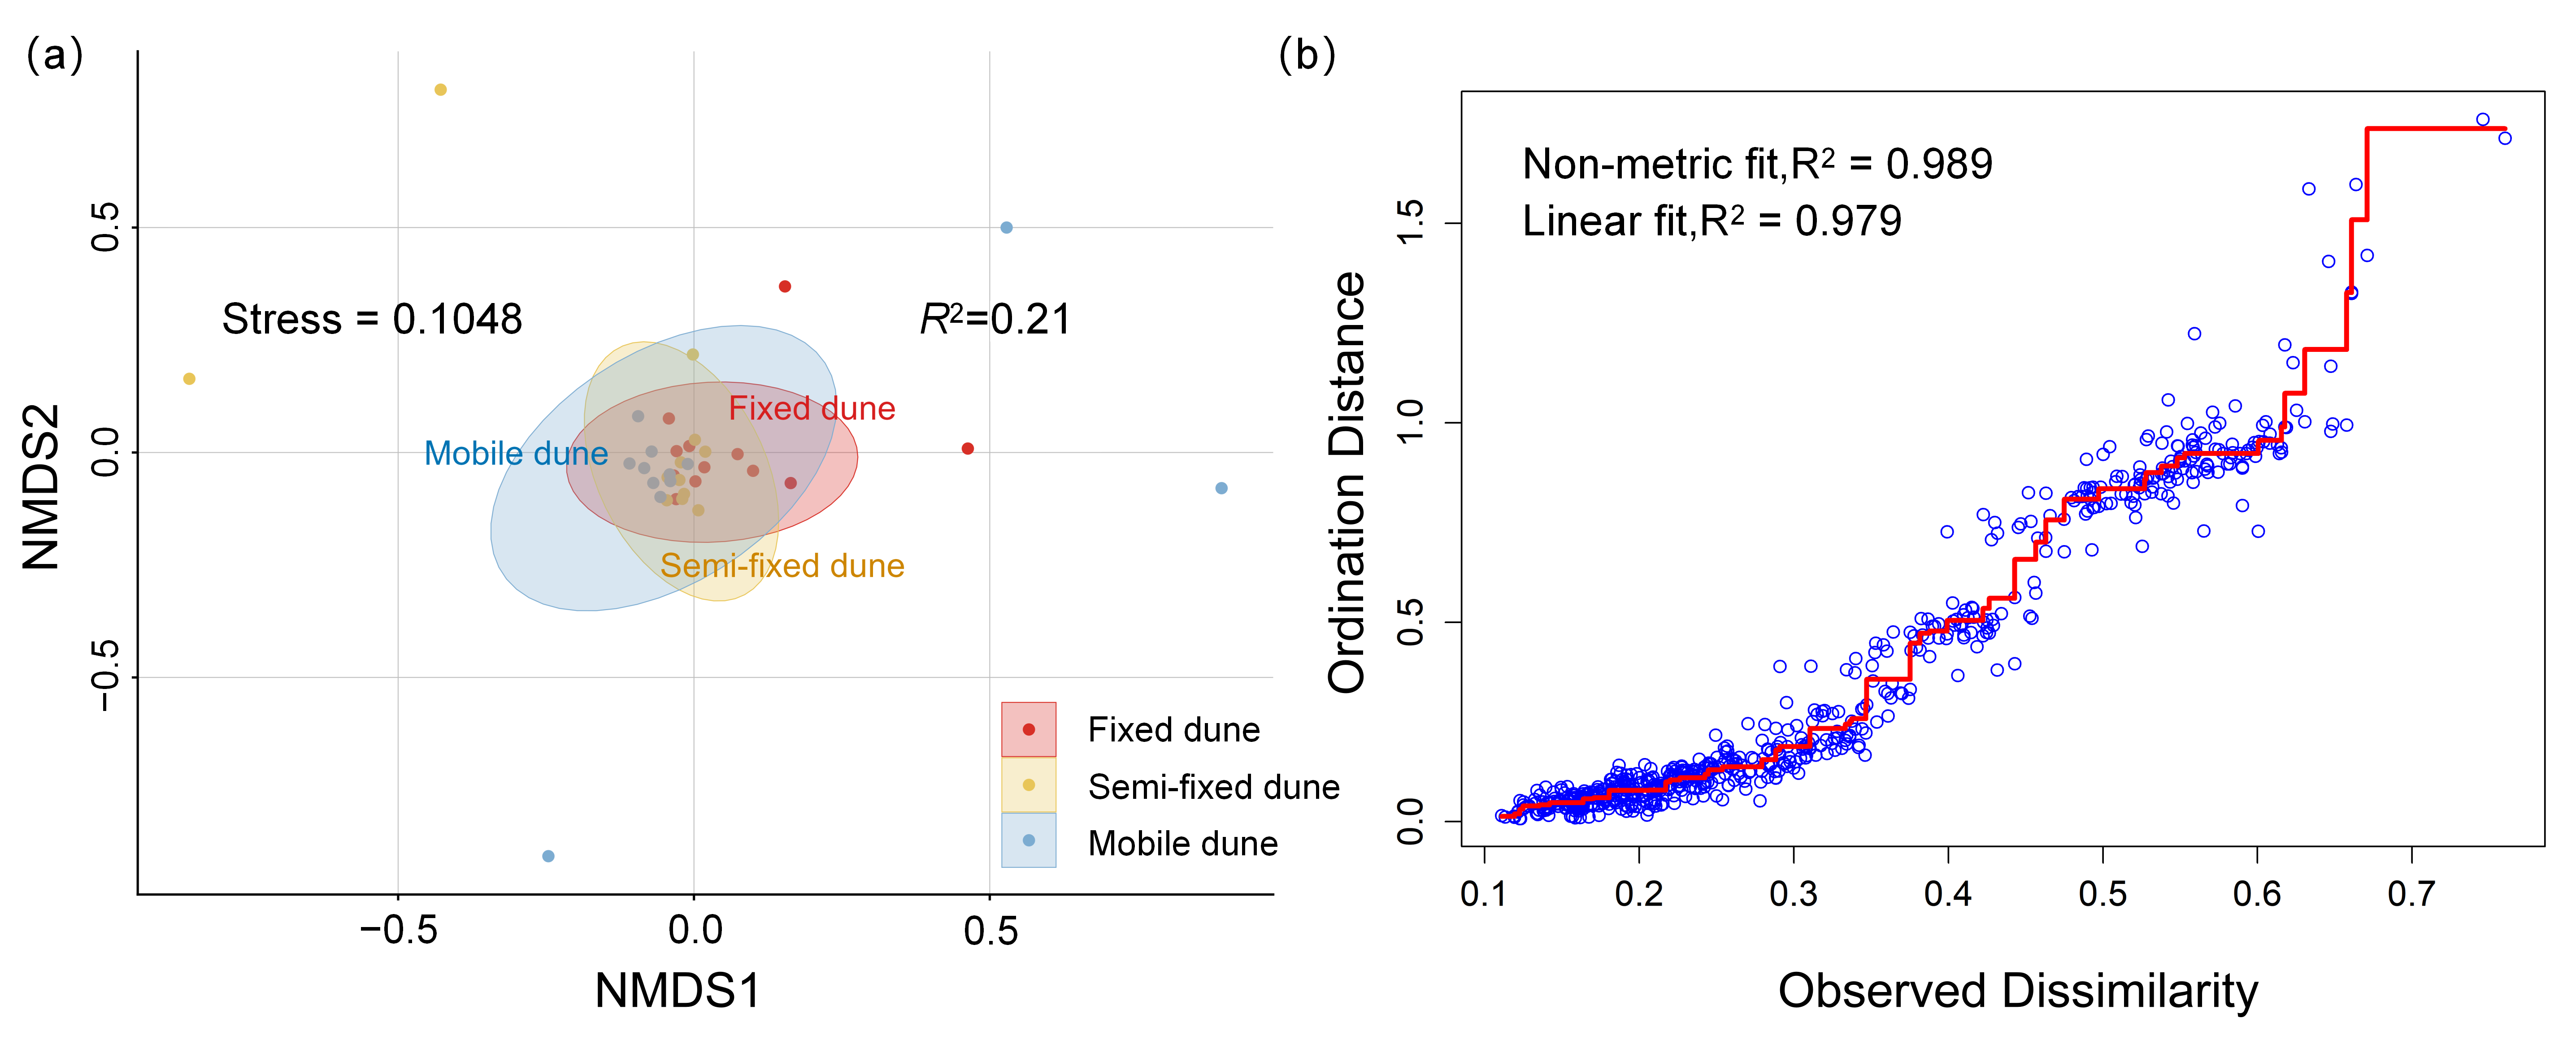
The results of NMDS showed a stress value of 0.1048 (<0.2). The linear regression between observed distances and ordination distances (Shepard plot) yielded a goodness-of-fit (R2) of 0.979, indicating that the ordination results were acceptable (Figure 4). The 95% confidence ellipses for the three sample groups—fixed dunes, semi-fixed dunes, and mobile dunes—overlap extensively, with the community samples generally clustered near the origin, shifting toward the third quadrant. In terms of spatial distribution, the samples from fixed dunes were scattered across all four quadrants, those from semi-fixed dunes were concentrated in quadrants I and III, while the samples from mobile dunes were mostly clustered in quadrant III. These spatial characteristics indicate that the species composition of the three dune community types diverges in response to habitat differences, but the similarity in species composition among the communities remains high.
Figure 4.
NMDS ordination of plant communities across three dune stabilization types and the corresponding stress diagnostic Shepard plot. (a) Two-dimensional NMDS ordination plot based on species dissimilarity matrix; red dots and shaded ellipses = fixed dune, yellow dots and shaded ellipses = semi-fixed dune, blue dots and shaded ellipses = mobile dune. The stress value of the ordination equals 0.1048, and the goodness-of-fit R2 = 0.21. (b) Shepard stress plot illustrating the correlation between observed species dissimilarity (x-axis) and ordination distance (y-axis); the red step curve represents the non-metric monotonic fit (R2 = 0.989). The blue circles represent individual data points of observed species dissimilarity.
The PERMANOVA test based on Bray–Curtis dissimilarity (999 permutations) indicated that there was highly significant compositional divergence in community assemblages among the dune types (R2 = 0.21, p < 0.001).
3.3. Coupling Relationship Between Plant Diversity and Soil Environmental Factors
3.3.1. Screening of Environmental Factors Based on RDA
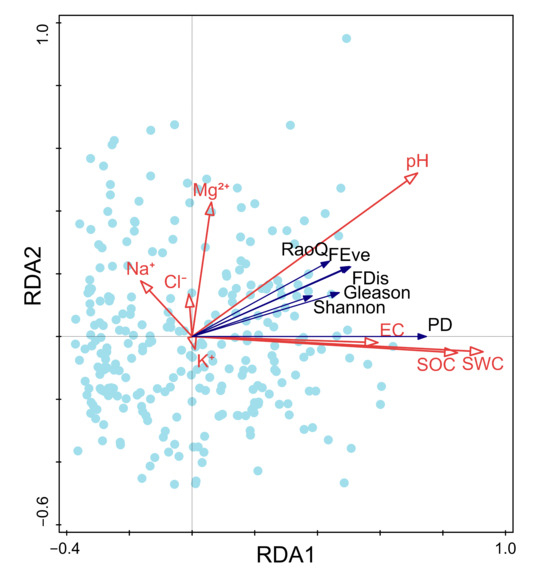
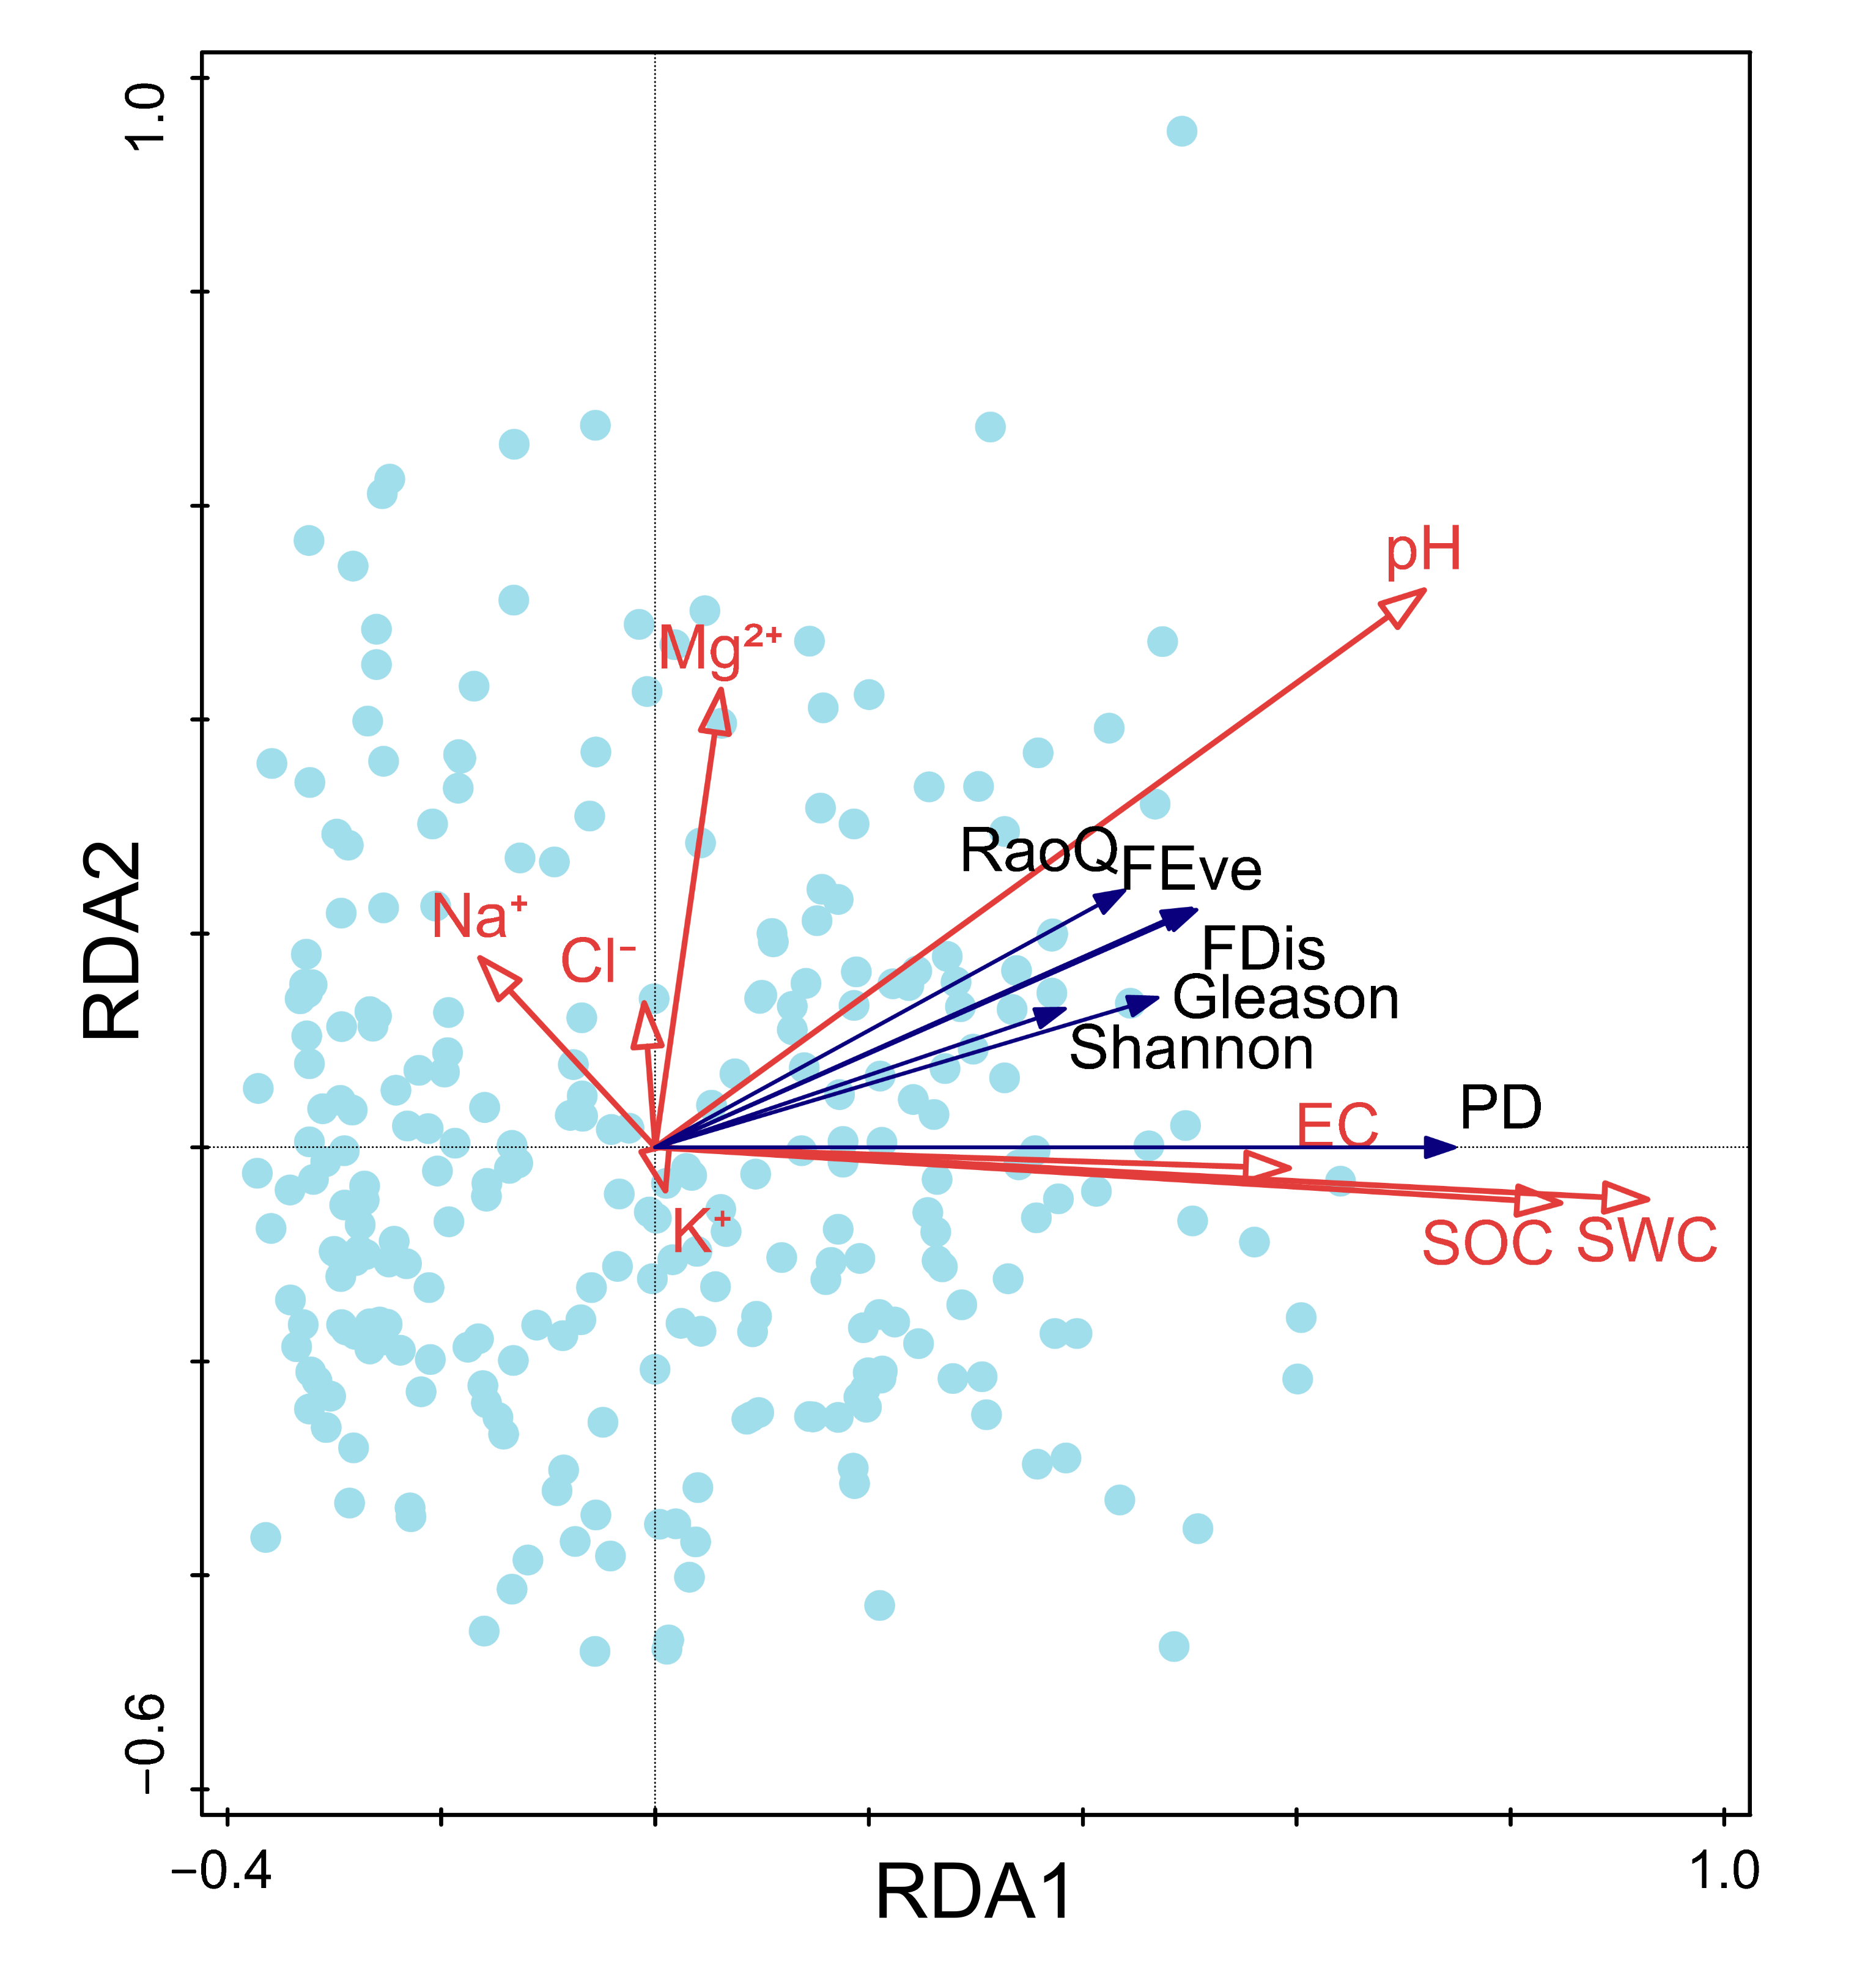
RDA results indicate that SWC and SOC are the dominant factors influencing TD, FD, and PD. Monte Carlo permutation tests revealed that only SWC and SOC significantly influenced multidimensional plant diversity (p < 0.01, Table 2), with these two factors explaining 48.2% and 7.1% of the variance, respectively; pH, EC, and soluble ions, including K+, Na+, Mg2+, and Cl-, did not reach statistical significance (p > 0.05). The RDA plot showed that the directions of the arrows for SWC and SOC were highly convergent with those of the TD, FD, and PD indices, with small angles between them; both were significantly positively correlated with all types of diversity indices. In contrast, the association between these soluble ions and diversity indices was weak (Figure 5).
Table 2.
Variable preselection and correlation analysis between soil variables and RDA ordination axes. Explains % = the proportion of community variation explained by each soil variable; Contribution % = independent explanatory contribution of each variable; pseudo-F = permutation-based F statistic; p = significance value of permutation test.
Figure 5.
RDA biplot illustrating the relationships between soil environmental factors (red arrows) and plant diversity indices (blue arrows) for all sampling plots (light blue dots). RDA1 and RDA2 represent the two canonical axes of the ordination. Soil variables include pH, SWC, SOC, EC, Na+, Cl−, Mg2+ and K+; diversity metrics consist of FD (FDis, FEve, RaoQ), TD (Gleason index, Shannon), and PD.
3.3.2. Structural Equation Modeling (SEM)
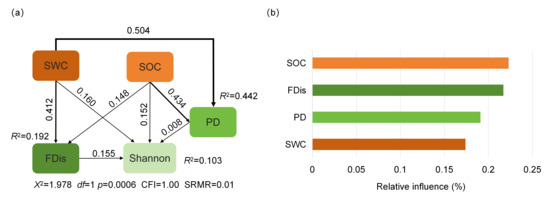
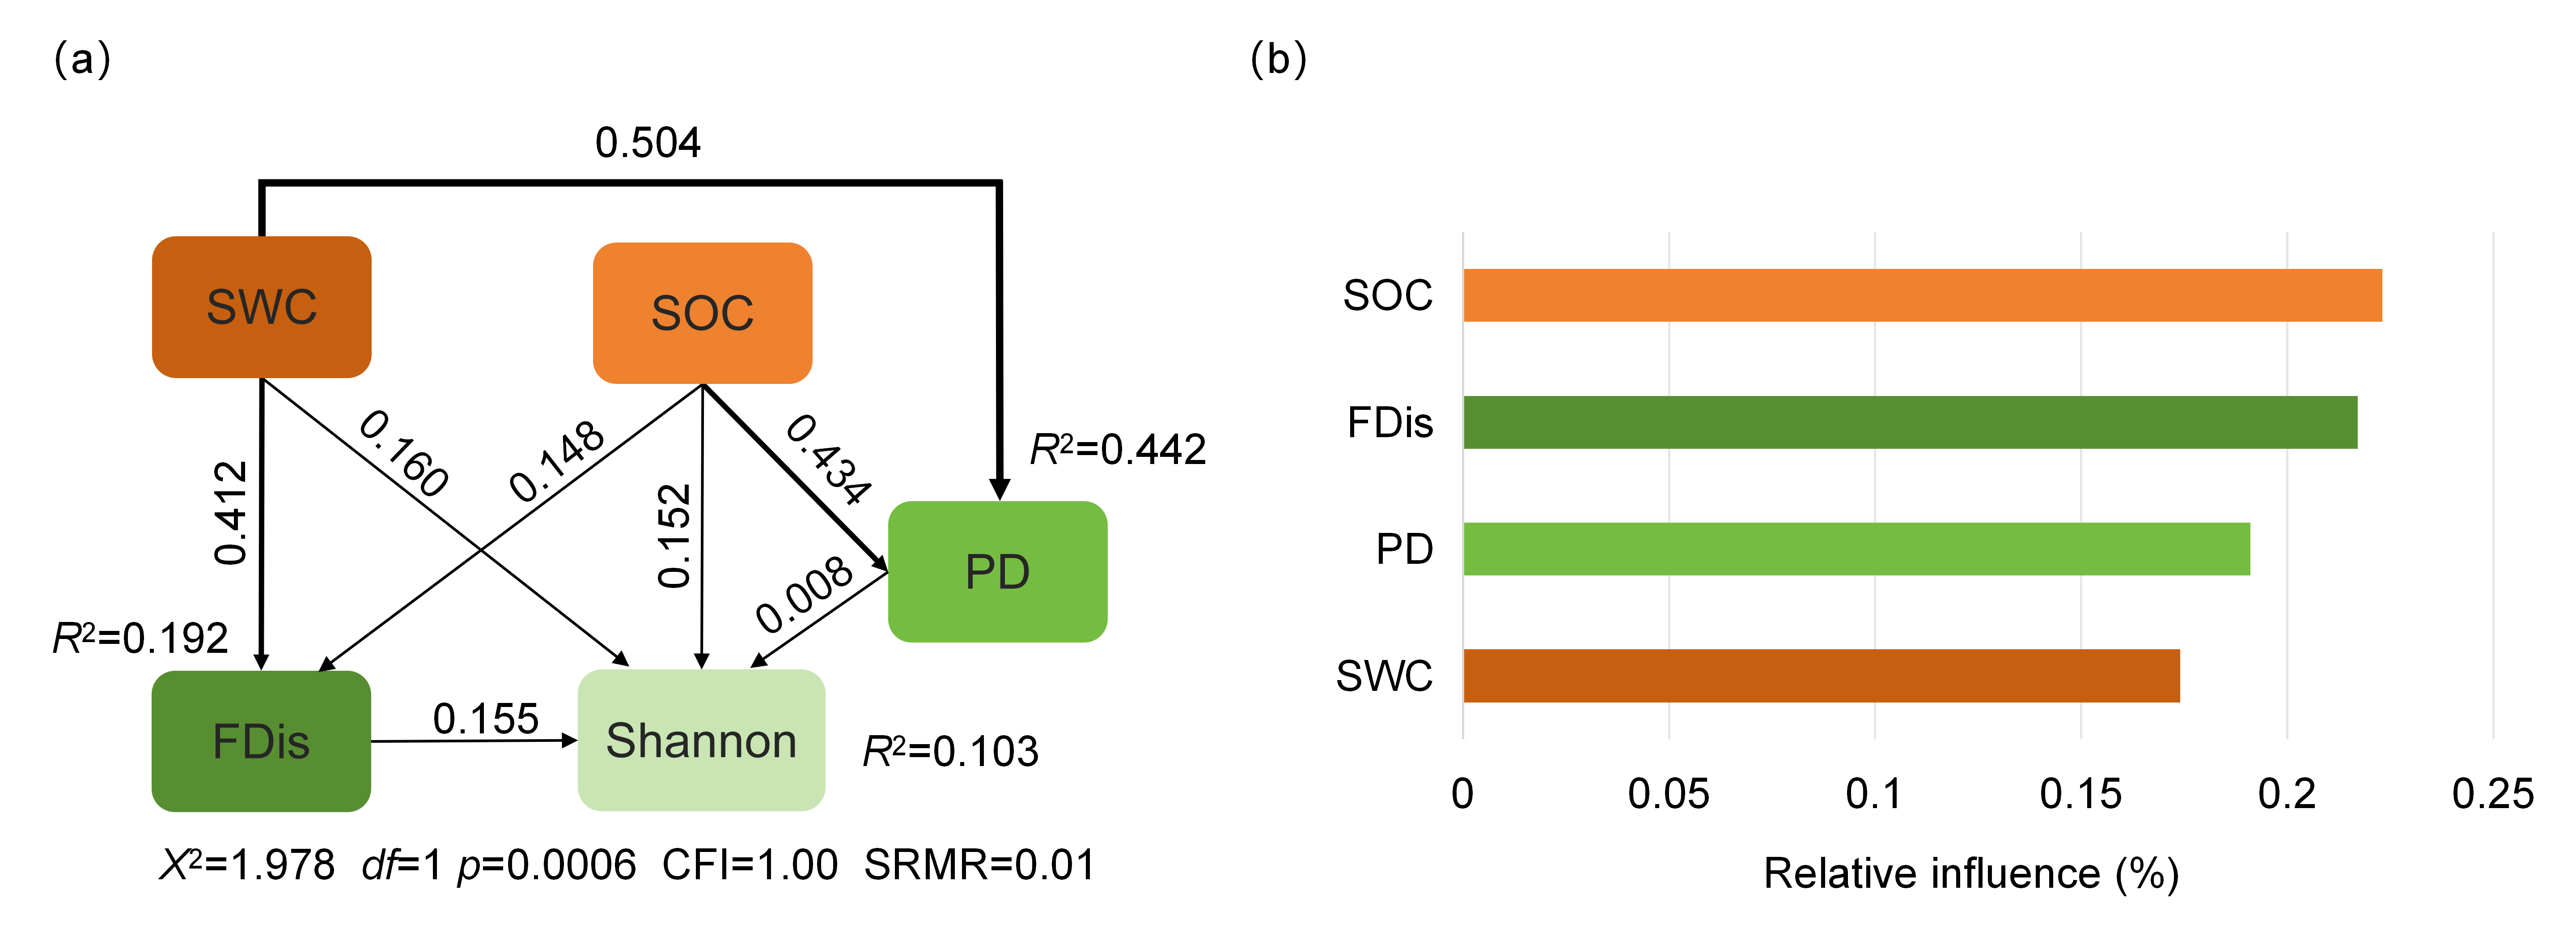
The SEM fit parameters are χ2 = 1.978, df = 1, χ2/df = 1.978, CFI = 1.00, and SRMR = 0.01, indicating an excellent model fit (Figure 6a). Path analysis results indicate that SWC and SOC directly and significantly influence PD and FDis, but their standardized indirect effects on the Shannon index (TD) via PD and FDis are relatively low. The relative contribution rates of variables (Figure 6b) show that SOC and SWC are the primary environmental drivers of community diversity variation, with contribution rates of 22.3% and 17.4%, respectively; the contribution rates of FDis and PD are 21.7% and 19.1%, respectively.
Figure 6.
SEM revealing the direct and indirect effects of SWC and SOC on FDis, Shannon and PD, alongside the relative influence of all predictors. (a) SEM path diagram; values on arrows are standardized path coefficients; R2 beside response boxes denotes explained variance of each diversity metric. Model fit indices at the bottom include χ2, df, p, CFI and SRMR. (b) Horizontal bar plot showing relative influence (%) of each variable on plant diversity. Orange elements represent environmental variables (SWC and SOC); green elements represent plant diversity indices (FDis, Shannon, PD).
4. Discussion
This study found that TD, FD, and PD generally showed a gradual decline across fixed dunes, semi-fixed dunes, and mobile dunes. Diversity indices such as Gleason, Shannon, FDis, and RaoQ all exhibited consistent gradient patterns, indicating that environmental heterogeneity among habitats serves as a key determinant of floristic diversity distribution [8,13]. This is primarily because: fixed dunes have minimal wind and sand activity and surface vegetation cover exceeding 30%, which supports the coexistence of more species and promotes niche differentiation among them [8]; mobile dunes experience intense wind and sand activity and lack soil nutrients; the harsh habitat restricts species settlement and development, leading to increased niche overlap among species and the lowest values for all diversity indices [11]; semi-fixed dunes, as a transitional type, are subject to dual stressors of natural disturbances and human disturbance [36], with diversity indices falling between those of the other two types [13].
PD also follows the trend of fixed > semi-fixed > mobile dunes. Results from NRI and NTI statistical tests showed that overall, the mean NRI and NTI values across all plots were significantly higher than 0 (p < 0.001). More than half of the plot communities exhibit phylogenetic clustering, indicating that habitat filtering is the core factor driving community assembly in this region. These results are in line with those documented by Zhao et al. [8] for the study region. In arid regions, extreme water scarcity and poor soil conditions create strong selective pressures. Only closely related species possessing similar stress-tolerant traits, such as drought and salt tolerance, are able to establish and persist, ultimately resulting in a community-wide pattern of phylogenetic clustering.
In contrast to this overall trend, it is worth noting that communities on fixed dunes generally exhibit phylogenetic overdispersion (median NRI and NTI < 0), whereas those on semi-fixed and mobile dunes exhibit a phylogenetic clustering pattern. These results indicate that the dominant mechanism of community assembly shifts along the dune stability gradient: in semi-fixed and mobile dunes, where environmental stress is more intense, habitat filtering predominates, allowing only closely related species with specific stress-tolerance traits to survive, resulting in phylogenetic clustering; in contrast, in the relatively stable habitats of fixed dunes, resource competition intensifies, and competitive exclusion outweighs habitat filtering, leading to the coexistence of distantly related species that have undergone niche differentiation to reduce competitive intensity, thereby resulting in phylogenetic overdispersion. This shift is consistent with the stress-dominance hypothesis, which posits that the importance of competition declines with increasing environmental stress while habitat filtering becomes more influential [37]. Phylogenetic community assembly theory similarly predicts that habitat filtering acting on phylogenetically conserved traits leads to phylogenetic clustering, whereas competitive exclusion results in phylogenetic overdispersion [32]. Empirical evidence from stressful habitats, such as Brazilian campo rupestre vegetation, supports this pattern, with more severe environments exhibiting higher phylogenetic clustering [37]. Despite this overall pattern, however, a small proportion of plots still exhibit phylogenetic overdispersion, which can be attributed to environmental heterogeneity resulting from local microtopography within the dunes—this heterogeneity introduces a stochastic assembly process driven by niche differentiation or neutral theory, partially offsetting the dominant role of habitat filtering at the local scale. Microhabitat heterogeneity that alters community assembly patterns has been reported in studies of the vegetation of the Gurbantunggut Desert. The Gurbantunggut Desert is China’s largest fixed and semi-fixed desert, where various types of biocrusts (algal, lichen and moss crusts) are widely distributed [38,39]. The distribution of biocrusts varies significantly along the microtopographic gradient of the dunes: along the slope from the dune crest to the base, biocrusts gradually transition from microbial-dominated to algal-dominated, then to lichen-dominated, and finally become moss-dominated in the depressions, with their development gradually increasing in thickness and diversity [38,39]. Because different types of biocrusts exhibit significant differences in soil physicochemical properties [40] and can regulate SWC and nutrient supply [40,41], this microtopography-driven biocrust zonation creates diverse microhabitats that may influence plant community assembly. For example, Zhao et al. [8] found that the increase in dune slope from the base to the crest is accompanied by a gradual decrease in the intensity of habitat filtering; Zang et al. [42] confirmed that microtopographic differences significantly modulate the response of plant communities to drought stress, with marked differences in the sensitivity of community productivity across different slope aspects to extreme drought.
The above studies indicate that microhabitat heterogeneity can indeed reduce the intensity of habitat filtering at the local scale, resulting in a spatially variable habitat filtering effect. Therefore, the phylogenetic overdispersion observed in a few plots in this study may be attributed to the fact that these plots are located at specific sites where microtopography or biocrust types change. In these locations, environmental heterogeneity overrides the dominant role of habitat filtering, thereby allowing phylogenetically more distantly related species to coexist.
The NMDS ordination results indicate that the species compositions of the three dune community types show a high degree of similarity, suggesting frequent species dispersal among the communities. Under the combined influence of long-term wind and sand disturbance and human activities, dune habitats possess the potential for transformation [43]. Regional studies have confirmed that fixed and semi-fixed dunes can develop from mobile dunes [13]. Among these, semi-fixed dunes, as a transitional habitat type between fixed and mobile dunes, exhibit the lowest habitat stability. They are highly susceptible to vegetation degradation and gradually evolve into mobile dunes [36]. This also explains, from the perspective of community composition, the intrinsic reason why the diversity metrics of semi-fixed dunes fall between those of fixed and mobile dunes. This pattern of change is consistent with the trend observed in this study, where PD decreases sequentially from fixed to semi-fixed to mobile dunes [8].
Both RDA and SEM confirmed that SWC and SOC are the key drivers regulating plant diversity in this region. pH and various soluble ions did not play a significant role. SWC and SOC can directly and significantly influence FD and PD; however, their indirect effects on TD are weak, suggesting that species composition is also jointly constrained by dispersal limitation and interspecific competition [9,44]. Related studies on temperate desert ecosystems have also confirmed that the dynamic trade-off between dispersal limitation and habitat filtering is a key process for maintaining plant diversity [45], which is highly consistent with the inferences of this study. However, it should be noted that the relationship between SOC and plant diversity is not unidirectional, but exhibits bidirectional feedback loops. Plant diversity can promote SOC accumulation through litter input, root exudates, and changes in the soil microbial community [46,47]. This positive effect has been widely validated [48] and is particularly pronounced in arid and semiarid regions. In the Gurbantunggut Desert, SOC is a key factor regulating aboveground vegetation diversity [8]; meanwhile, enhanced plant diversity can further boost SOC sequestration by supplying organic matter inputs and reshaping soil microbial assemblages. Due to the cross-sectional design of this study, we are unable to fully clarify the direction of causality between SOC and plant diversity. The analytical framework of this study (RDA/SEM) was designed to test the hypothesis that “soil factors drive diversity,” and the data support this direction; however, we also acknowledge that a feedback relationship between SOC and plant diversity likely exists in this desert ecosystem. Future long-term experiments are needed to further elucidate the bidirectional relationship between soil carbon dynamics and plant community assembly. From the perspective of community assembly theory, habitat filtering that allows the co-occurrence of phylogenetically proximate taxa is the core driver of community clustering in this region—a finding corroborated by Zhao et al. [8], whose study in the same area confirmed that habitat filtering emerges as the dominant mechanism influencing plant community assembly. These outcomes furnish a theoretical basis for differentiated ecological management of the Gurbantunggut Desert based on habitat types.
5. Conclusions
Through systematic vegetation surveys of fixed, semi-fixed, and mobile dunes in the Gurbantunggut Desert, combined with diversity metrics and multivariate statistical methods, this study elucidated the multidimensional diversity characteristics of plant communities, their community assembly mechanisms, and their primary environmental drivers. From fixed to mobile dunes, TD, FD, and PD all exhibited a decreasing trend. The mean values of NRI and NTI for all three dune types were significantly greater than zero, indicating that habitat filtering emerges as the principal in plant community assembly in this region. The NMDS ordination shows that the 95% confidence ellipses of species composition across the three dune types overlap extensively, indicating that although differences in habitat conditions have led to a certain degree of species differentiation, the species compositions among communities remain highly similar. SWC and SOC are the two key factors driving multidimensional diversity, explaining 48.2% and 7.1% of the variance, respectively; soil salinity (EC, soluble ions) and pH had no significant effects. SEM further indicates that SWC and SOC directly and significantly influence FD and PD, and consequently indirectly influence TD, although the indirect effects are weak. These results clarify the key roles of SWC and SOC in maintaining plant diversity in temperate deserts, validate the dominant role of habitat filtering, and establish a theoretical framework for predicting the dynamic responses of plant communities in the Gurbantunggut Desert to environmental changes.
Author Contributions
Conceptualization, Y.Z. and X.L.; methodology, X.L. and L.H.; software, X.L.; validation, G.N., D.W. and P.W.; formal analysis, X.L.; investigation, X.L. and L.H.; resources, G.N.; data curation, X.L. and L.H.; writing—original draft preparation, X.L.; writing—review and editing, X.L.; visualization, X.L.; supervision, Y.Z. and P.W.; project administration, D.W.; funding acquisition, Y.Z. All authors have read and agreed to the published version of the manuscript.
Funding
This research was funded by the Undergraduate Innovation and Entrepreneurship Training Program, grant number X202510762002; the Xinjiang Normal University Young Elite Talent Program, grant number XJNUQB2024-12; and the Xinjiang Uygur Autonomous Region Natural Science Foundation, grant number 2023D01B52.
Institutional Review Board Statement
Not applicable.
Informed Consent Statement
Not applicable.
Data Availability Statement
The original contributions presented in the study are included in the article/. Further inquiries can be directed to the corresponding author.
Conflicts of Interest
The authors declare no conflicts of interest.
References
- Mammola, S.; Carmona, C.P.; Guillerme, T.; Cardoso, P. Concepts and applications in functional diversity. Funct. Ecol. 2021, 35, 1869–1885. [Google Scholar] [CrossRef] [Scilit]
- Schmera, D.; Ricotta, C.; Podani, J. Components of functional diversity revisited: A new classification and its theoretical and practical implications. Ecol. Evol. 2023, 13, e10614. [Google Scholar] [CrossRef] [Scilit] [PubMed]
- Yue, J.; Li, R. Phylogenetic relatedness of woody angiosperm assemblages and its environmental determinants along a subtropical elevational gradient in China. Plant Divers. 2021, 43, 111–116. [Google Scholar] [CrossRef] [Scilit] [PubMed]
- Gross, N.; Maestre, F.T.; Liancourt, P.; Berdugo, M.; Martin, R.; Gozalo, B.; Ochoa, V.; Delgado-Baquerizo, M.; Maire, V.; Saiz, H.; et al. Unforeseen plant phenotypic diversity in a dry and grazed world. Nature 2024, 632, 808–814. [Google Scholar] [CrossRef] [Scilit] [PubMed]
- Li, S.; Gao, G.; Wang, C.; Li, Z.; Feng, X.; Fu, B. Aridity regulates the impacts of multiple dimensional plant diversity on soil properties in the drylands of northern China. Sci. Total Environ. 2024, 946, 174211. [Google Scholar] [CrossRef] [Scilit] [PubMed]
- Yunoki, T. In a niche-neutral continuum, a set of theoretical models in a metacommunity operates simultaneously in patchy habitats. Ecol. Evol. 2023, 13, e9754. [Google Scholar] [CrossRef] [Scilit] [PubMed]
- Baecher, J.A. The environmental filtering paradigm and non-filtering community assembly processes. J. Biogeogr. 2024, 51, 2109–2116. [Google Scholar] [CrossRef] [Scilit]
- Zhao, K.; Zeng, Y.; Wang, Y.; Yang, X.; Wang, P.; Liang, Y.; He, J. Mechanisms for the construction of plant communities in the Gurbantunggut Desert, China. Ecol. Indic. 2023, 154, 110615. [Google Scholar] [CrossRef] [Scilit]
- Hu, D.; Jiang, L.; Zhang, Y.; Qiu, S.; Hou, Z.; Zhang, J.; Lv, G.; Yue, M. The Relative Importance of Environmental Filtering and Dispersal Limitation on the Multidimensional Beta Diversity of Desert Plant Communities Depends on Sampling Scales. J. Soil Sci. Plant Nutr. 2023, 23, 5608–5620. [Google Scholar] [CrossRef] [Scilit]
- Chesson, P. Species coexistence. In Theoretical Ecology: Concepts and Applications; McCann, K.S., Gellner, G., Eds.; Oxford University Press: Oxford, UK, 2020; pp. 5–27. [Google Scholar]
- Carvajal, D.E.; Loayza, A.P.; Squeo, F.A. Functional diversity and spatial association analyses at different spatial scales reveal no changes in community assembly processes along an aridity gradient in the Atacama Desert. Sci. Rep. 2023, 13, 19905. [Google Scholar] [CrossRef] [Scilit] [PubMed]
- Mastrogianni, A.; Kiziridis, D.A.; Chytrý, M.; Kallimanis, A.S.; Tsiripidis, I. Decoupled functional and phylogenetic diversity provide complementary information about community assembly mechanisms: A case study of Greek forests. Acta Oecol. 2023, 120, 103933. [Google Scholar] [CrossRef] [Scilit]
- Zang, Z.; Zeng, Y.; Wang, D.; Shi, F.; Dong, Y.; Liu, N.; Liang, Y. Species-Abundance Distribution Patterns of Plant Communities in the Gurbantünggüt Desert, China. Sustainability 2022, 14, 137251. [Google Scholar] [CrossRef] [Scilit]
- Wu, T.; Wang, X.; Gai, S.; Guo, H.; Chen, M.; Wang, Q.; Quan, Y.; Jin, X. Effect of Grazing in Spring-Summer on Soil Seed Bank and Vegetation in Southern Part of Gurbantunggut Desert. J. Desert Res. 2009, 29, 488–494. [Google Scholar]
- Wang, X.; Zhang, Y.; Jiang, J.; Yang, W.; Chen, M.; Zhang, J.; Chen, J.; Song, C. Influence of Grazing on the Characteristics of Longitudinal Dune Surface in the Southern Part of Gurbantunggut Desert. Acta Geogr. Sin. 2007, 62, 698–706. [Google Scholar]
- Qian, Y.; Zhang, L.; Wu, Z. Destruction and Regeneration of the Desert Vegetation in the Engineering Activities in the Gurbantunggut Desert. Arid Zone Res. 2001, 18, 47–51. [Google Scholar]
- Zhang, L.; Chen, C. On the General Characteristics of Plant Diversity of Gurbantunggut Sandy Desert. Acta Ecol. Sin. 2002, 22, 1923–1932. [Google Scholar]
- Jiang, C.; Wu, L.; An, J. Changes and driving forces of landscape pattern in southern Gurbantunggut Desert during 1998–2016. Chin. J. Ecol. 2018, 37, 3729–3737. [Google Scholar]
- vegan: Community Ecology Package Version 2.7-5. Available online: https://vegandevs.github.io/vegan/ (accessed on 17 June 2026).
- Borcard, D.; Gillet, F.; Legendre, P. Numerical Ecology with R, 2nd ed.; Springer: Cham, Switzerland, 2018. [Google Scholar]
- Grace, J.B. Structural Equation Modeling and Natural Systems; Cambridge University Press: Cambridge, UK, 2006. [Google Scholar]
- He, P.; Ma, J.; Ye, H.; Han, Z.; Ma, X.; Alitengbieke, H.; Shi, M.; Liu, H.; Wang, H.; Sun, Z. Satellite greenness and solar-induced chlorophyll fluorescence reveal reverse desertification in Gurbantunggut Desert. Ecol. Appl. 2022, 33, e2757. [Google Scholar] [CrossRef] [Scilit] [PubMed]
- Liu, Y.; Zeng, Y.; Yang, Y.; Wang, N.; Liang, Y. Competition, spatial pattern, and regeneration of Haloxylon ammodendron and Haloxylon persicum communities in the Gurbantunggut Desert, Northwest China. J. Arid Land 2022, 14, 1138–1158. [Google Scholar] [CrossRef] [Scilit]
- Li, W.; Gao, J.; Mamtimin, A.; Liu, Y.; Wang, Y.; Song, M.; Wen, C.; Aihaiti, A.; Yang, F.; Huo, W.; et al. Parameterization and Remote Sensing Retrieval of Land Surface Processes in the Gurbantunggut Desert, China. Remote Sens. 2023, 15, 2646. [Google Scholar] [CrossRef] [Scilit]
- Qian, Y.; Wu, Z.; Zhao, R.; Zhang, L. Vegetation patterns and species—Environment relationships in the Gurbantunggut Desert of China. J. Geogr. Sci. 2008, 18, 400–414. [Google Scholar] [CrossRef] [Scilit]
- Fukang Site Flux Observation Data (2003–2010). Available online: https://www.chinaflux.org/ (accessed on 17 June 2026).
- Fan, L.L.; Tang, L.S.; Wu, L.F.; Ma, J.; Li, Y.; Güsewell, S. The limited role of snow water in the growth and development of ephemeral plants in a cold desert. J. Veg. Sci. 2013, 25, 681–690. [Google Scholar] [CrossRef] [Scilit]
- Ma, X.; Wu, L.; Liu, D.; Ma, M. Impacts of habitat fragmentation on biological characteristics of Alhagi sparsifolia populations at the southern margin of the Gurbantunggut Desert. Acta Ecol. Sin. 2021, 41, 4935–4941. [Google Scholar] [CrossRef] [Scilit]
- Bao, S.D. Soil Agrochemical Analysis, 3rd ed.; China Agriculture Press: Beijing, China, 2000. [Google Scholar]
- Villéger, S.; Mason, N.W.H.; Mouillot, D. New multidimensional functional diversity indices for a multifaceted framework in functional ecology. Ecology 2008, 89, 2290–2301. [Google Scholar] [CrossRef] [Scilit] [PubMed]
- Laliberté, E.; Legendre, P. A distance-based framework for measuring functional diversity from multiple traits. Ecology 2010, 91, 299–305. [Google Scholar] [CrossRef] [Scilit] [PubMed]
- Webb, C.O.; Ackerly, D.D.; McPeek, M.A.; Donoghue, M.J. Phylogenies and Community Ecology. Annu. Rev. Ecol. Syst. 2002, 33, 475–505. [Google Scholar] [CrossRef] [Scilit]
- Le Bagousse-Pinguet, Y.; Gross, N.; Maestre, F.T.; Maire, V.; de Bello, F.; Fonseca, C.R.; Kattge, J.; Valencia, E.; Leps, J.; Liancourt, P.; et al. Testing the environmental filtering concept in global drylands. J. Ecol. 2017, 105, 1058–1069. [Google Scholar] [CrossRef] [Scilit] [PubMed]
- Elith, J.; Leathwick, J.R.; Hastie, T. A working guide to boosted regression trees. J. Anim. Ecol. 2008, 77, 802–813. [Google Scholar] [CrossRef] [Scilit] [PubMed]
- Hu, L.T.; Bentler, P.M. Cutoff criteria for fit indexes in covariance structure analysis: Conventional criteria versus new alternatives. Struct. Equ. Model. 1999, 6, 1–55. [Google Scholar] [CrossRef] [Scilit]
- Wang, X.; Zhang, Y.; Jiang, J.; Yang, W.; Guo, H.; Hu, Y. Effects of spring–summer grazing on longitudinal dune surface in southern Gurbantunggut Desert. J. Geogr. Sci. 2009, 19, 299–308. [Google Scholar] [CrossRef] [Scilit]
- Miazaki, A.S.; Gastauer, M.; Meira-Neto, J.A.A. Environmental Severity Promotes Phylogenetic Clustering in Campo Rupestre Vegetation. Acta Bot. Bras. 2015, 29, 561–566. [Google Scholar] [CrossRef] [Scilit]
- Zhang, Y.; Pan, H.; Pan, B. Distribution Characteristics of Biological Crust on Sand Dune Surface in Gurbantunggut Desert, Xinjiang. J. Soil Water Conserv. 2004, 18, 61–64. [Google Scholar] [CrossRef] [Scilit]
- Chen, Y.; Li, W.; Zhang, Y.; Zhou, Z.; Liu, J. Ecological and environmental explanation of microbiotic crusts on sand dune scales in the Gurbantonggut Desert, Xinjiang. Prog. Nat. Sci. 2005, 15, 1089–1095. [Google Scholar] [CrossRef] [Scilit]
- Li, B.; Wu, Z.; Tao, Y.; Zhou, X.; Zhang, B. Effects of Biological Soil Crust Type on Herbaceous Diversity in the Gurbantunggut Desert. Arid Zone Res. 2021, 38, 438–447. [Google Scholar]
- Liu, C.; Zhou, X.; Lu, Y.; Zhang, S.; Liu, X.; Zhang, Y.; Zhang, L. Effects of Biological Soil Crusts on Vertical Distribution of Soil Nitrogen Pools in the Gurbantunggut Desert. Acta Ecol. Sin. 2023, 43, 5005–5016. [Google Scholar] [CrossRef] [Scilit]
- Zang, Y.X.; Min, X.J.; Resco de Dios, V.; Ma, J.Y.; Sun, W. Extreme drought affects the productivity, but not the composition, of a desert plant community in Central Asia differentially across microtopographies. Sci. Total Environ. 2020, 717, 137251. [Google Scholar] [CrossRef] [Scilit]
- Yan, N.; Baas, A.C.W. Transformation of parabolic dunes into mobile barchans triggered by environmental change and anthropogenic disturbance. Earth Surf. Process. Landf. 2018, 43, 1001–1018. [Google Scholar] [CrossRef] [Scilit]
- Kang, J.; Niu, Y.; Wang, X. Mechanisms promoting biodiversity in ecosystems. Quant. Biol. 2024, 13, e77. [Google Scholar] [CrossRef] [Scilit] [PubMed]
- Li, S.; Zhao, X.; Liu, Y.; Xu, Y.; Yang, M.; Dong, S. Unraveling community assembly in temperate desert ecosystems: Insights from multi-seasonal surveys along the expressway. Ecosphere 2024, 15, e4923. [Google Scholar] [CrossRef] [Scilit]
- Zhang, J.; Duan, X.; Lan, T.; Surigaoge, S.; Liu, L.; Guo, Z.; Lü, H.; Zhang, W.; Li, L. Research Progress of the Effects of Plant Diversity on Soil Organic Carbon and Its Stability. Chin. J. Plant Ecol. 2024, 48, 1393–1405. [Google Scholar] [CrossRef] [Scilit]
- Liu, H.; Gao, X.; Li, C.; Ma, L.; Siddique, K.H.M.; Zhao, X. Short-Term Plant Mixtures Alter Soil Organic Carbon Components and Microbial Network Characteristics. Eur. J. Soil Biol. 2024, 122, 103650. [Google Scholar] [CrossRef] [Scilit]
- Chen, X.; Chen, H.Y.H.; Chen, C.; Ma, Z.; Searle, E.B.; Yu, Z.; Huang, Z. Effects of Plant Diversity on Soil Carbon in Diverse Ecosystems: A Global Meta-Analysis. Biol. Rev. 2020, 95, 167–183. [Google Scholar] [PubMed]

Disclaimer/Publisher’s Note: The statements, opinions and data contained in all publications are solely those of the individual author(s) and contributor(s) and not of MDPI and/or the editor(s). MDPI and/or the editor(s) disclaim responsibility for any injury to people or property resulting from any ideas, methods, instructions or products referred to in the content. |
© 2026 by the authors. Licensee MDPI, Basel, Switzerland. This article is an open access article distributed under the terms and conditions of the Creative Commons Attribution (CC BY) license.