


Abstract
Climate change threatens the stability of temperate grassland ecosystems in Inner Mongolia, a core part of the Eurasian Steppe, by driving widespread shifts in plant species distributions. Agropyron cristatum (L.) Gaertn., a dominant native perennial herb in Inner Mongolian steppes, is ecologically vital for degraded grassland restoration and forage supply, but its response to future climate change is unclear. Here, we used an optimized MaxEnt model to assess its potential distribution under current and future climate scenarios. We processed 228 initial occurrence records into 112 valid points, selected 11 non-collinear environmental variables, optimized model parameters with the R package ENMeval, and projected distributions for the 2050s and 2100s under CMIP6 SSP2-4.5 and SSP5-8.5 scenarios, while quantifying habitat fragmentation with landscape metrics. We found that annual mean temperature and annual precipitation dominate A. cristatum distribution (total contribution ~87%), with current highly suitable habitats concentrated in central-eastern Inner Mongolia. Future scenarios show stable core suitable habitats with northward and westward shifts, habitat fragmentation will slightly increase. Our findings clarify the climate response of A. cristatum and support its conservation and adaptive grassland management.
1. Introduction
Climate change drives widespread shifts in the spatial distribution of plant species worldwide and poses profound challenges to the structure, function and biodiversity of temperate grassland ecosystems [1,2,3,4]. The Inner Mongolia Autonomous Region hosts the core part of the Eurasian Steppe and acts as a critical ecological barrier for northern China [5]. This region has a pronounced hydrothermal gradient from east to west, and its grassland ecosystems are highly sensitive to climate change [6,7,8]. We focus on A. cristatum in this study, a dominant native perennial herb in Inner Mongolia’s temperate steppes [6,9]. A. cristatum is a cool-season, perennial, tufted grass in the family Poaceae, tribe Triticeae [10], native to the temperate steppes of Eurasia and widely naturalized in North America [11]. Culms are erect, 20–75 cm tall, with linear, often involute leaves 2–5 mm wide [12]. The inflorescence is a flattened, comb-like spike 2–7 cm long, bearing densely packed spikelets with 3–7 florets; glumes and lemmas are pilose, with short awns. This species has strong tolerance to cold, drought and poor soil conditions, and plays irreplaceable roles in degraded grassland restoration, forage supply, and the maintenance of grassland ecosystem stability [13,14]. It also holds valuable genetic resources for forage breeding and grassland ecological improvement [12]. Many previous studies explore the agronomic traits, genetic differentiation and physiological characteristics of A. cristatum, but few studies systematically assess its potential distribution dynamics across the entire Inner Mongolia region under climate change [15] and lack comprehensive analysis of the core environmental drivers that shape the species’ distribution, as well as long-term projections of its habitat pattern changes under different future climate scenarios. These research gaps limit the scientific basis for the long-term protection and rational utilization of A. cristatum germplasm resources. We use the Maximum Entropy (MaxEnt) model as our core simulation tool in this study [16]. We and other researchers widely apply this presence-only niche model in species distribution research, as it delivers stable and high-accuracy predictions even with small sample sizes of occurrence records, and allows us to quantify the contribution of each environmental variable to the species’ distribution [17,18]. These advantages make the model perfectly suitable for our research objectives and dataset [18]. We carry out a systematic assessment of the potential distribution dynamics of A. cristatum in Inner Mongolia under current and future climate conditions [19]. We set the following three core research objectives: (1) we screen the key environmental factors that drive the distribution of A. cristatum in Inner Mongolia; (2) we simulate the potential distribution for A. cristatum under current climate conditions; and (3) we project the distribution dynamics of the species in the middle (2041–2060, 2050s) and end (2081–2100, 2100s) of this century, under the medium emission scenario (SSP2-4.5) and high emission scenario (SSP5-8.5) from the BCC-CSM2-MR global climate model in the Coupled Model Intercomparison Project Phase 6 (CMIP6) [20]. We built the MaxEnt model based on species occurrence records from recent decades and contemporary climate data for 1970–2000 [21]. The model was then projected onto 2050 and 2100 climate scenarios. Despite slight temporal mismatches between occurrence records and baseline climate, climatic niche conservatism permits reliable extrapolation to near-future conditions [22]. We expect our results to fill the research gap of regional-scale climate change response assessment for A. cristatum in Inner Mongolia [6,14]. We also aim to provide solid scientific support for the in situ and ex situ conservation of A. cristatum germplasm resources, the selection of native species for degraded grassland restoration, and the formulation of adaptive management strategies for temperate grassland ecosystems to cope with future climate change [1].
2. Materials and Methods
2.1. Overview of the Study Area
The study area covers the entire territory of Inner Mongolia Autonomous Region, with geographical coordinates of 97°12′–126°04′ E and 37°24′–53°23′ N [23]. The region has a complex terrain, mainly composed of plateaus, mountains, hills, and plains and an average altitude of about 1000 m [24]. The climate type is mainly temperate continental monsoon climate, with long and cold winters, short and warm summers, and concentrated precipitation [25]. Annual precipitation decreases from more than 450 mm in the east to less than 50 mm in the west, and the annual average temperature increases from north to south [26]. This environmental gradient has created a zonal distribution of vegetation from forests, meadow steppes, typical steppes to desert steppes and deserts, providing a natural gradient experimental field for studying the ecological adaptability of A. cristatum [27].
2.2. Acquisition and Preprocessing of Species Distribution Data
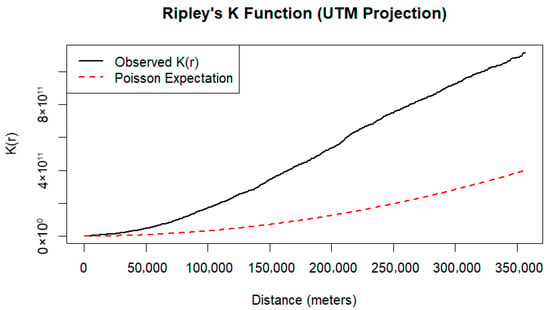
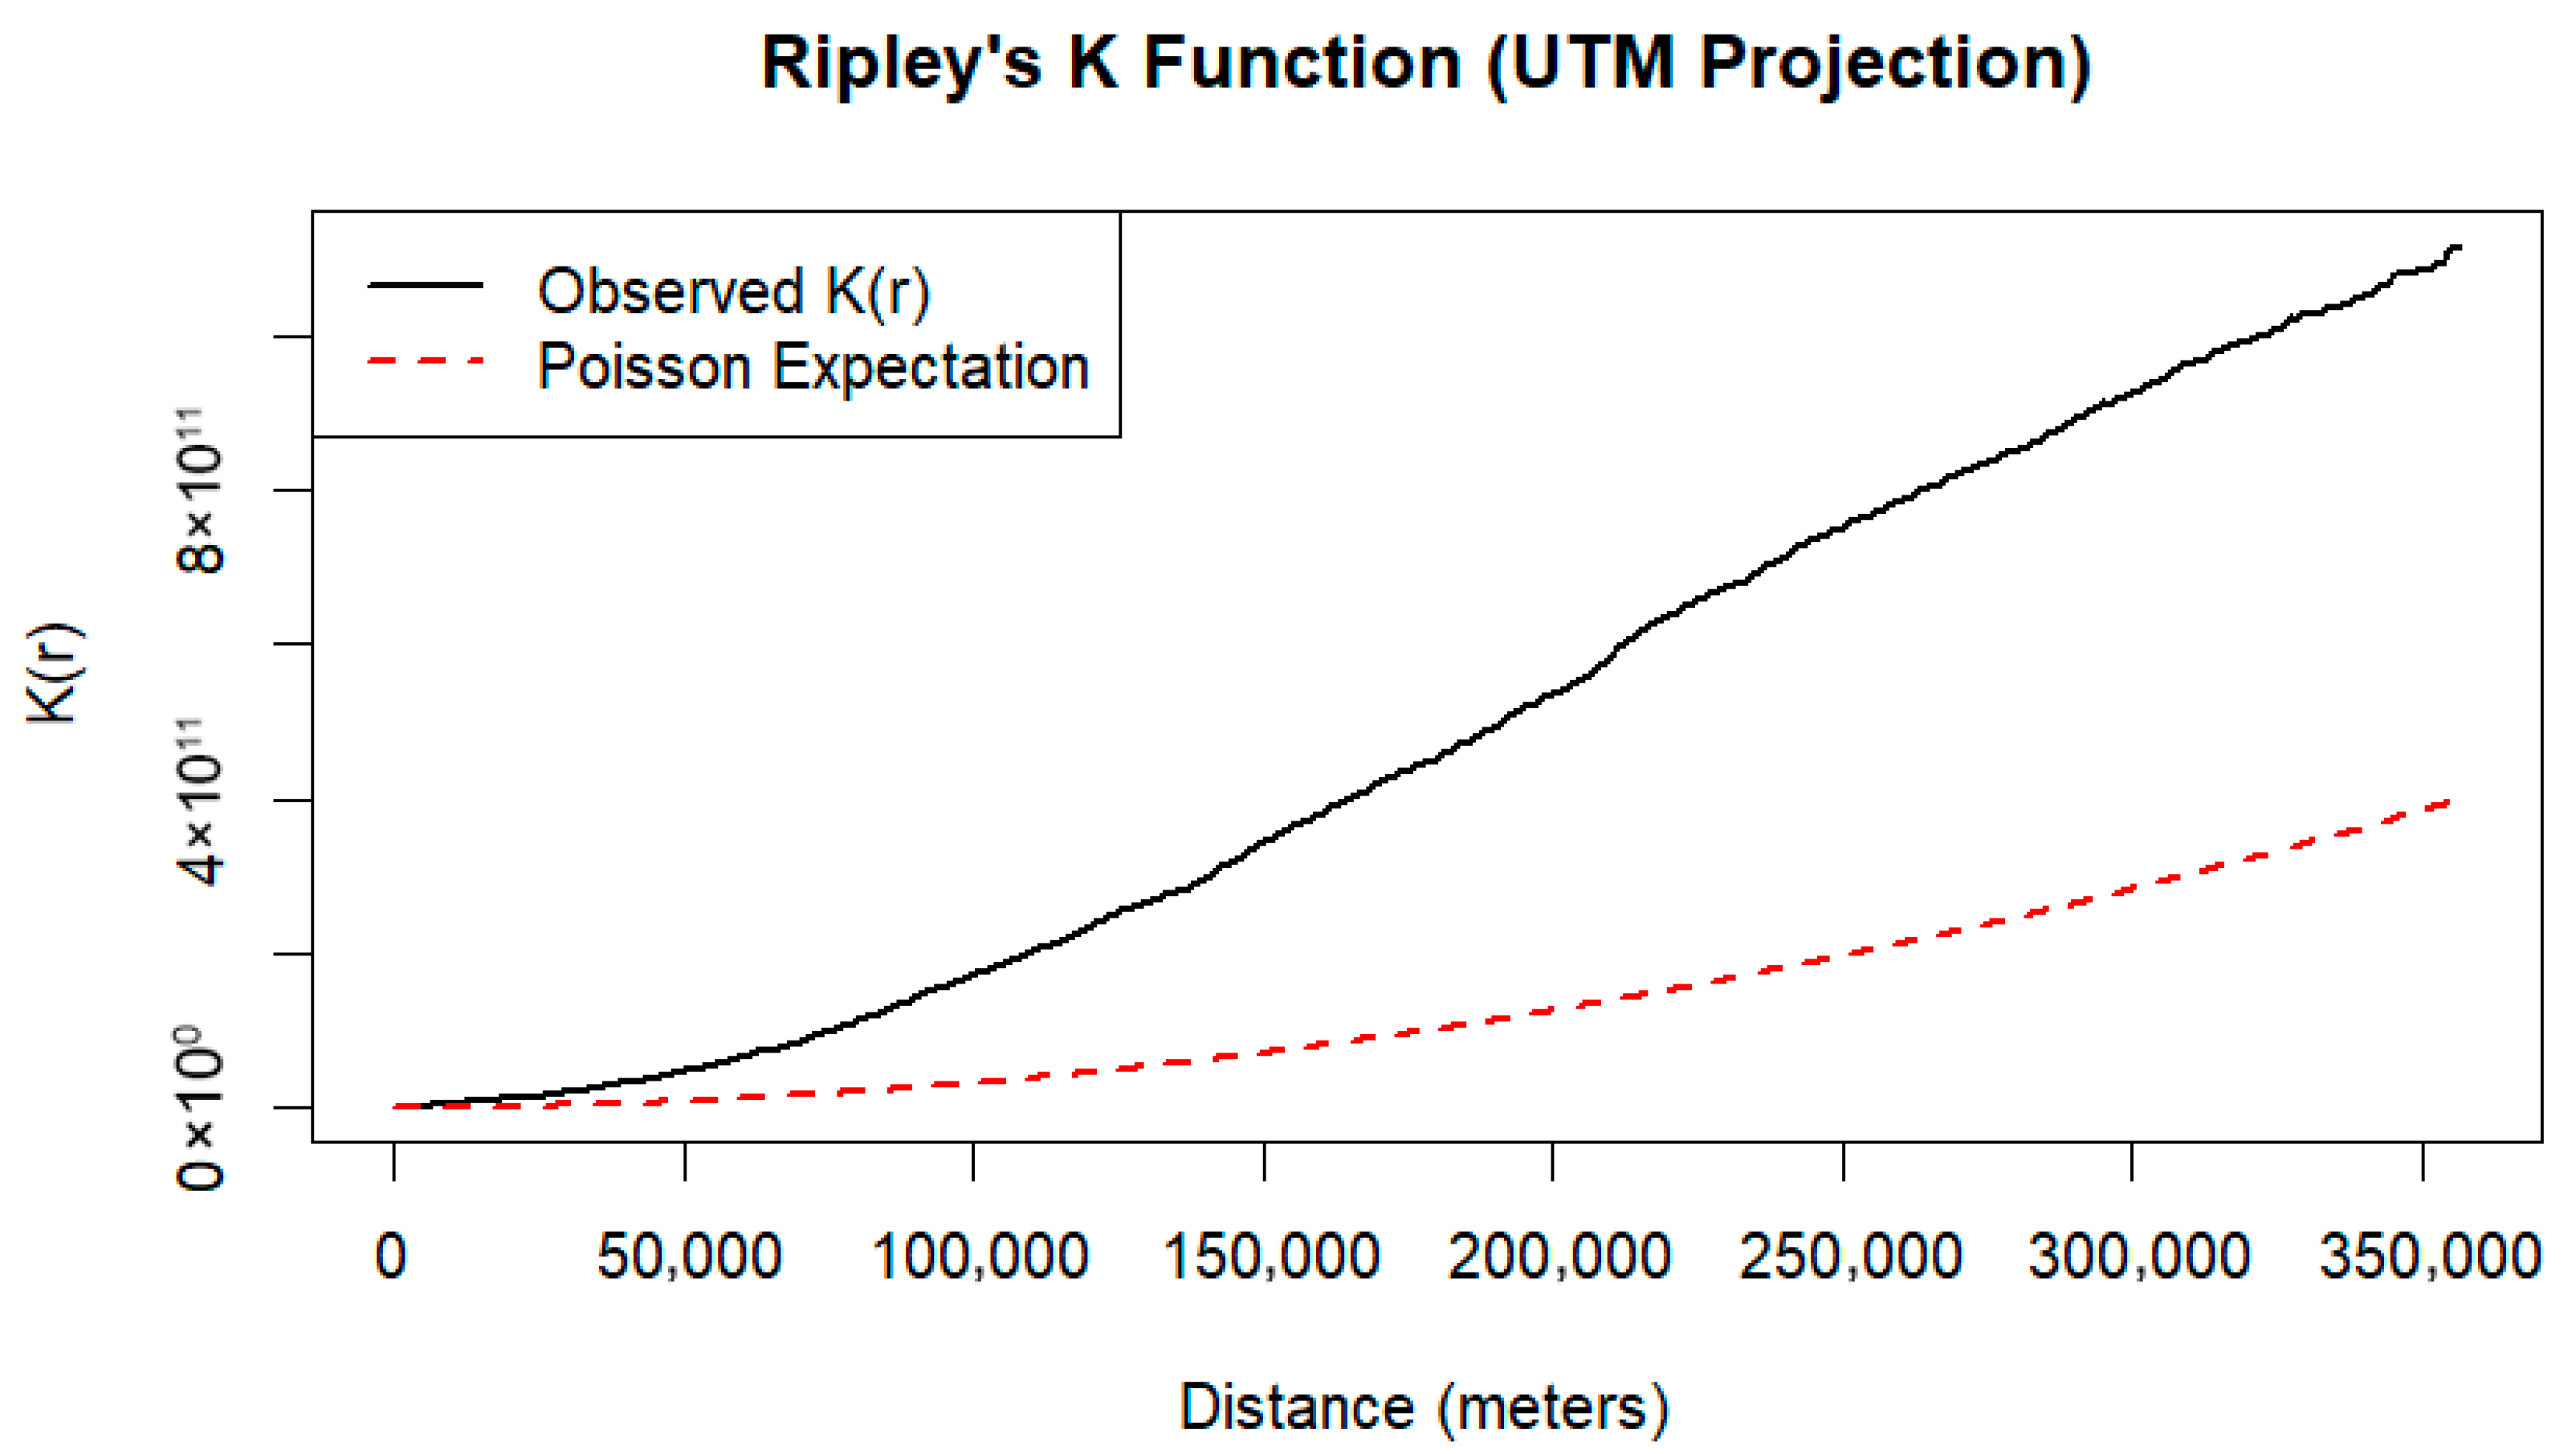
We obtained distribution data of A. cristatum from the Chinese Virtual Herbarium (CVH) and field sampling, and initially collected 236 distribution records [28,29,30]. To ensure data quality, we implemented a strict data cleaning process: we removed duplicate latitude and longitude records, verified whether the coordinates fell within the administrative boundary of Inner Mongolia [31]. We also deleted records with vague descriptions or obviously incorrect coordinates (such as those falling into water bodies or coordinates of 0,0) [32]. Considering that specimen collection often has spatial bias (e.g., over-concentrated around Hohhot or along major highways), direct modeling may lead the model to overfit the environmental characteristics of these areas, thereby reducing the prediction ability for unsampled areas [33]; meanwhile, we evaluated the spatial autocorrelation of A. cristatum occurrence points using the Nearest Neighbor Index (NNI) and Ripley’s K function [34]. We calculated an NNI value of 0.608, indicating a moderate spatial clustering pattern of the occurrence points, and Ripley’s K function analysis further confirmed this trend: the observed K(r) curve remained consistently above the Poisson expectation curve across all spatial scales from 0 to 350 km (Figure 1) [35]. Such multi-scale clustering can cause the MaxEnt (version 3.4.4, Princeton University, Princeton, NJ, USA) model to overfit local habitat characteristics and weaken prediction generalization. We therefore performed moderate spatial thinning on the occurrence points to mitigate the effect of spatial autocorrelation on model performance: we adopted a 5 km × 5 km regular grid for spatial thinning [36], projected the WGS84 coordinates to the UTM 50 N planar coordinate system to ensure the accuracy of distance calculation, and retained only one record closest to the center in each grid cell [37]. This treatment not only reduced spatial autocorrelation but also retained the representativeness of the species in the environmental space [38]. Finally, we used 112 valid distribution points for modeling.
Figure 1.
Ripley’s K function analysis of A. cristatum occurrence points.
2.3. Selection and Processing of Environmental Variables
We obtained the historical bioclimatic variables (19 standard bioclimatic indicators) and altitude data required for this study from the WorldClim v2.1 database (https://www.worldclim.org/) (accessed on 31 December 2025), with a spatial resolution of 2.5 arc-minutes (approximately 5 km) [39]. We selected this 2.5 arc-minute resolution for the following two core reasons: first, it strikes an optimal balance between simulation accuracy and computational efficiency for regional-scale species distribution modeling across Inner Mongolia, effectively capturing the habitat heterogeneity of the study area without inducing model overfitting; second, this resolution is a widely adopted standard in global species distribution model (SDM) studies, ensuring the comparability of our results with relevant published research [40]. We selected the 5 km × 5 km regular grid for spatial thinning of species occurrence points in the preceding data preprocessing step to exactly match the spatial resolution of our environmental predictors [41,42]. This matching grid size reduces the scale mismatch between species distribution records and environmental variables, and further reduces the uncertainty in model simulation [43]. Based on the obtained altitude data, this study further extracted two topographic variables, slope and aspect, using the surface analysis tool on the ArcGIS 10.8.1 (version 10.8.1, Esri, Redlands, CA, USA) platform [44].
We also obtained future climate data from the WorldClim v2.1 database. This dataset is constructed based on the output of the BCC-CSM2-MR global climate model from the Coupled Model Intercomparison Project Phase 6 (CMIP6) and has undergone bias correction to improve the reliability of local climate simulation [45]. To evaluate the response to climate change under different emission scenarios, this study selected the medium emission scenario (SSP2-4.5) and the high emission scenario (SSP5-8.5), and obtained data for the mid-century (2041–2060, 2050s) and the end of the century (2081–2100, 2100s) respectively [46]. The core climate variables include daily minimum temperature, daily maximum temperature, and precipitation, with a spatial resolution of 2.5 arc-minutes [47].
We obtained soil property data, including clay content, organic carbon content (OC), pH value, and sand content (Sand), from the Harmonized World Soil Database via the NASA Earthdata platform (https://www.earthdata.nasa.gov/) [48]. This dataset was jointly developed by the Food and Agriculture Organization of the United Nations (FAO) and the International Institute for Applied Systems Analysis (IIASA), providing high-precision global-scale soil physical and chemical property data, which supports the analysis of ecosystem processes in the study area with key environmental factors (Table 1) [16].
Table 1.
The environment variables.
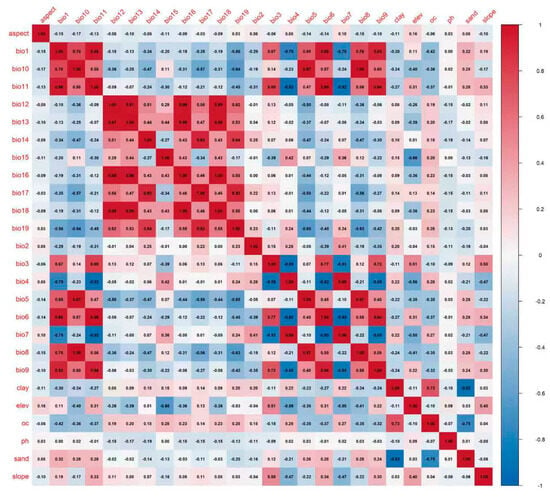
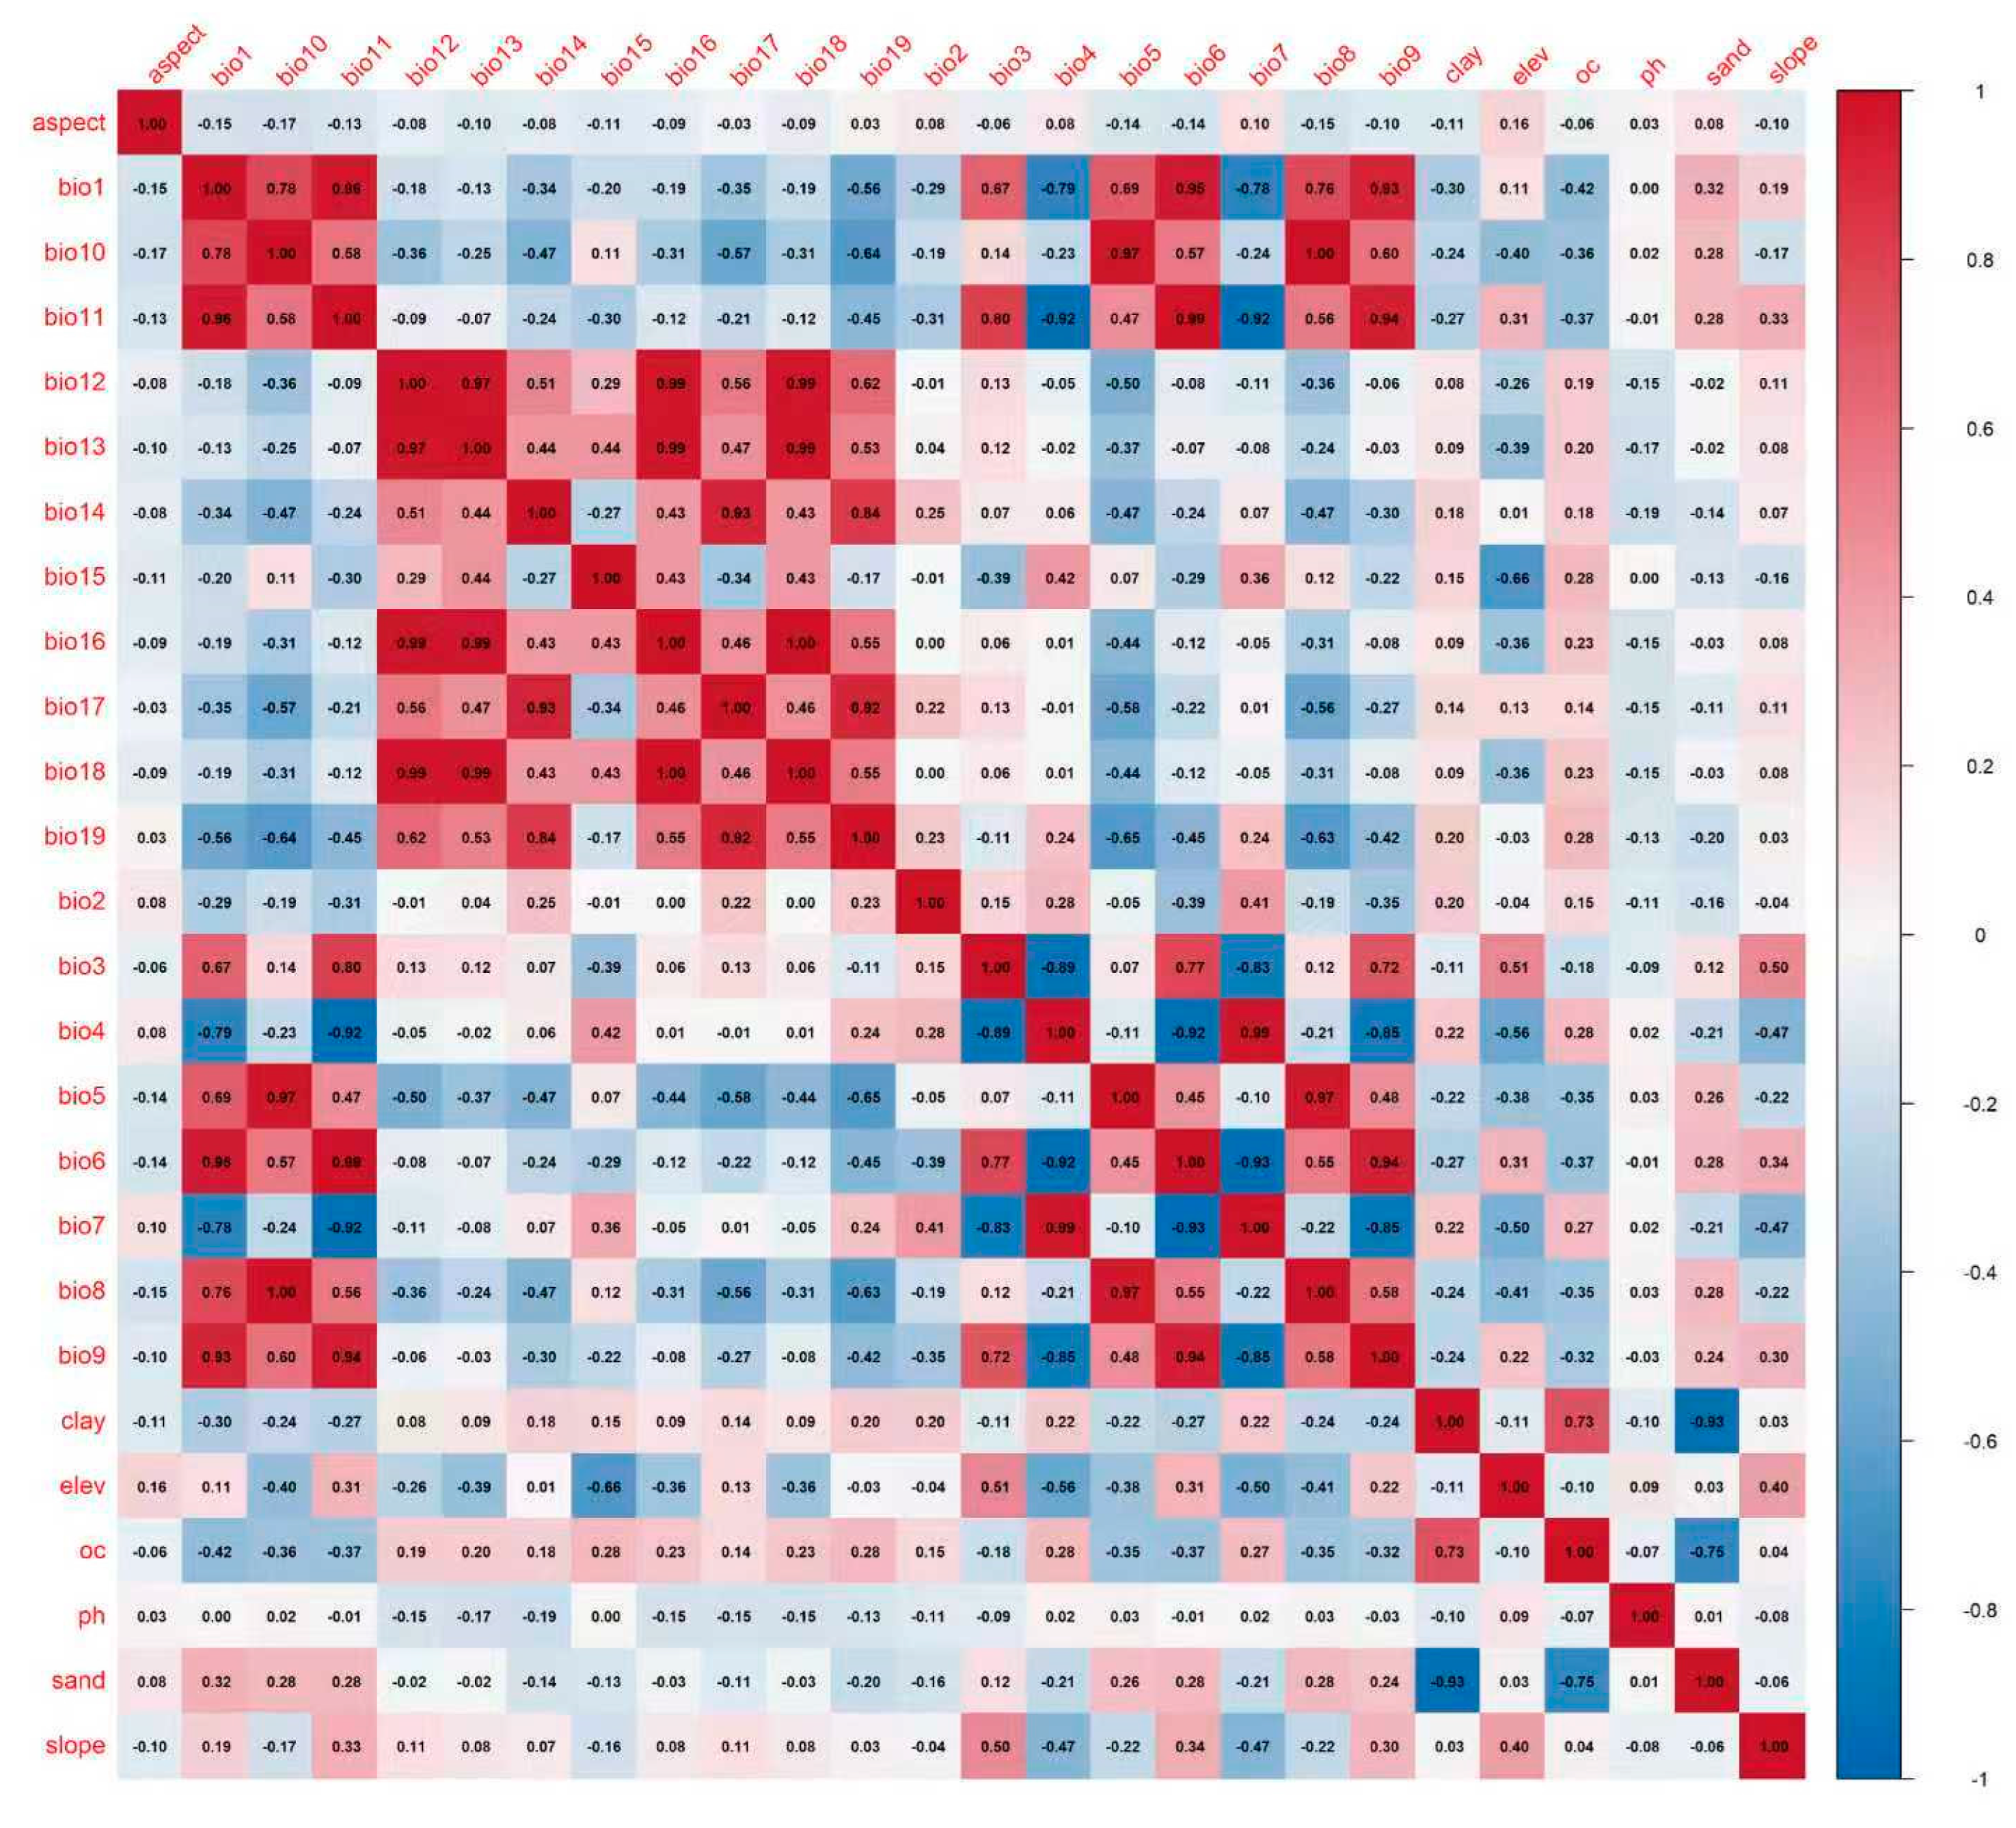
To screen the core environmental variables affecting the potential distribution of A. cristatum and mitigate the interference of multicollinearity among variables on model performance, we constructed a stepwise selection framework of “contribution rate initial screening—correlation elimination—ecological significance correction” [49]. First, we imported the distribution data of A. cristatum and all 26 environmental variables (19 climatic variables, 3 topographic variables, and 4 soil variables) into MaxEnt 3.4.4 software, setting 20% of the data as the test set and 80% as the training set, with other parameters kept as default [28]. Subsequently, we calculated the Pearson correlation coefficient matrix among all environmental variables using R4.5.2 (version 4.5.2, R Foundation for Statistical Computing, Vienna, Austria) and adopted |r| ≥ 0.8 as the threshold for identifying strong multicollinearity (Figure 2) [50]. We followed the core principle of “prioritizing high-contribution variables, removing one from strongly correlated pairs, and supplementing with ecological significance”: for variables with high percent contribution and permutation importance, we prioritized their inclusion in the core variable set; for strongly correlated variable pairs, we removed the one with lower contribution and relatively secondary ecological significance, while retaining the factor that drives A. cristatum distribution more significantly; meanwhile, considering the climatic characteristics of the arid and semi-arid grasslands in Inner Mongolia and the cold- and drought-tolerant ecological traits of A. cristatum, we evaluated the ecological interpretability of variables to avoid the loss of key habitat factors [28]. We also retained variables that play an irreplaceable indicative role in distinguishing the monsoon-dominated eastern grasslands from the westerly affected western deserts [51]. Finally, we selected 11 core environmental variables with no strong multicollinearity for MaxEnt model construction (Table 2) [39,52], including climatic variables (bio1, bio2, bio8, bio12, and bio15), topographic variables (aspect, slope, and elev), and soil variables (clay, pH, and OC).
Figure 2.
Pearson correlation coefficient matrix of all initial environmental variables.
Table 2.
The environmental variables used in this study.
2.4. Model Construction and Parameter Optimization
We constructed the species distribution simulation using MaxEnt version 3.4.4. As a presence-only niche model, MaxEnt is widely used in potential species distribution simulation, climate change response prediction and other research fields, because it only requires species presence data to complete predictions, shows strong adaptability to small sample data, provides stable prediction accuracy, and allows quantifiable contributions of environmental variables [39,40,53]. It is particularly suitable for the scenario where only species presence records are obtained in this study, and the interpretability of its output results can provide reliable support for subsequent analysis [17,54,55]. To avoid model overfitting and improve the transferability of the model under different future climate scenarios, we parameter optimization using the ENMeval package (v2.0.5) in R (version 4.5.2, R Foundation for Statistical Computing, Vienna, Austria) [56,57]. We conducted full-combination tuning of two core MaxEnt parameters to screen the optimal combination: (1) feature classes (fc), including linear (L), linear-quadratic (LQ), linear-quadratic-hinge (LQH), linear-quadratic-hinge-product (LQHP), and linear-quadratic-hinge-product-threshold (LQHPT); (2) regularization multipliers (rm), ranging from 0.5 to 4.0 with 0.5 increments, forming 8 levels [58]. We then selected the optimal model based on the corrected Akaike Information Criterion (AICc), choosing the parameter combination with the minimum AICc value [59]. After tuning, we determined the optimal parameters for the MaxEnt model: feature class LQH and regularization multiplier 2.5 [57]. This regularization multiplier (2.5) effectively smooths the response curve between the species and environmental variables, reduces overfitting to local noise in the training data, makes model predictions more robust, and adapts to the transfer needs of future climate scenarios; the LQH feature combination more accurately simulates the nonlinear relationship between A. cristatum and environmental factors while matching the sample size and avoiding feature redundancy [18,53]. We generated 10,000 random background points across the entire study area (Inner Mongolia Autonomous Region) to characterize the environmental background available to A. cristatum. This setting follows the default configuration of MaxEnt and is a widely adopted standard in species distribution modeling studies [18], ensuring the model adequately learns the contrast between species occurrence environments and the overall regional environmental background [17]. We set the model run number to 10, and reduced the impact of random factors on results through repeated runs to improve the stability of predictions [60]. We validated the model using 10-fold cross-validation. We randomly divided all occurrence points into 10 groups, sequentially used 9 groups as the training set to build the model, and took the remaining 1 group as the test set for accuracy evaluation, and repeated the process 10 times to reduce random errors [18]. Limited by field survey conditions, we did not obtain additional independent occurrence points for external validation, so we used cross-validation results as the basis for evaluating model reliability [18]. To avoid bias caused by a single evaluation metric, we comprehensively assessed model prediction accuracy using the Area Under the Receiver Operating Characteristic Curve (AUC), True Skill Statistic (TSS), and omission rate [36,40]. In addition, the study used the Jackknife test to examine the contribution of each environmental variable to the distribution of A. cristatum, clarifying the core influencing factors; at the same time, the response curves of the species to key environmental variables were drawn to intuitively show the influence law of the gradient change in environmental factors on the potential distribution probability of A. cristatum, and the prediction data output by the model were visualized (Plot Data) to provide intuitive data support for subsequent result analysis and discussion [49,50,61].
2.5. Habitat Suitability Classification and Analysis
To quantify the potential distribution suitability of A. cristatum and intuitively present its spatial distribution characteristics, we conducted subsequent processing and classification analysis on the habitat suitability results output by the MaxEnt 3.4.4 model [52]. First, we imported the ASCII format (.asc) files output by the model into ArcGIS 10.8.1 software, used the raster conversion tool to convert them into raster datasets, and uniformly projected them to the WGS 1984 coordinate system to maintain spatial consistency with the previous climate, terrain, and soil data [62]. We kept the raster spatial resolution at 2.5 arc-min (approximately 5 km) to ensure a unified analysis scale [19]. Subsequently, we classify the continuous logical probability values (0–1) output by the model into different grades using the reclassification tool of ArcGIS, so as to quantify the differences in habitat suitability [63,64,65]. Following the industry convention for species habitat classification and combining the ecological characteristics of A. cristatum (e.g., its adaptability to environmental factors such as temperature, precipitation and soil conditions), we divided the habitat into the following four grades: unsuitable habitat (probability <0.2), low-suitable habitat (probability 0.2–0.4), moderately suitable habitat (probability 0.4–0.6), and highly suitable habitat (probability >0.6) [66]. This threshold setting can effectively balance the sensitivity and specificity of the model, making the classification results more consistent with the actual distribution law of A. cristatum [67]. To accurately calculate the spatial range of each suitability grade, we adopted a standardized ArcGIS workflow to obtain precise area data [18]. First, we confirmed the accurate definition of the projected coordinate system for the classified raster data to ensure spatial reference consistency [68]. Then, we converted the graded raster datasets into vector polygon features using the “Raster to Polygon” tool in ArcGIS. After conversion, we directly opened the attribute table of the generated vector layer, where the software automatically calculates and stores the area of each polygon unit based on the defined coordinate system, eliminating manual calculation errors [69]. This workflow effectively avoids the impact of differences in the actual area of raster cells at different latitudes on the calculation results and ensures the accuracy and reliability of the area data for each habitat suitability grade [70]. Finally, based on the classified raster data, we generated a spatial distribution map of the potential distribution suitability of A. cristatum, which includes basic cartographic elements such as north arrow, scale bar, latitude and longitude grid lines, and grade legend [63]. This ensures the standardization and readability of the map and provides intuitive data support and visualization basis for subsequent spatial pattern analysis of A. cristatum habitats and prediction of distribution dynamics under climate change scenarios [17,71].
3. Results
3.1. Contribution of Environmental Variables and Ecological Thresholds
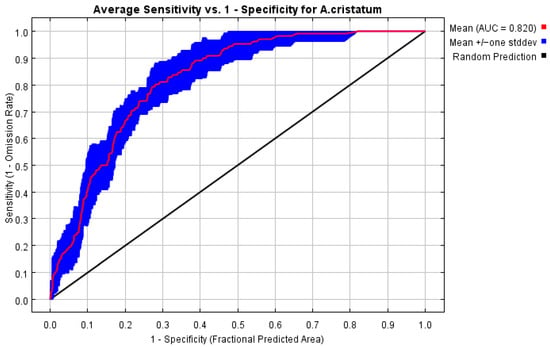
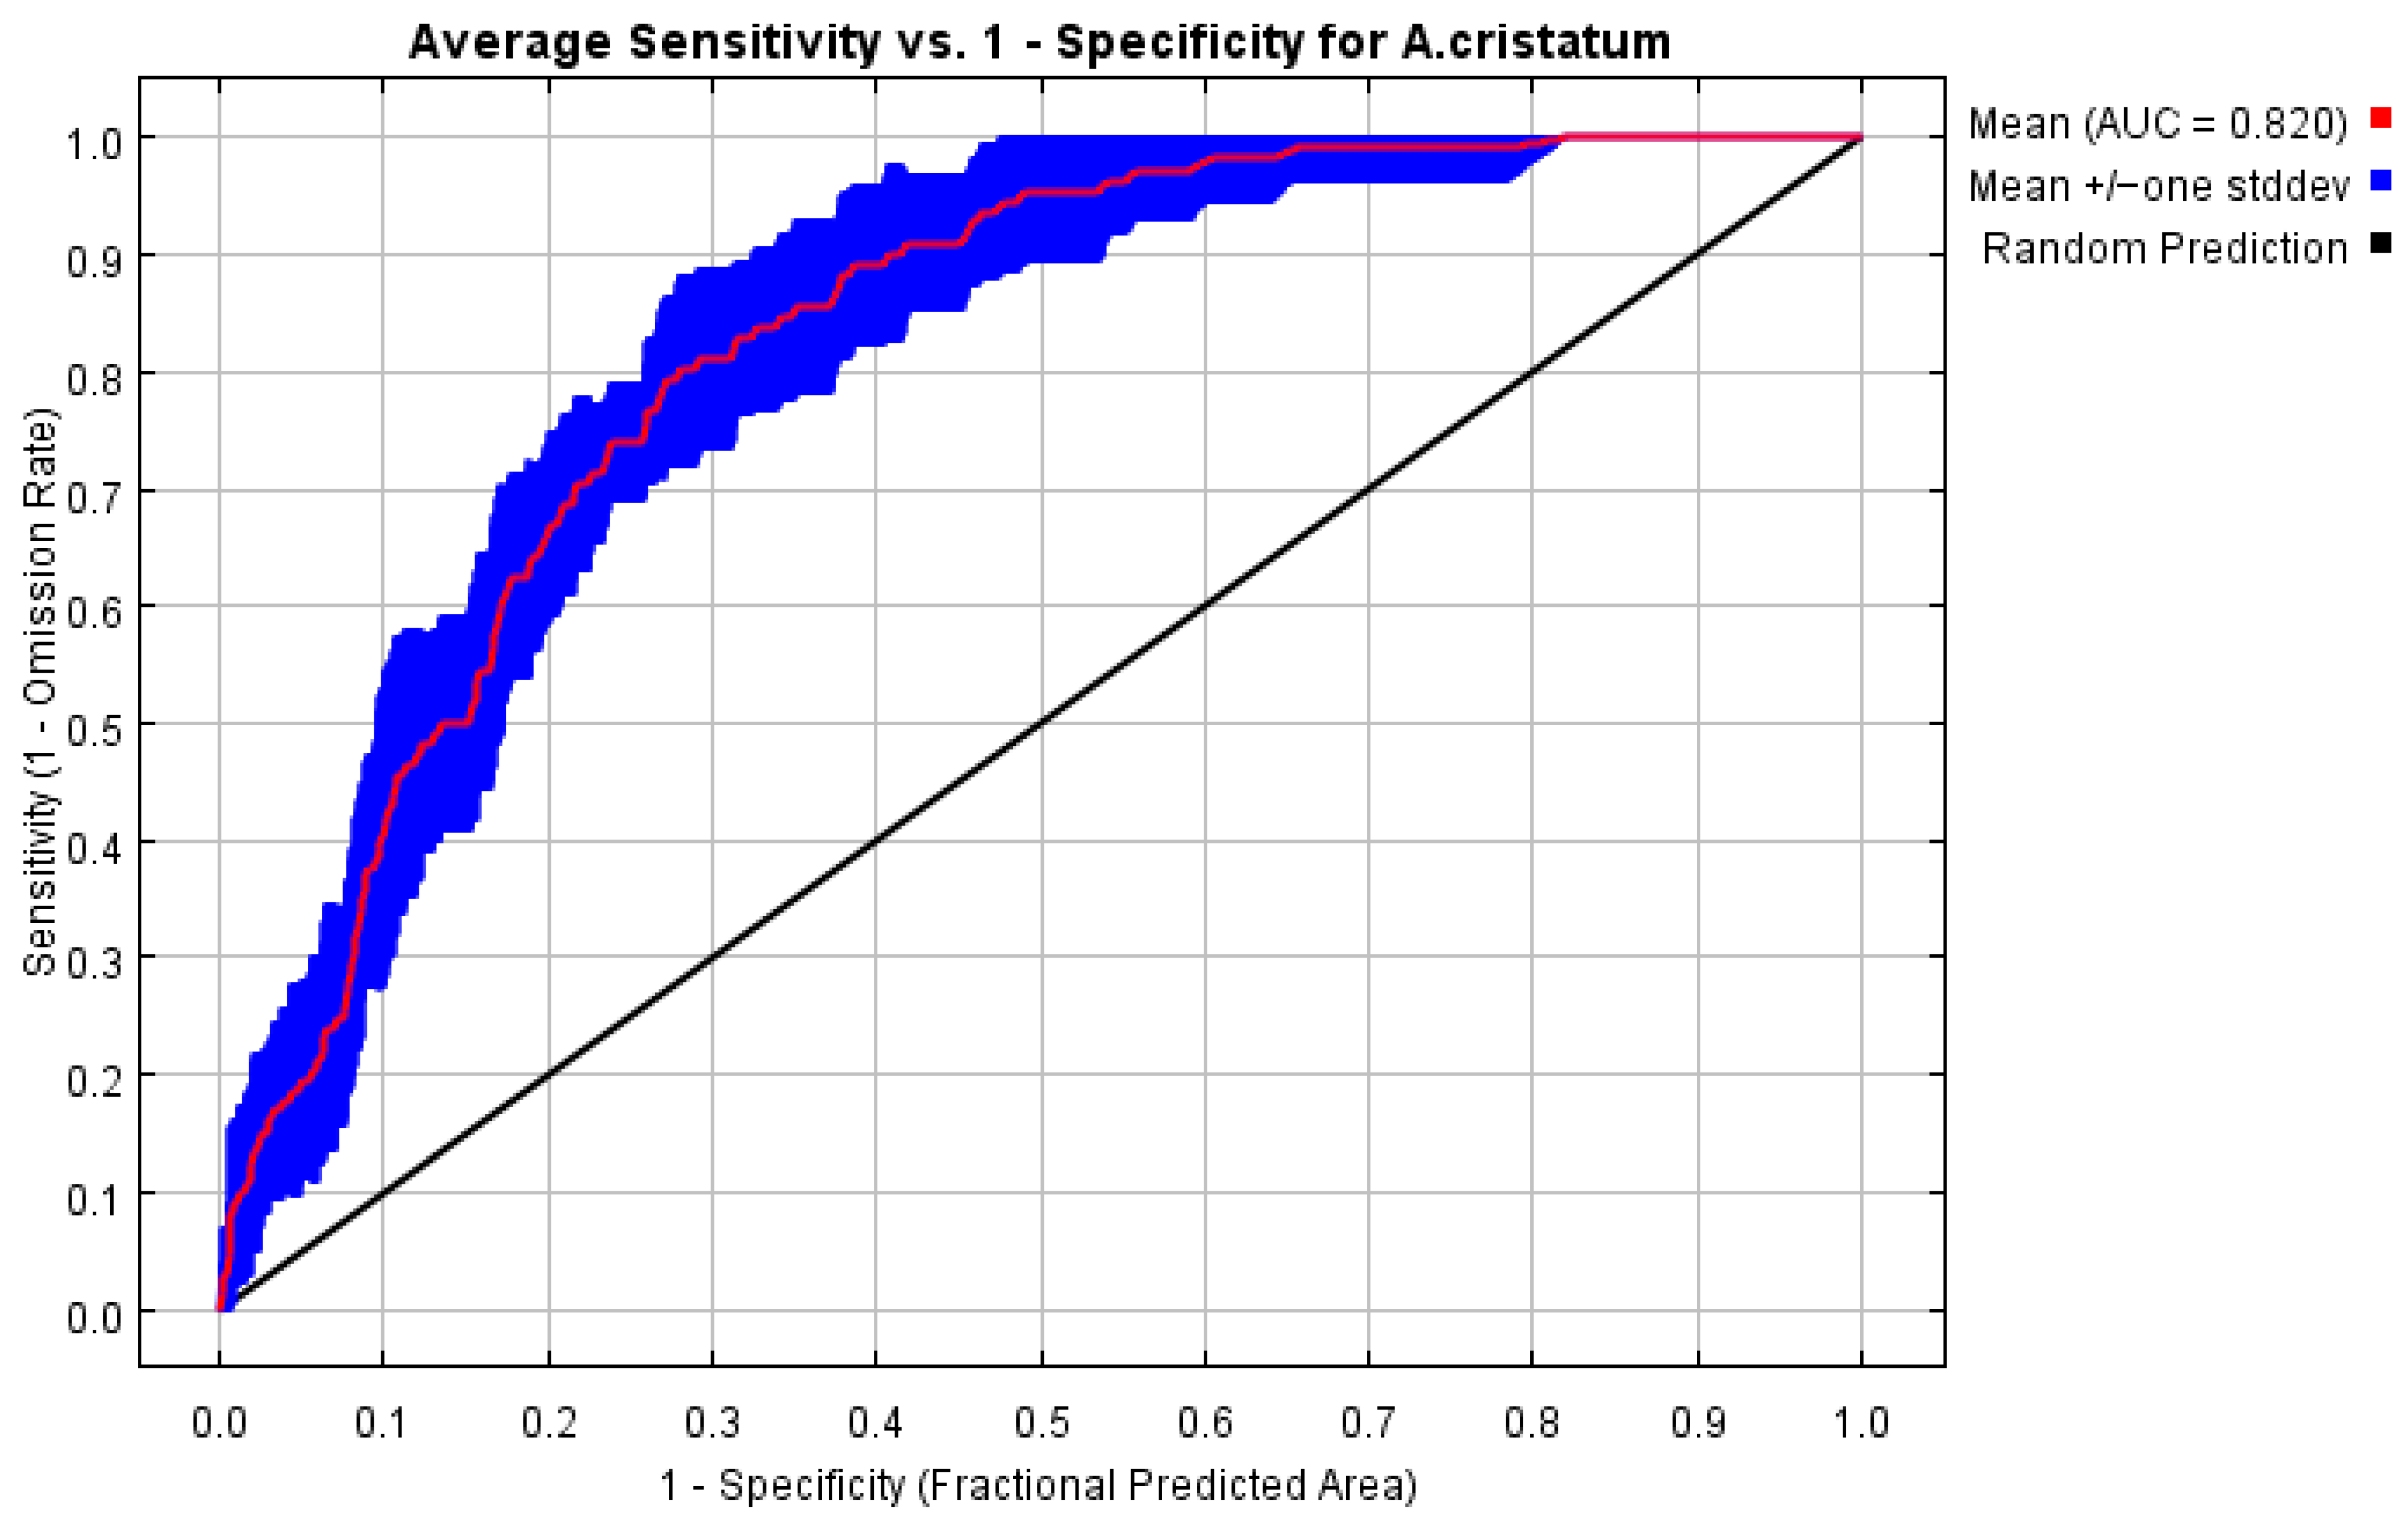
This study simulates the potential distribution of A. cristatum using MaxEnt models with 10 replicate runs. Results show that the mean training AUC is 0.8464, the mean test AUC is 0.8201, and the standard deviation of AUC is only 0.0460, and a True Skill Statistic (TSS) of 0.64 (Figure 3). The model shows no obvious overfitting and follows a normal iterative convergence process. In terms of variable contribution, the core environmental factors shaping the potential distribution of A. cristatum are annual mean temperature (bio1, average contribution rate 47.93%) and annual precipitation (bio12, average contribution rate 38.78%). Together, these two hydrothermal factors explain approximately 87% of the distribution variation (Table 3). Permutation importance results correspond well with contribution rates (36.91% for bio1 and 33.40% for bio12), which further verifies that hydrothermal conditions act as the key drivers of this species’ distribution. Other environmental factors, including aspect, slope, elevation, soil texture (clay), organic carbon (oc), and pH, all exert weak impacts on species distribution.
Figure 3.
ROC curve for A. cristatum distribution modeling.
Table 3.
Percent contribution and permutation importance of each environmental variable of A. cristatum (the sum of permutation importance values does not equal 100%).
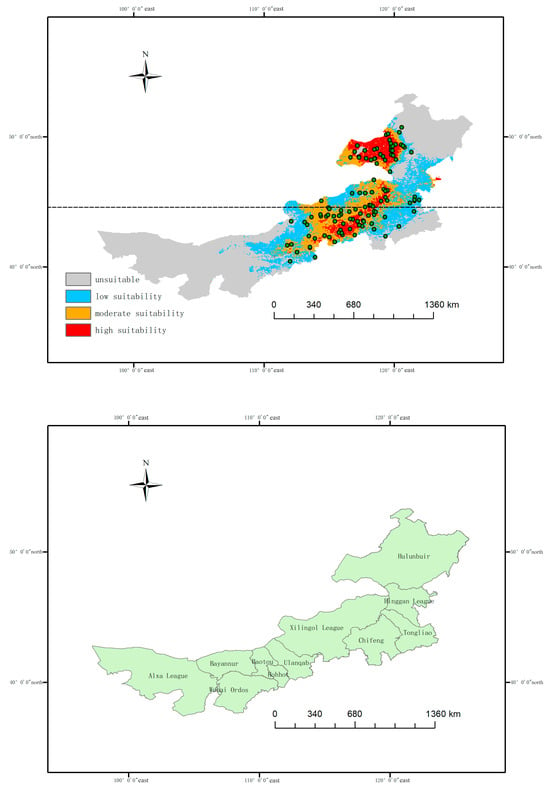
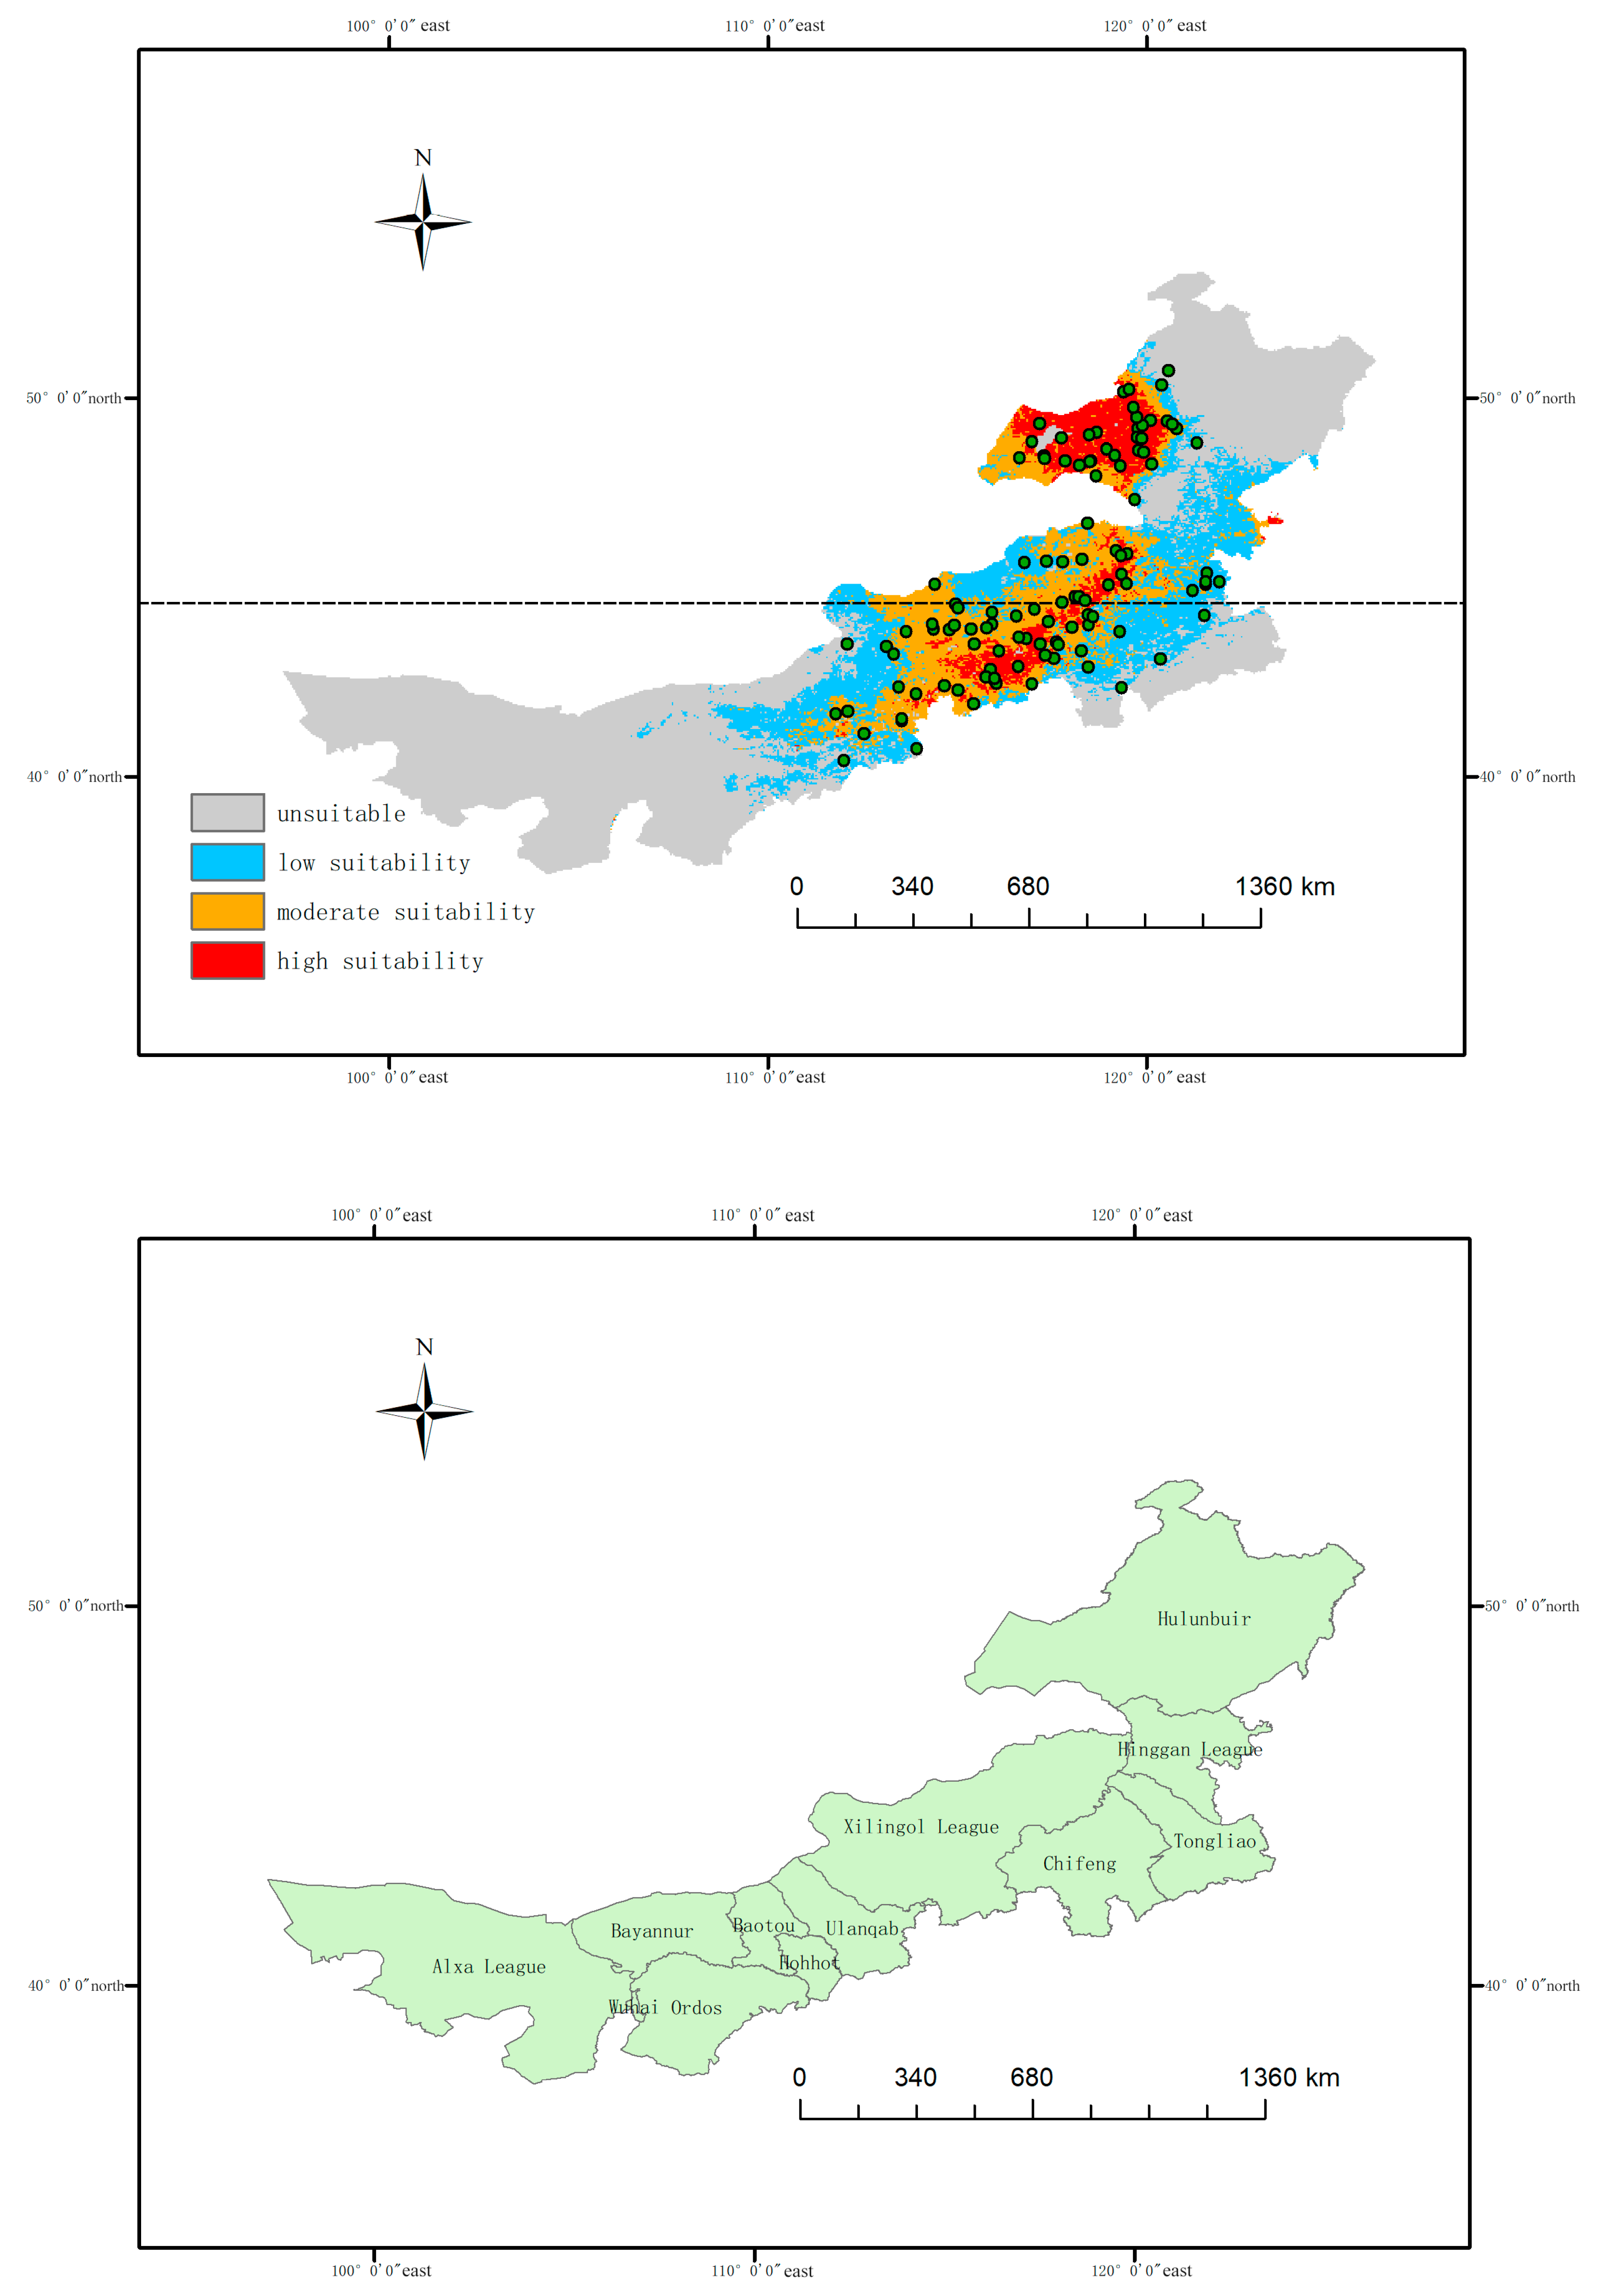
To validate model predictive performance for regions not covered by training data, this study conducts supplementary spatially validation (Figure 4). Based on the distribution pattern of A. cristatum in Inner Mongolia, we split occurrence points into spatially isolated training and test sets according to the median sample latitude (44.6°). The training set includes northern areas (latitude < 44.6°) and the test set covers southern areas (latitude ≥ 44.6°). The two sample sets have no geographic overlap, which guarantees the test region represents an unknown area excluded from model training. Spatial validation results indicate that the mean training AUC is 0.9177 and the mean spatially independent test AUC reaches 0.8962, with a narrow gap of only 0.0215 between them. This demonstrates that the model maintains strong discriminative ability in the untrained southern regions and possesses high spatial generalization capacity.
Figure 4.
Current potential distribution of A. cristatum predicted by MaxEnt model and overlay of modeling occurrence points (red, orange, and blue areas represent high, moderate, and low suitability regions respectively, while gray indicates unsuitable areas; the black dashed line denotes the 44.6° N latitude; green dots represent the occurrence points of A. cristatum) and base map of the Inner Mongolia Autonomous Region.
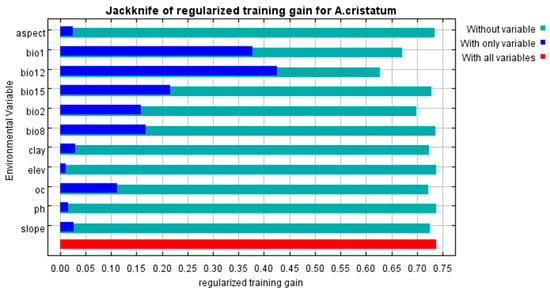
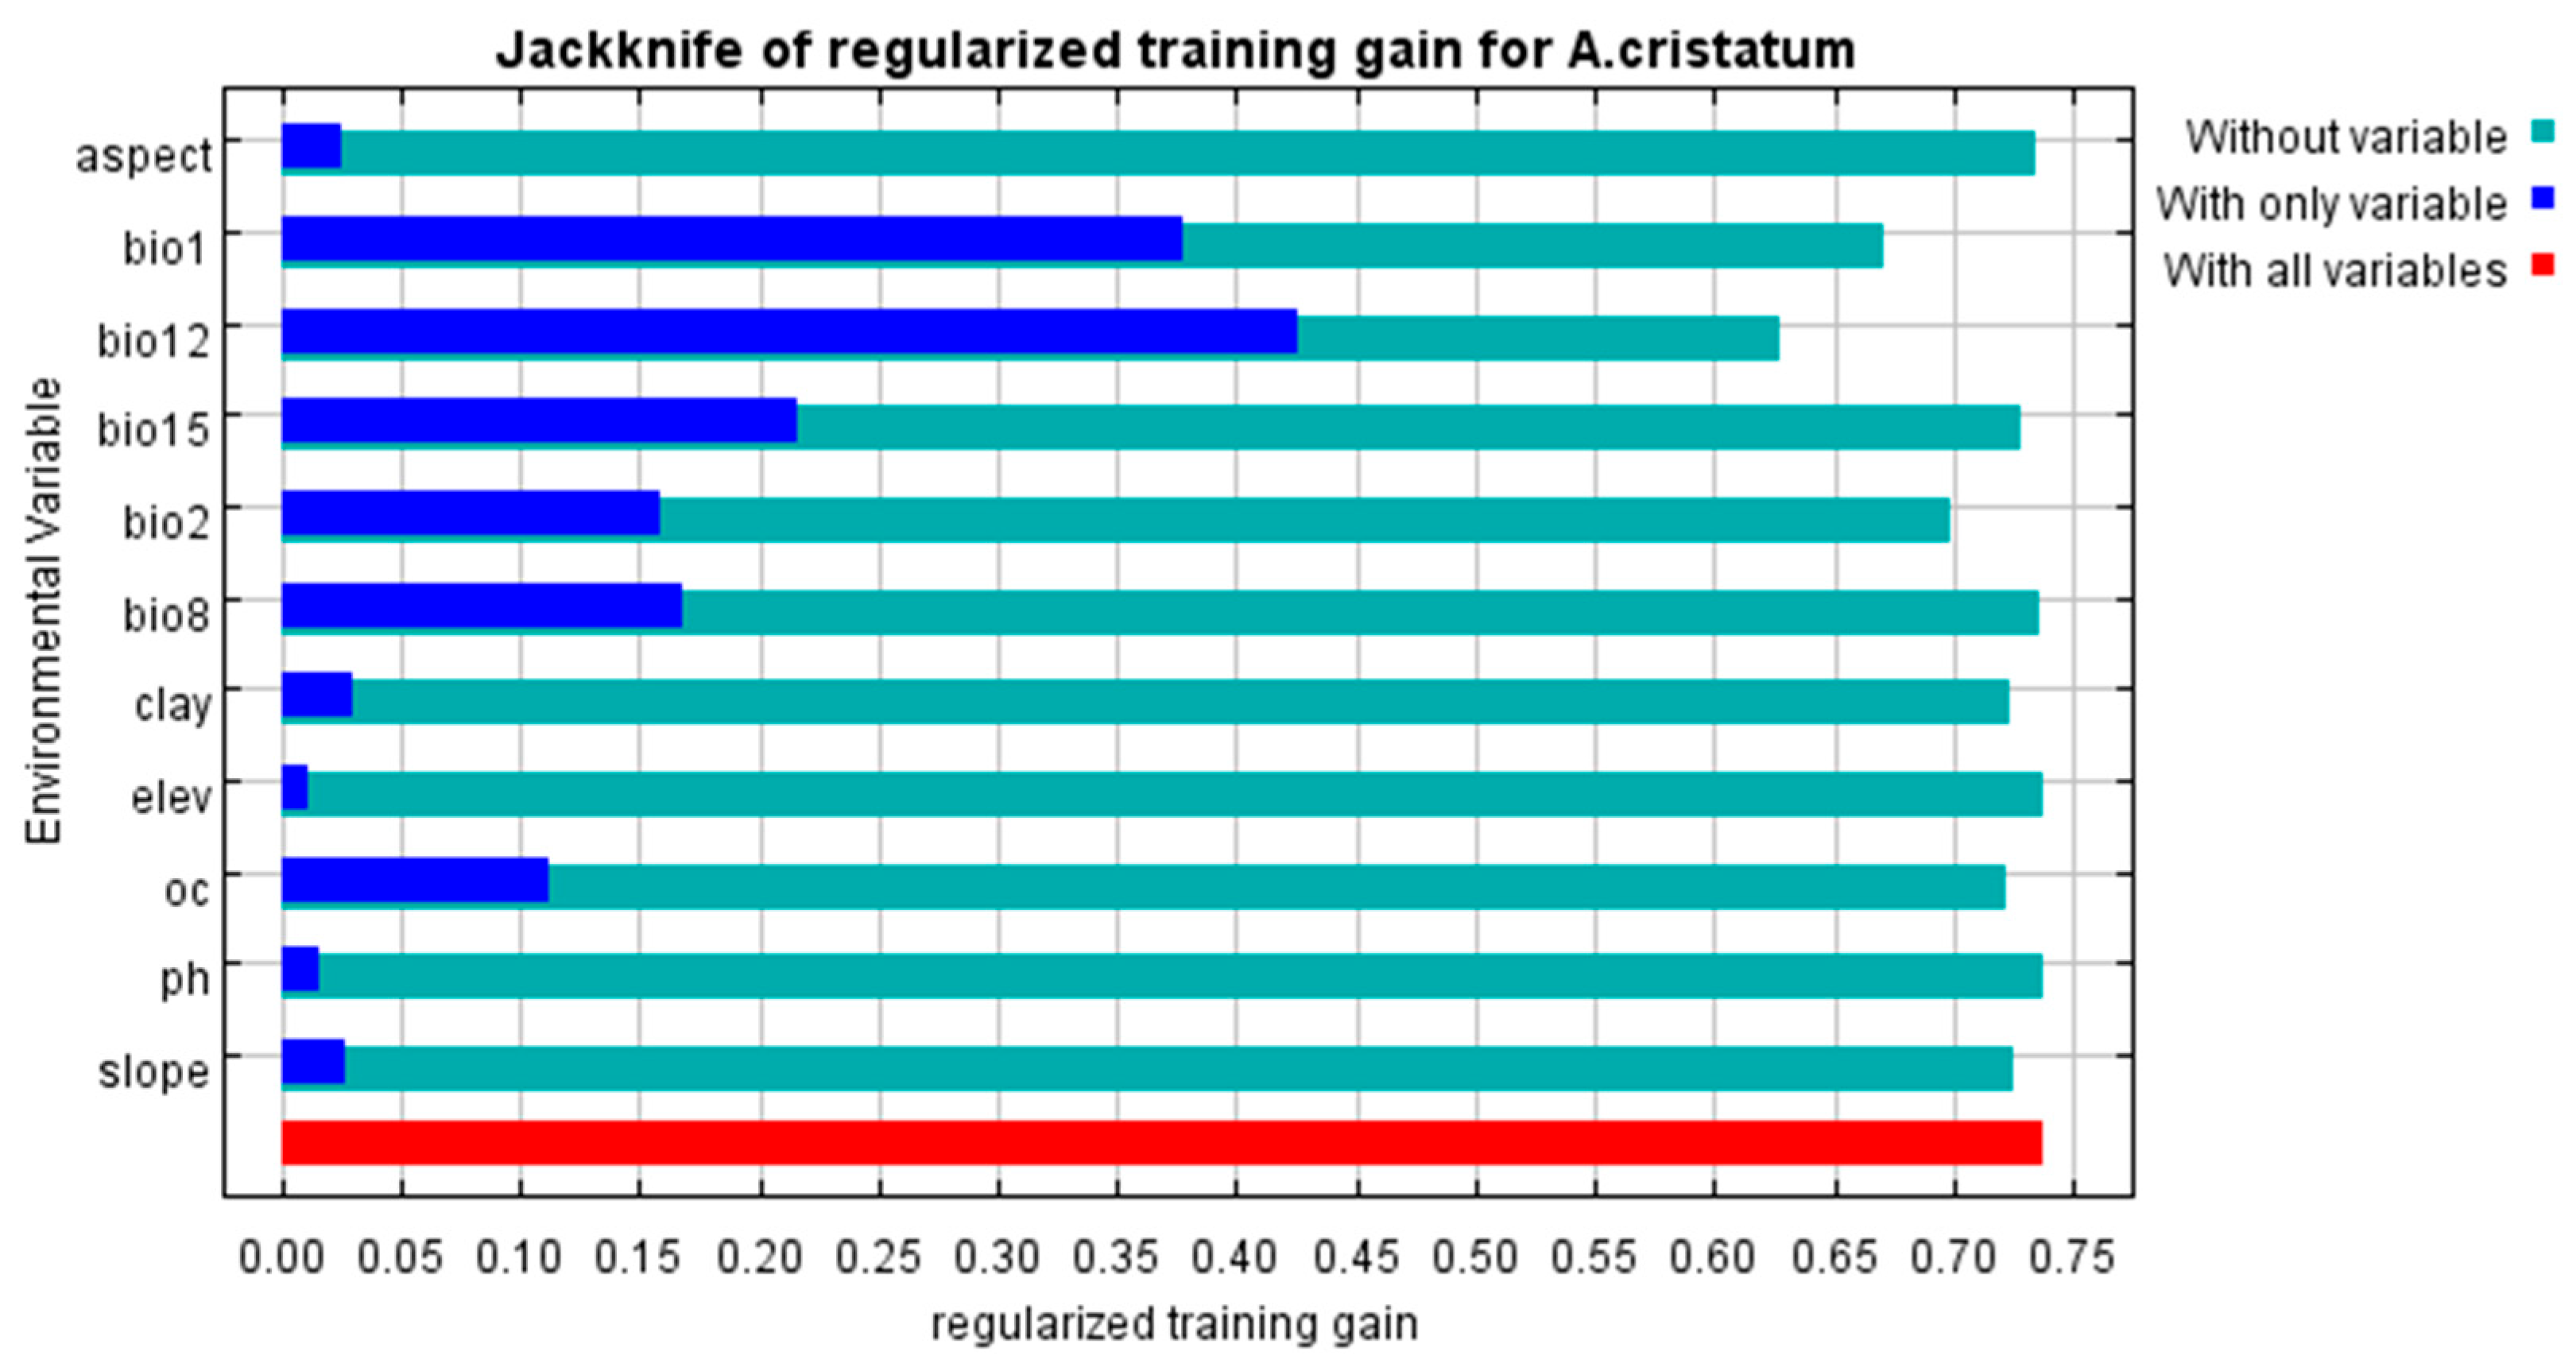
The jackknife test results further validated the dominant role of hydrothermal factors in the distribution of A. cristatum (Figure 5). Annual mean temperature (bio1) and annual precipitation (bio12) showed the highest independent predictive ability, with the highest training gain when used alone for modeling. Meanwhile, removing these two variables caused the most significant decrease in model gain, indicating that they contained unique and irreplaceable information for predicting the distribution of A. cristatum. Other variables such as mean diurnal range (bio2), soil organic carbon content (oc) and precipitation seasonality (bio15) had only weak auxiliary effects.
Figure 5.
Jackknife test of regularized training gain for the A. cristatum.
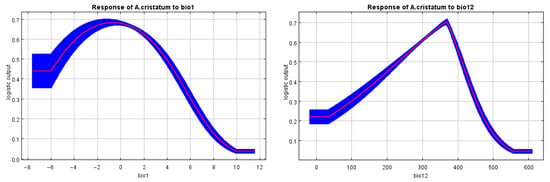
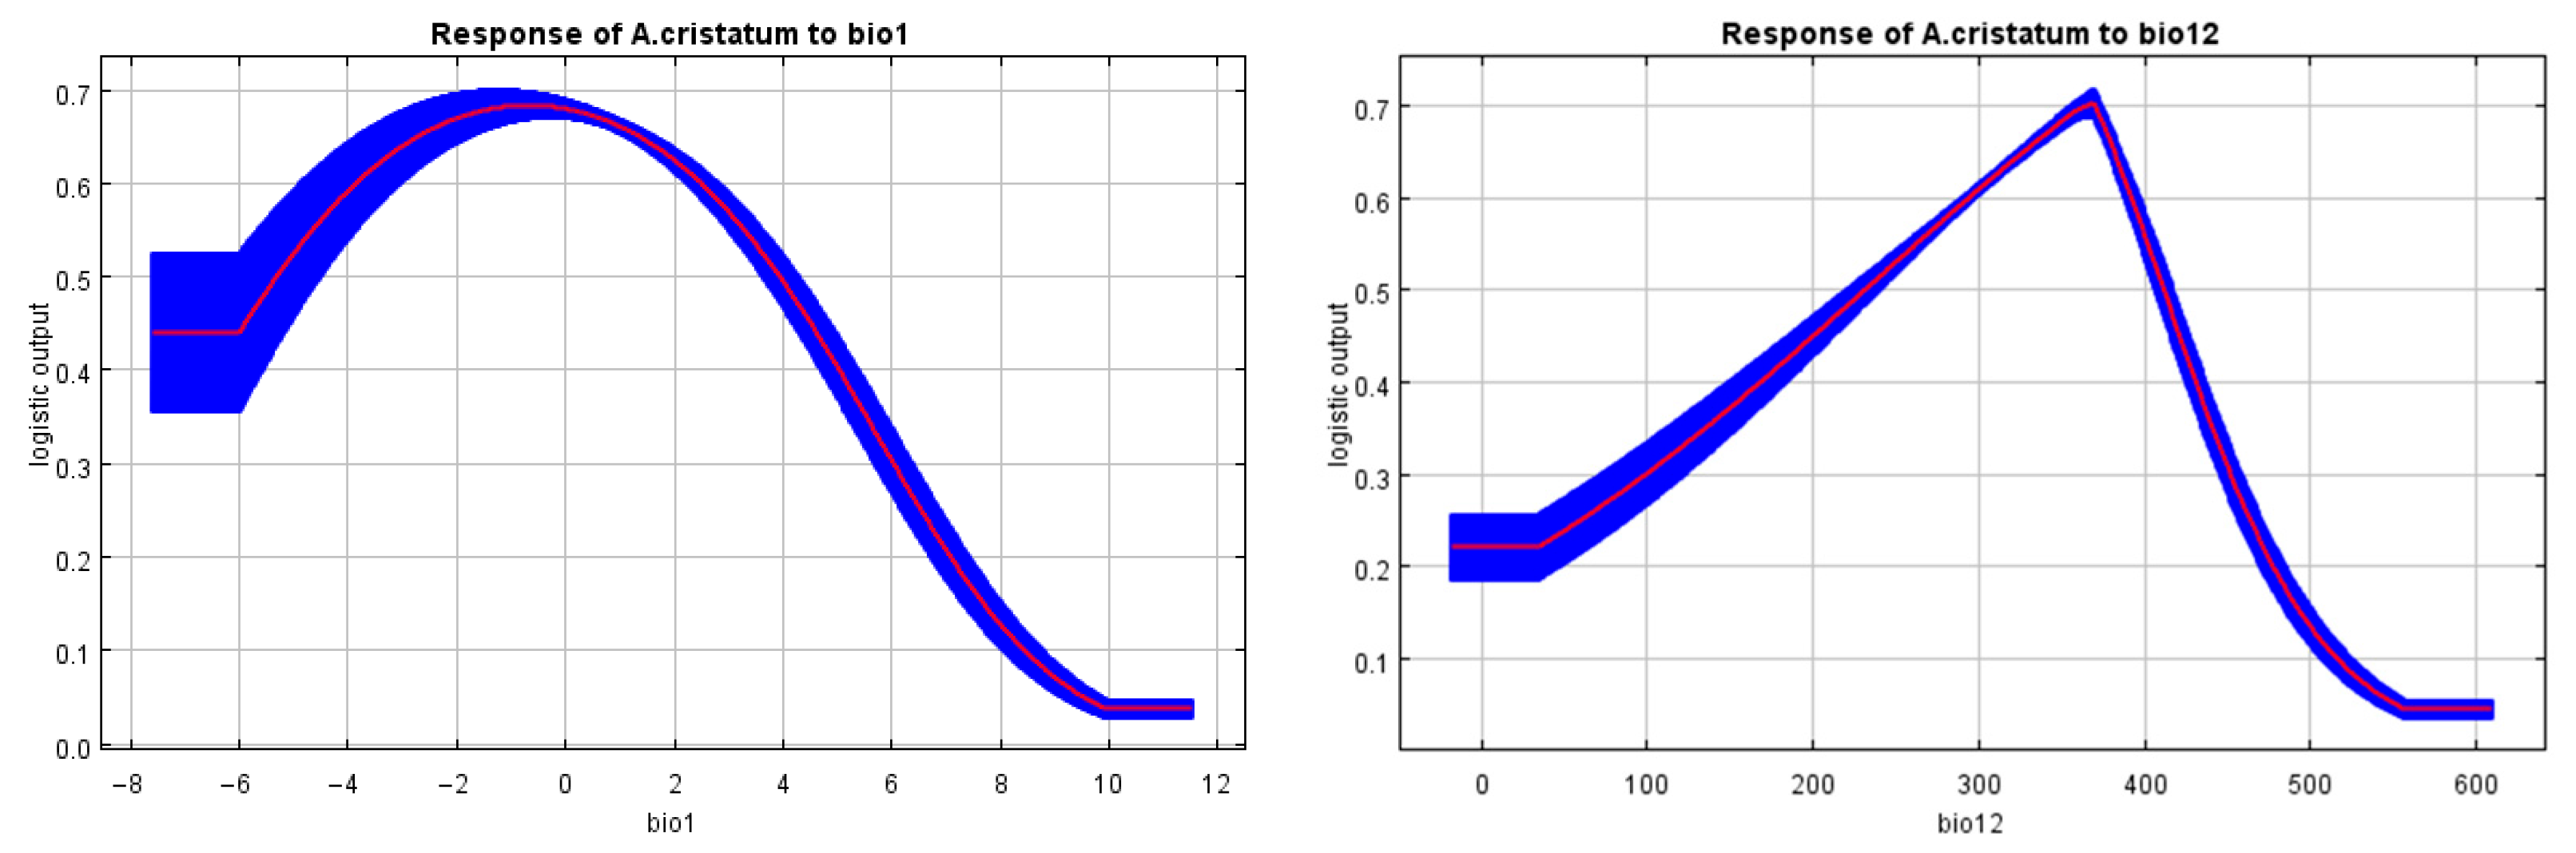
The response curves of A. cristatum to annual mean temperature (bio1) and annual precipitation (bio12) both show unimodal patterns (Figure 6). For annual mean temperature, the habitat suitability of A. cristatum rises with increasing temperature to a peak, then declines continuously as temperature grows warmer. Suitability drops sharply under extreme cold or heat, and approaches nearly zero when annual mean temperature exceeds 10 °C. For annual precipitation, habitat suitability increases with rising precipitation to a peak at moderate moisture levels, then decreases as precipitation becomes overly abundant. Suitability falls rapidly under extreme drought or overly wet conditions, and reaches nearly zero when annual precipitation exceeds 550 mm.
Figure 6.
Response curves of A. cristatum to the two dominant climatic variables (bio1: annual mean temperature; bio12: annual precipitation).
3.2. Potential Distribution Under Current Climate
We obtained the potential distribution pattern of A. cristatum under the current climate through MaxEnt model simulation (Figure 4). From the perspective of suitability spatial distribution, the high suitable area (red in Figure 4), accounting for 7.82% of the study area (≈1.01 × 10⁵ km2), is mainly concentrated in the chestnut soil belt of central-eastern Inner Mongolia; the moderately suitable area (orange in Figure 4), the largest among all suitability levels, accounts for 16.22% (≈2.09 × 10⁵ km2) and is distributed around highly suitable zones while extending to typical steppe regions; the low-suitable area (blue in Figure 4) accounts for 20.33% (≈2.62 × 10⁵ km2), located in the transition zone between moderately suitable and unsuitable areas; the unsuitable area (gray in Figure 4), covering the western Alxa Plateau, Badain Jaran Desert, and Gobi regions, accounts for 55.63% (≈7.18 × 10⁵ km2) (Table 4). This distribution pattern aligns well with the “meadow steppe-typical steppe-desert steppe” transition zone in Inner Mongolia’s vegetation regionalization, verifying the macro-scale accuracy of the model.
Table 4.
Area statistics of each suitability grade under current and future different SSP scenarios (unit: km2).
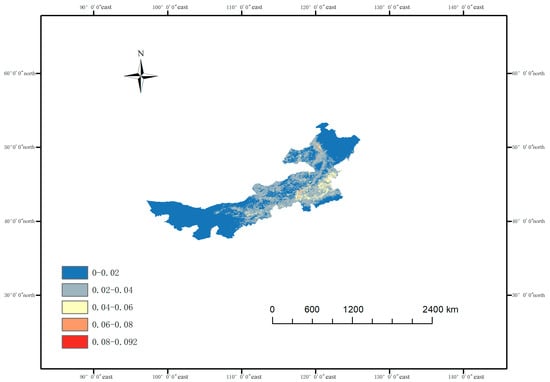
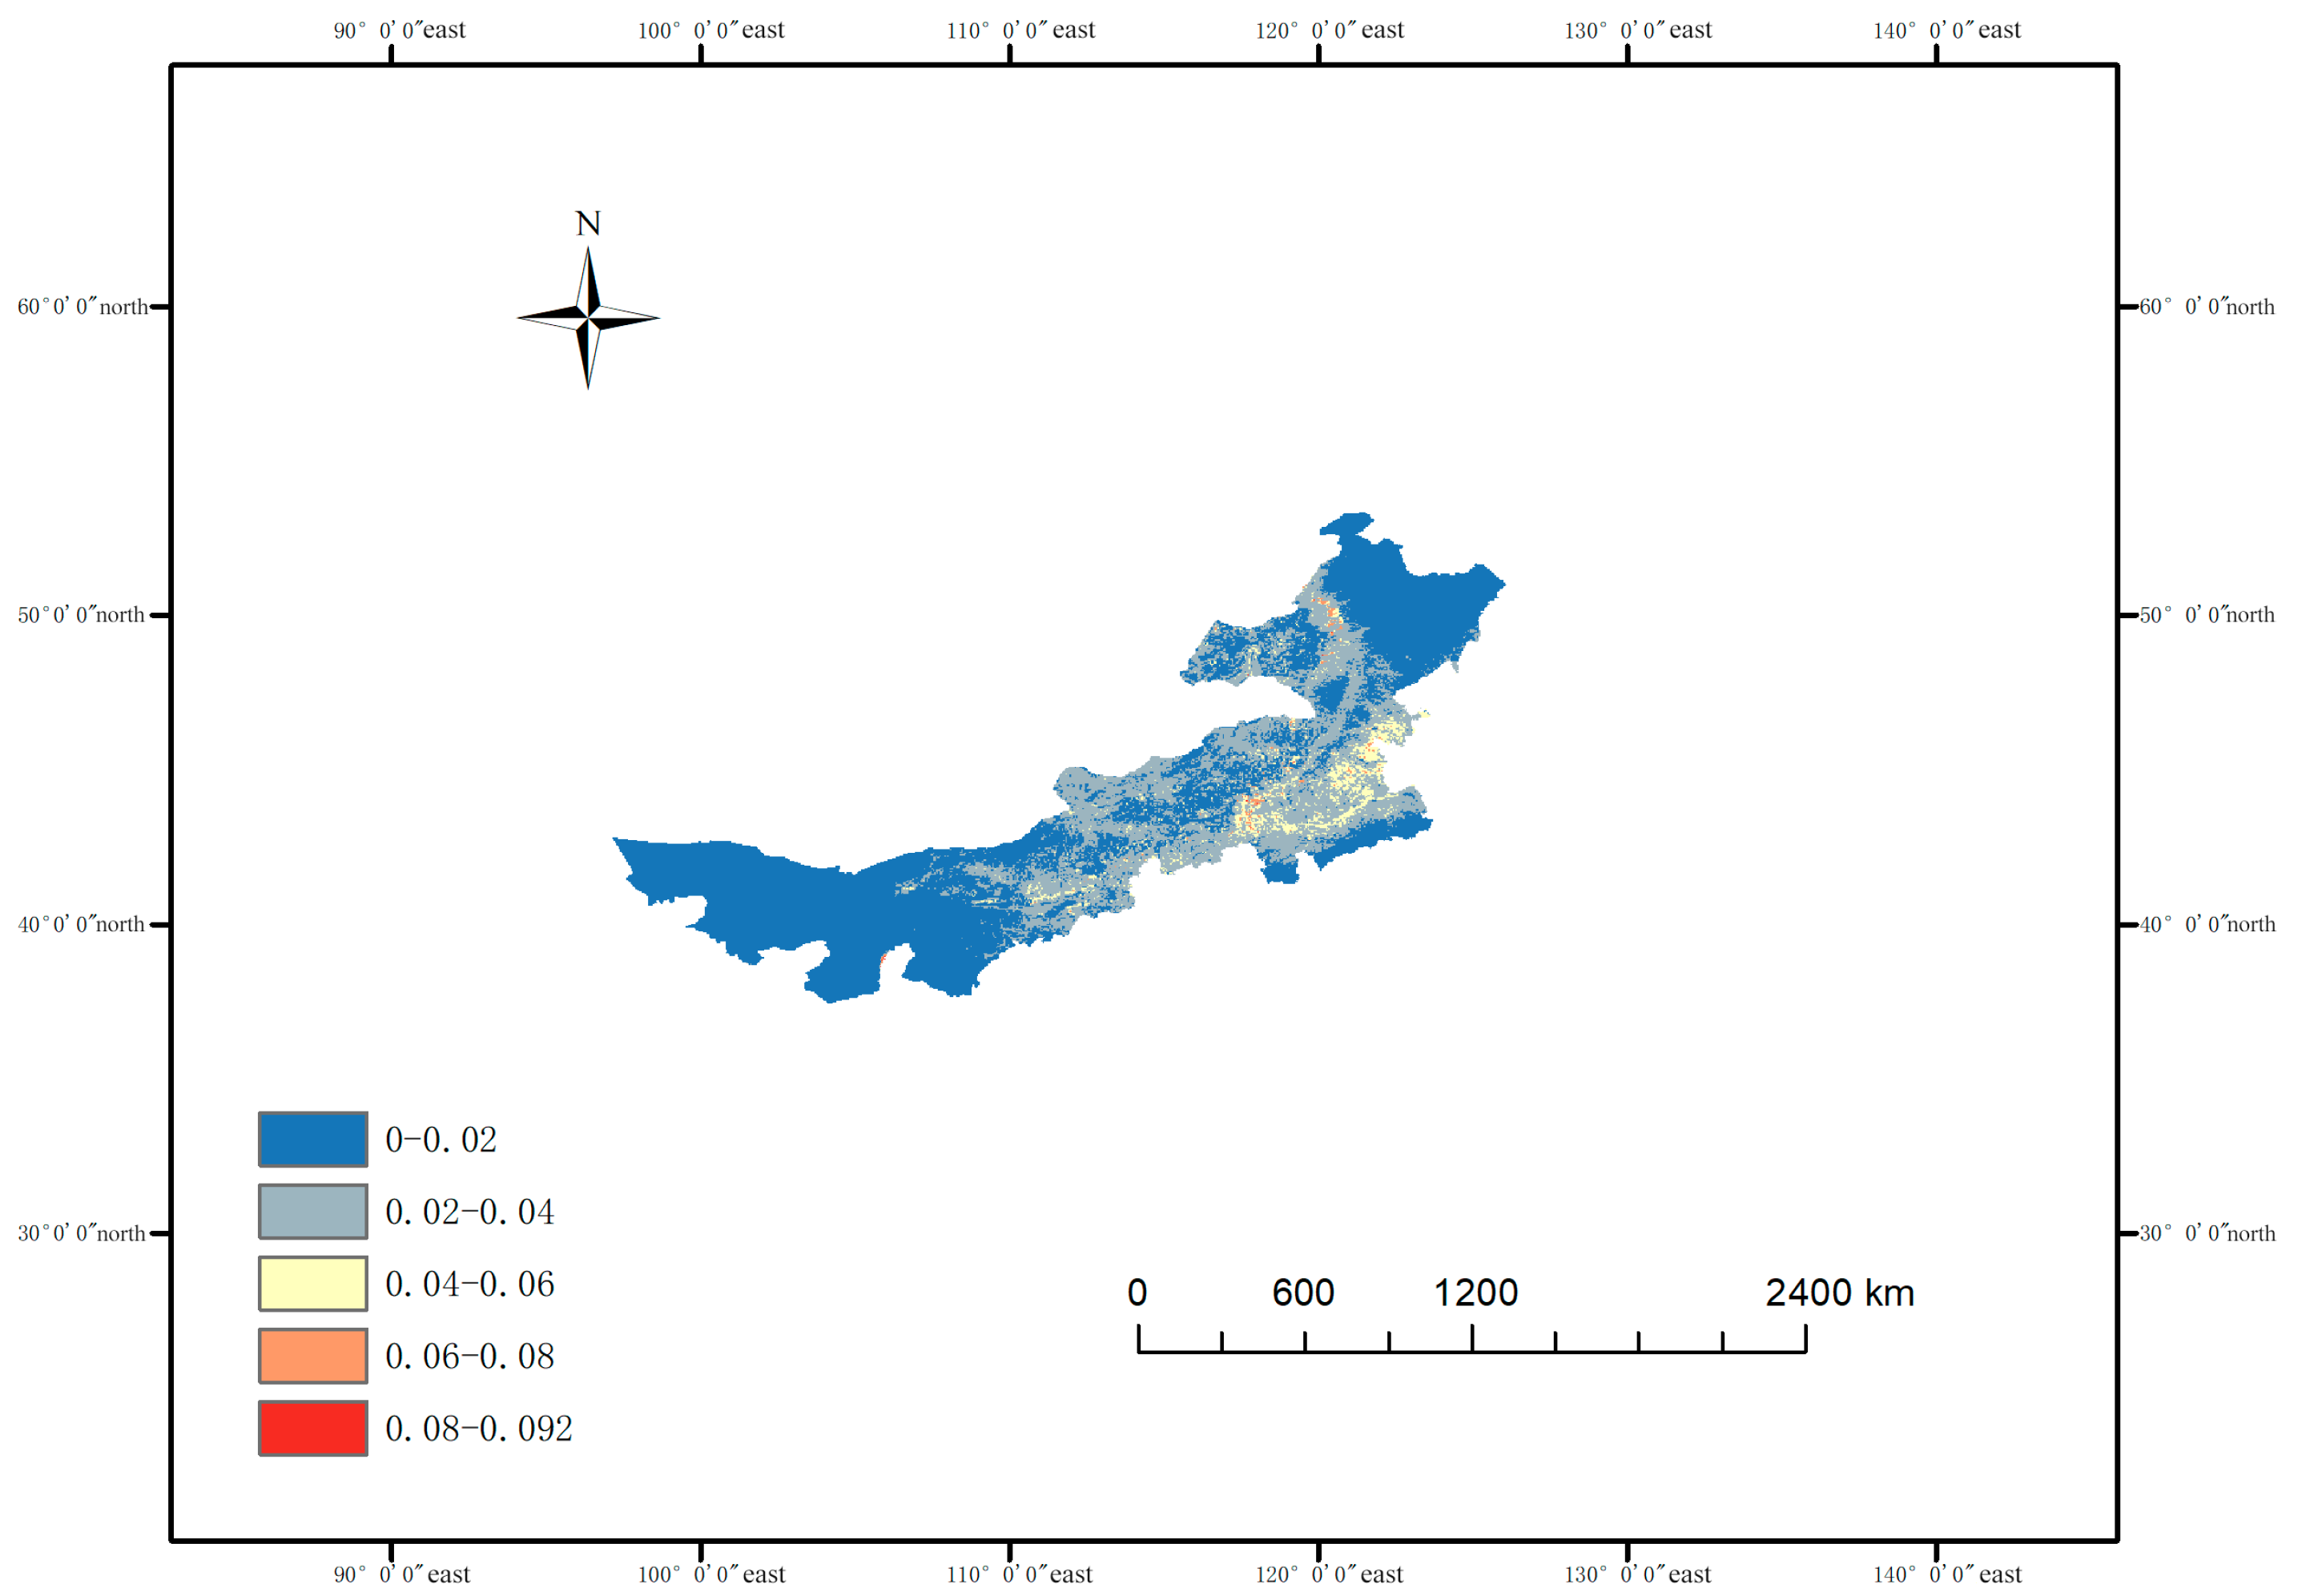
We quantify the prediction uncertainty of our current habitat suitability model for A. cristatum using the standard deviation from 10 replicate MaxEnt runs (Figure 7). We divide the standard deviation into five equal-interval classes to clearly show spatial variation in uncertainty. We find that prediction uncertainty is relatively high in the eastern part of the study area, which corresponds to the core distribution region of A. cristatum. We observe low prediction uncertainty in the western and northern marginal areas. We attribute higher uncertainty in the eastern region to greater environmental heterogeneity and more intensive occurrence records, while lower uncertainty in other regions reflects more stable model performance under relatively homogeneous environmental conditions. These results help us identify reliable prediction areas and improve the interpretability of our habitat suitability results.
Figure 7.
Prediction uncertainty map of current suitable habitat for A. cristatum in Inner Mongolia. (We calculate prediction uncertainty as the standard deviation (SD) of 10 replicate MaxEnt runs. We classify the SD into the following five classes: 0–0.02, 0.02–0.04, 0.04–0.06, 0.06–0.08, and 0.08–0.092.).
3.3. Potential Distribution for A. cristatum Based on Future Climatic Conditions
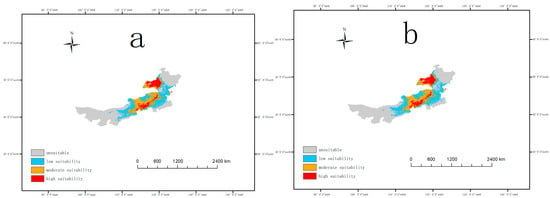
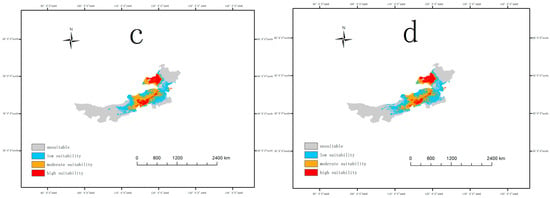
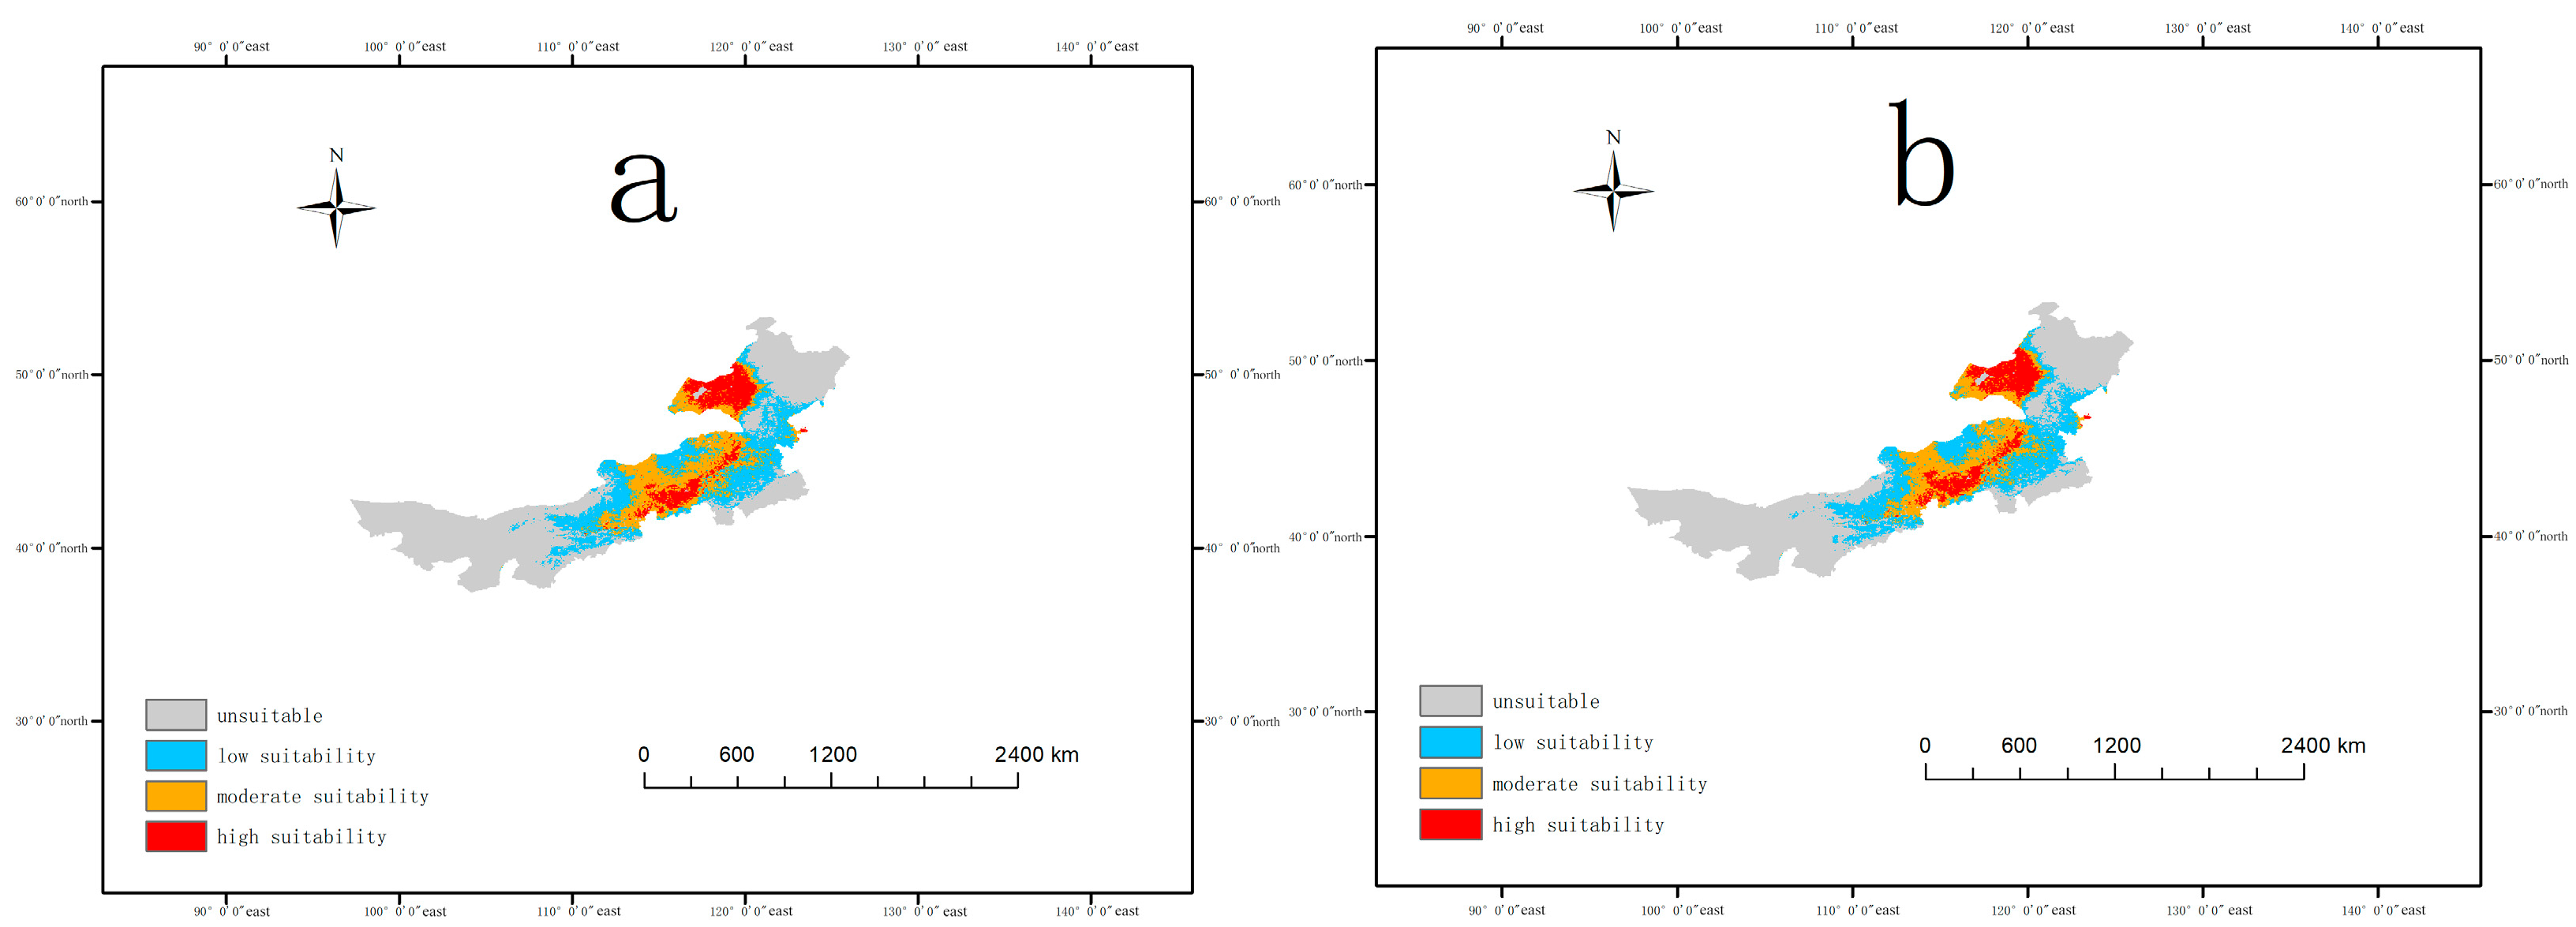
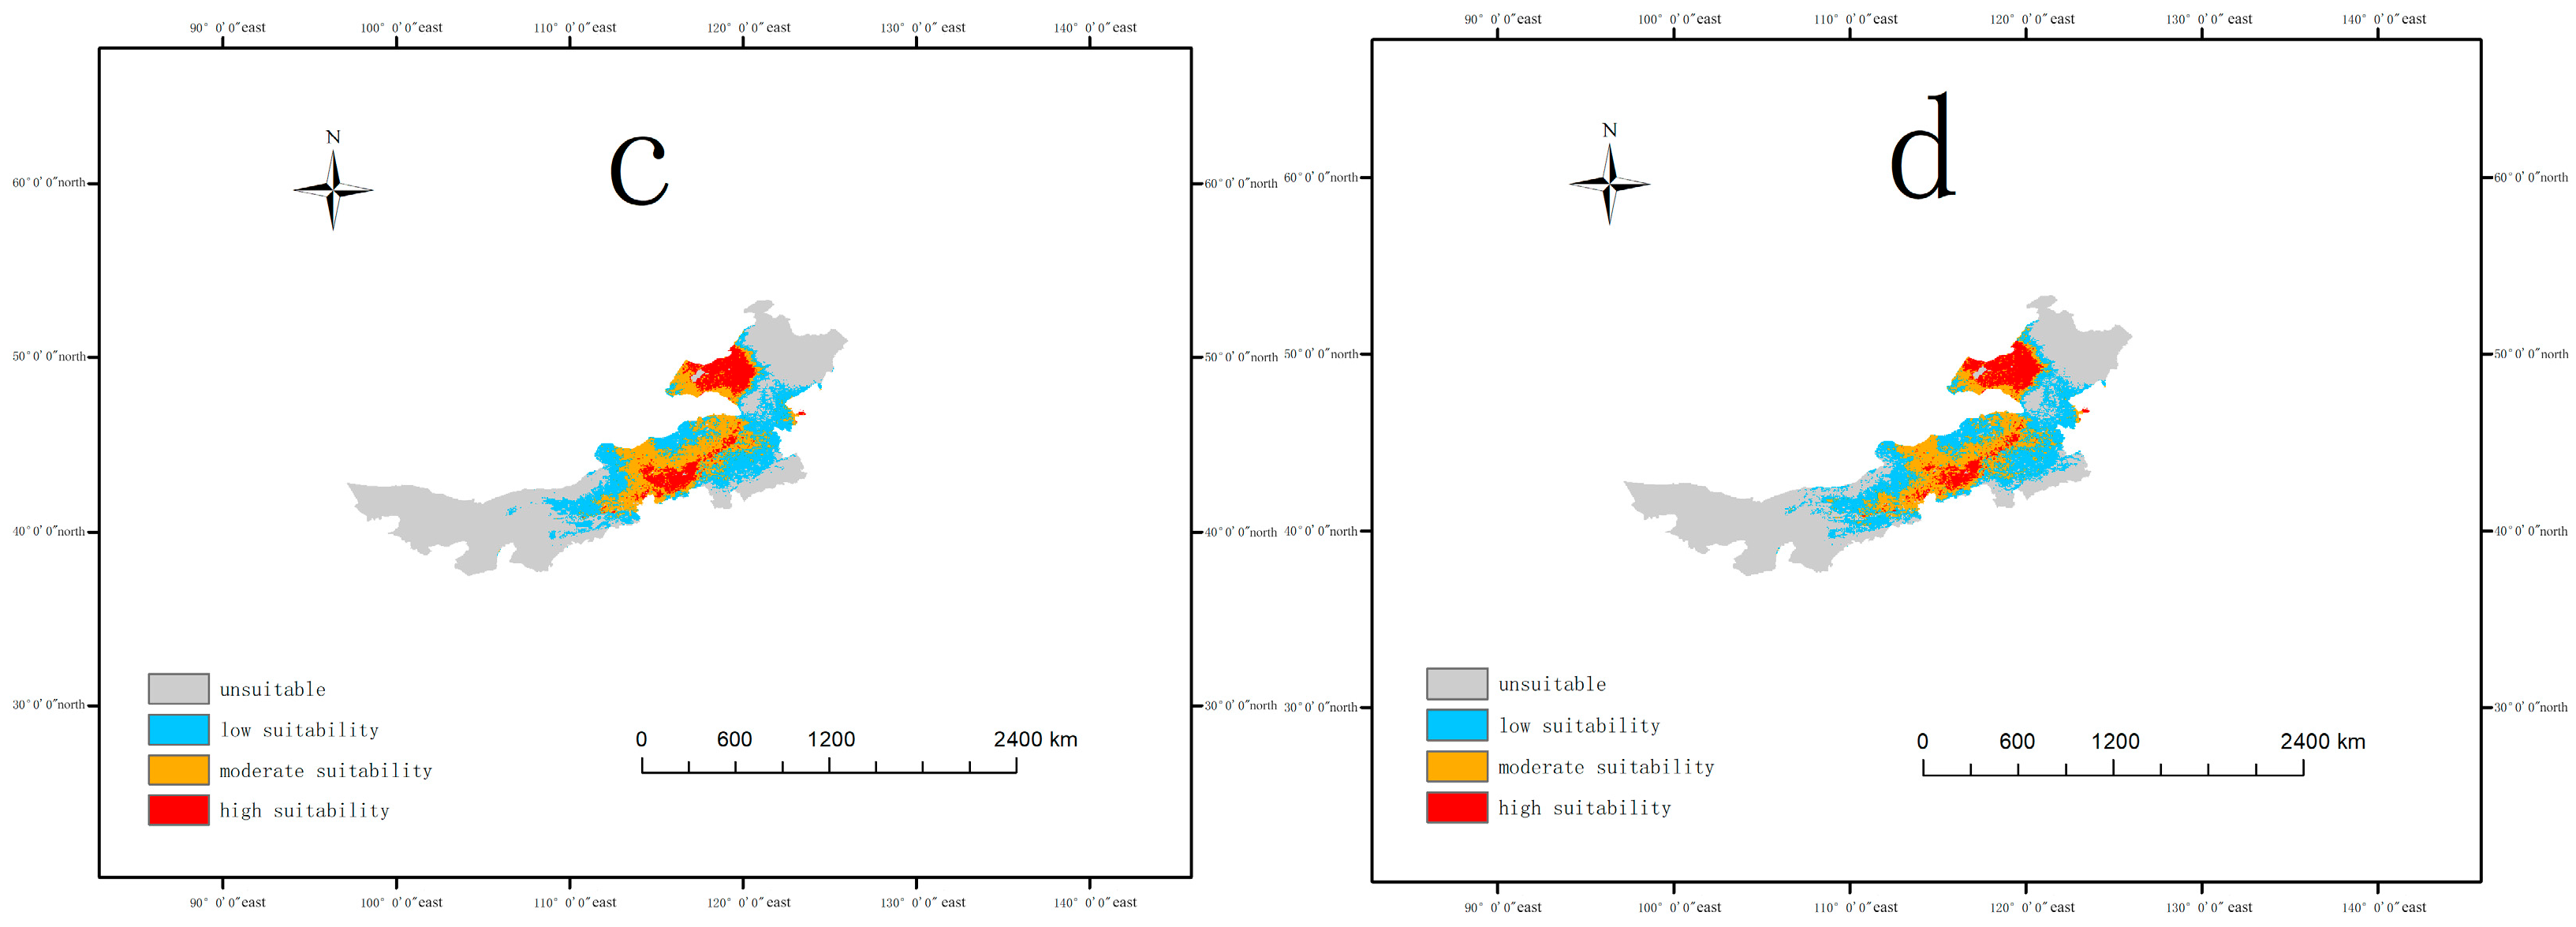
Based on the SSP2-4.5 (medium emission) and SSP5-8.5 (high emission) scenarios released by CMIP6, we simulated and predicted the spatio-temporal evolution of the suitable habitat of A. cristatum at the following two time nodes: the 2050s and 2100s (Figure 8).
Figure 8.
Potential distribution pattern of A. cristatum under different future climate scenarios. ((a): SSP2-4.5 scenario in the 2050s; (b): SSP2-4.5 scenario in the 2100s; (c): SSP5-8.5 scenario in the 2050s; (d): SSP5-8.5 scenario in the 2100s).
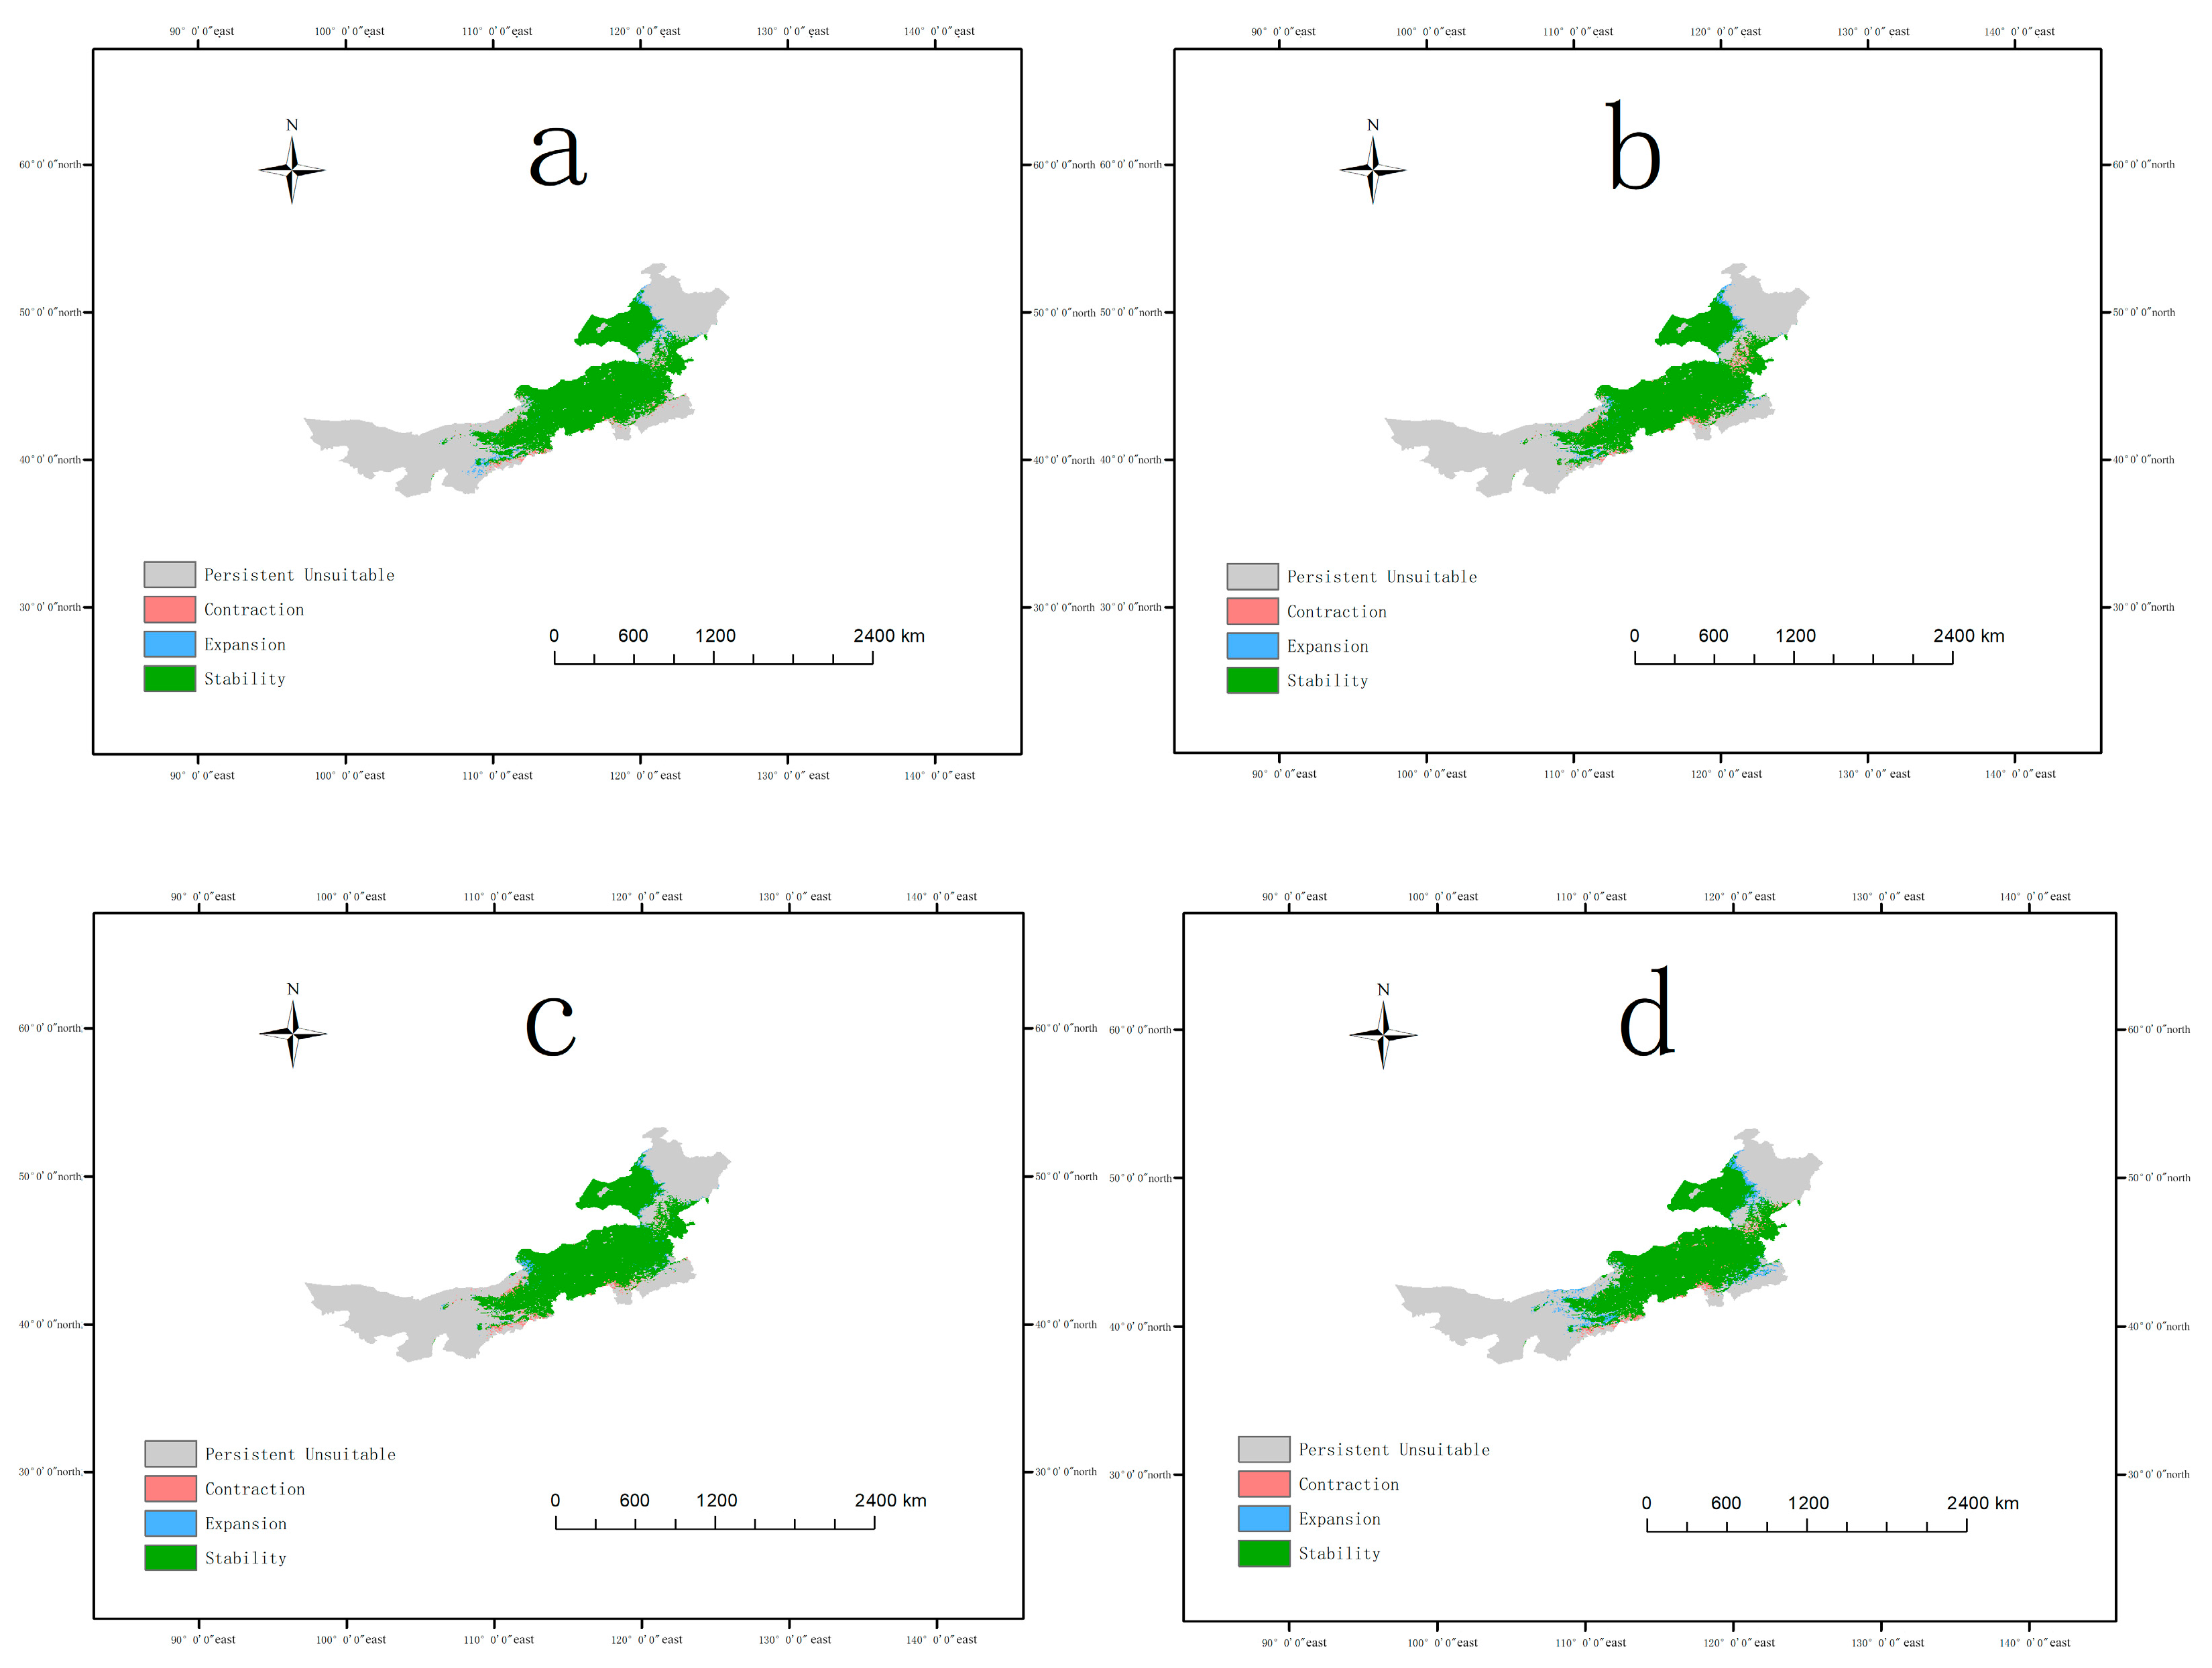
We analyzed changes in the suitable habitat of A. cristatum in Inner Mongolia under future climate scenarios relative to the current period using MaxEnt (Figure 9; Table 4). Under SSP2-4.5, the unsuitable area decreases slightly to 708,229.17 km2 in the 2050s and then rises to 715,347.22 km2 in the 2100s; the low suitable area expands to 272,465.28 km2 in the 2050s and then declines slightly to 269,565.97 km2 in the 2100s; the moderate suitable area decreases continuously to 204,496.53 km2 in the 2050s and 197,725.69 km2 in the 2100s; the high suitable area increases steadily to 105,954.86 km2 in the 2050s and 108,506.94 km2 in the 2100s. Spatially, stable suitable habitats dominate the distribution, with expansion areas concentrated in northern and western regions and contraction areas limited to southern edges in the 2050s (Figure 9a); by the 2100s, expansion areas extend further northward, while contraction areas expand slightly in southern and eastern parts (Figure 9b). Under SSP5-8.5, the unsuitable area drops to 717,621.53 km2 in the 2050s and then decreases sharply to 689,600.69 km2 in the 2100s; the low suitable area declines slightly to 262,013.89 km2 in the 2050s and then increases significantly to 292,413.19 km2 in the 2100s, becoming the dominant suitable habitat type; the moderate suitable area remains stable at 207,187.50 km2 in the 2050s and 207,812.50 km2 in the 2100s; the high suitable area reduces slightly to 104,322.92 km2 in the 2050s and 101,319.44 km2 in the 2100s. Spatially, stable suitable habitats remain dominant, with contraction areas appearing in southern and eastern regions in the 2050s (Figure 9c); by the 2100s, contraction areas expand notably in southern and eastern parts, while expansion areas emerge in western and northern regions, leading to more extensive habitat changes (Figure 9d). By the 2100s, SSP5-8.5 induces more pronounced habitat changes than SSP2-4.5, with a smaller high suitable area and a larger low suitable area, alongside more extensive contraction and expansion regions.
Figure 9.
Habitat stability and change in A. cristatum in Inner Mongolia under future climate scenarios. ((a): SSP2-4.5 scenario in the 2050s; (b): SSP2-4.5 scenario in the 2100s; (c): SSP5-8.5 scenario in the 2050s; (d): SSP5-8.5 scenario in the 2100s).
4. Discussion
4.1. Key Environmental Drivers of A. cristatum Distribution
Our results show that hydrothermal conditions, including annual mean temperature (bio1, 47.9% contribution) and annual precipitation (bio12, 38.8% contribution), are the dominant factors shaping the potential distribution of A. cristatum in Inner Mongolia, jointly explaining nearly 87% of its distribution variation. This finding aligns with previous studies on A. cristatum and other dominant steppe species in temperate arid and semi-arid regions, which confirm macroclimatic factors as the primary drivers of species distribution at the regional scale [72]. The unimodal response curves further define the fundamental ecological niche of A. cristatum and match its known identity as a temperate xerophytic herb [73]. These patterns reflect the species’ adaptation to semi-arid temperate environments: it thrives under moderate thermal and moisture conditions and cannot tolerate extreme cold, heat, drought or waterlogging [74]. These suitability limits also explain the core distribution of A. cristatum in Inner Mongolia and provide a clear basis for predicting its range shifts under future climate change [75].
In contrast, topographic factors (aspect, slope, and elevation) and soil properties (clay content, organic carbon, and pH) made only minor contributions to the distribution of A. cristatum [76]. This does not negate their ecological relevance; rather, they play a regulatory role at the local scale [77]. For example, slope and aspect modify soil moisture and solar radiation at the patch scale, while soil clay and organic carbon content affect soil water retention and nutrient supply, which can fine-tune the habitat suitability of A. cristatum in local areas. However, at the regional scale of Inner Mongolia, these local factors are overridden by the broad hydrothermal gradient, consistent with the hierarchical theory of species distribution drivers [78].
4.2. Distribution Dynamics of A. cristatum Under Future Climate Change Scenarios
Our results indicate that the suitable habitat areas of A. cristatum in Inner Mongolia show small changes under the SSP2-4.5 scenarios and SSP5-8.5 scenarios, suggesting a relatively stable response of this species to climate warming under different greenhouse gas emission scenarios [79]. This finding aligns with the niche characteristics of A. cristatum as a dominant species in typical Inner Mongolian steppes: long adapted to cold and arid environments, this grass exhibits low sensitivity to temperature and precipitation changes under both moderate and high emission scenarios, and its core suitable habitat areas remain highly stable under future climate conditions [79,80]. Although the differences in suitable area across scenarios are not significant, spatial pattern analysis reveals subtle changes in local regions, indicating that A. cristatum can serve as a stable planting species for climate change adaptation in grassland conservation and restoration practices, and the stability of its distribution range provides a reliable basis for adaptive management of regional ecosystems [81].
We introduced landscape metrics to quantify the habitat fragmentation of A. cristatum in Inner Mongolia, aiming to reveal the spatial integrity and connectivity of its suitable habitats (Table 5) [82]. We imported the preprocessed GeoTIFF datasets into Fragstats 4.2.1 (version 4.2.1, University of Massachusetts, Amherst, MA, USA) to compute six key fragmentation metrics, including Number of Patches (NPs), Patch Density (PD), and Aggregation Index (AI). We observe a mild reduction in habitat fragmentation in 2050 under both climate scenarios. Under the SSP2-4.5 scenario, NP falls slightly from 154 to 152, and PD shows a minor decrease. The reduction is slightly greater under the SSP5-8.5 scenario: NP drops modestly to 121. This mild drop in fragmentation aligns with the change in suitable habitat area. Total suitable habitat area has a slight increase in 2050. Scattered small patches merge into larger continuous patches, which drives this mild reduction in fragmentation. Habitat fragmentation shows a slight rebound in 2100 for both scenarios. Under the SSP2-4.5 scenario, NP rises slightly to 171. The rebound is slightly greater under the SSP5-8.5 scenario: NP reaches 174, the highest value across all scenarios. AI still stays nearly unchanged. This slight rebound links to the spatial pattern of newly added suitable habitats. Total suitable habitat area continues to grow modestly in 2100, with a 5.00% increase under the SSP5-8.5 scenario. However, most new suitable habitats appear as scattered small patches. These patches drive a minor rise in overall NP and PD and lead to the slight rebound of habitat fragmentation [83]. Overall, A. cristatum habitat fragmentation sees a mild decrease in the near term (2050) and a slight rebound in the long term (2100) under future climate change. All observed changes in fragmentation patterns remain minor in scale.
Table 5.
Landscape fragmentation metrics of A. cristatum habitat under current and future climate scenarios.
4.3. Implications for Grassland Conservation and Management
Based on our findings, we propose targeted implications for grassland conservation and adaptive management in Inner Mongolia: carry out targeted ecological restoration using A. cristatum in future expansion suitable areas [84,85]. Our predictions show that northern and western Inner Mongolia will become new suitable habitats for A. cristatum under future climate change. We recommend using A. cristatum as a key native species for artificial seeding and vegetation restoration in these areas, to improve vegetation coverage, prevent soil desertification, and enhance the stability of degraded grassland ecosystems [85,86]. Meanwhile, local provenances adapted to the climatic conditions of the restoration areas should be selected to ensure the survival rate and long-term stability of restored populations [15,87] and implement ex situ conservation and adaptive management for contraction areas under high emission scenarios [88]. The southern edge of the current core distribution area will face habitat contraction under high-intensity climate change. We recommend establishing ex situ germplasm conservation nurseries in this region to collect and preserve local A. cristatum germplasm resources, preventing the loss of unique genotypes caused by climate change [89].
Under the high-emission SSP5-8.5 scenario, suitable habitats for A. cristatum expand notably in Inner Mongolia’s grasslands. Low-suitable areas increase by 11.4% in particular. As a dominant drought-tolerant grass, this expansion intensifies competition for key resources like water, nutrients, and light. It may squeeze the ecological niches of sensitive native species [90]. This compression of their habitats threatens grassland species diversity and community stability. We compare this trend with the moderate-emission SSP2-4.5 scenario. We find that A. cristatum’s suitable habitats expand far less under this scenario. This finding indicates that proactive greenhouse gas emission reduction curbs extreme warming. It effectively mitigates climate-driven shifts in species distributions [1]. Such actions safeguard the integrity and biodiversity of grassland ecosystems [51].
4.4. Research Limitations
Despite the robust predictive performance and ecological interpretability of the results, several inherent limitations tied to data availability, methodological design and sampling constraints should be acknowledged to define the boundaries of the present findings and guide targeted future research. Future climate projections in this study were derived solely from the BCC-CSM2-MR global climate model of CMIP6, and single model outputs are inevitably subject to uncertainties from structural differences and parameterization schemes, whereas multi-model ensemble simulations would better reduce such uncertainties and improve the generalizability of distribution predictions. Biotic interactions (e.g., interspecific competition with dominant steppe species, soil microbial symbiosis) and anthropogenic disturbances (e.g., grazing intensity, grassland reclamation) were not integrated into the model framework, as these factors are quantifiable for the current scenario with existing data yet lack unified, credible spatiotemporal datasets for future projections—reliant on unforeseeable socioeconomic development and human decision-making—making their objective integration without excessive subjective assumptions unfeasible, and thus the results reflect only climate-soil-topography driven potential distribution rather than the actual distribution of A. cristatum. Spatial validation of the model was also constrained by the limited number of available occurrence records: we only conducted latitude-based split validation for spatially independent testing and lacked additional independent sampling points for strict external validation, which may limit the ability to fully verify the model’s predictive performance in completely unsampled regions. Spatially validation produced a higher test AUC (0.8962) than the 10-fold cross-validation AUC (0.820). This outcome indicates limitations in the single latitude-based spatial splitting scheme. We will refine the spatial validation design in future research to improve the robustness of model generalization assessment. Additionally, the static MaxEnt model employed does not account for the species’ adaptive evolutionary capacity (e.g., shifts in temperature and precipitation tolerance thresholds) and natural dispersal ability (constrained by landscape barriers such as farmland and linear infrastructure) over the long time scale of climate change, meaning future potential distribution may not match the actual colonizable range of A. cristatum. Finally, although 5 km × 5 km spatial thinning was performed to mitigate sampling bias, the occurrence records compiled from herbarium specimens and field sampling still have inherent biases (e.g., over-concentration around urban areas and major highways, sparse sampling in remote western and northern Inner Mongolia), which may lead the model to overfit densely sampled areas and potentially underestimate suitable habitats in ecologically appropriate but under-sampled regions.
5. Conclusions
We use the MaxEnt model to systematically simulate the potential distribution patterns of A. cristatum in the Inner Mongolia Autonomous Region under current and future climate change scenarios, identify the core environmental factors driving the species’ distribution, and evaluate the impacts of climate change on its habitat suitability and landscape integrity. We find that annual mean temperature (bio1) and annual precipitation (bio12) are the dominant factors determining the distribution of A. cristatum, and the two factors jointly explain approximately 87% of the variation in the species’ distribution. We delineate the suitable habitat range of A. cristatum under the current climate background, where the highly suitable areas are mainly concentrated in the chestnut soil belt of central-eastern Inner Mongolia, and the overall distribution pattern is highly consistent with the zonal vegetation gradient of “meadow steppe-typical steppe-desert steppe” in the region. We confirm the reliability and good spatial generalization ability of the model predictions through 10-fold cross-validation and spatially validation with north–south latitude split. We complete the simulation of A. cristatum distribution dynamics in the middle (2050s) and end (2100s) of this century based on the SSP2-4.5 medium emission and SSP5-8.5 high emission scenarios from CMIP6, and we find that the core suitable areas of A. cristatum remain overall stable at both time nodes. We observe a continuous slight expansion of highly suitable areas under the medium emission scenario, while the highly suitable areas under the high emission scenario show a slight expansion first and then a mild contraction, with an overall spatial trend of northward and westward shift. We carry out quantitative analysis with landscape metrics, and we find that future climate change will gradually aggravate the fragmentation of A. cristatum suitable habitats, with a more significant habitat-splitting effect under the high emission scenario, which may pose a potential threat to the gene exchange and population persistence of the species. Our results provide clear scientific support for grassland ecological protection, native grass restoration and germplasm resource management in Inner Mongolia. We propose that we can prioritize the use of A. cristatum for ecological restoration of degraded grasslands in the newly suitable areas in the future, focus on in situ conservation and ex situ preservation of native germplasm resources in the southern habitat contraction areas, and actively promote greenhouse gas emission reduction measures to effectively alleviate the long-term disturbance of climate change on A. cristatum habitats. We also clarify the limitations of this study, including the use of a single climate model for future scenario simulation and the failure to systematically incorporate biotic interactions and long-term anthropogenic disturbance data. In follow-up research, we can further improve prediction accuracy through multi-climate model ensemble simulation and integration of multi-dimensional driving factors, to provide a more comprehensive scientific basis for the long-term protection of A. cristatum germplasm resources and sustainable management of temperate grassland ecosystems.
Author Contributions
Resources, validation, X.Z.; investigation, data curation, writing—original draft preparation, writing—review and editing, Z.W.; supervision, project administration, funding acquisition, N. Y.Z. conceived and designed the study, acquired funding, and supervised the project implementation. All authors have read and agreed to the published version of the manuscript.
Funding
This research was funded by Department of Science and Technology of Inner Mongolia Autonomous Region, grant number 2022JBGS0014.
Data Availability Statement
The raw data supporting the conclusions of this article will be made available by the authors on request.
Acknowledgments
We thank Xiaoming Zhang from Inner Mongolia Agricultural University for his technical guidance and the provision of research datasets for this study, and we also acknowledge the administrative support from Inner Mongolia Agricultural University during the research and manuscript preparation; during the preparation of this manuscript, the authors used R (version 4.5.2) for statistical analysis and data processing, ArcGIS (version 10.8.1) for spatial data visualization and geographic analysis, and MaxEnt (version 3.4.4) for species distribution modeling, and Fragstats 4.2.1 for landscape metrics. We sincerely appreciate the developers of these software packages for providing professional and reliable research tools.
Conflicts of Interest
The authors declare no conflicts of interest.
References
- Suter, G. Climate change 2022: Impacts, adaptation and vulnerability. Integr. Environ. Assess. Manag. 2022, 18, 1117–1118. [Google Scholar]
- Chardon, N.I.; McBurnie, L.; Goodwin, K.J.A.; Pradhan, K.; Lambers, J.H.R.; Angert, A.L. Variable species establishment in response to microhabitat indicates different likelihoods of climate-driven range shifts. Ecography 2024, e07144. [Google Scholar] [CrossRef] [Scilit]
- Buonincontri, M.P.; Bosso, L.; Smeraldo, S.; Chiusano, M.L.; Pasta, S.; Di Pasquale, G. Shedding light on the effects of climate and anthropogenic pressures on the disappearance of Fagus sylvatica in the Italian lowlands: Evidence from archaeo-anthracology and spatial analyses. Sci. Total Environ. 2023, 877, 162893. [Google Scholar] [CrossRef] [Scilit]
- Osland, M.J.; Chivoiu, B.; Feher, L.C.; Dale, L.L.; Lieurance, D.; Daniel, W.M.; Spencer, J.E. Title: Plant migration due to winter climate change: Range expansion of tropical invasive plants in response to warming winters. Biol. Invasions 2023, 25, 2813–2830. [Google Scholar] [CrossRef] [Scilit]
- Yan, X.R.; Wei, D.D.; Yang, J.Z.; Yao, W.L.; Tian, S.F. Monitoring Temperate Typical Steppe Degradation in Inner Mongolia: Integrating Ecosystem Structure and Function. Sustainability 2025, 17, 9015. [Google Scholar] [CrossRef] [Scilit]
- Bai, Y.F.; Han, X.G.; Wu, J.G.; Chen, Z.Z.; Li, L.H. Ecosystem stability and compensatory effects in the Inner Mongolia grassland. Nature 2004, 431, 181–184. [Google Scholar] [CrossRef] [Scilit] [PubMed]
- Li, S.K.; Li, X.B.; Gong, J.R.; Dang, D.L.; Dou, H.S.; Lyu, X. Quantitative Analysis of Natural and Anthropogenic Factors Influencing Vegetation NDVI Changes in Temperate Drylands from a Spatial Stratified Heterogeneity Perspective: A Case Study of Inner Mongolia Grasslands, China. Remote Sens. 2022, 14, 3320. [Google Scholar] [CrossRef] [Scilit]
- Wang, Y.X.; Duan, L.M.; Liu, T.X.; Luo, Y.Y.; Li, D.F.; Tong, X.; Li, W.; Lei, H.M.; Singh, V.P. Evaluation of non-stationarity in summer precipitation and the response of vegetation over the typical steppe in Inner Mongolia. Clim. Dyn. 2022, 58, 2227–2247. [Google Scholar] [CrossRef] [Scilit]
- Loades, K.W.; Bengough, A.G.; Bransby, M.F.; Hallett, P.D. Reinforcement of Soil by Fibrous Roots. In Enhancing Understanding and Quantification of Soil-Root Growth Interactions; Timlin, D., Ahuja, L.R., Eds.; Wiley: Hoboken, NJ, USA, 2013; Volume 4, pp. 197–228. [Google Scholar]
- Plant Guide for Crested Wheatgrass (A. cristatum) and Desert Wheatgrass (Agropyron desertorum); USDA Natural Resources Conservation Service, Aberdeen Plant Materials Center: Aberdeen, ID, USA, 2024. Available online: https://plants.sc.egov.usda.gov/DocumentLibrary/plantguide/pdf/pg_agde.pdf (accessed on 26 March 2026).
- Zheng, L.; Duan, M.; Zhang, Z.; Liu, C.; Wang, Z.; Wang, G.; Wang, M. Comparative analysis of Chloroplast genomes in 48 samples from 5 species and 2 varieties of Agropyron Gaertn. (Poaceae, Triticeae). BMC Genom. 2025, 26, 912. [Google Scholar] [CrossRef] [Scilit]
- Wu, Z.; Raven, P.H.; Missouri Botanical Garden. Flora Republicae Popularis Sinicae; Science Press: Beijing, China, 1996; Volume 22. [Google Scholar]
- Bengtsson, J.; Bullock, J.M.; Egoh, B.; Everson, C.; Everson, T.; O’Connor, T.; O’Farrell, P.J.; Smith, H.G.; Lindborg, R. Grasslands-more important for ecosystem services than you might think. Ecosphere 2019, 10, e02582. [Google Scholar] [CrossRef] [Scilit]
- Reeder, J.D.; Schuman, G.E. Influence of livestock grazing on C sequestration in semi-arid mixed-grass and short-grass rangelands. Environ. Pollut. 2002, 116, 457–463. [Google Scholar] [CrossRef] [Scilit]
- Cui, H.; Xie, K.; Yan, A.; Zhang, L.; Wang, X.; Wan, J.; Meng, X.; Yang, L. Synergistic Interaction of AMF and Phosphorus Enhances Drought Resilience and Regrowth Capability in Agropyron via Root Architecture Remodeling. Agronomy 2026, 16, 557. [Google Scholar] [CrossRef] [Scilit]
- Purohit, S.; Rawat, N. MaxEnt modeling to predict the current and future distribution of Clerodendrum infortunatum L. under climate change scenarios in Dehradun district, India. Model. Earth Syst. Environ. 2022, 8, 2051–2063. [Google Scholar] [CrossRef] [Scilit]
- Phillips, S.J.; Anderson, R.P.; Schapire, R.E. Maximum entropy modeling of species geographic distributions. Ecol. Model. 2006, 190, 231–259. [Google Scholar] [CrossRef] [Scilit]
- Merow, C.; Smith, M.J.; Silander, J.A. A practical guide to MaxEnt for modeling species’ distributions: What it does, and why inputs and settings matter. Ecography 2013, 36, 1058–1069. [Google Scholar] [CrossRef] [Scilit]
- Wei, B.; Wang, R.; Hou, K.; Wang, X.; Wu, W. Predicting the current and future cultivation regions of Carthamus tinctorius L. using MaxEnt model under climate change in China. Glob. Ecol. Conserv. 2018, 16, e00477. [Google Scholar] [CrossRef] [Scilit]
- Guisan, A.; Zimmermann, N.E. Predictive habitat distribution models in ecology. Ecol. Model. 2000, 135, 147–186. [Google Scholar] [CrossRef] [Scilit]
- Fick, S.E.; Hijmans, R.J. WorldClim 2: New 1-km spatial resolution climate surfaces for global land areas. Int. J. Climatol. 2017, 37, 4302–4315. [Google Scholar] [CrossRef] [Scilit]
- Wiens, J.J.; Ackerly, D.D.; Allen, A.P.; Anacker, B.L.; Buckley, L.B.; Cornell, H.V.; Damschen, E.I.; Davies, T.J.; Grytnes, J.A.; Harrison, S.P.; et al. Niche conservatism as an emerging principle in ecology and conservation biology. Ecol. Lett. 2010, 13, 1310–1324. [Google Scholar] [CrossRef] [Scilit]
- Guo, J.; Yang, X.C.; Jiang, W.G.; Xing, X.Y.; Zhang, M.; Chen, A.; Yang, D.; Yang, M.X.; Wei, L.D.; Xu, B. Resistance of Grassland under Different Drought Types in the Inner Mongolia Autonomous Region of China. Remote Sens. 2023, 15, 5045. [Google Scholar] [CrossRef] [Scilit]
- Song, D.; Hu, Z.; Yu, Y.; Zhang, F.; Sun, H. Assessing Ecological Impacts and Recovery in Coal Mining Areas: A Remote Sensing and Field Data Analysis in Northwest China. Remote Sens. 2024, 16, 2236. [Google Scholar] [CrossRef] [Scilit]
- Wang, Q.; Zou, J.; Liu, Y.; Li, J.; Liu, X.; Zhang, H.; Jiao, F.; Meng, Q.; Guo, Z. Impacts of Farming Activities on Nitrogen Degradability under a Temperate Continental Monsoon Climate. Agronomy 2024, 14, 1094. [Google Scholar] [CrossRef] [Scilit]
- Wang, W.; Guo, J. Regionalization and Analysis of Precipitation Variations in Inner Mongolia. Atmosphere 2025, 16, 216. [Google Scholar] [CrossRef] [Scilit]
- Liu, H.; Na, Y.; Wu, Y.; Li, Z.; Qu, Z.; Lv, S.; Jiang, R.; Sun, N.; Hao, D. Spatiotemporal Patterns of Vegetation Coverage and Its Response to Land-Use Change in the Agro-Pastoral Ecotone of Inner Mongolia, China. Land 2025, 14, 1202. [Google Scholar] [CrossRef] [Scilit]
- Shi, X.; Wang, J.; Zhang, L.; Chen, S.; Zhao, A.; Ning, X.; Fan, G.; Wu, N.; Zhang, L.; Wang, Z. Prediction of the potentially suitable areas of Litsea cubeba in China based on future climate change using the optimized MaxEnt model. Ecol. Indic. 2023, 148, 110093. [Google Scholar] [CrossRef] [Scilit]
- Di Febbraro, M.; Bosso, L.; Fasola, M.; Santicchia, F.; Aloise, G.; Lioy, S.; Tricarico, E.; Ruggieri, L.; Bovero, S.; Mori, E.; et al. Different facets of the same niche: Integrating citizen science and scientific survey data to predict biological invasion risk under multiple global change drivers. Glob. Change Biol. 2023, 29, 5509–5523. [Google Scholar] [CrossRef] [Scilit]
- Annessi, M.; Riccieri, A.; Marconi, M.; Rossi, S.; Di Giulio, A. Integrating taxonomic, genetic and ecological data to explore the species richness of wild bees (Hymenoptera, Apoidea, Anthophila) of the Culuccia Peninsula (NE Sardinia, Italy). J. Hymenopt. Res. 2025, 98, 117–145. [Google Scholar] [CrossRef] [Scilit]
- He, Y.; Ma, J.; Chen, G. Potential geographical distribution and its multi-factor analysis of Pinus massoniana in China based on the maxent model. Ecol. Indic. 2023, 154, 110790. [Google Scholar] [CrossRef] [Scilit]
- Wang, Y.; Xie, L.; Zhou, X.; Chen, R.; Zhao, G.; Zhang, F. Prediction of the potentially suitable areas of Leonurus japonicus in China based on future climate change using the optimized MaxEnt model. Ecol. Evol. 2023, 13, e10597. [Google Scholar] [CrossRef] [Scilit]
- Zhang, X.F.; Nizamani, M.M.; Jiang, C.; Fang, F.Z.; Zhao, K.K. Potential planting regions of Pterocarpus santalinus (Fabaceae) under current and future climate in China based on MaxEnt modeling. Ecol. Evol. 2024, 14, e11409. [Google Scholar] [CrossRef] [Scilit]
- Rayburn, A.P.; Monaco, T.A. Linking Plant Spatial Patterns and Ecological Processes in Grazed Great Basin Plant Communities. Rangel. Ecol. Manag. 2011, 64, 276–282. [Google Scholar] [CrossRef] [Scilit]
- Franklin, J. Spatial Point Pattern Analysis of Plants. In Perspectives on Spatial Data Analysis; Anselin, L., Rey, S.J., Eds.; 2010; pp. 113–123. [Google Scholar]
- Zhu, D.P.; Yang, L.; Li, Y.h.; Huang, P.; Yao, B.; Kong, Z.; Xiang, Y. Predicting the Potential Distribution of the Endangered Pyrethrum tatsienense in China Using an Optimized Maxent Model Under Climate Change Scenarios. Ecol. Evol. 2024, 14, e70503. [Google Scholar] [CrossRef] [Scilit]
- Kelly, K.M.; Dennis, M.L. Transforming between WGS84 Realizations. J. Surv. Eng. 2022, 148, 04021031. [Google Scholar] [CrossRef] [Scilit]
- Halvorsen, R.; Mazzoni, S.; Dirksen, J.W.; Næsset, E.; Gobakken, T.; Ohlson, M. How important are choice of model selection method and spatial autocorrelation of presence data for distribution modelling by MaxEnt? Ecol. Model. 2016, 328, 108–118. [Google Scholar] [CrossRef] [Scilit]
- Xue, N.; Li, K.; Chen, K.; Li, P.; Ji, X.; Ma, Z.; Ji, W. Predicting climate change impacts on distribution and conservation of critically endangered Picea neoveitchii using MaxEnt. Front. For. Glob. Change 2024, 7, 1472857. [Google Scholar] [CrossRef] [Scilit]
- Elith, J.; Phillips, S.J.; Hastie, T.; Dudík, M.; Chee, Y.E.; Yates, C.J. A statistical explanation of MaxEnt for ecologists. Divers. Distrib. 2011, 17, 43–57. [Google Scholar] [CrossRef] [Scilit]
- Hijmans, R.J.; Cameron, S.E.; Parra, J.L.; Jones, P.G.; Jarvis, A. Very high resolution interpolated climate surfaces for global land areas. Int. J. Climatol. 2005, 25, 1965–1978. [Google Scholar] [CrossRef] [Scilit]
- Boria, R.A.; Olson, L.E.; Goodman, S.M.; Anderson, R.P. Spatial filtering to reduce sampling bias can improve the performance of ecological niche models. Ecol. Model. 2014, 275, 73–77. [Google Scholar] [CrossRef] [Scilit]
- Wisz, M.S.; Hijmans, R.J.; Li, J.; Peterson, A.T.; Graham, C.H.; Guisan, A.; Distribut, N.P.S. Effects of sample size on the performance of species distribution models. Divers. Distrib. 2008, 14, 763–773. [Google Scholar] [CrossRef] [Scilit]
- Chen, L.F.; Kong, J.Q.; He, Z.B.; Zhao, W.Z.; Song, M.D.; Li, Y.M.; Gao, Y.; Yang, S.P. A Fundamental Role of Slope Aspect and Elevation in Controlling Diversity Patterns of Soil Bacterial Communities: Insights from an Arid-Montane Ecosystem in China. J. Soil Sci. Plant Nutr. 2022, 22, 3996–4007. [Google Scholar] [CrossRef] [Scilit]
- Wu, T.; Lu, Y.; Fang, Y.; Xin, X.; Li, L.; Li, W.; Jie, W.; Zhang, J.; Liu, Y.; Zhang, L.; et al. The Beijing Climate Center Climate System Model (BCC-CSM): The main progress from CMIP5 to CMIP6. Geosci. Model Dev. 2019, 12, 1573–1600. [Google Scholar] [CrossRef] [Scilit]
- Song, H.; Xing, Q. Climate-Driven Changes in Spring Dust Emissions Over China: WRF-Chem Projections Under SSP2-4.5 and SSP5-8.5 Scenarios. Earth Space Sci. 2025, 12, e2025EA004440. [Google Scholar] [CrossRef] [Scilit]
- Collette, N.; Pinel, S.; Delorme-Hinoux, V.; Bertrand, J.A.M. Projecting spatiotemporal bioclimatic niche dynamics of endemic Pyrenean plant species under climate change: How much will we lose? Ecography 2025, 2026, e08067. [Google Scholar] [CrossRef] [Scilit]
- Huggett, R. Soil as part of the Earth system. Prog. Phys. Geogr. Earth Environ. 2023, 47, 454–466. [Google Scholar] [CrossRef] [Scilit]
- Yong, D.; Xu, D.; Deng, X.; He, Z.; Liu, B.; Yang, X.; Zhuo, Z. The Potential Distribution of Termitomyces spp. in China Based on MaxEnt Model Analysis. Ecol. Evol. 2025, 15, e71477. [Google Scholar] [CrossRef] [Scilit]
- Wang, X.; Li, Z.; Zhang, L.; Wang, Y.; Liu, Y.; Ma, Y. The optimized Maxent model reveals the pattern of distribution and changes in the suitable cultivation areas for Reaumuria songarica being driven by climate change. Ecol. Evol. 2024, 14, e70015. [Google Scholar] [CrossRef] [Scilit]
- Guo, G.; Zou, X.; Zhang, Y. The Dual Effects of Climate Change and Human Activities on the Spatiotemporal Vegetation Dynamics in the Inner Mongolia Plateau from 1982 to 2022. Land 2025, 14, 1559. [Google Scholar] [CrossRef] [Scilit]
- Wen, X.; Fang, G.; Chai, S.; He, C.; Sun, S.; Zhao, G.; Lin, X. Can ecological niche models be used to accurately predict the distribution of invasive insects? A case study of Hyphantria cunea in China. Ecol. Evol. 2024, 14, e11159. [Google Scholar] [CrossRef] [Scilit] [PubMed]
- Phillips, S.J.; Anderson, R.P.; Dudík, M.; Schapire, R.E.; Blair, M.E. Opening the black box: An open-source release of Maxent. Ecography 2017, 40, 887–893. [Google Scholar] [CrossRef] [Scilit]
- Bosso, L.; Fichera, G.; Mucedda, M.; Pidinchedda, E.; Veith, M.; Smeraldo, S.; De Pasquale, P.P.; Mori, E.; Ancillotto, L. Island Life and Interspecific Dynamics Influence Body Size, Distribution and Ecological Niche of Long-Eared Bats. J. Biogeogr. 2026, 53, e70071. [Google Scholar] [CrossRef] [Scilit]
- Valavi, R.; Guillera-Arroita, G.; Lahoz-Monfort, J.J.; Elith, J. Predictive performance of presence-only species distribution models: A benchmark study with reproducible code. Ecol. Monogr. 2022, 92, e1486. [Google Scholar] [CrossRef] [Scilit]
- Kang, Y.; Lin, F.; Yin, J.M.; Han, Y.J.; Zhu, M.; Guo, Y.H.; Tang, F.L.; Li, Y.M. Projected distribution patterns of Alpinia officinarum in China under future climate scenarios: Insights from optimized Maxent and Biomod2 models. Front. Plant Sci. 2025, 16, 1517060. [Google Scholar] [CrossRef] [Scilit]
- Muscarella, R.; Galante, P.J.; Soley-Guardia, M.; Boria, R.A.; Kass, J.M.; Uriarte, M.; Anderson, R.P.; McPherson, J. ENMeval: An R package for conducting spatially independent evaluations and estimating optimal model complexity for Maxent ecological niche models. Methods Ecol. Evol. 2014, 5, 1198–1205. [Google Scholar] [CrossRef] [Scilit]
- Xiang, Y.Z.; Yang, Q.; Li, S.H.; Liu, Y.; Li, Y.; Ren, J.; Yao, J.X.; Luo, X.Q.; Luo, Y.; Yao, B. Climate Change Drives Northwestward Migration of Betula alnoides: A Multi-Scenario MaxEnt Modeling Approach. Plants 2025, 14, 2539. [Google Scholar] [CrossRef] [Scilit]
- Warren, D.L.; Seifert, S.N. Ecological niche modeling in Maxent: The importance of model complexity and the performance of model selection criteria. Ecol. Appl. 2011, 21, 335–342. [Google Scholar] [CrossRef] [Scilit]
- Meena, R.K.; Bhandari, M.S.; Thakur, P.K.; Negi, N.; Pandey, S.; Kant, R.; Sharma, R.; Sahu, N.; Avtar, R. MaxEnt-Based Potential Distribution Mapping and Range Shift under Future Climatic Scenarios for an Alpine Bamboo Thamnocalamus spathiflorus in Northwestern Himalayas. Land 2024, 13, 931. [Google Scholar] [CrossRef] [Scilit]
- Du, Z.; He, Y.; Wang, H.; Wang, C.; Duan, Y. Potential geographical distribution and habitat shift of the genus Ammopiptanthus in China under current and future climate change based on the MaxEnt model. J. Arid Environ. 2021, 184, 104328. [Google Scholar] [CrossRef] [Scilit]
- Brown, J.L.; Anderson, B. SDMtoolbox: A python-based GIS toolkit for landscape genetic, biogeographic and species distribution model analyses. Methods Ecol. Evol. 2014, 5, 694–700. [Google Scholar] [CrossRef] [Scilit]
- Yan, H.; Feng, L.; Zhao, Y.; Feng, L.; Wu, D.; Zhu, C. Prediction of the spatial distribution of Alternanthera philoxeroides in China based on ArcGIS and MaxEnt. Glob. Ecol. Conserv. 2020, 21, e00856. [Google Scholar] [CrossRef] [Scilit]
- Rehan, M.; Hassan, A.; Zeb, S.; Ullah, S.; Ahmad, F.; Bohnett, E.; Bosso, L.; Fida, T.; Kabir, M. Application of species distribution models to estimate and manage the Asiatic black bear (Ursus thibetanus) habitat in the Hindu Kush Mountains, Pakistan. Eur. J. Wildl. Res. 2024, 70, 11. [Google Scholar] [CrossRef] [Scilit]
- Sarab, S.A.; Zilaie, M.N.; Dinarvand, M.; Arami, S.H. Land suitability mapping for Dalbergia sissoo cultivation in Khuzestan province using MaxEnt modeling. For. Ecol. Manag. 2026, 601, 123368. [Google Scholar] [CrossRef] [Scilit]
- Zhang, K.; Zhang, Y.; Zhou, C.; Meng, J.; Sun, J.; Zhou, T.; Tao, J. Impact of climate factors on future distributions of Paeonia ostii across China estimated by MaxEnt. Ecol. Inform. 2019, 50, 62–67. [Google Scholar] [CrossRef] [Scilit]
- Liu, C.; Newell, G.; White, M. On the selection of thresholds for predicting species occurrence with presence-only data. Ecol. Evol. 2015, 6, 337–348. [Google Scholar] [CrossRef] [Scilit]
- Goodchild, M.F. Geographic information systems and science: Today and tomorrow. In Proceedings of the International Conference on Mining Science & Technology (ICMST2009), Xuzhou, China, 18–20 October 2009; pp. 1037–1043. [Google Scholar]
- Harsha, J.; Ravikumar, A.S.; Shivakumar, B.L. Evaluation of morphometric parameters and hypsometric curve of Arkavathy river basin using RS and GIS techniques. Appl. Water Sci. 2020, 10, 1–15. [Google Scholar] [CrossRef] [Scilit]
- Xu, J.; Xu, D.W.; Qu, C. Construction of Ecological Security Pattern and Identification of Ecological Restoration Zones in the City of Changchun, China. Int. J. Environ. Res. Public Health 2023, 20, 289. [Google Scholar] [CrossRef] [Scilit]
- van Wijk, J.J. The value of visualization. In Proceedings of the IEEE Visualization 2005, Minneapolis, MN, USA, 23–28 October 2005; pp. 79–86. [Google Scholar]
- Hu, X.X.; Hirota, M.; Wuyunna; Kawada, K.; Li, H.; Meng, S.K.; Tamura, K.; Kamijo, T. Responses in gross primary production of Stipa krylovii and Allium polyrhizum to a temporal rainfall in a temperate grassland of Inner Mongolia, China. J. Arid Land 2019, 11, 824–836. [Google Scholar] [CrossRef] [Scilit]
- Dyakov, N.R. Spatial Distribution of Dominant Plants Species According to Local Environmental Gradients. Appl. Ecol. Environ. Res. 2016, 14, 327–347. [Google Scholar] [CrossRef] [Scilit]
- Fanselow, N.; Schönbach, P.; Gong, X.Y.; Lin, S.; Taube, F.; Loges, R.; Pan, Q.M.; Dittert, K. Short-term regrowth responses of four steppe grassland species to grazing intensity, water and nitrogen in Inner Mongolia. Plant Soil 2011, 340, 279–289. [Google Scholar] [CrossRef] [Scilit]
- Liu, X.N.; Qiang, L.; Wang, H.X.; Ren, Z.C.; He, G.X.; Zhang, D.G.; Han, T.H.; Bin, S.; Pan, D.R.; Tong, J. Response of potential grassland vegetation to historical and future climate change in Inner Mongolia. Rangel. J. 2021, 43, 329–338. [Google Scholar] [CrossRef] [Scilit]
- Farashi, A.; Karimian, Z. Assessing climate change risks to the geographical distribution of grass species. Plant Signal. Behav. 2021, 16, 1913311. [Google Scholar] [CrossRef] [Scilit]
- Dormaar, J.F.; Naeth, M.A.; Willms, W.D.; Chanasyk, D.S. Effect of native prairie, crested wheatgrass (Agropyron-cristatum (L) gaertn) and russian wildrye (Elymus-junceus fisch) on soil chemical-properties. J. Range Manag. 1995, 48, 258–263. [Google Scholar] [CrossRef] [Scilit]
- Wang, Y.Q.; Qiu, J.; Meng, Y.; Li, Q. Morphological-physiological responses of three species of Agropyron to drought stress in Xinjiang, China. Funct. Plant Biol. 2026, 53, FP25179. [Google Scholar] [CrossRef] [Scilit]
- Song, B.; Niu, S.L.; Wan, S.Q. Precipitation regulates plant gas exchange and its long-term response to climate change in a temperate grassland. J. Plant Ecol. 2016, 9, 531–541. [Google Scholar] [CrossRef] [Scilit]
- Zhang, H.X.; Gao, Y.Z.; Tasisa, B.Y.; Baskin, J.M.; Baskin, C.C.; Lü, X.T.; Zhou, D.W. Divergent responses to water and nitrogen addition of three perennial bunchgrass species from variously degraded typical steppe in Inner Mongolia. Sci. Total Environ. 2019, 647, 1344–1350. [Google Scholar] [CrossRef] [Scilit]
- Louhaichi, M.; Toshpulot, R.; Moyo, H.P.; Belgacem, A.O. Effect of slope aspect on vegetation characteristics in mountain rangelands of Tajikistan: Considerations for future ecological management and restoration. Afr. J. Range Forage Sci. 2021, 39, 320–328. [Google Scholar] [CrossRef] [Scilit]
- Jones, R. Landscape ecology: In theory and practice, pattern and process. Geography 2002, 87, 369–370. [Google Scholar]
- Liu, Z.M.; Shou, W.K.; Qian, J.Q.; Wu, J.; Busso, C.A.; Hou, X.Z. Level of habitat fragmentation determines its non-linear relationships with plant species richness, frequency and density at desertified grasslands in Inner Mongolia, China. J. Plant Ecol. 2018, 11, 866–876. [Google Scholar] [CrossRef] [Scilit]
- Li, C.J.; Chen, H.P.; Wang, S.; Yao, X.L.; Chen, H.B.; Guo, Y.; Mao, Z.H.; Fu, B.J. Land degradation and ecological restoration in desert steppe of Bayannur of Inner Mongolia, China. Ecol. Front. 2025, 45, 689–692. [Google Scholar] [CrossRef] [Scilit]
- Park, J.H.; Lee, S.H.; Kim, Y.S.; Park, J.W.; Park, Y.B.; Kim, E.J.; You, Y.H. Vegetation cover is a crucial key to the success of ecological restoration in the desertified steppe of Inner Mongolia. Ecol. Indic. 2024, 165, 112241. [Google Scholar] [CrossRef] [Scilit]
- Li, Y.Y.; Wei, M.; Zhou, R.; Jin, H.; Chen, Y.S.; Hong, C.J.; Duan, W.T.; Li, Q.Y. Identifying priority restoration areas based on ecological security pattern: Implications for ecological restoration planning. Ecol. Indic. 2025, 174, 113486. [Google Scholar] [CrossRef] [Scilit]
- Ahmed, A. Land abandonment after land grabbing: Exploring the implications for local climate change adaptation and ecological restoration in Ghana. Reg. Environ. Change 2024, 24, 71. [Google Scholar] [CrossRef] [Scilit]
- Eschen, R.; Bekele, K.; Jumanne, Y.; Kibet, S.; Makale, F.; Mbwambo, J.R.; Megersa, B.; Mijay, M.; Moyo, F.; Munishi, L.; et al. Experimental prosopis management practices and grassland restoration in three Eastern African countries. Cabi Agric. Biosci. 2023, 4, 21. [Google Scholar] [CrossRef] [Scilit]
- Anderson, J.T.; DeMarche, M.L.; Denney, D.A.; Breckheimer, I.; Santangelo, J.; Wadgymar, S.M. Adaptation and gene flow are insufficient to rescue a montane plant under climate change. Science 2025, 388, 525–531. [Google Scholar] [CrossRef] [Scilit] [PubMed]
- Nunez, S.; Alkemade, R.; Kok, K.; Leemans, R. Potential biodiversity change in Central Asian grasslands: Scenarios for the impact of climate and land-use change. Reg. Environ. Change 2020, 20, 39. [Google Scholar] [CrossRef] [Scilit]

Disclaimer/Publisher’s Note: The statements, opinions and data contained in all publications are solely those of the individual author(s) and contributor(s) and not of MDPI and/or the editor(s). MDPI and/or the editor(s) disclaim responsibility for any injury to people or property resulting from any ideas, methods, instructions or products referred to in the content. |
© 2026 by the authors. Licensee MDPI, Basel, Switzerland. This article is an open access article distributed under the terms and conditions of the Creative Commons Attribution (CC BY) license.