Article

Recapturing Vipera ursinii: Photo-Identification and HDF Telemetry in a Meadow Viper Population from Maiella National Park, Italy

1
Sezione Abruzzo-Molise of the Societas Herpetologica Italica, 67100 L’Aquila, AQ, Italy
2
Department of Veterinary Medicine, University of Perugia, via San Costanzo 4, 06126 Perugia, PG, Italy
3
ANVA—Associazione Naturalistica Valle dell’Aniene, via delle Ginestre 30, 00012 Guidonia Montecelio, RM, Italy
4
Centro Studi Arcadia, via Valverde 4, 01016 Tarquinia, VT, Italy
5
G.N.M.L. Gruppo Naturalistico della Maremma Laziale, Località San Giorgio nsc., 01016 Tarquinia, VT, Italy
6
Department of Life, Health and Environmental Sciences, University of L’Aquila, via Vetoio Coppito, 67100 L’Aquila, AQ, Italy
7
Ufficio Monitoraggio e Gestione della Fauna Selvatica, Parco Nazionale della Maiella, via Badia 28, 67039 Sulmona, AQ, Italy
*
Author to whom correspondence should be addressed.
Diversity 2026, 18(4), 202; https://doi.org/10.3390/d18040202
Submission received: 31 December 2025 / Revised: 27 February 2026 / Accepted: 4 March 2026 / Published: 30 March 2026
(This article belongs to the Special Issue Amphibian and Reptile Adaptation: Biodiversity and Monitoring)

Abstract

Reliable individual identification and minimally invasive tracking are essential for monitoring threatened snake populations. A relict high-altitude population of Vipera ursinii ursinii was studied in the Maiella National Park (Central Apennines, Italy) during two field seasons (2024–2025) to (i) validate dorsal head photo-identification against unequivocal PIT-tag identities and (ii) test a novel, non-invasive telemetry method based on externally attached harmonic diodes detected with a RECCO® harmonic direction finder (HDF). All analysed snakes were PIT-tagged and photographed under standardised conditions. Manual photo-identification based on dorsal cephalic scale counts was performed independently by four blinded operators. In parallel, software-assisted photo-identification was conducted with two independent programmes (Wild-ID and Hotspotter). Both methods were evaluated exclusively against PIT-tag-confirmed identities. Manual identification achieved moderate-to-high overall accuracy (0.77–0.91) but showed marked inter-operator variability. Software-assisted matching appeared more consistent: Hotspotter identified 75% of true recaptures at first suggestion (85% within the top six suggestions), while Wild-ID identified 56% at first suggestion (88% within the top six). Correct matches were primarily supported by the distinctive pholidosis of the dorsal head region, especially apical, intercanthal and parafrontal scales—which were highly diverse but independent of sex and age class in the studied population. Externally attached HDF diodes enabled repeated short-term relocations with detachments occurring within hours to several days and mostly associated with ecdysis. The method was minimally invasive, supporting its applicability for monitoring small-bodied animals with low-density populations and restricted ranges.

1. Introduction

Reliable individual identification is a cornerstone of capture–recapture studies, as it underpins the estimation of key demographic parameters such as population size, survival, and reproductive output [1,2]. In herpetology, traditional marking techniques—including toe/scale clipping, elastomers, shell notching—have historically provided essential data, but their invasive nature raises both ethical and health concerns and may bias demographic estimates by affecting survival, behaviour, or recapture probability [2,3]. In snakes, traditional marking techniques such as scale clipping have been widely used, but they are inherently invasive and their limitations are particularly relevant for small-bodied species. Photographic identification methods (PIM) have therefore gained increasing relevance as a non-invasive alternative in herpetological research. PIM exploits the presence of stable, individually distinctive natural markings—such as colour patterns or scale arrangements—that can act as natural identifiers when recorded through standardised photographs [1,4,5,6]. In snakes, the relative stability of pholidosis and colour patterning over time makes different body regions suitable for individual recognition, providing an effective substitute for permanent physical marking while reducing ethical and methodological drawbacks [3]. Indeed, photographs of the dorsal head region have long been used for individual recognition in snakes. The combined evaluation of cephalic scale number and morphology, dorsal patterning, colouration, and sex has proven effective for assigning unique identification codes and enable consistent recognition across recapture events [4,6,7]. In European vipers, these approaches are especially well supported, as most species exhibit individually distinctive head pholidosis and unique body colour patterns. The usefulness of these traits for individual identification has been demonstrated in Vipera ursinii [8], Vipera berus [4,6,7,9,10,11], and Vipera ammodytes [12]. Moreover, the applicability of software-assisted photo-identification has been explicitly tested in these vipers, including the use of Hotspotter in V. ammodytes [13] and I3S software in V. berus [7], providing a methodological foundation for the present study.
The practical implementation of photographic identification has been greatly facilitated by the development of computer-aided matching software. Feature-based algorithms extract and compare distinctive keypoints within images, allowing robust matching despite moderate variation in scale, orientation, or viewpoint [1,5]. Wild-ID [14] and Hotspotter [15] are softwares widely used in herpetological studies, both based on the Scale-Invariant Feature Transform (SIFT) algorithm. SIFT detects stable local features within an image and describes them mathematically, allowing the same individual to be recognised across photographs taken under different conditions [1,5]. In both programmes, candidate matches are ranked according to similarity scores, and final identification relies on expert visual validation, reducing the time required to process large photographic datasets. As a result, photographic identification supported by dedicated software is increasingly adopted in ecology and conservation studies, offering a scalable and reliable approach for individual-based monitoring [1,2].
Although photographic identification enables individual-based monitoring, independent marking techniques remain essential to confirm individual identity. Passive integrated transponder (PIT) tags are therefore widely used for individual identification in snake studies due to their small size, low cost, and long lifespan [16]. Moreover, the development of PIT telemetry, using portable antennas capable of detecting tags beyond tactile range, has substantially expanded PIT-tags ecological applications by permitting spatial relocation of concealed individuals [17]. PIT telemetry has proven effective for estimating movement patterns and population density in linear habitats, particularly for cryptic species [18], although detection range remains constrained relative to very high frequency (VHF) systems and is influenced by tag size, orientation, substrate, and antenna configuration [19].
To overcome these spatial limitations, telemetry based on active transmitters has long represented a cornerstone methodology for studying spatial ecology, movement patterns, and habitat use in snakes. Traditional radiotelemetry using VHF transmitters surgically implanted into the coelomic cavity has been widely applied to snakes, allowing continuous tracking over relatively large spatial scales and extended periods [20,21,22]. Despite its effectiveness, this method requires anaesthesia, specialised veterinary expertise, and post-operative recovery, limiting its applicability, especially when applied to small-bodied species. To reduce surgical invasiveness, alternative VHF-based techniques relying on external transmitter attachments have been developed, including fixation with tape, harnesses, adhesives, or scale suturing [23]. External VHF tagging avoids surgery and anaesthesia, substantially reducing procedural risks and logistical complexity [24]. A review by Christensen and Fantuzzi [23] reported that externally attached transmitters in snakes are most commonly positioned dorsally (92% of studies) and along the posterior third of the body (55%) or on the tail (40%), with adverse effects—including injury and mortality—reported in 37% of studies. Smaller and more slender snakes exhibited significantly higher probabilities of adverse outcomes associated with externally attached transmitters compared to larger species [23].
In recent years, harmonic direction finding (HDF) telemetry has emerged as a complementary, non-invasive alternative for tracking small-bodied and cryptic vertebrates for which conventional telemetry approaches are less suitable. HDF systems rely on ultralight, battery-free passive tags composed of a diode and antenna that re-radiate a harmonic signal when stimulated by an external transceiver, allowing animal relocation through directional scanning [24,25]. Owing to their minimal mass and unlimited operational lifespan, HDF tags have been widely applied in amphibian ecology and in reptile studies targeting early life stages or species below the size threshold for VHF transmitters (e.g. [25,26]). Although the signal emitted is not univocal across diodes, detection range is typically limited to a few metres and varies with habitat structure and substrate, comparative studies indicate that HDF telemetry yields movement and space-use estimates comparable to VHF telemetry at fine spatial scales [25]. These characteristics make HDF particularly suitable for studies on small snake species, where minimising invasiveness and transmitter burden is critical.
Vipera ursinii (Bonaparte 1835) is one of the most threatened snake species in Europe and represents a taxon of exceptional conservation value [27,28,29]. Due to its strict ecological specialisation, fragmented distribution, and limited dispersal capacity, the species is particularly vulnerable to habitat alteration and environmental change [30,31]. The conservation status of V. ursinii is currently assessed as Vulnerable at the global scale and Endangered at the national level in Italy [32,33]. Vipera ursinii ursinii (Bonaparte 1835), commonly known as Orsini’s viper, is a key member of the Vipera ursinii complex, a group of meadow and steppe vipers also referred to as the subgenus Acridophaga [34].
In Italy, Vipera ursinii is widely regarded as a flagship taxon for the conservation of high-altitude grassland ecosystems. The species persists in small, isolated relict populations confined to a few mountain massifs of the central Apennines, including the Gran Sasso, Maiella, Sirente Velino, Sibillini, Marsicano, Meta and Terminillo massifs [35,36]. Several historical localities have recently lost confirmed occurrences, such as Mount Terminillo, where the species has not been recorded since the mid-1990s (Filippi E., pers. comm.). The population inhabiting the Maiella massif is among the most ecologically significant within the Italian range of the species. Here, V. ursinii is restricted to high-altitude plateaus and grasslands embedded within extensive Pinus mugo formations, at elevations ranging approximately between 1700 and 2300 m a.s.l. [37]. These habitats are characterised by strong thermal contrasts, prolonged snow cover, and a vegetation mosaic, dominated by alpine and subalpine grasslands interspersed with dwarf juniper (Juniperus communis subsp. nana), which usually provide essential refuges for thermoregulation and predator avoidance for this species [38].
This study was conducted within the framework of the MAIA project (MonitorAggio della bIodiversità Altomontana del parco nazionale della Maiella) over two consecutive field seasons (2024–2025), focusing on a relict high-altitude population of V. ursinii ursinii in the Maiella National Park (Central Apennines, Italy). The aims of the paper are twofold. First, the study evaluates whether the dorsal head region provides sufficiently stable and distinctive features to enable reliable photo-identification of individual vipers. Manual identification, based on dorsal cephalic scale counts, was performed by four independent and blinded operators. In parallel, software-assisted individual recognition was performed using two independent programmes. Both approaches were applied to the same original image dataset generated within the MAIA project and restricted to individuals bearing implanted PIT tags. Method performance was evaluated exclusively through validation against the unequivocal PIT-tag-based individual identity, which served as the positive control. Second, the paper introduces and documents the application of a novel non-invasive telemetry approach based on harmonic direction finding (HDF) using RECCO® technology, discussing its feasibility, performance, and methodological constraints when applied to small-bodied snakes such as V. ursinii. By integrating PIT-tag-validated photo-identification with experimental HDF-based telemetry, the study aims to provide methodological insights applicable to the monitoring and conservation of small, threatened snake species in alpine and subalpine environments.

2. Materials and Methods

2.1. Study Area

The study was conducted within the Maiella National Park (Central Apennines, Italy), focusing on a high-altitude grassland system known as Pianoro del Martellese, lying at approximately 2000 m a.s.l. The site is characterised by a mosaic of alpine and subalpine pastures surrounded by extensive Pinus mugo formations, with scattered rocky outcrops and juniper shrubs. Active snake surveys were concentrated in a central core area of about 4.2 ha, with a substrate predominantly calcareous, highly permeable, and marked by shallow soils and fissured bedrock. Climatic conditions are continental-montane, with long snow cover periods and strong daily thermal fluctuations during the active season of reptiles. Vegetation is dominated by primary xerophilous and mesophilous grasslands (Festuca spp., Sesleria spp.), interspersed with dwarf juniper and bordered by dense P. mugo shrublands.

2.2. Snake Capture, Handling, PIT-Tag Implantation

Field activities were carried out during the active seasons (from June to October) of 2024 and 2025, following a standardised monitoring protocol with survey sessions approximately every two weeks, each lasting one or two consecutive days depending on weather conditions. Unlike survey sessions that lasted one entire day (from early morning to late afternoon), sessions composed of two consecutive days generally extended from noon of the first day until the late afternoon of the second day. On one occasion, a survey session lasting three consecutive days was conducted. Snakes were searched for using visual encounter surveys conducted by trained operators walking parallel transects at approximately 5 m spacing, covering the study area in a systematic zig-zag pattern. Searches targeted basking individuals as well as potential refuges, including stones, fissured rocks, juniper cushions, rodent burrows, and the margins of Pinus mugo stands. All V. ursinii individuals were captured by hand and temporarily restrained. Following capture, each snake was placed in a cloth bag and processed near the capture site. Individuals with a total weight ≥ 7 g (subadults and adults) were permanently marked with a PIT tag. PIT tags (8.3 mm length, 1.4 mm diameter; ISO 11784 FDX-B compliant; BackHome Mini transponder, VIRBAC S.r.l., Milano, Italy) were implanted subcutaneously in the anterior third of the body, with longitudinal orientation, following disinfection of the insertion site with povidone-iodine. Implantation was performed by an experienced veterinarian using sterile single-use injectors, ensuring the needle remained parallel to the body axis to avoid penetration of the coelomic cavity. To prevent early tag loss, the insertion site was sealed with a medical-grade tissue adhesive (Surgibond). Photographs were taken and diode attachment was performed (see Section 2.3 and Section 2.4 for further details). All snakes were released at their exact capture location.

2.3. Photographs, Manual Photo-Identification and Software-Assisted Photo-Identification

For photographic identification, most photographs were taken using a smartphone camera, with a smaller number obtained using a reflex camera, immediately after snake capture. Images included in the analysis were close-up photographs of the head region. Photographs were taken with the snake positioned on a reference background to ensure consistent scale and orientation. Only photos of individuals bearing PIT tags were included in the analysed dataset, allowing unequivocal validation of individual identity and subsequent comparison between photographic recognition outputs and the known PIT-tag identity. All photographs were standardised prior to analysis. Images were rotated to the same orientation and cropped before manual scale count by blinded operators or before being imported into the software. The dorsal head region was always retained as the core region of interest (ROI). When possible—i.e., when the trunk immediately posterior to the head was not rotated relative to the cranial axis—a short caudal portion of the body was also included, never exceeding the head length. In seven cases, the background or parts of it were blurred to prevent the inclusion of additional body regions that could potentially influence the analysis. In one case, brightness and contrast were adjusted to improve image quality. No further image manipulation was performed. The final image set of photographs used was identical for both manual photo-identification and software-assisted photo-identification.
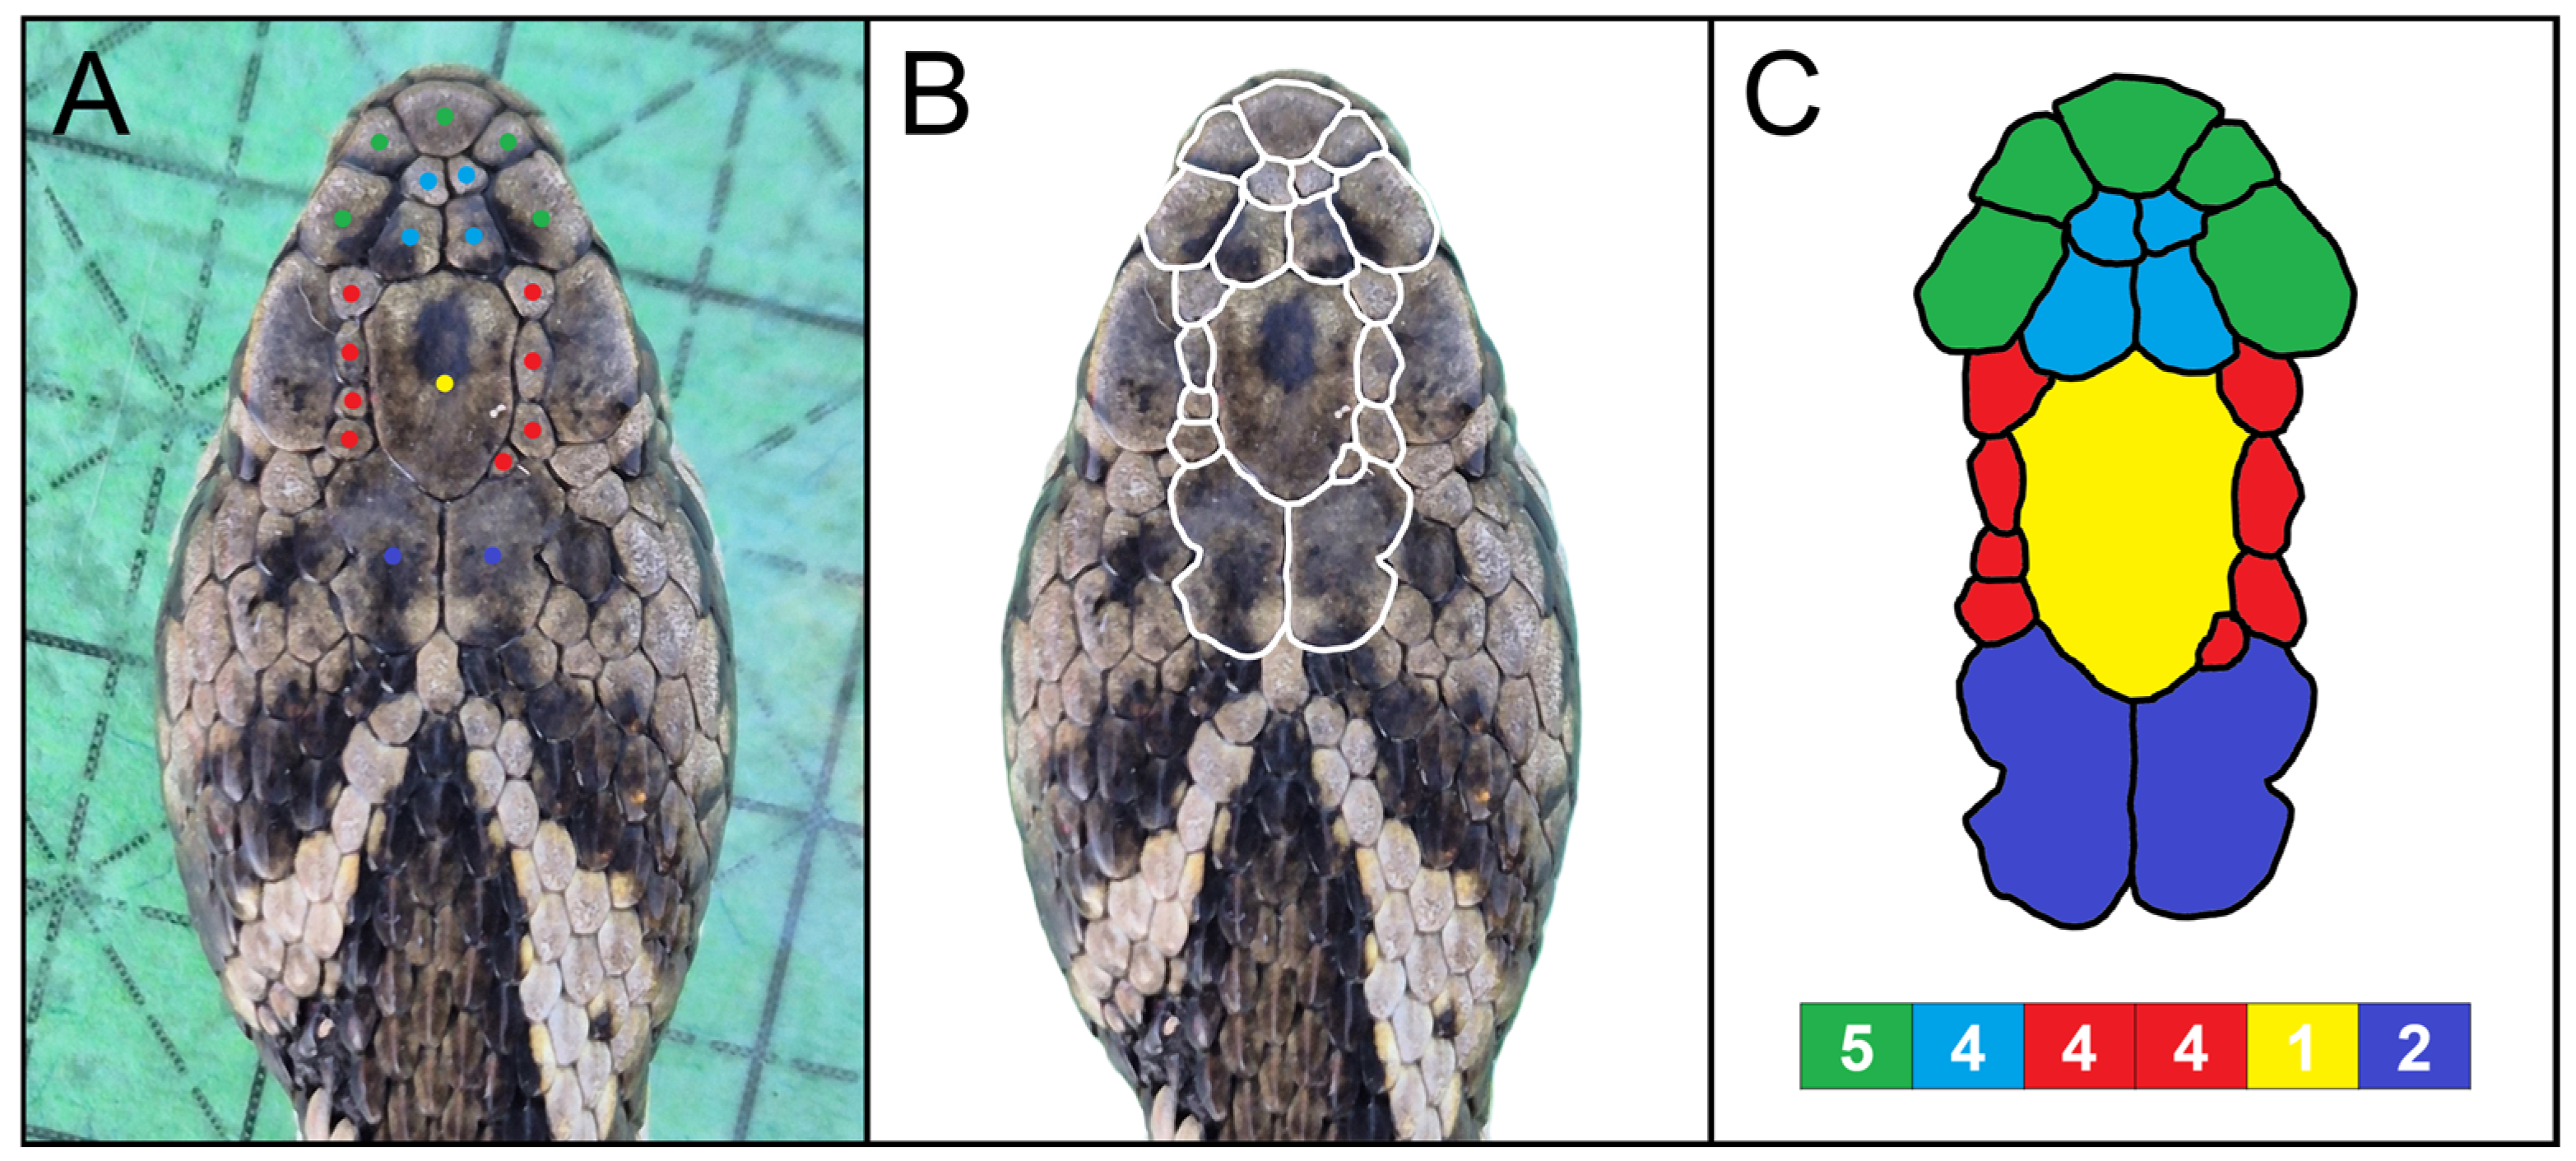
Four independent, blinded operators (i.e., operators who were unaware of the true identity of the individuals depicted in the images, as all photographs were anonymised and PIT-tag codes were masked) were asked to perform the manual photo-identification analysis. Operators were herpetologists with different level of experience with photo-identification techniques. Manual photo-identification was performed using a scale count-based approach, following the methodology described by Rey & Timmerman [7] and Bauwens et al. [9]. Each operator was provided with an illustrated reference image, in which the selected dorsal cephalic scale groups considered in the study were delineated and colour-coded (apicals + canthals, intercanthals, parafrontals left, parafrontals right, frontals and parietals—Figure 1). The image set, with individual identities masked, was provided to each operator. In addition to the photographic material, each operator received a dedicated spreadsheet to record the results of the manual identification (see Supplementary Table S1). The spreadsheet contained one row per photograph, linked to its masked ID and sex/age class of the individual (female/male/juvenile). Separate columns were included for each dorsal cephalic scale group, in which operators recorded the number of scales observed for that specific group. The file also included a column in which operators recorded a composite six-digit numerical code, obtained by concatenating the scale counts across all cephalic scale groups (Figure 1C). Finally, operators assigned a unique individual identification code (e.g., F1, M1, J1), initially filtering photographs by sex and age class, and subsequently grouping images based on the degree of correspondence among the numerical identifiers derived from cephalic scale counts. Images sharing identical numerical codes were usually considered candidate matches, which were then potentially confirmed or rejected through a subsequent visual re-evaluation of the photographs.
For each operator, a confusion matrix was constructed to compare the outcomes of manual photo-identification against PIT-tag identification (treated as the ground truth for individual identity and used exclusively for validation purposes). From each confusion matrix, performance metrics were extracted, including overall accuracy, sensitivity, specificity, and Cohen’s Kappa. All statistical analyses were conducted in the R environment [39] using the caret package (v. 7.0-1) [40].
Software-assisted photo-identification was performed using Wild-ID (version 1.0; [14]) and Hotspotter (version 2.0; [15]). To ensure direct comparability between the two programmes, the entire cropped image was used as the ROI in both analyses. This approach was required because Wild-ID does not allow further ROI cropping during analysis, whereas Hotspotter does. Descriptive statistics on scores (±standard deviation) of the first-ranked match and of the PIT-tag-validated correct match produced from both software are reported. It should be noted that the similarity scores provided by the software are dataset-dependent measures generated by the matching algorithms, and that score ranges vary with image set size and composition and are interpretable only within the same dataset [15].
The efficiency of the software was evaluated by comparing software-identified matches with the true identity of individuals known from the PIT tags. Hotspotter compares each image against all other images simultaneously, returning a ranked list of potential matches. Wild-ID compares each new image sequentially against previously analysed images, generating progressive match suggestions, making direct comparison with Hotspotter partially limited. Software performance was assessed based on: (i) matches correctly identified at the first suggestion, (ii) matches found within the first six suggested positions—since Hotspotter firstly suggests only the highest ranked six matches—and (iii) matches identified beyond the first six suggestions.

2.4. Dorsal Cephalic Scale Assessment

Dorsal cephalic scale counts were obtained from 32 standardised photographs of the dorsal head region, each corresponding to a unique individual of V. ursinii. Scale counts followed the manual identification protocol described in Section 2.3. In particular, after excluding photographs of recapture events, scale counts initially carried out by the blinded operator 1 were subsequently validated through independent inspection by two authors. The following scale categories were analysed: apicals + canthals, intercanthals, parafrontals left, parafrontals right, frontals and parietals. Descriptive statistics were calculated for each scale category to characterise the distribution of cephalic scale counts within the studied population. To assess whether cephalic scale counts varied among sex and age classes, contingency tables were constructed for each scale category. Associations between scale counts and sex/age classes (adult females, adult males, juveniles) were tested using chi-squared (χ2) tests. Statistical analyses were performed using JASP (version 0.95.2).

2.5. HDF Diodes Attachment and Field Detection

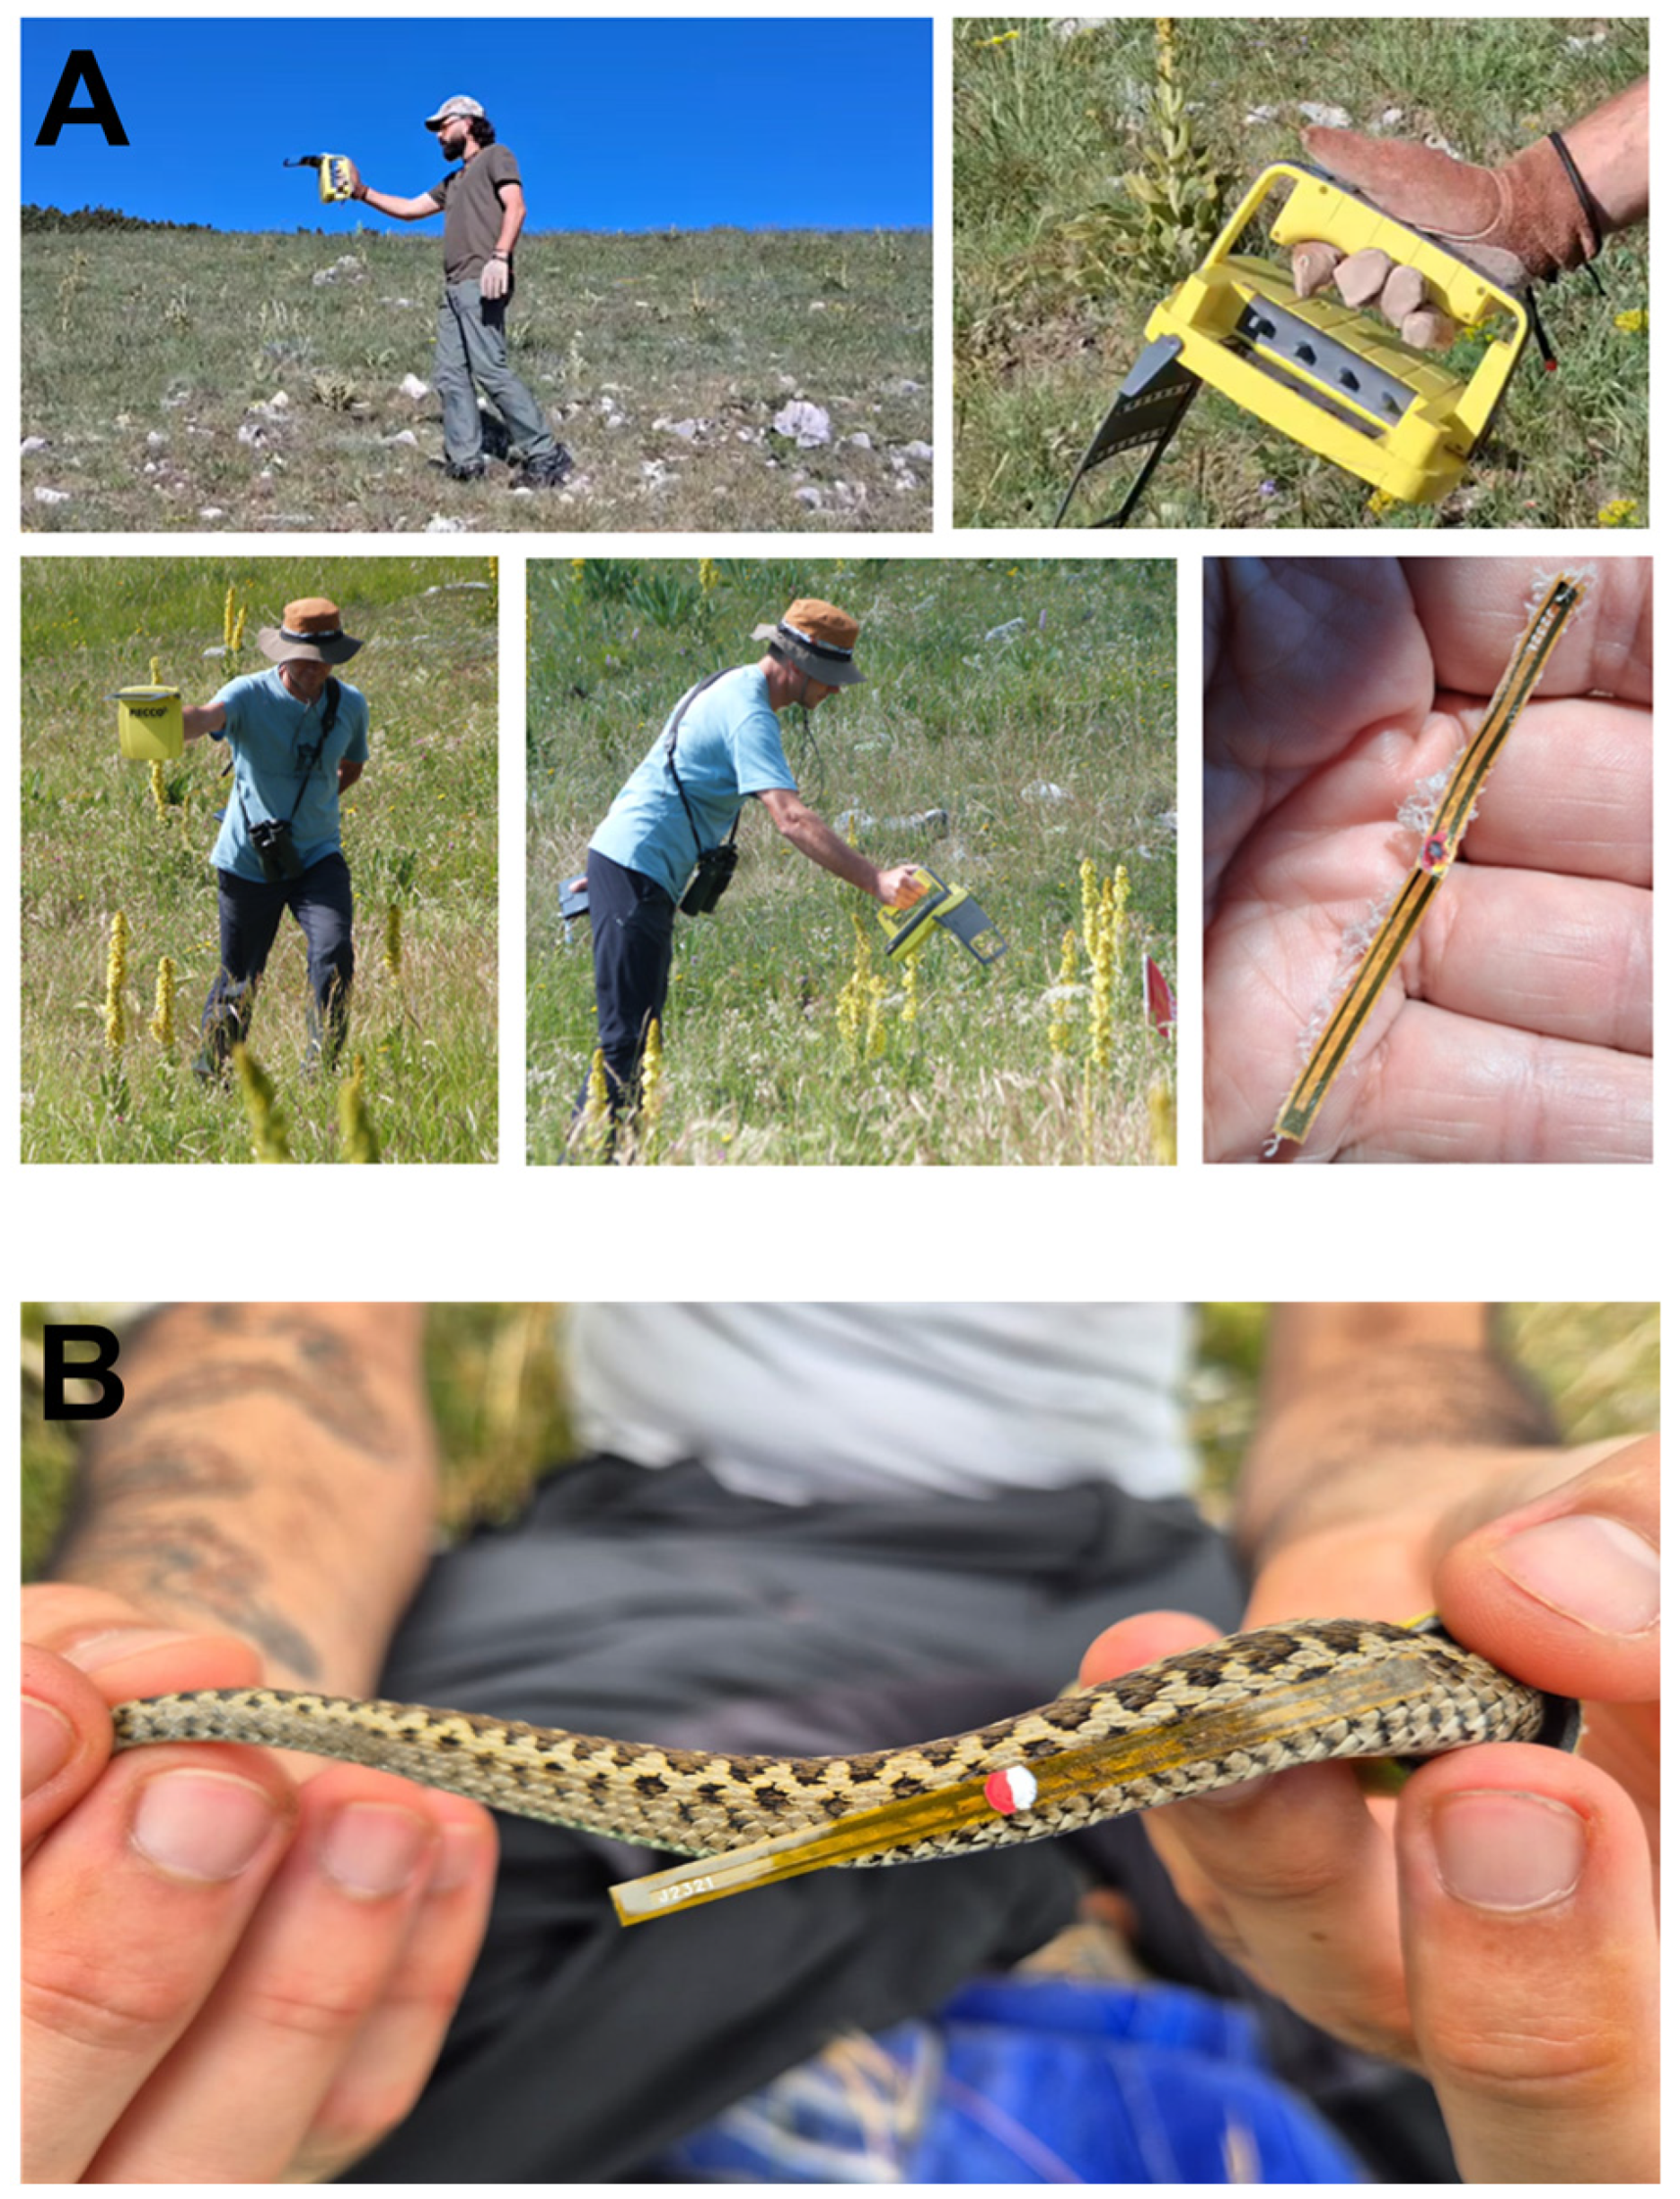
Vipera ursinii individuals were monitored using an external harmonic direction finder (HDF) telemetry approach based on the RECCO® system (Figure 2). HDF telemetry was applied to individuals exceeding 7 g in total weight. The system consisted of a RECCO handheld transmitter/receiver (RECCO 5000; RECCO AB, Lidingö, Sweden) and ultra-light passive diode reflectors (≈0.02 g – RECCO AB, Lidingö, Sweden), externally attached to the snake’s body. Diodes were fixed to the integument using cyanoacrylate based surgical adhesive (Surgibond) and cyanoacrylate based high-viscosity glue (Loctite Super Attak Power Gel). The attachment method consisted of fixing only one half of the diode to the lateral surface of the posterior third of the trunk, with longitudinal orientation. Prior to attachment, each diode was coded using unique colours or colour combinations. All attachment procedures were performed with the snake safely restrained, minimising handling time and stress which lasted 10–15 min. After fixation, adhesive curing was verified before releasing the individual at the exact capture location. Diodes were searched during subsequent surveys using the RECCO receiver.
Field detection was performed by scanning the area with the RECCO receiver, adjusting gain and volume settings to optimise signal detection and localization. High gain was used for initial detection at longer distances, followed by progressive reduction in gain and volume to refine localization as the operator approached the signal source. When possible (e.g., vipers basking in exposed microhabitats), binoculars were used to visually locate individuals at an approximate distance of 4–5 m thereby reducing disturbance while also enabling recognition of the colour combination of the diodes and facilitating behavioural observations. Signal modulation caused by changes in reflector location was used to infer movement, including when snakes were not visible. At the end of each field session, individuals still bearing an attached diode were left with the device remaining in place.

3. Results

3.1. Photographs Selection

A total of 33 individuals were captured and marked with PIT tags. Of these, five individuals were recaptured once and four individuals were recaptured during two different sessions, resulting in a total of 13 recapture events. Among PIT-tagged snakes, one individual was captured but never photographed, and one individual was recaptured once but not photographed during the recapture event. In this latter case, only the photograph from the initial capture was retained, and the recapture event was excluded, with no additional images included in the image set. The final image set was composed of a total of 44 images from 32 individuals and 12 recapture photos, used in both manual and software-assisted photo-identification.

3.2. Manual Photo-Identification Based on Dorsal Cephalic Scale Counts

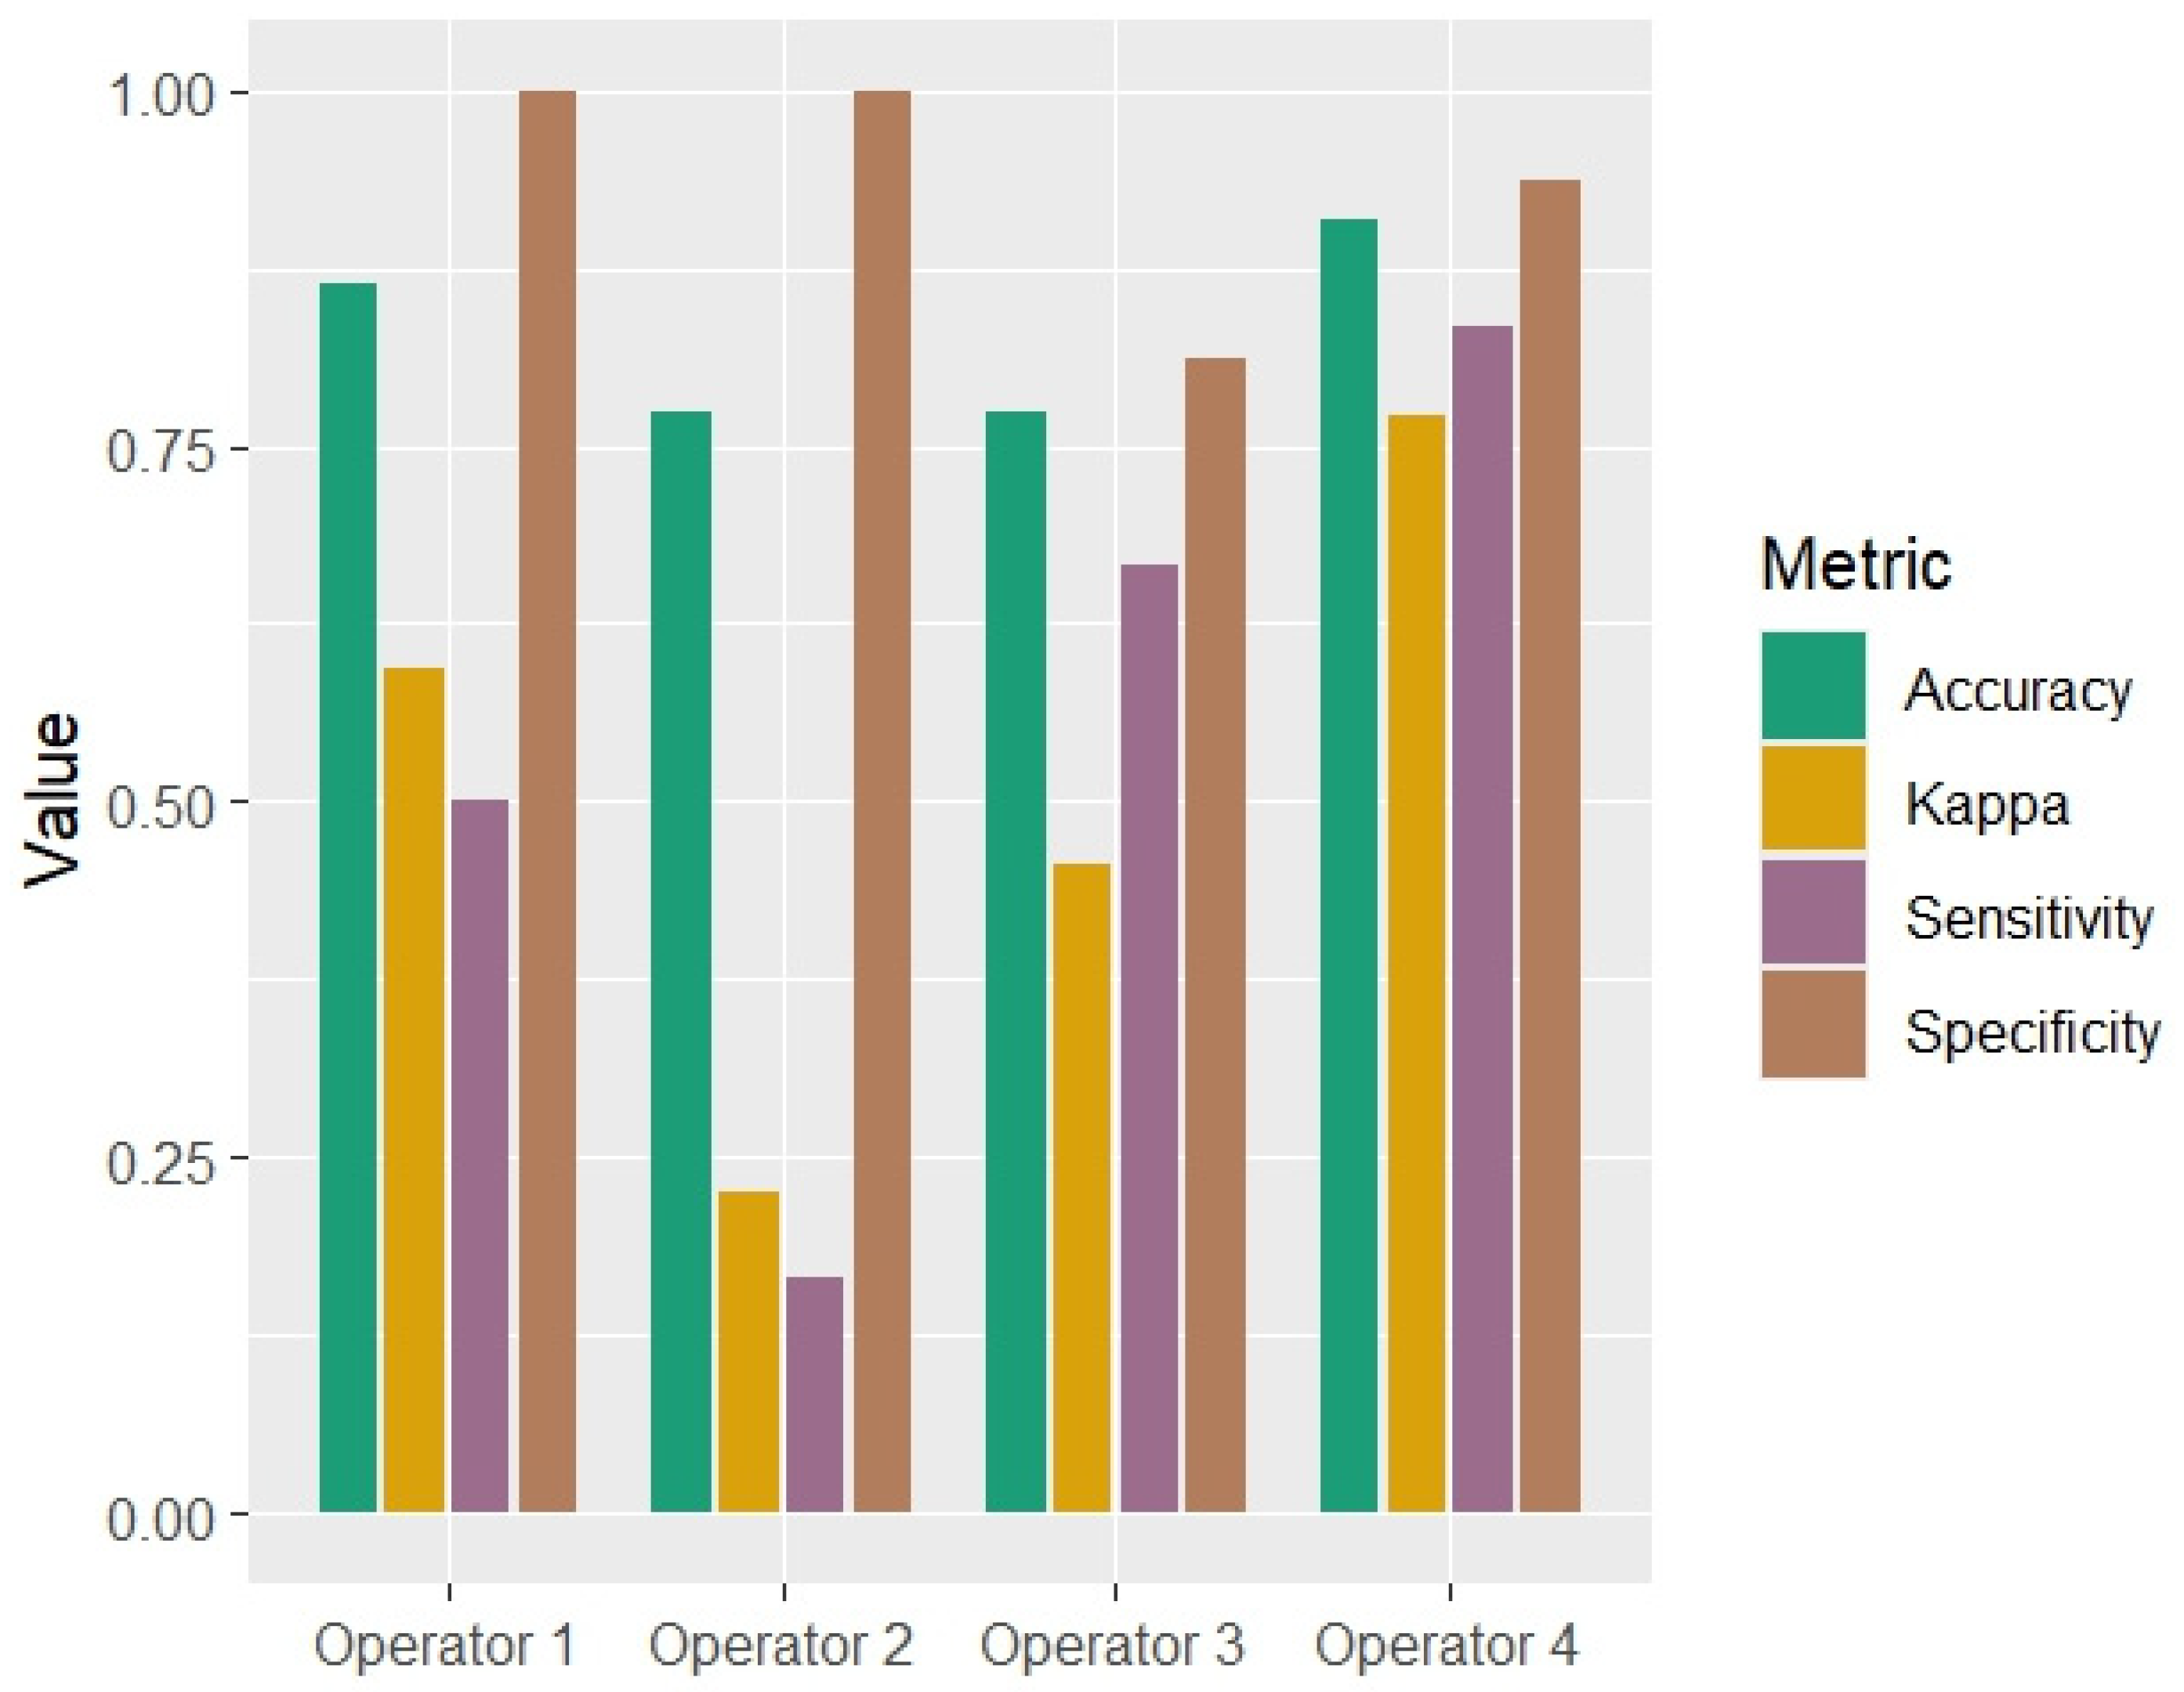
Manual photo-identification performance was assessed independently for each operator and confusion matrix outputs differed among operators (Figure 3, Supplementary Note S1). Across operators, overall accuracy values ranged between 77.3% and 90.9%. Accuracy confidence intervals overlapped among operators, with lower bounds ranging from 0.62 to 0.78 and upper bounds ranging from 0.89 to 0.97. For two operators, accuracy was significantly higher than the no-information rate (p < 0.05), whereas for the remaining operators the difference did not reach statistical significance (p > 0.05). Cohen’s Kappa values ranged from 0.23 to 0.77, indicating variable levels of agreement between manual photo-identification and PIT-tag data across operators. Sensitivity values differed among operators, ranging from 0.17 to 0.83, reflecting variability in the proportion of correctly identified true matches. Specificity values were consistently high, with values ranging from 0.81 to 1.00 across all operators. Positive predictive value was equal to 1.00 for three operators and 0.57 for one operator. Negative predictive value ranged from 0.76 to 0.94. Balanced accuracy values ranged from 0.58 to 0.89, summarising the combined effects of sensitivity and specificity for each operator. McNemar’s test yielded statistically significant results for two operators (p = 0.041 and p = 0.004), whereas no significant asymmetry was observed for the remaining operators (p = 0.75 and p = 1.00). Overall, confusion matrix-derived metrics showed inter-operator variability in sensitivity and agreement measures, while specificity remained high across operators (Figure 3, Supplementary Note S1).

3.3. Software-Assisted Photo-Identification

For Wild-ID analyses, similarity scores were calculated for 43 image comparisons. The mean similarity score of the first-ranked match was 0.00527 (±0.0135; n = 43), while the mean similarity score of the PIT-tag-validated correct match was 0.01477 (±0.0235; n = 12). Minimum similarity scores were 0 for the first-ranked match and 0.000002 for the correct match. Maximum similarity score for both categories was 0.08418 and belonged to a true positive match.
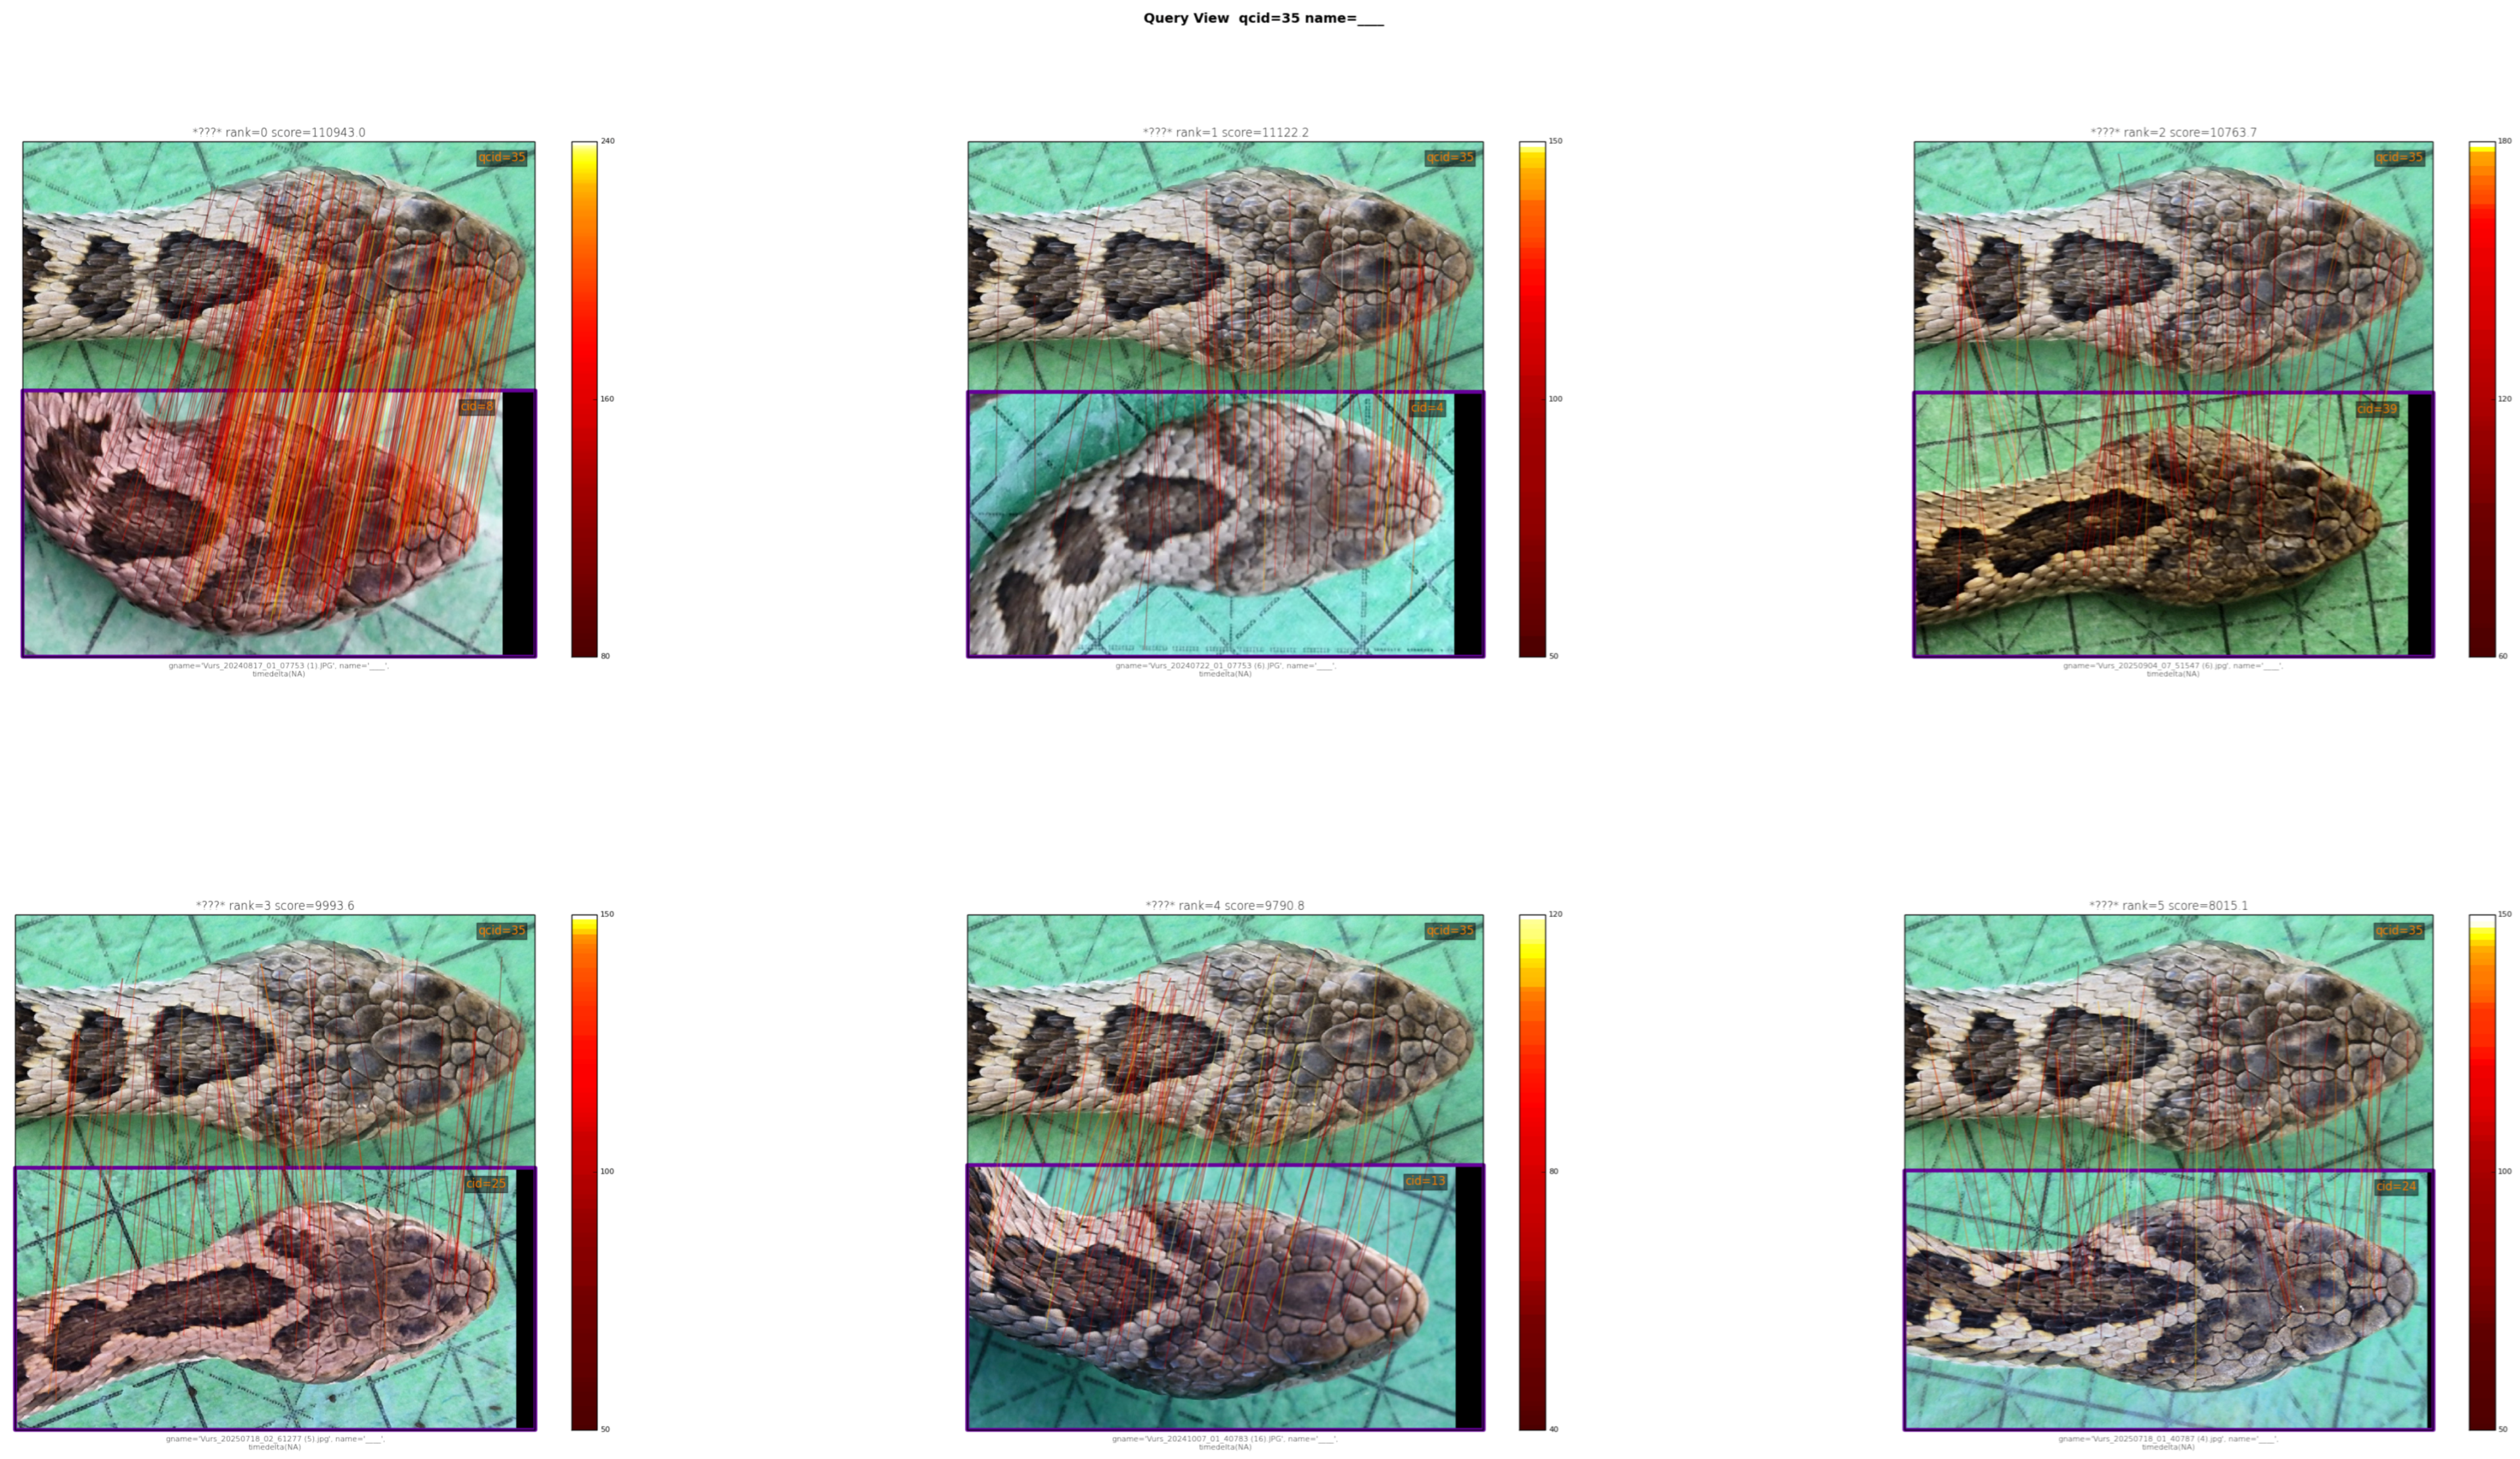
For Hotspotter analyses, similarity scores were calculated for 44 image comparisons. The mean similarity score of the first-ranked match was 22,760.26 (±25,913.62; n = 44), while the mean similarity score of the PIT-tag-validated correct match was 36,918.28 (±33,352.21; n = 20). Minimum similarity scores were 4058.9 for the first-ranked match and 3752.9 for the correct match. Maximum similarity score for both categories was 110,943 and belonged to a true positive match (Figure 4).
The software could only be compared with images of recaptured individuals, hence the number of comparable results deriving from recapture images dropped more than 50%. Using Wild-ID, considering 16 analysed images (three per individual recaptured twice and one per individual recaptured once): nine matches (56.25%) were correctly identified at the first suggestion; five matches (31.25%) were identified within the first six suggestions; and two matches (12.5%) were identified beyond the first six suggestions. Using Hotspotter, out of 20 total matches (six matches for each individual recaptured twice and two matches for each individual recaptured once): 15 matches (75%) were correctly identified at the first suggestion; two matches (10%) were identified within the first six suggestions; and three matches (15%) were found beyond the first six suggestions. Performances of both software are summarised in Table 1, while main results are presented in the Supplementary Table S2.

3.4. Dorsal Cephalic Scales Counts in Vipera ursinii from Maiella

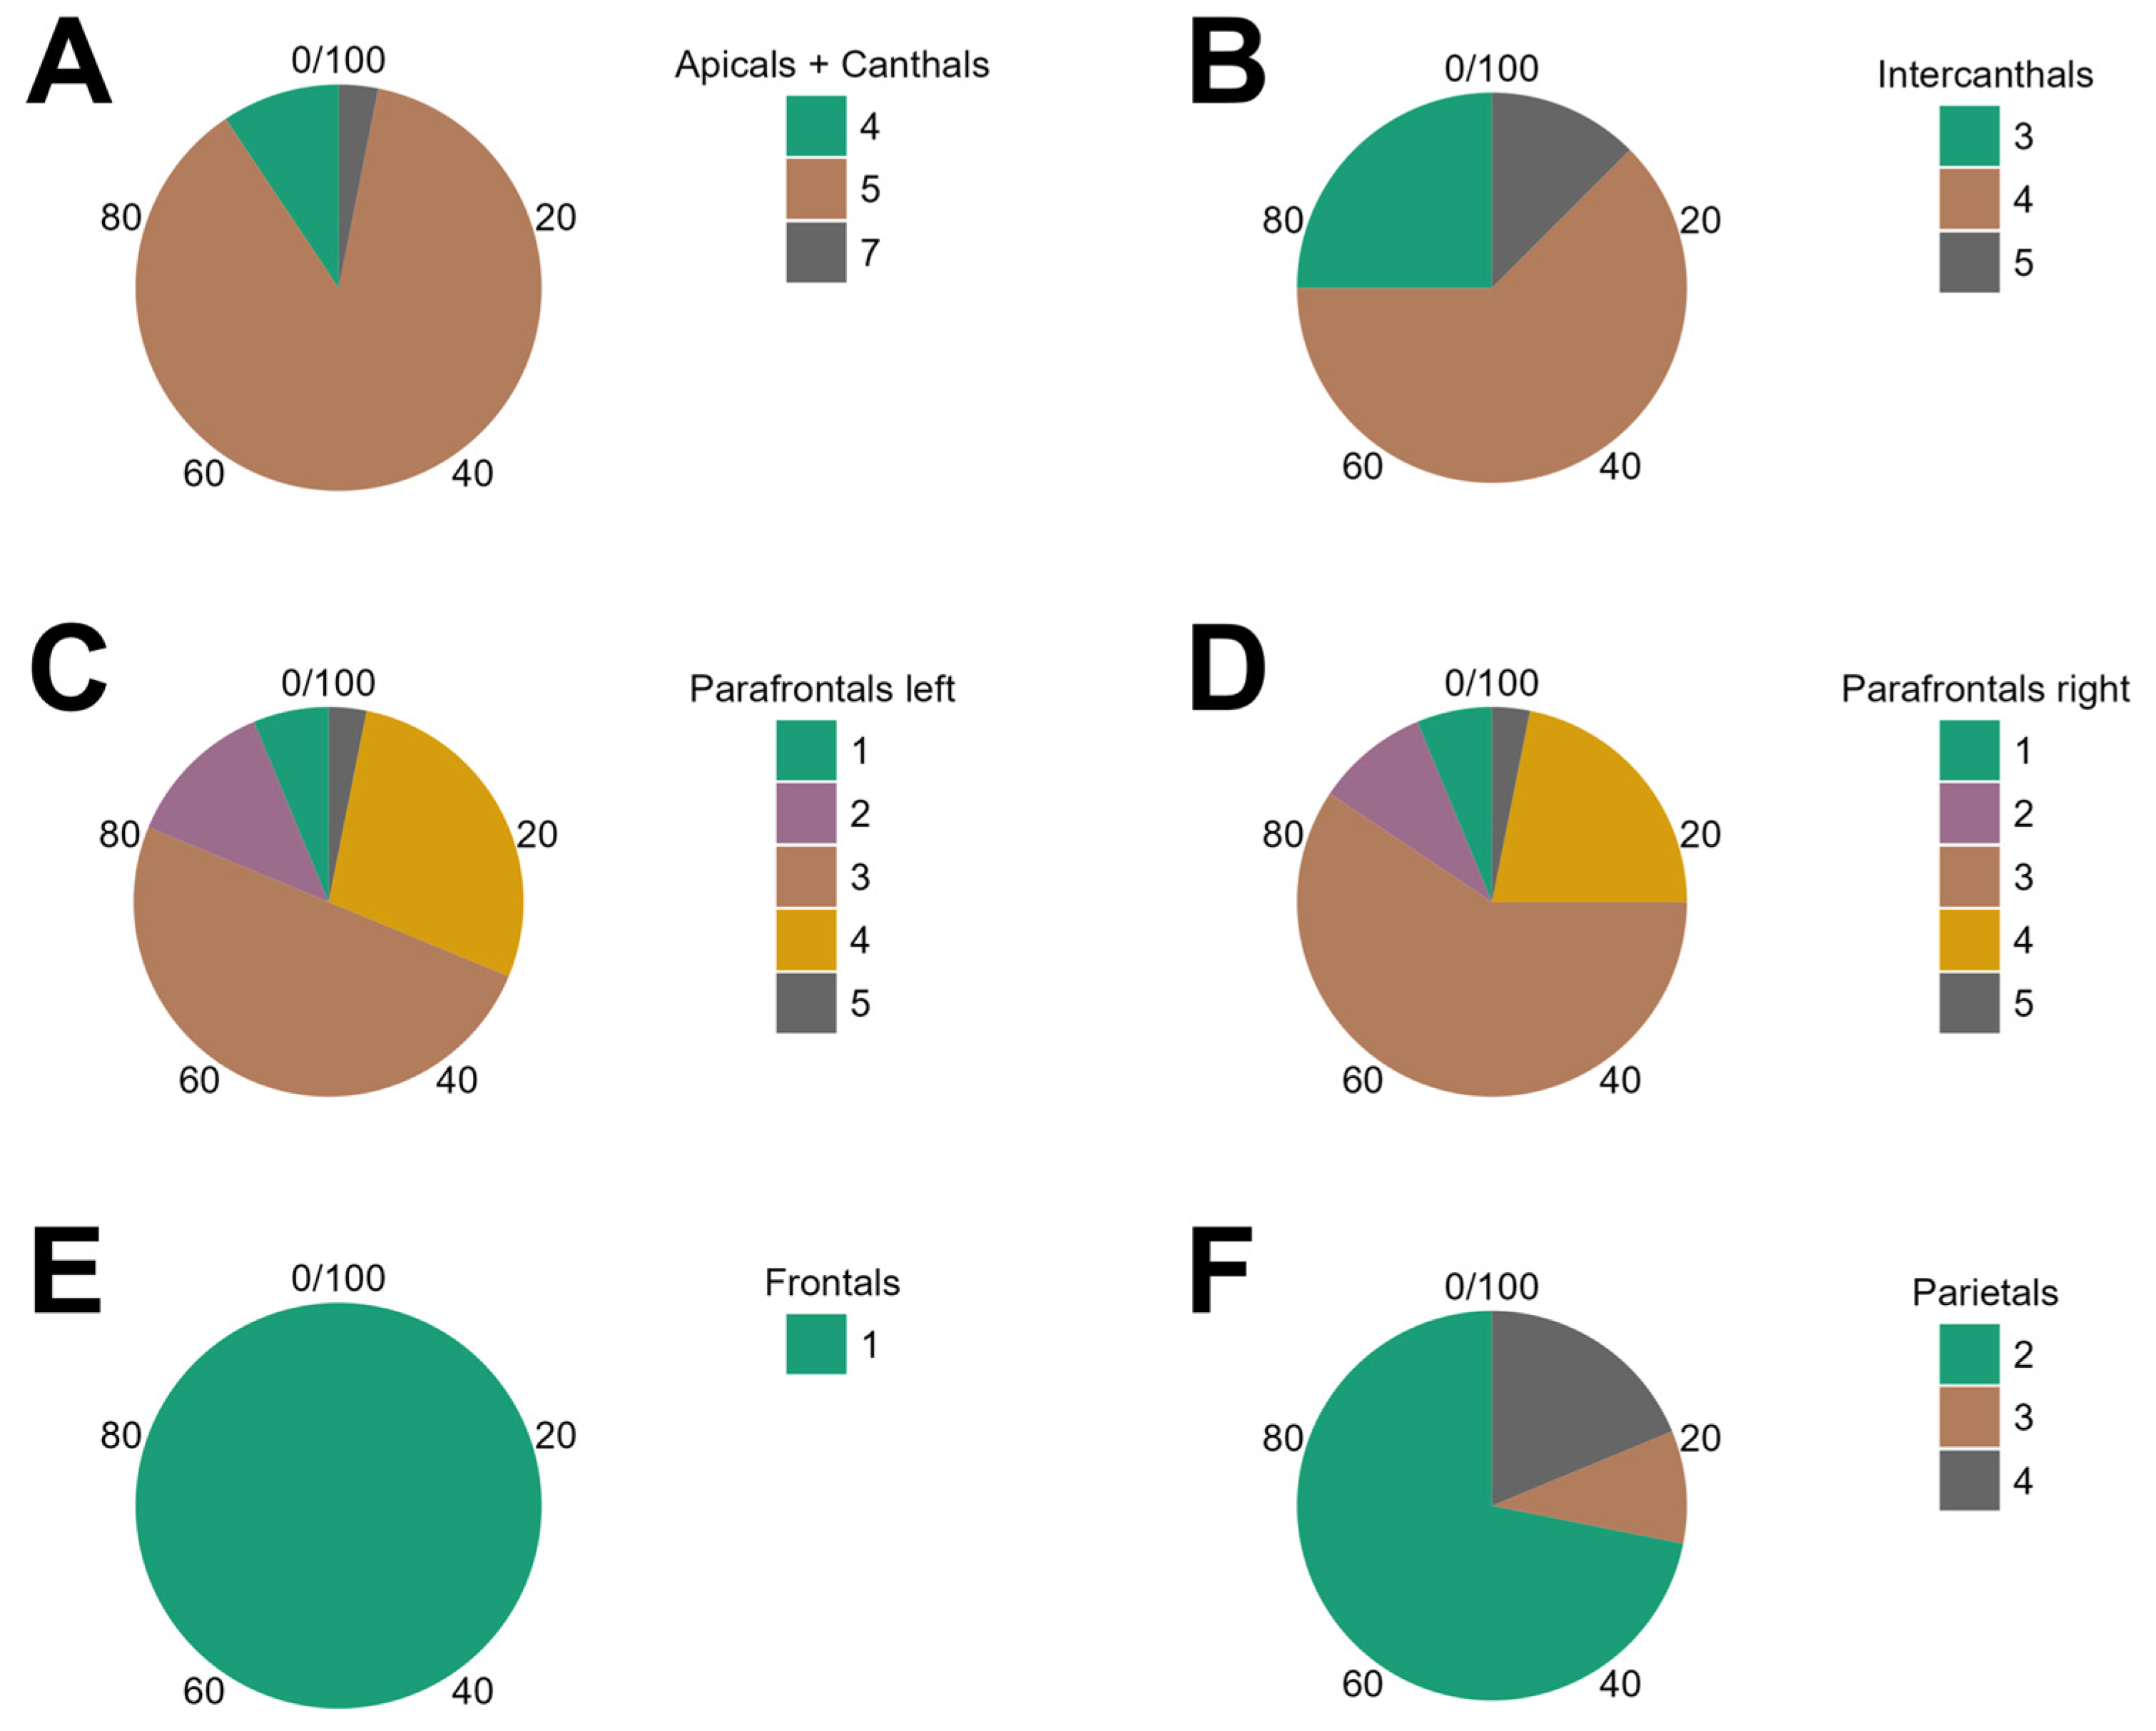
The modal configuration of the selected dorsal cephalic scales in the Maiella meadow viper population was five apicals + canthals, four intercanthals, three parafrontals (left), three parafrontals (right), one frontal, and two parietals, representing the most frequently observed pattern across individuals. Summary statistics of scale counts, including the mode, minimum, and maximum values, are presented in Table 2. Relative proportions for each scale category are illustrated in the pie charts in Figure 5, while detailed frequency distribution values, including absolute frequencies, percentages and cumulative percentages, are reported in Supplementary Note S2.
The image set of unique individuals comprised 14 adult females, 10 juveniles, and eight adult males. Contingency tables were constructed for each scale category, excluding frontals due to lack of variability. Chi-squared (χ2) tests revealed no significant differences (p > 0.05) in scale count distributions among sex and age classes for any of the analysed categories. For each test, χ2 values, degrees of freedom (df), p-values, and sample size are reported in Supplementary Note S3.

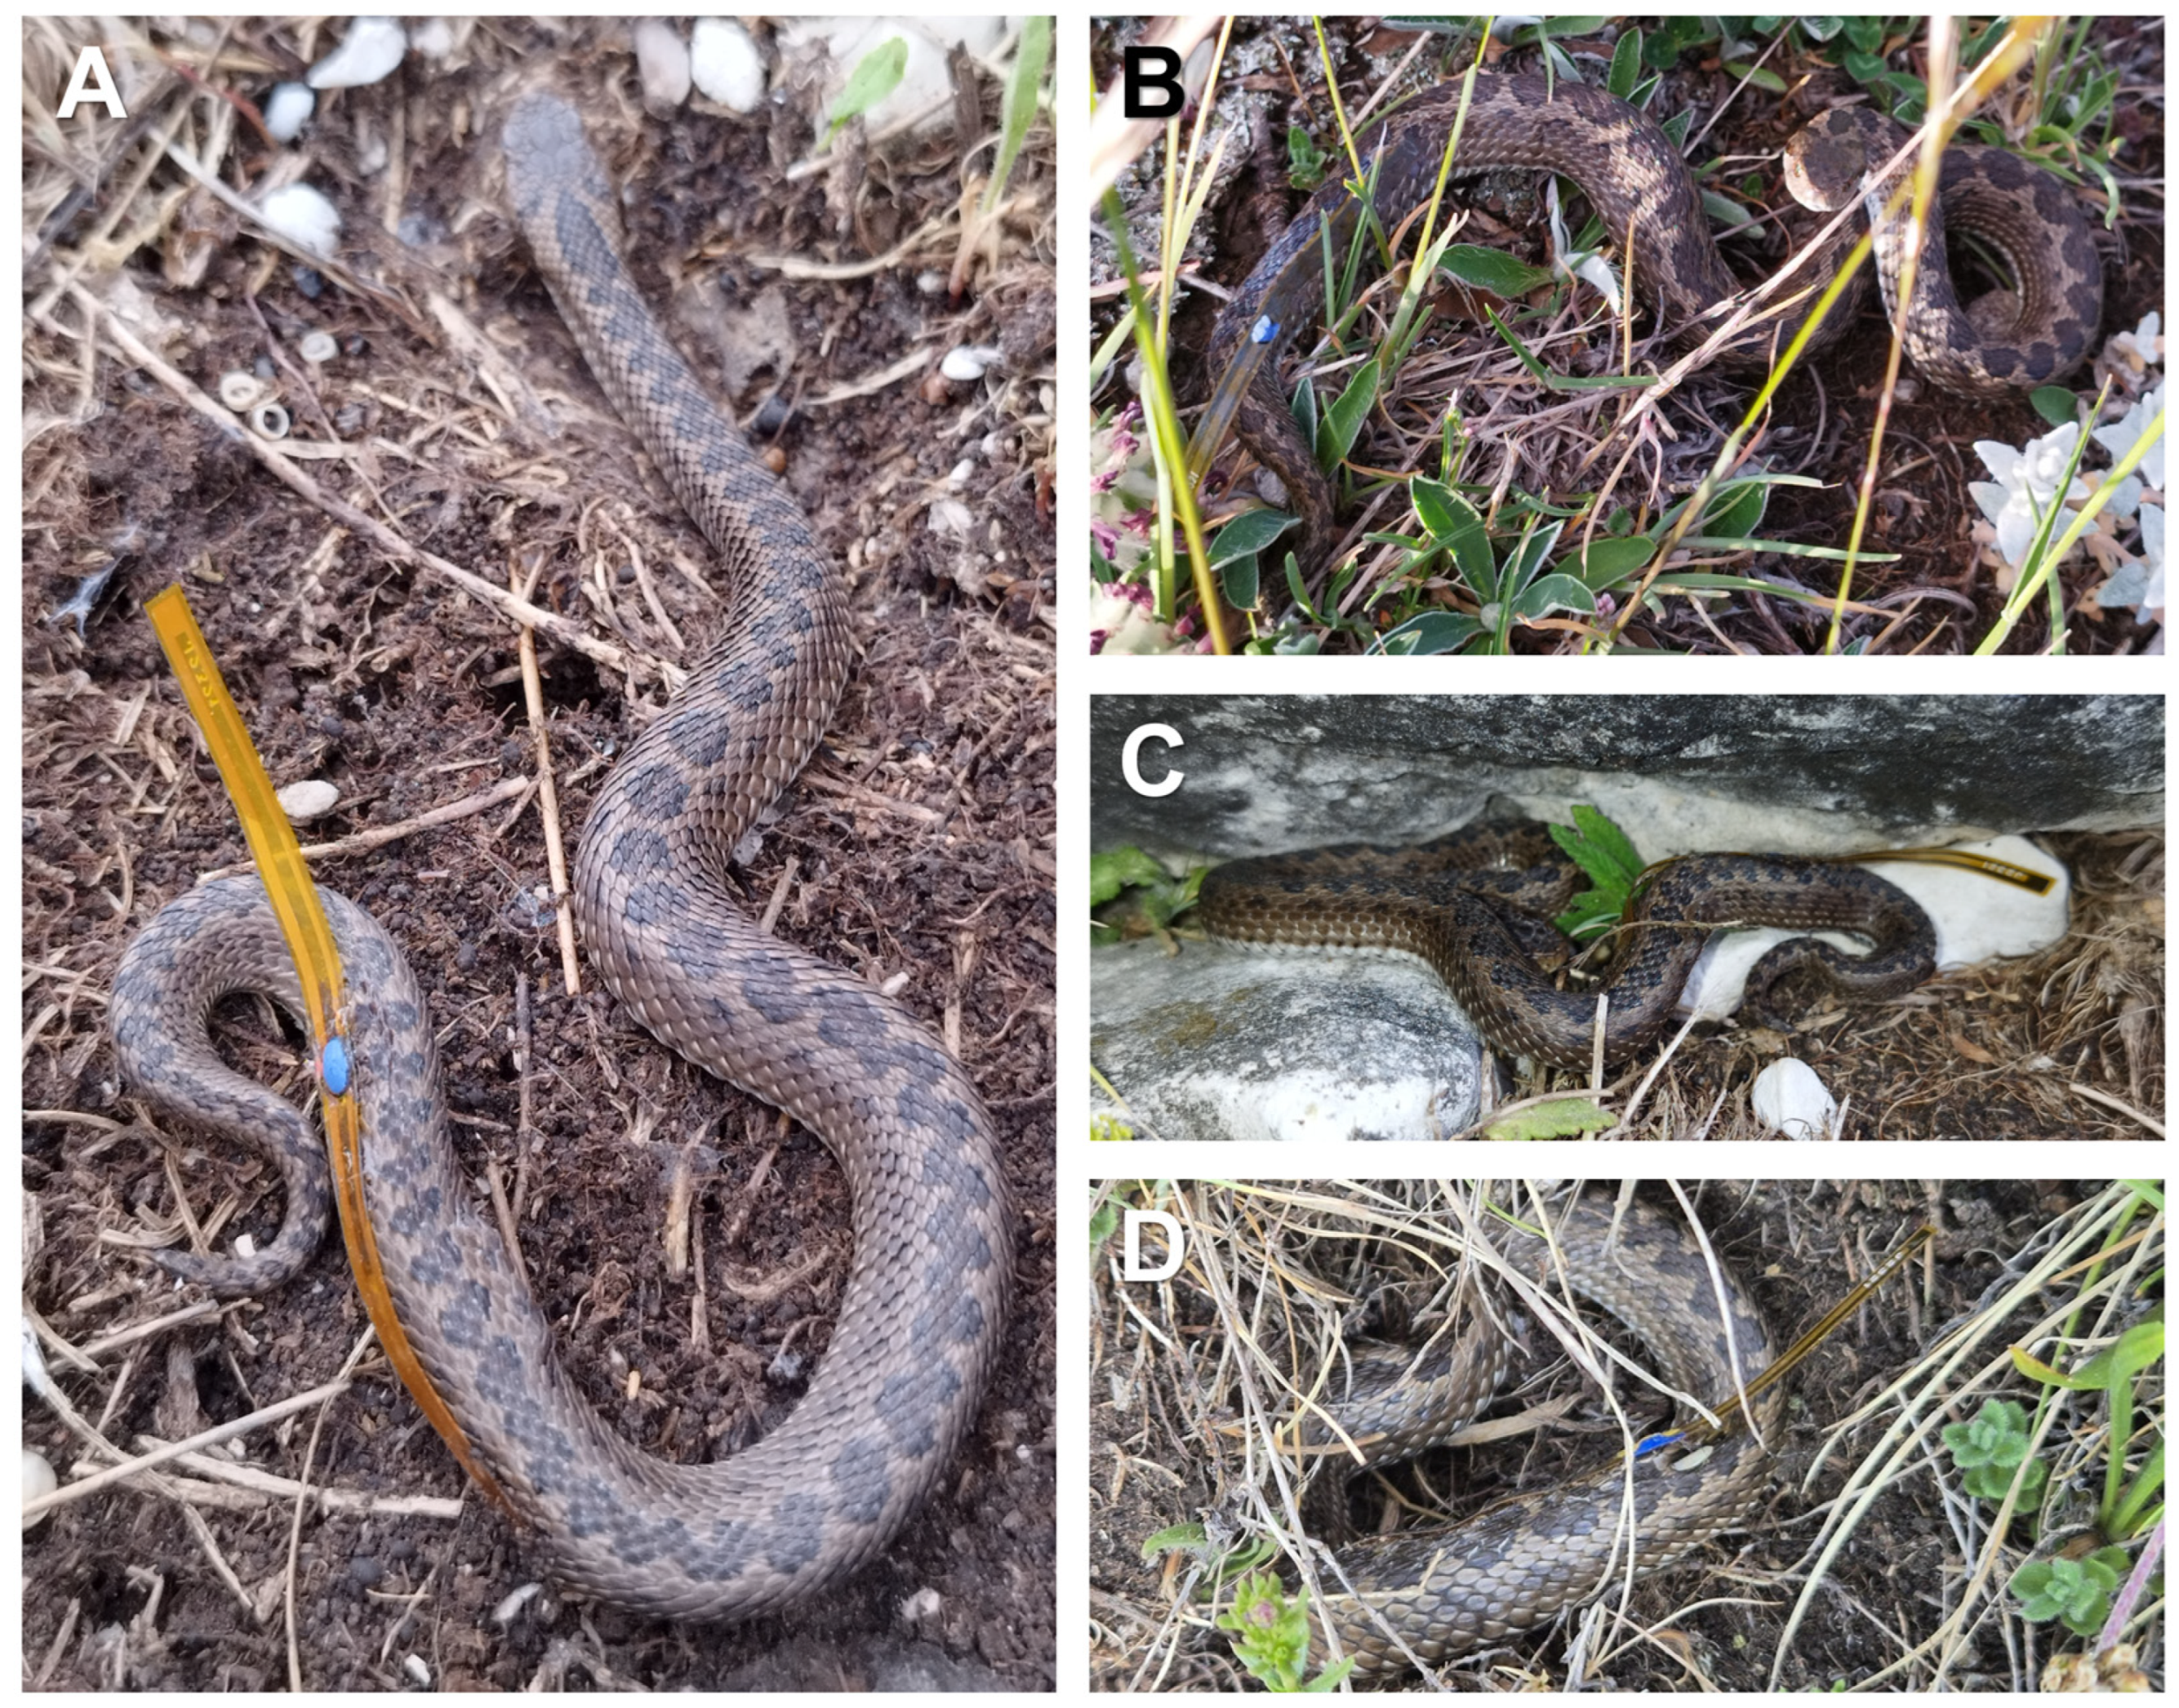
3.5. HDF Telemetry Notes

Twenty-five individuals were equipped with both PIT tags and externally attached HDF-RECCO diodes (Figure 6). Diodes remained on the snakes’ bodies for variable durations, ranging from a few hours to several days. In six cases (24%), the diode detached within the same field session (i.e., within two consecutive days). All remaining diodes persisted for at least the duration of a standard two-day session. In some of these instances, hidden individuals were detected more than once at exactly the same location during the final part of the session; consequently, it was not possible to determine with certainty whether the diode was still attached or had detached in the interim. In three cases, it was possible to estimate a maximum attachment duration more closely approximating the true persistence time, as an operator conducted additional HDF detection trials outside the regular fortnightly survey schedule. In these cases, confirmed maximum attachment times were 75 h, 91.5 h, and 161.5 h respectively, although actual persistence was certainly longer, as the diodes were still attached to the animals at the time of last observation. During one of these trials, the operator recovered a detached diode from an individual to which it had been attached 56 h earlier. No diodes remained attached for the full two-week interval between consecutive survey sessions. All attached diodes, except one, were consistently recovered after detachment, often during the subsequent field session. Their recovery allowed the recording of the last corresponding waypoint and localisation of the passage site of a uniquely identified individual. In one case, a diode was not recovered, indicating that the individual was either predated or had moved outside the study area.
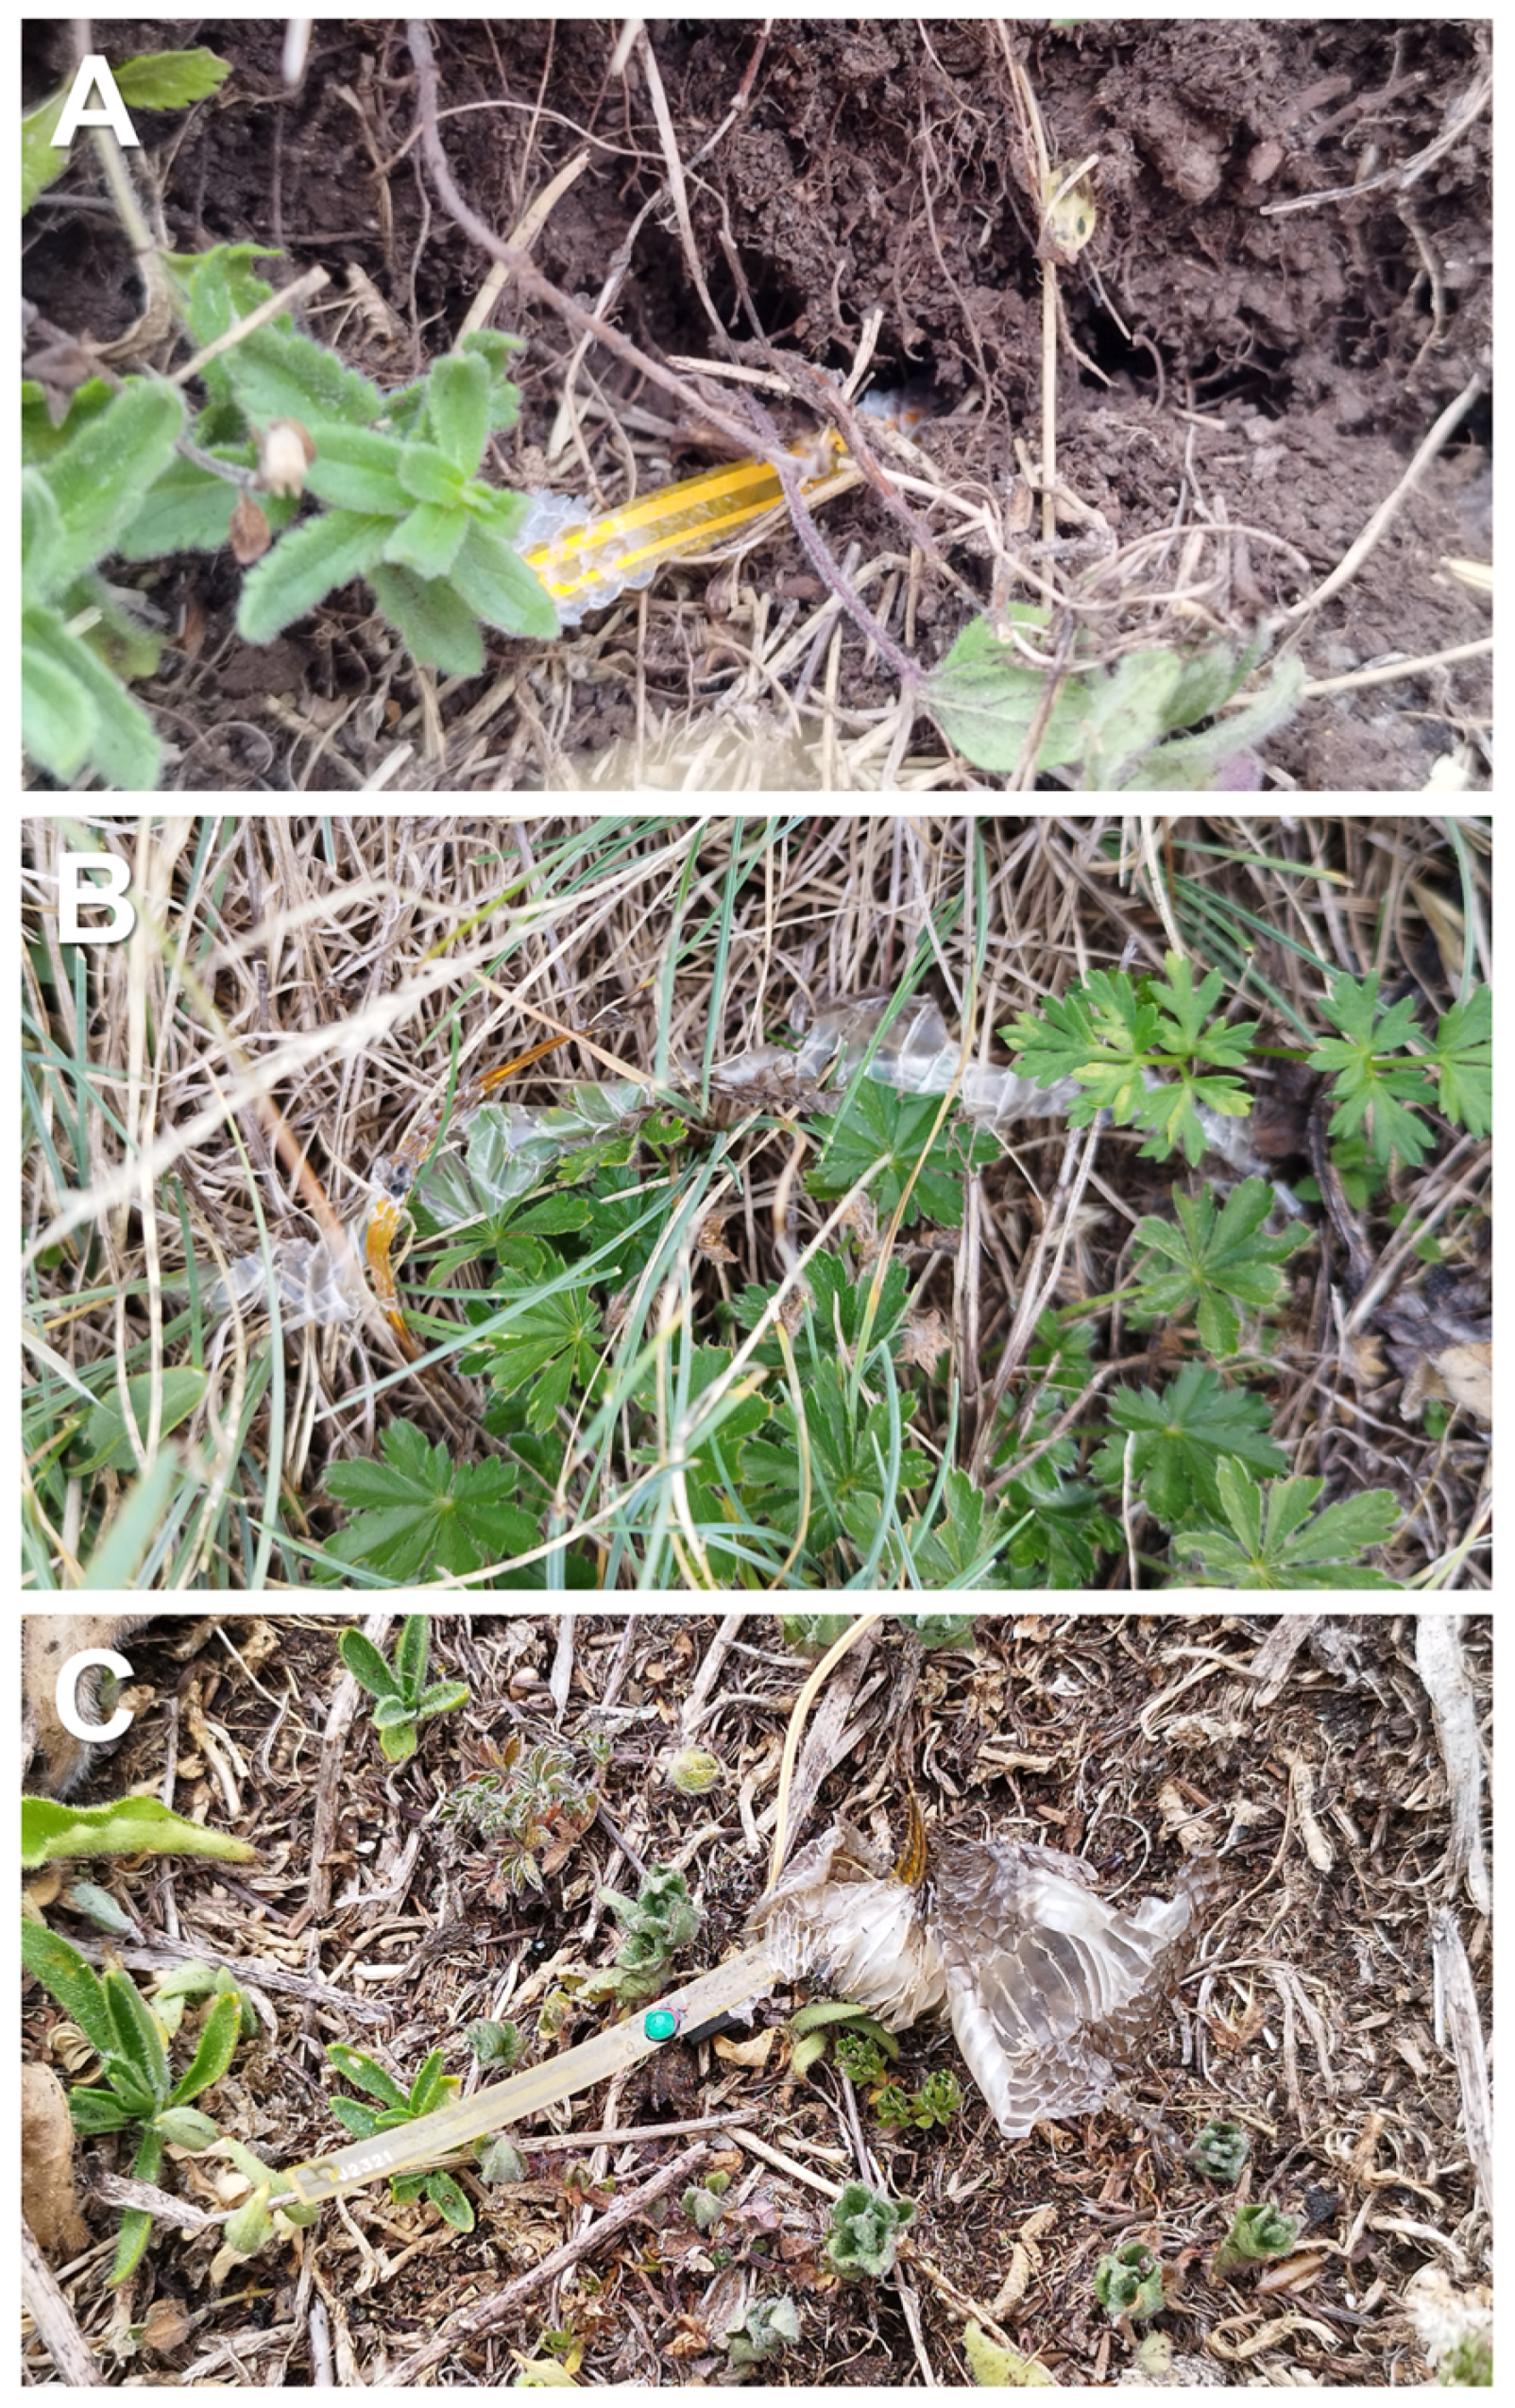
Although the HDF system did not provide intrinsic individual identity, to minimise potential confusion during HDF detection, the application of diodes to individuals captured in very close spatial proximity was avoided. Only on one occasion were two adult individuals found beneath the same stone and both fitted with diodes: after release they moved in opposite directions, and we were able to distinguish the signals because the colour of one diode was visually confirmed with binoculars. Hence, the different colour coding allowed individual recognition during field observations and facilitated identification even in the absence of PIT-tag reading, such as in cases of diode loss or recovery after ecdysis (Figure 7).
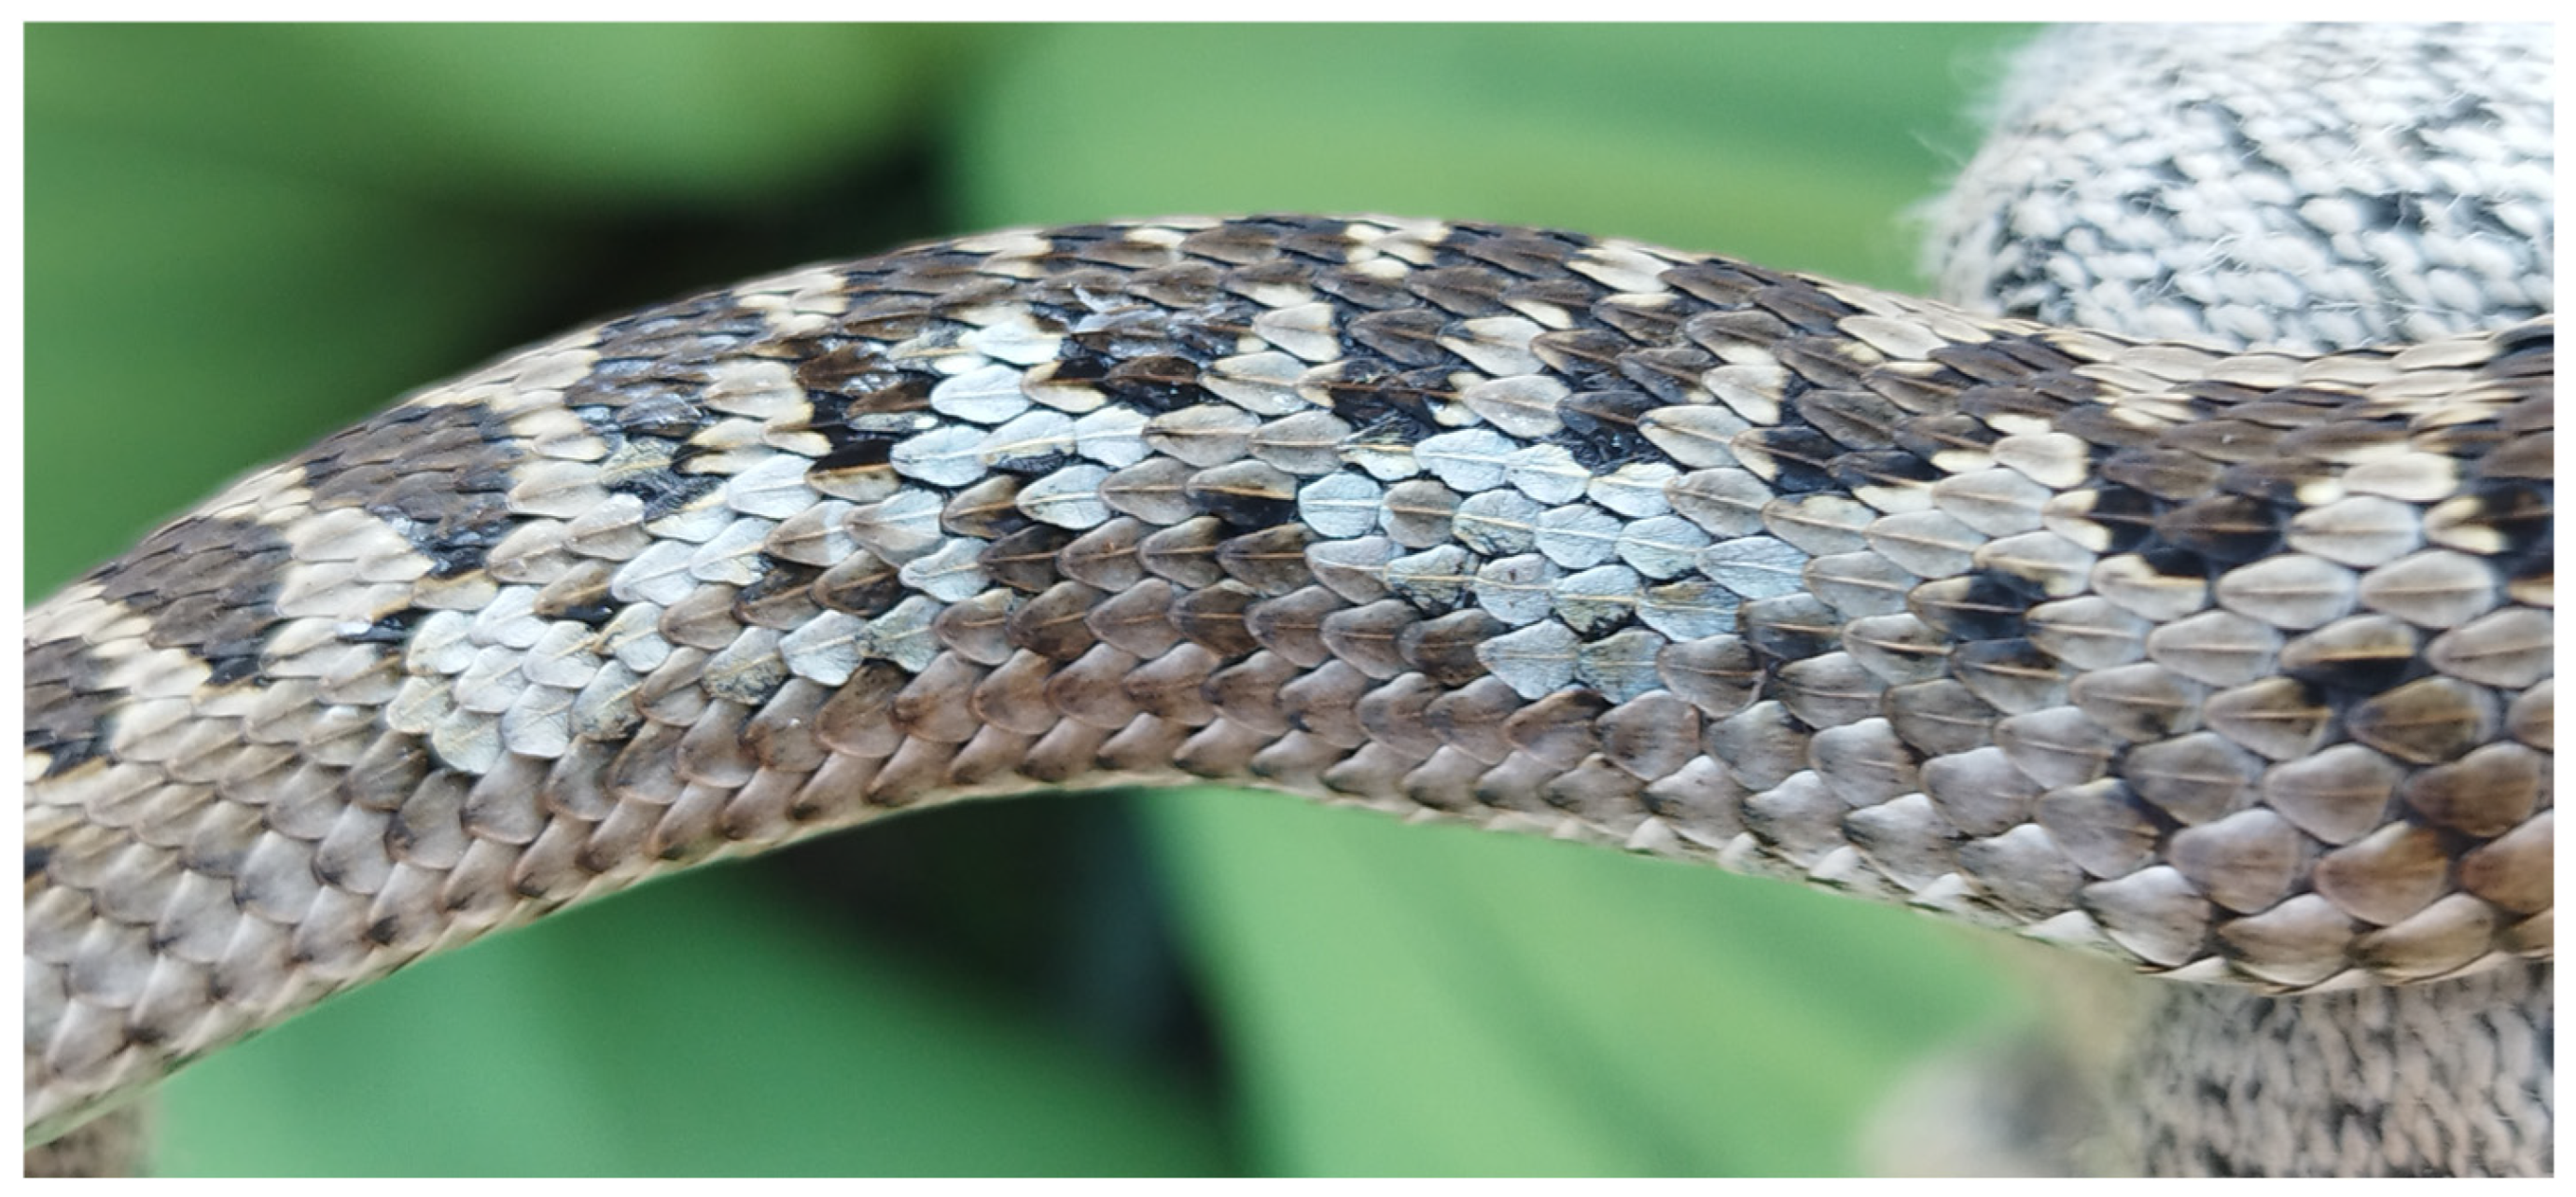
Recovered diodes were found attached to fragments of shed skin (Figure 7A,B) or, less commonly, embedded within complete sheds (Figure 7C), indicating that device loss was generally associated with the moulting process. In some instances, partial detachment suggested active rubbing against abrasive surfaces. Occasional early detachment occurred without apparent severe skin damage; in these cases, only superficial epidermal layers appeared to be affected, with no evidence of deeper tissue injury (Figure 8). The RECCO system proved effective in detecting both surface-active and hidden individuals. Signal strength varied according to reflector orientation and distance, and clear modulation of the acoustic signal was observed when snakes were moving. Signal modulation allowed detection of underground movement, such as within rodent burrow systems, even when the animal was not directly visible. A practical field criterion was developed to discriminate between surface and subsurface locations: reflectors associated with surface-active snakes remained detectable at minimal gain and volume settings, whereas signals from underground individuals disappeared when gain and volume were reduced to the lowest levels, confirming a hypogean position. Consistent with this interpretation, on one occasion a detached diode was recovered from a rodent burrow after excavation of the substrate at the point where a hypogean signal had been detected, confirming that the system could detect reflectors located below ground.

4. Discussion

This study demonstrates that software-assisted photo-identification, when validated against permanent PIT tagging, provides a reliable method for individual recognition in this snake species. The algorithm-based photo-identification ensures objective, standardised and reproducible identity assignment. In contrast, manual photo-identification, although capable of achieving satisfactory results, appears inherently more subjective and substantially more variable among operators, as was previously reported [7].
Confusion-matrix outputs highlighted this variability: overall accuracy ranged from 77.3% to 90.9%; however, statistical significance was reached for only two operators. Sensitivity and specificity further illustrated contrasting patterns with sensitivity spanning (0.17–0.83) while specificity remained consistently high (0.81–1.00). Those results indicate that operators were generally effective in avoiding false matches between different individuals, but less consistent in correctly recognising true recaptures, which could translate into under-detection of recapture events. Operator-dependent performance may also reflect differences in effort and workflow, particularly the amount of time dedicated to image inspection, spreadsheet compilation, and systematic re-checking of photographs. Although we did not record the time invested by each operator, this factor could plausibly contribute to the observed heterogeneity of results. Future studies would therefore benefit from standardising operator effort and/or explicitly tracking time spent per task, allowing accuracy to be interpreted in relation to effort and enabling more meaningful comparisons among operators. Beyond interpretation and counting uncertainty, manual workflows were also susceptible to procedural errors: in three instances scale counts were correctly extracted from images but incorrectly entered as composite identifiers into the spreadsheet, generating artificial mismatches. Such transcription errors highlight the human component as an additional source of bias and variability and further support the adoption of more automated, software-assisted approaches that are less susceptible to operator-dependent mistakes. These results should also be considered in the context of the limited dataset size. With relatively few individuals and recaptures, the probability of encountering ambiguous or convergent scale configurations is reduced, potentially inflating apparent performance; as datasets grow, morphological overlap and combinatorial redundancy are expected to increase, likely reducing the reliability of purely manual identification. Finally, manual scale counting, verification, and transcription are inherently time-intensive processes [7,13], which constrains feasibility and efficiency in long-term monitoring or large sample sizes.
Regarding software-assisted photo-identification, both Hotspotter and Wild-ID successfully re-identified PIT-tag-validated individuals of Vipera ursinii, despite a reduced dataset limited to recaptured individuals. Hotspotter showed a higher first-rank identification performance compared to Wild-ID, correctly identifying 75% of matches at the top rank, whereas Wild-ID yielded a lower proportion of first-ranked correct matches. However, for both software, most correct matches were retrieved within the first six ranked suggestions, indicating comparable effectiveness when broader rank thresholds are considered. This is in line with other herpetological studies using these software (e.g., [41]). In both programmes, the highest similarity scores consistently corresponded to true positive matches, supporting the reliability of strong similarity values as indicators of correct identification. However, for Hotspotter, similarity scores are dataset-specific and strongly influenced by the size and composition of the image set; smaller datasets generally yield higher similarity scores, and score values also depend on overall image pattern characteristics [15]. Consequently, similarity scores must only be interpreted within the same image set and cannot be directly compared across different datasets or studies.
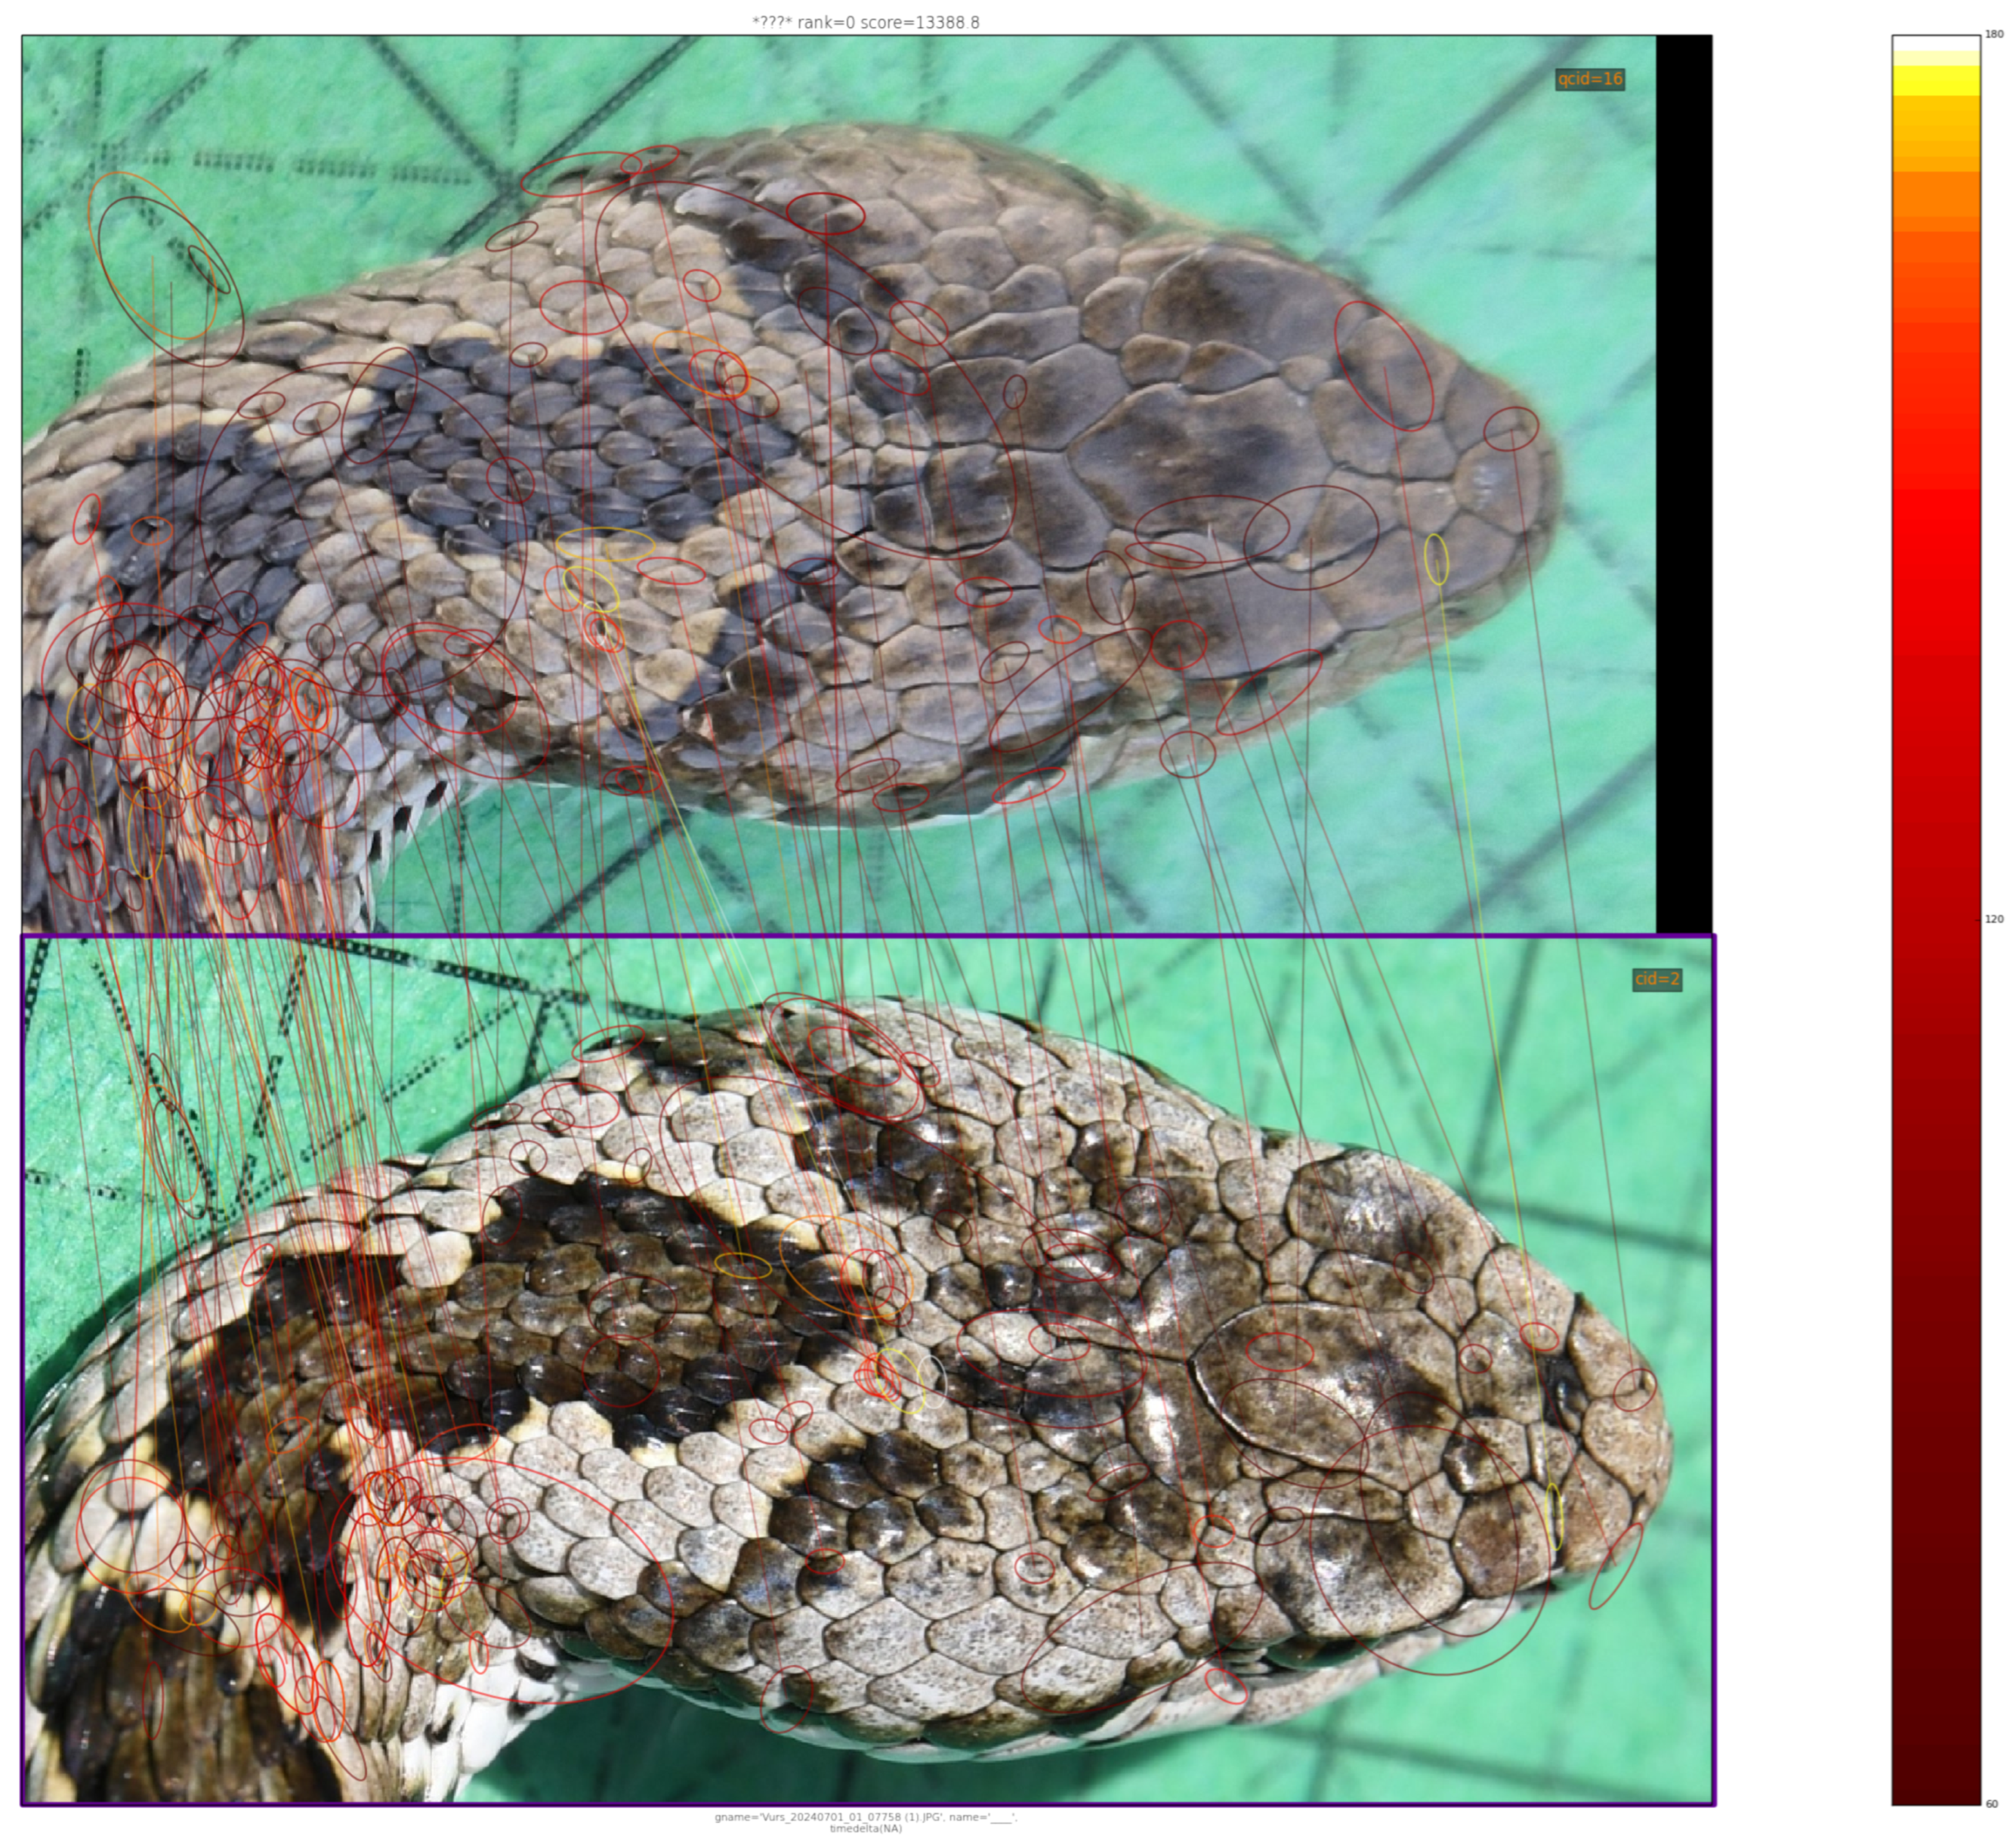
Our results highlight both the potential and the intrinsic limitations of software-assisted photo-identification in Vipera ursinii, emphasising the central role of image quality, body region selection, and individual posture in shaping software-assisted matching performance. In particular, the analysis suggests that the order in which images of different quality are processed may substantially influence the outcome of automated matching, especially when using Hotspotter. We recommend prioritising the analysis of poor-quality images against reference datasets, rather than the opposite approach. In several instances, low-quality images were still able to retrieve the correct match when queried first, whereas using high-quality images to match against poorer references more frequently resulted in rank deterioration or false positives. Across both software platforms, the dorsal head region emerged as an informative anatomical area for reliable individual discrimination. Fine-scale pholidosis, particularly the configuration of small head scales, consistently contributed to correct identification. Structures surrounding the frontal and parietal shields—namely apical, intercanthal, parafrontal, temporal, and adjacent dorsal cranial scales—appeared especially stable and individually distinctive (e.g., Figure 9). In the Maiella population, some of these scale groups also exhibited substantial inter-individual variability in both number (Table 2, Figure 5) and suture configuration. In particular, the V. ursinii pholidiosis of intercantal and parafrontal scales seems to be highly variable in both number and shape, and this variability likely represents a major source of discriminative power for photo-identification in this species. Importantly, our contingency analyses showed no significant differences in scale counts among sex or age classes (Supplementary Note S3), indicating that this variability reflects stable individual configurations rather than ontogenetic or sexual variation. Within the Vipera ursinii complex—particularly in V. u. rakosiensis—the scales of these groups appear largely genetically determined and only weakly influenced by environmental conditions, and are therefore expected to remain temporally stable and suitable as reliable morphological identifiers for discriminating individuals [8]. A comparable pattern has also been reported in the congeneric V. berus, which exhibits similar dorsal cephalic pholidiosis; in this species, changes in dorsal head scales are considered very rare, supporting their usefulness as long-term individual identifiers [4,6,7,8,9,11]. Although post-natal changes in head scalation are rare, they may occasionally occur [10]. In this context, software-assisted photo-identification is likely to be more resilient to minor pholidosis modifications, as it evaluates the overall head morphology rather than relying exclusively on discrete scale counts, whereas purely manual, count-based approaches are more prone to misclassification if scale subdivision or structural changes occur.
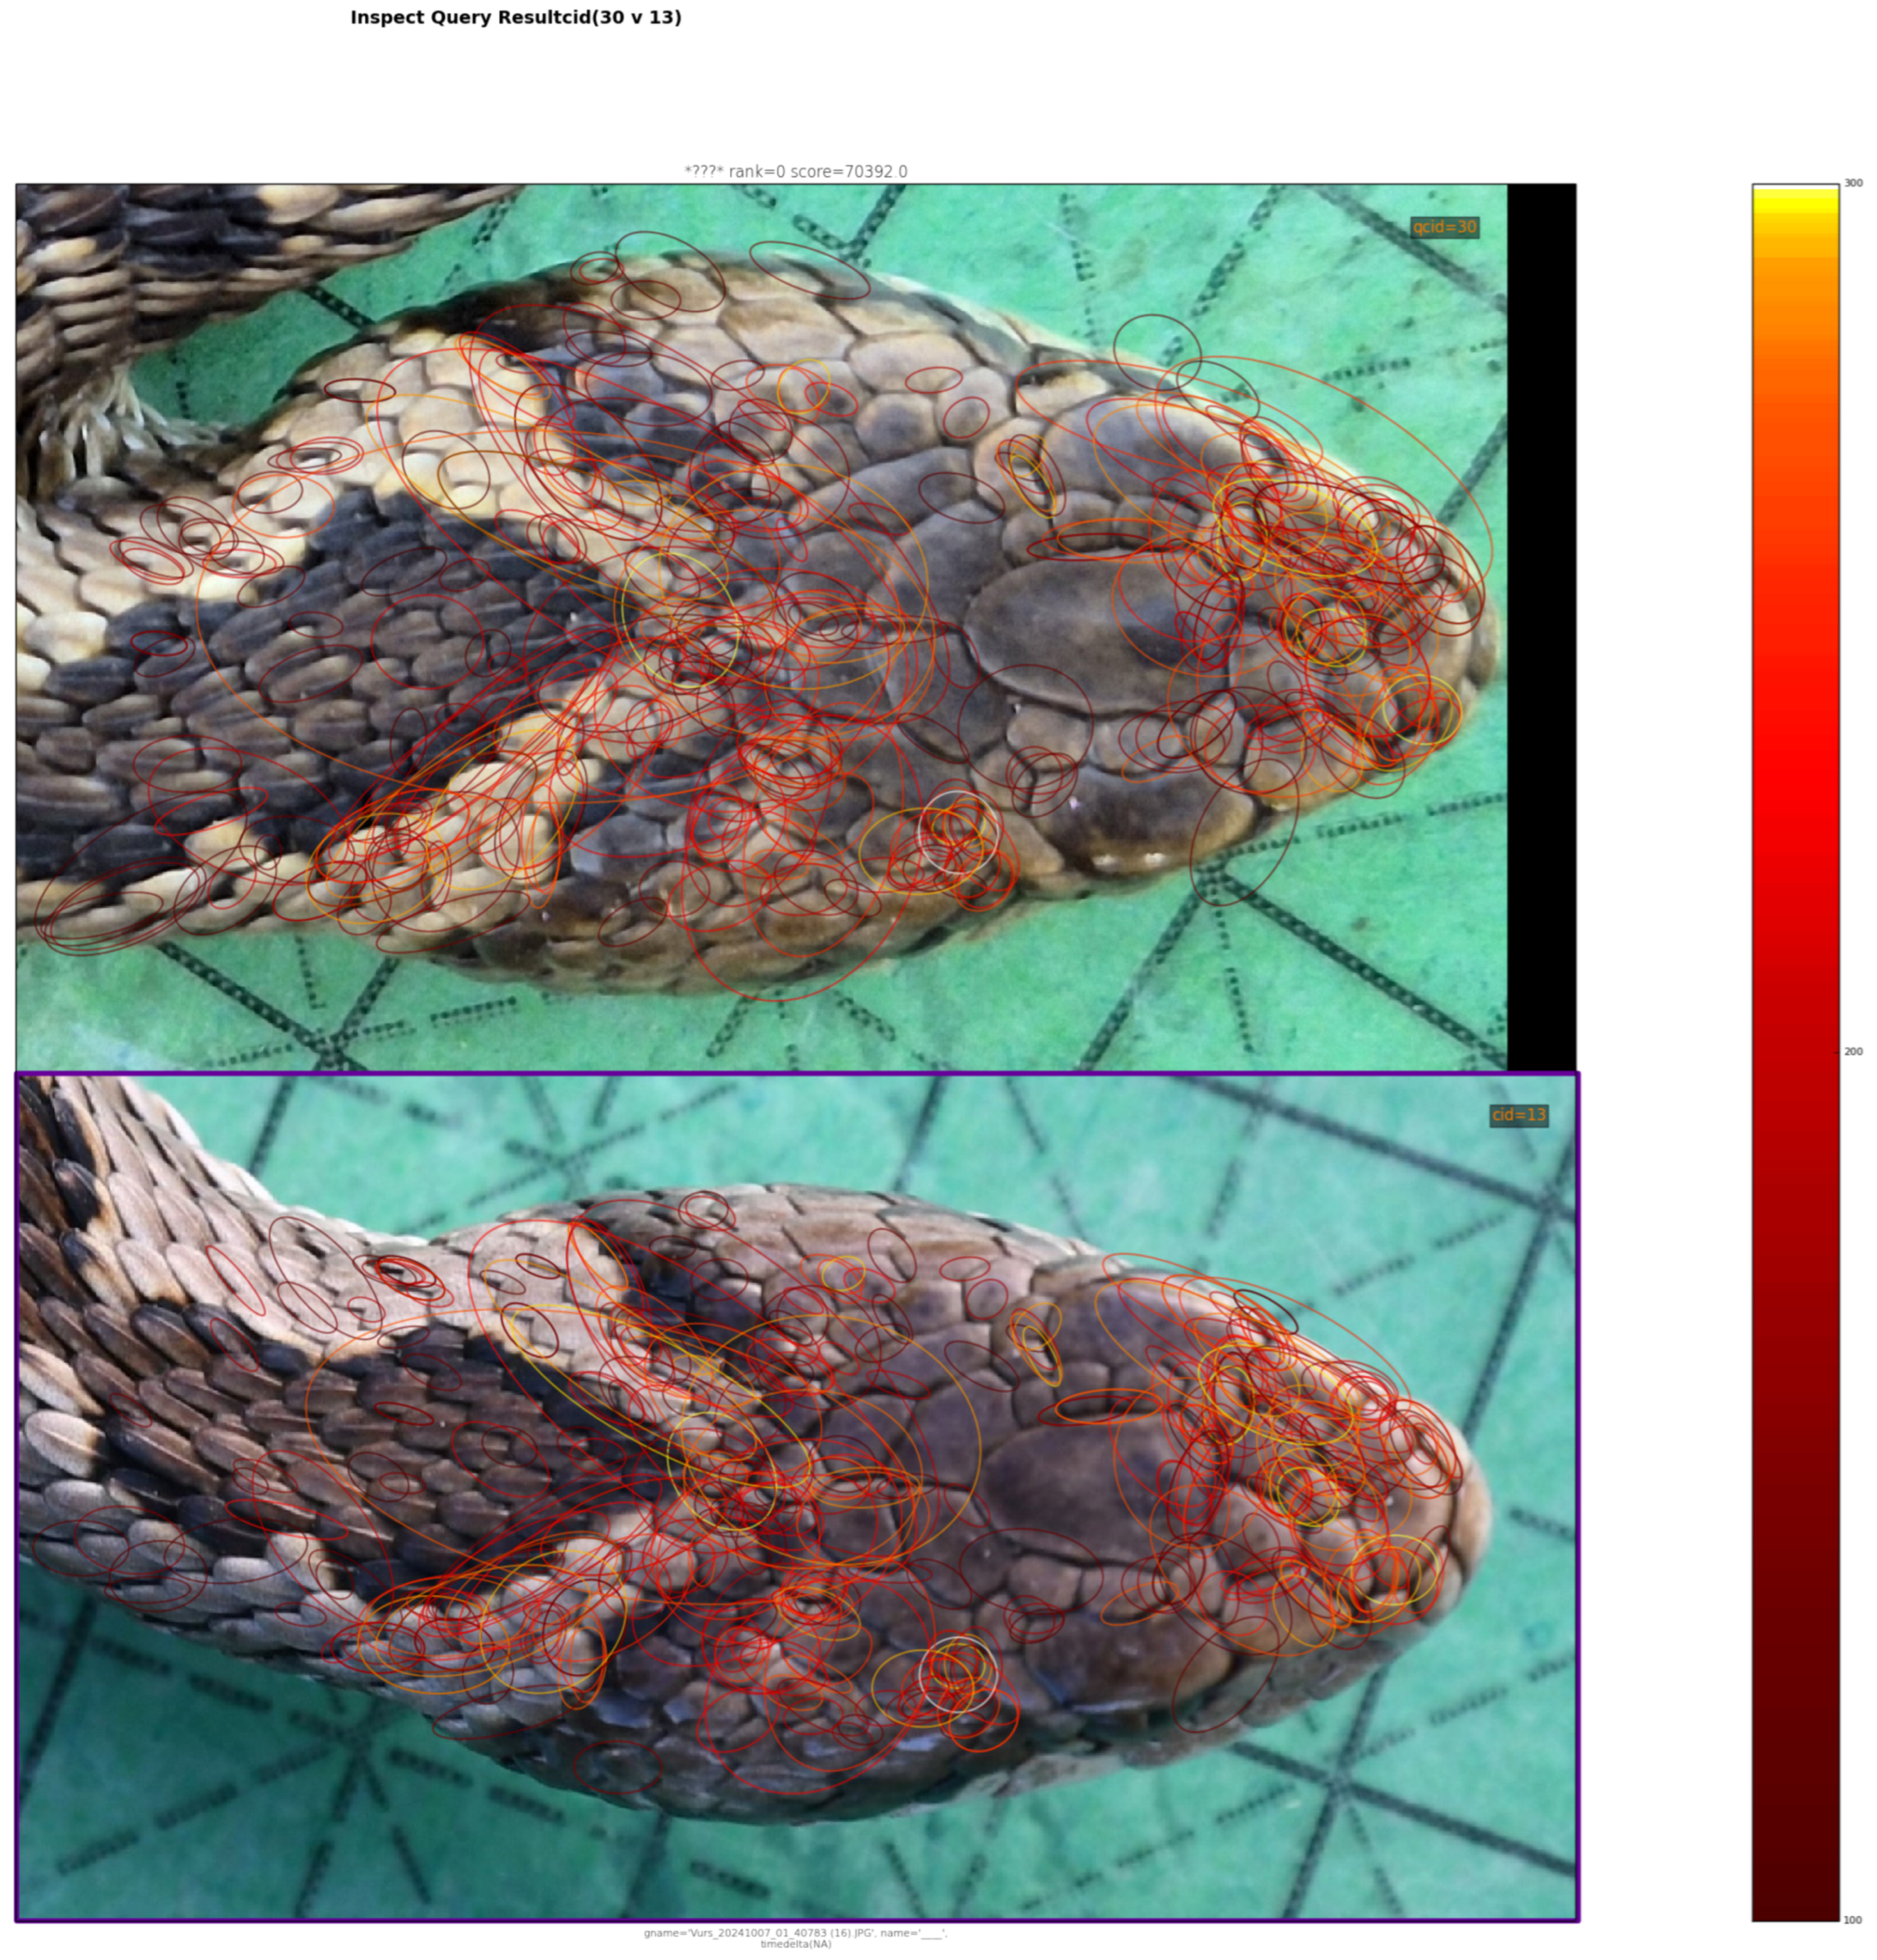
In contrast, the dorsal scales on the trunk caudal to the head region appeared to be more problematic and prone to misclassification using software-assisted photo-identification. Although dorsal caudal scales can exhibit visible patterning, this body region frequently generated false positives. Artificial lighting, low ambient illumination, or strong shadowing altered the apparent contrast and geometry of caudal scales, leading to spurious similarity scores between different individuals. Animal posture further influenced matching reliability. Individuals photographed in similar body positions sometimes produced high similarity scores, resulting in false positives (e.g., Figure 10). This suggests that posture-induced geometric congruence can override true individual differences when the algorithm relies heavily on outline or local feature alignment. Such posture-related bias reinforces the importance of standardising photographic protocols as much as possible during field acquisition.
Image quality is a major driver of photo-identification performance, with reported success rates dropping from 85–99% for high-quality images to 28–52% for low-quality ones, and with images tending to match preferentially with others of similar quality [42]. Critical defects such as glare, slight blur, shadows, or inaccurate cropping can severely impair matching—particularly in pixel-based algorithms like Wild-ID—by altering or obscuring biologically relevant patterns [1,13,15,43,44]. Consequently, standardised acquisition and preprocessing protocols are increasingly recommended to maximise reliability and reduce false negatives in automated matching systems [1,2].
Overall, our findings indicate that photo-identification in V. ursinii seems to be driven by head-scale morphology rather than by broader body patterning at the cephalic region. The high variability of apical, canthal, intercanthal and parafrontal pholidiosis appears to be a key taxon-specific advantage for this species, as well as for other viper species with similar head morphology (i.e., V. berus, see above).
Based on our results, we recommend a two-step approach: software-assisted matching as the primary identification method, followed—where necessary—by manual validation through dorsal cephalic scale counts. Automated algorithms provide rapid and standardised candidate matches, whereas scale-count verification increases confidence in cases of difficult validation or suboptimal images. This integrative workflow can maximise identification reliability while limiting operator-dependent bias.
HDF telemetry using externally attached RECCO diodes proved effective for short-term relocation of individuals. Diode retention was generally sufficient to allow repeated detections, with losses primarily associated with ecdysis rather than traumatic detachment. No evidence of deep tissue damage was observed, suggesting limited impact on the animals. The RECCO system allowed detection of both surface-active and concealed individuals, including underground movements. Variation in signal strength provided a practical criterion to distinguish between epigean and hypogean positions. Additional support for this capability was provided by the recovery of a detached diode located underground. Although HDF telemetry does not provide intrinsic individual identity, its combination with PIT tags and colour-coded diodes enabled effective short-term spatial monitoring in a structurally complex subalpine environment. However, diode retention time remains the main technical limitation. Although most reflectors persisted long enough for within-session relocations, none remained attached across the full inter-session interval, and detachment was often associated with moulting. Improvements in attachment protocols or reflector design are therefore required to increase persistence while maintaining minimal invasiveness. A possible future development could involve the design of an injectable or implantable harmonic diode, analogous to PIT tags and encapsulated in a biocompatible material, in order to avoid losses linked to ecdysis and extend monitoring duration. Such an approach would require careful evaluation of signal performance and long-term biocompatibility.
These considerations should be viewed as preliminary technical notes intended to support future applications of HDF telemetry in small animals with restricted home ranges and high conservation value.
In summary, the combined use of PIT tagging, photo-identification, and HDF telemetry represents a complementary and low-impact approach for studying small-bodied, cryptic snake populations where conventional telemetry may be unsuitable.

5. Conclusions

This study demonstrates that the dorsal head region—in particular its pholidosis—provides a robust morphological basis for individual photo-identification in Vipera ursinii. Software-assisted matching (Hotspotter and Wild-ID) demonstrated consistent and reproducible performance, whereas manual scale-based identification, although satisfactory, proved more operator-dependent and susceptible to transcription errors. An integrated workflow—using software-assisted matching as a first step and manual scale verification in cases of uncertainty—should further enhance the reliability of photo-identification for individual recognition in vipers. In parallel, the HDF–RECCO approach proved to be a minimally invasive and effective method for short-term spatial monitoring, being a promising alternative to conventional telemetry for small-bodied ophidians. Together, these methods offer an integrated, low-impact framework for monitoring threatened snake populations in high-altitude environments.

Supplementary Materials

The following supporting information can be downloaded at: https://www.mdpi.com/article/10.3390/d18040202/s1, Supplementary Table S1. Standardised data entry template used for manual photo-identification based on dorsal cephalic scale counts in Vipera ursinii (xlsx file). Supplementary Table S2. Main results from Wild-ID and Hotspotter (xlsx file). Supplementary Files (pdf file): Supplementary Note S1. Confusion matrix-derived performance metrics of manual photo-identification across operators. For each operator, manual assignments were compared against PIT-tag identities using confusion matrices implemented in the caret package in R. Reported metrics include overall accuracy, accuracy with 95% confidence intervals (CI), p-values testing accuracy, Cohen’s Kappa (κ), sensitivity, specificity, positive predictive value (PPV), negative predictive value (NPV), and McNemar’s test p-values; Supplementary Note S2. Frequency tables of scale counts for all dorsal cephalic scale categories considered in the manual identification procedure based on scale counts. Each table is divided per scale type and includes absolute frequencies, percentages, valid percentages, and cumulative percentages; Supplementary Note S3. Contingency tables and results of chi-squared tests assessing the association between cephalic scale counts groups and sex/age classes for all scale categories considered in the manual identification procedure—except frontals due to lack of variability. For each scale type, absolute frequencies are reported by sex (adult female, adult male) or age class (juvenile), together with total counts. Chi-squared statistics (χ2), degrees of freedom (df), p-values, and sample size (N) are provided to evaluate differences in scale count distributions among sex/age classes.

Author Contributions

Conceptualization, D.M., V.F. and M.C.; methodology, D.M., V.F. and M.C.; software, D.M. and A.F.; validation, D.M., A.F. and M.C.; formal analysis, D.M. and A.F.; investigation, D.M., V.F., A.F., O.G.G., P.C. and M.C.; resources, M.C.; data curation, D.M., A.F. and M.C.; writing—original draft preparation, D.M., A.F. and M.C.; writing—review and editing, D.M., V.F., A.F., O.G.G., P.C. and M.C.; visualisation, D.M. and A.F.; project administration, M.C.; funding acquisition, M.C. All authors have read and agreed to the published version of the manuscript.

Funding

This research was funded by the European Union Next Generation EU, Mission 4 Component 2 Measure 1.4 CUP B83C22002930006.

Institutional Review Board Statement

All procedures involving snake capture and handling, PIT-tag implantation, and telemetry were conducted under the relevant legal authorizations issued by the Italian Ministry for the Ecological Transition (MITE; authorization no. 0068141, 31 May 2022) and by the Ministry of the Environment and Energy Security (MASE; authorization no. 0078036, 24 April 2025).

Data Availability Statement

The original contributions presented in this study are included in the article/Supplementary Material. Further inquiries can be directed to the corresponding author.

Acknowledgments

We thank all other collaborators who participated in at least one monitoring session: Arceci F., Carafa Man., Coppari C., Donatelli A., Lunghi E., Mandola I., Manganiello D., Mizsei E., Nicolai E., Posillico M., Silvestri T., and Tantalo F. We sincerely thank the reviewers for their constructive and insightful comments, which substantially improved the quality and clarity of this manuscript. We are also grateful to L. Vignoli for providing the HDF diodes and to M. Trenti for conducting the manual scale counts. During the preparation of this manuscript, the authors used ChatGPT (version 5.2) by OpenAI to improve language and readability. The authors have reviewed and edited the output and take full responsibility for the content of this publication.

Conflicts of Interest

The authors declare no conflicts of interest.

References

  1. Matthé, M.; Sannolo, M.; Winiarski, K.; Spitzen-van der Sluijs, A.; Goedbloed, D.; Steinfartz, S.; Stachow, U. Comparison of Photo-Matching Algorithms Commonly Used for Photographic Capture–Recapture Studies. Ecol. Evol. 2017, 7, 5861–5872. [Google Scholar] [CrossRef] [Scilit]
  2. Alcaraz, R.; Amores, A.; Rotger, A. ReMatch: Re-Identification of Patterned Species in Open-Set Scenarios by Matching Keypoints and Lines. Res. Sq. 2025. [Google Scholar] [CrossRef] [Scilit]
  3. Sacchi, R.; Scali, S.; Pellitteri-Rosa, D.; Pupin, F.; Gentilli, A.; Tettamanti, S.; Cavigioli, L.; Racina, L.; Maiocchi, V.; Galeotti, P.; et al. Photographic Identification in Reptiles: A Matter of Scales. Amphibia-Reptilia 2010, 31, 489–502. [Google Scholar] [CrossRef] [Scilit]
  4. Benson, P.A. Identifying Individual Adders, Vipera berus, within an Isolated Colony in East Yorkshire. Br. Herpetol. Soc. Bull. 1999, 7, 21–27. [Google Scholar]
  5. Lukanov, S.; Kolev, A.; Dyugmedzhiev, A.; Slavchev, M. The Lateral Stripe—A Reliable Way for Software Assisted Individual Identification for Hyla arborea. Acta Herpetol. 2024, 19, 69–73. [Google Scholar] [CrossRef] [Scilit]
  6. Sheldon, S.; Bradley, C. Identification of Individual Adders (Vipera berus) by Their Head Markings. Herpetol. J. 1989, 1, 392–396. [Google Scholar]
  7. Rey, G.; Timmerman, A. L’identification et La Reconnaissance Individuelle Chez La Vipère Péliade Vipera berus à l’aide de Photographies de l’écaillure de La Tête En Vue Dorsale. Retour d’expérience de l’utilisation de Deux Méthodes. Héron 2018, 51, 97–106. [Google Scholar]
  8. Üveges, B.; Halpern, B.; Péchy, T.; Posta, J.; Komlósi, I. Characteristics and Heritability Analysis of Head Scales of the Hungarian Meadow Viper (Vipera ursinii rakosiensis, Méhely 1893). Amphib. Reptil. 2012, 33, 393–400. [Google Scholar] [CrossRef] [Scilit]
  9. Bauwens, D.; Claus, K.; Mergeay, J. Genotyping Validates Photo-identification by the Head Scale Pattern in a Large Population of the European Adder (Vipera berus). Ecol. Evol. 2018, 8, 2985–2992. [Google Scholar] [CrossRef] [Scilit]
  10. Hodges, R.; Seabrook, C. Head-Scale Instability and the Apparent Heritability of a Head Scale Anomaly in the Northern Viper (Vipera berus). Herpetol. Bull. 2014, 30, 16–17. [Google Scholar]
  11. Stoyanov, A.; Tzankov, N. Individual Variation of Pileus Scalation Characteristics in Vipera berus bosniensis Boettger, 1889 (Reptilia: Sqaumata: Viperidae). North-West. J. Zool. 2017, 13, 186–191. [Google Scholar]
  12. Dyugmedzhiev, A. A Non-Traumatic Multi-Operational Method for Individual Documentation and Identification of Nose-Horned Vipers (Vipera ammodytes (Linnaeus, 1758) (Squamata, Viperidae)) Allows Reliable Recognition of Recaptured Specimens. Biharean Biol. 2018, 12, 92–96. [Google Scholar]
  13. Lukanov, S.; Dyugmedzhiev, A. Photo Identification of Viperid Snakes Using Pattern Recognition Software: A Case Study of Vipera ammodytes (Linnaeus, 1758). North-West. J. Zool. 2023, 19, 41–45. [Google Scholar]
  14. Bolger, D.T.; Morrison, T.A.; Vance, B.; Lee, D.; Farid, H. A Computer-Assisted System for Photographic Mark–Recapture Analysis. Methods Ecol. Evol. 2012, 3, 813–822. [Google Scholar] [CrossRef] [Scilit]
  15. Crall, J.P.; Stewart, C.V.; Berger-Wolf, T.Y.; Rubenstein, D.I.; Sundaresan, S.R. HotSpotter—Patterned Species Instance Recognition. In Proceedings of the 2013 IEEE Workshop on Applications of Computer Vision (WACV), Clearwater Beach, FL, USA, 15–17 January 2013; pp. 230–237. [Google Scholar] [CrossRef] [Scilit]
  16. Gibbons, J.W.; Andrews, K.M. PIT Tagging: Simple Technology at Its Best. BioScience 2004, 54, 447. [Google Scholar] [CrossRef] [Scilit]
  17. Oldham, C.; Boys, W.; Price, S.; Fleckenstein, L. Enhancing Ecological Investigations of Snakes with Passive Integrated Transponder (PIT) Tag Telemetry. Herpetol. Rev. 2016, 47, 47–385. [Google Scholar]
  18. Leuenberger, W.; Davis, A.G.; Mckenzie, J.M.; Drayer, A.N.; Price, S.J. Evaluating Snake Density Using Passive Integrated Transponder (PIT) Telemetry and Spatial Capture–Recapture Analyses for Linear Habitats. J. Herpetol. 2019, 53, 272. [Google Scholar] [CrossRef] [Scilit] [PubMed]
  19. Ousterhout, B.H.; Semlitsch, R.D. Measuring Terrestrial Movement Behavior Using Passive Integrated Transponder (PIT) Tags: Effects of Tag Size on Detection, Movement, Survival, and Growth. Behav. Ecol. Sociobiol. 2014, 68, 343–350. [Google Scholar] [CrossRef] [Scilit]
  20. Dorcas, M.E.; Willson, J.D. Innovative Methods for Studies of Snake Ecology and Conservation. In Snakes: Ecology and Conservation; Cornell University Press: Ithaca, NY, USA, 2009; Volume 1, pp. 5–37. [Google Scholar]
  21. Reinert, H.K.; Cundall, D. An improved surgical implantation method for radio-tracking snakes. Copeia 1982, 3, 703–705. [Google Scholar] [CrossRef] [Scilit]
  22. Webb, J.K.; Shine, R. Out on a limb: Conservation implications of tree-hollow use by a threatened snake species (Hoplocephalus bungaroides: Serpentes, Elapidae). Biol. Conserv. 1997, 81, 21–33. [Google Scholar] [CrossRef] [Scilit]
  23. Christensen, T.; Fantuzzi, J. External Transmitter Attachment in Snakes: A Systematic Review of Methods, Efficacy, and Impacts. Anim. Biotelem. 2024, 12, 14. [Google Scholar] [CrossRef] [Scilit]
  24. Leskovar, C.; Sinsch, U. Harmonic Direction Finding: A Novel Tool to Monitor the Dispersal of Small-Sized Anurans. Herpetol. J. 2005, 15, 173–180. [Google Scholar]
  25. Rowley, J.J.L.; Alford, R.A. Techniques for Tracking Amphibians: The Effects of Tag Attachment, and Harmonic Direction Finding versus Radio Telemetry. Amphibia-Reptilia 2007, 28, 367–376. [Google Scholar] [CrossRef] [Scilit]
  26. Vesy, M.N.; Watters, J.L.; Moody, R.W.; Schauber, E.M.; Mook, J.M.; Siler, C.D. Survivorship and Spatial Patterns of an Urban Population of Texas Horned Lizards. J. Wildl. Manag. 2021, 85, 1267–1279. [Google Scholar] [CrossRef] [Scilit]
  27. Reading, C.J.; Luiselli, L.M.; Akani, G.C.; Bonnet, X.; Amori, G.; Ballouard, J.M.; Filippi, E.; Naulleau, G.; Pearson, D.; Rugiero, L. Are Snake Populations in Widespread Decline? Biol. Lett. 2010, 6, 777–780. [Google Scholar] [CrossRef] [Scilit] [PubMed]
  28. Filippi, E.; Luiselli, L. Status of the Italian Snake Fauna and Assessment of Conservation Threats. Biol. Conserv. 2000, 93, 219–225. [Google Scholar] [CrossRef] [Scilit]
  29. The IUCN Red List of Threatened Species. Available online: https://www.iucnredlist.org/en (accessed on 31 December 2025).
  30. Edgar, P.; Bird, D. Action Plan for the Conservation of the Meadow Viper (Vipera ursinii) in Europe; Council of Europe: Strasbourg, France, 2005. [Google Scholar]
  31. Mizsei, E.; Sos, T.; Móré, A.; Wenner, B.; Rák, G.; Mebert, K. Restriction Times on the Rise: Mechanistic Modelling of Activity Time of Grassland Vipers (Vipera spp.) in the Face of Climate Change. Front. Zool. 2025, 22, 10. [Google Scholar] [CrossRef] [Scilit] [PubMed]
  32. Rondinini, C.; Battistoni, A.; Teofili, C. Lista Rossa IUCN dei Vertebrati italiani; Comitato Italiano IUCN e Ministero dell’Ambiente e della Sicurezza Energetica: Roma, Italy, 2022.
  33. Mizsei, E.; Zinenko, O.; Sillero, N.; Ferri, V.; Roussos, S.A.; Szabolcs, M. The Distribution of Meadow and Steppe Vipers (Vipera graeca, V. renardi and V. ursinii): A Revision of the New Atlas of Amphibians and Reptiles of Europe. Basic Appl. Herpetol. 2018, 32, 77–83. [Google Scholar] [CrossRef] [Scilit]
  34. Ferchaud, A.-L.; Ursenbacher, S.; Cheylan, M.; Luiselli, L.; Jelić, D.; Halpern, B.; Major, Á.; Kotenko, T.; Keyan, N.; Behrooz, R.; et al. Phylogeography of the Vipera ursinii Complex (Viperidae): Mitochondrial Markers Reveal an East–West Disjunction in the Palaearctic Region. J. Biogeogr. 2012, 39, 1836–1847. [Google Scholar] [CrossRef] [Scilit]
  35. Capula, M.; Luiselli, L. Distribution and conservation of Vipera ursinii (Reptilia: Viperidae) in Italy. In Proceedings of the 6th Ordinary General Meeting of the Societas Europaea Herpetologica; Korsos, Z., Kiss, I., Eds.; Hungarian Natural History Museum: Budapest, Hungary, 1992; pp. 101–105. [Google Scholar]
  36. Carafa, M.; Ferri, V.; Filippi, E.; Montioni, F. Vipera ursinii (Bonaparte, 1835). In Atlante degli Anfibi e Rettili d’Italia/Atlas of Italian Amphibians and Reptiles; Razzetti, E., Bruni, G., Di Tizio, L., Liuzzi, C., Sindaco, R., Eds.; Historia Naturae; Societas Herpetologica Italica/Edizione Belvedere: Latina, Italy, 2025; pp. 442–445. [Google Scholar]
  37. Filippi, E.; Luiselli, L. Ecology and Conservation of the Meadow Viper, Vipera ursinii, in Three Protected Mountainous Areas in Central Italy. Ital. J. Zool. 2004, 71, 159–161. [Google Scholar] [CrossRef] [Scilit]
  38. Filippi, E.; Luiselli, L. Aspects of the Ecology and Conservation of the Meadow Viper, Vipera ursinii, in the Duchessa Mountains Natural Park (Latium, Central Italy). Herpetol. Bull. 2003, 86, 5–9. [Google Scholar]
  39. R Core Team. R: A Language and Environment for Statistical Computing; R Foundation for Statistical Computing: Vienna, Austria, 2024. [Google Scholar]
  40. Kuhn, M. Building Predictive Models in R Using the Caret Package. J. Stat. Softw. 2008, 28, 1–26. [Google Scholar] [CrossRef] [Scilit]
  41. Burgstaller, S.; Gollmann, G.; Landler, L. The Green Toad Example: A Comparison of Pattern Recognition Software. North-West. J. Zool. 2021, 17, e211506. [Google Scholar]
  42. Nipko, R.B.; Holcombe, B.E.; Kelly, M.J. Identifying Individual Jaguars and Ocelots via Pattern-Recognition Software: Comparing HotSpotter and Wild-ID. Wildl. Soc. Bull. 2020, 44, 424–433. [Google Scholar] [CrossRef] [Scilit]
  43. Patel, N.G.; Das, A. Shot the Spots: A Reliable Field Method for Individual Identification of Amolops formosus (Anura, Ranidae). Herpetozoa 2020, 33, 7–15. [Google Scholar] [CrossRef] [Scilit]
  44. Moya, Ó.; Mansilla, P.-L.; Madrazo, S.; Igual, J.-M.; Rotger, A.; Romano, A.; Tavecchia, G. APHIS: A New Software for Photo-Matching in Ecological Studies. Ecol. Inform. 2015, 27, 64–70. [Google Scholar] [CrossRef] [Scilit]
Figure 1. Manual photo-identification procedure based on dorsal cephalic scale counts in Vipera ursinii. (A) Dorsal view of the head showing dorsal cephalic scales considered for manual identification; coloured dots indicate the different scale groups used in the count-based approach. (B) Same image as in (A) with the background removed and the boundaries of the selected dorsal cephalic scales manually delineated to highlight the region used for scale counting and individual discrimination. (C) Schematic representation derived from (B), in which scale boundaries are filled with distinct colours corresponding to the predefined scale groups; the same colours are shown beneath the numbers indicating the scale count recorded for each group in the illustrated example. The concatenation of counts across all scale types was used to generate a composite six-digit numerical code for individual identification. Green: apical and canthal scales; light blue: intercanthal scales; red: left and right parafrontal scales; yellow: frontal scale; blue: parietal scales.
Diversity 18 00202 g001
Figure 2. Application and use of the HDF–RECCO tracking system on Vipera ursinii. (A) Field operations showing active searches with the handheld RECCO detector in alpine grassland habitats and a close-up of the detector in use; the lightweight harmonic diode (HDF reflector) is shown after detachment. Photos by VF. (B) Detail of an externally attached HDF reflector fixed longitudinally to a meadow viper trunk. Photo by MC.
Diversity 18 00202 g002
Figure 3. Comparison of confusion matrix-derived performance metrics among operators for manual photo-identification. Bars represent overall accuracy, Cohen’s Kappa (κ), sensitivity, and specificity for each operator. Accuracy values ranged from 0.77 to 0.91. Cohen’s Kappa indicated variable agreement beyond chance (0.23–0.77). Sensitivity exhibited marked inter-operator variability (0.17–0.83), whereas specificity remained consistently high across operators (0.81–1.00). Values were obtained from confusion matrix analyses comparing manual identifications with PIT-tag reference identities.
Diversity 18 00202 g003
Figure 4. Hotspotter output showing the first six ranked matches for a query image. The first two matches are true positives; the top-ranked match represents the highest similarity score obtained in the study (110,943.0).
Diversity 18 00202 g004
Figure 5. Pie charts illustrating the relative proportions (%) of dorsal cephalic scale counts for each cephalic category in the Maiella population of Vipera ursinii (n = 32 unique individuals). (A) apicals + canthals; (B) intercanthals; (C) parafrontals left; (D) parafrontals right; (E) frontals; (F) parietals. Detailed descriptive statistics are provided in Supplementary Note S2 and Table 2.
Diversity 18 00202 g005
Figure 6. Field application of the external HDF-RECCO tagging system on Vipera ursinii in the Maiella study area. (A) Juvenile photographed after attachment of the HDF diode, fixed to the posterior third of the body and colour-coded BLUE. Photo by DM. (B) Close-up of an individual with the HDF diode colour-coded BLUE-WHITE. Photo by DM. (C) The same individual as in (B), subsequently located beneath a rock shelter. Photo by DM. (D) Individual equipped with the HDF diode colour-coded BLUE-YELLOW. Photo by MC.
Diversity 18 00202 g006
Figure 7. Examples of detached HDF diodes recovered in the field. (A) Detached diode attached to a small fragment of shed skin, retrieved from soil fissures; the limited amount of epidermal tissue indicates that detachment may have occurred prior to the main ecdysis event. (B) Diode associated with a large fragment of shed skin, most likely detached during ecdysis. (C) Diode recovered together with a complete shed skin that had wrinkled and partially wrapped around the device, with the GREEN-ON-RED colour code clearly visible. Photos by DM.
Diversity 18 00202 g007
Figure 8. Vipera ursinii after the application of a RECCO diode using cyanoacrylate, which remained in place for less than 24 h. Macroscopic examination was consistent with loss of the Oberhäutchen and possible involvement of the β-layer, with no apparent damage to the underlying α-layer. Photo by DM.
Diversity 18 00202 g008
Figure 9. Hotspotter inspect-query output showing a true positive match. The query image is correctly matched to the same individual, with a high concentration of corresponding keypoints across the dorsal head region. Matched features are primarily associated with stable head-scale morphology, including the scales surrounding the frontal and parietal scutes.
Diversity 18 00202 g009
Figure 10. Hotspotter inspect-query output showing a false positive match. Despite a relatively high similarity score and dense clustering of matched keypoints, the two images represent different individuals photographed in a similar head orientation and posture. The overlap of matched features is largely driven by geometric congruence and shared cranial trunk outlines rather than true individual-specific pholidiosis, illustrating how posture and viewing angle can mislead automated matching.
Diversity 18 00202 g010
Table 1. Performance of the two photo-identification software programmes (Wild-ID and Hotspotter) applied to Vipera ursinii, showing the total suggesting the correct individual, the number and percentage of correct matches ranked as the first suggestion, and those retrieved within the top six suggested matches.
SoftwareTotal MatchesMatches at First SuggestionMatches Within Top Six Suggestion
Wild-ID169 (56.25%)5 (31.25%)
Hotspotter 2015 (75%)2 (10%)
Table 2. Summary statistics (mode, minimum and maximum) of selected dorsal cephalic scale counts. The analysis is based on 32 photographs of dorsal head regions, each corresponding to a unique individual of Vipera ursinii. Further details on the distribution and frequencies of cephalic scales among Maiella meadow vipers are illustrated in the pie charts shown in Figure 5, and in the Supplementary Note S2.
Apicals + CanthalsIntercanthalsParafrontals LeftParafrontals RightFrontalParietals
Mode543312
Minimum431112
Maximum755514
Disclaimer/Publisher’s Note: The statements, opinions and data contained in all publications are solely those of the individual author(s) and contributor(s) and not of MDPI and/or the editor(s). MDPI and/or the editor(s) disclaim responsibility for any injury to people or property resulting from any ideas, methods, instructions or products referred to in the content.