


Abstract
Glioblastoma (GBM) is characterized by marked heterogeneity and an immunosuppressive microenvironment. N-acetylneuraminate synthase (NANS) contributes to tumor-associated metabolic regulation, but its relationship with GBM and its immune profile remains unclear. This study aimed to characterize the prognostic and immune relevance of NANS and develop an MRI radiomics model for noninvasive prediction of NANS-high GBM. Prognostic genes were screened across TCGA-GBM and two CGGA cohorts. Bulk transcriptomic and single-cell RNA sequencing analyses were used to evaluate NANS expression, patient survival association, and cellular localization. NANS-high bone marrow-derived macrophages (BMDMs) were characterized using functional enrichment and CellChat analyses. A NANS-high BMDM signature was validated in TCGA-GBM for immune infiltration and ligand–receptor axis activity. Drug sensitivity and CMap analyses were performed. MRI radiomics features were extracted from preprocessed T1 contrast-enhanced and FLAIR images, and an elastic net logistic regression model was constructed to predict NANS-high BMDM signature status. NANS was identified as a prognostic macrophage-associated biomarker in GBM and was enriched in BMDMs. NANS-high BMDMs showed enrichment of mTORC1 signaling, oxidative phosphorylation, unfolded protein response, glycolysis, hypoxia, and protein secretion programs. Cell–cell communication analysis revealed enhanced outgoing signaling toward malignant tumor states and T-cell subsets, with LGALS9-centered interactions representing the dominant differential communication program. In TCGA-GBM, the NANS-high BMDM signature correlated with increased macrophage infiltration, broad immune infiltration, and elevated LGALS9 and PLAU axis scores. Drug sensitivity analyses suggested potential vulnerabilities involving PI3K/mTOR and MAPK/ERK pathways. The radiomics model selected six MRI features and distinguished NANS-high from NANS-low tumors with an AUC of 0.795 (95% CI, 0.652–0.939); bootstrap validation showed a mean AUC of 0.793 (95% CI, 0.637–0.922). NANS-high BMDMs define a prognostically adverse and potentially targetable macrophage-associated phenotype in GBM. MRI radiomics may noninvasively predict this NANS-high BMDM state, supporting imaging-based risk stratification and therapeutic selection.
1. Introduction
Glioblastoma (GBM) remains the most lethal primary malignancy of the adult central nervous system, with poor survival despite maximal safe resection, radiotherapy, and temozolomide-based chemotherapy [1,2]. Therapeutic resistance in GBM is largely driven by profound biological heterogeneity, involving genetic, epigenetic, developmental, and microenvironmental programs [3,4]. Recent single-cell transcriptomic studies have shown that malignant GBM cells exist in distinct and plastic cellular states, including neural progenitor-like, oligodendrocyte progenitor-like, astrocyte-like, and mesenchymal-like programs [3]. This cellular-state diversity provides an important framework for understanding tumor progression, treatment resistance, and tumor–microenvironment interactions.
The GBM immune microenvironment is characterized by limited effective lymphocyte infiltration and abundant immunosuppressive myeloid cells. Tumor-associated macrophages and microglia represent a major immune component of GBM and contribute to immune evasion, angiogenesis, tumor progression, and therapeutic resistance [5,6]. These macrophage-lineage populations include brain-resident microglia and recruited bone marrow-derived macrophages (BMDMs), which differ in ontogeny, transcriptional features, and functional roles within the tumor ecosystem [7]. Given the limited clinical benefit of immune checkpoint blockade in GBM, a more detailed understanding of macrophage heterogeneity and macrophage-mediated tumor–immune communication is needed to identify clinically relevant immune states and therapeutic vulnerabilities [8].
Beyond macrophage polarization, metabolic and glycosylation-related programs may further shape myeloid-cell function within the tumor microenvironment. Aberrant sialylation can modulate tumor–immune interactions through Siglec–sialic acid signaling, thereby contributing to immune evasion and suppression of anti-tumor responses [9]. N-acetylneuraminate synthase (NANS), a key enzyme involved in de novo sialic acid biosynthesis, may participate in tumor-associated sialylation programs; however, its role in the glioma ecosystem remains poorly defined [10]. Whether NANS marks a distinct macrophage-associated state, and whether this state is linked to malignant cellular programs, T-cell subsets, immune infiltration, and therapeutic vulnerability, has not been systematically investigated.
Single-cell RNA sequencing provides a powerful approach to resolve the cellular localization and functional context of candidate biomarkers within the GBM ecosystem. Prior single-cell studies have mapped malignant cell states, immune cell heterogeneity, and intercellular communication networks in human gliomas [5]. However, transcriptomic profiling is tissue-dependent and may not be available before treatment. MRI is routinely used in GBM diagnosis and management, and radiomics enables high-throughput extraction of quantitative imaging features that may reflect underlying tumor heterogeneity. Because macrophage states are influenced by spatially heterogeneous tumor niches, including edema, necrosis, and vascular remodeling, radiomics may provide a noninvasive surrogate for selected macrophage-associated molecular phenotypes [11,12].
In this study, we integrated multi-omics and radiomics to systematically dissect the role of NANS in the GBM TME. We first delineated its cellular localization and intercellular communication networks at single-cell resolution, then established its clinical relevance and therapeutic implications in bulk cohorts and finally constructed a radiomics-based imaging biomarker to enable noninvasive patient stratification for a NANS-associated specific immune state.
2. Results
2.1. NANS Is Associated with Poor Prognosis and Is Highly Expressed in BMDMs
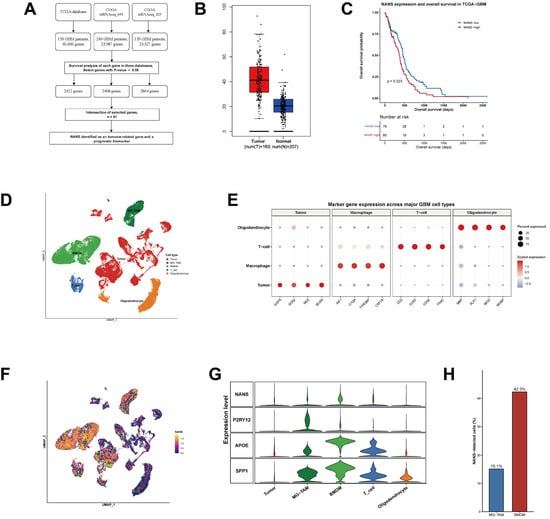
To identify prognostically relevant genes in GBM, survival analyses were performed across TCGA-GBM, CGGA mRNAseq_693, and CGGA mRNAseq_325 cohorts. A total of 2422, 2468, and 2864 survival-associated genes were identified in the three cohorts, respectively, and 41 overlapping prognostic genes were retained. Among these 41 genes (Supplementary Table S1), NANS was selected for further hypothesis-driven investigation based on its role in sialic acid biosynthesis and its potential relevance to the tumor immune microenvironment, rather than statistical superiority over the other candidates (Figure 1A). NANS expression was higher in GBM tissues than in normal brain tissues (Figure 1B), and high NANS expression was associated with significantly worse overall survival in TCGA-GBM patients (p = 0.023; Figure 1C). Stratified analyses were further performed according to IDH status and MGMT-promoter methylation status. NANS expression did not differ significantly between IDH-wildtype and IDH-mutant tumors or between MGMT-methylated and unmethylated tumors (Supplementary Figure S1A,B). High NANS expression remained associated with poorer overall survival in IDH-wildtype GBM (HR = 1.53, 95% CI: 1.01–2.30; p = 0.042) and in the MGMT-methylated subgroup (HR = 3.01, 95% CI: 1.43–6.36; p = 0.0024), whereas no significant association was observed in the IDH-mutant or MGMT-unmethylated subgroups (Supplementary Figure S1C–F).
Figure 1.
Identification of NANS as a prognostic and macrophage-associated biomarker in glioblastoma. (A) Workflow for prognostic gene screening across TCGA-GBM, CGGA mRNAseq_693, and CGGA mRNAseq_325, identifying 41 overlapping genes. (B) NANS expression in GBM and normal brain tissues using GEPIA. (C) Kaplan–Meier analysis of overall survival according to NANS expression in TCGA-GBM. (D) UMAP of major GBM cell populations, including tumor cells, MG-TAMs, BMDMs, T cells, and oligodendrocytes. (E) Dot plot of canonical marker genes across major cell types. (F) Feature plot of NANS expression in the single-cell dataset. (G) Violin plots showing NANS and representative macrophage-associated genes, including P2RY12, APOE, and SPP1, across major cell types. (H) Bar plot showing the proportion of NANS-detected cells in macrophage subsets. NANS-detected cells accounted for 15.1% of MG-TAMs and 42.3% of BMDMs.
Single-cell analysis identified five major cellular populations, including tumor cells, MG-TAMs, BMDMs, T cells, and oligodendrocytes, with cell annotations supported by canonical marker genes (Figure 1D,E). NANS expression was mainly localized to the macrophage compartment and was particularly enriched in BMDMs (Figure 1F,G). Within macrophage-lineage cells, the proportion of NANS-detected cells was higher in BMDMs than in MG-TAMs (42.3% vs. 15.1%, p < 0.001; Figure 1H).
2.2. NANS-High BMDMs Are Characterized by Metabolic Activation and Protein-Processing Programs
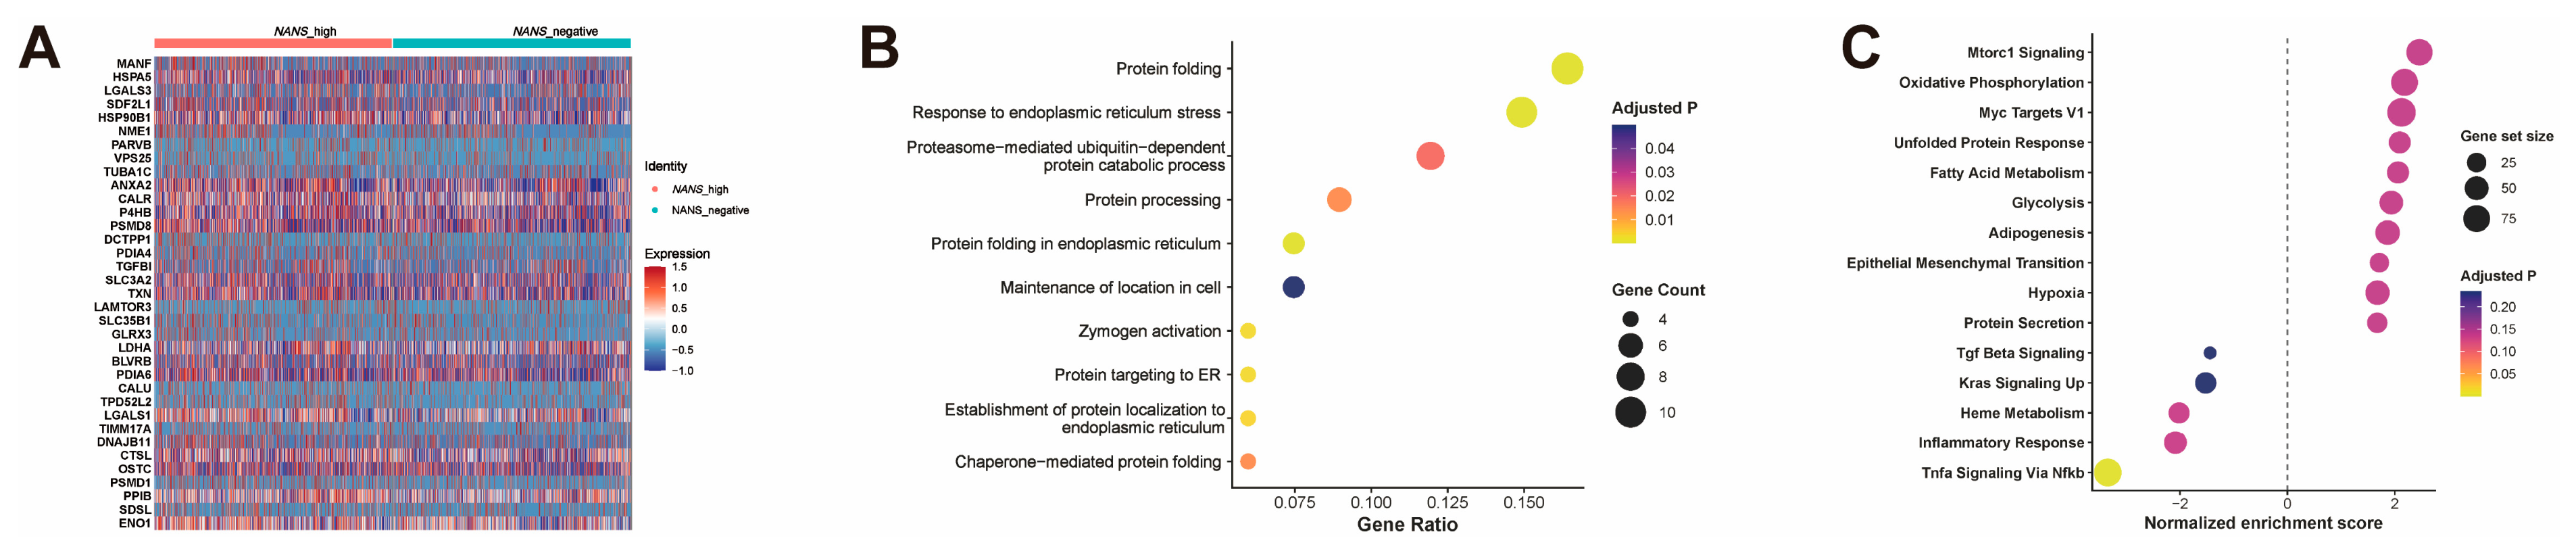
To define the biological features of NANS-high macrophages, we compared the transcriptional profiles of NANS-high and NANS-low BMDMs. Heatmap analysis showed that NANS-high BMDMs exhibited a distinct expression pattern, with increased expression of genes related to protein folding, endoplasmic reticulum stress, secretion, and cellular stress adaptation, including MANF, HSPA5, LGALS3, HSP90B1, CALR, PDIA4, and LGALS1 (Figure 2A).
Figure 2.
Functional characterization of NANS-high BMDMs in glioblastoma. (A) Heatmap of representative differentially expressed genes between NANS-high and NANS-low BMDMs. (B) Gene Ontology enrichment analysis of genes upregulated in NANS-high BMDMs. (C) Hallmark gene set enrichment analysis comparing NANS-high and NANS-low BMDMs. Positive normalized enrichment scores indicate pathways enriched in NANS-high BMDMs, whereas negative scores indicate pathways enriched in NANS-low BMDMs. Dot size represents gene set size, and color indicates adjusted p value.
Functional enrichment analysis further showed that genes enriched in NANS-high BMDMs were mainly associated with protein folding, response to endoplasmic reticulum stress, proteasome-mediated protein catabolism, protein processing, and protein targeting to the endoplasmic reticulum (Figure 2B). GSEA revealed positive enrichment of MTORC1 signaling, oxidative phosphorylation, MYC targets, unfolded protein response, fatty acid metabolism, glycolysis, adipogenesis, epithelial–mesenchymal transition, hypoxia, and protein secretion in NANS-high BMDMs (Figure 2C). In contrast, inflammatory response, TNFα signaling via NF-κB, heme metabolism, KRAS signaling, and TGF-β signaling were negatively enriched.
2.3. NANS-High BMDMs Show Increased CellChat-Inferred Communication with Tumor and T-Cell Populations
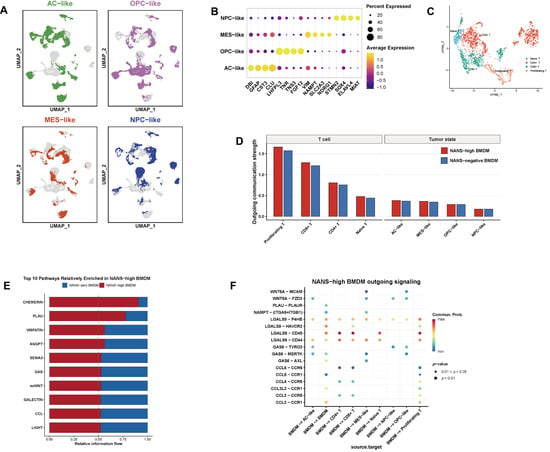
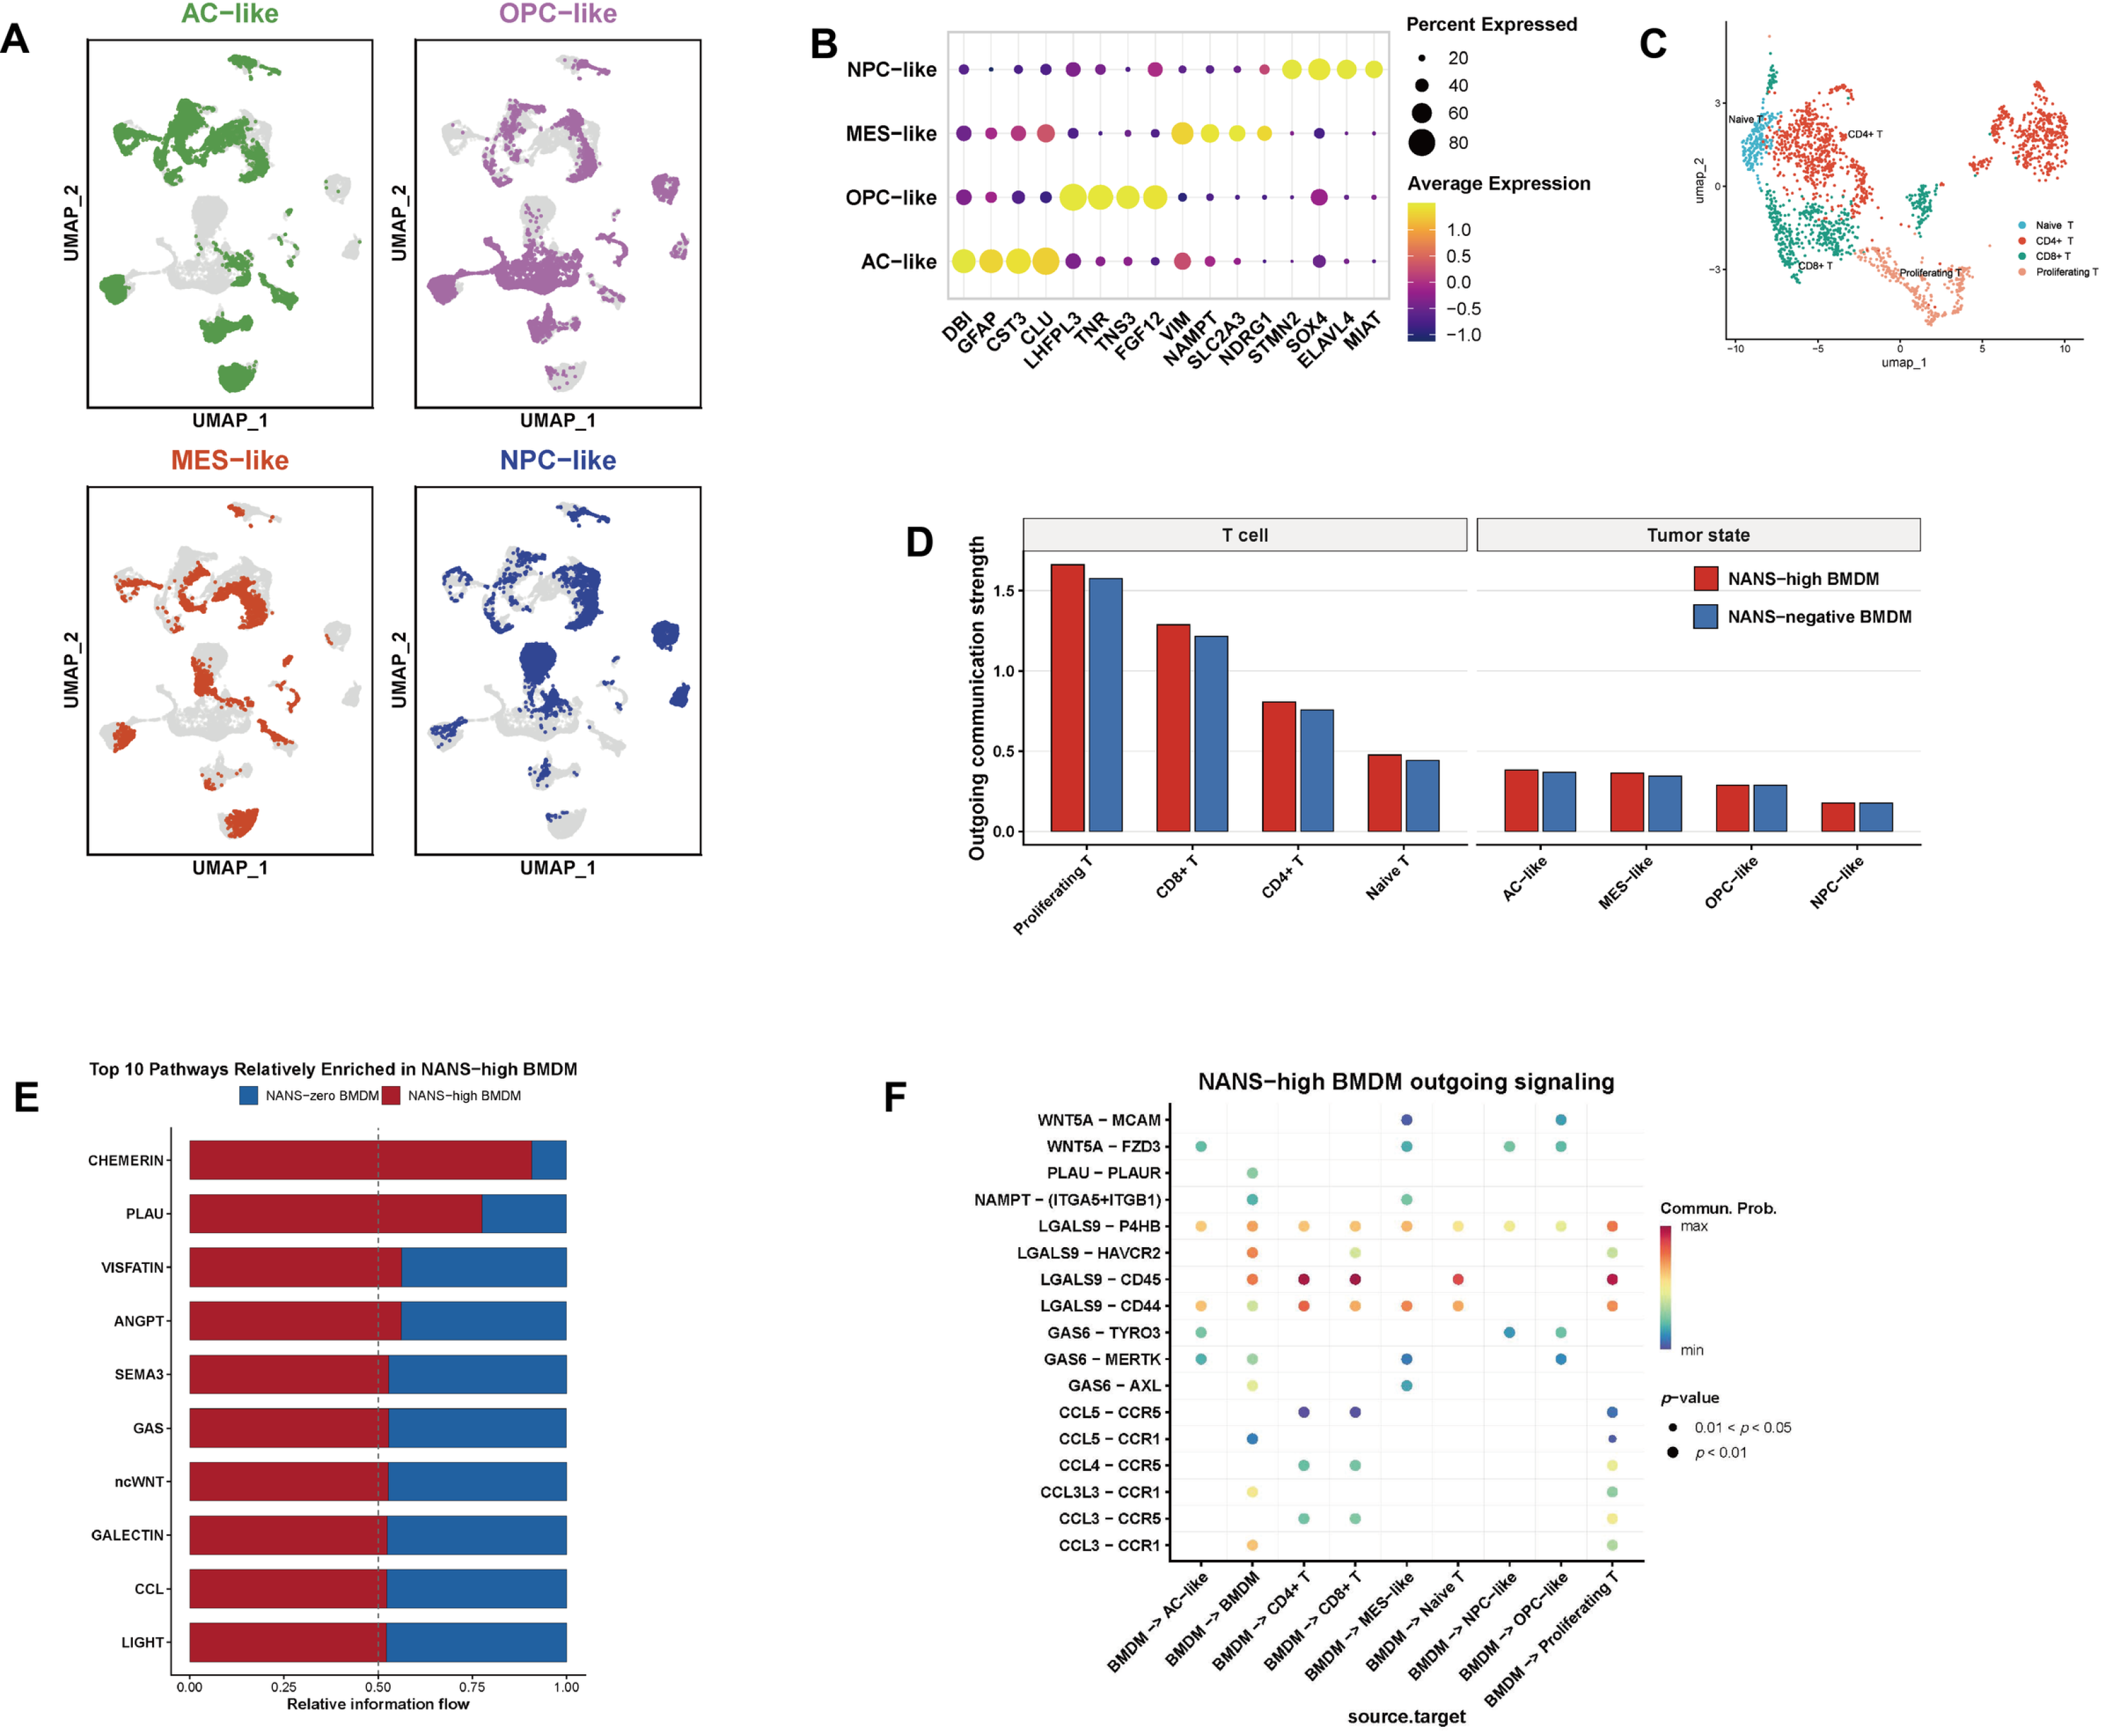
To further investigate the interaction between NANS-high BMDMs and other cellular compartments, malignant tumor cells were classified into AC-like, OPC-like, MES-like, and NPC-like states, while T cells were annotated as naïve T, CD4+ T, CD8+ T, and proliferating T subsets (Figure 3A–C). Compared with NANS-low BMDMs, NANS-high BMDMs were inferred by CellChat to have higher outgoing communication strength toward both T-cell subsets and malignant tumor states, particularly toward proliferating T cells, CD8+ T cells, and CD4+ T cells (Figure 3D). Pathway-level comparison further identified several signaling pathways preferentially enriched in NANS-high BMDMs, including CHEMERIN, PLAU, VISFATIN, and ANGPT signaling (Figure 3E). Ligand–receptor analysis further identified several differential outgoing signals from NANS-high BMDMs. Among these, LGALS9-centered interactions showed the largest inferred differences, including LGALS9–CD45, LGALS9–CD44, LGALS9–P4HB, and LGALS9–HAVCR2, with predicted interactions involving CD4+ T cells, CD8+ T cells, proliferating T cells, and BMDMs (Figure 3F).
Figure 3.
CellChat-inferred intercellular communication associated with NANS-high BMDMs in glioblastoma. (A) UMAP of malignant tumor cells classified into AC-like, OPC-like, MES-like, and NPC-like states. (B) Dot plot of marker genes used to annotate malignant tumor states. (C) UMAP of T-cell subpopulations, including naïve T cells, CD4+ T cells, CD8+ T cells, and proliferating T cells. (D) CellChat-inferred outgoing communication strength from NANS-high and NANS-low BMDMs to T-cell subsets and malignant tumor states. (E) Relative information flow of the top 10 signaling pathways with higher inferred activity in NANS-high BMDMs. (F) Bubble plot of ligand–receptor pairs showing the largest inferred differences between NANS-high and NANS-low BMDMs across interactions with malignant tumor states and T-cell subsets.
2.4. Development and Characterization of a NANS-High BMDM Signature
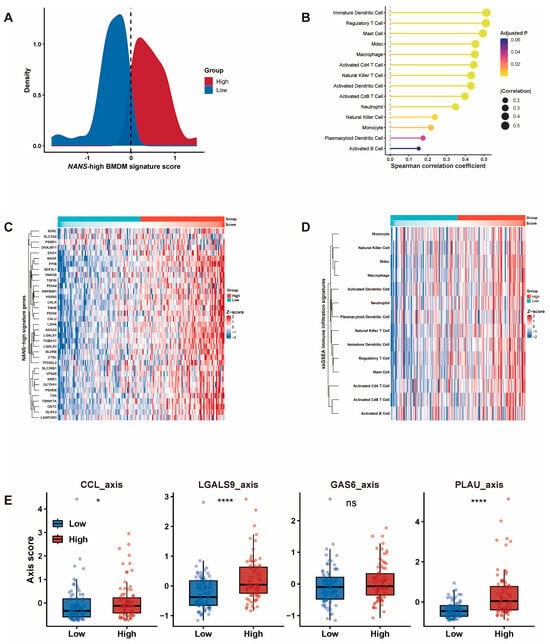
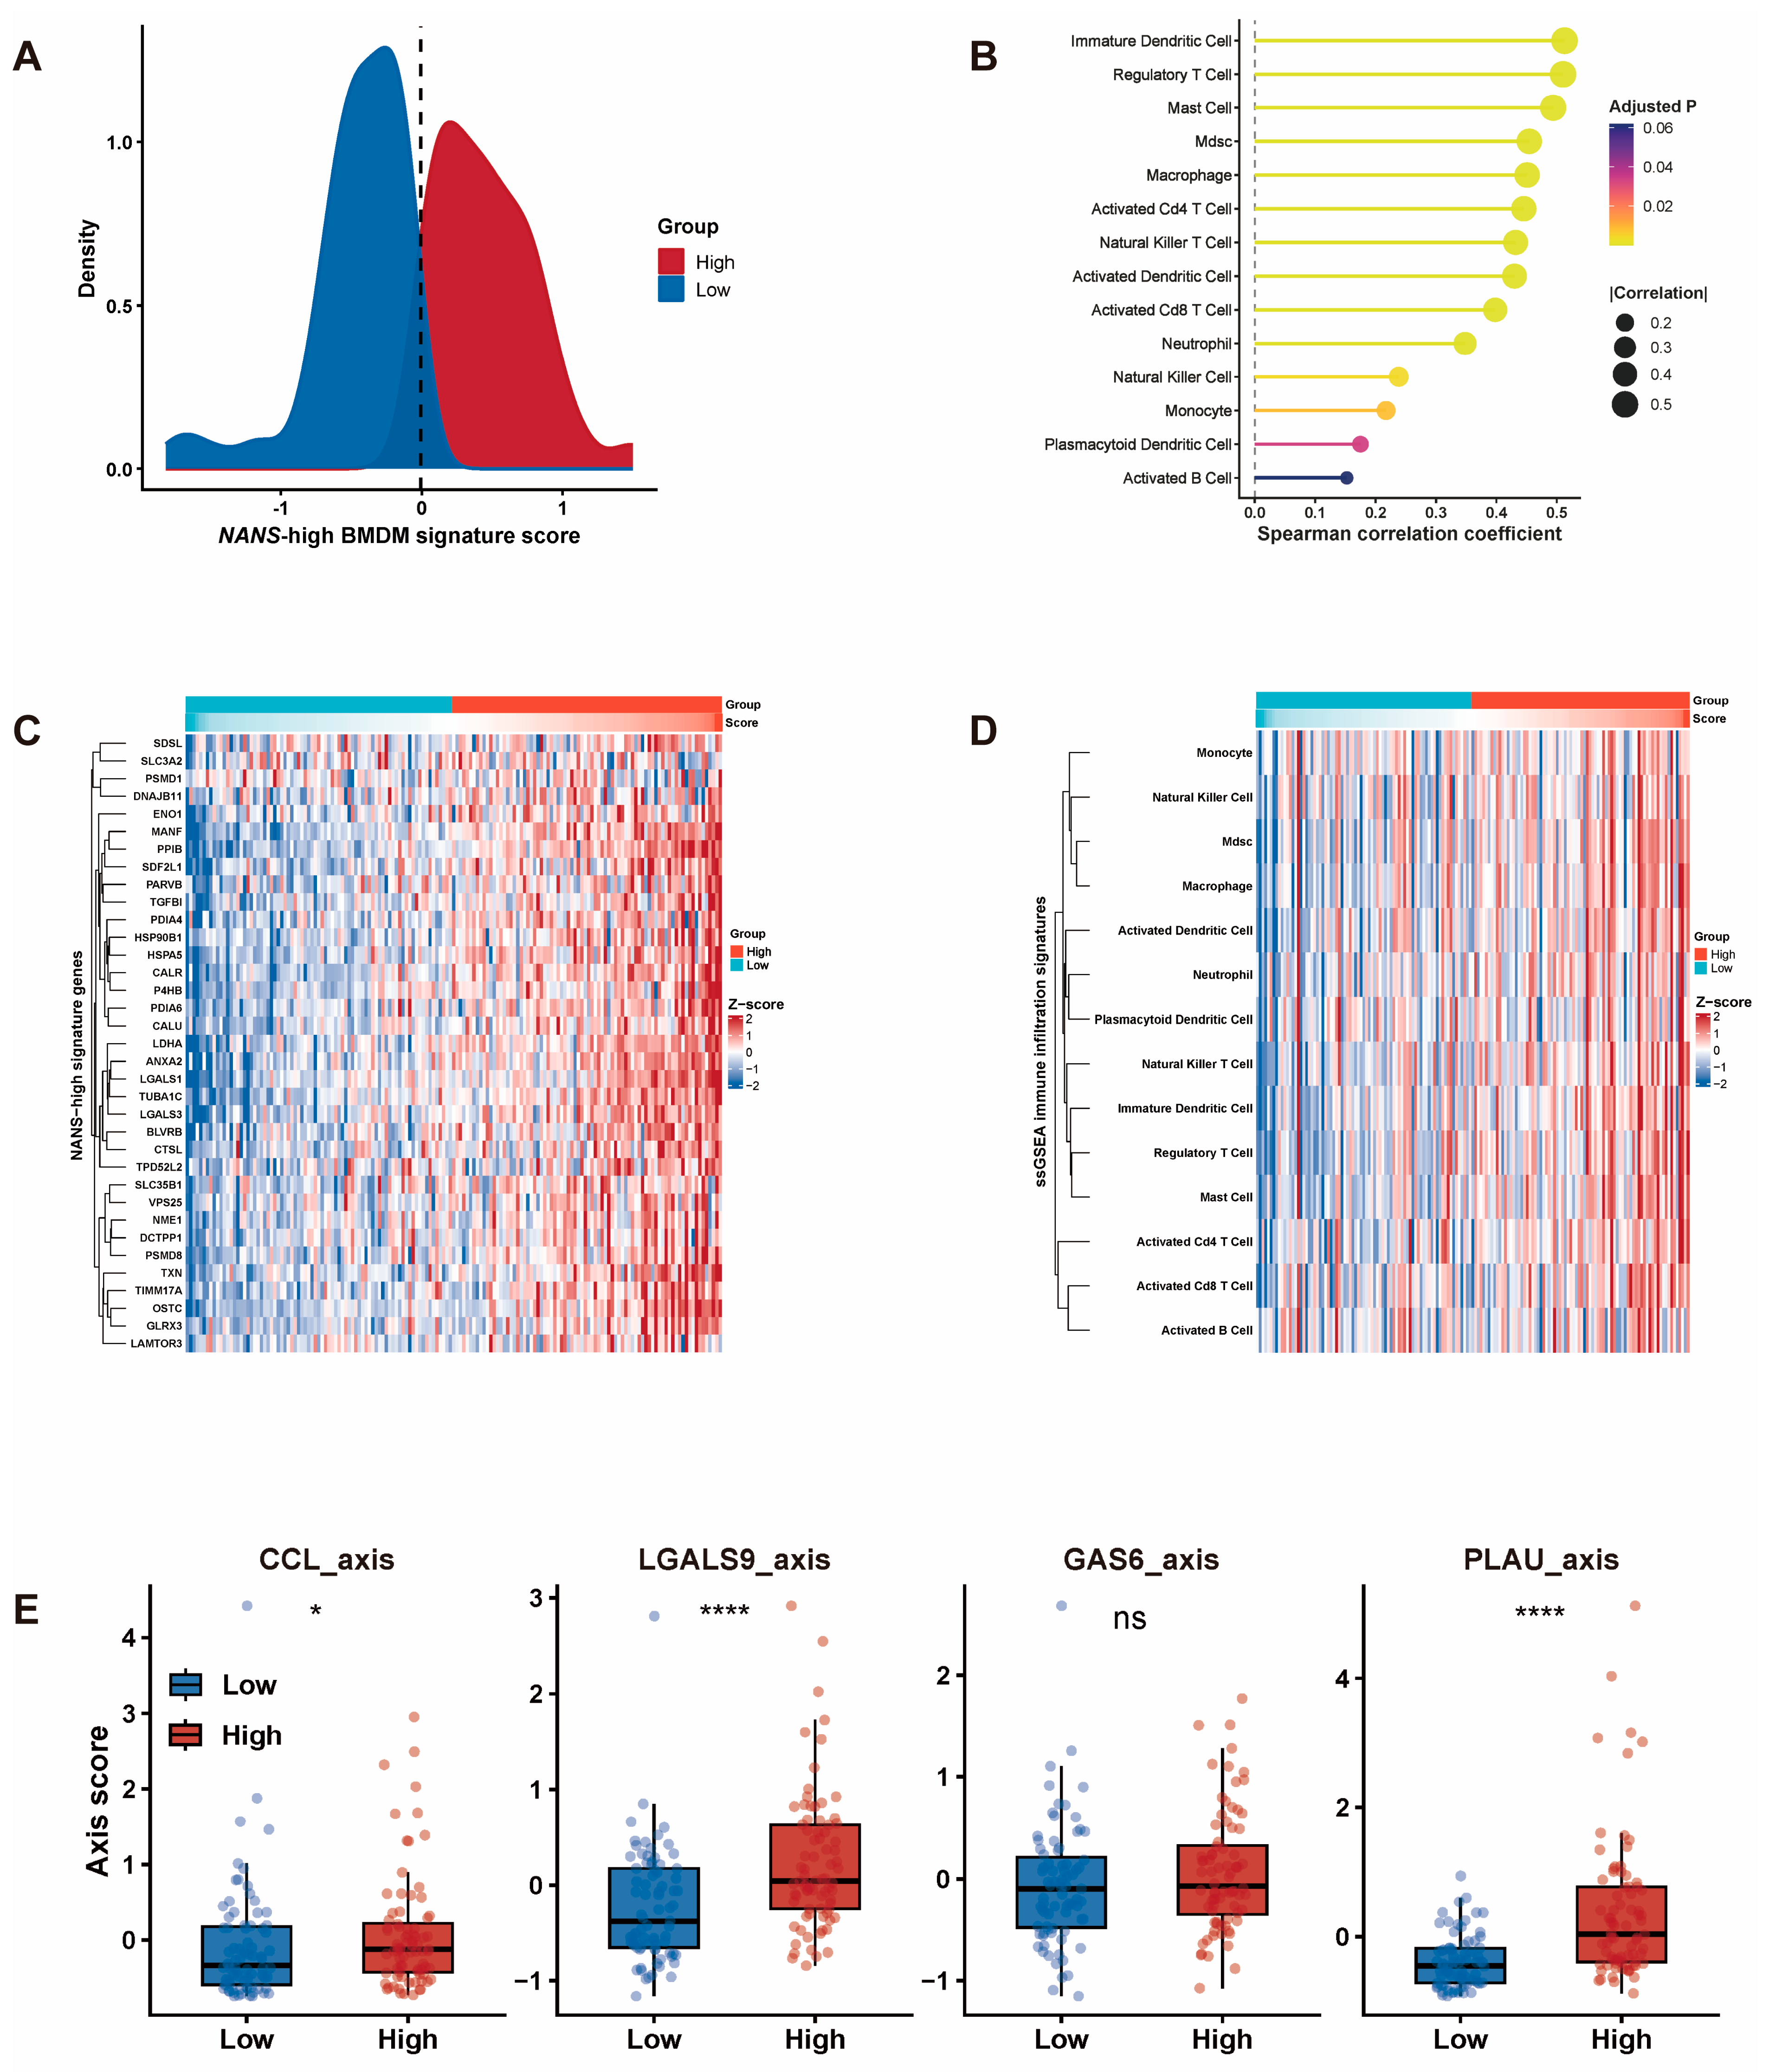
To translate the single-cell findings into bulk transcriptomic data, we constructed a NANS-high BMDM signature based on genes enriched in NANS-high BMDMs and calculated a signature score for each TCGA-GBM patient. Patients were then stratified into high- and low-score groups according to the signature score distribution (Figure 4A). The signature genes showed coordinated upregulation in the high-score group, supporting the consistency of this macrophage-associated transcriptional program in bulk GBM samples (Figure 4C).
Figure 4.
Bulk transcriptomic validation of the NANS-high BMDM signature and its association with immune infiltration in TCGA-GBM. (A) Distribution of the NANS-high BMDM signature score in TCGA-GBM patients and stratification into signature-high and signature-low groups. (B) Spearman correlations between the NANS-high BMDM signature score and ssGSEA-derived immune cell signatures. (C) Heatmap of NANS-high BMDM signature genes across TCGA-GBM patients. (D) Heatmap of ssGSEA-derived immune infiltration signatures stratified by signature score. (E) Comparison of selected ligand–receptor axis scores between signature-high and signature-low groups. Statistical significance: ns, not significant; * p < 0.05; **** p < 0.0001.
ssGSEA-based immune infiltration analysis showed that the NANS-high BMDM signature score was positively correlated with multiple immune cell signatures, including immature dendritic cells, regulatory T cells, mast cells, MDSCs, macrophages, and activated CD4+ T cells (Figure 4B). To determine whether the NANS-high BMDM signature primarily reflected macrophage abundance, we compared the signature score with MCP-counter-derived monocytic lineage abundance. No significant correlation was observed (Spearman ρ = 0.074, p = 0.352), suggesting that the NANS-high BMDM signature captures a distinct macrophage transcriptional state rather than simply reflecting macrophage abundance. Consistently, the heatmap showed broadly increased immune cell signature scores in the high-score group, particularly involving myeloid cells, dendritic cells, regulatory T cells, and activated T-cell populations (Figure 4D). In addition, LGALS9 and PLAU axis scores were significantly increased in the high-score group, whereas the GAS6 axis showed no significant difference (Figure 4E). These findings support that the NANS-high BMDM signature captures key macrophage-associated communication programs in bulk GBM, especially LGALS9- and PLAU-centered signaling.
2.5. Drug Sensitivity Analysis Reveals Potential Therapeutic Vulnerabilities
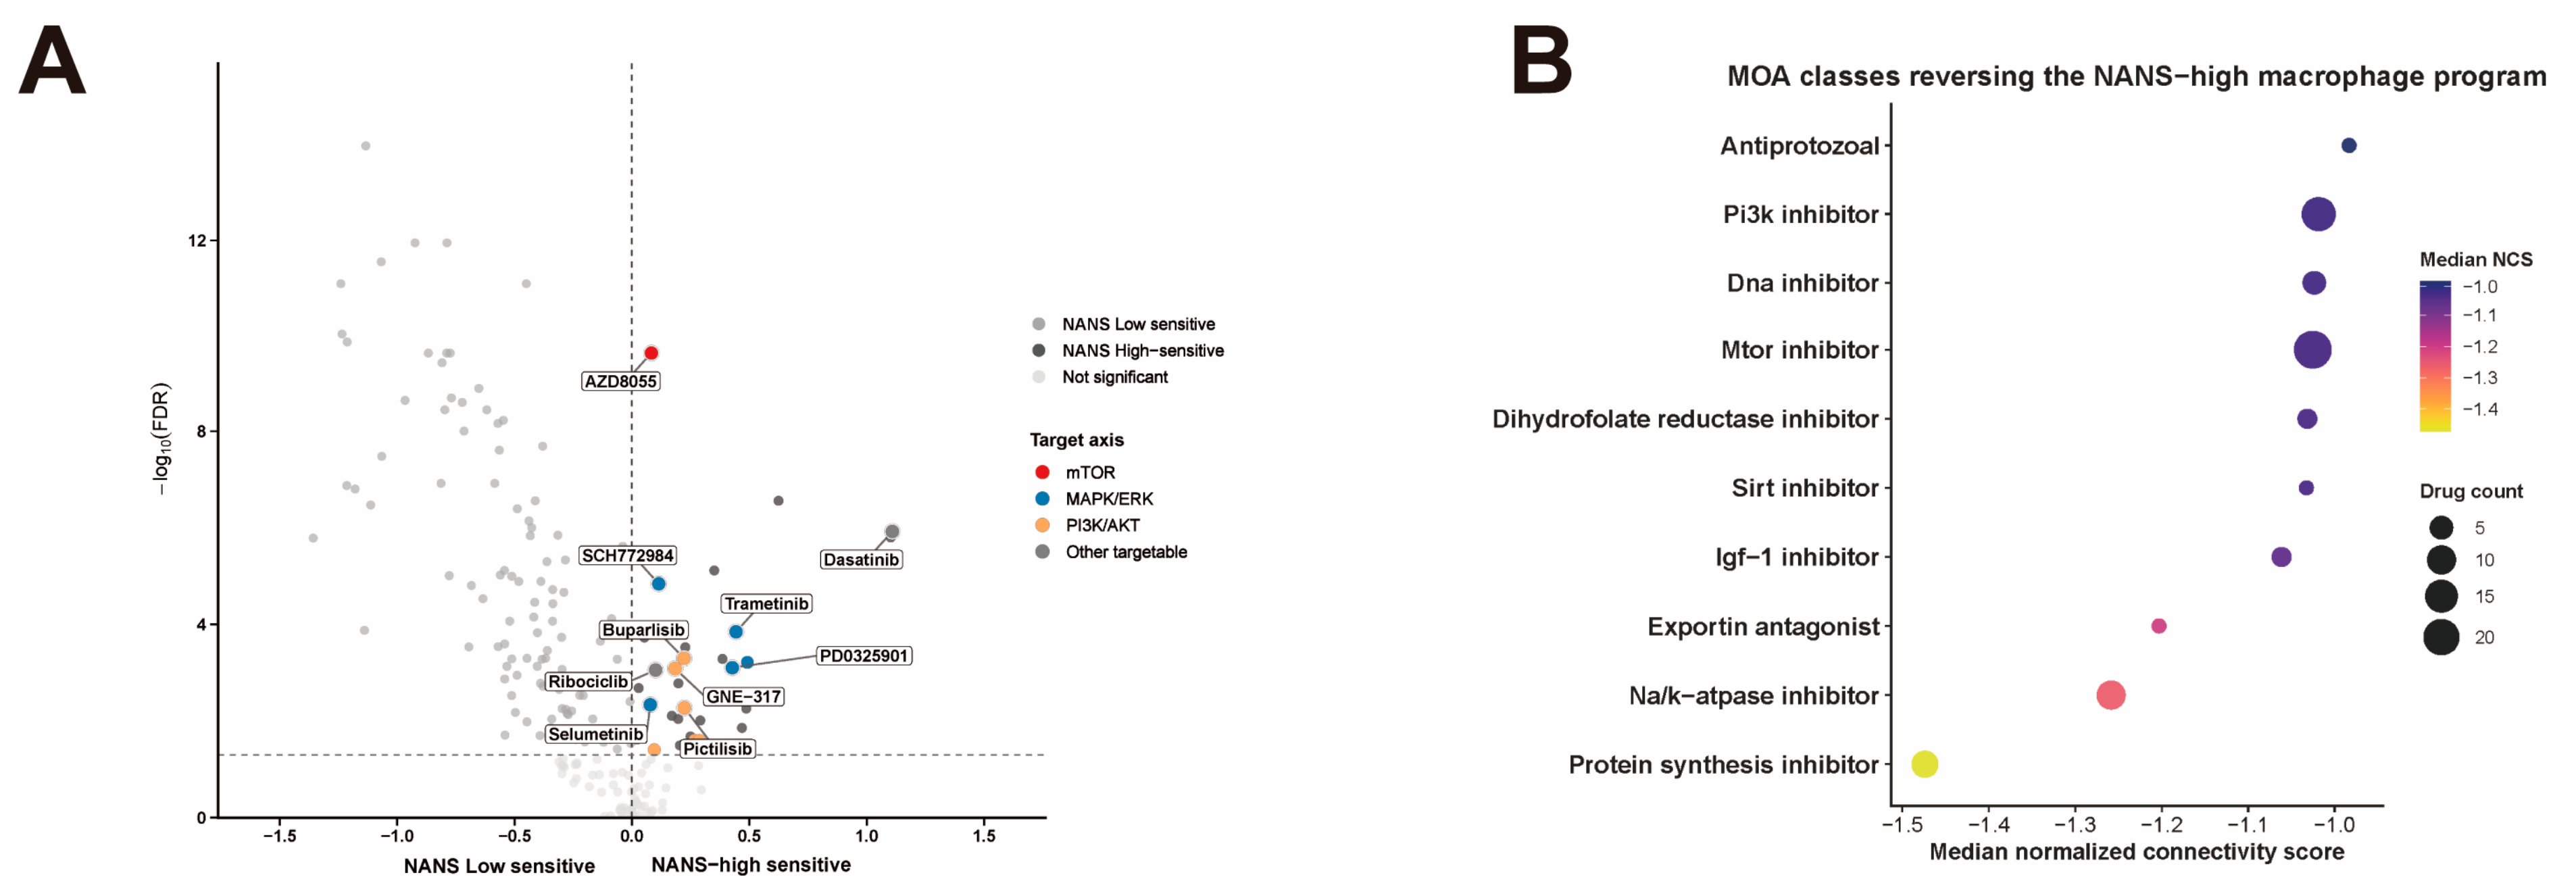
To explore potential therapeutic vulnerabilities associated with the NANS-high BMDM phenotype, drug sensitivity analysis was performed by comparing predicted drug responses between NANS-high and NANS-low groups. Several compounds showed preferential sensitivity in the NANS-high group, including AZD8055, SCH772984, Trametinib, PD0325901, GNE-317, Buparlisib, Pictilisib, Dasatinib, Ribociclib, and Selumetinib (Figure 5A). Connectivity analysis further identified drug mechanism-of-action classes with negative normalized connectivity scores, indicating potential reversal of the NANS-high macrophage program. The most enriched classes included protein synthesis inhibitors, Na+/K+-ATPase inhibitors, exportin antagonists, IGF-1 inhibitors, mTOR inhibitors, PI3K inhibitors, and DNA inhibitors (Figure 5B). These computational findings suggest that the NANS-high BMDM-associated phenotype may be associated with predicted therapeutic vulnerabilities involving mTOR/PI3K signaling, MAPK/ERK signaling, protein synthesis, and cellular stress regulation.
Figure 5.
Drug sensitivity and CMap analysis reveal potential therapeutic vulnerabilities in NANS-high GBM patients. (A) Volcano plot of differential predicted drug sensitivity between NANS-high and NANS-low GBM groups. Selected compounds are labeled and grouped by major target pathways. (B) Mechanism-of-action enrichment analysis of compounds predicted by CMap to reverse the NANS-high macrophage-associated transcriptional program. Negative normalized connectivity scores indicate predicted reversal effects.
2.6. MRI Radiomics Enables Noninvasive Prediction of NANS-High BMDM Status
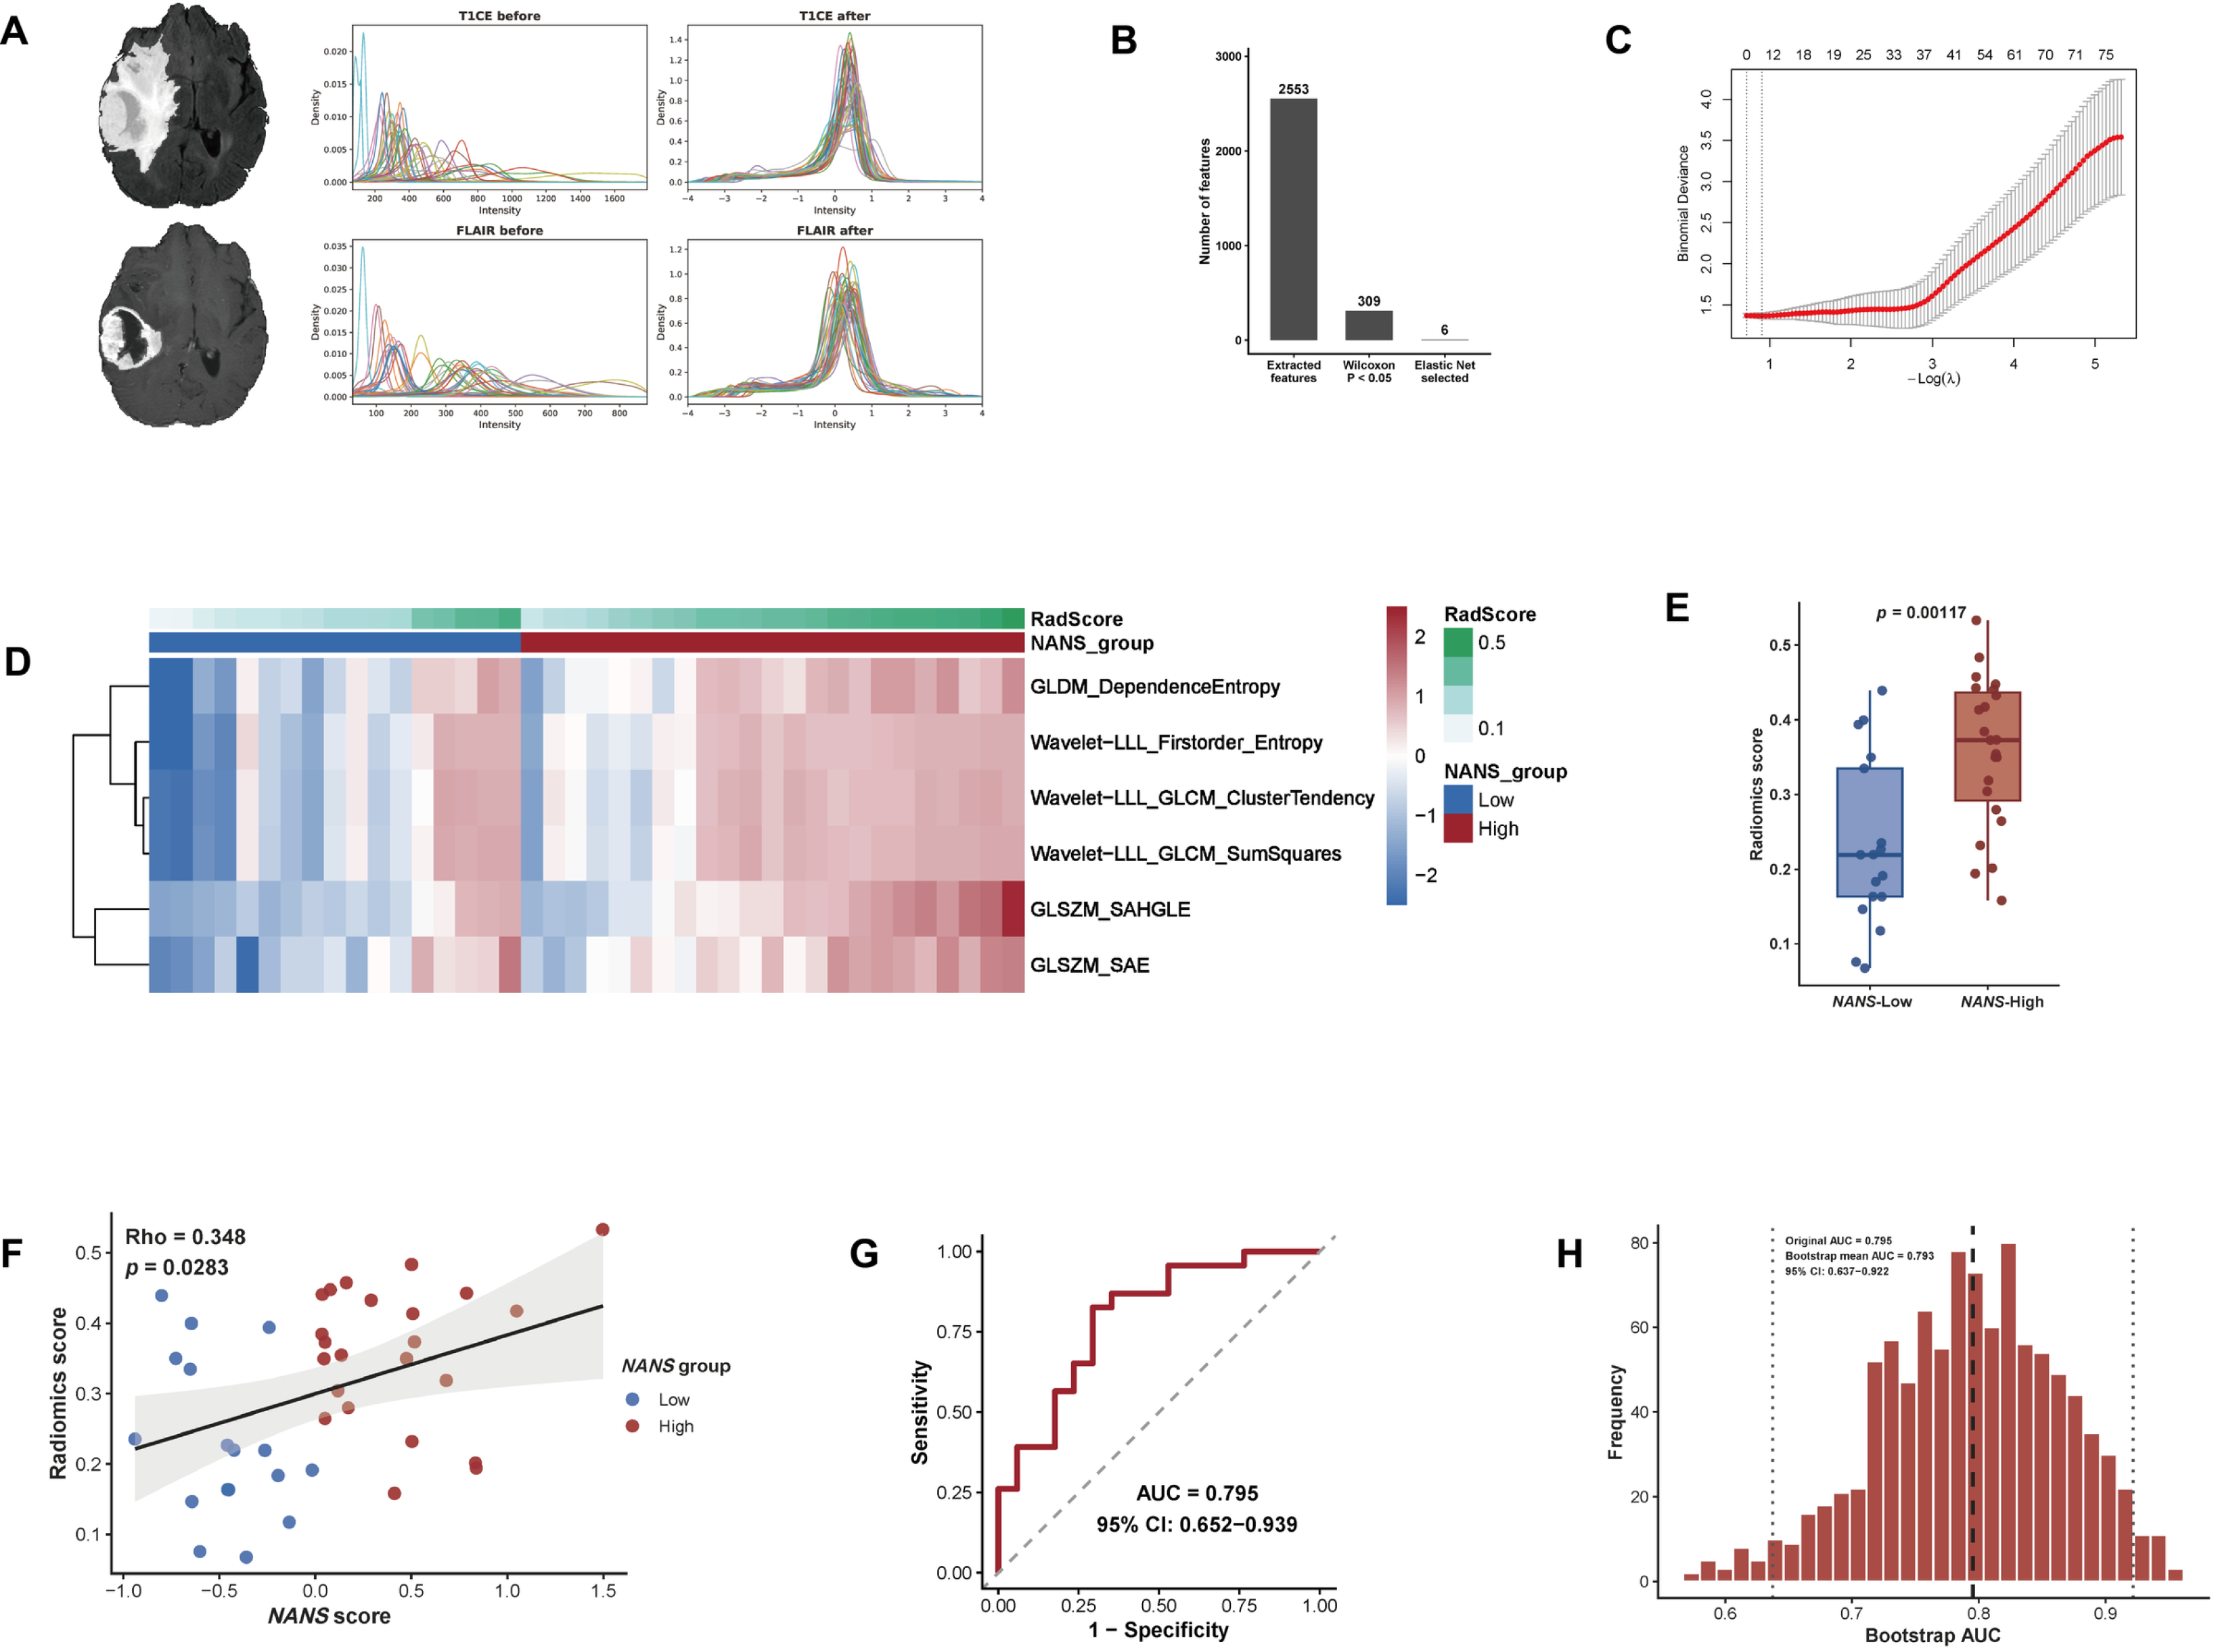
To investigate whether the NANS-high BMDM-associated molecular phenotype could be inferred noninvasively from routine MRI, we performed radiomics analysis using TCIA imaging data from 40 GBM patients with matched transcriptomic-derived NANS-BMDM signature scores. T1 contrast-enhanced (T1CE) and FLAIR images were first subjected to image preprocessing and intensity normalization. The normalized images were then used for radiomics feature extraction and downstream model construction (Figure 6A). A total of 2553 radiomics features were initially extracted from the MRI data. Feature filtering using the Wilcoxon test retained 309 candidate features associated with NANS-high versus NANS-low status. Elastic net modeling further reduced these candidates to six final radiomics features (Figure 6B,C). These selected features included GLDM_DependenceEntropy, Wavelet-LLL_Firstorder_Entropy, Wavelet-LLL_GLCM_ClusterTendency, Wavelet-LLL_GLCM_SumSquares, GLSZM_SAHGLE, and GLSZM_SAE. These features primarily capture image intensity heterogeneity, texture complexity, and gray-level spatial organization, suggesting that the NANS-high phenotype may be associated with increased intratumoral structural heterogeneity on MRI. Heatmap analysis showed that the selected radiomics features were generally elevated in the NANS-high group compared with the NANS-low group and were concordant with increasing RadScore values (Figure 6D). Consistently, the RadScore was significantly higher in NANS-high tumors than in NANS-low tumors (p = 0.00117; Figure 6E). In addition to the binary group comparison, RadScore was positively correlated with the continuous NANS-BMDM signature score across the 40 patients (Spearman rho = 0.348, p = 0.0283; Figure 6F). The radiomics model achieved an area under the receiver operating characteristic curve (AUC) of 0.795 for discriminating NANS-high from NANS-low tumors, with a 95% confidence interval of 0.652–0.939 (Figure 6G). Bootstrap resampling further supported the robustness of model performance, with a bootstrap mean AUC of 0.793 and a 95% confidence interval of 0.637–0.922 (Figure 6H).
Figure 6.
MRI radiomics model predicts NANS-high status in glioblastoma. (A) MRI preprocessing and intensity normalization workflow. (B) Radiomics feature reduction from 2553 initial features to 309 after Wilcoxon filtering and 6 after elastic net selection. (C) Cross-validation curve for elastic net logistic regression and selection of the optimal regularization parameter. (D) Heatmap of the 6 selected radiomics features across NANS-high and NANS-low patients. (E) Comparison of radiomics scores between NANS-high and NANS-low groups. (F) Spearman correlation between radiomics score and NANS score. (G) ROC curve of the radiomics model (AUC = 0.795, 95% CI: 0.652–0.939). (H) Bootstrap validation of model performance (mean AUC = 0.793, 95% CI: 0.637–0.922).
3. Discussion
In this study, we integrated bulk transcriptomic analysis, single-cell RNA sequencing, drug sensitivity prediction, and MRI radiomics to characterize the biological and clinical significance of NANS in GBM. We identified NANS as a prognostically relevant gene preferentially enriched in BMDMs within the GBM microenvironment. Single-cell analysis further showed that NANS-high BMDMs represented a transcriptionally distinct macrophage state characterized by metabolic activation, protein-processing and stress-response programs, intensified communication with malignant tumor states and T-cell subsets, and LGALS9/PLAU-centered signaling. By translating this single-cell-defined state into bulk GBM transcriptomes, we found that the NANS-high BMDM signature was associated with broad immune infiltration and macrophage-related communication programs. The drug prediction and radiomics analyses suggested that this immune state may be linked to therapeutic vulnerabilities and may be inferred noninvasively from routine MRI. Together, these findings suggest NANS-high BMDMs as a macrophage-associated immune state with potential biological, therapeutic, and imaging relevance in GBM.
A central implication of our study is that NANS is not merely a bulk prognostic marker but is preferentially associated with a specific macrophage-lineage compartment in GBM. This distinction is biologically important because tumor-associated macrophages in GBM are not a uniform population; resident microglia and recruited BMDMs differ in ontogeny, transcriptional programs, spatial distribution, and functional contribution to the tumor ecosystem [7,13,14]. Prior single-cell studies have shown that specific myeloid-cell states, rather than total macrophage abundance alone, may carry distinct prognostic and therapeutic implications. In this context, the enrichment of NANS in BMDMs suggests that NANS may mark a recruited macrophage-associated state with potential relevance to the immunosuppressive GBM microenvironment. Therefore, focusing on NANS-high BMDMs allows a more refined interpretation of macrophage heterogeneity and avoids treating the broader TAM compartment as a single biological entity.
The functional profile of NANS-high BMDMs further supports the interpretation that this population represents an activated and stress-adapted macrophage state rather than a passive marker-defined subset. The enrichment of mTORC1 signaling, oxidative phosphorylation, unfolded protein response, glycolysis, hypoxia, and protein secretion suggests increased metabolic and proteostatic demands [15,16]. Such programs may be particularly relevant for macrophages engaged in active communication with tumor and immune compartments, because secretory and remodeling functions require substantial biosynthetic capacity. Therefore, the metabolic and protein-processing features of NANS-high BMDMs provide a plausible transcriptional basis for their enhanced outgoing communication. Functional experiments will be required to determine whether NANS directly regulates these programs.
The communication profile of NANS-high BMDMs further suggests that this macrophage state may occupy an immunoregulatory and remodeling-oriented niche within the GBM microenvironment. The predominance of LGALS9-centered interactions is particularly relevant because the LGALS9–HAVCR2/TIM-3 axis has been implicated in T-cell dysfunction, macrophage polarization, and immune escape in several tumor contexts, including glioma [17,18,19]. Thus, the enrichment of LGALS9-related outgoing signals from NANS-high BMDMs may provide a mechanistic link between this macrophage state and the immunoregulatory phenotype observed in bulk GBM samples. In parallel, PLAU-related signaling may connect NANS-high BMDMs to extracellular matrix remodeling, invasion, angiogenesis, and tumor–stromal interaction, processes that are central to GBM progression [20,21]. The concomitant elevation of LGALS9 and PLAU axis scores in NANS-high bulk tumors therefore suggests that this state is not simply defined by increased macrophage infiltration, but by a coordinated communication program linking immune suppression with microenvironmental remodeling.
This interpretation is important because immune enrichment in GBM does not necessarily indicate productive anti-tumor immunity. Unlike tumors in which high immune infiltration may reflect an active cytotoxic response, GBM immune infiltration is frequently dominated by myeloid cells, MDSCs, regulatory T cells, and other suppressive components [22,23]. Therefore, the positive association between the NANS-high BMDM signature and multiple immune-cell signatures should be interpreted as evidence of an immune-active but potentially suppressive microenvironment. This may also explain why NANS-high features are associated with adverse prognosis: increased immune infiltration may reflect macrophage-driven immune remodeling and tumor-supportive inflammation rather than effective tumor clearance.
The drug sensitivity and CMap analyses provide additional translational hypotheses [24]. Compounds predicted to show preferential sensitivity in the NANS-high group included inhibitors targeting PI3K/mTOR and MAPK/ERK-related pathways, such as Trametinib, Dasatinib, Ribociclib, PD0325901/Mirdametinib, and Selumetinib. CMap analysis further identified mechanism-of-action classes with negative normalized connectivity scores, including protein synthesis inhibitors, Na+/K+-ATPase inhibitors, exportin antagonists, IGF-1 inhibitors, mTOR inhibitors, PI3K inhibitors, and DNA inhibitors. These findings are conceptually consistent with the metabolic, protein-processing, and stress-response programs observed in NANS-high BMDMs. In particular, the convergence of transcriptomic enrichment and drug prediction on mTOR/PI3K-related signaling supports the possibility that this macrophage-associated phenotype is linked to specific metabolic and stress-response dependencies. Beyond direct pathway inhibition, therapeutic reprogramming of tumor-associated macrophages may represent an alternative strategy. Takahashi et al. recently demonstrated that targeting MARCO in combination with anti-CTLA-4 enhanced antitumor efficacy by reprogramming macrophages toward an immune-stimulatory chemokine profile rather than depleting them [25]. These findings raise the possibility that macrophage-directed reprogramming strategies could be combined with PI3K/mTOR- or MAPK/ERK-targeted agents in NANS-high GBM, although this hypothesis requires experimental validation.
The radiomics component extends these molecular findings toward noninvasive patient stratification. Tissue-based transcriptomic profiling remains the standard approach for defining immune states, but it is limited by sampling bias, spatial heterogeneity, and the need for surgical tissue. These limitations are particularly relevant in GBM, where immune and stromal features may vary across enhancing tumor, necrotic regions, peritumoral edema, and invasive margins. MRI radiomics provides an opportunity to quantify macroscopic imaging heterogeneity from routinely acquired clinical scans and may therefore serve as a surrogate for selected molecular and immune phenotypes [11,26]. In our study, the association between RadScore and the NANS-high BMDM signature suggests that MRI texture and entropy-related features may capture imaging manifestations of macrophage-associated immune and stromal remodeling. However, radiomics should not be interpreted as a direct readout of NANS expression or BMDM abundance. Rather, it likely reflects broader tissue-level consequences of this immune state, including enhancement heterogeneity, edema, necrosis, vascular changes, and textural complexity. Therefore, the radiomics model should be viewed as a preliminary imaging biomarker that may support future noninvasive risk stratification after external and prospective validation.
Several limitations should be acknowledged. First, this study was based primarily on public retrospective datasets, including TCGA, CGGA, single-cell reference datasets, and TCIA imaging data. Differences in cohort composition, sequencing platforms, image acquisition protocols, and preprocessing procedures may introduce batch effects and selection bias. Second, although our analyses suggest associations between NANS, macrophage metabolic programs, LGALS9/PLAU-centered communication, and immune infiltration, the present study does not provide direct functional validation. Experimental studies are required to determine whether NANS regulates sialic acid metabolism, macrophage function, LGALS9/PLAU signaling, or T-cell modulation in GBM. Third, drug sensitivity and connectivity analyses were computational predictions and require validation in relevant preclinical systems. Fourth, although Harmony was applied for batch correction, quantitative batch-mixing evaluation was not performed. Following Harmony-based reclustering and manual annotation, 98.78% of cells retained consistent cell-type annotations compared with the original analysis. Given this high agreement, the original cell annotations and derived signatures were retained for downstream analyses, including CellChat and radiomics, without repeating these analyses. This may potentially affect ligand–receptor inference in CellChat and imaging–transcriptomic associations in the radiomics analysis; therefore, these results should be interpreted with caution. Finally, the radiomics analysis was limited by the small sample size (n = 40) relative to the large number of extracted features, resulting in a risk of overfitting. Although elastic net regularization and bootstrap validation were applied, the model should be considered preliminary and exploratory. Independent external validation in larger cohorts is required before clinical application. In addition, tumor volume was not systematically evaluated as a potential correlate of the radiomics score and should be examined in future imaging cohorts.
4. Materials and Methods
4.1. Study Design and Data Sources
Bulk RNA sequencing data and corresponding clinical information were obtained from the TCGA-GBM cohort and two independent CGGA cohorts (CGGA mRNAseq_693 and CGGA mRNAseq_325) [27]. Single-cell RNA sequencing data from newly diagnosed human glioblastoma samples were obtained from the Brain Immune Atlas (https://www.brainimmuneatlas.org/ (accessed on 1 March 2026)) and GBmap atlas (https://www.omicsdi.org/dataset/geo/GSE211376(accessed on 1 March 2026)) [28]. After merging the datasets, batch correction was performed using Harmony, with dataset identity specified as the batch variable. Harmony-corrected embeddings were used for unsupervised clustering and UMAP visualization. Cell types were subsequently manually annotated based on the expression patterns of canonical marker genes. For radiomics analysis, preoperative MRI data were acquired from the TCIA-GBM collection [29]. From 190 patients with available imaging data, 40 patients with matched transcriptomic data and calculable NANS-BMDM signature scores were ultimately included for radiomics model development and validation.
4.2. Prognostic Gene Screening and Survival Analysis
Survival-associated genes were identified independently in TCGA-GBM, CGGA mRNAseq_693, and CGGA mRNAseq_325 cohorts. Genes significantly associated with overall survival in each cohort were retained, and overlapping prognostic genes shared by all three datasets were identified. Among these candidates, NANS was prioritized for further exploratory investigation based on its macrophage-associated expression pattern, its role in sialic acid biosynthesis, and the limited understanding of its biological significance in GBM. The expression difference of NANS between GBM and normal brain tissues was evaluated using GEPIA (http://gepia.cancer-pku.cn/(accessed on 01 March 2026)) [30]. Patients were stratified into high-NANS and low-NANS groups according to the median NANS expression level within each cohort, and overall survival was compared using Kaplan–Meier analysis and the log-rank test.
4.3. Single-Cell RNA-Seq Processing and Cell Annotation
Single-cell RNA-seq data were processed using Seurat [14,31]. After quality control, normalization, highly variable gene selection, scaling, principal component analysis, batch correction, clustering, and UMAP visualization, major cell populations were annotated based on canonical marker genes and UMAP localization. Tumor cells were identified using EGFR, SOX2, NES, BCAN, OLIG2, PDGFRA, CHI3L1, CD44, VIM, MKI67, and TOP2A; macrophage-lineage cells using CD68, CD163, C1QA, C1QB, C1QC, AIF1, TYROBP, LST1, FCER1G, CSF1R, CD14, and FCGR3A; T cells using CD3D, CD3E, TRAC, CD2, CD4, CD8A, CD8B, NKG7, and GZMB; and oligodendrocyte-lineage cells using MBP, MOG, PLP1, MAG, MOBP, CLDN11, CNP, and SOX10. Macrophage-lineage cells were further classified into microglia-like tumor-associated macrophages (MG-TAMs) and bone marrow-derived macrophages (BMDMs) [7]. Unsupervised clustering and UMAP visualization in Figure 1D were performed using Harmony-corrected embedding space. Cell populations were subsequently manually annotated based on the expression patterns of canonical marker genes visualized using FeaturePlot. MG-TAMs were identified using P2RY12, TMEM119, CX3CR1, SALL1, and GPR34, whereas BMDMs were identified using FCN1, S100A8, S100A9, CCR2, and CCL3L3. Malignant tumor cells were annotated into AC-like, OPC-like, MES-like, and NPC-like states using established GBM cellular-state signatures from Neftel et al., including MES1, MES2, AC, OPC, NPC1, NPC2, G1/S, and G2/M programs [3]. Cell-cycle scores were calculated using ‘CellCycleScoring’, and cycling effects were accounted for during malignant-state classification. T cells were further classified into naïve T, CD4+ T, CD8+ T, and proliferating T-cell subsets based on canonical T-cell lineage and functional markers.
4.4. Definition and Characterization of NANS-High BMDMs
BMDMs were extracted for NANS-associated analysis. Cells with normalized NANS expression = 0 were designated as NANS-undetected and were referred to as NANS-low for downstream analyses, whereas cells with normalized NANS expression > 0 were considered NANS-detected. Among NANS-detected BMDMs, cells in the upper quartile of NANS expression were defined as NANS-high BMDMs. Genes upregulated in NANS-high BMDMs were used for functional enrichment analysis. Gene Ontology enrichment analysis was performed using clusterProfiler, and Hallmark gene set enrichment analysis was conducted using MSigDB Hallmark gene sets [32,33].
4.5. Cell–Cell Communication Analysis
Cell–cell communication analysis was performed using CellChat to compare outgoing signaling programs between NANS-high and NANS-low BMDMs [34]. CellChat analysis was performed using the original single-cell expression data and corresponding cell-type annotations established before Harmony-based reclustering. NANS-high and NANS-low BMDMs were analyzed together with annotated malignant tumor states and T-cell subsets. Communication probabilities, pathway-level information flow, and ligand–receptor interactions were inferred using the human CellChat database. Differential communication patterns were compared between NANS-high and NANS-low BMDMs, with a focus on BMDM-derived signaling toward malignant tumor states and T-cell subsets.
4.6. Construction and Validation of the NANS-High BMDM Signature
A NANS-high BMDM signature was generated from genes enriched in NANS-high BMDMs and applied to TCGA-GBM bulk RNA-seq data. For each TCGA-GBM patient, a NANS-BMDM signature score was calculated based on the expression of signature genes. Patients were classified into high-score and low-score groups according to the signature score. Signature gene expression patterns were visualized by heatmap analysis. Immune infiltration scores were estimated using single-sample gene set enrichment analysis (ssGSEA) based on predefined immune cell gene signatures [35]. Spearman correlation analysis was performed to evaluate the association between the NANS-BMDM signature score and ssGSEA-derived immune cell scores. Selected CellChat-derived ligand–receptor axes, including LGALS9, PLAU, CCL, and GAS6 signaling axes, were further evaluated in TCGA-GBM bulk transcriptomic data.
4.7. Drug Sensitivity and Connectivity Map Analysis
To explore potential therapeutic vulnerabilities associated with the NANS-high BMDM phenotype, two drug-related analyses were performed. First, drug response prediction was conducted using the R package ‘oncoPredict’ (version 1.2) to identify compounds with differential predicted sensitivity between NANS-high and NANS-low tumors [36]. Predicted drug response values were compared between groups using the Wilcoxon rank-sum test, with false discovery rate correction for multiple comparisons, and candidate compounds were visualized using volcano plots according to effect direction and statistical significance. Second, connectivity map analysis was performed using CLUE/CMap normalized connectivity scores to identify compounds and mechanism-of-action classes that may reverse the NANS-high macrophage-associated transcriptional program [24]. Negative normalized connectivity scores were interpreted as suggestive of potential transcriptional reversal activity.
4.8. MRI Preprocessing and Radiomics Analysis
TCIA MRI data from 40 GBM patients were included for radiomics analysis [37]. IDH mutation status was reviewed for all included patients, among whom 37 were IDH-wildtype and 3 were IDH-mutant. Pre-operative T1 contrast-enhanced and FLAIR images were used for radiomics analysis. All MRI scans were reviewed by three experienced specialists to confirm the tumor regions. Tumor regions of interest were manually delineated using 3D Slicer. T1 contrast-enhanced and FLAIR images were preprocessed and intensity-normalized before radiomics feature extraction and downstream model construction. Image preprocessing included N4 bias field correction, resampling to isotropic 1.0 × 1.0 × 1.0 mm spacing, mask alignment, and per-sequence Z-score intensity normalization [38,39]. Radiomics features were extracted from the delineated tumor regions of interest using PyRadiomics based on the preprocessed MRI images and corresponding tumor masks [40]. Radiomics analysis was performed using TCIA MRI data and matched bulk transcriptomic-derived NANS-high BMDM signature scores, with the signature originally established from the single-cell analysis before Harmony-based reclustering. A total of 2553 radiomics features were initially extracted. Features associated with NANS-high versus NANS-low status were first screened using the Wilcoxon rank-sum test, retaining 309 candidate features. Elastic net logistic regression was then used for feature selection and model construction [41]. Six final radiomics features were selected, and a radiomics score was calculated for each patient. The radiomics score was compared between NANS-high and NANS-low groups using the Wilcoxon rank-sum test. Spearman correlation analysis was used to evaluate the association between radiomics score and continuous NANS-BMDM signature score. Receiver operating characteristic curve analysis was performed to evaluate model performance, and bootstrap validation was used to assess model stability.
4.9. Statistical Analysis
Statistical analyses were performed using R (version 4.5.0) and Python (version 2025.2). Group comparisons were conducted using the Wilcoxon rank-sum test. Correlations were assessed using Spearman correlation analysis. Survival differences were evaluated using Kaplan–Meier analysis and the log-rank test. Multiple-testing correction was performed using the Benjamini–Hochberg method. A two-sided p value < 0.05 or adjusted p value < 0.05 was considered statistically significant.
5. Conclusions
In conclusion, this study identifies NANS-high BMDMs as a prognostically adverse macrophage-associated state in GBM. This state is characterized by metabolic activation, stress-response and protein-processing programs, intensified communication with tumor and T-cell populations, and LGALS9/PLAU-centered signaling. By linking this macrophage state to bulk immune signatures, predicted therapeutic vulnerabilities, and MRI radiomics, our findings provide a framework for integrating single-cell immunobiology with clinically accessible imaging biomarkers. Future experimental and prospective validation will be essential to determine whether the NANS-high BMDM phenotype can guide macrophage-directed or immunometabolic therapeutic strategies in GBM.
Supplementary Materials
The following supporting information can be downloaded at: https://www.mdpi.com/article/10.3390/ijms27219635/s1.
Author Contributions
Conceptualization, J.C., Q.W., H.M.C., K.N.B., A.E.B., Y.S., R.J.M., J.J.M. and A.B.E.; methodology, H.M.C., K.N.B., A.E.B., Y.S., J.C., R.J.M., J.J.M., Q.W. and A.B.E.; formal analysis, J.C. and A.E.B.; validation, A.E.B. and R.J.M.; writing—original draft, J.C.; writing—review and editing, J.C., Q.W., H.M.C., K.N.B., A.E.B., Y.S., R.J.M., J.J.M. and A.B.E.; supervision, A.B.E. and J.J.M. All authors have read and agreed to the published version of the manuscript, and agree to be accountable for all aspects of the work.
Funding
The study was supported by National Institute of Neurological Disorders and Stroke Support Grant 1R01NS135220.
Institutional Review Board Statement
Ethical review and approval were waived for this study due to the exclusive use of publicly available datasets, which have obtained all necessary ethical approvals and informed consent from participants. No new human or animal data were collected or analyzed in this study.
Informed Consent Statement
Not applicable.
Data Availability Statement
The data supporting the findings of this study are available upon reasonable request from the corresponding author.
Conflicts of Interest
The authors declare no competing interests or other relationships that could influence the results presented in this study.
References
- Stupp, R.; Mason, W.P.; van den Bent, M.J.; Weller, M.; Fisher, B.; Taphoorn, M.J.; Belanger, K.; Brandes, A.A.; Marosi, C.; Bogdahn, U.; et al. Radiotherapy plus concomitant and adjuvant temozolomide for glioblastoma. N. Engl. J. Med. 2005, 352, 987–996. [Google Scholar] [CrossRef] [Scilit] [PubMed]
- Perry, J.R.; Laperriere, N.; O’Callaghan, C.J.; Brandes, A.A.; Menten, J.; Phillips, C.; Fay, M.; Nishikawa, R.; Cairncross, J.G.; Roa, W.; et al. Short-Course Radiation plus Temozolomide in Elderly Patients with Glioblastoma. N. Engl. J. Med. 2017, 376, 1027–1037. [Google Scholar] [CrossRef] [Scilit]
- Neftel, C.; Laffy, J.; Filbin, M.G.; Hara, T.; Shore, M.E.; Rahme, G.J.; Richman, A.R.; Silverbush, D.; Shaw, M.L.; Hebert, C.M.; et al. An Integrative Model of Cellular States, Plasticity, and Genetics for Glioblastoma. Cell 2019, 178, 835–849.e821. [Google Scholar] [CrossRef] [Scilit] [PubMed]
- Wang, L.; Jung, J.; Babikir, H.; Shamardani, K.; Jain, S.; Feng, X.; Gupta, N.; Rosi, S.; Chang, S.; Raleigh, D.; et al. A single-cell atlas of glioblastoma evolution under therapy reveals cell-intrinsic and cell-extrinsic therapeutic targets. Nat. Cancer 2022, 3, 1534–1552. [Google Scholar] [CrossRef] [Scilit] [PubMed]
- Yeo, A.T.; Rawal, S.; Delcuze, B.; Christofides, A.; Atayde, A.; Strauss, L.; Balaj, L.; Rogers, V.A.; Uhlmann, E.J.; Varma, H.; et al. Single-cell RNA sequencing reveals evolution of immune landscape during glioblastoma progression. Nat. Immunol. 2022, 23, 971–984. [Google Scholar] [CrossRef] [Scilit] [PubMed]
- Chen, J.; Wu, Q.; Berglund, A.E.; Macaulay, R.J.; Mule, J.J.; Etame, A.B. Tumor-Associated Macrophages in Glioblastoma: Mechanisms of Tumor Progression and Therapeutic Strategies. Cells 2025, 14, 1458. [Google Scholar] [CrossRef] [Scilit] [PubMed]
- Chen, Z.; Feng, X.; Herting, C.J.; Garcia, V.A.; Nie, K.; Pong, W.W.; Rasmussen, R.; Dwivedi, B.; Seby, S.; Wolf, S.A.; et al. Cellular and Molecular Identity of Tumor-Associated Macrophages in Glioblastoma. Cancer Res. 2017, 77, 2266–2278. [Google Scholar] [CrossRef] [Scilit] [PubMed]
- Omuro, A. Immune-checkpoint inhibitors for glioblastoma: What have we learned? Arq. Neuropsiquiatr. 2022, 80, 266–269. [Google Scholar] [CrossRef] [Scilit] [PubMed]
- Mantuano, N.R.; Laubli, H. Sialic acid and Siglec receptors in tumor immunity and immunotherapy. Semin. Immunol. 2024, 74–75, 101893. [Google Scholar] [CrossRef] [Scilit] [PubMed]
- Wang, S.; Han, P.; Mi, P.; Wang, C.; Lu, M.; Li, X.; Xu, B.; Wang, H.; Gao, Y.; Hou, Y.; et al. The Role of the Hexosamine-Sialic Acid Metabolic Pathway Mediated by GFPT1/NANS in c-Myc-Driven Hepatocellular Carcinoma. Cell Mol. Gastroenterol. Hepatol. 2025, 19, 101523. [Google Scholar] [CrossRef] [Scilit] [PubMed]
- Khalili, N.; Kazerooni, A.F.; Familiar, A.; Haldar, D.; Kraya, A.; Foster, J.; Koptyra, M.; Storm, P.B.; Resnick, A.C.; Nabavizadeh, A. Radiomics for characterization of the glioma immune microenvironment. npj Precis. Oncol. 2023, 7, 59. [Google Scholar] [CrossRef] [Scilit] [PubMed]
- Fan, H.; Luo, Y.; Gu, F.; Tian, B.; Xiong, Y.; Wu, G.; Nie, X.; Yu, J.; Tong, J.; Liao, X. Artificial intelligence-based MRI radiomics and radiogenomics in glioma. Cancer Imaging 2024, 24, 36. [Google Scholar] [CrossRef] [Scilit] [PubMed]
- Solomou, G.; Young, A.M.H.; Bulstrode, H. Microglia and macrophages in glioblastoma: Landscapes and treatment directions. Mol. Oncol. 2024, 18, 2906–2926. [Google Scholar] [CrossRef] [Scilit] [PubMed]
- Hao, Y.; Stuart, T.; Kowalski, M.H.; Choudhary, S.; Hoffman, P.; Hartman, A.; Srivastava, A.; Molla, G.; Madad, S.; Fernandez-Granda, C.; et al. Dictionary learning for integrative, multimodal and scalable single-cell analysis. Nat. Biotechnol. 2024, 42, 293–304. [Google Scholar] [CrossRef] [Scilit] [PubMed]
- Covarrubias, A.J.; Aksoylar, H.I.; Horng, T. Control of macrophage metabolism and activation by mTOR and Akt signaling. Semin. Immunol. 2015, 27, 286–296. [Google Scholar] [CrossRef] [Scilit] [PubMed]
- Byles, V.; Covarrubias, A.J.; Ben-Sahra, I.; Lamming, D.W.; Sabatini, D.M.; Manning, B.D.; Horng, T. The TSC-mTOR pathway regulates macrophage polarization. Nat. Commun. 2013, 4, 2834. [Google Scholar] [CrossRef] [Scilit] [PubMed]
- Ahmady, F.; Sharma, A.; Achuthan, A.A.; Kannourakis, G.; Luwor, R.B. The Role of TIM-3 in Glioblastoma Progression. Cells 2025, 14, 346. [Google Scholar] [CrossRef] [Scilit] [PubMed]
- Ni, X.; Wu, W.; Sun, X.; Ma, J.; Yu, Z.; He, X.; Cheng, J.; Xu, P.; Liu, H.; Shang, T.; et al. Interrogating glioma-M2 macrophage interactions identifies Gal-9/Tim-3 as a viable target against PTEN-null glioblastoma. Sci. Adv. 2022, 8, eabl5165. [Google Scholar] [CrossRef] [Scilit] [PubMed]
- Yang, R.; Sun, L.; Li, C.F.; Wang, Y.H.; Yao, J.; Li, H.; Yan, M.; Chang, W.C.; Hsu, J.M.; Cha, J.H.; et al. Galectin-9 interacts with PD-1 and TIM-3 to regulate T cell death and is a target for cancer immunotherapy. Nat. Commun. 2021, 12, 832. [Google Scholar] [CrossRef] [Scilit] [PubMed]
- Fu, Z.; Chen, Z.; Ye, J.; Ji, J.; Ni, W.; Lin, W.; Lin, H.; Lu, L.; Zhu, G.; Xie, Q.; et al. Identifying PLAUR as a Pivotal Gene of Tumor Microenvironment and Regulating Mesenchymal Phenotype of Glioblastoma. Cancers 2024, 16, 840. [Google Scholar] [CrossRef] [Scilit] [PubMed]
- Winkler, J.; Abisoye-Ogunniyan, A.; Metcalf, K.J.; Werb, Z. Concepts of extracellular matrix remodelling in tumour progression and metastasis. Nat. Commun. 2020, 11, 5120. [Google Scholar] [CrossRef] [Scilit] [PubMed]
- Zhang, X.; Zhao, L.; Zhang, H.; Zhang, Y.; Ju, H.; Wang, X.; Ren, H.; Zhu, X.; Dong, Y. The immunosuppressive microenvironment and immunotherapy in human glioblastoma. Front. Immunol. 2022, 13, 1003651. [Google Scholar] [CrossRef] [Scilit] [PubMed]
- Coniglio, S.J. Macrophages in the Glioblastoma Tumor Microenvironment. Int. J. Mol. Sci. 2023, 24, 8978. [Google Scholar] [CrossRef] [Scilit] [PubMed]
- Subramanian, A.; Narayan, R.; Corsello, S.M.; Peck, D.D.; Natoli, T.E.; Lu, X.; Gould, J.; Davis, J.F.; Tubelli, A.A.; Asiedu, J.K.; et al. A Next Generation Connectivity Map: L1000 Platform and the First 1,000,000 Profiles. Cell 2017, 171, 1437–1452.e1417. [Google Scholar] [CrossRef] [Scilit] [PubMed]
- Takahashi, H.; Perez-Villarroel, P.; Falahat, R.; Mulé, J.J. Targeting MARCO in combination with anti-CTLA-4 leads to enhanced melanoma regression and immune cell infiltration via macrophage reprogramming. J. Immunother. Cancer 2025, 13, e011030. [Google Scholar] [CrossRef] [Scilit] [PubMed]
- Li, G.; Li, L.; Li, Y.; Qian, Z.; Wu, F.; He, Y.; Jiang, H.; Li, R.; Wang, D.; Zhai, Y.; et al. An MRI radiomics approach to predict survival and tumour-infiltrating macrophages in gliomas. Brain 2022, 145, 1151–1161. [Google Scholar] [CrossRef] [Scilit] [PubMed]
- Zhao, Z.; Zhang, K.N.; Wang, Q.; Li, G.; Zeng, F.; Zhang, Y.; Wu, F.; Chai, R.; Wang, Z.; Zhang, C.; et al. Chinese Glioma Genome Atlas (CGGA): A Comprehensive Resource with Functional Genomic Data from Chinese Glioma Patients. Genom. Proteom. Bioinform. 2021, 19, 1–12. [Google Scholar] [CrossRef] [Scilit] [PubMed]
- Ruiz-Moreno, C.; Salas, S.M.; Samuelsson, E.; Minaeva, M.; Ibarra, I.; Grillo, M.; Brandner, S.; Roy, A.; Forsberg-Nilsson, K.; Kranendonk, M.E.G.; et al. Charting the single-cell and spatial landscape of IDH-wild-type glioblastoma with GBmap. Neuro Oncol. 2025, 27, 2281–2295. [Google Scholar] [CrossRef] [Scilit] [PubMed]
- Clark, K.; Vendt, B.; Smith, K.; Freymann, J.; Kirby, J.; Koppel, P.; Moore, S.; Phillips, S.; Maffitt, D.; Pringle, M.; et al. The Cancer Imaging Archive (TCIA): Maintaining and operating a public information repository. J. Digit. Imaging 2013, 26, 1045–1057. [Google Scholar] [CrossRef] [Scilit] [PubMed]
- Tang, Z.; Li, C.; Kang, B.; Gao, G.; Li, C.; Zhang, Z. GEPIA: A web server for cancer and normal gene expression profiling and interactive analyses. Nucleic Acids Res. 2017, 45, W98–W102. [Google Scholar] [CrossRef] [Scilit] [PubMed]
- Stuart, T.; Butler, A.; Hoffman, P.; Hafemeister, C.; Papalexi, E.; Mauck, W.M., 3rd; Hao, Y.; Stoeckius, M.; Smibert, P.; Satija, R. Comprehensive Integration of Single-Cell Data. Cell 2019, 177, 1888–1902 e1821. [Google Scholar] [CrossRef] [Scilit] [PubMed]
- Yu, G.; Wang, L.G.; Han, Y.; He, Q.Y. clusterProfiler: An R package for comparing biological themes among gene clusters. OMICS 2012, 16, 284–287. [Google Scholar] [CrossRef] [Scilit] [PubMed]
- Liberzon, A.; Subramanian, A.; Pinchback, R.; Thorvaldsdottir, H.; Tamayo, P.; Mesirov, J.P. Molecular signatures database (MSigDB) 3.0. Bioinformatics 2011, 27, 1739–1740. [Google Scholar] [CrossRef] [Scilit] [PubMed]
- Jin, S.; Guerrero-Juarez, C.F.; Zhang, L.; Chang, I.; Ramos, R.; Kuan, C.H.; Myung, P.; Plikus, M.V.; Nie, Q. Inference and analysis of cell-cell communication using CellChat. Nat. Commun. 2021, 12, 1088. [Google Scholar] [CrossRef] [Scilit]
- Hanzelmann, S.; Castelo, R.; Guinney, J. GSVA: Gene set variation analysis for microarray and RNA-seq data. BMC Bioinform. 2013, 14, 7. [Google Scholar] [CrossRef] [Scilit] [PubMed]
- Maeser, D.; Gruener, R.F.; Huang, R.S. oncoPredict: An R package for predicting in vivo or cancer patient drug response and biomarkers from cell line screening data. Brief. Bioinform. 2021, 22, bbab260. [Google Scholar] [CrossRef] [Scilit] [PubMed]
- Bakas, S.; Akbari, H.; Sotiras, A.; Bilello, M.; Rozycki, M.; Kirby, J.S.; Freymann, J.B.; Farahani, K.; Davatzikos, C. Advancing The Cancer Genome Atlas glioma MRI collections with expert segmentation labels and radiomic features. Sci. Data 2017, 4, 170117. [Google Scholar] [CrossRef] [Scilit] [PubMed]
- Tustison, N.J.; Avants, B.B.; Cook, P.A.; Zheng, Y.; Egan, A.; Yushkevich, P.A.; Gee, J.C. N4ITK: Improved N3 bias correction. IEEE Trans. Med. Imaging 2010, 29, 1310–1320. [Google Scholar] [CrossRef] [Scilit] [PubMed]
- Zwanenburg, A.; Vallieres, M.; Abdalah, M.A.; Aerts, H.; Andrearczyk, V.; Apte, A.; Ashrafinia, S.; Bakas, S.; Beukinga, R.J.; Boellaard, R.; et al. The Image Biomarker Standardization Initiative: Standardized Quantitative Radiomics for High-Throughput Image-based Phenotyping. Radiology 2020, 295, 328–338. [Google Scholar] [CrossRef] [Scilit] [PubMed]
- van Griethuysen, J.J.M.; Fedorov, A.; Parmar, C.; Hosny, A.; Aucoin, N.; Narayan, V.; Beets-Tan, R.G.H.; Fillion-Robin, J.C.; Pieper, S.; Aerts, H. Computational Radiomics System to Decode the Radiographic Phenotype. Cancer Res. 2017, 77, e104–e107. [Google Scholar] [CrossRef] [Scilit] [PubMed]
- Friedman, J.; Hastie, T.; Tibshirani, R. Regularization Paths for Generalized Linear Models via Coordinate Descent. J. Stat. Softw. 2010, 33, 1–22. [Google Scholar] [CrossRef] [Scilit]
Disclaimer/Publisher’s Note: The statements, opinions and data contained in all publications are solely those of the individual author(s) and contributor(s) and not of MDPI and/or the editor(s). MDPI and/or the editor(s) disclaim responsibility for any injury to people or property resulting from any ideas, methods, instructions or products referred to in the content. |
© 2026 by the authors. Licensee MDPI, Basel, Switzerland. This article is an open access article distributed under the terms and conditions of the Creative Commons Attribution (CC BY) license.