


Abstract
M2-like macrophages contribute to the establishment of immunosuppressive microenvironments through coordinated activation of inflammatory and metabolic programs. Cyclooxygenase-2 (COX2) catalyzes prostaglandin E2 (PGE2) production, whereas arginase-1 (ARG1) hydrolyzes L-arginine (ARG) to ornithine (ORN) and urea. However, the ion channel-dependent mechanisms governing these immunometabolic pathways remain poorly defined. Here, we examined the role of the Ca2+-activated K+ channel KCa3.1 in regulating COX2 and ARG1 in THP-1-derived M2-like macrophages. COX2 and ARG1 were markedly upregulated during M2-like differentiation, whereas pharmacological activation of KCa3.1 with SKA-121 significantly reduced their mRNA and protein expression. KCa3.1 activation also decreased PGE2 production, increased extracellular ARG, and reduced ORN accumulation. Exposure to elevated extracellular K+ concentration ([K+]e) further enhanced COX2 and ARG1 expression, increased PGE2 production, and shifted ARG metabolism toward ORN formation; each of these responses was attenuated by KCa3.1 activation. Pharmacological inhibition of ERK or CREB signaling suppressed both COX2 and ARG1 expression, whereas inhibition of JNK, AP-1, NOX2, or NRF2 had limited effects. CREB2 knockdown similarly reduced COX2 and ARG1 under both basal and elevated [K+]e conditions. These findings demonstrate that KCa3.1 activation negatively regulates COX2- and ARG1-associated immunometabolic programs in THP-1-derived M2-like macrophages and suggest a potential role for KCa3.1 in modulating macrophage-associated inflammatory and metabolic responses.
1. Introduction
The tumor microenvironment (TME) is a heterogeneous milieu composed of malignant, stromal, and infiltrating immune cells that engage in complex reciprocal interactions [1]. Tumor-associated macrophages (TAMs), many of which exhibit M2-like features, are among the most abundant immune populations in solid tumors. Their accumulation is frequently associated with poor clinical outcomes, and they promote tumor progression through immune suppression, angiogenesis, tissue remodeling, and support of cancer cell survival [2,3]. These protumorigenic activities are mediated not only by cytokines and chemokines but also by lipid mediators and amino acid-metabolic pathways [3,4]. The TME is additionally characterized by metabolic stressors, including lactate accumulation, extracellular acidosis, hypoxia, and nutrient deprivation, which collectively promote tumor growth, immune evasion, and therapeutic resistance [5,6]. Elevated extracellular K+ concentration ([K+]e) has more recently emerged as another important feature of the TME [7]. Necrotic and dying tumor cells release intracellular K+ into the extracellular space, thereby perturbing ionic homeostasis and altering antitumor immune cell function.
The intermediate-conductance Ca2+-activated K+ channel KCa3.1, encoded by KCNN4, is an important regulator of immune cell activation, cytokine/chemokine production, and cellular metabolism [8,9]. We previously demonstrated that pharmacological activation of KCa3.1 downregulated interleukin-8 (IL-8), IL-10, and C-C motif chemokine ligand 2 (CCL2) in THP-1-derived M2-like macrophages (M2-MACs) [10,11]. These mediators contribute to the recruitment and functional regulation of immunosuppressive cell populations in pathological tissues [12,13], supporting a broader role for KCa3.1 in controlling macrophage-derived inflammatory and immunoregulatory signals. In those studies, elevated [K+]e significantly increased IL-8, IL-10, and CCL2 expression and production in M2-MACs, whereas KCa3.1 activation attenuated their induction [10,11]. These observations suggest that KCa3.1 counteracts elevated [K+]e-induced inflammatory responses. Whether KCa3.1 also regulates immunometabolic enzymes in M2-MACs, however, remains unknown. This question is important because M2-MACs contribute to immune suppression through metabolic mediators as well as cytokines and chemokines [3,4]. Cyclooxygenase-2 (COX2), also known as prostaglandin-endoperoxide synthase 2 (PTGS2), catalyzes the rate-limiting step in prostaglandin biosynthesis and promotes the production of prostaglandin E2 (PGE2), a lipid mediator with potent immunoregulatory and tumor-promoting activities [14]. In parallel, arginase-1 (ARG1) hydrolyzes L-arginine (ARG) to ornithine (ORN) and urea [15]. ARG1-dependent depletion of ARG impairs T cell proliferation and effector functions, whereas ORN provides a precursor for polyamine and proline biosynthesis, thereby supporting tissue remodeling and tumor progression [14,15]. Thus, the COX2–PGE2 and ARG1–ARG/ORN pathways represent complementary immunometabolic programs through which M2-MACs may shape pathological microenvironments.
In the present study, we investigated whether KCa3.1 activation regulates COX2 and ARG1 expression in M2-MACs and whether such regulation is accompanied by changes in PGE2 production and ARG metabolism. We further examined the effects of elevated [K+]e and explored the signaling pathways responsible for COX2 and ARG1 induction. Our results show that KCa3.1 activation with SKA-121 suppresses both basal and elevated [K+]e-induced COX2 and ARG1 expression and attenuates the associated changes in PGE2, ARG, and ORN. These findings extend the known role of KCa3.1 from cytokine and chemokine regulation to the control of macrophage immunometabolism.
2. Results
2.1. KCa3.1 Activation Suppresses COX2 Expression and PGE2 Production in M2-MACs
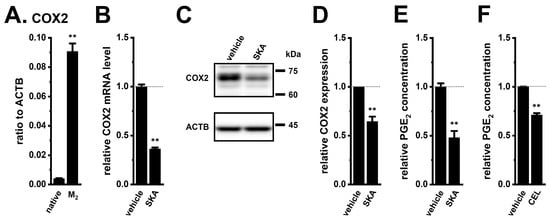
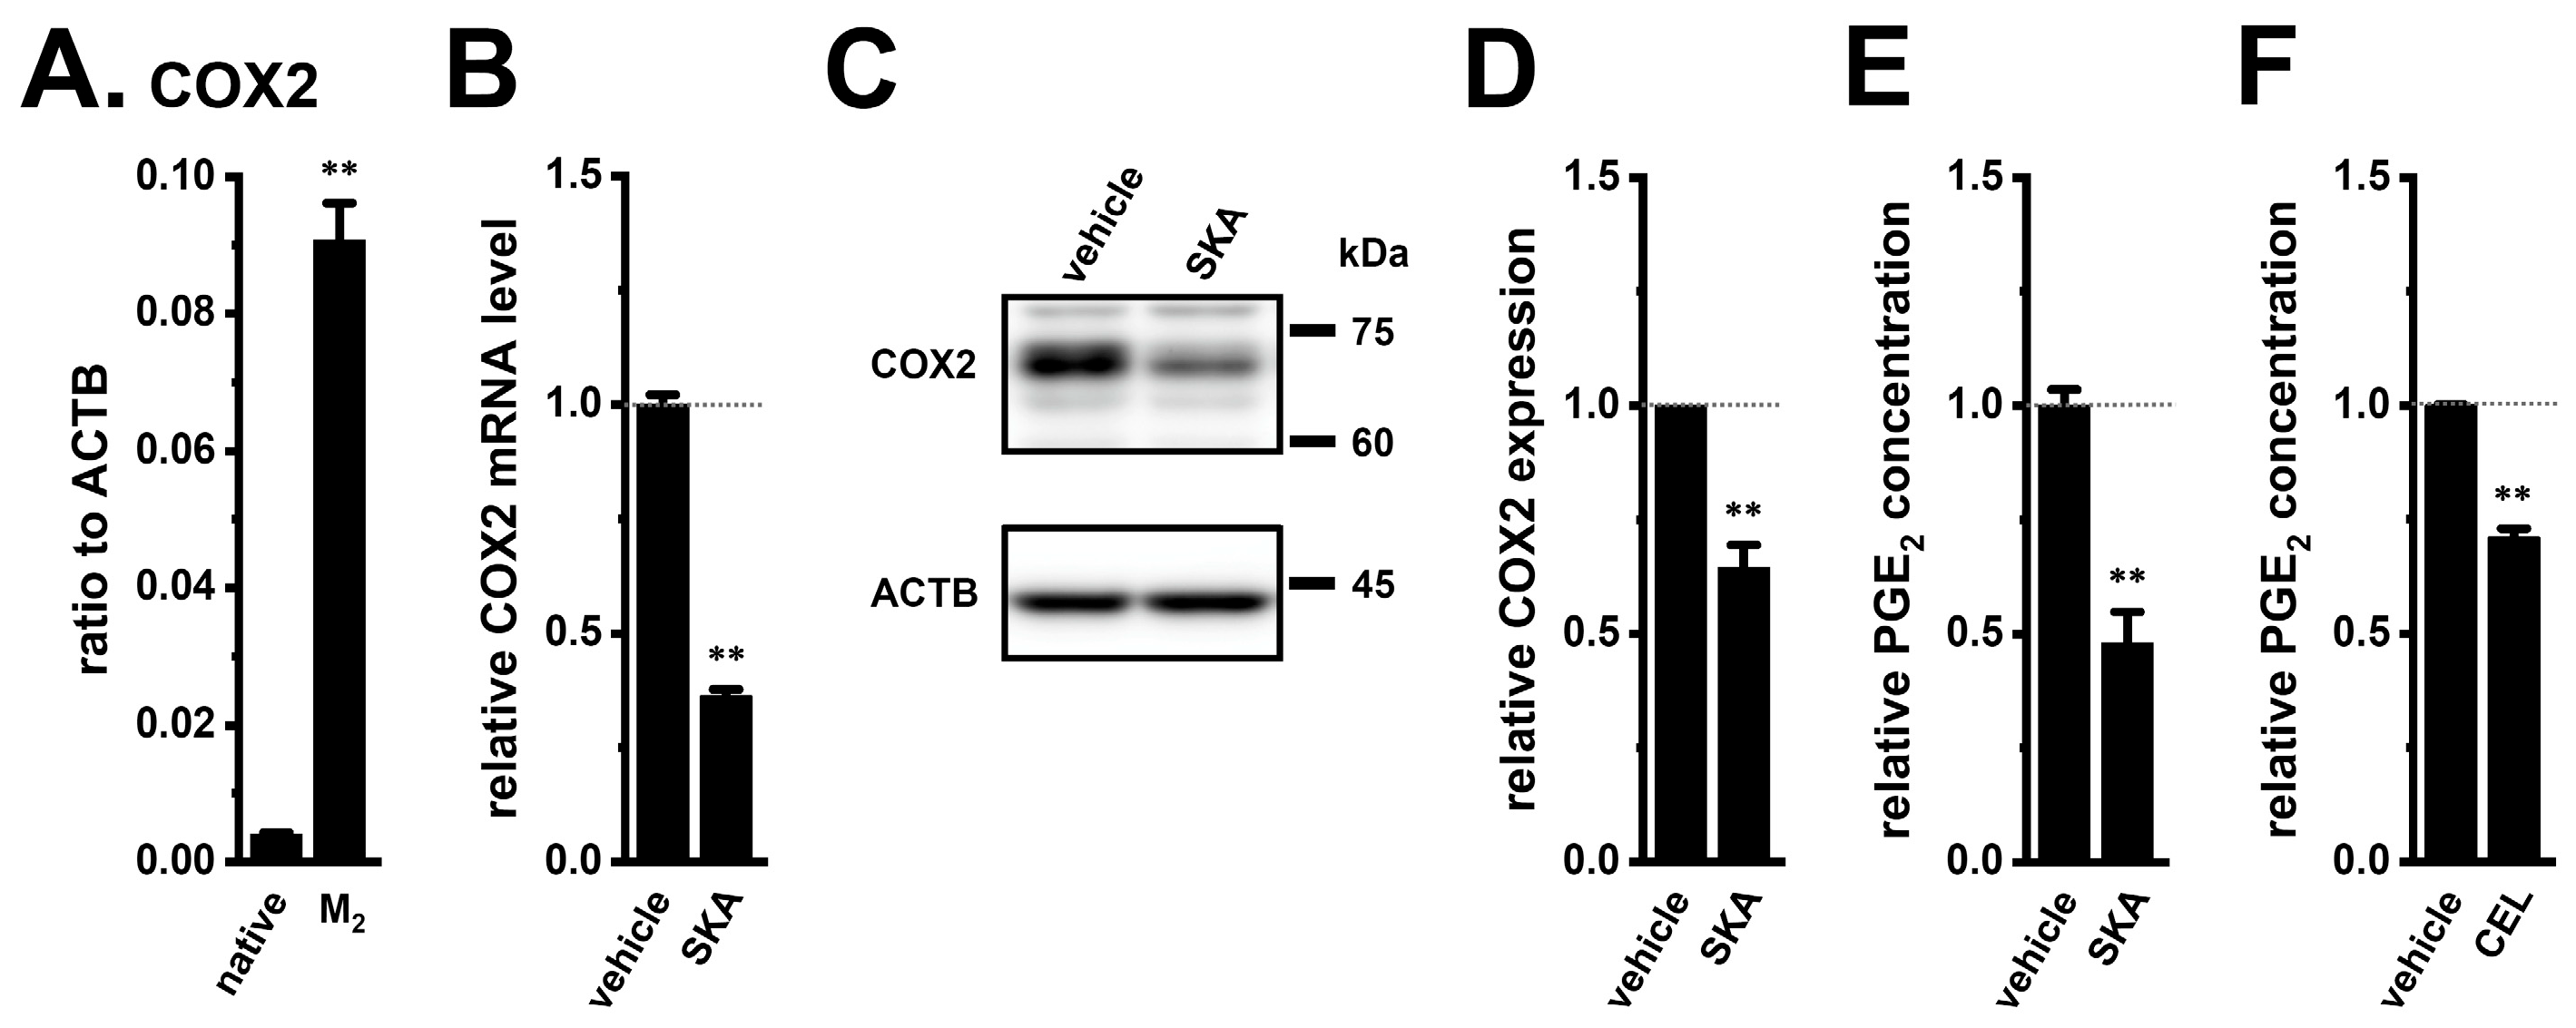
We previously reported that CD163 and ARG1, commonly used markers of human M2-MACs, were upregulated in THP-1-differentiated M2-MACs and that KCa3.1 activation elicited membrane hyperpolarization in these cells [10]. In the present study, quantitative real-time PCR and western blotting showed that COX2 expression was markedly higher in M2-MACs than in undifferentiated THP-1 cells (n = 4 for each, p < 0.01) (Figure 1A, Supplementary Figure S1A,B), indicating robust induction of COX2 during M2-like differentiation. Treatment with the KCa3.1 activator SKA-121 (10 μM) for 24 h significantly reduced COX2 mRNA expression (n = 4, p < 0.01) (Figure 1B). Consistent with this finding, SKA-121 treatment for 48 h decreased COX2 protein abundance (n = 4, p < 0.01) (Figure 1C,D) and reduced the PGE2 concentration in the culture medium (n = 4, p < 0.01) (Figure 1E). A comparable reduction in PGE2 was observed with the selective COX2 inhibitor celecoxib (1 μM) (Figure 1F). Together, these results indicate that KCa3.1 activation suppresses the COX2–PGE2 axis in M2-MACs.
Figure 1.
KCa3.1 activation suppresses COX2 expression and PGE2 production in M2-MACs. (A) Real-time PCR examination of the COX2 mRNA expression in undifferentiated THP-1 cells (native) and M2-MACs (M2). Expression was normalized to ACTB (n = 4). (B) Real-time PCR examination of the COX2 mRNA expression in M2-MACs treated with vehicle (0.1% DMSO) or SKA-121 (SKA; 10 μM) for 24 h. Values were normalized to ACTB and expressed relative to the vehicle control (set to 1.0; n = 4). (C,D) Representative immunoblots and densitometric analysis of COX2 protein in M2-MACs treated with vehicle or SKA for 48 h. COX2 signals were normalized to ACTB and expressed relative to the vehicle control (set to 1.0; n = 4). The positions of molecular weight markers (kDa) are indicated on the right of each blot (C). (E,F) PGE2 concentrations in the culture supernatants from M2-MACs treated with vehicle, SKA (E), or celecoxib (CEL; 1 μM) (F) for 48 h. Values were expressed relative to the vehicle control (set to 1.0; n = 4); the absolute concentration in the vehicle control was approximately 250 pg/mL. Data are presented as the mean ± SEM. **: p < 0.01 vs. ‘native’ and vehicle control.
To determine whether the suppressive effects of SKA-121 on COX2 expression were mediated through KCa3.1, siRNA-mediated inhibition of KCa3.1 was performed in M2-MACs. Transfection with KCa3.1-specific siRNA (siKCa3.1) significantly reduced KCa3.1 mRNA expression compared with control siRNA (siCont) (Supplementary Figure S2A). In cells transfected with control siRNA, SKA-121 significantly decreased COX2 expression (Supplementary Figure S2B). In contrast, following KCa3.1 knockdown, SKA-121 failed to reduce it (Supplementary Figure S2D). These results indicate that the inhibitory effects of SKA-121 on COX2 expression support a KCa3.1-mediated mechanism of action.
2.2. KCa3.1 Activation Attenuates Elevated Extracellular K+ ([K+]e)-Induced COX2 Expression in M2-MACs
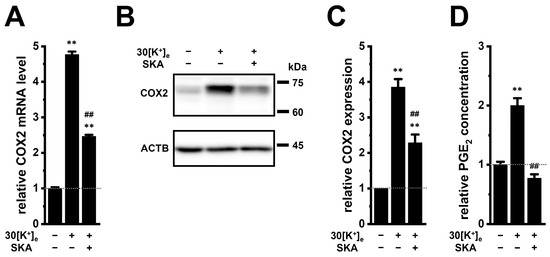
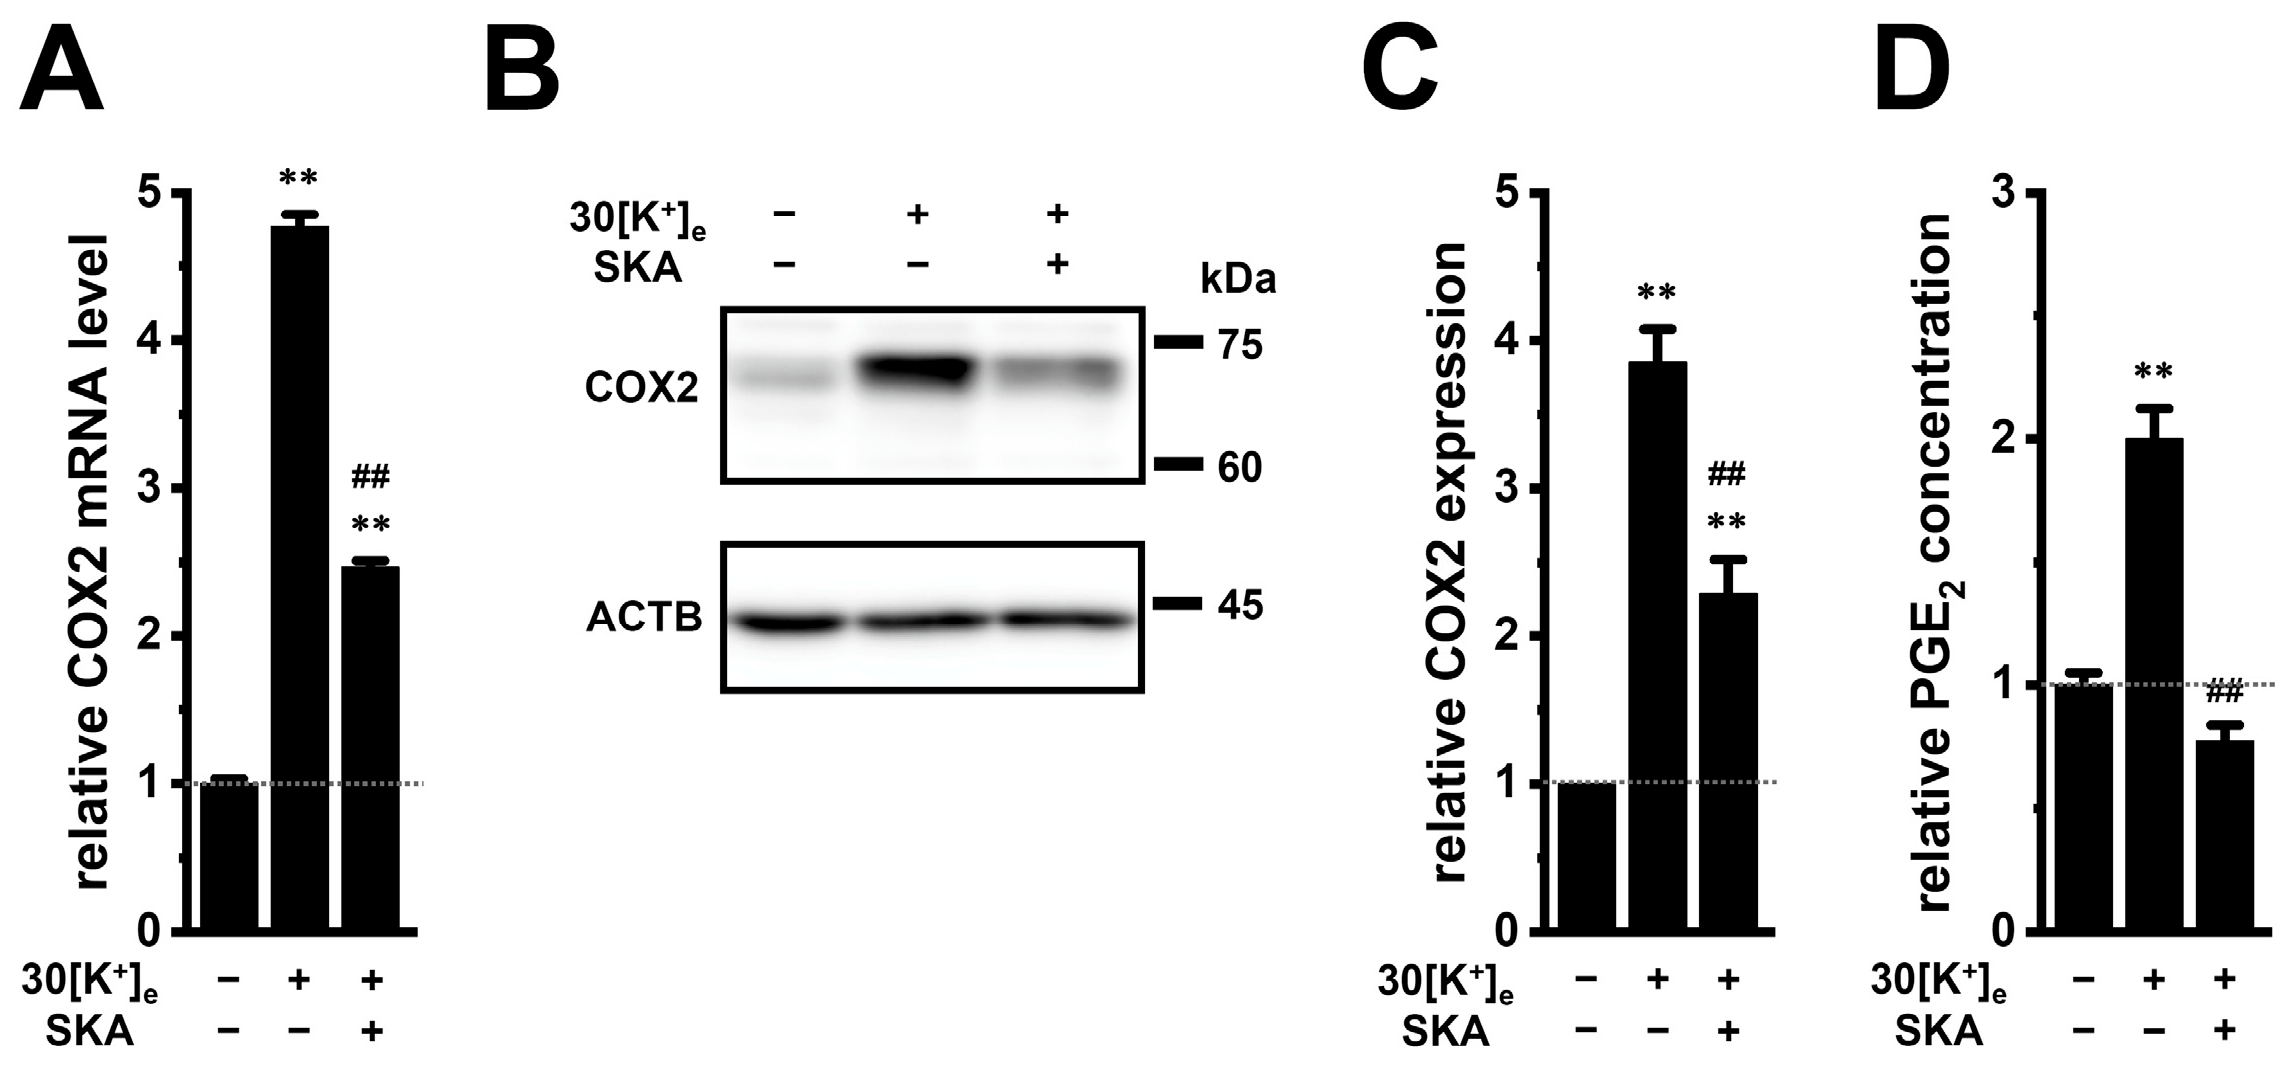
Elevated [K+]e is increasingly recognized as an ionic feature of the TME [7]. In vivo K+ imaging has shown that [K+]e can reach an average concentration of approximately 30 mM within tumors [16]. We previously found that exposure of M2-MACs to 35 mM [K+]e increased intracellular K+ by approximately 1.3-fold [11]. We therefore examined the effect of elevated [K+]e on COX2 expression. Addition of 30 mM KCl, which increased the final [K+]e to approximately 35 mM, increased COX2 mRNA expression by approximately five-fold after 24 h (n = 4, p < 0.01) (Figure 2A). No significant changes in COX2 mRNA expression were found by addition of 10 and 20 mM KCl after 24 h (n = 4, p > 0.05) (Supplementary Figure S1E). Co-treatment with SKA-121 (10 μM) significantly attenuated this increase (n = 4, p < 0.01). Similarly, elevated [K+]e increased COX2 protein abundance and PGE2 production after 48 h, and both responses were suppressed by SKA-121 (Figure 2B–D). These findings indicate that elevated [K+]e activates the COX2–PGE2 pathway in M2-MACs and that KCa3.1 activation counteracts this response.
Figure 2.
KCa3.1 activation attenuates elevated [K+]e-induced COX2 expression and PGE2 production. COX2 mRNA expression (A), representative immunoblots and densitometric analysis of COX2 protein (B,C), and PGE2 production (D) in M2-MACs cultured under basal [K+]e with vehicle (−/−), elevated [K+]e induced by addition of 30 mM KCl (+/−; final [K+]e, approximately 35 mM), or elevated [K+]e plus SKA-121 (SKA; 10 μM) (+/+) (n = 4). Values were normalized to ACTB and expressed relative to −/− (set to 1.0). The positions of molecular weight markers (kDa) are indicated on the right of each blot (B). PGE2 concentration was similarly expressed relative to −/−. Data are presented as the mean ± SEM. **: p < 0.01 vs. −/−; ##: p < 0.01 vs. +/−.
2.3. KCa3.1 Activation Suppresses ARG1 Expression and Alters ARG Metabolism in M2-MACs
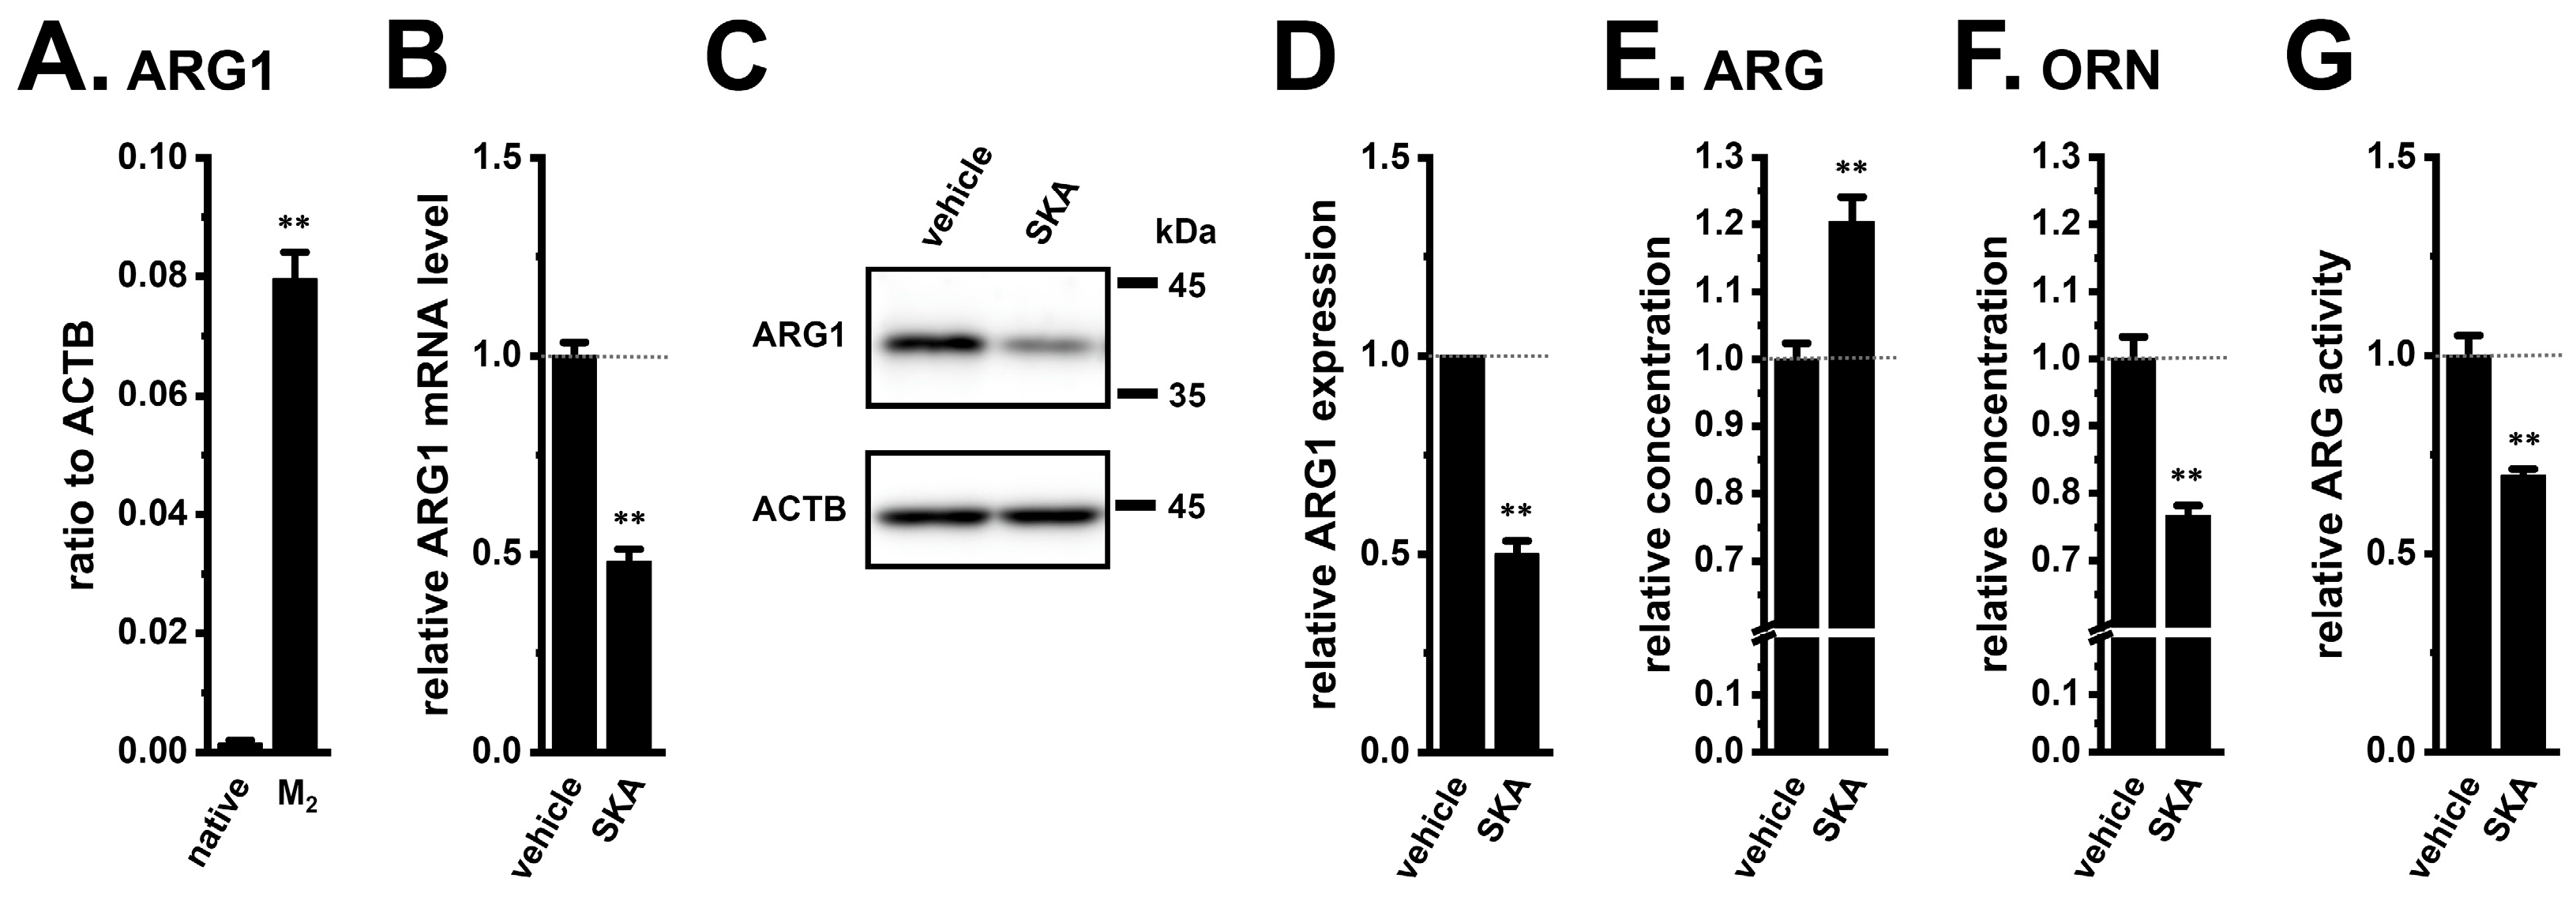
ARG1 expression was also markedly higher in M2-MACs than in undifferentiated THP-1 cells (n = 4, p < 0.01) (Figure 3A, Supplementary Figure S1C,D), confirming induction of ARG1 during M2-like differentiation. Treatment with SKA-121 (10 μM) for 24 h significantly reduced ARG1 mRNA expression (n = 4, p < 0.01) (Figure 3B), and treatment for 48 h decreased ARG1 protein abundance (n = 4, p < 0.01) (Figure 3C,D). In cells transfected with control siRNA, SKA-121 significantly decreased ARG1 mRNA expression (Supplementary Figure S2C). In contrast, following KCa3.1 knockdown, SKA-121 failed to reduce ARG1 expression (Supplementary Figure S2E). These results indicate that the inhibitory effects of SKA-121 on ARG1 expression support a KCa3.1-mediated mechanism of action.
Figure 3.
KCa3.1 activation suppresses ARG1 expression and modulates ARG metabolism in M2-MACs. (A) ARG1 mRNA expression in undifferentiated THP-1 cells (native) and M2-MACs (M2), measured by real-time PCR and normalized to ACTB (n = 4). (B) ARG1 mRNA expression in M2-MACs treated with vehicle or SKA-121 (SKA; 10 μM) for 24 h. Values were normalized to ACTB and expressed relative to the vehicle control (set to 1.0; n = 4). (C,D) Representative immunoblots and densitometric analysis of ARG1 protein in M2-MACs treated with vehicle or SKA for 48 h. The positions of molecular weight markers (kDa) are indicated on the right of each blot (C). (E,F) Relative ARG (E) and ORN (F) concentrations in the culture supernatants after vehicle or SKA treatment for 48 h. ARG and ORN concentrations were approximately 1200 and 200 μM, respectively. (G) Relative arginase activities after vehicle or SKA treatment for 48 h. Relative arginase activities were expressed relative to the vehicle control (set to 1.0; n = 4). Data are presented as the mean ± SEM. **: p < 0.01 vs. ‘native’ and vehicle control.
These changes were accompanied by an increase in extracellular ARG and a decrease in extracellular ORN (n = 4, p < 0.01) (Figure 3E,F). The ARG1 inhibitor numidargistat (10 μM) produced similar metabolic changes (Supplementary Figure S3A,B), supporting the interpretation that SKA-121 reduces ARG1-dependent ARG catabolism. Because ARG is also a substrate for nitric oxide synthases (NOSs), which convert ARG to L-citrulline (CIT) [17], we measured CIT in the culture medium. SKA-121 did not significantly alter CIT concentrations (n = 4, p > 0.05) (Supplementary Figure S3C). Consistent with this result, NOS2 mRNA expression was very low (less than 0.01 relative to ACTB). We further examined whether the reduction in ARG1 expression induced by SKA-121 was accompanied by a functional decrease in arginase enzymatic activity. Arginase activity was measured in cell lysates from M2-MACs using a colorimetric assay based on urea production from L-arginine. Treatment with SKA-121 significantly reduced arginase activity (n = 4, p < 0.01) (Figure 3G). Thus, under the present experimental conditions, KCa3.1 activation selectively altered the ARG1-associated branch of ARG metabolism without measurably affecting the NOS-associated branch.
2.4. KCa3.1 Activation Attenuates Elevated [K+]e-Induced ARG1 Expression in M2-MACs
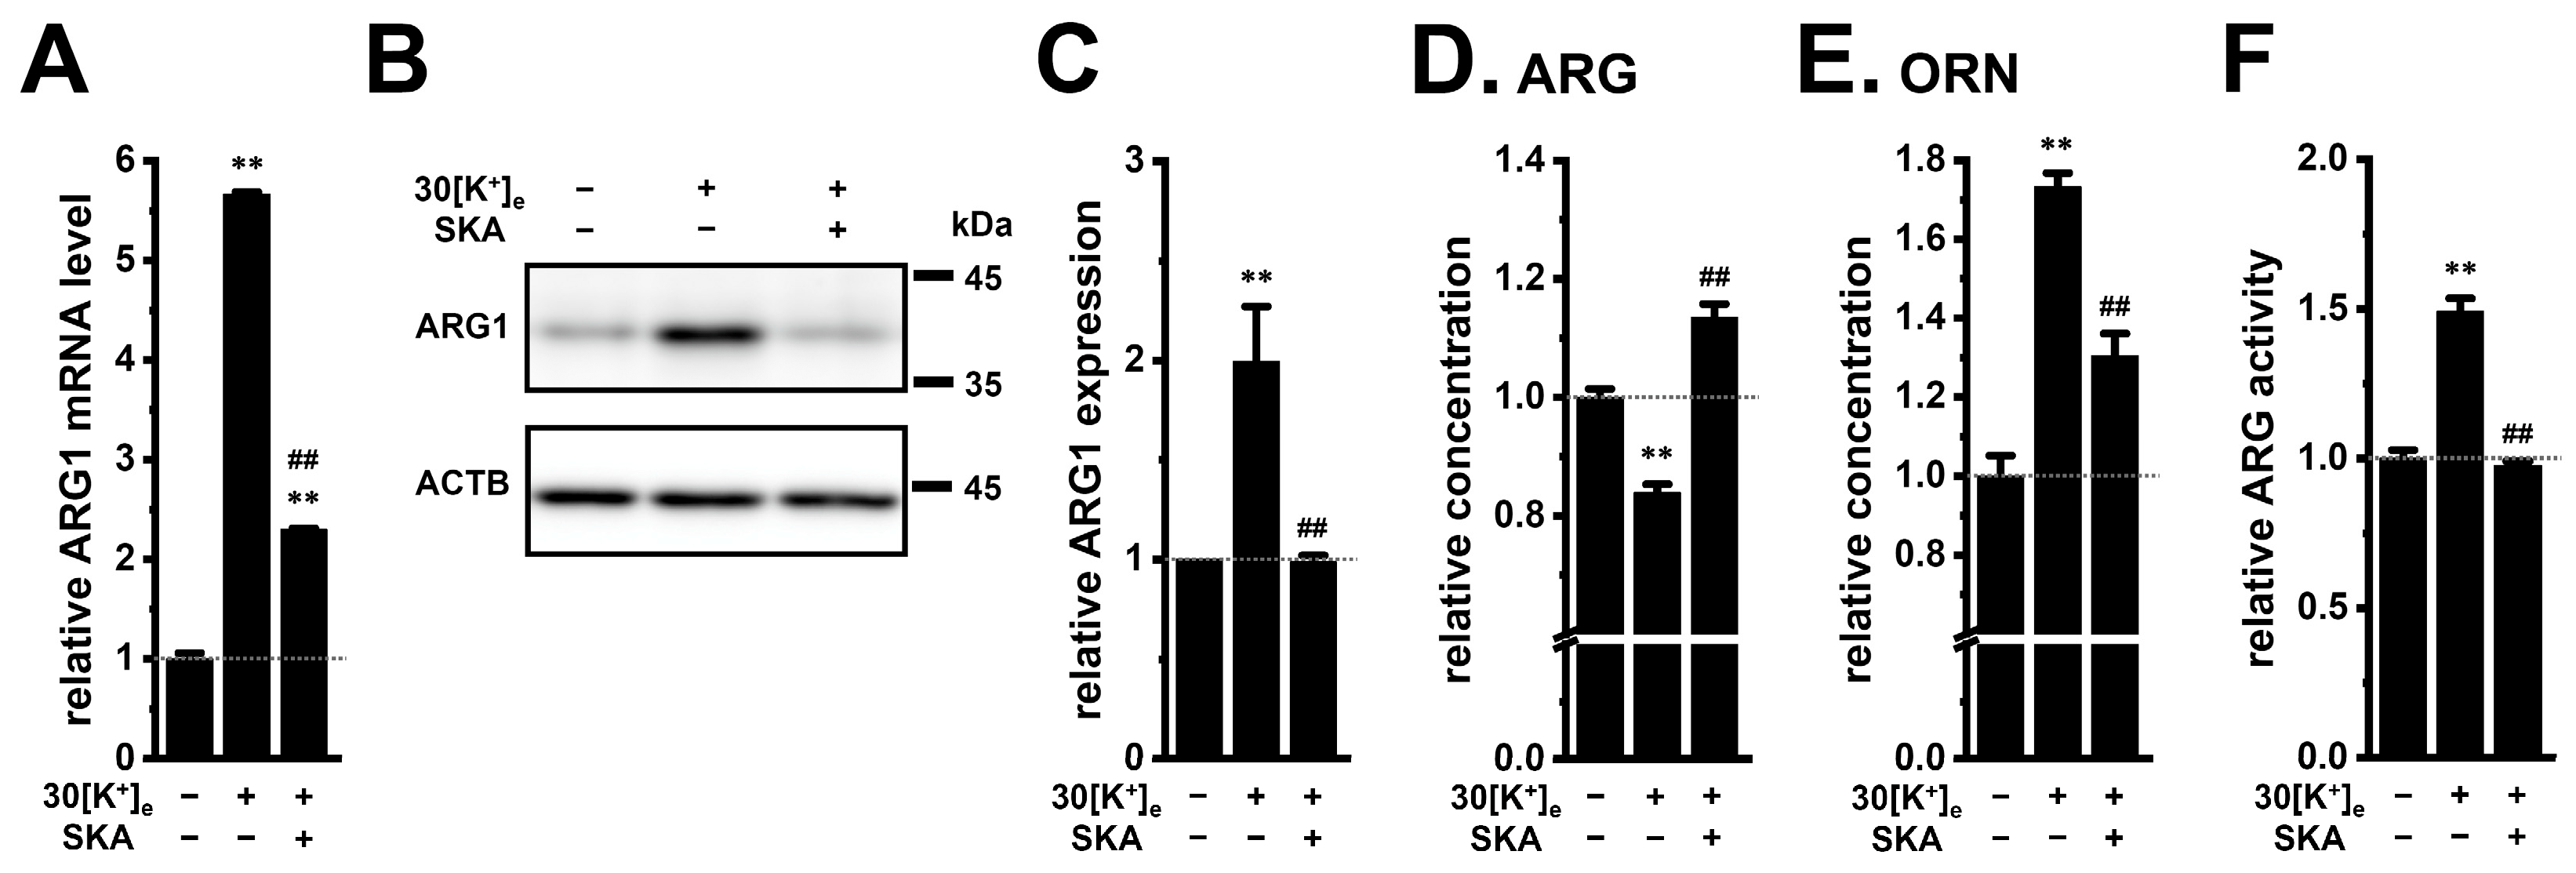
Exposure to elevated [K+]e for 24 h increased ARG1 mRNA expression by more than five-fold, and this induction was significantly attenuated by SKA-121 treatment (10 μM; n = 4, p < 0.01) (Figure 4A). No significant changes in ARG1 mRNA expression were found by addition of 10 and 20 mM KCl (n = 4, p > 0.05) (Supplementary Figure S1F). Elevated [K+]e also increased ARG1 protein abundance after 48 h, whereas co-treatment with SKA-121 suppressed this response (n = 4, p < 0.01) (Figure 4B,C). Consistent with reduced ARG1 activity, SKA-121 restored ARG concentrations and decreased ORN accumulation under elevated [K+]e conditions (n = 4, p < 0.01) (Figure 4D,E). Neither elevated [K+]e alone nor co-treatment with SKA-121 significantly altered CIT concentrations (n = 4, p > 0.05) (Supplementary Figure S3D). To determine whether the upregulation of ARG1 under elevated [K+]e conditions was associated with increased enzymatic activity, arginase activity was measured in M2-MACs. Exposure to elevated [K+]e significantly increased arginase activity compared with control conditions (n = 4, p < 0.01) (Figure 4F). In contrast, treatment with SKA-121 significantly attenuated the elevated [K+]e-induced increase in arginase activity (n = 4, p < 0.01) (Figure 4F). These results indicate that elevated [K+]e enhances ARG1-associated ARG catabolism in M2-MACs and that KCa3.1 activation counteracts this metabolic response.
Figure 4.
KCa3.1 activation suppresses elevated [K+]e-induced ARG1 expression and restores ARG/ORN balance. (A–E) ARG1 mRNA expression (A), representative immunoblots and densitometric analysis of ARG1 protein (B,C), and relative ARG and ORN concentrations (D,E) in M2-MACs cultured under basal [K+]e with vehicle (−/−), elevated [K+]e (+/−), or elevated [K+]e plus SKA-121 (SKA; 10 μM) (+/+) (n = 4). The positions of molecular weight markers (kDa) are indicated on the right of each blot (B). (F) Relative arginase activities after vehicle or SKA treatment for 48 h. Values were normalized to ACTB and expressed relative to vehicle control (set to 1.0). Data are presented as the mean ± SEM. **: p < 0.01 vs. −/−; ##: p < 0.01 vs. +/−.
2.5. ERK and CREB Signaling Are Involved in COX2–PGE2 Axis Regulation Under Basal and Elevated [K+]e Conditions
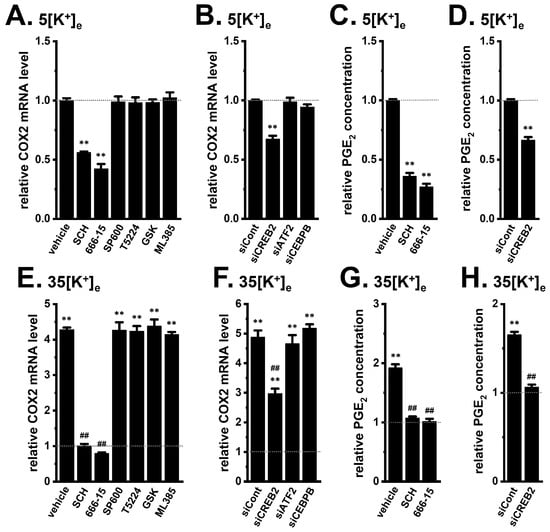
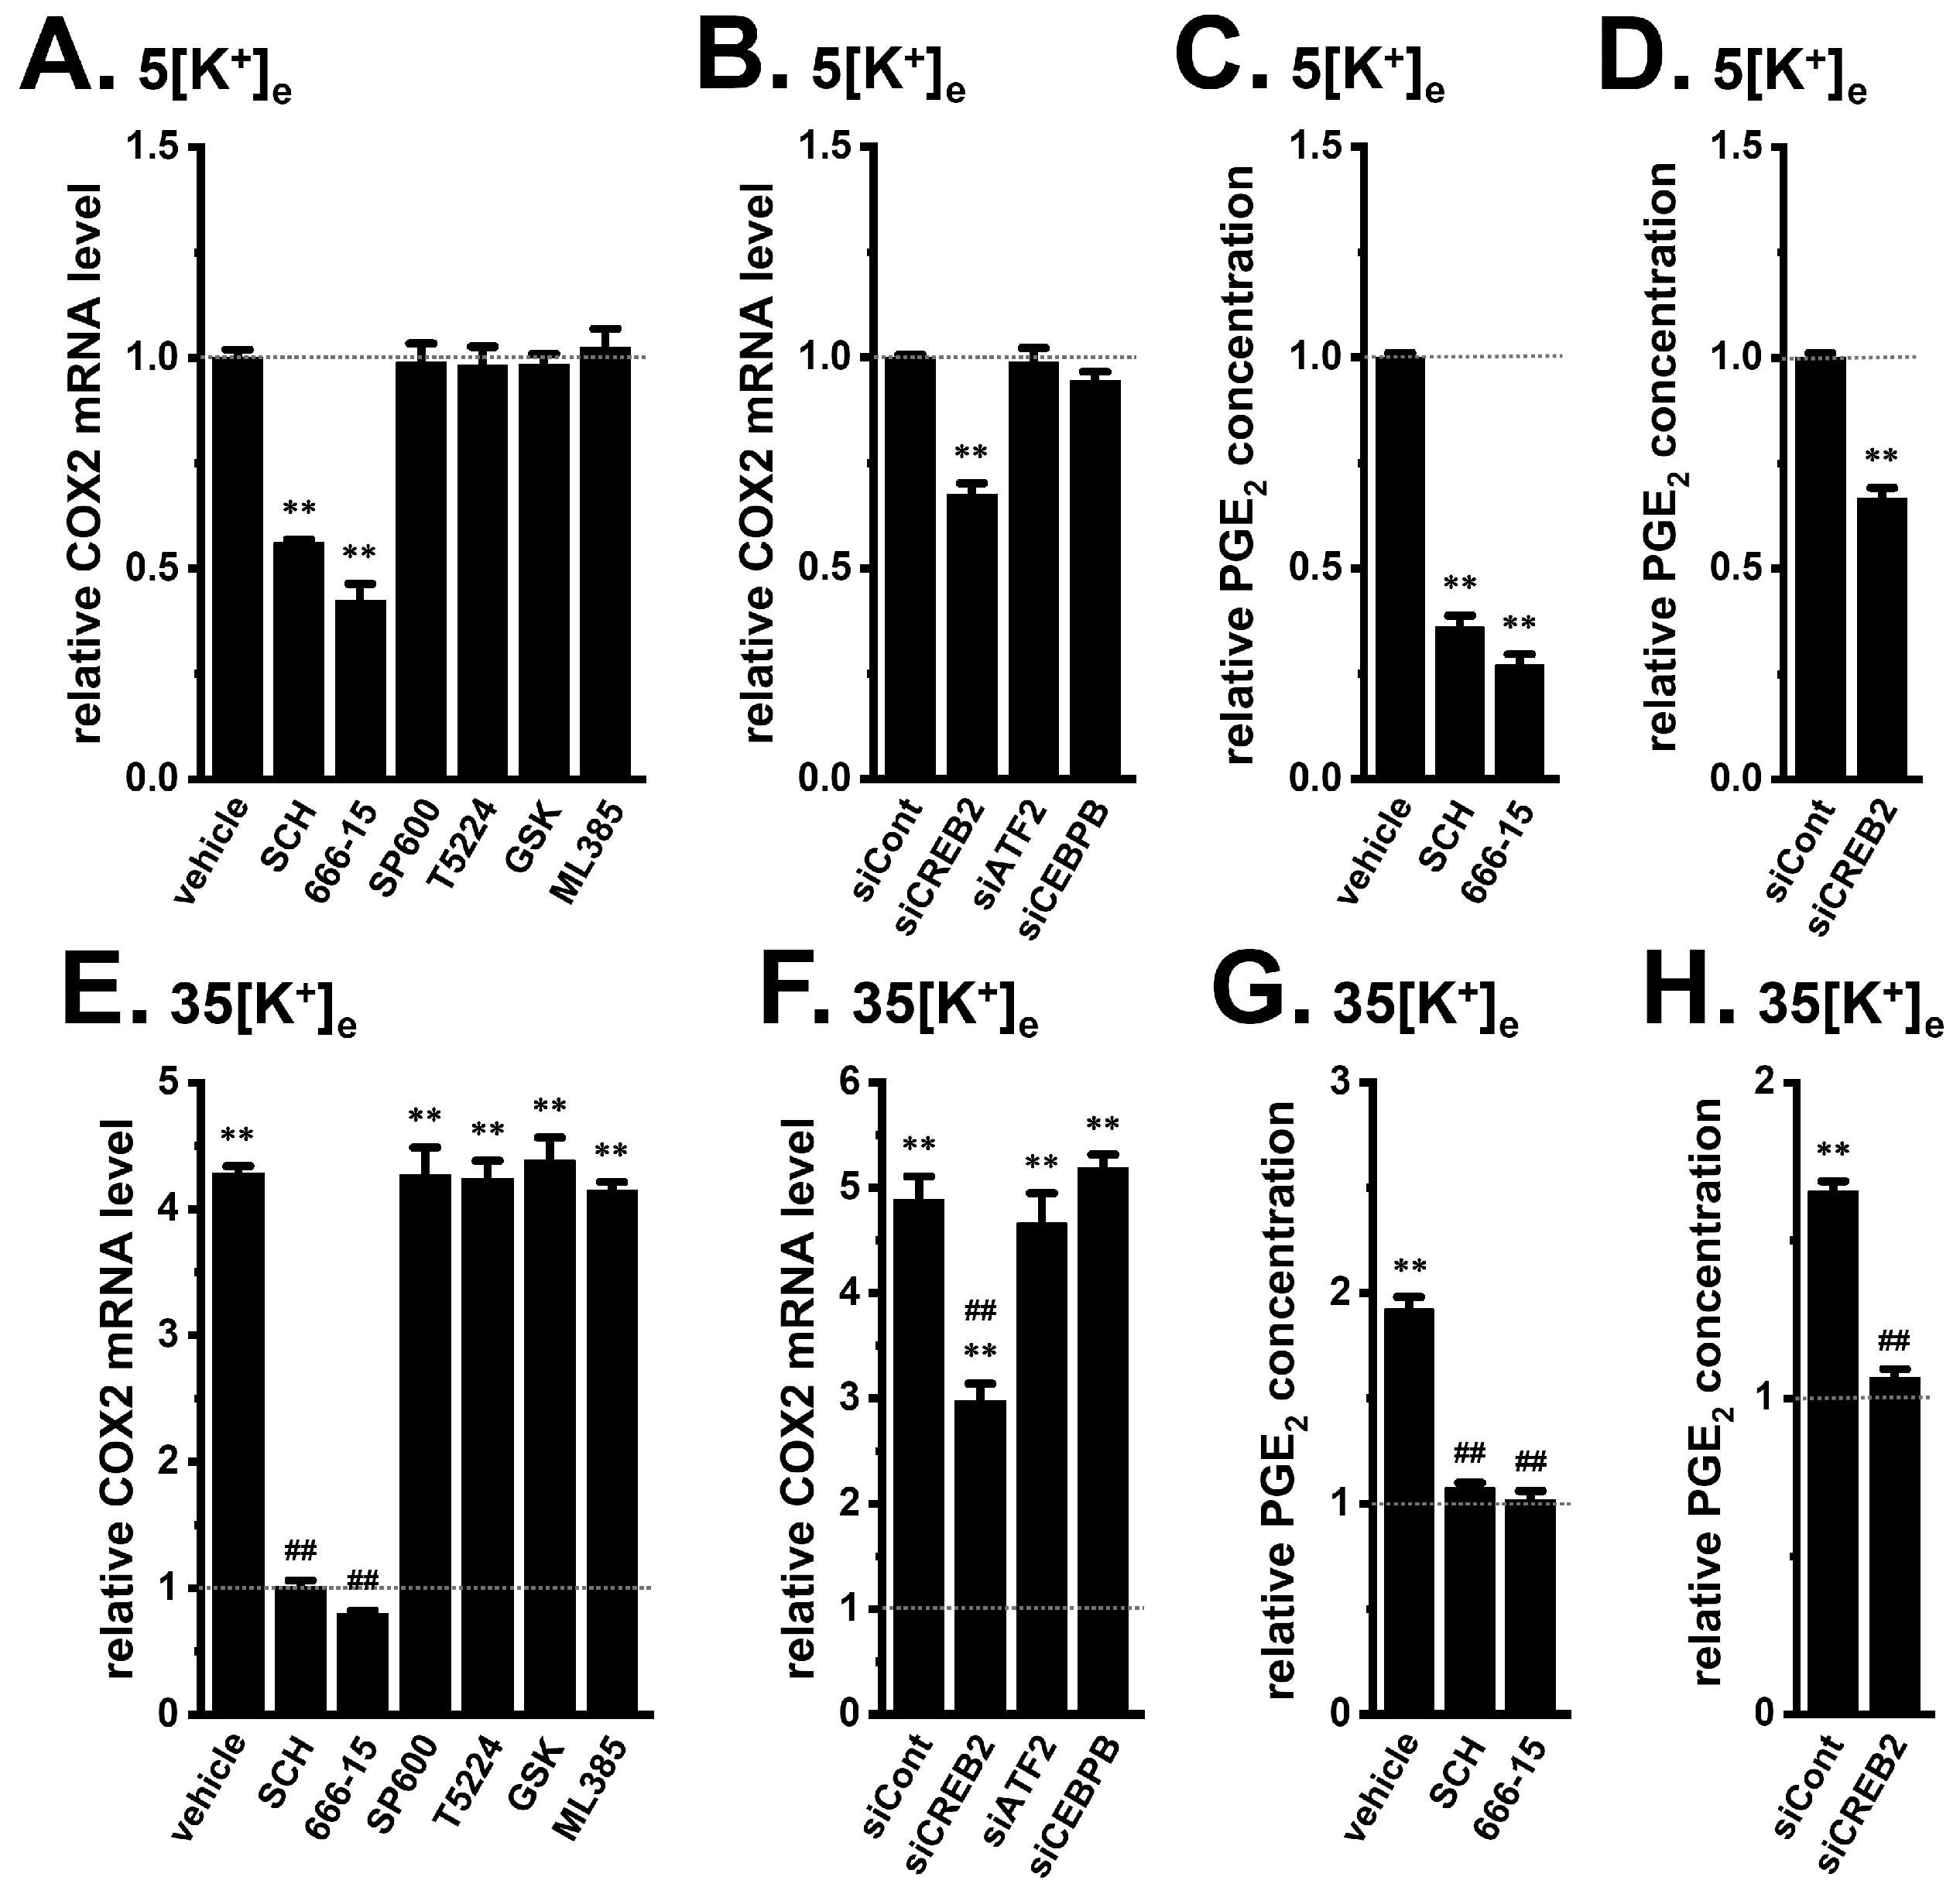
To identify signaling pathways involved in COX2 regulation, we examined the effects of pharmacological inhibitors and siRNA-mediated knockdown. Under basal [K+]e conditions (5 mM), inhibition of ERK with SCH772984 (1 μM) or pan-CREB activity with 666-15 (1 μM) significantly reduced COX2 mRNA expression and PGE2 production (n = 4, p < 0.01) (Figure 5A,C). By contrast, inhibition of JNK with SP600125 (1 μM), AP-1 with T5224 (10 μM), NOX2 with GSK2795039 (10 μM), or NRF2 with ML385 (5 μM) had little effect on COX2 mRNA expression (n = 4, p > 0.05) (Figure 5A). Among the CREB/ATF family members examined previously, CREB2/ATF4 was the predominant transcript in M2-MACs [11]. Although ATF2 can bind CRE-containing elements in the COX2 promoter [18], ATF2 was expressed at relatively low levels in M2-MACs. Selective knockdown of CREB2 reduced COX2 mRNA expression and PGE2 production (n = 4, p < 0.01) (Figure 5B,D), whereas ATF2 knockdown showed limited effects (n = 4, p > 0.05) (Figure 5B). The knockdown efficiencies were approximately 50% (Supplementary Figure S4). CCAAT/enhancer-binding protein β (CEBPB) has been implicated in the transcriptional regulation of COX2 and ARG1 in myeloid-derived suppressor cells [19]; however, CEBPB knockdown did not significantly alter COX2 expression in M2-MACs (n = 4, p > 0.05) (Figure 5B). Moreover, SKA-121, SCH772984, and 666-15 did not significantly reduce CEBPB mRNA expression under either basal or elevated [K+]e conditions (n = 4, p > 0.05) (Supplementary Figure S5). These findings implicate ERK and CREB2 in the regulation of the COX2–PGE2 pathway in M2-MACs.
Figure 5.
ERK and CREB2 signaling regulate COX2 expression and PGE2 production under basal and elevated [K+]e conditions. (A,E) COX2 mRNA expression in M2-MACs treated with vehicle, SCH772984 (SCH; 1 μM), 666-15 (1 μM), SP600125 (SP600; 1 μM), T5224 (10 μM), GSK2795039 (GSK; 10 μM), and 5 μM ML385 for 24 h under basal (5 mM) (A) and elevated (35 mM) [K+]e (E) conditions. (B,F) COX2 mRNA expression in M2-MACs transfected with control siRNA (siCont), CREB2 siRNA (siCREB2), ATF2 siRNA (siATF2), and CEBPB siRNA (siCEBPB) under basal (B) and elevated [K+]e (F) conditions. COX2 mRNA expression under basal [K+]e conditions was expressed as 1.0 (n = 4). (C,G) PGE2 concentrations in M2-MACs treated with vehicle, SCH, and 666-15 for 48 h under basal (C) and elevated [K+]e (G) conditions. (D,H) PGE2 concentrations in M2-MACs transfected with siCont and siCREB2 under basal (D) and elevated [K+]e (H) conditions. PGE2 concentrations under basal [K+]e conditions were expressed as 1.0 (n = 4). Data are presented as the mean ± SEM. **, ##: p < 0.01 vs. vehicle controls under basal and elevated [K+]e, respectively.
Under elevated [K+]e conditions, inhibition of ERK or pan-CREB activity markedly reduced COX2 mRNA expression and PGE2 production (n = 4, p < 0.01) (Figure 5E,G). CREB2 knockdown similarly attenuated elevated [K+]e-induced COX2 expression and PGE2 production (n = 4, p < 0.01) (Figure 5F,H), whereas knockdown of ATF2 or CEBPB had no significant effect (n = 4, p > 0.05) (Figure 5F). These results support the ERK–CREB2 axis as a major regulatory pathway for COX2 induction in M2-MACs, particularly under elevated [K+]e.
2.6. ERK and CREB2 Signaling Regulate ARG1 Expression and ARG Metabolism
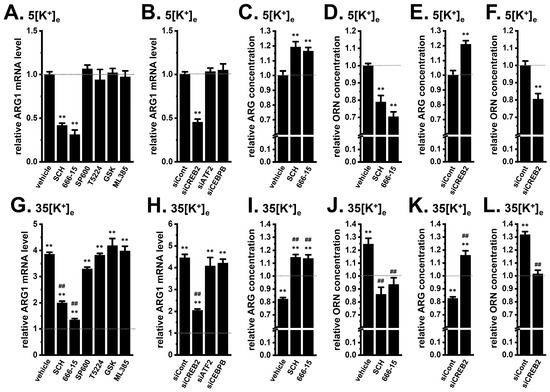
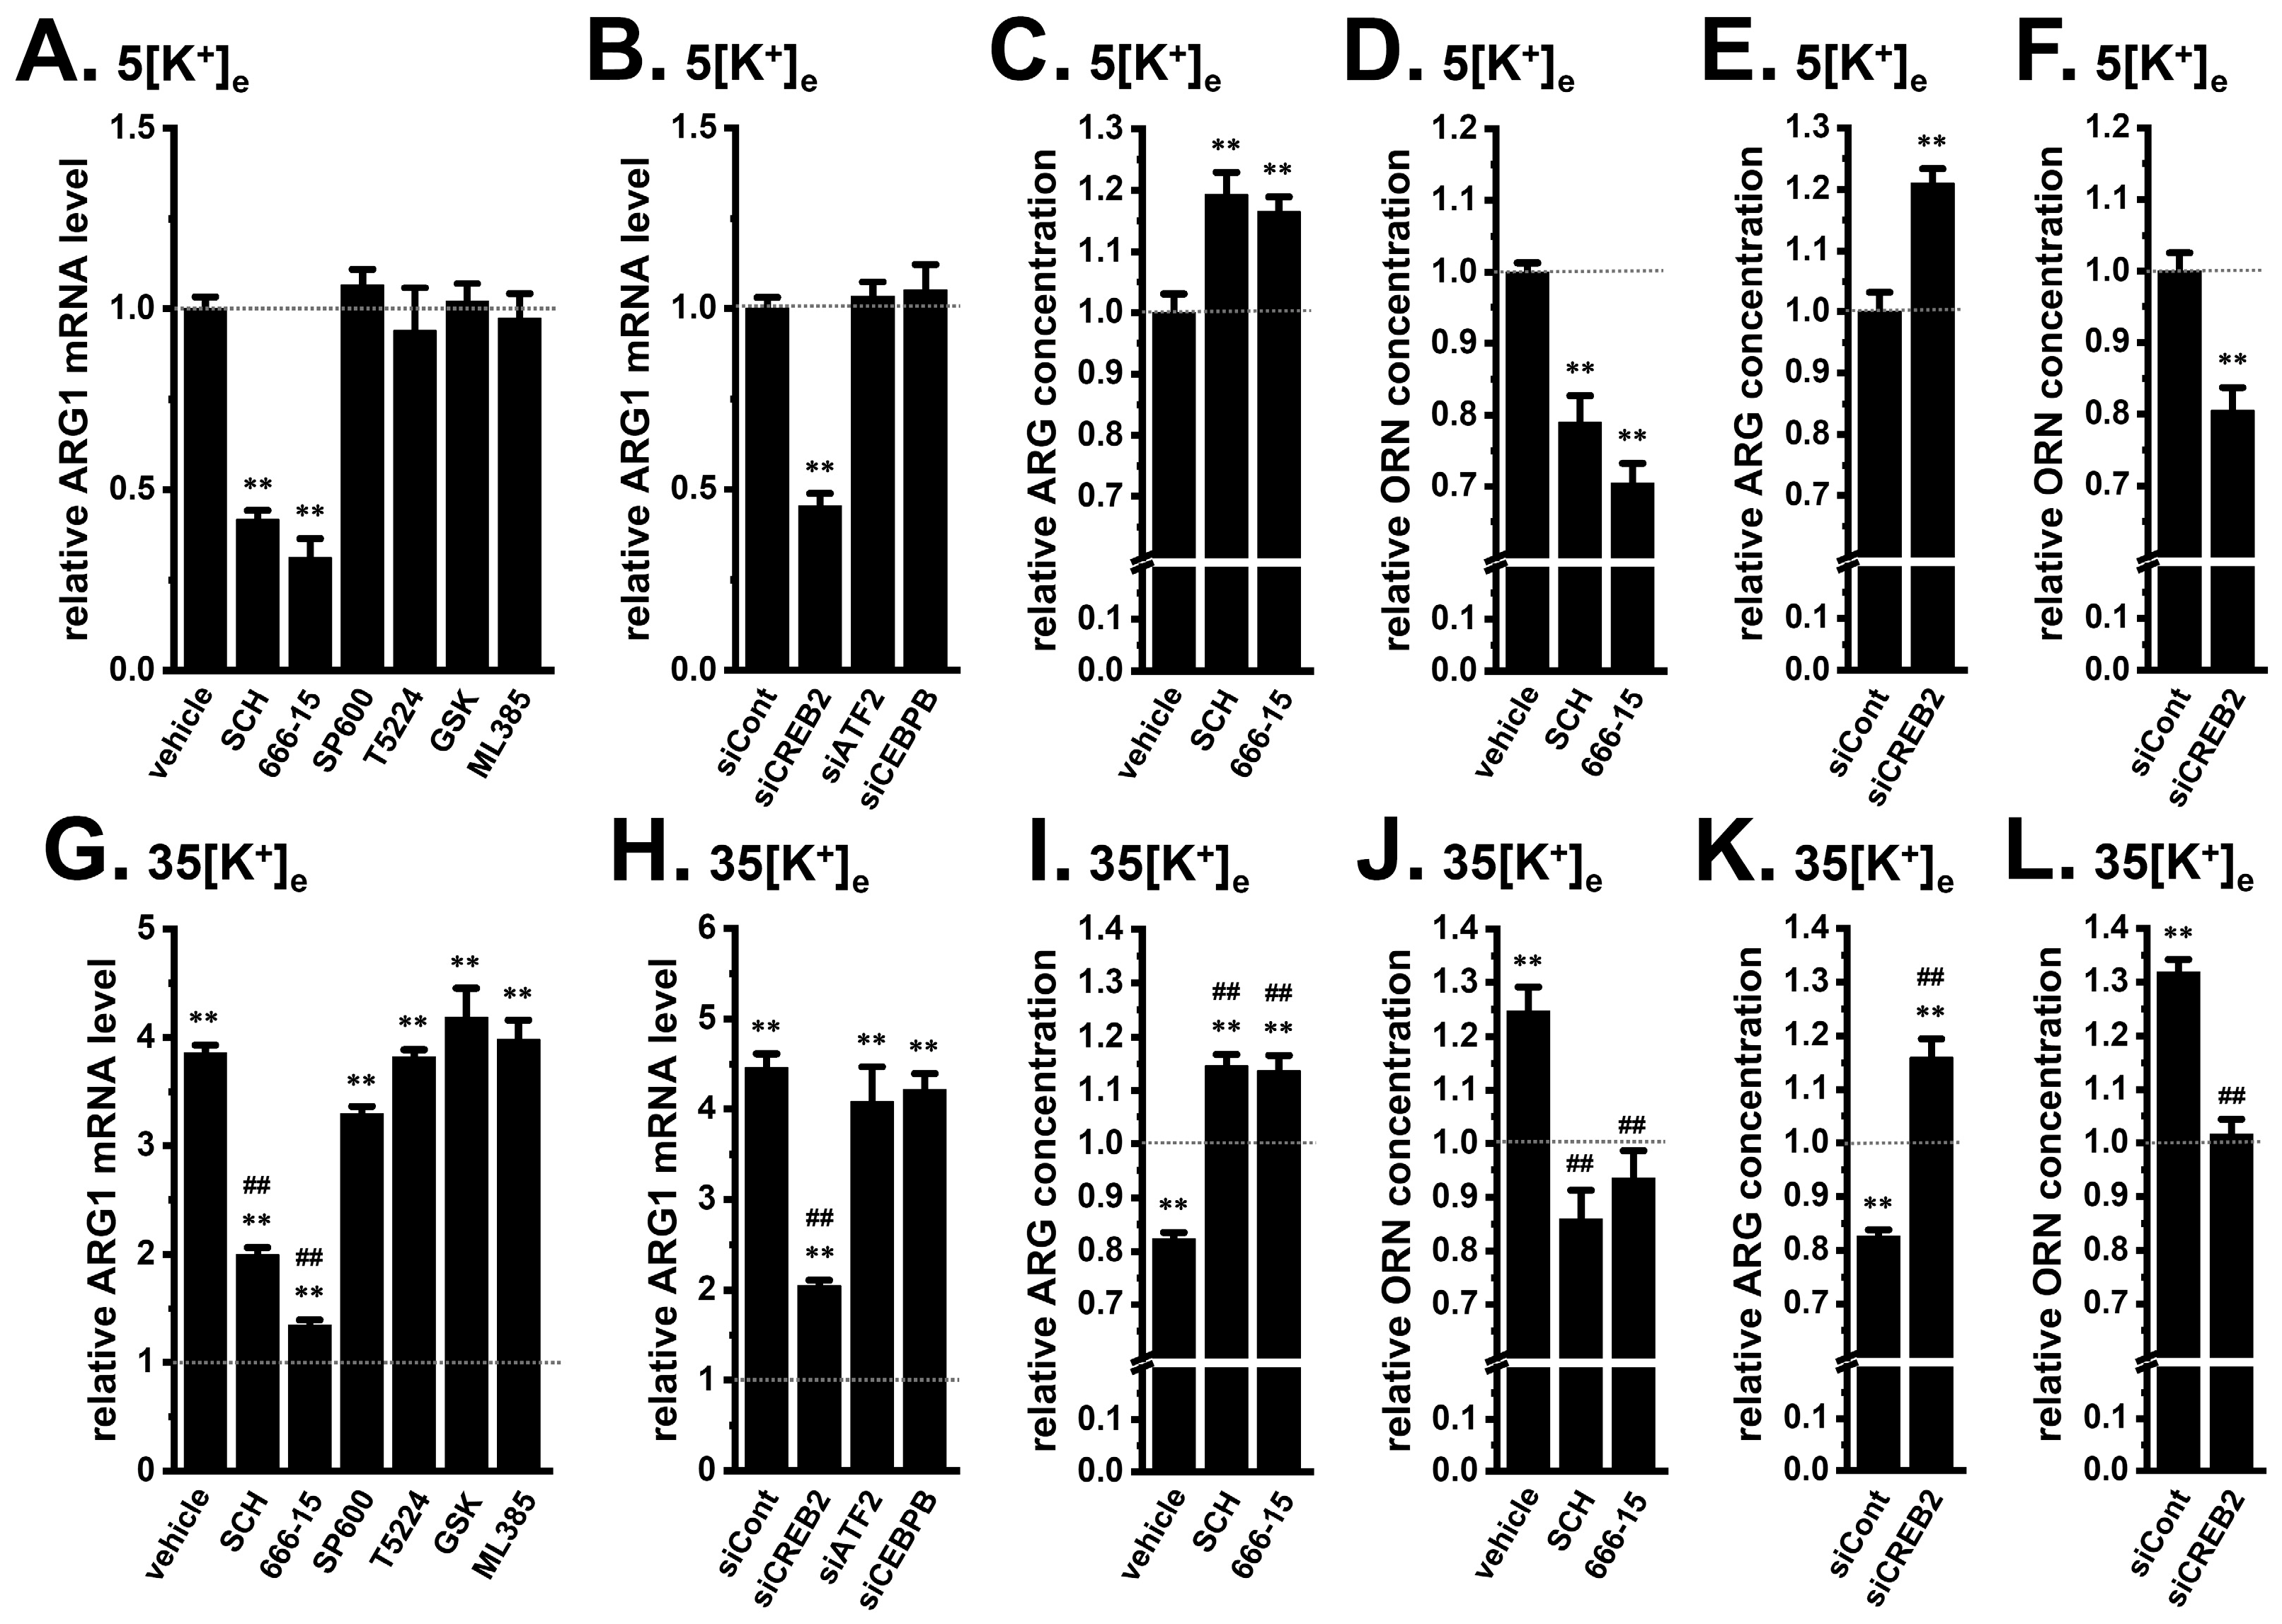
We next examined the signaling mechanisms regulating ARG1 expression and ARG metabolism. Under basal [K+]e conditions, inhibition of ERK or pan-CREB activity significantly reduced ARG1 mRNA expression (n = 4, p < 0.01) (Figure 6A). Both inhibitors increased extracellular ARG and decreased ORN (n = 4, p < 0.01) (Figure 6C,D), consistent with reduced ARG1-associated metabolic activity. CREB2 knockdown produced similar effects, reducing ARG1 expression, increasing ARG, and decreasing ORN (n = 4, p < 0.01), whereas knockdown of ATF2 or CEBPB had little effect (n = 4, p > 0.05) (Figure 6B,E,F).
Figure 6.
ERK and CREB2 signaling regulate ARG1 expression and restore ARG/ORN balance. (A,G) ARG1 mRNA expression in M2-MACs treated with vehicle, SCH, 666-15, SP600, T5224, GSK, and ML385 for 24 h under basal (A) and elevated [K+]e (G) conditions. (B,H) ARG1 mRNA expression in M2-MACs transfected with siCont, siCREB2, siATF2, and siCEBPB under basal (B) and elevated [K+]e (H) conditions. ARG1 mRNA expression under basal [K+]e conditions was expressed as 1.0 (n = 4). (C,D,I,J) ARG (C,I) and ORN (D,J) quantitation in the culture medium of M2-MACs treated with vehicle, SCH, and 666-15 for 48 h under basal (C,D) and elevated [K+]e (I,J) conditions. (E,F,K,L) ARG (E,K) and ORN (F,L) quantitation in the culture media of M2-MACs transfected with siCont and siCREB2 under basal (E,F) and elevated [K+]e (K,L) conditions. ARG and ORN concentrations under basal [K+]e conditions were expressed as 1.0 (n = 4). Data are presented as the mean ± SEM. **, ##: p < 0.01 vs. vehicle control under basal and elevated [K+]e, respectively.
Under elevated [K+]e conditions, inhibition of ERK or CREB markedly suppressed ARG1 induction (n = 4, p < 0.01) (Figure 6G). These inhibitors also restored ARG concentrations and reduced ORN accumulation (n = 4, p < 0.01) (Figure 6I,J). CREB2 knockdown likewise attenuated elevated [K+]e-induced ARG1 expression and normalized the ARG/ORN profile (n = 4, p < 0.01) (Figure 6H,K,L).
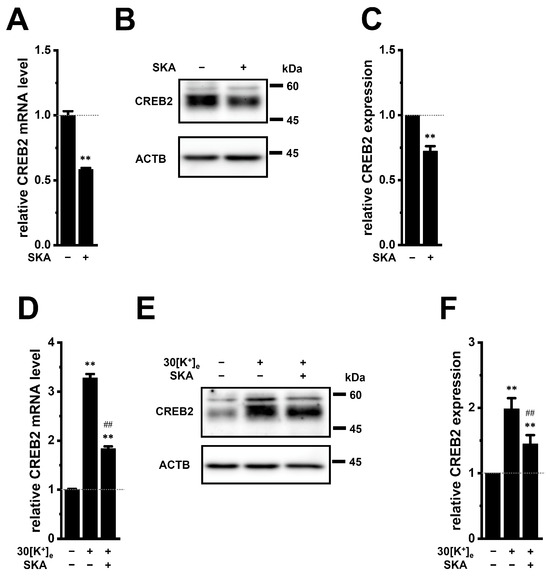
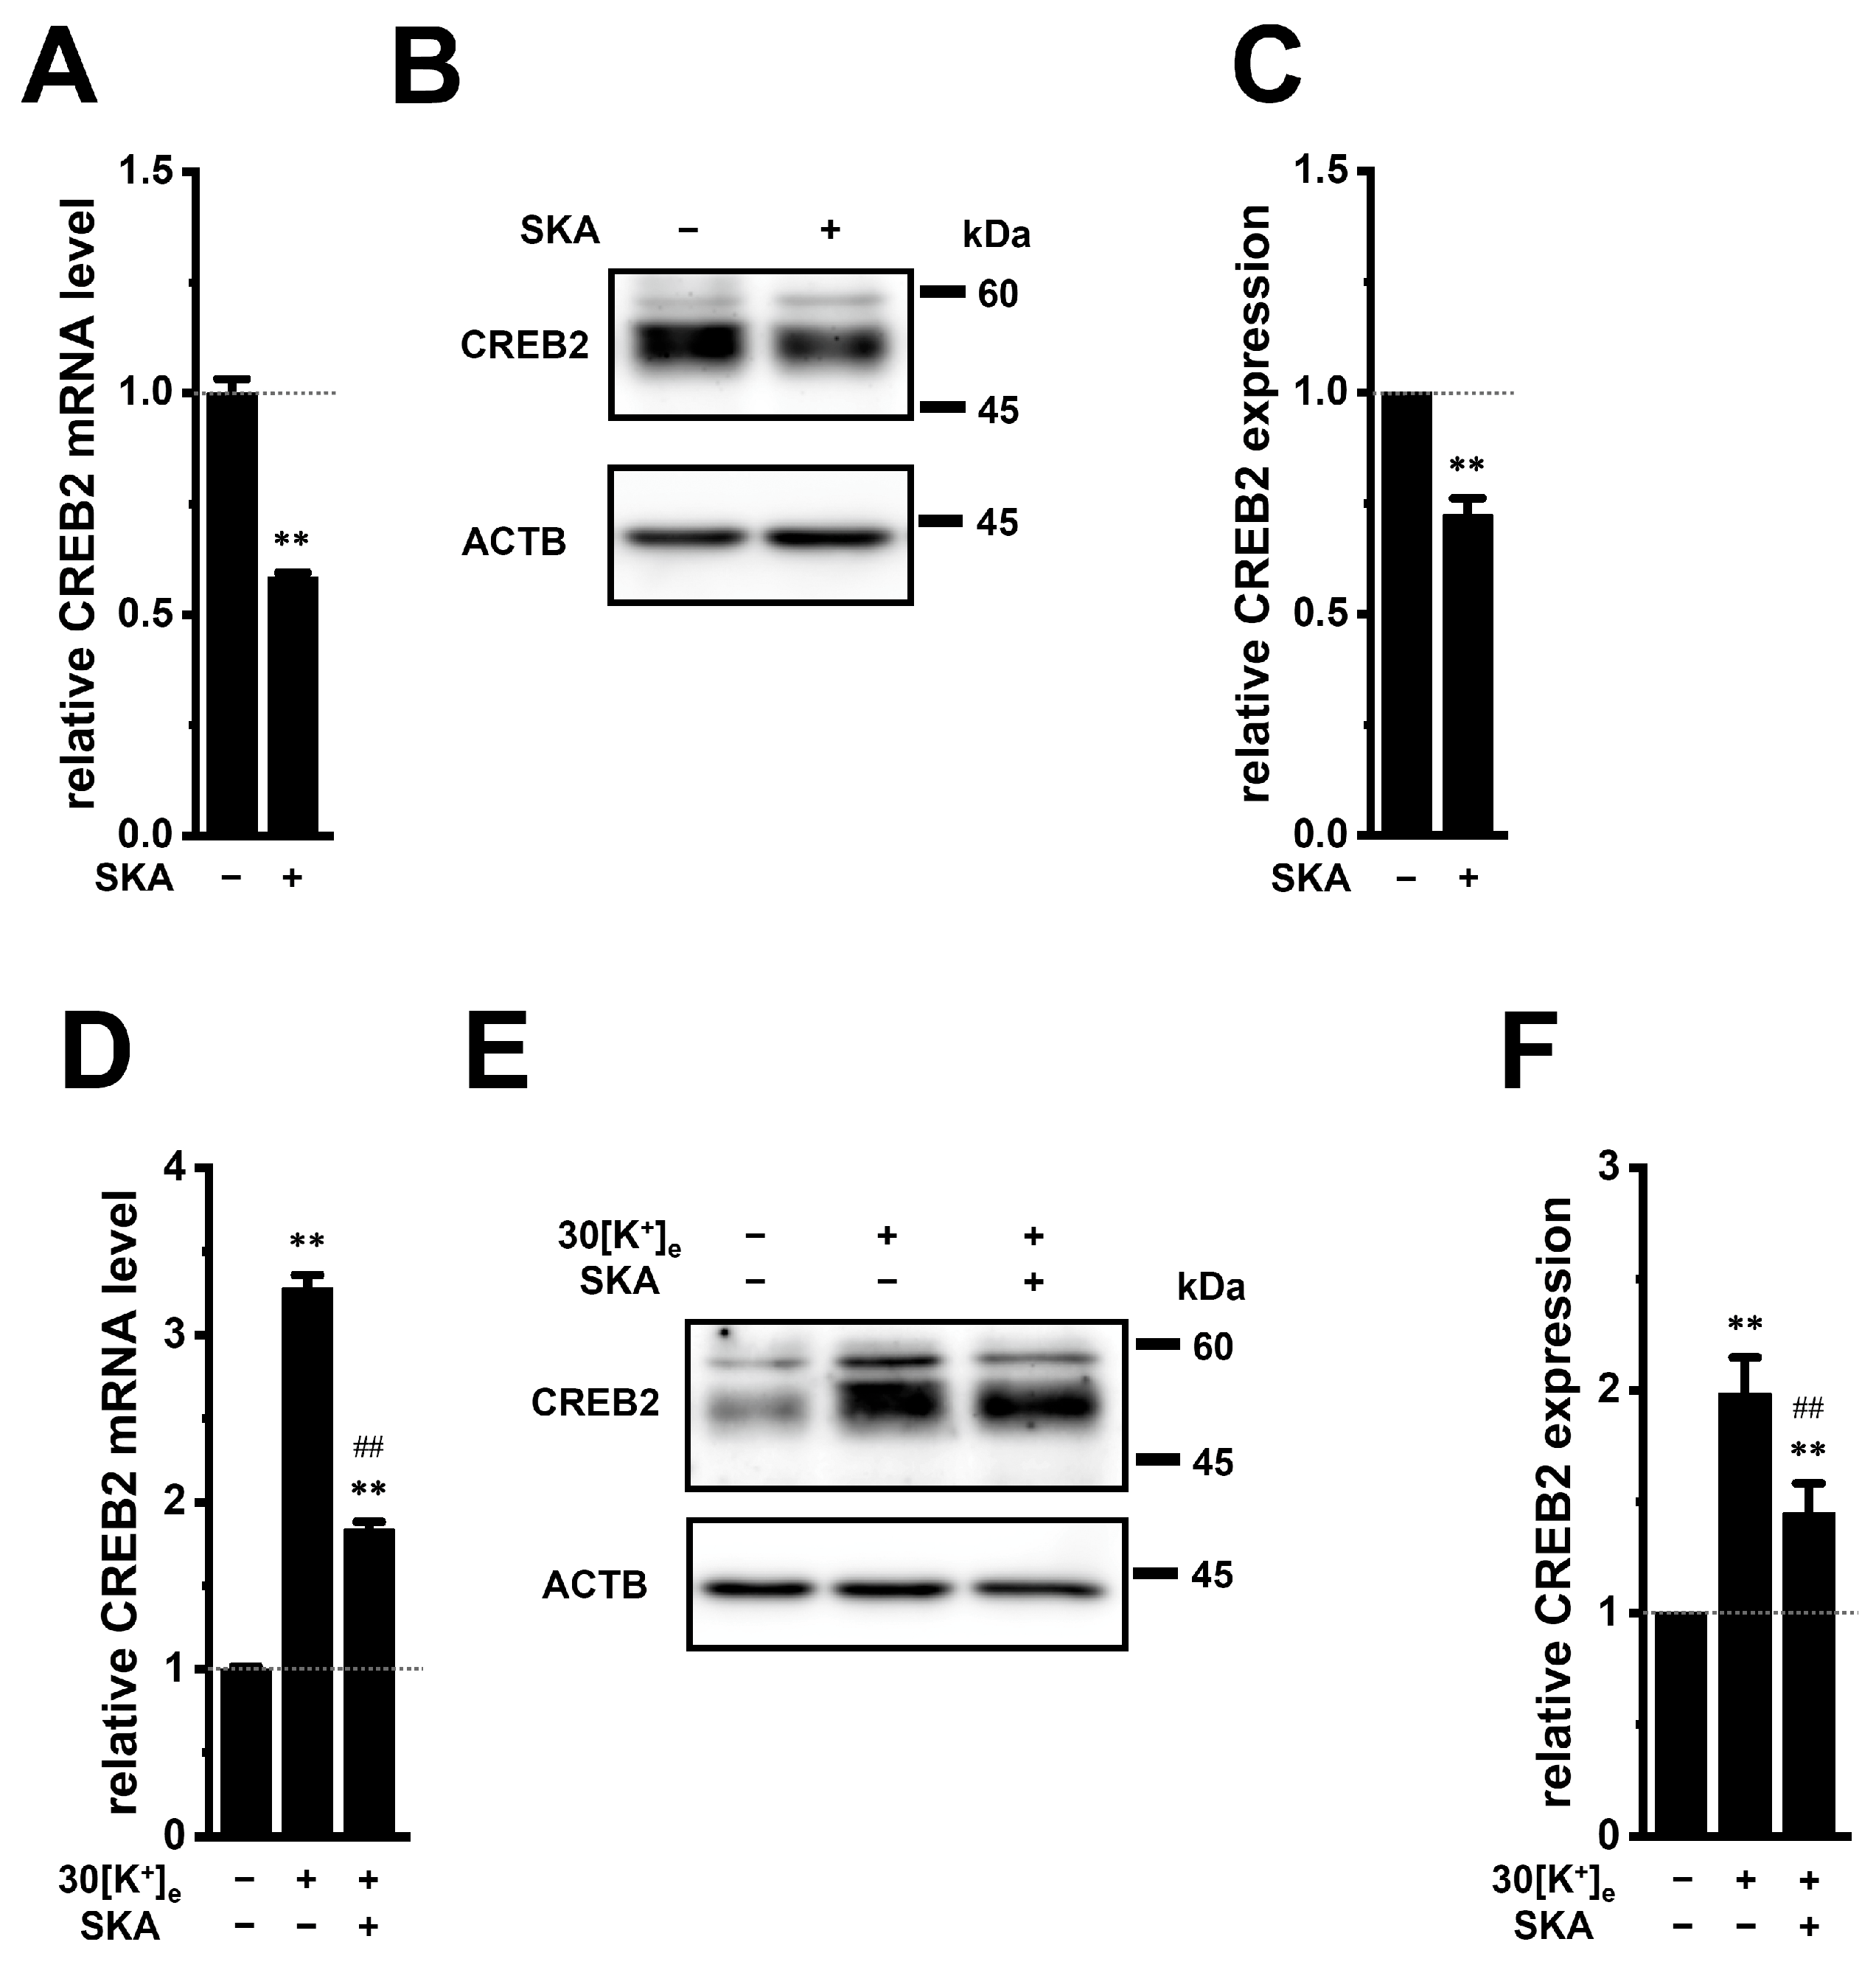
In our previous study [10], we demonstrated that SKA-121 treatment attenuated ERK phosphorylation, whereas exposure to [K+]e enhanced ERK phosphorylation in M2-MACs. However, the effects of SKA-121 and elevated [K+]e on CREB2 expression were not fully examined. Therefore, we investigated CREB2 expression under these conditions in the present study. Treatment with SKA-121 significantly decreased CREB2 mRNA and protein expression (n = 4, p < 0.01) (Figure 7A–C). In contrast, exposure to elevated [K+]e significantly increased CREB2 mRNA and protein expression (n = 4, p < 0.01) (Figure 7D–F). Notably, SKA-121 treatment significantly attenuated the elevated [K+]e-induced increase in CREB2 protein expression (n = 4, p < 0.01) (Figure 7D–F), suggesting that CREB2 may act downstream of ERK signaling under these conditions. Collectively, these data indicate that the ERK–CREB2 axis coordinately regulates the COX2–PGE2 and ARG1–ARG/ORN programs in M2-MACs.
Figure 7.
KCa3.1 activation suppresses basal and elevated [K+]e-induced CREB2 expression in M2-MACs. (A) Real-time PCR examination of the CREB2 mRNA expression in M2-MACs treated with vehicle (−) or SKA-121 (SKA; 10 μM) (+) for 24 h. Values were normalized to ACTB and expressed relative to the vehicle control (set to 1.0; n = 4). (B,C) Representative immunoblots and densitometric analysis of CREB2 protein in M2-MACs treated with vehicle (−) or SKA (+) for 48 h. CREB2 signals were normalized to ACTB and expressed relative to the vehicle control (set to 1.0; n = 4). CREB2 mRNA expression (D) and representative immunoblots and densitometric analysis of CREB2 protein (E,F) in M2-MACs cultured under basal [K+]e with vehicle (−/−), elevated [K+]e induced by addition of 30 mM KCl (+/−), or elevated [K+]e plus SKA-121 (SKA; 10 μM) (+/+) (n = 4). The positions of molecular weight markers (kDa) are indicated on the right of each blot (B,E). Data are presented as the mean ± SEM. **: p < 0.01 vs. − and −/−; ##: p < 0.01 vs. +/−.
Neither pharmacological inhibition of ERK or CREB nor CREB2 knockdown significantly altered CIT concentrations under basal or elevated [K+]e conditions (Supplementary Figure S6). Because tryptophan (TRP) metabolism also contributes to immune suppression in the TME [20], we measured TRP and kynurenine (KYN). SKA-121 did not significantly alter either metabolite under basal or elevated [K+]e conditions (Supplementary Figure S7), and the transcriptional levels of the related enzymes IDO1, IDO2, and TDO2 were very low (less than 0.01 relative to ACTB).
3. Discussion
The present study identifies KCa3.1 activation as a negative regulator of two immunometabolic pathways in M2-MACs: the COX2–PGE2 axis and ARG1-dependent ARG catabolism. COX2 and ARG1 were markedly induced during M2-like differentiation, and pharmacological activation of KCa3.1 with SKA-121 reduced their mRNA and protein expression (Figure 1 and Figure 3, Supplementary Figure S1). These molecular changes were accompanied by corresponding functional metabolic effects: reduced PGE2 production and arginase activity, increased extracellular ARG, and decreased ORN accumulation. Although polyamines were not directly measured, the reduction in ORN is consistent with decreased substrate availability for downstream polyamine and proline biosynthesis. Thus, KCa3.1 activation coordinately suppresses two distinct macrophage programs with the potential to support immune suppression and tissue remodeling.
A second major finding is that elevated [K+]e enhanced both COX2 and ARG1 expression (Figure 2 and Figure 4). The accompanying increase in PGE2 production and arginase activity, decrease in extracellular ARG, and accumulation of ORN indicate activation of both PG synthesis and ARG1-dependent ARG catabolism. Elevated [K+]e occurs in necrotic tissues and tumors, where loss of membrane integrity releases intracellular [K+] ([K+]i) into the extracellular compartment. In the present study, elevated [K+]e should therefore be regarded as an experimentally defined K+-rich condition designed to model localized regions of the TME associated with extensive tumor cell death rather than as a uniform ionic condition throught the entire TME. Our findings support the concept that elevated [K+]e may function not only as a suppresor of cytotoxic T cell activity but also as a microenvironmental signal that reinforces immunometabolic programs in macrophages. Importantly, SKA-121 attenuated these elevated [K+]e-induced responses, suggesting that KCa3.1 activation can counteract K+-driven macrophage immunometabolic reprogramming.
The coordinated regulation of COX2 and ARG1 is immunologically relevant because PGE2 production and ARG depletion suppress antitumor immunity through distinct but complementary mechanisms [21,22,23,24]. PGE2 inhibits cytotoxic T cell responses, promotes M2-MAC polarization, and enhances the suppressive activity of myeloid-derived suppressor cells through EP2 and EP4 receptors [21,22]. In contrast, ARG1 reduces ARG availability, thereby impairing T cell proliferation, activation, and effector function [23,24]. Thus, simultaneous suppression of the COX2–PGE2 and ARG1-dependent ARG metabolic pathways may reduce the ability of M2-MACs to establish an immunosuppressive metabolic environment. However, because macrophage-mediated suppression of T cell function was not directly assessed in the present study, our findings demonstrate regulation of macrophage immunometabolic pathways rather than direct restoration of antitumor immune responses.
Mechanistically, the pharmacological and gene-silencing experiments identify the ERK–CREB2 axis as an important regulator of both COX2 and ARG1 in M2-MACs. Inhibition of ERK or CREB, as well as CREB2 knockdown, reduced COX2 and ARG1 expression and attenuated the associated changes in PGE2 and ARG/ORN under both basal and elevated [K+]e conditions (Figure 5 and Figure 6). JNK–c-JUN, NOX2, and NRF2 signaling can regulate COX2 and/or ARG1 in other cellular contexts [25,26,27], but inhibition of these pathways had limited effects in the present model, suggesting context-dependent pathway utilization. The present findings are also consistent with our previous observation that KCa3.1 activation suppresses CCL2 through an ERK–CREB2-dependent mechanism in THP-1-derived M2-MACs [11]. KCa3.1 activation alters membrane potential, Ca2+ signaling, and [K+]i homeostasis [10,11], each of which may influence kinase activity and transcriptional regulation. Nevertheless, the current data do not establish whether KCa3.1 activation suppresses ERK-CREB2 signaling directly or through secondary changes in ion homeostasis. Direct measurement of ERK and CREB2 activation, together with promoter occupancy studies, will be required to define this mechanism.
Glycogen synthase kinase 3 (GSK3)-dependent phosphorylation of CREB2 at Ser214 promotes its proteasomal degradation [28], suggesting the possibility that KCa3.1 regulates CREB2 through a GSK3β pathway. KCa3.1 has been linked to PI3K–AKT–GSK3β signaling in astrocytes [29]. However, inhibition of GSK3β with TWS119 (1 μM) did not reproduce the effects of SKA-121 on COX2 or ARG1 expression, PGE2 production, or the ARG/ORN profile (Supplementary Figure S8), arguing against GSK3β as the principal mediator in M2-MACs. We also examined pyruvate kinase M2 (PKM2), which contains a K+-binding site and has been implicated in ERK–COX2 signaling and interstitial K+ homeostasis in tumors [30,31]. PKM2 mRNA was markedly induced during M2-like differentiation and reduced by SKA-121 under both basal and elevated [K+]e conditions (Supplementary Figure S9A,B). Nevertheless, PKM2 inhibition did not significantly alter COX2 expression. By contrast, PKM2 inhibition reduced ARG1 expression selectively under elevated [K+]e conditions (Supplementary Figure S9C,D). These results suggest that PKM2 may contribute to elevated [K+]e-induced ARG1 regulation but is not required for COX2 induction. This context-dependent role is compatible with emerging evidence that, in addition to promoting inflammatory M1-like metabolism, PKM2 can support TAM phenotypes [30,31,32].
ARG restriction can induce compensatory expression of cationic amino acid transporters, including solute carrier 7A1 (cationic amino acid transporter 1) (SLC7A1/CAT1), SLC7A2/CAT2, SLC7A3/CAT3, and SLC7A6 [33]. Among these transporters, SLC7A2 was the predominant transcript in M2-MACs. The relative expression values normalized to ACTB were 0.067 ± 0.002 for SLC7A1, 0.979 ± 0.045 for SLC7A2, under 0.0005 for SLC7A3, and 0.040 ± 0.001 for SLC7A6 (n = 4). Neither elevated [K+]e nor SKA-121 significantly altered their expression (Supplementary Figure S10). These findings suggest that the observed changes in extracellular ARG and ORN primarily reflect altered ARG1 activity rather than transcriptional regulation of SLC7A2. However, transporter activity was not measured directly, and the contribution of SLC7A2 to ARG flux in M2-MACs remains to be determined.
Several miRNAs have been implicated in the promotion of M2 macrophage polarization [34]. Among them, miR-223-3p is considered an important regulator of the dynamic balance between M1- and M2-MAC phenotypes. Its inhibition or downregulation has been reported to promote M1 polarization while suppressing M2 polarization [35,36]. In the present study, overexpression of miR-223-3p using a synthetic miR-223-3p mimic did not significantly affect the transcriptional levels of COX2 or ARG1 (Supplementary Figure S11A–C). Furthermore, treatment with SKA-121 for 24 h did not alter miR-223-3p expression (Supplementary Figure S11D). These findings suggest that miR-223-3p is unlikely to be directly involved in the SKA-121-mediated regulation of COX2 and ARG1 expression in M2-MACs.
The present findings may also be relevant to endometriosis and endometriosis-associated ovarian cancer, which are characterized by macrophage-rich inflammatory microenvironments [37,38]. The COX2–PGE2 axis contributes to inflammation and immune suppression, while ARG1-dependent ARG metabolism may further shape the immunometabolic environment of endometriotic lesions [39,40]. [K+]e elevation has not yet been directly established in endometriotic lesions, and disease-specific experimental validation will therefore be required [41]. Nevertheless, the ability of KCa3.1 activation to suppress COX2, PGE2, and ARG metabolism provides a rationale for investigating this pathway in macrophage-rich gynecological disorders.
Our previous findings that KCa3.1 activation suppresses IL-8, IL-10, and CCL2 in THP-1-derived M2-MACs support a broader role for KCa3.1 in limiting macrophage-derived protumorigenic and immunoregulatory mediators [10,11]. Taken together, the available data suggest that KCa3.1 activation can coordinately modulate cytokine, chemokine, lipid-mediator, and amino acid-metabolic programs. However, disease-specific and cell type-specific validation is essential before KCa3.1 activators can be considered therapeutic candidates.
Several limitations of the present study should be acknowledged. First, validation using primary human monocyte-derived macrophages, TAMs, and in vivo systems will be necessary to establish the physiological and pathological relevance of the KCa3.1–COX2/ARG1 metabolic pathway. Second, the effects of SKA-121 treatment on cancer cell growth and macrophage-mediated immunosuppression were not directly assessed. Third, although changes in ORN levels were used as an indicator of ARG1-associated metabolism, downstream metabolites, including polyamines, proline, and urea, were not measured. Finally, promoter-reporter assays, chromatin immunoprecipitation, and rescue experiments will be required to determine whether CREB2 directly regulates COX2 and ARG1 transcription and to elucidate how KCa3.1 activity converges on the ERK–CREB2 signaling axis.
4. Materials and Methods
4.1. Materials and Reagents
RPMI 1640 (Product code: 189-02025), DNase-free RNase (313-01461), and Penicillin-Streptomycin Solution (×100) (168-23191) were purchased from FUJIFILM Wako Pure Chemicals (Osaka, Japan). Fetal bovine serum (FBS) (Product code: 172012), 12-myristate 13-acetate (PMA) (P1585), and phosphatase inhibitor cocktails (P5726, P0044) were from Sigma-Aldrich (St. Louis, MO, USA). SP600125 (HY-12041), SKA-121 (HY-107414), numidargistat dihydrochloride (HY-101979A), celecoxib (HY-14398), TWS119 (HY-10590), hsa-miR223 mimic (HY-R00467), and miRNA mimic negative control (HY-R04602) were from MedChemExpress (Monmouth Junction, NJ, USA). GSK2795039 (33777) and SCH772984 (19166) were from Cayman Chemical (Ann Arbor, MI, USA). ML385 (S8790), 666-15 (S8846), T5224 (S8966), and PKM2-IN-1 (S8616) were from Selleckchem (Yokohama, Japan). Lipofectamine® RNAiMAX (13778075), SYBR Green qPCR Master Mix (A66732), PGE2 ELISA kit (EHPGE2), SuperSignal West Pico PLUS Chemiluminescent Substrate (34580), and pre-designed/validated siRNAs targeting the negative control (No. 1), ATF2 (ID#: s3492), CREB2/ATF4 (ID#: s1702), CEBPB (ID#: s2893), and KCa3.1 (ID#: s7801) were from Thermo Fisher Scientific (Waltham, MA, USA). IL-4 and IL-13 (human, recombinant, animal free) (AF-200-04, AF-200-13) were from PeproTech Inc (Cranbury, NJ, USA). ReverTra Ace (TRT-101) was from ToYoBo (Osaka, Japan). Flat-bottomed dishes were from Corning (Corning, NY, USA). Random hexanucleotide primer (C1181) was from Promega K.K. (Tokyo, Japan). FastGene RNA Premium kit and FastGene miRNA Enhancer kit were from Nippongenetics (Tokyo, Japan). Mir-X miRNA First-Strand Synthesis kit was from TaKaRa (Osaka, Japan). Arginase Activity Assay kit was from Cosmo Bio (Tokyo, Japan). PCR primers were from Nihon Gene Research Laboratories (Sendai, Japan) (Table S1). HS-F5 column (150 × 2.1 mm; Supelco) was from Merck (Darmstadt, Germany). Primary and secondary antibodies were listed in Table S2. Other chemicals and reagents were from Sigma-Aldrich and FUJIFILM Wako Pure Chemicals.
4.2. Cell Culture and Differentiation into M2-MACs
The human acute monocytic leukemia cell line THP-1 (RIKEN Cell Bank, Osaka, Japan) was used as a model for human monocyte-derived macrophages. Cells were maintained in RPMI 1640 medium supplemented with 10% FBS and antibiotics at 37 °C in a humidified atmosphere containing 5% CO2. To induce macrophage differentiation, THP-1 cells were treated with PMA (100 ng/mL) for 8–12 h. The PMA-containing medium was then removed, and adherent cells were washed and cultured for 72 h in fresh medium supplemented with recombinant human IL-4 and IL-13 (20 ng/mL each) to induce M2 polarization. This protocol was based on our previously established M2-MAC model [10,11]. Unless otherwise indicated, compounds were dissolved in dimethyl sulfoxide (DMSO), and the final DMSO concentration was matched across experimental groups. M2-MACs were exposed to elevated [K+]e by adding 30 mM KCl to the culture medium, yielding a final [K+]e of approximately 35 mM. Control cells were maintained at the basal [K+]e of approximately 5 mM.
4.3. RNA Extraction, cDNA Synthesis, and Real-Time PCR
Total RNA was isolated from M2-MACs using the acid guanidinium thiocyanate-phenol-chloroform method. RNA concentration and purity were measured using a NanoDrop One microvolume spectrophotometer (Thermo Fisher Scientific). cDNA was synthesized using ReverTra Ace and random hexamers. miRNAs were extracted using the FastGene RNA Premium kit with FastGene miRNA Enhancer, and cDNAs from miRNAs were synthesized using the Mir-X miRNA First-Strand Synthesis kit. Quantitative real-time PCR was performed using an Applied Biosystems 7500 Fast Real-Time PCR System (Thermo Fisher Scientific) and SYBR Green chemistry. PCR primers of human origin are listed in Table S1. ACTB was used as the reference gene, and relative mRNA expression was calculated using the 2−ΔΔCt method. Primer specificity was confirmed by melting-curve analysis.
4.4. Western Blotting
Whole-cell lysates were prepared from M2-MACs in RIPA buffer supplemented with protease inhibitor cocktails. Protein concentrations were determined using a protein assay kit. Equal amounts of protein were separated by SDS-PAGE and transferred to polyvinylidene difluoride membranes. After blocking, the membranes were incubated sequentially with the primary and secondary antibodies listed in Table S2. Immunoreactive bands were visualized using an enhanced chemiluminescent reagent and imaged with an Amersham Imager 600 (GE Healthcare Japan, Tokyo, Japan). Band intensities were quantified using ImageJ software (Ver. 1.42, National Institutes of Health, NIH, USA) and normalized to the corresponding ACTB signal.
4.5. Small Interfering RNA and MicroRNA Transfection
To examine the contribution of transcriptional regulators, M2-MACs were transfected with siRNAs targeting CREB2/ATF4, ATF2, CEBPB, or KCa3.1, or with a miR223 mimic. A non-targeting siRNA (control siRNA) and miRNA mimic negative control (control mimic) were used as negative controls. Transfection was performed in adherent cells using Lipofectamine RNAiMAX according to the manufacturer’s instructions. Knockdown efficiency was assessed by real-time PCR.
4.6. Measurement of PGE2 by Enzyme-Linked Immunosorbent Assay
PGE2 concentrations in culture supernatants were measured using a commercially available ELISA kit according to the manufacturer’s instructions. M2-MACs were treated with vehicle, SKA-121, elevated [K+]e, or elevated [K+]e plus SKA-121 for 48 h. Culture supernatants were collected, centrifuged to remove cellular debris, and stored at −80 °C until analysis. Absorbance was measured using a SpectraMax384 microplate reader (Molecular Devices Japan, Tokyo, Japan) at 405 nm with a reference wavelength of 580 nm. PGE2 concentrations were calculated from a standard curve and expressed relative to the vehicle control. The absolute PGE2 concentration in the vehicle control was approximately 250 pg/mL.
4.7. Measurement of Amino Acid Concentrations
Culture supernatants were collected after the indicated treatments, centrifuged to remove cell debris, and stored at −80 °C until analysis. L-ARG, L-ORN, and L-CIT were quantified using a Nexera ultra-high-performance liquid chromatography system coupled to an LCMS-8060 triple-quadrupole mass spectrometer equipped with an electrospray ionization source (Shimadzu, Kyoto, Japan) [42]. Chromatographic separation was performed at 40 °C using a Discovery HS-F5 column. Analytes were detected in positive-ion multiple-reaction-monitoring mode using the following transitions: m/z 175 > 70 for ARG, m/z 133 > 70 for ORN, m/z 176 > 70 for CIT, m/z 185 > 75 for ARG-13C6,15N4, m/z 139 > 76 for ORN-d6, and m/z 180 > 74 for CIT-d4. Concentrations were calculated from external standard curves and expressed relative to the vehicle control. Basal concentrations in control M2-MAC cultures were approximately 1100 μM ARG, 200 μM ORN, and 20 μM CIT.
4.8. Measurement of Arginase Activity
Arginase activity was measured using an Arginase Activity Assay kit according to the manufacturer’s instructions. Briefly, M2-MACs were collected after the indicated treatments and lysed. Arginase activity was determined by measuring the amount of urea generated from L-ARG. The enzymatic reaction was initiated by incubating cell lysates with the supplied substrate solution and for the duration specified by the manufacturer. After termination of the reaction, the amount of urea produced was determined colorimetrically using the detection reagents included in the kit. Absorbance (at 540 nm) was measured using a microplate reader, and arginase activity was calculated from a urea standard curve.
4.9. Statistical Analyses
Statistical analyses were performed using XLSTAT software (version 2013.1). Differences between two groups were evaluated using paired or unpaired Student’s t-tests with Welch’s correction when appropriate. Comparisons among multiple groups were performed using Tukey’s test. A p value less than 0.05 was considered statistically significant. Data were presented as the mean ± SEM.
5. Conclusions
KCa3.1 activation coordinately suppressed the COX2–PGE2 axis and ARG1-dependent ARG catabolism in M2-MACs through the ERK–CREB2 transcriptional axis. KCa3.1 activation also attenuated the immunometabolic response to elevated [K+]e. Thus, KCa3.1 represents a potential immunometabolic checkpoint in macrophages and may provide a pharmacological strategy for reprogramming the immunosuppressive tumor microenvironment. Further studies using in vivo tumor models are required to establish the therapeutic relevance of this pathway.
Supplementary Materials
The following supporting information can be downloaded at: https://www.mdpi.com/article/10.3390/ijms27198477/s1.
Author Contributions
Conceptualization, S.O.; validation, J.K., A.K., M.M. and S.O.; formal analysis, J.K., A.K., M.M., Y.M. and S.O.; investigation, J.K., A.K., M.M., Y.M., R.O. and S.O.; data curation, J.K., A.K. and S.O.; writing—original draft preparation, J.K., A.K. and S.O.; writing—review and editing, J.K., A.K., M.M., Y.M., H.K., Y.Y., R.O. and S.O.; funding acquisition, J.K., M.M. and S.O. All authors have read and agreed to the published version of the manuscript.
Funding
This research was funded by JSPS KAKENHI grants [JP24K09847] (S.O.) and [JP24K10314] (J.K.); The Salt Science Research Foundation, [2324] (S.O.); Aichi Cancer Research Foundation [2025-23] (M.M.); The Nitto Foundation [2025-19] (M.M.). This research was also the result of using research equipment shared in the MEXT Project for promoting public utilization of advanced research infrastructure (Program for supporting construction of core facilities) [JPMXS0441500026].
Institutional Review Board Statement
Not applicable.
Informed Consent Statement
Not applicable.
Data Availability Statement
The original data presented in the study are included in the article and Supplementary Materials. Further inquiries may be directed to the corresponding author.
Acknowledgments
The authors used ChatGPT 5.4Thinking (OpenAI, https://chatgpt.com) for English-language editing, accessed on 1 August and 14 September 2026.
Conflicts of Interest
The authors declare no conflicts of interest.
References
- Hinshaw, D.C.; Shevde, L.A. The tumor microenvironment innately modulates cancer progression. Cancer Res. 2019, 79, 4557–4566. [Google Scholar] [CrossRef] [Scilit] [PubMed]
- Ricketts, T.D.; Prieto-Dominguez, N.; Gowda, P.S.; Ubil, E. Mechanisms of macrophage plasticity in the tumor environment: Manipulating activation state to improve outcomes. Front. Immunol. 2021, 12, 642285. [Google Scholar] [CrossRef] [Scilit] [PubMed]
- Lin, Y.; Xu, J.; Lan, H. Tumor-associated macrophages in tumor metastasis: Biological roles and clinical therapeutic applications. J. Hematol. Oncol. 2019, 12, 76. [Google Scholar] [CrossRef] [Scilit] [PubMed]
- Hasan, M.N.; Capuk, O.; Patel, S.M.; Sun, D. The role of metabolic plasticity of tumor-associated macrophages in shaping the tumor microenvironment immunity. Cancers 2022, 14, 3331. [Google Scholar] [CrossRef] [Scilit] [PubMed]
- Singh, L.; Nair, L.; Kumar, D.; Arora, M.K.; Bajaj, S.; Gadewar, M.; Mishra, S.S.; Rath, S.K.; Dubey, A.K.; Kaithwas, G.; et al. Hypoxia induced lactate acidosis modulates tumor microenvironment and lipid reprogramming to sustain the cancer cell survival. Front. Oncol. 2023, 13, 1034205. [Google Scholar] [CrossRef] [Scilit] [PubMed]
- Boedtkjer, E.; Pedersen, S.F. The acidic tumor microenvironment as a driver of cancer. Annu. Rev. Physiol. 2020, 82, 103–126. [Google Scholar] [CrossRef] [Scilit] [PubMed]
- Eil, R.; Vodnala, S.K.; Clever, D.; Klebanoff, C.A.; Sukumar, M.; Pan, J.H.; Palmer, D.C.; Gros, A.; Yamamoto, T.N.; Patel, S.J.; et al. Ionic immune suppression within the tumour microenvironment limits T cell effector function. Nature 2016, 537, 539–543. [Google Scholar] [CrossRef] [Scilit] [PubMed]
- Feske, S.; Wulff, H.; Skolnik, E.Y. Ion channels in innate and adaptive immunity. Annu. Rev. Immunol. 2015, 33, 291–353. [Google Scholar] [CrossRef] [Scilit] [PubMed]
- Ohya, S.; Kito, H. Ca2+-activated K+ channel KCa3.1 as a therapeutic target for immune disorders. Biol. Pharm. Bull. 2018, 41, 1158–1163. [Google Scholar] [CrossRef] [Scilit] [PubMed]
- Ohya, S.; Matsui, M.; Kajikuri, J.; Kito, H.; Endo, K. Downregulation of IL-8 and IL-10 by the activation of Ca2+-activated K+ channel KCa3.1 in THP-1-derived M2 macrophages. Int. J. Mol. Sci. 2022, 23, 8603. [Google Scholar] [CrossRef] [Scilit] [PubMed]
- Matsui, M.; Kajikuri, J.; Kito, H.; Yamaguchi, Y.; Ohya, S. Transcriptional repression of CCL2 by KCa3.1 K+ channel activation and LRRC8A anion channel inhibition in THP-1-differentiated M2 macrophages. Int. J. Mol. Sci. 2025, 26, 7624. [Google Scholar] [CrossRef] [Scilit] [PubMed]
- Li, H.; Wu, M.; Zhao, X. Role of chemokine systems in cancer and inflammatory diseases. MedComm 2022, 3, e147. [Google Scholar] [CrossRef] [Scilit] [PubMed]
- Salkeni, M.A.; Naing, A. Interleukin-10 in cancer immunotherapy: From bench to bedside. Trends Cancer 2023, 9, 716–725. [Google Scholar] [CrossRef] [Scilit] [PubMed]
- Jin, K.; Qian, C.; Lin, J.; Liu, B. Cyclooxygenase-2-prostaglandin E2 pathway: A key player in tumor-associated immune cells. Front. Oncol. 2023, 13, 1099811. [Google Scholar] [CrossRef] [Scilit] [PubMed]
- Matos, A.; Carvalho, M.; Bicho, M.; Ribeiro, R. Arginine and arginases modulate metabolism, tumor microenvironment and prostate cancer progression. Nutrients 2021, 13, 4503. [Google Scholar] [CrossRef] [Scilit] [PubMed]
- Tan, J.W.Y.; Folz, J.; Kopelman, R.; Wang, X. In vivo photoacoustic potassium imaging of the tumor microenvironment. Biomed. Opt. Express 2020, 11, 3507–3522. [Google Scholar] [CrossRef] [Scilit] [PubMed]
- Rath, M.; Müller, I.; Kropf, P.; Closs, E.I.; Munder, M. Metabolism via arginase or nitric oxide synthase: Two competing arginine pathways in macrophages. Front. Immunol. 2014, 5, 532. [Google Scholar] [CrossRef] [Scilit] [PubMed]
- Zdanov, S.; Toussaint, O.; Debacq-Chainiaux, F. p53 and ATF-2 partly mediate the overexpression of COX-2 in H2O2-induced premature senescence of human fibroblasts. Biogerontology 2009, 10, 291–298. [Google Scholar] [CrossRef] [Scilit] [PubMed]
- Gao, Y.; Sun, W.; Shang, W.; Li, Y.; Zhang, D.; Wang, T.; Zhang, X.; Zhang, S.; Zhang, Y.; Yang, R. Lnc-C/EBPβ negatively regulates the suppressive function of myeloid-derived suppressor cells. Cancer Immunol. Res. 2018, 6, 1352–1363. [Google Scholar] [CrossRef] [Scilit] [PubMed]
- Wen, J.; Jiang, J.; Ma, X.; Wei, W.; Wu, X.; Yu, Y.; Xia, L. Tryptophan metabolism in tumor microenvironment and therapeutic implications. J. Adv. Res. 2026, 87, 825–840. [Google Scholar] [CrossRef] [Scilit] [PubMed]
- Lacher, S.B.; Dörr, J.; de Almeida, G.P.; Hönninger, J.; Bayerl, F.; Hirschberger, A.; Pedde, A.M.; Meiser, P.; Ramsauer, L.; Rudolph, T.J.; et al. PGE2 limits effector expansion of tumour-infiltrating stem-like CD8+ T cells. Nature 2024, 629, 417–425. [Google Scholar] [CrossRef] [Scilit] [PubMed]
- Santiso, A.; Heinemann, A.; Kargl, J. Prostaglandin E2 in the tumor microenvironment, a convoluted affair mediated by EP receptors 2 and 4. Pharmacol. Rev. 2024, 76, 388–413. [Google Scholar] [CrossRef] [Scilit] [PubMed]
- Grzywa, T.M.; Sosnowska, A.; Matryba, P.; Rydzynska, Z.; Jasinski, M.; Nowis, D.; Golab, J. Myeloid cell-derived arginase in cancer immune response. Front. Immunol. 2020, 11, 938. [Google Scholar] [CrossRef] [Scilit] [PubMed]
- Menjivar, R.E.; Nwosu, Z.C.; Du, W.; Donahue, K.L.; Hong, H.S.; Espinoza, C.; Brown, K.; Velez-Delgado, A.; Yan, W.; Lima, F.; et al. Arginase 1 is a key driver of immune suppression in pancreatic cancer. Elife 2023, 12, e80721. [Google Scholar] [CrossRef] [Scilit] [PubMed]
- Hannemann, N.; Jordan, J.; Paul, S.; Reid, S.; Baenkler, H.W.; Sonnewald, S.; Bäuerle, T.; Vera, J.; Schett, G.; Bozec, A. The AP-1 transcriptional factor c-Jun promotes arthritis by regulating cyclooxygenase-2 and arginase-1 expression in macrophages. J. Immunol. 2017, 198, 3605–3614. [Google Scholar] [CrossRef] [Scilit] [PubMed]
- Khanal, T.; Kim, H.G.; Do, M.T.; Choi, J.H.; Chung, Y.C.; Kim, H.S.; Park, Y.J.; Jeong, T.C.; Jeong, H.G. Genipin induces cyclooxygenase-2 expression via NADPH oxidase, MAPKs, AP-1, and NF-κB in RAW 264.7 cells. Food Chem. Toxicol. 2014, 64, 126–134. [Google Scholar] [CrossRef] [Scilit] [PubMed]
- Jessen, C.; Kreß, J.K.C.; Baluapuri, A.; Hufnagel, A.; Schmitz, W.; Kneitz, S.; Roth, S.; Marquardt, A.; Appenzeller, S.; Ade, C.P.; et al. The transcription factor NRF2 enhances melanoma malignancy by blocking differentiation and inducing COX2 expression. Oncogene 2020, 39, 6841–6855, Erratum in Oncogene 2021, 40, 1391. [Google Scholar] [CrossRef] [Scilit] [PubMed]
- Nagao, Y.; Amo-Shiinoki, K.; Nakabayashi, H.; Hatanaka, M.; Kondo, M.; Matsunaga, K.; Emoto, M.; Okuya, S.; Tanizawa, Y.; Tanabe, K. Gsk-3-mediated proteasomal degradation of ATF4 is a proapoptotic mechanism in mouse pancreatic β-cells. Int. J. Mol. Sci. 2022, 23, 13586. [Google Scholar] [CrossRef] [Scilit] [PubMed]
- Wei, T.; Wang, Y.; Xu, W.; Liu, Y.; Chen, H.; Yu, Z. KCa3.1 deficiency attenuates neuroinflammation by regulating an astrocyte phenotype switch involving the PI3K/AKT/GSK3β pathway. Neurobiol. Dis. 2019, 132, 104588. [Google Scholar] [CrossRef] [Scilit] [PubMed]
- Guo, W.; Zhang, Z.; Li, G.; Lai, X.; Gu, R.; Xu, W.; Chen, H.; Xing, Z.; Chen, L.; Qian, J.; et al. Pyruvate kinase M2 promotes prostate cancer metastasis through regulating ERK1/2-COX-2 signaling. Front. Oncol. 2020, 10, 544288, Erratum in Front. Oncol. 2024, 14, 1323020. [Google Scholar] [CrossRef] [Scilit] [PubMed]
- Na, W.; Zeng, W.; Song, K.; Wang, Y.; Wang, L.; Zhao, Z.; Jin, L.; Zhu, P.; Liang, W. PKM2, the “K+ sink” in the tumor interstitial fluid. Protein Cell 2025, 16, 303–308. [Google Scholar] [CrossRef] [Scilit] [PubMed]
- Chen, M.; Liu, H.; Li, Z.; Ming, A.L.; Chen, H. Mechanism of PKM2 affecting cancer immunity and metabolism in tumor microenvironment. J. Cancer 2021, 12, 3566–3574. [Google Scholar] [CrossRef] [Scilit] [PubMed]
- Cai, X.; Shang, L.; Li, Y.; Cao, Y.; Shi, F. Arginine transporters in human cancers: Emerging mechanisms and clinical implications. Biomolecules 2026, 16, 132. [Google Scholar] [CrossRef] [Scilit] [PubMed]
- Zhou, X.; Chen, B.; Zhang, Z.; Huang, Y.; Li, J.; Wei, Q.; Cao, D.; Ai, J. Crosstalk between tumor-associated macrophages and microRNAs: A key role in tumor microenvironment. Int. J. Mol. Sci. 2022, 23, 13258. [Google Scholar] [CrossRef] [Scilit] [PubMed]
- Yao, X.; Bie, B.; Wang, Z.; Chen, Y.; Sheng, L.; Li, M. MiR-223-3p promote microglia “M2” polarization by targeting FOXO3a in subarachnoid hemorrhage. J. Neuroimmunol. 2025, 406, 578677. [Google Scholar] [CrossRef] [Scilit] [PubMed]
- Cantoni, C.; Ghezzi, L.; Choi, J.; Cross, A.H.; Piccio, L. Targeting miR-223 enhances myeloid-derived suppressor cell suppressive activities in multiple sclerosis patients. Mult. Scler. Relat. Disord. 2023, 76, 104839. [Google Scholar] [CrossRef] [Scilit] [PubMed]
- Capobianco, A.; Rovere-Querini, P. Endometriosis, a disease of the macrophage. Front. Immunol. 2013, 4, 9. [Google Scholar] [CrossRef] [Scilit] [PubMed]
- Wang, X.; Wu, N.; Xue, Q. Macrophages in endometriosis: Key roles and emerging therapeutic opportunities—A narrative review. Reprod. Biol. Endocrinol. 2025, 23, 134. [Google Scholar] [CrossRef] [Scilit] [PubMed]
- Kobayashi, H.; Imanaka, S. Understanding the molecular mechanisms of macrophage polarization and metabolic reprogramming in endometriosis: A narrative review. Reprod. Med. Biol. 2022, 21, e12488. [Google Scholar] [CrossRef] [Scilit] [PubMed]
- Hogg, C.; Panir, K.; Dhami, P.; Rosser, M.; Mack, M.; Soong, D.; Pollard, J.W.; Jenkins, S.J.; Horne, A.W.; Greaves, E. Macrophages inhibit and enhance endometriosis depending on their origin. Proc. Natl. Acad. Sci. USA 2021, 118, e2013776118. [Google Scholar] [CrossRef] [Scilit] [PubMed]
- Zondervan, K.T.; Becker, C.M.; Missmer, S.A. Endometriosis. N. Engl. J. Med. 2020, 382, 1244–1256. [Google Scholar] [CrossRef] [Scilit] [PubMed]
- Kawasaki, R.; Kukimoto, I.; Nishio, E.; Otani, S.; Nishizawa, H.; Maeda, Y.; Iwata, A.; Fujii, T. Distinct cervical microbiome and metabolite profiles before and after menopause; implications for cervical cancer progression. Front. Cell. Infect. Microbiol. 2025, 15, 1589277. [Google Scholar] [CrossRef] [Scilit] [PubMed]
Disclaimer/Publisher’s Note: The statements, opinions and data contained in all publications are solely those of the individual author(s) and contributor(s) and not of MDPI and/or the editor(s). MDPI and/or the editor(s) disclaim responsibility for any injury to people or property resulting from any ideas, methods, instructions or products referred to in the content. |
© 2026 by the authors. Licensee MDPI, Basel, Switzerland. This article is an open access article distributed under the terms and conditions of the Creative Commons Attribution (CC BY) license.