


Abstract
Butidae is a family of teleost fishes with diverse morphological and ecological adaptations, including the marbled goby (Oxyeleotris marmorata), a large species of high economic value in Southeast and East Asia. The previous mitogenomic studies on cultured populations of O. marmorata from non-native habitats have provided limited insights into genetic divergence, structural variation, and evolutionary relationships. Hence, this study presented the complete mitochondrial genome of O. marmorata from its native habitat in Indonesia, providing structural characterization, assessment of genetic diversity, and matrilineal phylogenetic analysis. The circular mitogenome was 16,525 bp, comprising 37 genes and a non-coding control region (CR). The gene organization and strand distribution were conserved among Oxyeleotris species, with 28 genes on the heavy strand and nine on the light strand, and a pronounced A+T compositional bias. The comparative analyses of O. marmorata (from both native and cultured habitats) and Oxyeleotris lineolata mitogenomes revealed minor variations in intergenic spacers, gene overlaps, protein-coding gene (PCGs) lengths, and codon usage patterns. Conversely, the nonsynonymous and synonymous substitution ratios observed in species of the family Butidae and its closest related family (Eleotridae) indicate strong purifying selection in the present dataset. Notably, the ATG was the predominant start codon, whereas the COI gene utilized GTG, and amino acid composition analysis demonstrated high frequencies of arginine, leucine, and serine. Most transfer RNAs retained the canonical cloverleaf secondary structure except for trnS1, which lacked a functional dihydrouridine arm, whereas the CR contained four conserved sequence blocks with variable nucleotide motifs and no detectable tandem repeats. The haplotype analysis of native (Indonesia) and introduced populations (China) highlighted three haplotypes with high diversity (Hd = 1.0000) and substantial nucleotide variation (π = 0.6667). The genetic divergence across 13 PCGs was gene-specific, with COI and ND5 showing the highest variation, while ND4L and ATP8 were highly conserved. The phylogenetic analyses based on concatenated 13 PCGs using both Bayesian Inference and Maximum Likelihood methods revealed that Oxyeleotris forms a monophyletic clade and is closely related to Bostrychus sinensis. In addition, the broader phylogenetic framework inferred the matrilineal relationships within the family Butidae and its closest related family, Eleotridae. This study also recommends expanding analyses to include the mitogenomes of the remaining 17 Oxyeleotris species, together with comprehensive genomic data, to further elucidate their genetic architecture, evolutionary history, and ecological adaptability across diverse aquatic ecosystems.
1. Introduction
The family Butidae comprises teleost fishes within the order Gobiiformes, commonly known as sleeper gobies or gudgeons [1,2]. Initially, this group was classified as a subfamily (=Butinae) within Eleotridae, but a taxonomic revision in the fifth edition of Fishes of the World recognized Butidae as a distinct family [1]. This reclassification is corroborated by molecular phylogenetic analyses, which reveal that Butidae constitutes a sister clade to Eleotridae [3,4,5,6]. Currently, Butidae encompasses 57 valid species under 12 genera, distributed widely in tropical and subtropical freshwater and brackish habitats in Africa, Asia, Australia, and Oceania, with the highest diversity observed in Papua New Guinea, Australia, and New Zealand [2,3]. Morphologically, members of this family are characterized by a robust, cylindrical body, dorsal fins with spines and rays, pelvic fins that are not connected by a membrane, relatively thick scales, and a typical body length of 10–25 cm [7,8]. Most species are benthic due to the absence of a swim bladder, and their high tolerance to hypoxia and salinity variation makes them valuable model organisms for experimental studies in physiology and ecology [9,10,11]. Therefore, morphological diversity, behavioral strategies, and ecological adaptations within this family reflect their ability to colonize and survive across a range of aquatic habitats [12].
Within Butidae, the genus Oxyeleotris currently includes 19 valid species, distributed from the Sundarbans (India) and Yunnan (China) to mainland and island Southeast Asia, Australia, and Oceania [2]. While most species of Butidae are small, the marbled goby (Oxyeleotris marmorata) is notable as a large freshwater species, reaching up to 65 cm in length, with significant value in both aquaculture and the ornamental fish trade [13,14,15]. This species is well-known for its rapid growth, prolonged aerial survival via air breathing, and demersal predatory behavior feeding on small fish, crustaceans, and aquatic invertebrates [13,16,17]. Its natural habitats incorporate rivers, lakes, swamps, and canals, particularly within the Mekong and Chao Phraya basins, Cambodia, Thailand, Malaysia, Singapore, Indochina, Philippines, and Indonesia [2,14,18]. Outside its native range, O. marmorata has been introduced to China via Thailand, where it has hybridized with the native Chinese goby, Bostrychus sinensis [19,20]. This phenomenon likely results from close phylogenetic affinity and overlapping habitat preferences, and may have been deliberately facilitated through artificial interspecific hybridization for aquaculture purposes [19,20,21,22,23]. Although such hybridization can confer commercial benefits in aquaculture, the introduction of O. marmorata into non-native ecosystems may poses ecological risks, including potential threats to native goby populations and disruption of its genomic integrity [19]. Moreover, O. marmorata is traditionally believed to possess therapeutic properties, often consumed post-surgery or postpartum to accelerate recovery, further increasing its market demand and economic value in Southeast and East Asia [13,14,20].
Beyond ecological and economic significance, the mitochondrial genomic studies of O. marmorata have previously been conducted on specimens from aquaculture in China, outside their native range [19,20]. The mitogenome is a powerful molecular marker in phylogenetic and evolutionary studies due to its compact structure, high copy number, rapid mutation rate, and lack of recombination [24,25]. In vertebrates, the mitogenome typically consists of circular DNA (~16–17 kb) encoding 37 genes, including 13 protein-coding genes (PCGs), two ribosomal RNA (rRNA) genes, 22 transfer RNA (tRNA) genes, and a non-coding control region (CR) critical for replication and transcription [26,27]. Due to maternal inheritance and high resolution in distinguishing closely related species, the mitogenomic data are extensively used for species identification, population genetics, and phylogeography in many teleosts [28,29]. The comparative mitogenomic analyses have also provided key insights into genetic diversity, lineage divergence, and adaptive evolution in gobies [30,31]. However, the previous studies on O. marmorata have lacked in-depth insights into structural variation, genetic diversity, and detailed matrilineal phylogenetic interpretations. This highlights the need for comprehensive mitogenomic analysis of this species from its native range to understand genetic variation relative to cultured specimens and to elucidate the phylogenetic relationships. In light of these considerations, the present study aims to: (i) generate the complete mitogenome of O. marmorata from its native range in Indonesia; (ii) provide a detailed structural characterization and comparative assessment of mitogenomic variation among Oxyeleotris congeners, including O. marmorata from both native and non-native ranges; and (iii) evaluate the genetic diversity and matrilineal phylogenetic relationships of the family Butidae and its closest related family, Eleotridae. By integrating mitogenomic data with in-depth genetic analyses, this study provides new insights into the systematics and genetic diversity of O. marmorata, particularly across native and non-native populations.
2. Results
2.1. Mitogenome Structure and Organization
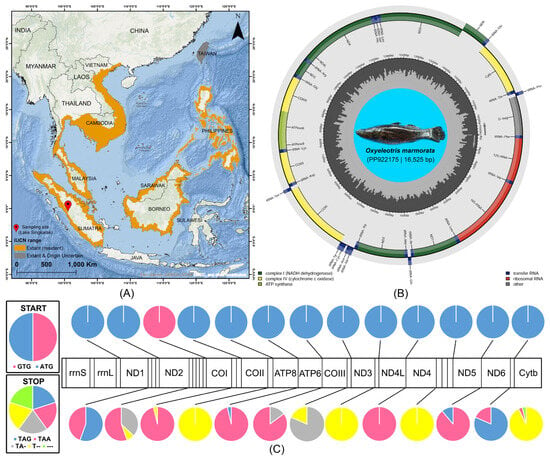
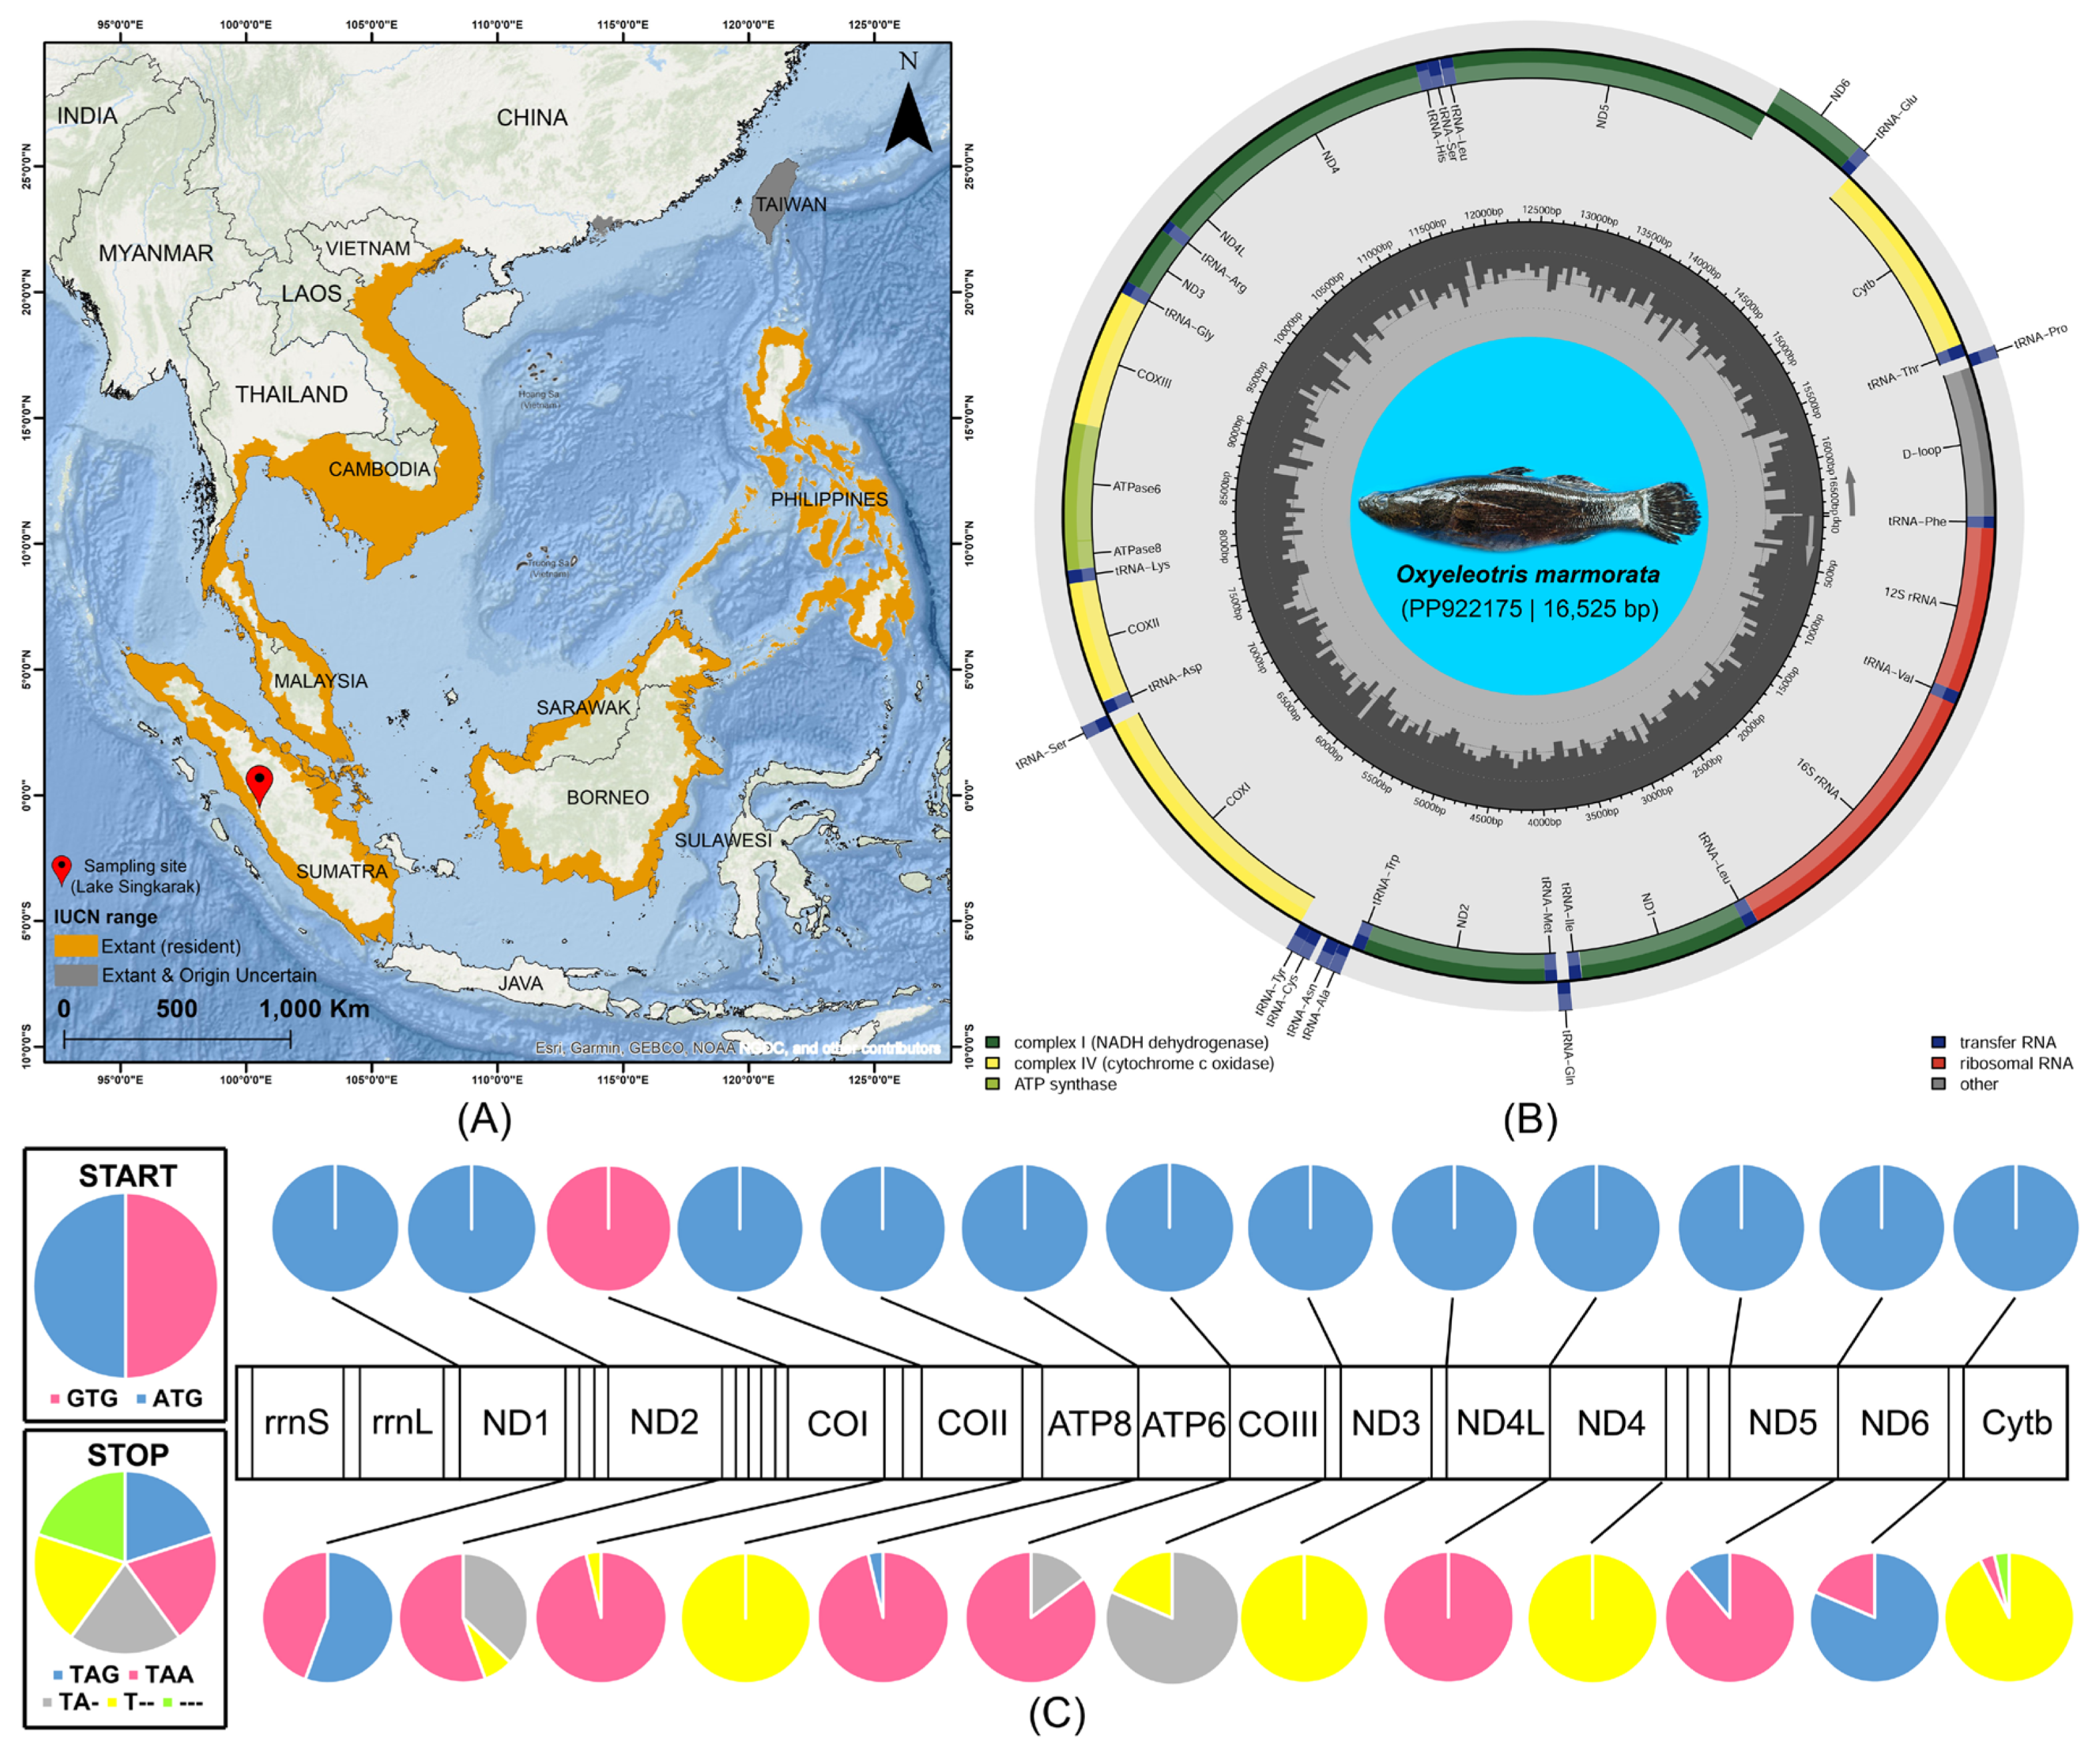
In this study, the complete circular mitogenome of O. marmorata from its native range in Indonesia, with a length of 16,525 bp, was successfully sequenced and deposited in GenBank under accession number PP922175 (Figure 1B). The comparative analysis indicated that mitogenome sizes among Oxyeleotris species range from 16,519 bp in O. lineolata (KP684140) to 16,555 bp in O. marmorata (KJ595342). The newly assembled genome contained 37 genes (13 PCGs, two rRNAs, 22 tRNAs, and one CR), with conserved gene content and overall gene order across all analyzed Oxyeleotris mitogenomes (Table 1 and Table 2). Among them, 28 genes (12 PCGs, two rRNAs, and 14 tRNAs) are encoded on the heavy (H) strand, whereas the remaining nine genes (ND6 and eight tRNAs) are located on the light (L) strand. The nucleotide composition of the newly sequenced O. marmorata mitogenome exhibited an A+T bias of 53.67%, comprising 28.73% A, 24.94% T, 15.47% G, and 30.86% C. In comparison, other Oxyeleotris mitogenomes showed slight variation, with A+T content ranging from 53.54% in O. marmorata (KJ595342) to 53.90% in O. lineolata (KP684140). The AT-skew and GC-skew of the newly sequenced mitogenome were 0.070 and −0.332, respectively. Among other Oxyeleotris mitogenomes, AT-skew values ranged from 0.066 in O. marmorata (KJ595342) and O. lineolata (KP684140) to 0.075 in O. lineolata (KP663727), while GC-skew values varied between −0.334 in O. lineolata (KP663727) and −0.326 in O. lineolata (KP684140) (Table 2).
Figure 1.
(A) The biogeographic distribution pattern of O. marmorata across Southeast and East Asia is illustrated based on the presence of extant (resident) range as well as uncertain origins. The sampling location of O. marmorata is marked with a red pin. (B) The complete mitogenome of O. marmorata (PP922175), obtained from its natural habitat in Lake Singkarak, Sumatra, Indonesia. The colored arcs indicate the positions of various genes, including PCGs, tRNAs, rRNAs, and CR. The species photograph was taken by Hamdani from Jakarta Technical University of Fisheries, Indonesia. (C) The start and stop codon usage frequencies in the 13 PCGs of O. marmorata and selected other Butidae and Eleotridae species are presented to illustrate genetic variation.
Table 1.
Annotated genes in the newly sequenced mitochondrial genome of O. marmorata (PP922175), including gene positions, strand orientation, lengths, and intergenic nucleotide regions.
Table 2.
Nucleotide composition of mitogenomes across different Oxyeleotris species.
2.2. Intergenic Spacer and Overlapping Regions
Analysis of intergenic spacers and gene overlaps among Oxyeleotris species, including three O. marmorata and two O. lineolata sequences, revealed notable variation in both the length and distribution of these features (Supplementary Table S2). The newly sequenced O. marmorata mitogenome (PP922175) contained 11 intergenic spacers totaling 65 bp and seven overlapping regions totaling 25 bp. Conversely, the longest intergenic spacer (37 bp) was located between trnN and trnC on the light strand, whereas the longest overlap (10 bp) was occurred between ATP8 and ATP6 on the heavy strand. Several genes, including trnF, trnL2, trnM, COII, trnG, trnR, ND4, trnH, trnL1, ND6, Cytb, and CR consistently lacked both intergenic spacers and overlaps across all analyzed mitogenomes. Conserved spacer lengths were observed between trnN and ND1 (37 bp and 3 bp, respectively) in all sequences, while other genes (trnW, trnA, trnY, trnS2, trnK, trnE) exhibited uniform intergenic spacers ranging from 1 to 5 bp. The ATP8–ATP6 gene pair displayed a conserved 10 bp overlap across all sequences. Despite these conserved patterns, interspecific and inter-accession variation was detected in several regions. Specifically, the spacer downstream of trnD measured 6 bp in O. marmorata (PP922175 and KJ595342), 11 bp in O. marmorata (KF711995), and 6 bp and 5 bp in O. lineolata (KP663727 and KP684140), respectively. The longest overlapping region in other mitogenomes was observed between ND5 and ND6, reaching 12 bp in O. marmorata (KJ595342) and O. lineolata (KP663727). Additional overlaps were also identified among 12S rRNA, trnV, trnI, trnQ, ND2, trnC, ATP6, COIII, ND3, ND4L, ND5, and trnT, with overlap lengths ranging from 1 to 12 bp (Supplementary Table S2).
2.3. Protein-Coding Genes Features
The newly sequenced of O. marmorata in this study contained 13 PCGs with a total length of 11,431 bp, representing 69.17% of the entire mitogenome. Among these PCGs, ATP8 was the shortest gene (168 bp), whereas ND5 was the longest (1824 bp) (Table 1). In comparison, the total lengths of PCGs in other Oxyeleotris mitogenomes ranged from 11,419 bp in O. lineolata (KP684140) to 11,453 bp in O. marmorata (KJ595342). The PCGs of the newly sequenced O. marmorata exhibited an A+T content of 53.08%, while in other species, this value ranged from 52.90% in O. marmorata (KJ595342) to 53.45% in O. lineolata (KP684140). The AT-skew and GC-skew of the PCGs in the newly sequenced mitogenome were −0.022 and −0.362, respectively. For other Oxyeleotris mitogenomes, AT-skew values ranged from −0.028 in O. marmorata (KJ595342) to −0.017 in O. lineolata (KP663727), and GC-skew values ranged from −0.362 in other O. marmorata sequences and O. lineolata (KP663727) to −0.358 in O. lineolata (KP684140) (Table 2). Moreover, the analysis of start and stop codon usage across 13 PCGs of 25 butid and eleotrid species in 27 sequences revealed consistent patterns (Supplementary Table S3). The ATG codon was the predominant initiation codon for all PCGs, except for COI, which consistently used GTG across all species examined. In contrast, stop codon usage was more variable, with TAA being the most frequently observed, appearing in ND1 (44.44%), ND2 (55.56%), COI and ATP8 (96.30%), ATP6 (85.19%), ND4L (100%), ND5 (88.89%), ND6 (18.52%), and Cytb (3.70%). The TAG codon was also detected in ND1 (55.56%), ATP8 (3.70%), ND5 (11.11%), and ND6 (81.48%). Incomplete stop codons (TA- and T--) were commonly observed in ND2, COI, COII, ATP6, COIII, ND3, ND4, and Cytb across several species. Notably, in Gobiomorus dormitor, the Cytb gene lacked a recognizable stop codon (---), likely due to the shorter mitogenome length in this species, resulting in the absence of the expected stop codon at the anticipated position (Figure 1C; Supplementary Table S3).
2.4. Substitutions Pattern and Relative Synonymous Codon Usage
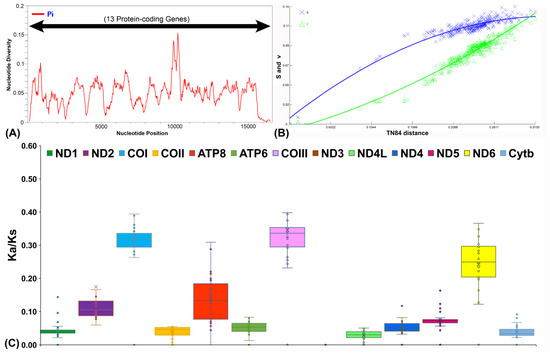
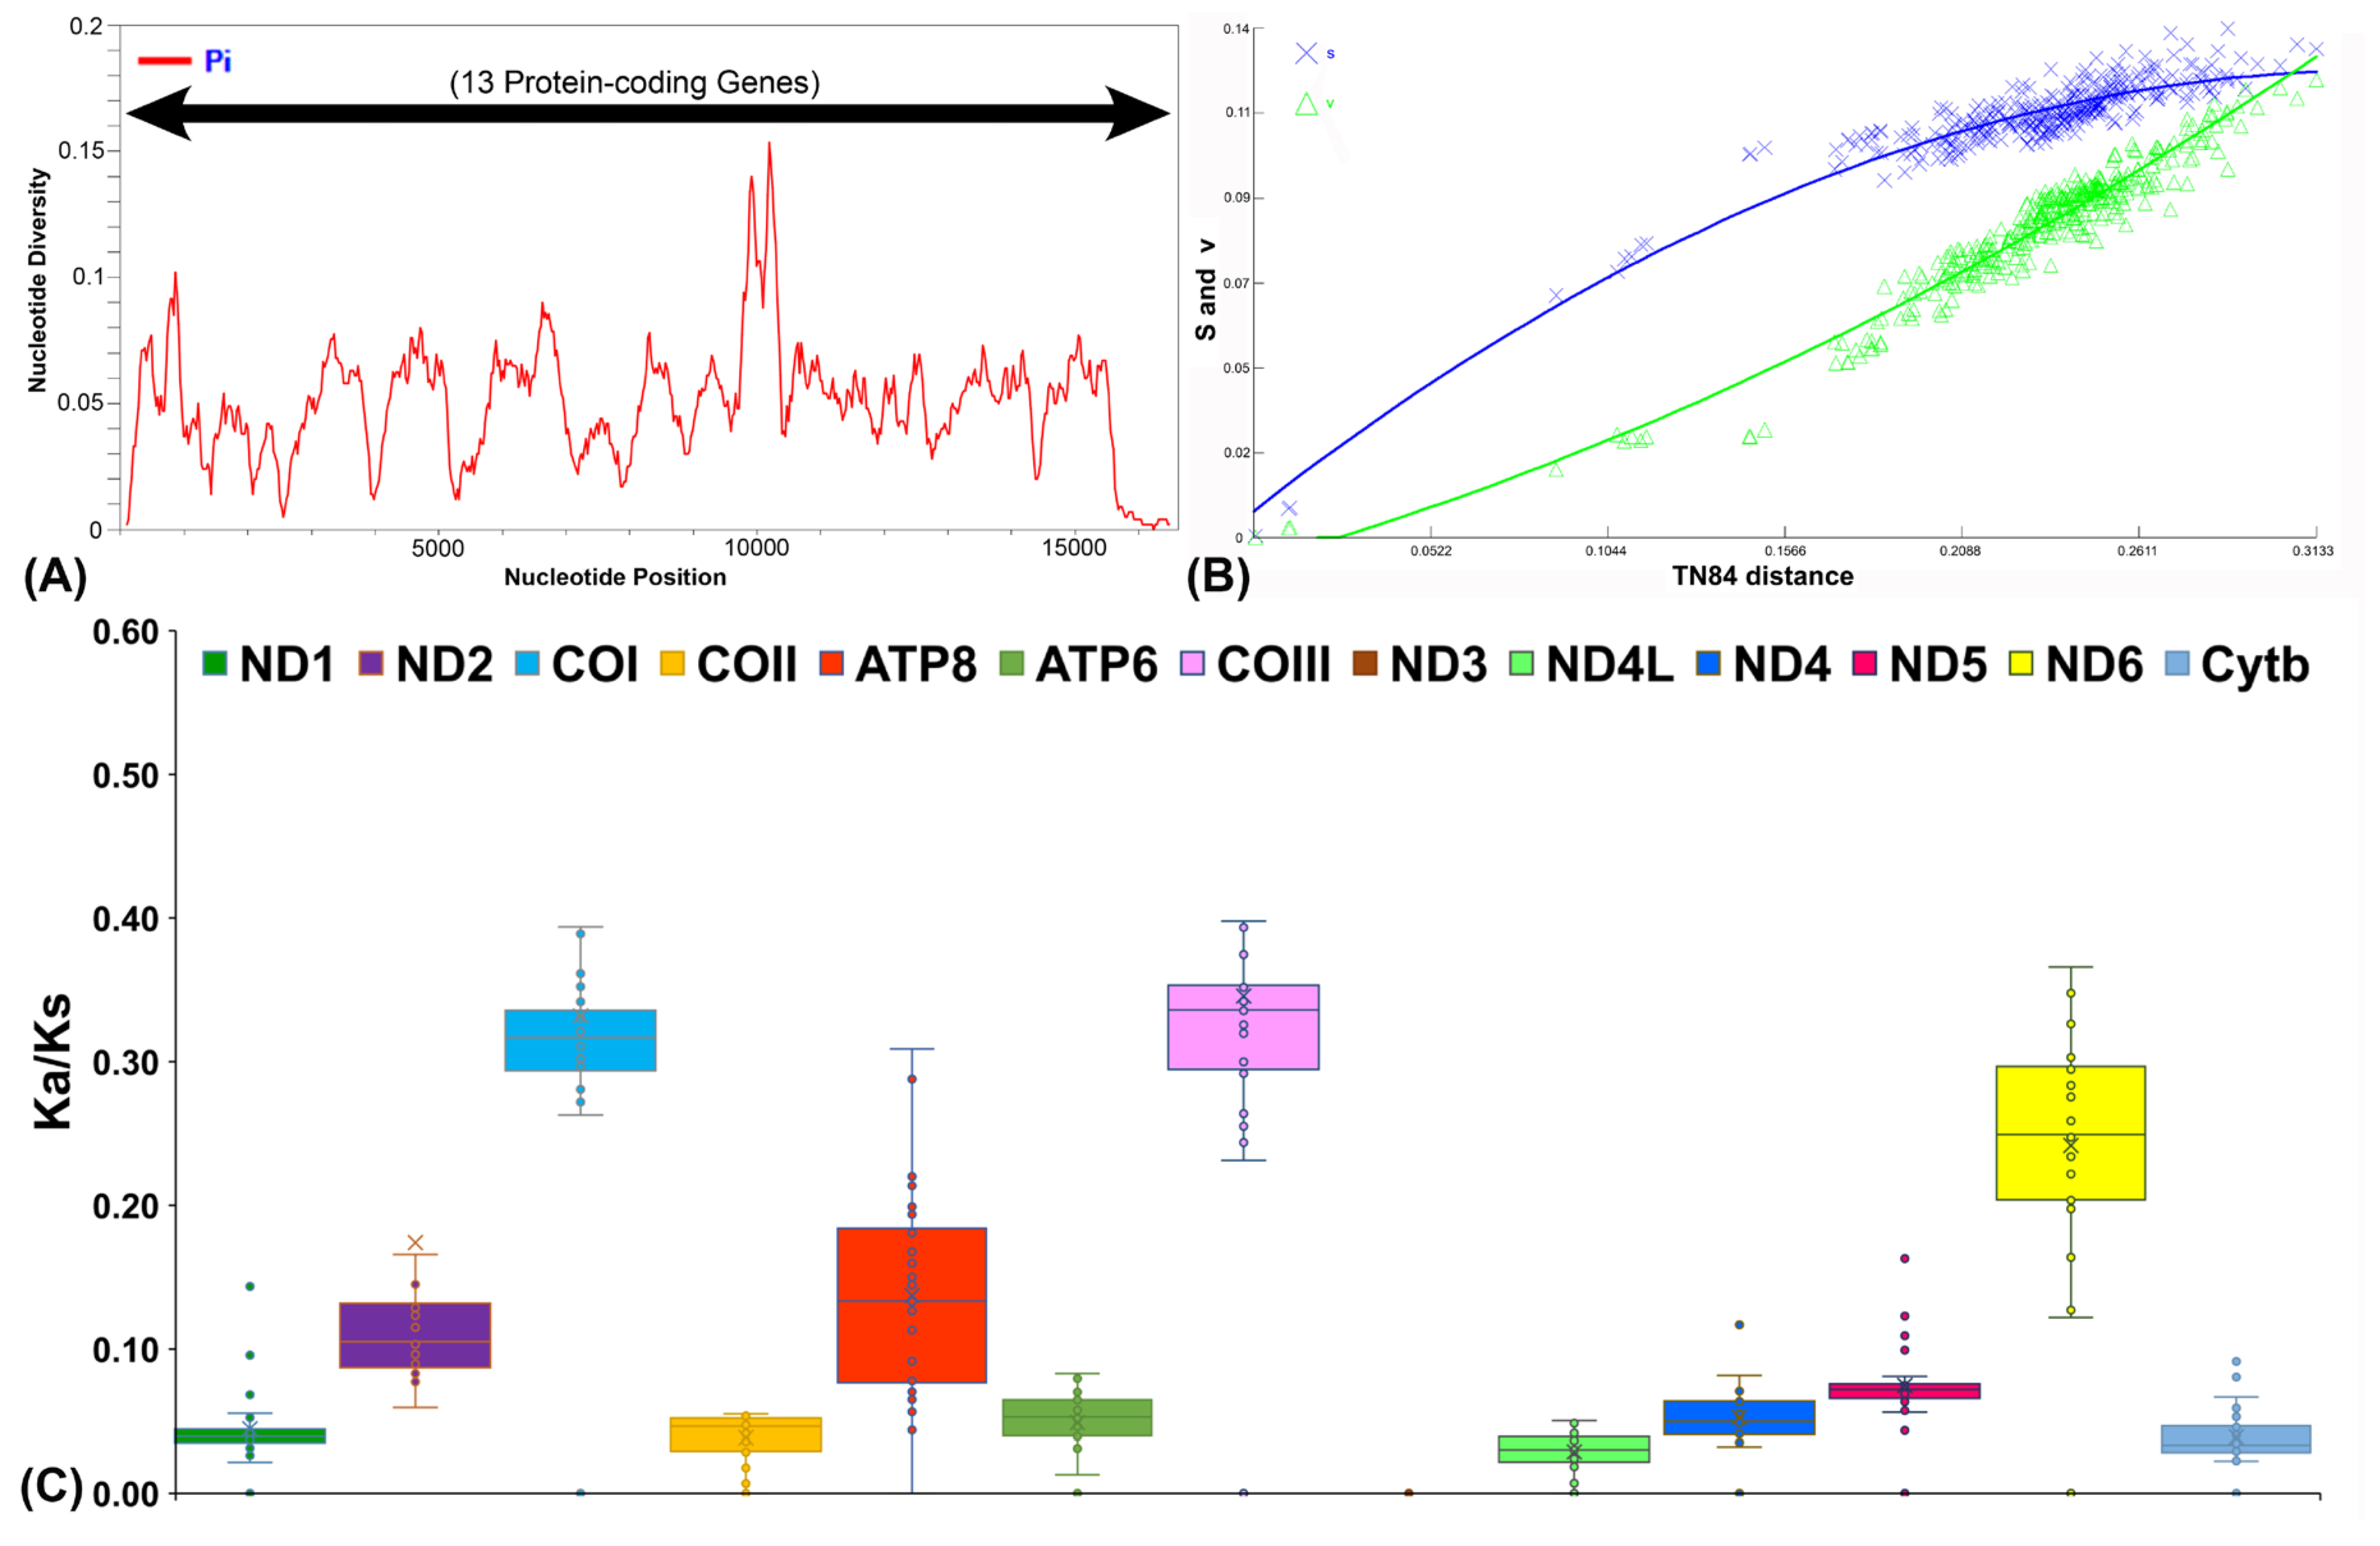
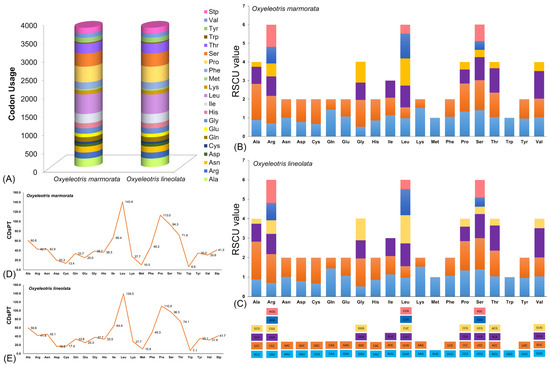
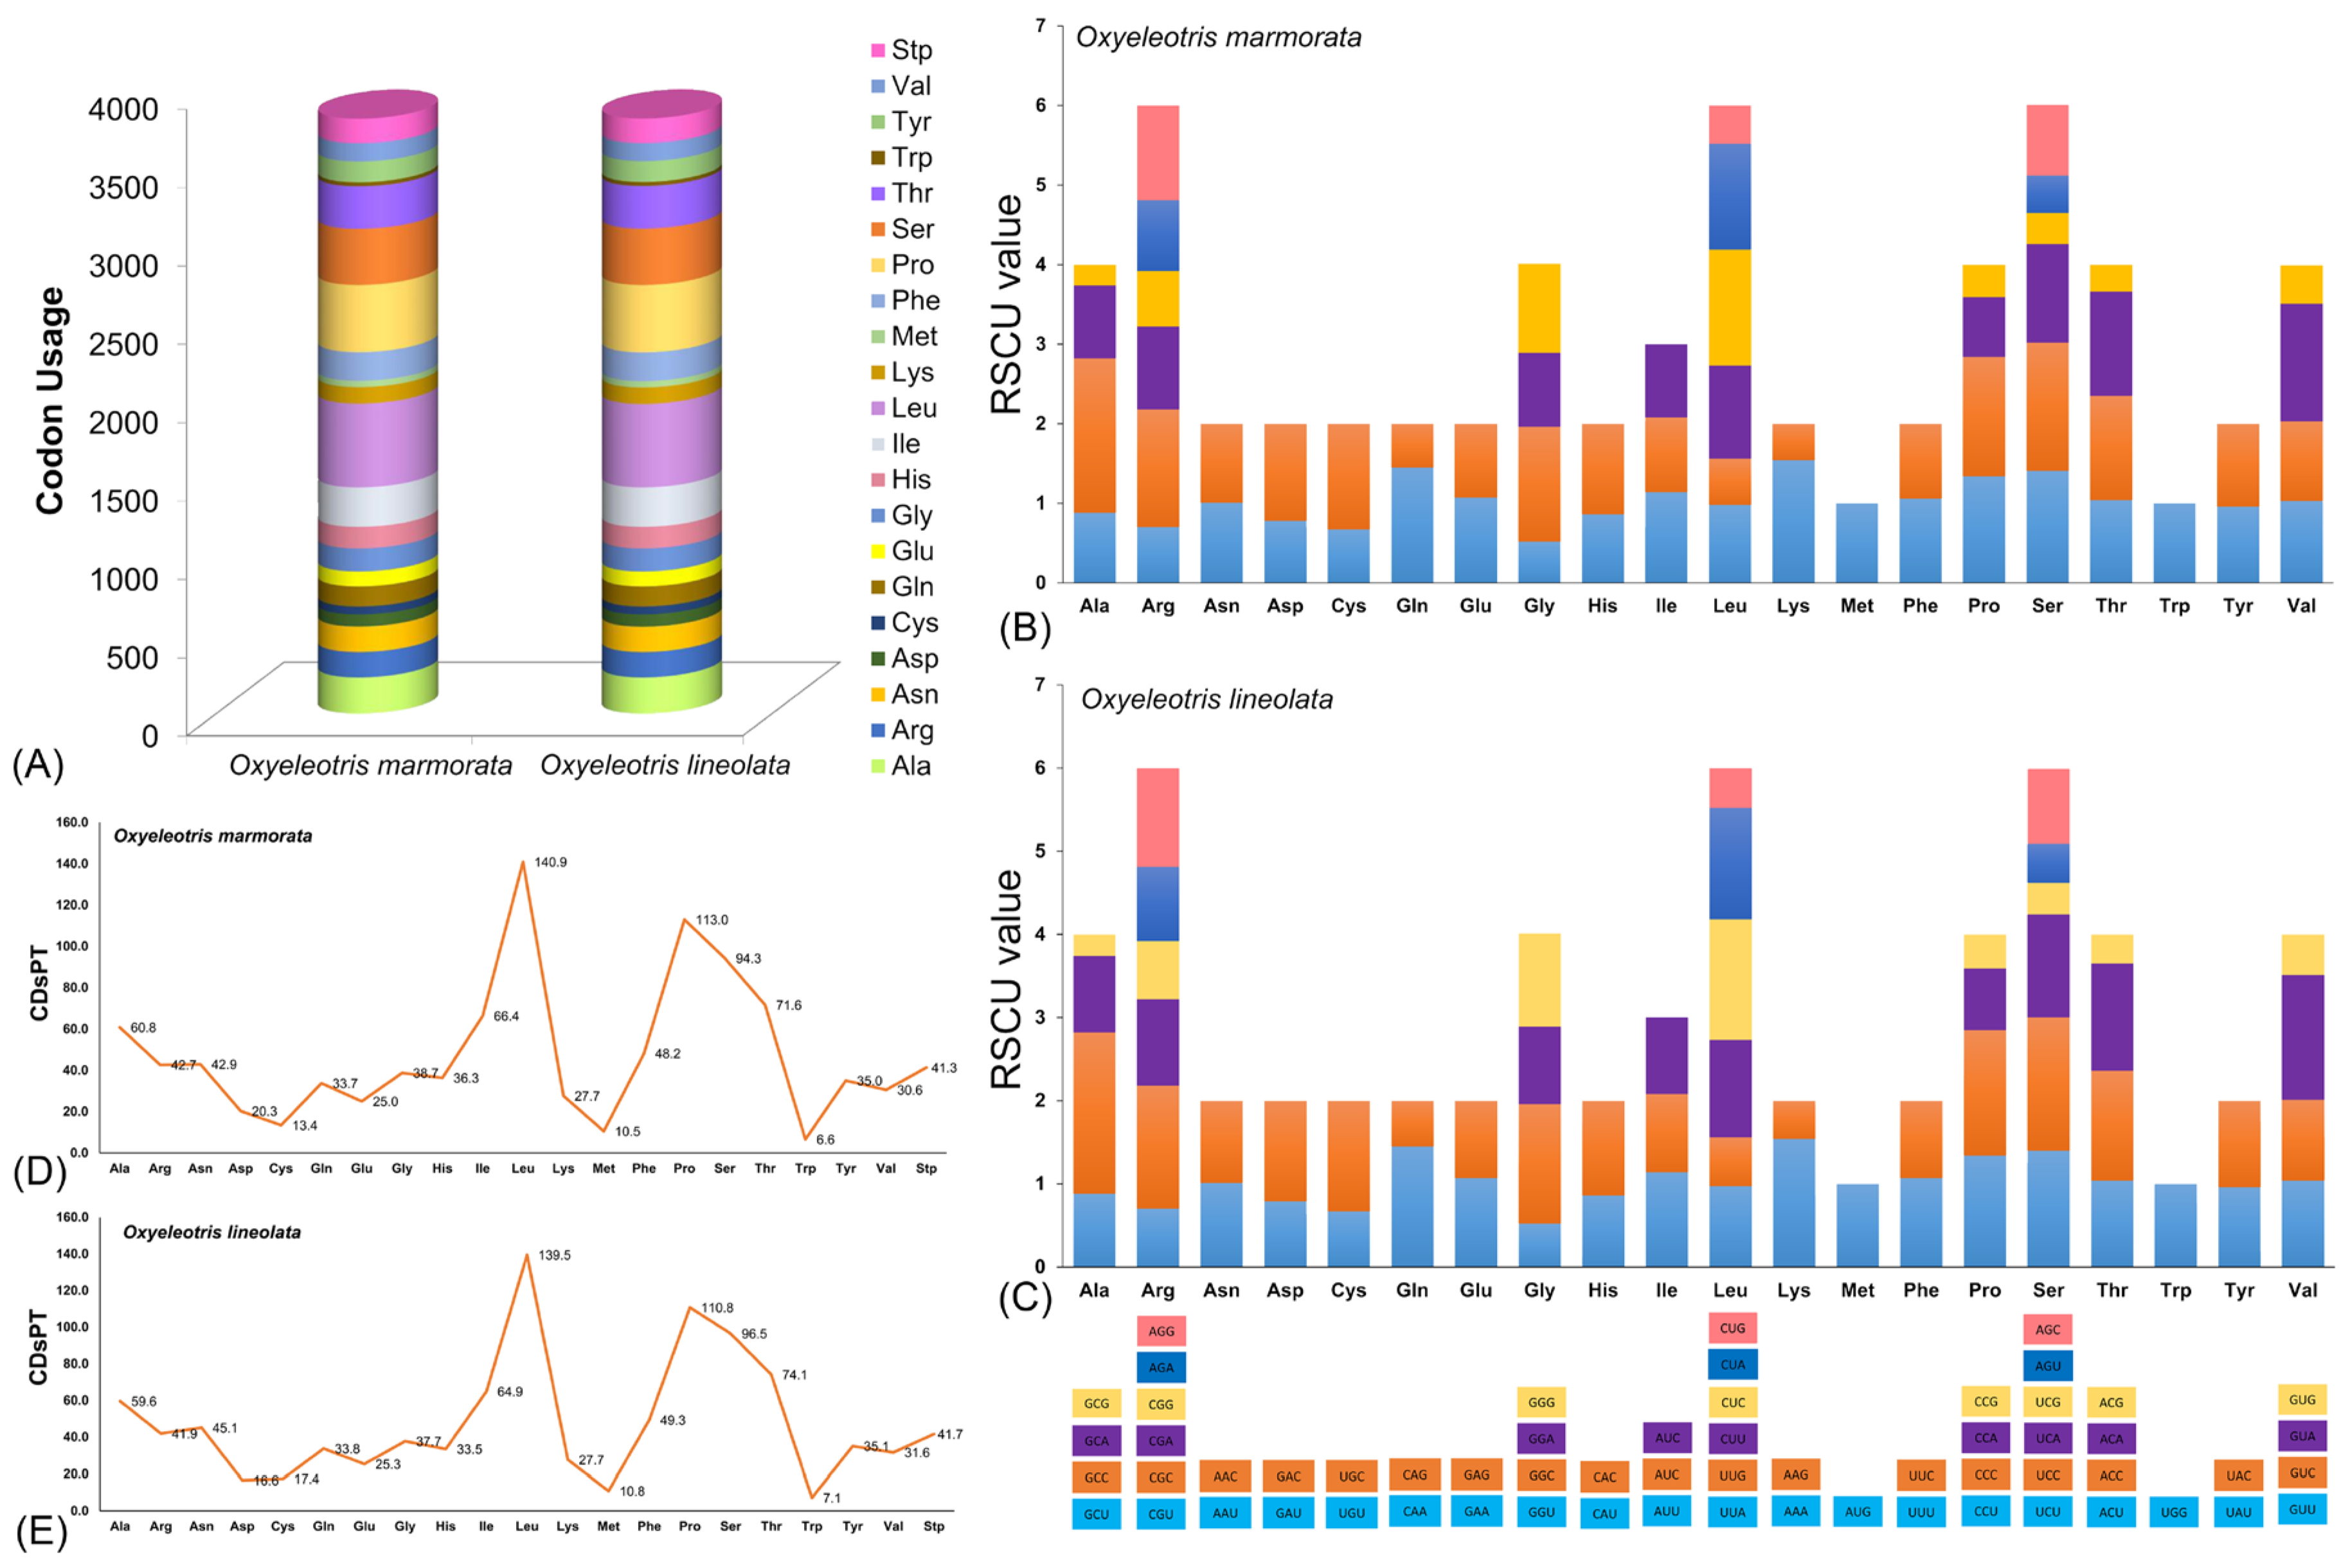
In this study, the nucleotide diversity of the assembled PCGs was assessed using a sliding window approach, revealing an average nucleotide diversity (π) of 0.04934 and identifying 1970 polymorphic sites across Oxyeleotris species (Figure 2A). The saturation analysis indicated no evidence of saturation for either transitions or transversions, as TN84 divergence values continued to rise across all PCGs of the Oxyeleotris species (Figure 2B). To investigate evolutionary pressures on homologous genes, the Ka/Ks ratio was calculated for the newly sequenced O. marmorata and compared with other species in the Butidae and Eleotridae families. The Ka/Ks values ranged from 0.05256 ± 0.02098 for ND4L to 1.84269 ± 0.88966 for ND3, following the order: ND4L < COII < Cytb < ND1 < ATP6 < ND4 < ND5 < ATP8 < ND2 < ND6 < COI < COIII < ND3 (Figure 2C; Supplementary Table S4). The analysis of codon usage in O. marmorata and O. lineolata revealed that arginine, leucine, and serine were the most frequently used amino acids in PCGs, whereas methionine and tryptophan occurred less frequently (Figure 3A; Supplementary Table S5). The RSCU analysis further indicated that the GCG codon for alanine was notably underrepresented compared to other codons in both species (Figure 3B,C; Supplementary Table S5). The CDsPT in O. marmorata and O. lineolata showed broadly similar patterns, although some variation was observed among species. The leucine displayed the highest CDsPT values, spanning 139.5 in O. lineolata to 140.9 in O. marmorata, whereas tryptophan and methionine were less abundant, with tryptophan varying between 6.6 (O. marmorata) and 7.1 (O. lineolata) and methionine covering 10.5 (O. marmorata) to 10.8 (O. lineolata) (Figure 3D,E; Supplementary Table S6).
Figure 2.
(A) The plot displays nucleotide diversity (π) for mitochondrial PCGs across Oxyeleotris species. (B) The line scatter plot illustrates the relationship between transitions (s) and transversions (v) with genetic divergence in PCGs, based on TN84 distances. (C) The box plot shows the pairwise Ka/Ks ratios for each PCG among representative Butidae and Eleotridae species, including O. marmorata.
Figure 3.
(A) The codon usage abundance in the mitogenomes of Oxyeleotris species (O. marmorata and O. lineolata). (B,C) The comparative analysis of RSCU in Oxyeleotris species (O. marmorata and O. lineolata), with collective RSCU values plotted on the y-axis against codons corresponding to each amino acid on the x-axis. (D,E) Codon distribution per thousand codons for all amino acids in the mitogenomes of Oxyeleotris species (O. marmorata and O. lineolata).
2.5. Ribosomal and Transfer RNA Genes
The newly sequenced of O. marmorata (PP922175) contained two rRNA genes with a combined length of 2639 bp and 22 tRNA genes totaling 1559 bp, representing 15.97% and 9.43% of the mitogenome, respectively (Table 1). The comparative analysis across available Oxyeleotris mitogenomes revealed that total rRNA length ranged from 2615 bp in O. lineolata (KP684140) to 2640 bp in O. lineolata (KP663727). The rRNA genes exhibited an A+T compositional bias, with values ranging from 53.28% in O. marmorata (PP922175) to 53.54% in O. lineolata (KP684140). The rRNA AT-skew values varied from 0.239 in O. lineolata (KP684140) to 0.268 in O. lineolata (KP663727), while GC-skew values ranged from −0.151 in O. lineolata (KP663727) to −0.141 in O. marmorata (KJ595342). In comparison, the total tRNA length among Oxyeleotris species ranged from 1485 bp in O. marmorata (KF711995) to 1575 bp in O. marmorata (KJ595342). The tRNA genes also demonstrated A+T bias, with proportions ranging from 54.95% in O. marmorata (KF711995) to 55.16% in O. marmorata (PP922175) and O. lineolata (KP663727). The AT-skew values for tRNAs ranged from 0.025 in O. lineolata (KP684140) to 0.156 in O. marmorata (PP922175), while the GC-skew values ranged from −0.147 in O. marmorata (PP922175) to 0.037 in O. lineolata (KP684140) (Table 2). Furthermore, almost all Oxyeleotris species exhibited fully conserved anticodon sequences across the complete set of 22 tRNAs, except for trnW in O. marmorata (KJ595342), which lacked a detectable anticodon (Supplementary Table S7). The majority of tRNAs in the newly sequenced O. marmorata (PP922175) conformed to the canonical cloverleaf secondary structure, with the exception of trnS1, which lacked a functional dihydrouridine (DHU) arm. The structural assessment revealed that 12 tRNAs (trnF, trnQ, trnW, trnA, trnN, trnC, trnY, trnS2, trnD, trnG, trnE, and trnP) contained both canonical Watson–Crick base pairing (A–T and G≡C) and wobble pairing (G–T), whereas the remaining 10 tRNAs (trnV, trnL2, trnI, trnM, trnK, trnR, trnH, trnS1, trnL1, and trnT) exhibited only canonical Watson–Crick pairing (Supplementary Figure S1).
2.6. Characteristics of Control Region
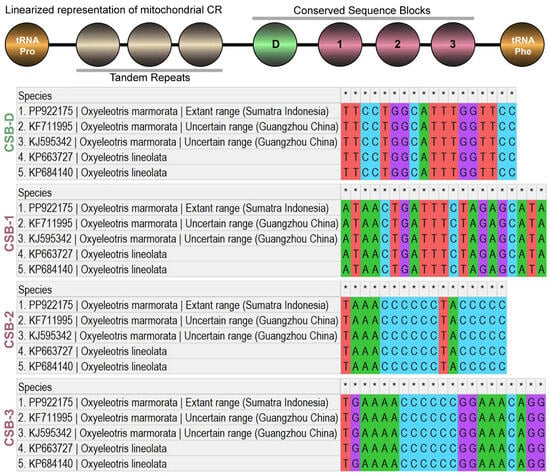
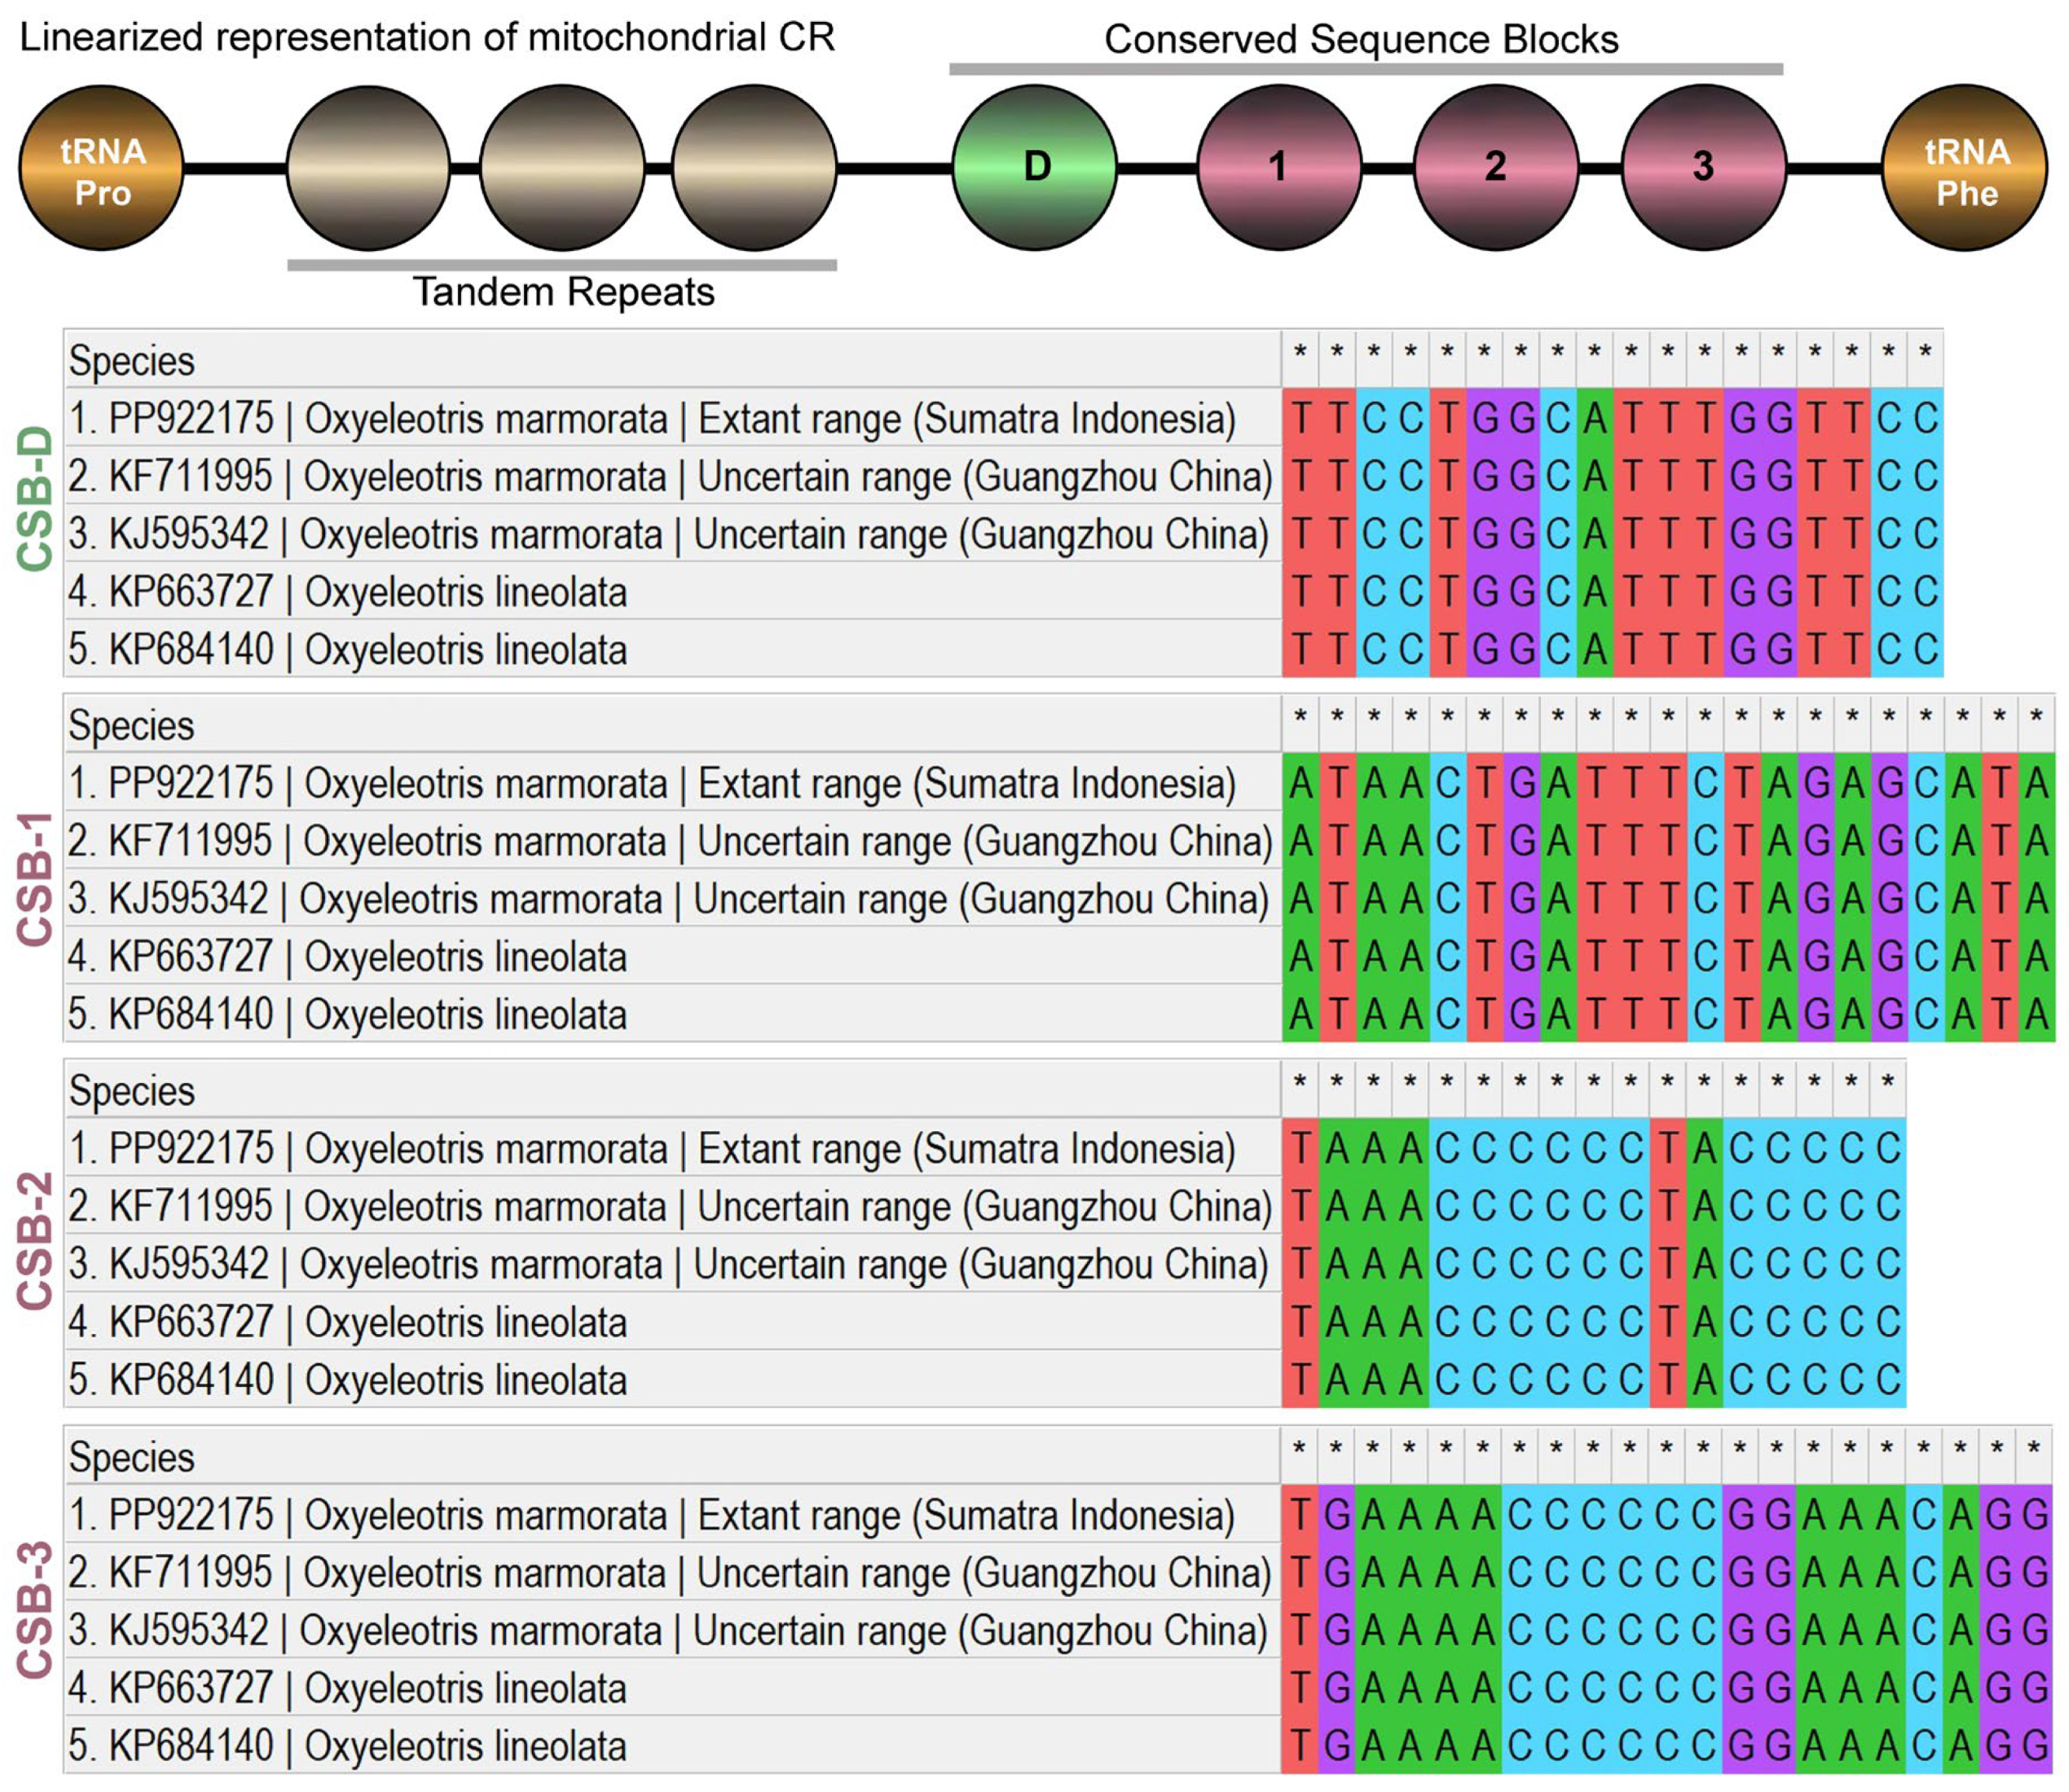
The CR in the newly sequenced of O. marmorata was 856 bp in length, accounting for 5.18% of the total mitogenome (Table 1). The comparative analysis across different Oxyeleotris mitogenomes revealed slight variation in CR length, ranging from 856 bp in O. marmorata (KF711995) and O. lineolata (KP663727) to 858 bp in O. lineolata (KP684140). The CR of the newly sequenced O. marmorata also exhibited an A+T bias of 60.98%, with an AT-skew of −0.011 and a GC-skew of −0.144. By comparison, other Oxyeleotris mitogenomes showed A+T bias values in the CR ranging from 59.09% in O. lineolata (KP684140) to 61.21% in O. marmorata (KF711995) and O. lineolata (KP663727). The AT-skew values ranged from −0.015 in O. marmorata (KF711995) and O. lineolata (KP663727) to −0.004 in O. marmorata (KJ595342), while the GC-skew values ranged from −0.146 in O. marmorata (KJ595342) and O. lineolata (KP684140) to −0.139 in O. marmorata (KF711995) and O. lineolata (KP663727) (Table 2). Additionally, detailed mitogenomic analysis of O. marmorata and O. lineolata identified four conserved sequence blocks (CSBs) within the CR: CSB-D, CSB-1, CSB-2, and CSB-3. Although these elements are conserved, the comparative analysis revealed notable nucleotide variability, particularly in CSB-1 and CSB-3 (21 bp each), whereas CSB-D and CSB-2 were shorter, measuring 18 bp and 17 bp, respectively (Figure 4). Furthermore, no tandem repeats were detected in the CR among Oxyeleotris congeners.
Figure 4.
The schematic evaluation of nucleotide composition and the length of conserved domains within the CR of O. marmorata from Sumatra (Indonesia), two O. marmorata sequences from Guangzhou (China), and two O. lineolata sequences. A general linear representation is shown at the top, with highly conserved nucleotides indicated by small black star symbols.
2.7. Haplotype Diversity and Genetic Divergence
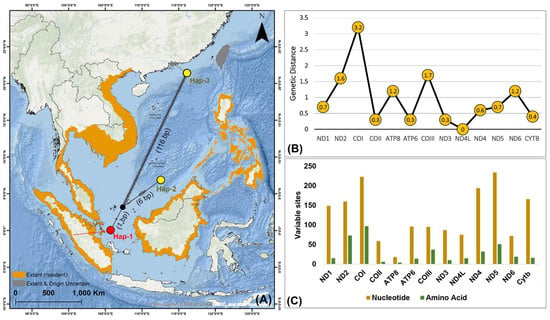
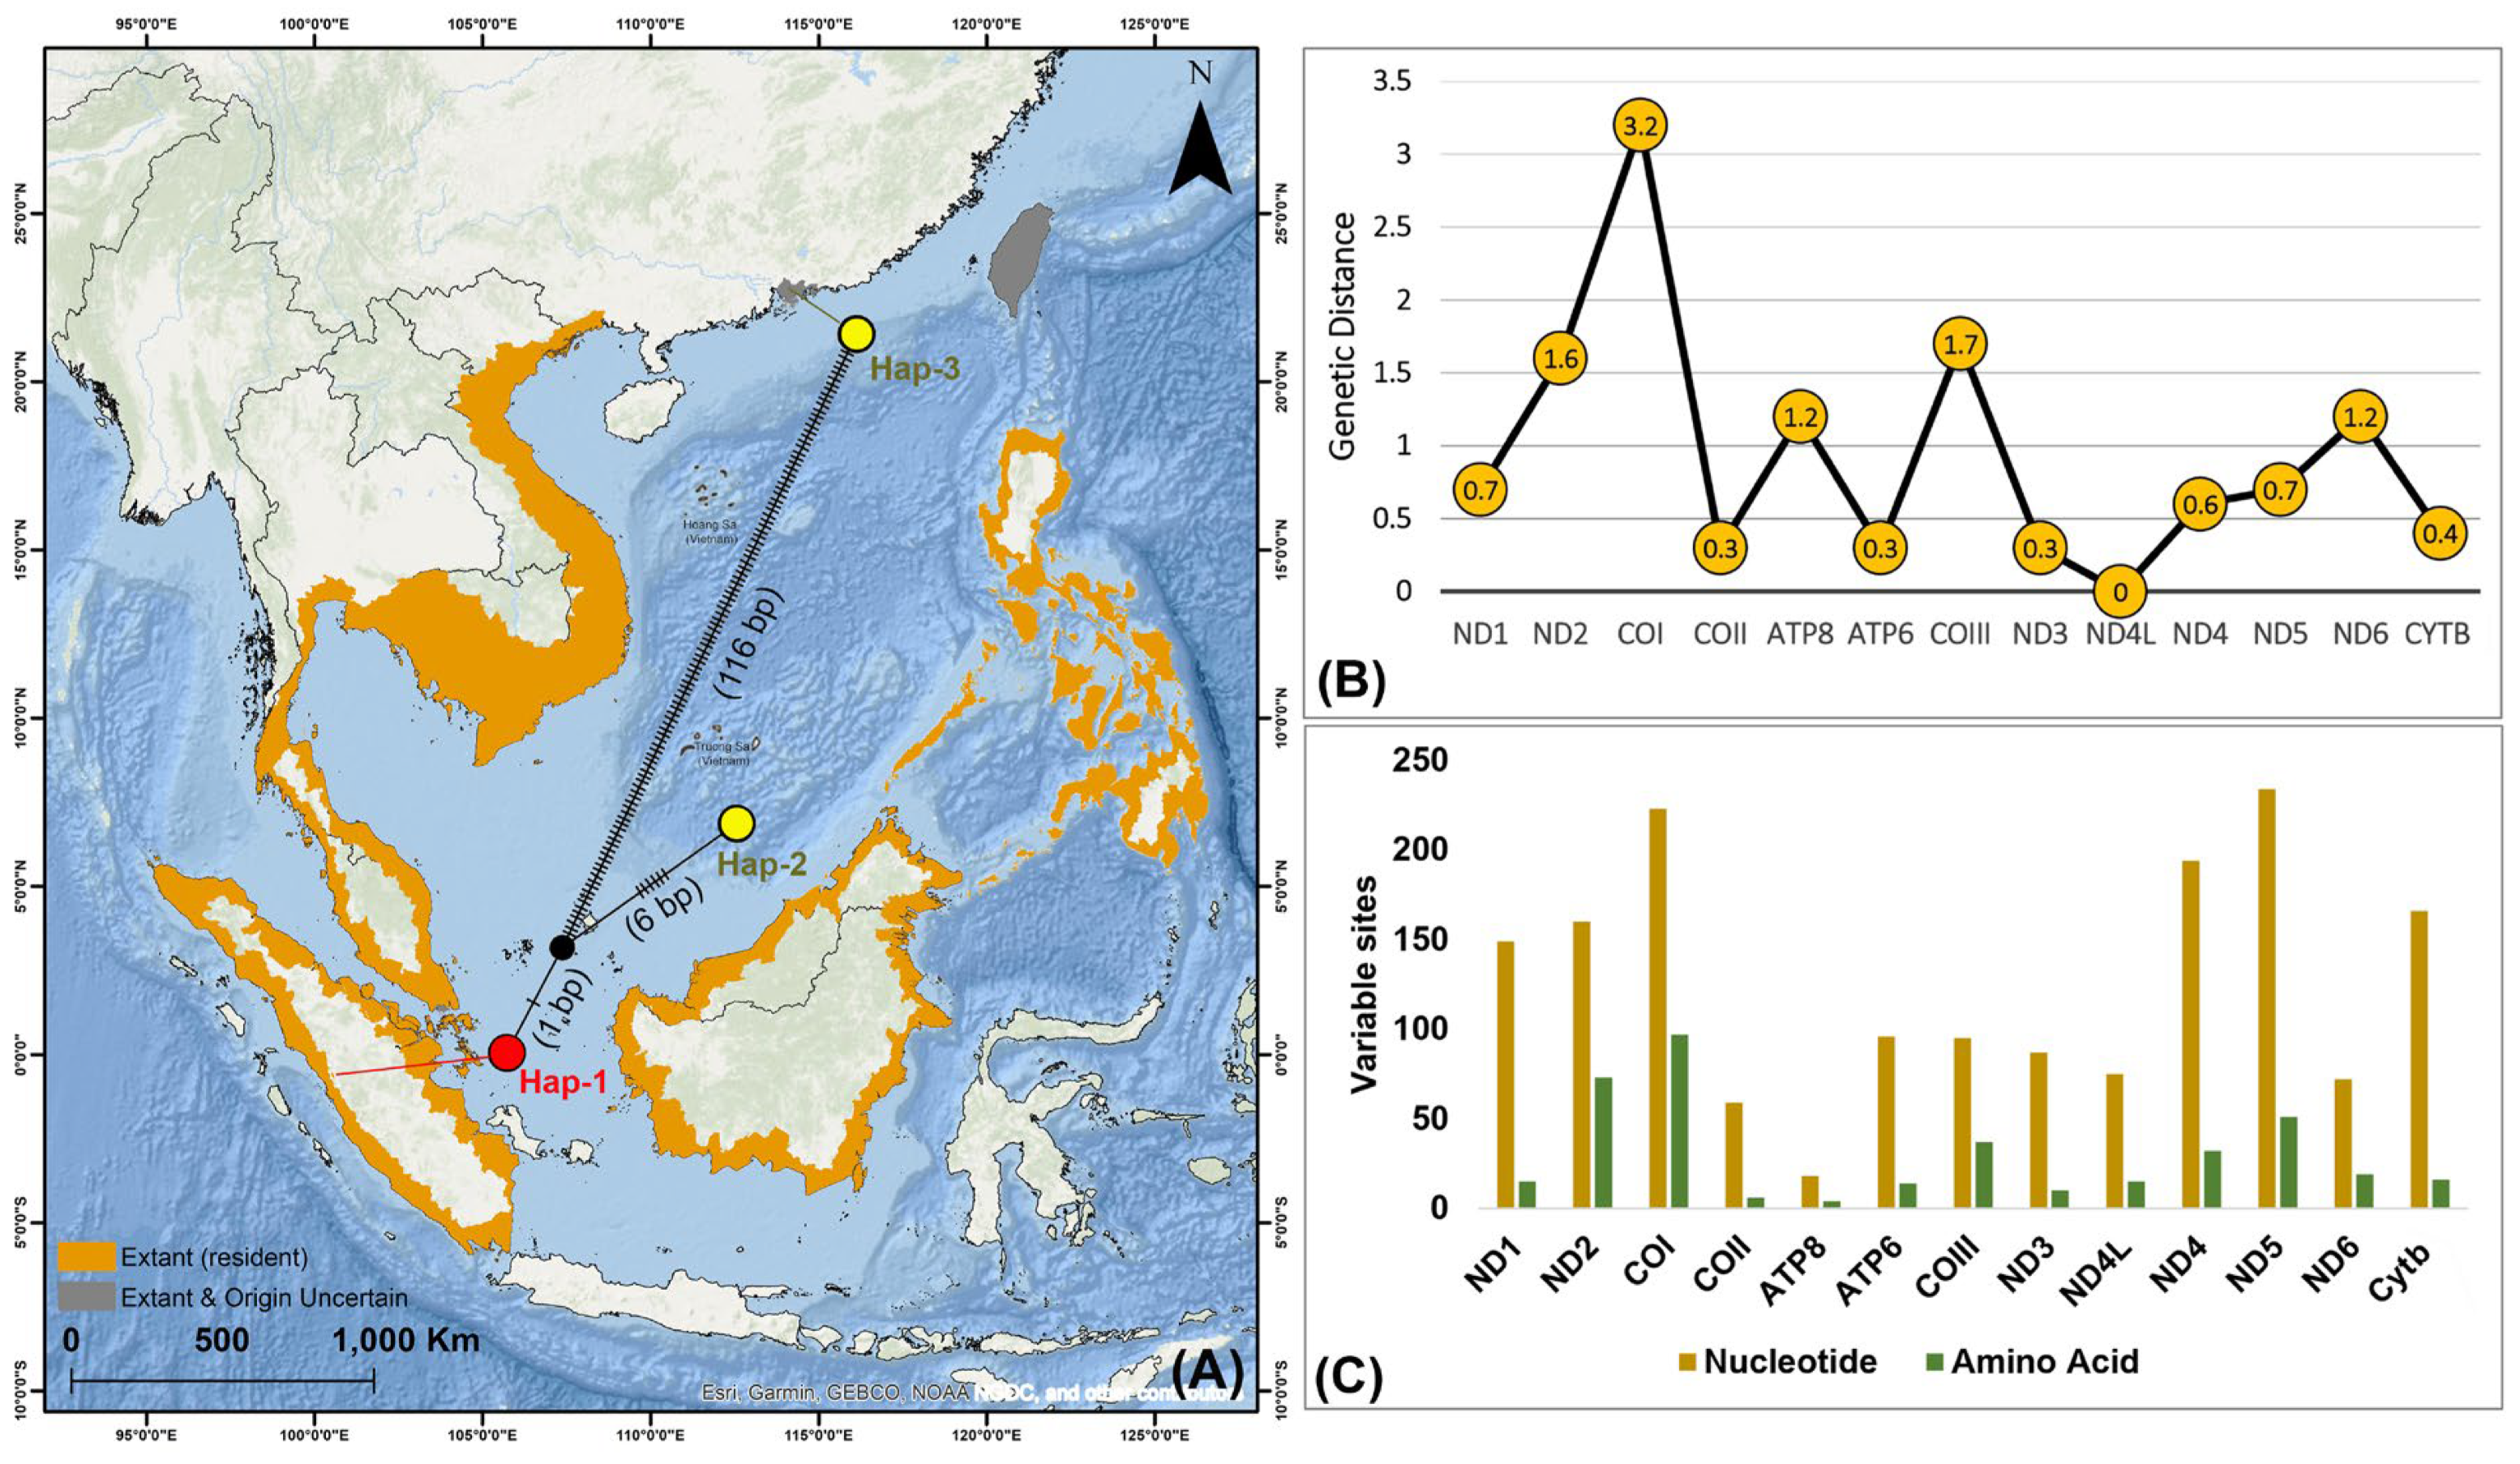
The haplotype analysis of O. marmorata from its native habitat (Lake Singkarak, West Sumatra, Indonesia) and introduced habitat (Guangzhou, China) identified three haplotypes, with 123 segregating sites, a haplotype diversity (Hd) of 1.0000, and nucleotide diversity (π) of 0.6667 (Figure 5A; Supplementary Table S8). The genetic distance analyses of the 13 PCGs between O. marmorata from native and introduced habitats revealed the highest pairwise divergence in COI (3.2%) and the lowest in ND4L (0%) (Figure 5B; Supplementary Table S9). However, the comparative analysis of variable sites across the 13 PCGs between O. marmorata and O. lineolata demonstrated gene-specific patterns of nucleotide and amino acid variation. Notably, ND5 had the highest number of variable nucleotide sites (234), followed by COI (223) and ND4 (194), while at the amino acid level, COI exhibited the greatest variation (97), followed by ND2 (73) and ND5 (51). In contrast, ATP8 displayed the fewest variations, with only 18 nucleotide and 4 amino acid variable sites (Figure 5C; Supplementary Table S9).
Figure 5.
(A) This map presents the geographical distribution of O. marmorata across Southeast and East Asia. The TCS haplotype network illustrates the genetic relationships among all O. marmorata haplotypes derived from the native habitat in Lake Singkarak, Sumatra, Indonesia (indicated by red circles), and the introduced habitat in Guangzhou, China (indicated by yellow circles). The circle sizes reflect the frequency of each haplotype, while the number of mutations between haplotypes is shown in parentheses. The median vectors representing hypothetical haplotypes are depicted as black circles. (B) The line graph displays the frequency of K2P genetic distances across 13 PCGs, estimated from the mitogenomes of O. marmorata, including one individual from the native habitat and two sequences from the introduced habitat. (C) The bar chart illustrates the variation in the number of nucleotide and amino acid sites across the 13 PCGs, compared between two Oxyeleotris species.
2.8. Matrilineal Phylogenetic Relationships
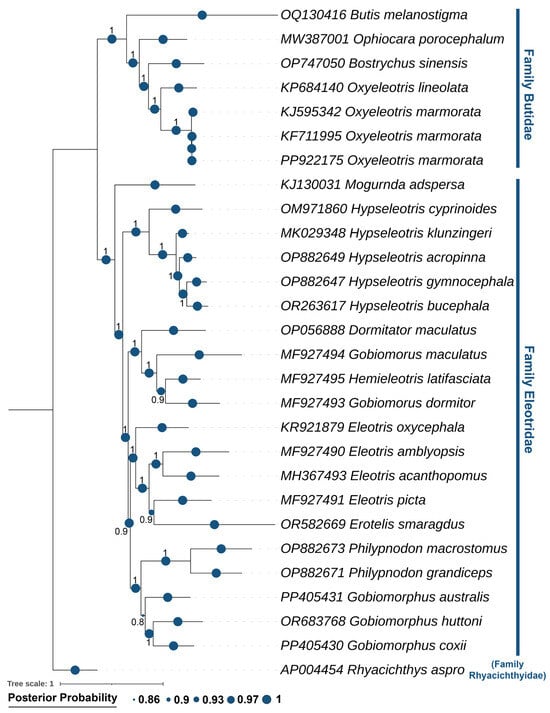
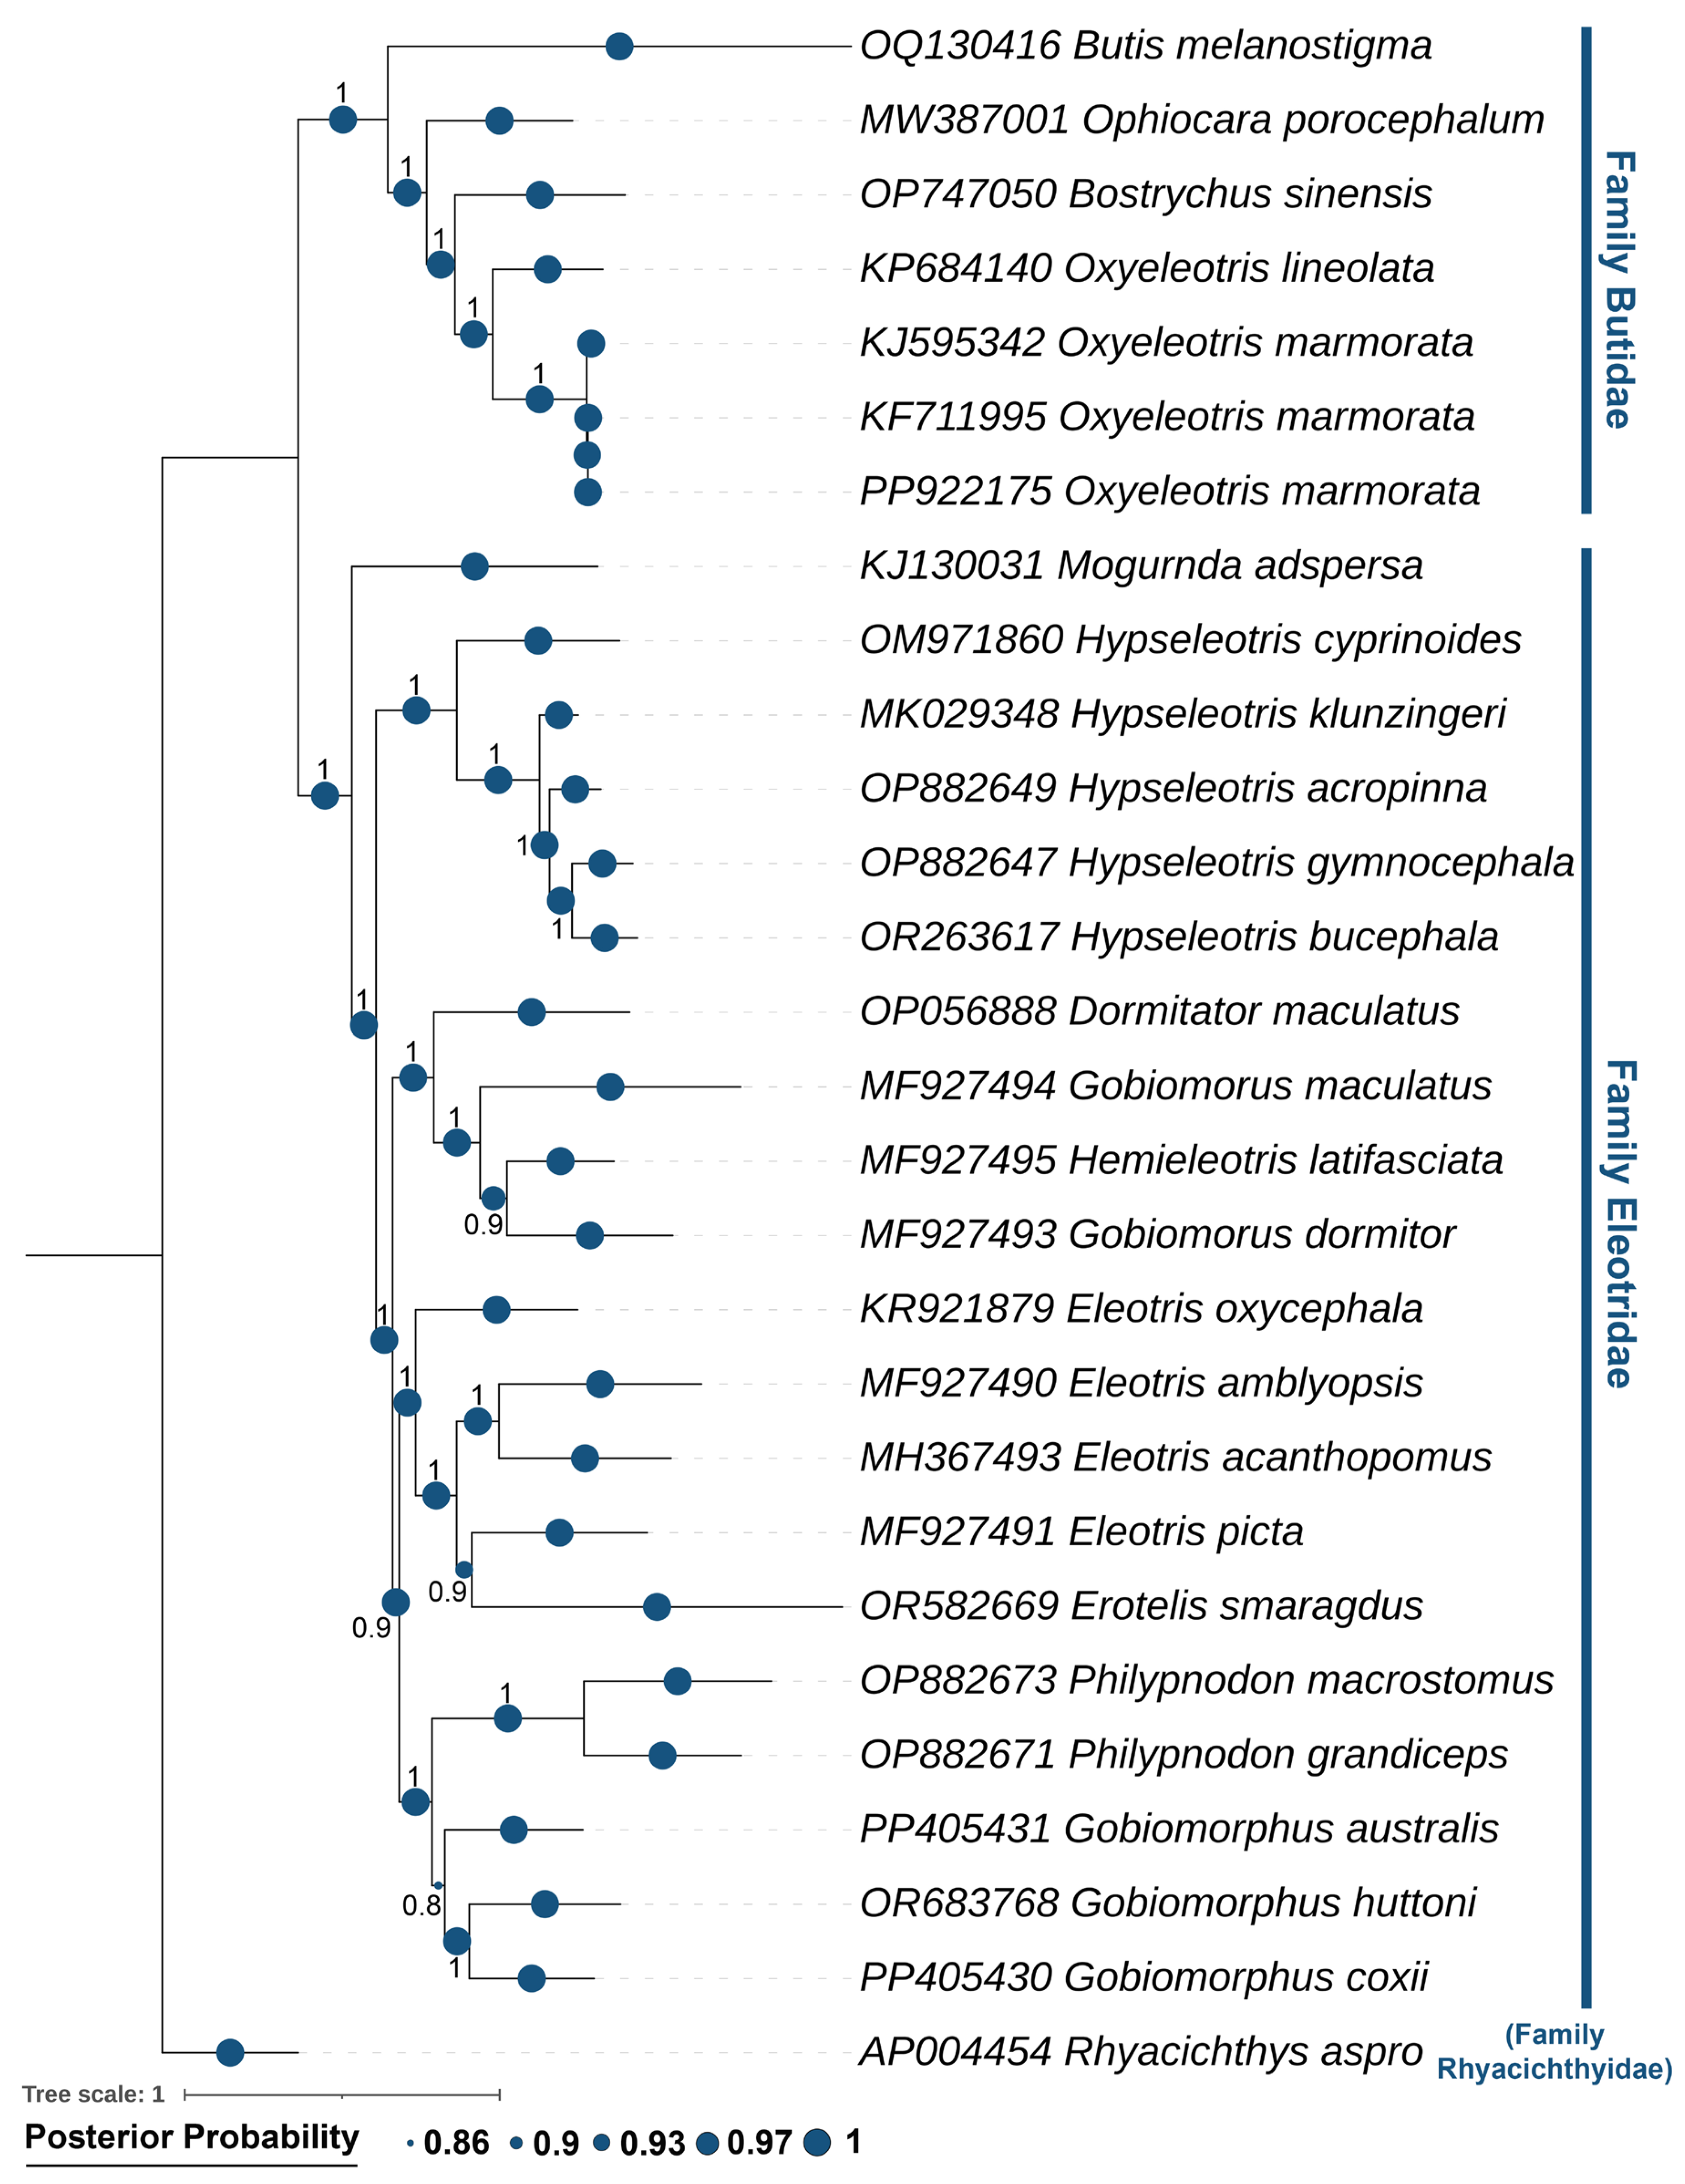
The mitogenome-based phylogenetic analysis was performed using 13 PCGs from the newly sequenced of O. marmorata along with other related species from the Butidae and Eleotridae families. The phylogenetic trees constructed using BA and ML methods resolved the species into distinct clades with strong statistical support. The analysis demonstrated that O. marmorata shares a close evolutionary relationship with O. lineolata, a tropical congener distributed across northern Australia and New Guinea, with both species forming a monophyletic group. This clade was sister to B. sinensis, which has a broad Indo-West Pacific distribution from eastern India to the Philippines, Vietnam, and China, extending north to southern Japan and south to northern Australia. Beyond the Oxyeleotris and Bostrychus genera, the phylogeny also supported matrilineal relationships within other Butidae genera, including Butis and Ophiocara, and within Eleotridae, covering Mogurnda, Hypseleotris, Dormitator, Gobiomorus, Hemieleotris, Eleotris, Erotelis, Philypnodon, and Gobiomorphus. Notably, the cladistic analysis also uncovered a non-monophyletic structure within the genus Gobiomorus, with G. maculatus and G. dormitor forming separate lineages, suggesting that further investigation is required (Figure 6; Supplementary Figure S2).
Figure 6.
The Bayesian phylogenetic tree, inferred from 13 concatenated PCGs, distinctly places O. marmorata within the Butidae clade, separating it from other Butidae and Eleotridae species. The posterior probability support values are indicated by blue circles at each node.
3. Discussion
3.1. Mitogenomic Profiling
The newly characterized mitogenome of O. marmorata comprises 37 genes, with 28 on the heavy strand and nine on the light strand. The gene order and strand distribution are conserved relative to other teleosts, and the pronounced A+T bias aligns with the hydrophobic properties of mitochondrial proteins [24,28,32,33]. Comparative analyses of Oxyeleotris species revealed the longest intergenic spacer and overlapping regions between trnN–trnC and ATP8–ATP6, respectively, a pattern characteristic of canonical mitochondrial genomes in teleost fishes [34]. The conserved overall mitogenome architecture suggests that nucleotide composition and gene organization can serve as reliable markers for phylogenetic inference within Oxyeleotris [25,29]. The PCGs also follow a conserved pattern, with ATP8 as the shortest and ND5 as the longest, consistent with prior observation in another goby [35]. Most PCGs in Butidae and the closely related Eleotridae start with the canonical ATG codon, whereas COI uses GTG, reflecting conserved selective pressures on mitochondrial translation [27,36]. Conversely, the stop codon usage varies, with six PCGs ending with complete codons (TAA/TAG) and the remainder exhibiting truncated codons (TA-/T--), presumably completed via polyadenylation during RNA processing [37,38]. These patterns underscore a conserved initiation mechanism alongside flexible termination strategies, which may facilitate mitogenomic evolution and adaptation.
Furthermore, the Ka/Ks analysis in Butidae and its closest related family Eleotridae showed that all PCGs have ratios <1, indicating strong purifying selection against deleterious nonsynonymous mutations and no evidence of positive selection, reflecting evolutionary stability in mitochondrial proteins [39,40]. The RSCU analysis indicates differential codon preferences, which may reflect translational optimization in O. marmorata and provide a framework for studying gene expression dynamics and adaptive evolution within the Butidae [41]. The rRNA genes (12S and 16S) of O. marmorata exhibit the typical vertebrate organization, separated by trnV on the heavy strand [36]. Conversely, most tRNA genes of this species display canonical cloverleaf structures, except trnS1, which lacks the DHU arm, a typical mitochondrial feature that preserves function and reflects evolutionary adaptation [38]. The structural integrity of the WANCY tRNAs in O. marmorata likely supports efficient mitochondrial translation and gene expression [42,43]. In addition, the CR among the Oxyeleotris species harbors conserved sequence blocks (CSB-D, CSB-1, CSB-2, CSB-3), consistent with their regulatory role in mitochondrial DNA replication termination [25,27]. The observed variability in CR sequences, together with potential structural mechanisms such as dimer formation and differential strand replication, may underlie mitogenomic structural diversity and contribute to the evolutionary dynamics of O. marmorata and related species [29,33]. Overall, the findings reveal structural conservation alongside functional variability in the O. marmorata mitogenome, providing a framework for understanding evolutionary constraints, translational dynamics, and mitochondrial adaptation in Gobiiformes.
3.2. Genetic Diversity and Matrilineal Phylogenetic Insights
The haplotype analysis in the present study indicated clear genetic differences between the native O. marmorata from Lake Singkarak, West Sumatra, Indonesia, and the introduced localities in Guangzhou, China. The Indonesian haplotype differed from the two Chinese haplotypes, exhibiting nucleotide variations ranging from 7 to 117 base pairs. These differences likely reflect multiple-source introductions from diverse geographic regions or the accumulation of mutations under aquaculture conditions [44]. Moreover, artificial selection, novel environmental pressures, and genetic isolation within captive systems may further accelerate haplotype differentiation [45,46]. These findings suggest that species translocations can generate new patterns of genetic variation through the combined effects of ecological and anthropogenic factors [23]. Furthermore, the analysis of the 13 PCGs revealed considerable variation in genetic divergence among loci. The COI gene exhibited the highest levels of nucleotide and amino acid variation, confirming its suitability as a molecular marker for distinguishing species, resolving taxonomic relationships, and supporting further phylogeographic studies of O. marmorata in Southeast and East Asia [47]. In contrast, highly conserved genes in O. marmorata such as ND4L and ATP8 displayed minimal variation, likely constrained by essential mitochondrial functions, making them suitable for deep evolutionary or comparative analyses [48,49]. Additionally, by integrating multiple genes and non-coding regions, the mitogenome-based phylogeny in this study provides a comprehensive view of matrilineal relationships within Oxyeleotris and closely related goby species in Butidae and Eleotridae [5,6,28]. The two Oxyeleotris species, O. lineolatus and O. marmorata, formed a monophyletic clade with close genetic affinity, whereas B. sinensis diverged earlier, in agreement with previous phylogenetic studies [6,21,22,35]. These results highlight the utility of mitogenomic data for elucidating potential ancestral lineages and resolving morphological inconsistencies reported among ichthyologists [29,38]. Considering the diversity and broad distribution of the remaining 17 Oxyeleotris species, additional mitogenomic studies are warranted to further investigate their speciation processes and adaptive evolution across heterogeneous aquatic habitats.
3.3. Study Limitations, Conservation Implications, and Future Perspectives
The present study reports a single complete mitochondrial genome generated from one individual representing the native Indonesian range of O. marmorata, providing an initial matrilineal genomic baseline for comparative analyses. However, reliance on a single specimen may not capture the full extent of mitogenomic diversity within Indonesia or across Southeast Asia; accordingly, the representativeness and broader applicability of the findings should be interpreted with caution. Despite this limitation, the dataset constitutes a valuable reference for characterizing mitogenomic features and inferring phylogenetic relationships. In addition, the introduction of non-native species, including O. marmorata, poses a significant threat to biodiversity by competing with and potentially displacing native gobies [19,50]. Such introductions can also lead to hybridization between native and introduced populations, which may compromise genetic integrity, reduce adaptive uniqueness, and alter ecological distributions and population dynamics [51,52]. Hence, we recommend that future studies incorporate larger sample sizes and generate complementary molecular datasets, including complete mitogenomes, nuclear markers, microsatellites, and single-nucleotide polymorphisms, to resolve fine-scale genetic variation, detect hybridization and more robustly infer population structure. Collectively, such integrative genomic approaches can strengthen conservation strategies by providing robust inferences of genetic diversity and demographic structure across both native and non-native ecosystems.
4. Materials and Methods
4.1. Sample Collection, Identification, and Preservation
A single wild specimen of O. marmorata was harvested from Lake Singkarak, West Sumatra, Indonesia (coordinates 0°33′52″ S, 100°32′11″ E), using a 5/8-inch gill net (Figure 1A). The identification was conducted following taxonomic keys from the previous investigations [14,53]. The specimen exhibited seven dorsal spines, nine dorsal soft rays, one anal spine, eight anal soft rays, and 60–65 predorsal scales, with no ocellus on the caudal peduncle. The specimen was euthanized by administering 2-phenoxyethanol at a final concentration of 600 µL L−1 directly into the aquarium, and after complete cessation of movement, it was rinsed three times with Milli-Q water [54]. Further, approximately 20 g of apical muscle tissue was aseptically collected and preserved in 95% molecular-grade ethanol in a 2 mL centrifuge tube, which was sealed with parafilm to prevent DNA degradation and microbial contamination and stored at −20 °C. The samples were subsequently transferred to the Molecular Physiology Laboratory at Pukyong National University, Busan, Republic of Korea, for molecular analyses. For archival purposes, the specimen was cataloged and fixed in 10% formaldehyde under voucher number ‘IDN5’ at the Jakarta Technical University of Fisheries (Pariaman Campus), Ministry of Marine Affairs and Fisheries, Indonesia. The distribution records of O. marmorata, including confirmed resident and those of uncertain origin, were mapped using IUCN shapefiles and visualized with ArcGIS version 10.6 to illustrate biogeographical patterns across Southeast and East Asia (Figure 1A). The species under this study is locally utilized as a food fish and is currently classified as “Least Concern” on the IUCN Red List of Threatened Species (https://www.iucnredlist.org/, accessed on 24 November 2025). Nevertheless, all experiments were conducted in accordance with institutional guidelines, approved by the Pukyong National University Institutional Animal Care and Use Committee (IACUC) under code PKNUIACUC-2025-16 dated 18 February 2025, and adhered to the ARRIVE 2.0 guidelines (https://arriveguidelines.org/, accessed on 24 November 2025) [55].
4.2. Genomic DNA Extraction and COI Amplification
The genomic DNA was extracted using the AccuPrep® Genomic DNA Extraction Kit (Bioneer, Daejeon, Republic of Korea), following the standard procedure outlined by the manufacturer. Approximately 30 mg of tissue was homogenized in 600 μL of 1× lysis buffer using a Tissue Lyser II (Qiagen, Hilden, Germany) for 60 s. Cell lysis and protein degradation were achieved by adding 100 μL of sodium dodecyl sulfate (SDS) and 20 μL of proteinase K, followed by incubation at 60 °C for 12 h. The DNA precipitation was facilitated by adding 500 μL of GC buffer and 300 μL of isopropanol. The mixture was then transferred to a column tube and centrifuged at 8000 rpm for 1 min. The contaminants were removed through sequential washes with buffer 1 and buffer 2, and purified DNA was eluted in 50 μL of TE buffer. The DNA concentration and purity were assessed using a NanoDrop spectrophotometer (Thermo Fisher Scientific, D1000, Waltham, MA, USA). For species verification, a partial fragment of the mitochondrial COI gene was amplified by polymerase chain reaction (PCR) using the universal primers Fish-BCH (5′-TCAACYAATCAYAAAGATATYGGCAC-3′) as the forward primer and Fish-BCL (5′-ACTTCYGGGTGRCCRAARAATCA-3′) as the reverse primer [56]. The PCR was executed in a total volume of 30 µL and contained 1 µL of each primer (10 pmol), 0.9 μL of 3% dimethyl sulfoxide (DMSO), 19.9 μL of sterilized deionized water, 3 μL of 10× ExTaq Buffer, 0.2 μL of Ex Taq HS, 3 μL of dNTPs, and 1 μL of a 1:10 diluted DNA template. The thermal cycling was performed on a Takara thermal cycler, beginning with initial denaturation at 94 °C for 3 min, followed by 40 cycles of 94 °C for 30 s, 50 °C for 30 s, 72 °C for 1 min, and a final extension at 72 °C for 5 min. The PCR products were purified using the AccuPrep® PCR/Gel Purification Kit (Bioneer, Daejeon, Republic of Korea) and sequenced bidirectionally on a 96-capillary ABI PRISM 3730XL Analyzer at Macrogen in Daejeon, Republic of Korea (https://dna.macrogen.com/, accessed on 24 November 2025). The sequencing chromatograms were filtered for noise using SeqScanner v1.0 (Applied Biosystems, Foster City, CA, USA), and COI sequences were verified via nucleotide BLAST searches against the GenBank database (https://blast.ncbi.nlm.nih.gov, accessed on 24 November 2025).
4.3. Mitogenome Sequencing and Assembly
Next-generation sequencing (NGS) was performed using paired-end reads (2 × 150 bp) on the NovaSeq platform at Macrogen (Daejeon, Republic of Korea) to generate the complete mitogenome of O. marmorata. The library preparation followed the TruSeq Nano DNA High-Throughput Library Prep Kit protocol (Illumina, Inc., San Diego, CA, USA). Briefly, 100 ng of genomic DNA was fragmented via adaptive focused acoustics (Covaris, Woburn, MA, USA) to produce double-stranded DNA with blunt ends and 5′ phosphorylation. Fragmented DNA underwent end repair, and then ligated with TruSeq DNA UD Indexing adapters, which were modified with a single 3′ adenine overhang, and subsequent size selection using a bead-based method. The library was then purified, enriched by PCR, and quantified via qPCR according to the KAPA Library Quantification Kit guidelines for Illumina sequencing platforms. The library quality was assessed using the Agilent 4200 TapeStation with D1000 ScreenTape (Agilent Technologies, Santa Clara, CA, USA). Furthermore, high-quality sequencing reads were used to assemble the mitogenome in Geneious Prime v2023.0.1 [57], with alignment guided by the previously published O. marmorata mitogenome from China (GenBank accession no. KJ595342). For precise sequence assembly, the overlapping regions were refined and verified using MEGA v12 [58]. Gene positions, boundaries, and orientations were independently confirmed using two annotation platforms: MITOS2 (integrated with the Galaxy web server, https://usegalaxy.eu, accessed on 24 November 2025) and MitoAnnotator (http://mitofish.aori.u-tokyo.ac.jp/annotation/input/, accessed on 24 November 2025) [26,59]. The PCGs were further validated by examining their predicted amino acid sequences using the Open Reading Frame Finder tool (https://www.ncbi.nlm.nih.gov/orffinder/, accessed on 24 November 2025) under the standard vertebrate mitochondrial genetic code. The final annotated mitogenome of O. marmorata, including strand orientation and gene features, was submitted to GenBank via the Sequin platform.
4.4. Mitogenome Characterization, Comparative Analyses, and Genetic Diversity
In this investigation, the mitogenome of O. marmorata from its native range in Indonesia was visualized using MitoAnnotator. The comparative analyses were performed by aligning the newly generated sequence with available Oxyeleotris mitogenomes from GenBank (Supplementary Table S1), including two previously published O. marmorata sequences from China (KF711995, KJ595342) and two O. lineolata sequences (KP663727, KP684140) [19,20,22,60]. Intergenic spacers and overlapping regions among Oxyeleotris species were manually quantified in Microsoft Excel v2016. The nucleotide composition of PCGs, rRNAs, tRNAs, and CR was analyzed in MEGA v12, while the A-T and G-C composition were calculated using AT-skew = (A − T)/(A + T) and GC-skew = (G − C)/(G + C) [61]. The start and stop codons of PCGs across 27 sequences representing 25 Butidae species and the closely related Eleotridae were annotated using the Open Reading Frame Finder tool (Supplementary Table S1). The nucleotide diversity (π) among Oxyeleotris species was assessed using a sliding window analysis in DnaSP v6.0 with a window size of 200 bp and a step size of 25 bp [62]. The transition–transversion saturation across PCG codon positions was evaluated in DAMBE v6 [63]. The rates of nonsynonymous (Ka) and synonymous (Ks) substitutions were also calculated in DnaSP v6.0. The codon usage patterns, including amino acid frequency, Relative Synonymous Codon Usage (RSCU), and Codon Distribution per Thousand Codons (CDsPT), were similarly examined. The tRNA secondary structures of O. marmorata were predicted using Aragorn on the Galaxy platform [64]. The conserved CR motifs among Oxyeleotris species were identified through CLUSTAL X alignments and verified against previously characterized conserved domains [27,65]. The Tandem Repeats Finder (https://tandem.bu.edu/trf/trf.html, accessed on 24 November 2025) was also used to detect repetitive elements due to their relevance in population level investigation [66]. Further, the genetic diversity indices of O. marmorata, including the number of haplotypes, haplotype diversity (Hd), and nucleotide diversity (π), were estimated from 13 PCGs using DnaSP v6.0. The haplotype relationships were visualized using a TCS network constructed in POPART v.1.7 [67,68]. The genetic distances between O. marmorata from native and introduced habitats were calculated using the Kimura 2-parameter (K2P) model in MEGA v12, based on concatenated sequences of the 13 PCGs. Lastly, variable nucleotide and amino acid sites between O. marmorata and O. lineolata were also examined to identify species-specific molecular signatures and quantify genetic differentiation.
4.5. Dataset Configuration and Phylogenetic Framework
The phylogenetic dataset comprised 27 mitogenome representing 25 valid species from the Butidae and Eleotridae families, including the newly assembled O. marmorata mitogenome from its native distribution in Indonesia and 26 sequences retrieved from GenBank (Supplementary Table S1). The mitogenome of Rhyacichthys aspro (GenBank accession no. AP004454) was selected as the outgroup. The phylogenetic construction was performed using Bayesian inference (BA) and Maximum Likelihood (ML) approaches based on a concatenated alignment of the 13 PCGs generated in iTaxoTools v0.1 [69]. The best-fit evolutionary model, GTR+G+I, was identified using PartitionFinder v2 under the Bayesian Information Criterion [70]. The BA tree was implemented in MrBayes v3.1.2 using the Metropolis-coupled Markov Chain Monte Carlo (MCMC) framework with nst = 6. The analysis was run for 10,000,000 generations with sampling every 100 generations, and the first 25% of sampled trees were discarded as burn-in. The convergence was confirmed when the average standard deviation of split frequencies reached ≤0.01 and the Potential Scale Reduction Factor (PSRF) values approached 1 across all estimated parameters [71]. Conversely, the ML tree was generated in PhyML v3.0 with 1000 bootstrap replicates [72]. The final trees visualization and annotation were performed using iTOL v7 [73].
5. Conclusions
This study provides an in-depth analysis of the complete mitogenome of O. marmorata from its native range in Indonesia, elucidating its gene organization and structural architecture. The phylogenetic inference further offers insights into the evolutionary dynamics of Oxyeleotris species and their taxonomic placement within the Butidae and its closest related family, Eleotridae. The structural variations in the mitogenome are shown to contribute to evolutionary divergence, informing species differentiation and adaptation. The findings supply critical genetic data applicable to systematics, molecular taxonomy, conservation genetics, and the sustainable management of goby populations. This work underscores the need to establish a comprehensive mitogenomic database for the remaining 17 Oxyeleotris species. Future research should incorporate broader sampling of O. marmorata from both wild and cultured populations across diverse regions of Southeast and East Asia to increase sample size and improve population representativeness. In addition, the use of complementary nuclear markers, such as microsatellites and single-nucleotide polymorphisms, will be essential to resolve fine-scale genetic variation, detect hybridization, and more robustly infer population structure and local adaptation.
Supplementary Materials
The following supporting information can be downloaded at: https://www.mdpi.com/article/10.3390/ijms27010140/s1.
Author Contributions
Conceptualization: S.K. and H.-W.K.; methodology: S.A., A.P. and H.-E.K.; software: S.A. and A.P.; validation: M.M. and H.-W.K.; formal analysis: S.A. and A.P.; investigation: H.-E.K., M.M. and S.V.V.; resources: S.K. and H.-W.K.; data curation: H.-E.K. and S.V.V.; writing—original draft: S.A. and A.P.; writing—review and editing: S.K. and H.-W.K.; visualization: A.P. and K.K.; supervision: S.K. and H.-W.K.; project administration: S.K. and K.K.; funding acquisition: H.-W.K. and K.K. All authors have read and agreed to the published version of the manuscript.
Funding
This research was supported by the Research Grant of Pukyong National University (2024).
Institutional Review Board Statement
All experiments were conducted in accordance with institutional guide-lines, approved by the Pukyong National University Institutional Animal Care and Use Committee (IACUC) (protocol code: PKNUIACUC-2025-16; approval date: 18 February 2025) and adhered to the ARRIVE 2.0 guidelines.
Informed Consent Statement
Not applicable.
Data Availability Statement
The mitogenomic sequence data supporting the findings of this study are publicly available in GenBank (NCBI) at https://www.ncbi.nlm.nih.gov/ under accession number PP922175, accessed on 24 November 2025.
Acknowledgments
The authors sincerely thank Hamdani and his students from the Jakarta Technical University of Fisheries, Indonesia, for their invaluable assistance with sample collection, preparation, and proper documentation for shipment to the Republic of Korea. The authors also express their gratitude to the Government of Solok Regency, West Sumatra, Indonesia, particularly Zaitul Ikhlas and Yossi Agusta, for their generous support and assistance with this research. S.A. and A.P. additionally acknowledge the Interdisciplinary Program of Marine and Fisheries Sciences and Convergent Technology at Pukyong National University, Busan, Republic of Korea, for their academic support throughout their Ph.D. studies.
Conflicts of Interest
The authors declare no conflicts of interest.
References
- Nelson, J.S.; Grande, T.C.; Wilson, M.V.H. Fishes of the World, 5th ed.; John Wiley & Sons: Hoboken, NJ, USA, 2016. [Google Scholar]
- Fricke, R.; Eschmeyer, W.N.; Van der Laan, R. Eschmeyer’s Catalog of Fishes: Genera, Species, References. Available online: http://researcharchive.calacademy.org/research/ichthyology/catalog/fishcatmain.asp (accessed on 25 November 2025).
- Thacker, C. Systematics of Butidae and Eleotridae. In The Biology of Gobies; Patzner, R., Van Tassell, J.L., Kovacic, M., Kapoor, B.G., Eds.; CRC Press: Boca Raton, FL, USA, 2011. [Google Scholar]
- Gierl, C.; Reichenbacher, B.; Gaudant, J.; Erpenbeck, D.; Pharisat, A. An extraordinary gobioid fish fossil from Southern France. PLoS ONE 2013, 8, e64117. [Google Scholar] [CrossRef] [Scilit]
- Gierl, C.; Dohrmann, M.; Keith, P.; Humphreys, W.; Esmaeili, H.R.; Vukić, J.; Šanda, R.; Reichenbacher, B. An integrative phylogenetic approach for inferring relationships of fossil gobioids (Teleostei: Gobiiformes). PLoS ONE 2022, 17, e0271121. [Google Scholar] [CrossRef] [Scilit] [PubMed]
- Thacker, C.E.; McCraney, W.T.; Harrington, R.C.; Near, T.J.; Shelley, J.J.; Adams, M.; Hammer, M.P.; Unmack, P.J. Diversification of the sleepers (Gobiiformes: Gobioidei: Eleotridae) and evolution of the root gobioid families. Mol. Phylogenet. Evol. 2023, 186, 107841. [Google Scholar] [CrossRef] [Scilit] [PubMed]
- Hoese, D.F. Gobioidei: Relationships. In Ontogeny and Systematics of Fishes; Moser, H.G., Ed.; Special Publication of the American Society of Ichthyologists and Herpetologists No. 1; Allen Press: Lawrence, KS, USA, 1984; pp. 588–591. [Google Scholar]
- Hoese, D.F.; Gill, A.C. Phylogenetic relationships of eleotridid fishes (Perciformes: Gobioidei). Bull. Mar. Sci. 1993, 52, 415–440. [Google Scholar]
- Nilsson, G.E.; Hobbs, J.P.; Munday, P.L.; Ostlund-Nilsson, S. Coward or braveheart: Extreme habitat fidelity through hypoxia tolerance in coral-dwelling goby. J. Exp. Biol. 2004, 207, 33–39. [Google Scholar] [CrossRef] [Scilit]
- Ip, Y.K.; Leong, M.W.F.; Sim, M.Y.; Goh, G.S.; Wong, W.P.; Chew, S.F. Chronic and acute ammonian toxicity in mudskippers, Periophthalmodon schlosseri and Boleophthalmus boddaerti: Brain ammonia and glutamine contents and effects of methionine sulfoximine and MK801. J. Exp. Biol. 2005, 208, 1993–2004. [Google Scholar] [CrossRef] [Scilit]
- Zeyl, J.N.; Malavasi, S.; Holt, D.E.; Noel, P.; Lugli, M.; Johnston, C.E. Convergent aspects of acoustic communication in darters, sculpins, and gobies. In Fish Hearing and Bioacoustics: An Anthology in Honour of Arthur N. Popper and Richard R. Fay; Springer International Publishing AG: Dordrecht, The Netherlands, 2016; pp. 93–120. [Google Scholar]
- Untersteggaber, L.; Mitteroecker, P.; Herler, J. Coral architecture affects the habitat choice and form of associated gobiid fishes. Mar. Biol. 2014, 161, 521–530. [Google Scholar] [CrossRef] [Scilit]
- Herawati, T.; Yustiati, A.; Nurhayati, A.; Natadia, S.S. Domestication of Marble Goby [Oxyeleotris marmorata (Bleeker, 1852)] indigenous fish of Citarum River, Indonesia. Aquat. Procedia 2016, 7, 247–253. [Google Scholar] [CrossRef] [Scilit]
- Froese, R.; Pauly, D. FishBase: World Wide Web Electronic Publication. Available online: https://www.fishbase.org/ (accessed on 25 November 2025).
- Liu, H.; Yao, J.; Dong, M.; Yi, M.; Liu, W. Chromosome-level genome assembly of the marble goby (Oxyeleotris marmorata). Sci. Data 2025, 12, 1596. [Google Scholar] [CrossRef] [Scilit]
- Larson, H.K.; Murdy, E.O. Suborder Gobioidei: Eleotridae–Sleepers (Gudgeons). In FAO Species Identification Guide for Fishery Purposes. The Living Marine Resources of the Western Central Pacific; Food & Agriculture Organization of the United Nations (FAO): Rome, Italy, 2001; Volume 6, pp. 3574–3610. [Google Scholar]
- Luong, V.C.; Yi, Y.; Lin, C.K. Cove culture of marble goby (Oxyeleotris marmorata Bleeker) and carps in Tri An Reservoir of Vietnam. Aquaculture 2005, 244, 97–107. [Google Scholar] [CrossRef] [Scilit]
- Kottelat, M.; Whitten, A.J.; Kartikasari, S.N.; Wirjoatmodjo, S. Freshwater Fishes of Western Indonesia and Sulawesi; Periplus Editions: Hong Kong, China, 1993; pp. 1–221. [Google Scholar]
- Xu, Y.; Hu, Y.; Bao, B.; Gong, X. Complete mitochondrial DNA sequence of marble goby, Oxyeleotris marmorata (Bleeker, 1852). Mitochondrial DNA Part A DNA Mapp. Seq. Anal. 2016, 27, 817–818. [Google Scholar] [CrossRef] [Scilit] [PubMed]
- Yang, Z.Y.; Liang, H.W.; Li, Z.; Wang, D.; Zou, G.W. Mitochondrial genome of the marbled goby (Oxyeleotris marmorata). Mitochondrial DNA Part A DNA Mapp. Seq. Anal. 2016, 27, 1073–1074. [Google Scholar] [CrossRef] [Scilit] [PubMed]
- Meng, Y.; Ma, H.; Ma, C.; Wei, H.; Liu, Y.; Zhang, F.; Wang, W.; Chen, W.; Zhao, M.; Chen, F.; et al. The complete mitochondrial genome of Eleotris oxycephala (Perciformes: Eleotridae). Mitochondrial DNA Part A DNA Mapp. Seq. Anal. 2016, 27, 3820–3821. [Google Scholar] [CrossRef] [Scilit] [PubMed]
- Zang, X.; Yin, D.; Wang, R.; Yin, S.; Tao, P.; Chen, J.; Zhang, G. Complete mitochondrial DNA sequence and phylogenetic analysis of Oxyeleotris lineolatus (Perciformes, Eleotridae). Mitochondrial DNA Part A DNA Mapp. Seq. Anal. 2016, 27, 2414–2416. [Google Scholar] [CrossRef] [Scilit]
- Millette, K.L.; Gonzalez, A.; Cristescu, M.E. Breaking ecological barriers: Anthropogenic disturbance leads to habitat transitions, hybridization, and high genetic diversity. Sci. Total Environ. 2020, 740, 140046. [Google Scholar] [CrossRef] [Scilit]
- Miya, M.; Nishida, M. The mitogenomic contributions to molecular phylogenetics and evolution of fishes: A 15-year retrospect. Ichthyol. Res. 2015, 62, 29–71. [Google Scholar] [CrossRef] [Scilit]
- Kundu, S.; Kang, H.-E.; Go, Y.; Bang, G.; Jang, Y.; Htoo, H.; Aini, S.; Kim, H.-W. Mitogenomic architecture of Atlantic Emperor Lethrinus atlanticus (Actinopterygii: Spariformes): Insights into the lineage diversification in the Atlantic Ocean. Int. J. Mol. Sci. 2024, 25, 10700. [Google Scholar] [CrossRef] [Scilit]
- Iwasaki, W.; Fukunaga, T.; Isagozawa, R.; Yamada, K.; Maeda, Y.; Satoh, T.P.; Sado, T.; Mabuchi, K.; Takeshima, H.; Miya, M.; et al. MitoFish and MitoAnnotator: A mitochondrial genome database of fish with an accurate and automatic annotation pipeline. Mol. Biol. Evol. 2013, 30, 2531–2540. [Google Scholar] [CrossRef] [Scilit]
- Satoh, T.P.; Miya, M.; Mabuchi, K.; Nishida, M. Structure and variation of the mitochondrial genome of fishes. BMC Genom. 2016, 17, 719. [Google Scholar] [CrossRef] [Scilit]
- Miya, M.; Takeshima, H.; Endo, H.; Ishiguro, N.B.; Inoue, J.G.; Mukai, T.; Satoh, T.P.; Yamaguchi, M.; Kawaguchi, A.; Mabuchi, K.; et al. Major patterns of higher teleostean phylogenies: A new perspective based on 100 complete mitochondrial DNA sequences. Mol. Phylogenet. Evol. 2003, 26, 121–138. [Google Scholar] [CrossRef] [Scilit]
- Aini, S.; Rina; Sektiana, S.P.; Lee, S.R.; Kim, A.R.; Kang, H.E.; Amin, M.H.F.; Jung, W.K.; Putra, A.; Suyasa, I.N.; et al. Mitogenomic characterization and phylogenetic insights of the ornamental Sail-Fin Molly (Poecilia velifera) in non-native Indonesian waters. Biochem. Genet. 2025. [Google Scholar] [CrossRef] [Scilit] [PubMed]
- Shang, Y.; Wang, X.; Liu, G.; Wu, X.; Wei, Q.; Sun, G.; Mei, X.; Dong, Y.; Sha, W.; Zhang, H. Adaptability and evolution of Gobiidae: A genetic exploration. Animals 2022, 12, 1741. [Google Scholar] [CrossRef] [Scilit] [PubMed]
- An, C.; Li, A.; Wang, H.; Che, S.; van der Laan, R.; Liu, S.; Zhuang, Z. The complete mitochondrial genome of the deep-dwelling goby Suruga fundicola (Teleostei, Gobiidae) reveals evidence of recombination in the control region. Int. J. Mol. Sci. 2025, 26, 8317. [Google Scholar] [CrossRef] [Scilit] [PubMed]
- Naylor, G.J.; Collins, T.M.; Brown, W.M. Hydrophobicity and phylogeny. Nature 1995, 373, 565–566. [Google Scholar] [CrossRef] [Scilit]
- Yoon, T.-H.; Kang, H.-E.; Aini, S.; Wujdi, A.; Kim, H.-W.; Kundu, S. Mitogenomic analysis reveals the phylogenetic placement of monotypic Parachelon grandisquamis and distinctive structural features of control regions in mullets. Front. Mar. Sci. 2024, 11, 1484198. [Google Scholar] [CrossRef] [Scilit]
- Wujdi, A.; Ewusi, E.O.M.; Sektiana, S.P.; Amin, M.H.F.; López-Vera, E.; Kim, H.W.; Kang, H.E.; Kundu, S. Mitogenomic characterization and phylogenetic placement of the red pandora Pagellus bellottii from the Eastern Atlantic Ocean within the family Sparidae. Sci. Rep. 2025, 15, 30432. [Google Scholar] [CrossRef] [Scilit]
- Wei, T.; Jin, X.X.; Xu, T.J. The first complete mitochondrial genome from Bostrychus genus (Bostrychus sinensis) and partitioned Bayesian analysis of Eleotridae fish phylogeny. J. Genet. 2013, 92, 247–257. [Google Scholar] [CrossRef] [Scilit]
- Marnis, H.; Syahputra, K.; Kadarusman; Darmawan, J.; Cartealy, I.C.; Larashati, S.; Kusuma, W.E.; Hayuningtyas, E.P.; Iswanto, B.; Asaf, R.; et al. Insights into the structural features and phylogenetic implications of the complete mitochondrial genome of Fasin rainbow fish (Melanotaenia fasinensis). BMC Genom. 2024, 25, 1066. [Google Scholar] [CrossRef] [Scilit]
- Ojala, D.; Montoya, J.; Attardi, G. tRNA punctuation model of RNA processing in human mitochondria. Nature 1981, 290, 470–474. [Google Scholar] [CrossRef] [Scilit]
- Izaki, A.F.; Aini, S.; Putra, A.; Kang, H.E.; Kim, A.R.; Lee, S.R.; Mulyono, M.; Amin, M.H.F.; Kim, H.W.; Kundu, S. Mitogenomic profiling of Cyclocheilichthys repasson (Cypriniformes: Cyprinidae) and its phylogenetic placement within the clade “Poropuntiinae”. Ecol. Evol. 2025, 15, e71990. [Google Scholar] [CrossRef] [Scilit]
- Nei, M.; Kumar, S. Molecular Evolution and Phylogenetics; Oxford University Press: New York, NY, USA, 2000; pp. 1–333. [Google Scholar]
- Zhao, D.; Guo, Y.; Gao, Y. Natural selection drives the evolution of mitogenomes in Acrossocheilus. PLoS ONE 2022, 17, e0276056. [Google Scholar] [CrossRef] [Scilit] [PubMed]
- Redwan, R.M.; Parthasarathy, S.; Hari, R. Codon usage. In Encyclopedia of Bioinformatics and Computational Biology; Elsevier Science Publishing Co., Inc.: New York, NY, USA, 2019; Volume 3, pp. 327–331. [Google Scholar]
- Cantatore, P.; Gadaleta, M.N.; Roberti, M.; Saccone, C.; Wilson, A.C. Duplication and remoulding of tRNA genes during the evolutionary rearrangement of mitochondrial genomes. Nature 1987, 329, 853–855. [Google Scholar] [CrossRef] [Scilit] [PubMed]
- Ponce, M.; Infante, C.; Jiménez-Cantizano, R.M.; Pérez, L.; Manchado, M. Complete mitochondrial genome of the blackspot seabream, Pagellus bogaraveo (Perciformes: Sparidae), with high levels of length heteroplasmy in the WANCY region. Gene 2008, 409, 44–52. [Google Scholar] [CrossRef] [Scilit] [PubMed]
- Aminisarteshnizi, M.; Moyo, N.A.G. Genetic and haplotype diversity of Clarias gariepinus (Burchell 1822) based on cytochrome c oxidase I (COI) gene. Hydrobiology 2024, 3, 337–349. [Google Scholar] [CrossRef] [Scilit]
- Nam, B.H.; Yoo, D.; Kim, Y.O.; Park, J.Y.; Shin, Y.; Shin, G.H.; Park, C.I.; Kim, H.; Kwak, W. Whole genome sequencing reveals the impact of recent artificial selection on red sea bream reared in fish farms. Sci. Rep. 2019, 9, 6487, Erratum in Sci Rep. 2020, 10, 1625. [Google Scholar] [CrossRef] [Scilit]
- Milardi, M.; Gavioli, A.; Soana, E.; Lanzoni, M.; Fano, E.A.; Castaldelli, G. The role of species introduction in modifying the functional diversity of native communities. Sci. Total Environ. 2020, 699, 134364. [Google Scholar] [CrossRef] [Scilit]
- Bhattacharya, M.; Sharma, A.R.; Patra, B.C.; Sharma, G.; Seo, E.M.; Nam, J.S.; Chakraborty, C.; Lee, S.S. DNA barcoding to fishes: Current status and future directions. Mitochondrial DNA Part A DNA Mapp. Seq. Anal. 2016, 27, 2744–2752. [Google Scholar] [CrossRef] [Scilit]
- Zardoya, R.; Meyer, A. Phylogenetic performance of mitochondrial protein-coding genes in resolving relationships among vertebrates. Mol. Biol. Evol. 1996, 13, 933–942. [Google Scholar] [CrossRef] [Scilit]
- Shtolz, N.; Mishmar, D. The metazoan landscape of mitochondrial DNA gene order and content is shaped by selection and affects mitochondrial transcription. Commun. Biol. 2023, 6, 93. [Google Scholar] [CrossRef] [Scilit]
- Moi, D.A.; Alves, D.C.; Figueiredo, B.R.S.; Antiqueira, P.A.P.; de Mello, F.T.; Jeppesen, E.; Romero, G.Q.; Mormul, R.P.; Bonecker, C.C. Non-native fishes homogenize native fish communities and reduce ecosystem multifunctionality in tropical lakes over 16 years. Sci. Total Environ. 2021, 769, 144524. [Google Scholar] [CrossRef] [Scilit]
- Cucherousset, J.; Olden, J.D. Ecological impacts of non-native freshwater fishes. Fisheries 2011, 36, 215–230. [Google Scholar] [CrossRef] [Scilit]
- Todesco, M.; Pascual, M.A.; Owens, G.L.; Ostevik, K.L.; Moyers, B.T.; Hübner, S.; Heredia, S.M.; Hahn, M.A.; Caseys, C.; Bock, D.G.; et al. Hybridization and extinction. Evol. Appl. 2016, 9, 892–908. [Google Scholar] [CrossRef] [Scilit] [PubMed]
- Kottelat, M. Fishes of Laos; WHT Publications Ltd.: Colombo, Sri Lanka, 2001; pp. 1–198. [Google Scholar]
- Nahon, S.; Séité, S.; Kolasinski, J.; Aguirre, P.; Geurden, I. Effects of euthanasia methods on stable carbon (δ13C) and nitrogen (δ15N) isotopic compositions of fry and juvenile rainbow trout (Oncorhynchus mykiss). Rapid Commun. Mass Spectrom. 2017, 31, 1742–1748. [Google Scholar] [CrossRef] [Scilit] [PubMed]
- Percie du Sert, N.; Hurst, V.; Ahluwalia, A.; Alam, S.; Avey, M.T.; Baker, M.; Browne, W.J.; Clark, A.; Cuthill, I.C.; Dirnagl, U.; et al. The ARRIVE guidelines 2.0: Updated guidelines for reporting animal research. PLoS Biol. 2020, 18, e3000410. [Google Scholar]
- Baldwin, C.C.; Mounts, J.H.; Smith, D.G.; Weigt, L.A. Genetic identification and color descriptions of early life-history stages of Belizean Phaeoptyx and Astrapogon (Teleostei: Apogonidae), with comments on identification of adult Phaeoptyx. Zootaxa 2009, 2008, 1–22. [Google Scholar] [CrossRef] [Scilit]
- Kearse, M.; Moir, R.; Wilson, A.; Stones-Havas, S.; Cheung, M.; Sturrock, S.; Buxton, S.; Cooper, A.; Markowitz, S.; Duran, C.; et al. Geneious Basic: An integrated and extendable desktop software platform for the organization and analysis of sequence data. Bioinformatics 2012, 28, 1647–1649. [Google Scholar] [CrossRef] [Scilit]
- Kumar, S.; Stecher, G.; Suleski, M.; Sanderford, M.; Sharma, S.; Tamura, K. MEGA12: Molecular evolutionary genetic analysis version 12 for adaptive and green computing. Mol. Biol. Evol. 2024, 41, msae263. [Google Scholar] [CrossRef] [Scilit]
- Bernt, M.; Donath, A.; Jühling, F.; Externbrink, F.; Florentz, C.; Fritzsch, G.; Pütz, J.; Middendorf, M.; Stadler, P.F. MITOS: Improved de novo metazoan mitochondrial genome annotation. Mol. Phylogenet. Evol. 2013, 69, 313–319. [Google Scholar] [CrossRef] [Scilit]
- Chen, H.; Li, W.; Zhao, J.; Zhu, X. The complete mitochondrial genome of the sleepy cod (Oxyeleotris lineolatus). Mitochondrial DNA Part A DNA Mapp. Seq. Anal. 2016, 27, 2539–2540. [Google Scholar] [CrossRef] [Scilit]
- Perna, N.T.; Kocher, T.D. Patterns of nucleotide composition at fourfold degenerate sites of animal mitochondrial genomes. J. Mol. Evol. 1995, 41, 353–358. [Google Scholar] [CrossRef] [Scilit]
- Rozas, J.; Ferrer-Mata, A.; Sánchez-DelBarrio, J.C.; Guirao-Rico, S.; Librado, P.; Ramos-Onsins, S.E.; Sánchez-Gracia, A. DnaSP 6: DNA sequence polymorphism analysis of large data sets. Mol. Biol. Evol. 2017, 34, 3299–3302. [Google Scholar] [CrossRef] [Scilit] [PubMed]
- Xia, X. DAMBE6: New tools for microbial genomics, phylogenetics, and molecular evolution. J. Hered. 2017, 108, 431–437. [Google Scholar] [CrossRef] [Scilit] [PubMed]
- Laslett, D. ARAGORN, a program to detect tRNA genes and tmRNA genes in nucleotide sequences. Nucleic Acids Res. 2004, 32, 11–16. [Google Scholar] [CrossRef] [Scilit]
- Thompson, J.D.; Gibson, T.J.; Plewniak, F.; Jeanmougin, F.; Higgins, D.G. The CLUSTAL_X windows interface: Flexible strategies for multiple sequence alignment aided by quality analysis tools. Nucleic Acids Res. 1997, 25, 4876–4882. [Google Scholar] [CrossRef] [Scilit]
- Benson, G. Tandem Repeats Finder: A program to analyze DNA sequences. Nucleic Acids Res. 1999, 27, 573–580. [Google Scholar] [CrossRef] [Scilit] [PubMed]
- Clement, M.; Posada, D.; Crandall, K.A. TCS: A computer program to estimate gene genealogies. Mol. Ecol. 2000, 9, 1657–1659. [Google Scholar] [CrossRef] [Scilit]
- Leigh, J.W.; Bryant, D. POPART: Full-feature software for haplotype network construction. Methods Ecol. Evol. 2015, 6, 1110–1116. [Google Scholar] [CrossRef] [Scilit]
- Vences, M.; Miralles, A.; Brouillet, S.; Ducasse, J.; Fedosov, A.; Kharchev, V.; Kostadinov, I.; Kumari, S.; Patmanidis, S.; Scherz, M.D.; et al. iTaxoTools 0.1: Kickstarting a specimen-based software toolkit for taxonomists. Megataxa 2021, 6, 77–92. [Google Scholar] [CrossRef] [Scilit]
- Lanfear, R.; Frandsen, P.B.; Wright, A.M.; Senfeld, T.; Calcott, B. PartitionFinder 2: New methods for selecting partitioned models of evolution for molecular and morphological phylogenetic analyses. Mol. Biol. Evol. 2017, 34, 772–773. [Google Scholar] [CrossRef] [Scilit]
- Ronquist, F.; Teslenko, M.; van der Mark, P.; Ayres, D.L.; Darling, A.; Höhna, S.; Larget, B.; Liu, L.; Suchard, M.A.; Huelsenbeck, J.P. MrBayes 3.2: Efficient Bayesian phylogenetic inference and model choice across a large model space. Syst. Biol. 2012, 61, 539–542. [Google Scholar] [CrossRef] [Scilit]
- Guindon, S.; Dufayard, J.F.; Lefort, V.; Anisimova, M.; Hordijk, W.; Gascuel, O. New algorithms and methods to estimate maximum-likelihood phylogenies: Assessing the performance of PhyML 3.0. Syst. Biol. 2010, 59, 307–321. [Google Scholar] [CrossRef] [Scilit]
- Letunic, I.; Bork, P. Interactive Tree of Life (iTOL) v6: Recent updates to the phylogenetic tree display and annotation tool. Nucleic Acids Res. 2024, 52, W78–W82. [Google Scholar] [CrossRef] [Scilit]

Disclaimer/Publisher’s Note: The statements, opinions and data contained in all publications are solely those of the individual author(s) and contributor(s) and not of MDPI and/or the editor(s). MDPI and/or the editor(s) disclaim responsibility for any injury to people or property resulting from any ideas, methods, instructions or products referred to in the content. |
© 2025 by the authors. Licensee MDPI, Basel, Switzerland. This article is an open access article distributed under the terms and conditions of the Creative Commons Attribution (CC BY) license.