


Abstract
The concentration of carotenoids and fat-soluble vitamins in human plasma may play a significant role in numerous chronic diseases such as age-related macular degeneration and some types of cancer. Although these compounds are of utmost interest for human health, methods for their simultaneous determination are scarce. A new high pressure liquid chromatography (HPLC)-tandem mass spectrometry (MS/MS) method for the quantification of selected carotenoids and fat-soluble vitamins in human plasma was developed, validated, and then applied in a pilot dietary intervention study with healthy volunteers. In 50 min, 16 analytes were separated with an excellent resolution and suitable MS signal intensity. The proposed HPLC–MS/MS method led to improvements in the limits of detection (LOD) and quantification (LOQ) for all analyzed compounds compared to the most often used HPLC–DAD methods, in some cases being more than 100-fold lower. LOD values were between 0.001 and 0.422 µg/mL and LOQ values ranged from 0.003 to 1.406 µg/mL, according to the analyte. The accuracy, precision, and stability met with the acceptance criteria of the AOAC (Association of Official Analytical Chemists) International. According to these results, the described HPLC-MS/MS method is adequately sensitive, repeatable and suitable for the large-scale analysis of compounds in biological fluids.
1. Introduction
A wide range of significant evidence has associated the human diet with chronic diseases in the last decades [1,2,3,4,5]. Based on this evidence, many dietary recommendations and guidelines have been formulated to prevent conditions such as age-related macular degeneration, cardiovascular diseases, some types of cancer, osteoporosis, diabetes, and others [6,7]. Owing to their content of bioactive compounds, notably carotenoids and fat-soluble vitamins, an increment of fruit and vegetable consumption is recommended [8]. Carotenoids, xanthophylls and carotenes are natural fat-soluble, red, yellow and orange pigments characterized by a wide distribution, structural diversity and numerous physio-chemical and biological properties [9]. Particularly due to their antioxidant activity, carotenoids have been the subject of many studies [10,11,12,13,14]. To date, over 700 carotenoid compounds have been identified in various natural sources, and 40 to 50 of these are usually consumed in the human diet [15,16]. Since these antioxidants are synthesized only by plants, algae and fungi [9], their levels in human blood are directly dependent on food intake.
Another group of interesting and useful compounds are fat-soluble vitamins and their metabolites such as retinol, retinol acetate, cholecalciferol, and α-tocotrienol. These compounds also have free radical scavenging properties that allow them to function as antioxidants [17,18]. The presence of fat-soluble vitamins in human tissues and fluids is of vital importance for human health because of their catalytic functions in anabolic and catabolic pathways. Both carotenoids and fat-soluble vitamins can be labeled as fat-soluble micronutrients, and their absorption from the gastrointestinal tract depends on processes responsible for fat absorption or metabolism [19]. An excess or lack of these fat-soluble micronutrients has been associated with the expression of certain diseases. Consequently, there is an increasing demand for the analysis of these antioxidants.
Available methods can determine only a few representatives of the aforementioned fat-soluble micronutrients [20,21,22,23,24,25,26], and few of them can be applied for the simultaneous analysis of compounds in biological samples. Most use high pressure liquid chromatography (HPLC) separation coupled to UV–Vis or diode array detection (DAD) [23,24,25], but with these methods it is extremely challenging to obtain the sensitivity required for the analysis of human fluids, in which the concentration of fat-soluble micronutrients is very low. The problem of sensitivity can be solved by usage of tandem mass spectrometry (MS/MS) detection, although finding general ionization conditions suitable for all targeted analytes is very difficult. A few HPLC–MS/MS methods have been described for the simultaneous analysis of carotenoids and fat-soluble vitamins but usually for no more than 10 analytes [22,25,26,27]. Reported here is a unique HPLC–MS/MS method for the simultaneous determination of 16 carotenoids and fat-soluble vitamins in human plasma.
2. Results
2.1. HPLC-MS/MS Method Development
2.1.1. Extraction of Carotenoids and Fat-Soluble Vitamins
For the determination of carotenoids and fat-soluble vitamins in a complex matrix such as human plasma, it was necessary to develop an efficient extraction procedure. For our purpose, a double liquid-liquid extraction was designed. The biggest advantage of this extraction procedure is the small amount of human plasma (200 µL) and chemicals required to obtain good quality results. A detailed description is provided in Materials and Methods.
2.1.2. Optimization of Chromatographic and MS/MS Conditions
During the development of the HPLC–MS/MS method, different variations of mobile phase additives were compared: 0.4 g/L ammonium acetate (AMAC), 0.7 g/L AMAC, 1 g/L AMAC, 0.4 g/L AMAC + 0.1% acetic acid (AA), 0.7 g/L AMAC + 0.1% AA, 1 g/L AMAC + 0.1% AA. Table 1 shows the dependency of the MS signal intensity for product ions using multiple reaction monitoring (MRM) in APCI positive mode on the use of LC solvent additives. In general, a combination of AMAC and AA provided better results than the addition of only AMAC to the mobile phases. 0.4 g/L AMAC + 0.1% AA provided the best MS signal intensity for 25-hydroxycholecalciferol, retinol acetate, and cholecalciferol; meanwhile 0.7 g/L AMAC + 0.1% AA provided the best MS signal intensity for most of the analyzed analytes: retinol, cantaxanthin, cryptoxanthin, 13-Z-β-carotene, α-carotene, β-carotene, and 9-Z-β-carotene. For lutein, the same mass signal intensities were obtained with 0.7 g/L AMAC, 0.4 g/L AMAC + 0.1% AA, 0.7 g/L AMAC + 0.1% AA, and 1 g/L AMAC + 0.1% AA. In the case of E-β-apo-8′-carotenal, the MS signals obtained by 1 g/L AMAC, 0.4 g/L AMAC + 0.1% AA, 0.7 g/L AMAC + 0.1% AA, and 1 g/L AMAC + 0.1% AA were also comparable. For α-tocotrienol and astaxanthin, 1 g/L AMAC provided the best MS signal, which was 0.7 g/L AMAC for zeaxanthin, and 0.4 g/L AMAC for 5-Z-lycopene. The combination of 0.7 g/L AMAC + 0.1% AA added to both mobile phases was chosen for the final data acquisition because they provided the highest MS signal intensity for product ions of most of the analytes, including the highly problematic carotenes.
Table 1.
Influence of LC solvent additives (0.4 g/L ammonium acetate (AMAC), 0.7 g/L AMAC, 1 g/L AMAC, 0.4 g/L AMAC + 0.1% AA, 0.7 g/L AMAC + 0.1% AA, 1 g/L AMAC + 0.1% AA) on MS signal intensity for product ions using MRM in APCI positive mode. The fair blue represents lower intensities of MS signal than the highest obtained intensity under described conditions. The dark blue represents the highest MS signal intensity.
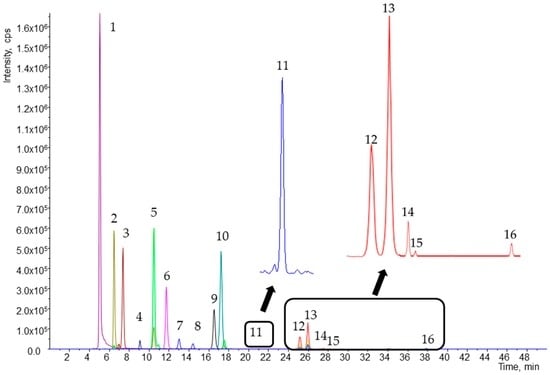
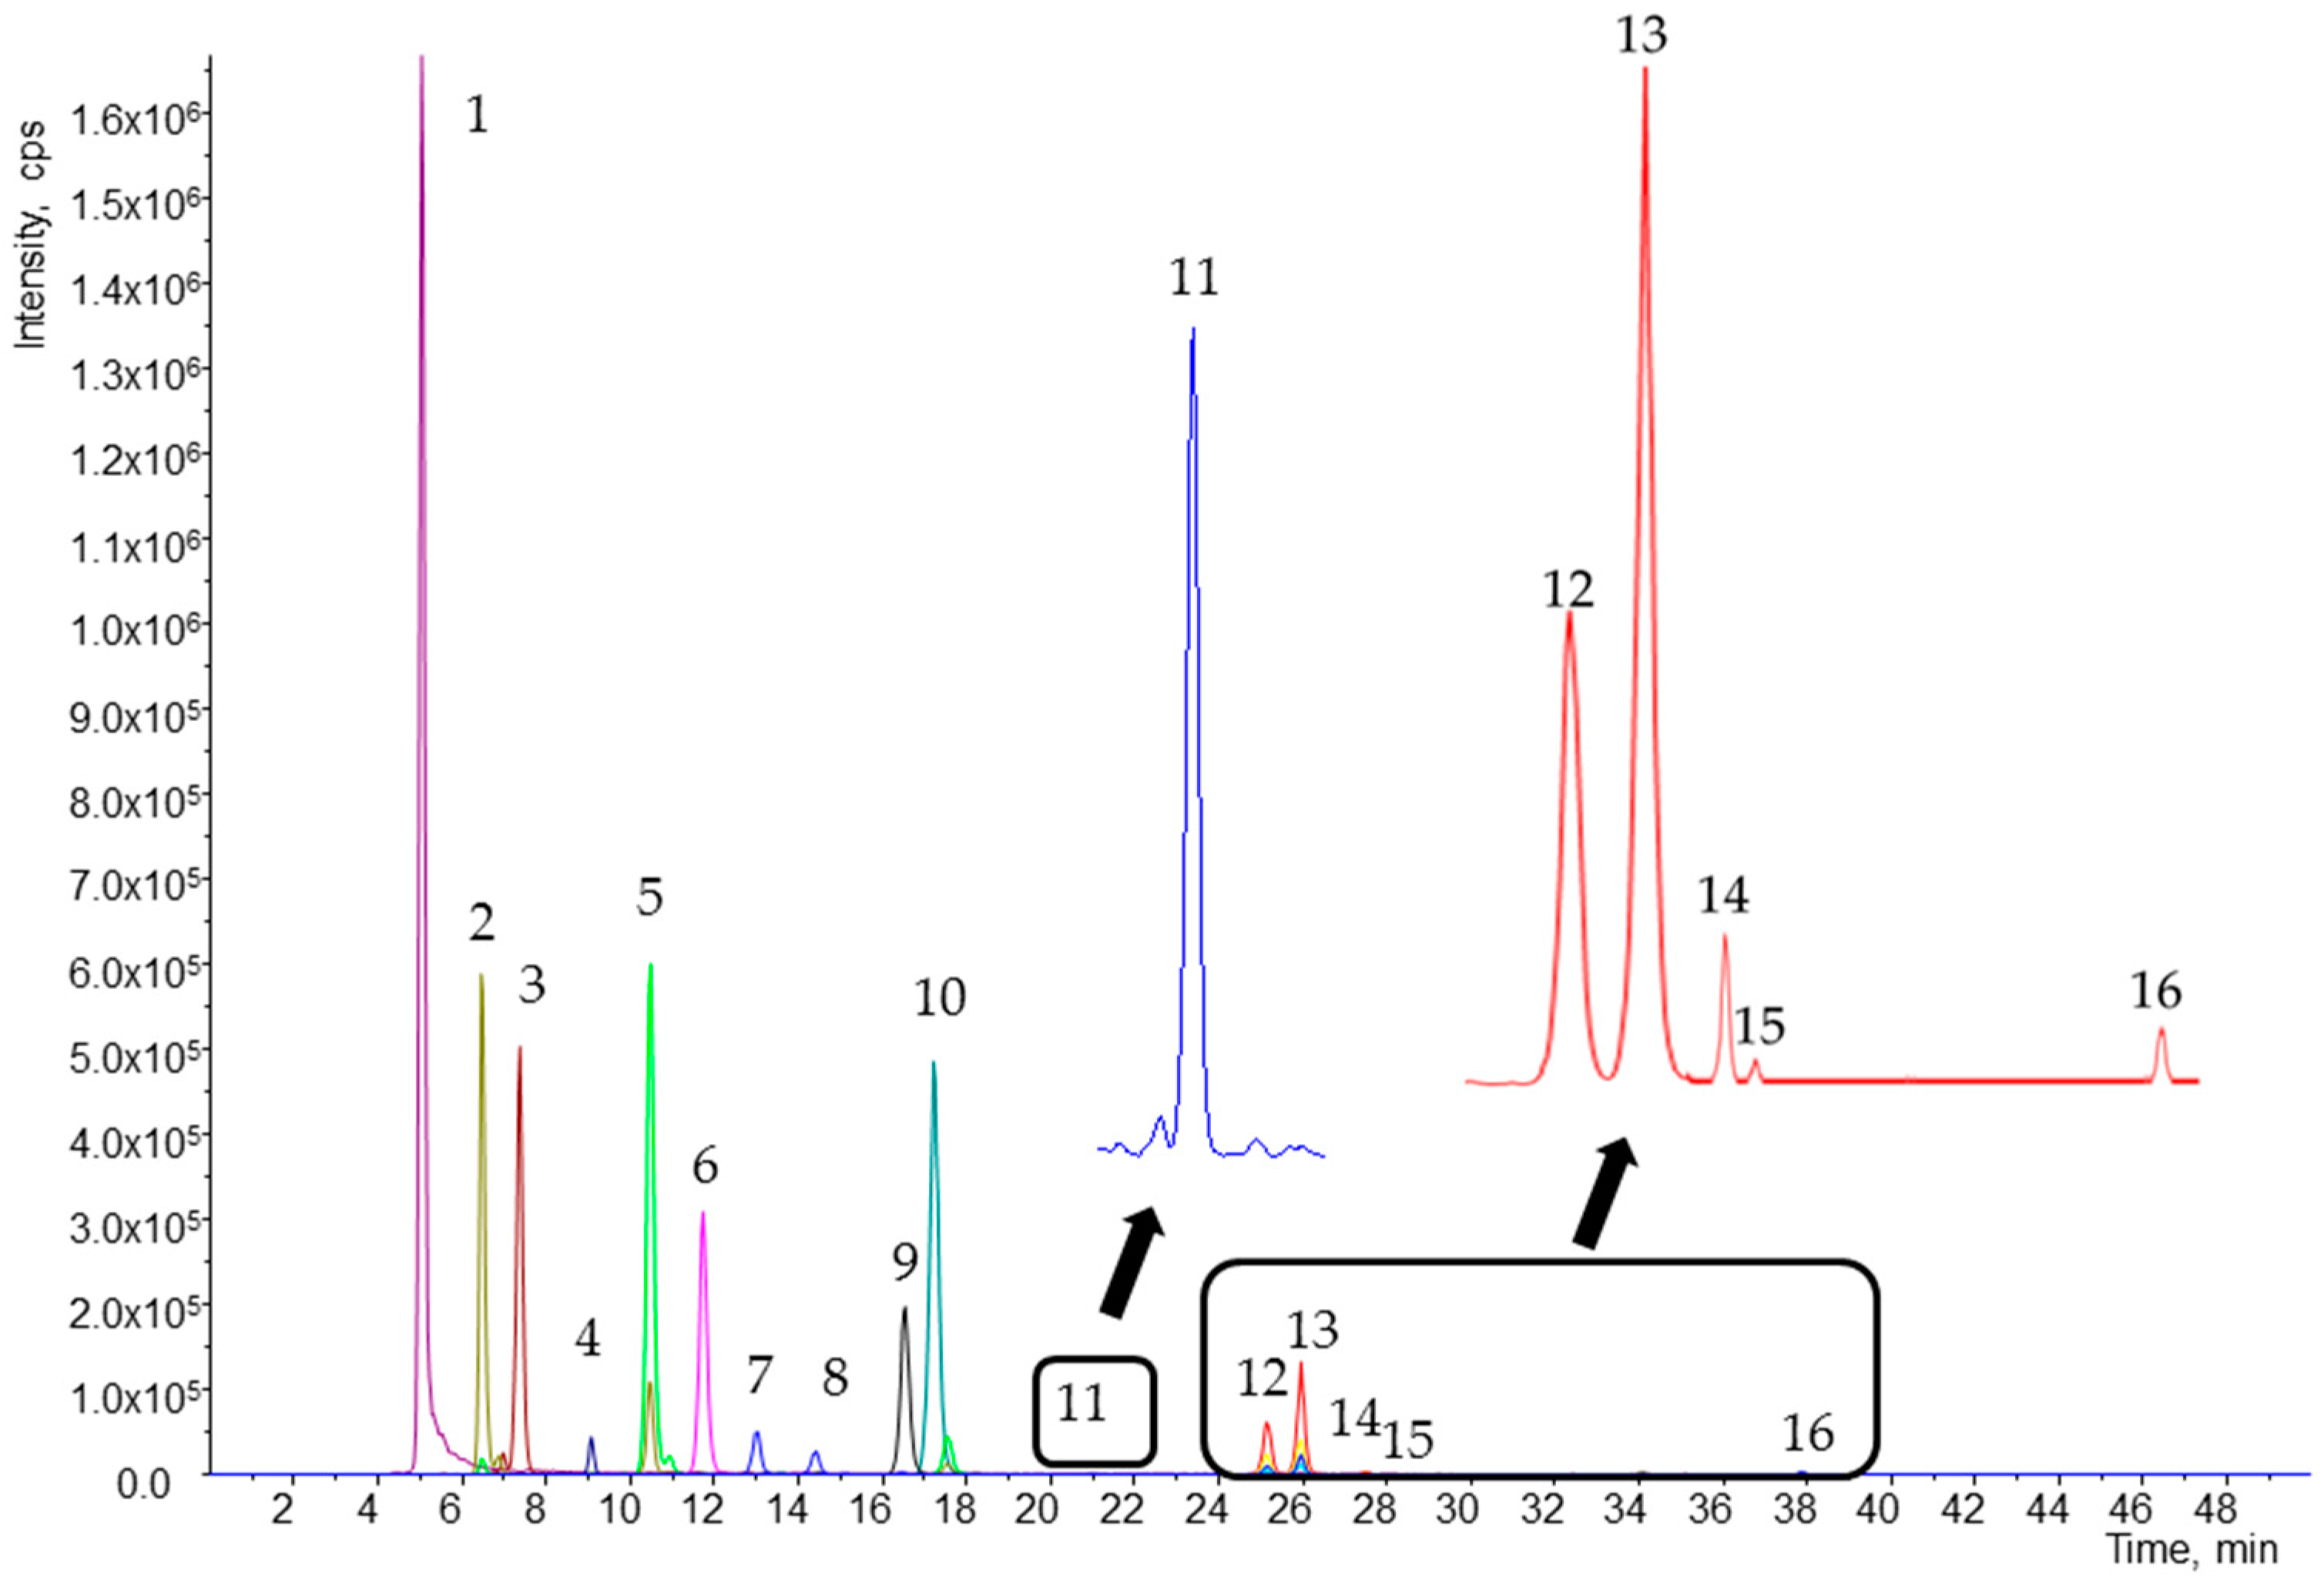
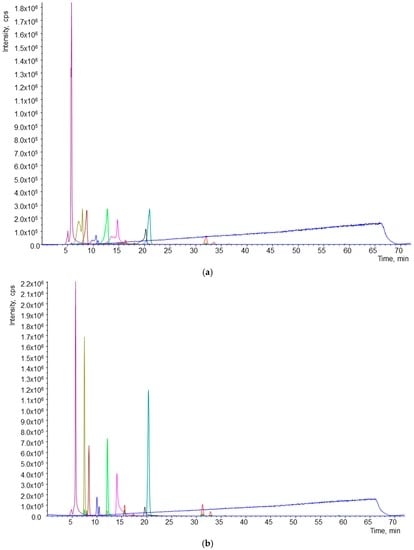
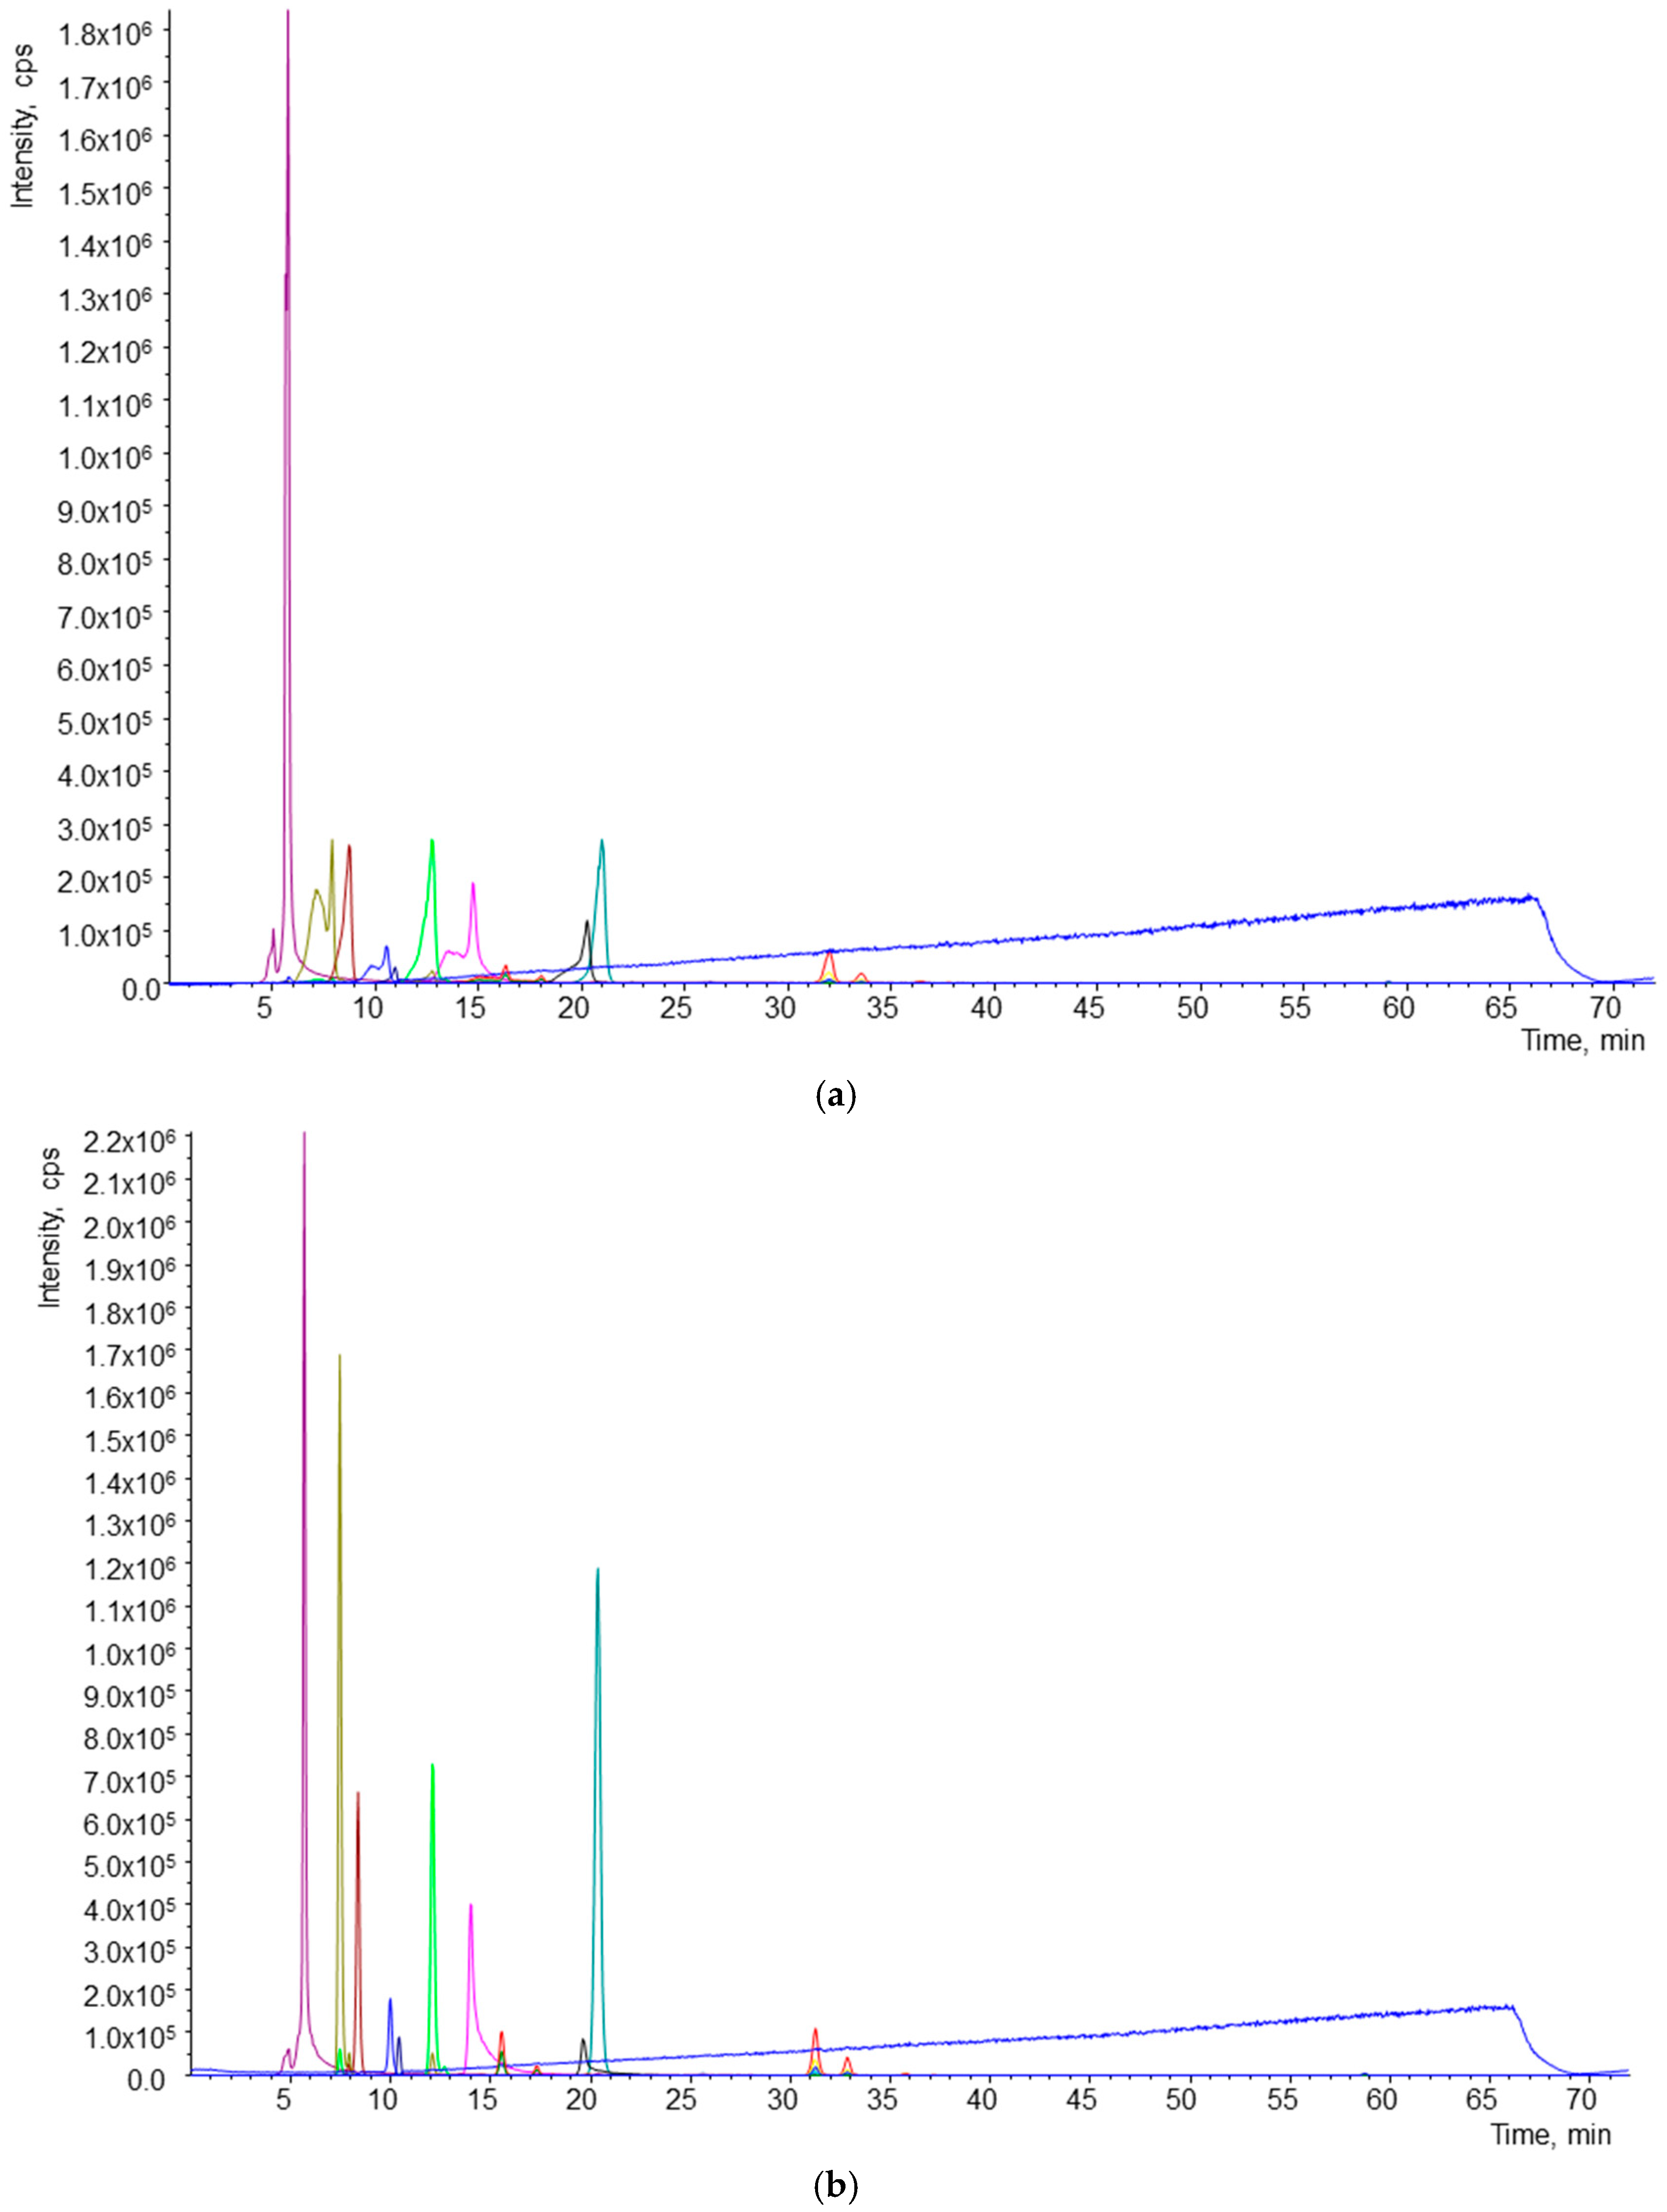
An excellent separation of 16 analytes in 50 min was accomplished (Figure 1). Flow rate, which allowed good quality resolution, was 0.6 mL/min, and the most suitable injection volume was 20 µL. The resolution and shape of individual peaks were greatly affected by the solvent used for sample reconstitution. During preliminary experiments, methyl tert-butyl ether (MTBE) and methanol (MeOH) were used for reconstitution. The effects of the solvents used for reconstitution are shown in Figure 2. Reconstitution by MeOH provided better separation and resolution of all analytes.
Figure 1.
Chromatogram of working standard solutions obtained by high pressure liquid chromatography-tandem mass spectrometry (HPLC-MS/MS) analysis. Peaks: (1) retinol; (2) 25-hydroxycholecalciferol; (3) retinol acetate; (4) α-tocotrienol; (5) cholecalciferol; (6) astaxanthin; (7) lutein; (8) zeaxanthin; (9) cantaxanthin; (10) E-β-apo-8′-carotenal; (11) cryptoxanthin; (12) 13-Z-β-carotene; (13) α-carotene; (14) β-carotene; (15) 9-Z-β-carotene; and (16) 5-Z-lycopene.
Figure 2.
Effect of solvent used for reconstitution of samples. (a) Chromatogram of sample reconstituted in methyl tert-butyl ether (MTBE); (b) chromatogram of sample reconstituted in MeOH.
Retention time (Rt) and optimal value for mass detection of declustering potential (DP), focusing potential (FP), entrance potential (EP), cell exit potential (CXP), and quantification transitions, with their corresponding collision energy (CE) are shown in Table 2.
Table 2.
Optimized values of declustering potential (DP), entrance potential (EP), cell exit potential (CXP) and retention time (Rt). Quantification transitions of the carotenoids and fat-soluble vitamins with the optimal collision energy (eV).
2.2. Validation of the Method
2.2.1. Limit of Detection (LOD) and Limit of Quantification (LOQ)
LOD and LOQ were determined for individual analytes (Table 3). The sensitivity of the developed HPLC-MS/MS method was evaluated by these two parameters. LOD values were between 0.001 and 0.422 µg/mL, and LOQ values ranged from 0.003 to 1.406 µg/mL according to the analyte. The lowest LOD and LOQ were established for astaxanthin, and the highest for zeaxanthin. The LOD and LOQ values obtained demonstrate that the present HPLC–MS/MS method is suitable for the analysis of carotenoids and fat-soluble vitamins in human plasma.
Table 3.
Limit of detection (LOD), limit of quantification (LOQ), recovery, matrix effect, linearity range and correlation coefficient obtained in samples by the HPLC-MS/MS method.
2.2.2. Linearity
Linearity was evaluated according to signal responses of target analytes from spiked plasma samples at seven different concentrations and by calculating the linear regression. Calibration curves showed linear responses ranging from 0.003 to 10 µg/mL in plasma according to the target analyte. To obtain an adequate accuracy it was necessary to use a weighting factor for most of the analyzed compounds. Sufficient linearity was demonstrated by the coefficient of determination (r2) values, ranging from 0.990 to 0.999. Linear concentration ranges of individual compounds and associated coefficients of determination are shown in Table 3.
2.2.3. Recovery
The recoveries of analyzed carotenoids and fat-soluble vitamins were between 86.1% and 104.8%. The lowest recovery was achieved in the case of lutein and zeaxanthin. Individual recoveries established during the method validation are presented in Table 3.
2.2.4. Accuracy and Precision
Intra- and inter-day accuracy and precision in three concentration levels with respect to calibration curves were studied. All the analytes met the acceptance criteria by not exceeding 15% RSD. The highest values of RSD% were 14% for 9-Z-β-carotene and cryptoxanthin. Obtained accuracy ranged from 85.9% to 114.0%. Values of intra- and inter-day precision are summarized in Table 4 and values of intra- and inter-day accuracy are shown in Table 5.
Table 4.
Intra- and inter-day precision obtained in samples by the HPLC-MS/MS method.
Table 5.
Intra- and inter-day accuracy obtained in samples by the HPLC-MS/MS method.
2.2.5. Matrix Effect
The final quality parameter of the validation procedure was the matrix effect. Matrix effect values ranged from 86.9% to 108.5% (Table 3). MS signal suppression was achieved for 13-Z-β-carotene, cryptoxanthin, lutein, zeaxanthin, β-carotene, 9-Z-β-carotene, retinol acetate, 25-hydroxycholecalciferol, cholecalciferol, α-tocotrienol, and 5-Z-lycopene. MS signal enhancement was obtained for E-β-apo-8′-carotenal, α-carotene, astaxanthin, cantaxanthin, and retinol.
2.3. Quantification of Carotenoids and Fat-Soluble Vitamins in Human Plasma
Concentrations of carotenoids and fat-soluble vitamins found in the human plasma after a high antioxidant intervention are shown in Table 6. In plasma samples from eight volunteers the following carotenoids and fat-soluble vitamins were found at quantifiable concentrations: retinol, 25-hydroxycholecalciferol, cantaxanthin, β-carotene, and α-carotene. The highest concentration was obtained in the case of β-carotene (2634.1 ± 1870.3 nM). Retinol acetate, astaxanthin, E-β-apo-8′-carotenal, and cryptoxanthin were also detected in plasma but at concentration levels lower than their LOQ. The other targeted analytes were not detected.
Table 6.
Carotenoids and fat-soluble vitamins quantified in plasma by the HPLC-MS/MS method.
3. Discussion
3.1. HPLC-MS/MS Method Development
3.1.1. Extraction of Carotenoids and Fat-Soluble Vitamins
To keep costs of analytical procedures down, it is necessary to minimize the quantity of plasma used, which entails a lower consumption of chemicals. Two hundred µL of human plasma was used in our experiments. In previously published work, quantities such as 200 µL [28,29], 100 µL [23], 800 µL [30], 1 mL [31], and 300 µL [32] of plasma have been required. Isolation of fat-soluble micronutrients from plasma generally consists of two steps. Deproteinization by the addition of methanol, acetonitrile [31,33] or ethanol [23,29,30,33] to plasma is required as a prior step. Deproteinization is usually followed by extraction with hexane [29], heptane [21] or a combination of hexane with another solvent [34]. Solvents used for extraction are very often enriched with an antioxidant, such as tert-butylated hydroxytoluene or ascorbic acid, to protect carotenoids and fat-soluble vitamins [29,32]. In our study, ethanol for deproteinization and n-hexane enriched with BHT at a concentration of 100 mg/L were chosen. The designed extraction technique is simple, repeatable, non-time consuming and provides good recoveries (Table 3).
3.1.2. Chromatographic and MS/MS Conditions
Numerous HPLC-DAD methods have been designed to determine carotenoids and fat-soluble vitamins [23,24,25]. However, chromatographic techniques coupled to mass detection used for the analysis of a wide range of analytes are scarce. The available HPLC–MS or HPLC–MS/MS methods analyze fewer analytes in comparison with the method described here [25,26,29,32,35,36]. During the development of this method, different combinations of solvents for the preparation of mobile phases and gradients were tested: A = 80:20 MeOH/W (v/v), B = 78:20:2 MTBE/MeOH/W (v/v/v); A = MeOH, B = MTBE and A = MeOH, B = 80:20 MTBE/MeOH (v/v). At the beginning of the study, the total run time for an adequate separation of our analytes was 72 min with the following linear gradient used for B (t (min), %B): (0.0, 90); (40.0, 40); (60.0, 6); (62.0, 90); (72.0, 90) [24]. Before the validation of the method, the resulting total run time was 50 min, with the linear gradient as described in Materials and Methods.
LC solvent additives such as formic acid, acetic acid, propionic acid, ammonium acetate, ammonium formate, and others are usually used in HPLC–MS and HPLC–MS/MS analyses to enhance the mass signal [22,25,26,35,36,37,38]. For example, Kopec et al. [25], who analyzed carotenoids, retinyl esters, α-tocopherol and phylloquinone in chylomicron-rich fractions of human plasma, compared the effects of adding water (no additive), formic acid, and ammonium acetate to the mobile phase, obtaining the best results with the addition of ammonium acetate. Ammonium acetate for mass signal enhancement was also used for the analysis of carotenoids by Meulebroek et al. [26] and Arathi et al. [22]. Another preferred LC solvent additive for MS analysis of carotenoids is ammonium formate [35,36]. In our preliminary experiments, all tested mobile phases were enriched with AMAC at a concentration of 0.4 g/L. Then, the effects of the following additives and their combinations were compared: 0.4 g/L AMAC, 0.7 g/L AMAC, 1 g/L AMAC, 0.4 g/L AMAC + 0.1% AA, 0.7 g/L AMAC + 0.1% AA, 1 g/L AMAC + 0.1% AA (Table 1). Due to providing the best MS signal enhancement for the most problematic analytes, the combination of 0.7 g/L AMAC + 0.1% AA was chosen for the final data acquisition.
These conditions allowed us to efficiently separate 16 analytes in an acceptable time, with very good resolution and suitable sensitivity for the analysis of biological fluids. To the best of our knowledge, a similar HPLC-MS/MS method for the determination of a large number of the afore mentioned analytes has not been previously published.
3.2. Method Validation
The proposed method was fully validated based on the criteria of the AOAC International [39]. Since few methods for the simultaneous determination of a wide range of carotenoids and fat-soluble vitamins using HPLC-MS/MS have been published, an effective comparison of our results was limited. As in Kopec et al. [25], lutein, cryptoxanthin, α-carotene, and β-carotene were analyzed and as in Meulebroek et al. [26], lutein, zeaxanthin, α-carotene, and β-carotene. In comparison with Kopec et al. [25], lower LOD and LOQ values were obtained for lutein, but the values were higher for the other analytes. In comparison with Meulebroek et al. [26], comparable LOD and LOQ values for lutein and α-carotene were obtained, but our values for zeaxanthin and β-carotene were higher. The most often used method for the analysis of carotenoids and fat-soluble vitamins is HPLC coupled to DAD [23,24,25]. In comparison with a previous study of our group [24], LOD and LOQ values achieved by the present HPLC-MS/MS method were lower for retinol, astaxanthin, lutein, E-β-Apo-8′-carotenal, 13-Z-β-carotene, α-carotene, and β-carotene, in some cases, more than 100-fold lower. For cryptoxantin, zeaxantin, and 9-Z-β-carotene we obtained comparable LOD and LOQ values. Thus, our method achieved a considerable improvement in LOD and LOQ values in relation to HPLC–DAD methods.
Another very important quality parameter is recovery. Achieved recoveries were in approximate agreement with those published by Lee et al. [23], Colmán-Martínez et al. [24], and Karppi et al. [29]. Recoveries obtained during our experiments were between 86.1% and 104.8%, in comparison with 87% to 105% reported by Lee et al. [23] for α-tocotrienol, retinol, α-carotene, β-carotene, lutein, zeaxanthin, and canthaxanthin. Karppi et al. [29] published recoveries between 86.8% and 103% for retinol, lutein, zeaxanthin, E-β-apo-8′-carotenal, cryptoxanthin, α-carotene, and β-carotene. Recoveries achieved by Colmán-Martínez et al. [24] ranged from 89% to 107% for retinol, astaxanthin, lutein, E-β-apo-8′-carotenal, 13-Z-β-carotene, α-carotene, β-carotene, cryptoxantin, zeaxantin, and 9-Z-β-carotene. The biggest differences in recovery were for lutein and zeaxanthin, which in our case were 86.1% and 86.2%, respectively. The average recovery for these compounds published in the above-mentioned studies is approximately 100%.
For the quality evaluation of our method, we also calculated the matrix effect. It is essential to calculate this parameter for HPLC-MS/MS methods designed to determine compounds in complex matrices such as human plasma, because the matrix can enhance or suppress the acquired MS signal. The matrix effect calculated for each analyte is shown in Table 3. Data to compare the matrix effect was not found.
Perhaps the most valuable parameters for assessing the potential application of the developed method to real samples were intra- and inter-day precision and accuracy, which were determined by injection of plasma extracts spiked at three different concentrations (low, medium, and high) in 5 replications. Intra-day precision ranged from 0.1 to 14.0 RSD% and inter-day from 0.7 to 13.1 RSD%. Values of intra-day accuracy were between 85.9% and 114%. Inter-day accuracy was between 90.3% and 106.6%. These results are summarized in Table 4 and Table 5. Kopec et al. [25] report an accuracy ranging from 93% to 102%, and inter-day precision from 4.5 RSD % to 15 RSD % for lutein, cryptoxanthin, α-carotene and β-carotene. The highest conformity with our analytes (11 common analytes) is found in the study by Colmán-Martínez et al. [24], whose values ranged from 1 to 15 RSD% for intra-day precision; 4.9 to 15.1 RSD% for inter-day precision; and an accuracy of 90.7%–112.2%. In comparison with Colmán-Martínez et al. [24], the method presented here is more precise and the accuracy is comparable. In any case, based on the intra- and inter-day precision and accuracy, our method is repeatable and reproducible and therefore highly suitable for application to real biological samples such as human plasma.
3.3. Quantification of Carotenoids and Fat-Soluble Vitamins in Human Plasma
The plasma samples collected after a high antioxidant intervention were analyzed. As the content of carotenoids and fat-soluble vitamins depends on alimentary intake, we could not compare our results (concentrations in plasma before the intervention) with other results such as those published by Colmán-Martínez et al. [24].
4. Materials and Methods
4.1. Standards, Solvents and Reagents
Carotenoids and fat-soluble vitamin standards: E-β-apo-8′-carotenal, α-carotene, 13-Z-β-carotene, cryptoxanthin, lutein, zeaxanthin, astaxanthin, cantaxanthin, β-carotene, 9-Z-β-carotene, retinol, retinol acetate, 25-hydroxycholecalciferol, cholecalciferol and α-tocotrienol were purchased from Sigma-Aldrich (St. Louis, MO, USA). The standard of 5-Z-lycopene was supplied by CaroteNature GmbH (Ostermundigen, Switzerland).
MeOH of LC-MS grade, n-hexane, ethanol and MTBE of HPLC grade, synthetic plasma and butylated hydroxytoluene (BHT) were obtained from Sigma-Aldrich. AMAC and AA of HPLC grade were purchased from Panreac Quimica SA (Barcelona, Spain). Ultrapure water (Milli-Q) was generated by a Millipore system (Millipore, Bedford, MA, USA).
Preparation of Standard Solutions
All carotenoid and fat-soluble vitamin standards were prepared at a concentration of 1 mg/mL of MTBE by dissolving 1 mg of each standard in 1 mL of MTBE. All standards were processed and manipulated under dim light to protect against light-induced isomerization or possible degradation. Individual working standards were stored in eppendorf tubes and kept in a freezer at −80 °C until analysis. The stock solution used to spike synthetic plasma was prepared by mixing individual working standards at a concentration of 10 µg/mL in MeOH.
4.2. UHPLC-MS/MS Method Development
4.2.1. Instrumentation
HPLC-MS/MS was carried out in an Agilent 1100 HPLC system (Agilent Technologies, Hewlett-Packard, Waldbronn, Germany), consisting of a binary pump and an autosampler coupled to a QTRAP4000 (AB Sciex, Foster City, CA, USA) triple quadrupole mass spectrometer with a DAD detector, which was operated in multiple reaction monitoring (MRM) mode. Chromatographic separation was performed on a reversed phase column YMC Carotenoid S-5 μm, 250 × 4.6 mm (Waters, Milford, MA, USA), maintained at 40 °C.
4.2.2. Chromatographic Conditions
For chromatographic separation, the following combination of mobile phases was used. Mobile phase A consisted of MeOH, AMAC at a concentration of 0.7 g/L and 0.1% of acetic acid. Mobile phase B contained MTBE and MeOH (80:20, v/v), AMAC at a concentration of 0.7 g/L and 0.1% of acetic acid. The following linear gradient of A was used (t (min), %A): (0.0, 90); (10.0, 75); (20.0, 50); (25.0, 30); (35.0, 10); (37.0, 6); (39.0, 90); (50.0, 90). Total run time of analysis was 50 min. The mobile phase flow rate was 600 µL/min, and 20 µL of the sample was injected into the UHPLC system.
4.2.3. MS Conditions
A triple quadrupole mass spectrometer QTRAP4000 (Sciex, Foster City, CA, USA) equipped with APCI ionization source and controlled by Analyst v.1.6.2 software (Sciex) was used for direct infusion experiments. During the infusion experiments, the equivalent mixture (50:50, v/v) of mobile phase containing MeOH:W (80:20, v/v) + 0.4 g/L AMAC and mobile phase containing MTBE:MeOH:W (78:20:2, v/v/v) + 0.4 g/L AMAC was used. All individual standards were injected at a concentration of 1 µL. An atmospheric-pressure chemical ionization source was working in positive ionization mode. After various optimization experiments, the following parameters were chosen to analyze the final samples: curtain gas, 20 psi; source temperature, 400 °C; ion source gas 1 (GS1), 45 psi; ion source gas 2 (GS2), 0 psi; entrance potential (EP), 10 V; collision cell exit potential (CXP), 15 V. Values of declustering potential (DP) were individual for each standard. During the preliminary experiments, the various combinations of precursor-product ions were obtained. The most selective combination for the analyte with the highest MS signal intensity was chosen for final acquisition data. The resulting data acquisition was performed via MRM mode with a dwell time of 120 ms, with 1412 cycles, and between 10 and 14 data points on the peaks. The product ions were generated by collision-activated dissociation (CAD) applied to selected precursor ions in the mass spectrometer collision cell. The chosen MRM transitions and optimal values of DP and collision energy (CE) for all 17 standards are shown in Table 2.
4.2.4. Quality Parameters
The present method was validated according to the criteria of AOAC International [39]. The quality parameters established for the validation of the method were accuracy, intra- and inter-day precision, recovery, limit of detection (LOD), limit of quantification (LOQ), and linearity. LOD is the lowest quantity of a substance that can be distinguished from the absence of that substance (a blank value) within a stated confidence limit. The LOD is estimated from the mean of the blank, the standard deviation of the blank and the confidence factor. The LOD was estimated from the chromatograms of spiked blank plasma at the lowest analyte concentration tested for a signal-to-noise ratio of 3. Similarly, the LOQ is the lowest concentration not only at which the analyte can be reliably detected but at which predefined goals for precision and accuracy are met. The LOQ is at a higher concentration than LOD. The LOQ was determined for a signal-to-noise ratio of 10.
Another quality parameter, recovery, was established by preparing internal calibration curves (synthetic plasma was spiked before the extraction procedure) and external calibration curves (samples were spiked after extraction procedure). Firstly, the concentration had to be calculated by interpolation of individual analyte areas obtained from the samples spiked after the extraction procedure by samples spiked before the extraction procedure. Further, the dependency of ratio analyte concentration to internal standard concentration on calculated concentration was plotted. Then, a linear regression was applied. The slope multiplied by 100 corresponded to the analyte recovery.
To determine the presence or non-presence of a plasma matrix effect, two calibration curves were prepared. MS/MS areas of known amounts of standards (calibration curve prepared by dissolving of working mixture of standards in MeOH–(A)) were compared with those measured in a blank plasma extract spiked, after extraction, with the same amount of the working mixture of standards (B). The ratio (B/A × 100) was defined as the matrix effect (ME). A value of 100% indicates that there was no matrix effect. There was signal enhancement if the value was higher than 100% and signal suppression if the value was lower than 100%.
Linearity was tested by evaluating signal responses of target analytes from spiked plasma samples at seven different concentrations and by calculating linear regression.
Accuracy expresses the closeness of mean test results obtained by the developed method to the actual concentration of the analyte, and was determined by spiking blank plasma with three known concentrations (low, medium, and high with respect to the calibration curve). The accuracy was expressed as the percentage of the ratio of the mean observed concentration and the known spiked concentration in the plasma matrix. The mean accuracy should be within ±15% of the nominal value. Precision of a method is the closeness of agreement between independent test results obtained from homogenous test material under specified conditions of use. Intra-day precision and inter-day precision were studied. It was decided to use five replicates per three concentration levels: low, medium, and high in a single run or in three different days. The precision of the developed method was evaluated by the %RSD (percentage of relative standard deviation of intra- and inter-day repeatability). The values determined at each concentration level should not exceed 15% of RSD.
4.3. Method Application to Real Samples: Human Dietary Intervention Study
The human plasma samples were obtained from healthy, non-smoking male volunteers (8 volunteers), aged between 18 and 32 years. The plasma samples in the pilot human study were collected after two weeks of a high antioxidant dietary intervention consisting of an increased consumption of fruits and vegetables. Blood collection was performed in the morning at 08:00 after fasting. Collected blood samples were immediately centrifuged at 3500 rpm for 15 min at 6 °C. Plasma was separated and samples were stored at −80 °C until analysis. For the determination of carotenoids and fat-soluble vitamins, 200 µL of human plasma was used. The study protocol was approved by the Ethics Committee of Clinical Investigation of the University of Barcelona (Spain) (Institutional Review Board IRB00003099; Approval date: 12 April 2016).
Extraction of Carotenoids and Fat-Soluble Vitamins
In preliminary experiments, liquid-liquid extraction as previously described by our group in [30] was used for the isolation of selected carotenoids and fat soluble vitamins. For our purpose, the following double liquid-liquid extraction method was designed. Two hundred microliters of ethanol causing deproteinization and 0.5 mL of n-hexane/BHT (100 mg/L) were added to 200 μL of human plasma in an eppendorf tube. This step was followed by a vortexing for 1 min and centrifugation at 2070× g for 5 min at 4 °C. The upper nonpolar hexane layer was removed from the two-phase liquid system to another eppendorf tube. The remaining aqueous plasma phase was re-extracted by the second addition of 0.5 mL of n-hexane/BHT (100 mg/L) followed by vortexing for 1 min and centrifugation at 2070× g for 5 min at 4 °C. The upper nonpolar hexane layer was again removed. Both nonpolar layers were combined in an eppendorf tube and evaporated to dryness by a sample concentrator under nitrogen gas at 25 °C followed by a reconstitution with 100 μL of MeOH. Finally, the samples were stored in glass amber vials with inserts in an ultra-freezer at −80 °C until HPLC-MS/MS analysis. In comparison to a previously published extraction method, we have only proportionally changed volumes of the used solvents and we have also exchanged the solvent for reconstitution of a sample. The same design was used to prepare internal and external calibration curves with purified human plasma. Stock solution of synthetic plasma was prepared by dissolving the purified human plasma in 50 mL of Mili-Q water. For this purpose, mixtures of the above-mentioned individual working standards in methanol at 10, 5, 2.5, 1, 0.5, 0.1, 0.05, 0.01 and 0 µg/mL concentrations have been prepared. For preparation of the internal calibration curve, the following extraction procedure was performed on each concentration level. Two hundred microliters of ethanol was added to 200 μL of human plasma in an eppendorf tube. Then, the plasma sample was spiked by 100 μL of stock solution of individual working standards. This step was followed by the addition of 0.5 mL of n-hexane/BHT (100 mg/L) and by a vortexing for 1 min and centrifugation at 2070× g for 5 min at 4 °C. The upper nonpolar hexane layer was removed from the two-phase liquid system to another eppendorf tube. The remaining aqueous plasma phase was re-extracted as described above. Both nonpolar layers were combined in an eppendorf tube and evaporated to dryness by a sample concentrator under nitrogen gas at 25 °C, followed by a reconstitution with 100 μL of MeOH. The processed samples were also stored into glass amber vials with inserts in an ultra-freezer at −80 °C until HPLC-MS/MS analysis. For preparation of external calibration curve the exact same extraction procedure was performed on each concentration level, but in this case, removed combined nonpolar phases were spiked by 100 μL of stock solution of individual working standards before evaporating to dryness and reconstitution. All samples were manipulated under dim light during the all procedure steps in order to avoid oxidation and/or isomerization of the bioactive compounds.
5. Conclusions
A unique HPLC-MS/MS method for the simultaneous quantification of 16 carotenoids and fat-soluble vitamins in human plasma was designed and fully validated. Good quality values of LOD, LOQ, recovery, linearity, matrix effect, accuracy, and precision were obtained by the proposed method. According to our knowledge, no similar HPLC-MS/MS method for the determination of such a large number of analytes has been previously published. In the future, considering the excellent validation results obtained, this method could be used in various applied clinical studies or investigations.
Acknowledgments
This work was supported in part by CICYT (AGL2013-49083-C3-1-R), the Instituto de Salud Carlos III, ISCIII (CIBEROBN) from the Spanish Ministry of Economy and Competivity (MEC) and Generalitat de Catalunya (GC) 2014 SGR 773. The work was also supported by student grant n. SGS04/PřF/2016 from University of Ostrava, Czech Republic and by the Project LO1208 (TEWEP) of the National Feasibility Programme I of the Czech Republic.
Author Contributions
Rosa Maria Lamuela-Raventós and Jiří Kalina designed the research; Sara Hurtado-Barroso elaborated the plasma samples; Barbora Hrvolová, Miriam Martínez-Huélamo and Mariel Colmán-Martínez conducted the research; Barbora Hrvolová and Miriam Martínez-Huélamo analyzed the data; and Barbora Hrvolová wrote the paper. All authors read and approved the final manuscript.
Conflicts of Interest
The authors declare no conflict of interest.
Abbreviations
| MeOH | Methanol |
| MTBE | Methyl-tert-butyl ether |
| BHT | Butylated hydroxy toluene |
| AMAC | Ammonium acetate |
| AA | Acetic acid |
| W | Water |
| CAD | Collision-activated dissociation |
| DP | Declustering potential |
| APCI | Atmospheric pressure chemical |
| EP | Entrance potential |
| CE | Collision energy |
| HPLC-MS/MS | High performance liquid chromatography coupled to mass spectrometry in tandem mode |
| LOD | Limit of detection |
| LOQ | Limit of quantification |
| MRM | Multiple reaction monitoring |
| ME | Matrix effect |
| MS | Mass spectrometry |
| CXP | Cell exit potential |
| RSD | Relative standard deviation |
| RT | Retention time |
References
- Maiani, G.; Periago Castón, M.J.; Catasta, G.; Toti, E.; Cambrodón, I.G.; Bysted, A.; Granado-Lorencio, F.; Olmedilla-Alonso, B.; Knuthsen, P.; Valoti, M.; et al. Carotenoids: Actual knowledge on food sources, intakes, stability and bioavailability and their protective role in humans. Mol. Nutr. Food Res. 2009, 53, S194–S218. [Google Scholar] [CrossRef] [PubMed]
- Granado, F.; Olmedilla, B.; Blanco, I. Nutritional and clinical relevance of lutein in human health. Br. J. Nutr. 2003, 90, 487–502. [Google Scholar] [CrossRef] [PubMed]
- Balvers, M.G.J.; Brouwer-Brolsma, E.M.; Endenburg, S.; de Groot, L.C.P.G.M.; Kok, F.J.; Gunnewiek, J.K. Recommended intakes of vitamin D to optimise health, associated circulating 25-hydroxyvitamin D concentrations, and dosing regimens to treat deficiency: Workshop report and overview of current literature. J. Nutr. Sci. 2015, 4, 1–8. [Google Scholar] [CrossRef] [PubMed]
- Romney, S.L.; Palan, P.R.; Basu, J.; Mikhail, M. Nutrient antioxidants in the pathogenesis and prevention of cervical dysplasias and cancer. J. Cell Biochem. 1995, 59, S96–S103. [Google Scholar] [CrossRef]
- Perraud, A.; Nouaille, M.; Akil, H.; Petit, D.; Labrousse, F.; Jauberteau, M.; Mathonnet, M. Retinoid acid receptors in human colorectal cancer: An unexpected link with patient outcome. Exp. Ther. Med. 2011, 3, 491–497. [Google Scholar] [CrossRef] [PubMed]
- Scientific Report of the 2015 Dietary Guidelines Advisory Committee. Available online: http://health.gov/dietaryguidelines/2015-scientific-report/pdfs/scientific-report-of-the-2015-dietary-guidelines-advisory-committee.pdf (accessed on 20 June 2016).
- Food Based Dietary Guidelines in the WHO European Region. Available online: http://www.euro.who.int/__data/assets/pdf_file/0017/150083/E79832.pdf (accessed on 20 June 2016).
- Stahl, W.; Sies, H. Bioactivity and protective effects of natural carotenoids. BBA Mol. Basis Dis. 2005, 1740, 101–107. [Google Scholar] [CrossRef] [PubMed]
- Rodriguez-Amaya, D.B. A Guide to Carotenoid Analysis in Foods; ILSI Press: Washington, DC, USA, 2001; pp. 1–22. [Google Scholar]
- Su, C.-C.; Chan, C.-M.; Chen, H.-M.; Wu, C.-C.; Hsiao, C.-Y.; Lee, P.-L.; Lin, V.C.-H.; Hung, C.-F. Lutein Inhibits the Migration of Retinal Pigment Epithelial Cells via Cytosolic and Mitochondrial Akt Pathways (Lutein Inhibits RPE Cells Migration). Int. J. Mol. Sci. 2014, 15, 13755–13767. [Google Scholar] [CrossRef] [PubMed]
- Gómez-García, M.R.; Ochoa-Alejo, N. Biochemistry and Molecular Biology of Carotenoid Biosynthesis in Chili Peppers (Capsicum spp.). Int. J. Mol. Sci. 2013, 14, 19025–19053. [Google Scholar] [CrossRef] [PubMed]
- Laddomada, B.; Durante, M.; Minervini, F.; Garbetta, A.; Cardinali, A.; D’Antuono, I.; Caretto, S.; Blanco, A.; Mita, G. Phytochemical Composition and Anti-Inflammatory Activity of Extracts from the Whole-Meal Flour of Italian Durum Wheat Cultivars. Int. J. Mol. Sci. 2015, 16, 3512–3527. [Google Scholar] [CrossRef] [PubMed]
- Nishino, A.; Ichihara, T.; Takaha, T.; Kuriki, T.; Nihei, H.; Kawamoto, K.; Yasui, H.; Maoka, T. Accumulation of Paprika Carotenoids in Human Plasma and Erythrocytes. J. Oleo Sci. 2015, 64, 1135–1142. [Google Scholar] [CrossRef] [PubMed]
- Rodríguez-Bernaldo de Quirós, A.; Costa, H.S. Analysis of carotenoids in vegetable and plasma samples: A review. J. Food Comp. Anal. 2006, 19, 97–111. [Google Scholar] [CrossRef]
- Bertram, J.S. Carotenoids and Gene Regulation. Nutr. Rev. 1999, 57, 182–191. [Google Scholar] [CrossRef] [PubMed]
- Cooper, D.A.; Eldridge, A.L.; Peters, J.C. Dietary carotenoids and lung cancer: A review of recent research. Nutr. Rev. 1999, 57, 133–145. [Google Scholar] [CrossRef] [PubMed]
- Palace, V.P.; Khaper, N.; Qin, Q.; Singal, P.K. Antioxidant potentials of vitamin A and carotenoids and their relevance to heart disease. Free Radic. Biol. Med. 1999, 26, 746–761. [Google Scholar] [CrossRef]
- Mostafa, W.Z.; Hegazy, R.A. Vitamin D and the skin: Focus on a complex relationship: A review. J. Adv. Res. 2015, 6, 793–804. [Google Scholar] [CrossRef] [PubMed]
- Reboul, E. Absorption of vitamin A and carotenoids by the enterocyte: Focus on transport proteins. Nutrients 2013, 5, 3563–3581. [Google Scholar] [CrossRef] [PubMed]
- Albarhani, A.A.; Collier, F.; Greaves, R.F.; Ponsonby, A.-L.; Allen, K.J.; Vuillermin, P.J.; Roche, P.; Clarke, M.W. Vitamins D and A can be successfully measured by LC–MS/MS in cord blood diluted plasma. Clin. Biochem. 2015, 48, 1105–1112. [Google Scholar] [CrossRef] [PubMed]
- Donaldson, M. Development of a rapid, simple assay of plasma total carotenoids. BMC Res. Notes 2012, 5, 521. [Google Scholar] [CrossRef] [PubMed]
- Arathi, B.P.; Sowmya, P.R.R.; Vijay, K.; Dilshad, P.; Saikat, B.; Gopal, V.; Lakshminarayana, R. An Improved Method of UPLC-PDA-MS/MS Analysis of Lycopene Isomers. Food Anal. Methods 2015, 8, 1962–1969. [Google Scholar] [CrossRef]
- Lee, B.L.; New, A.L.; Ong, C.N. Simultaneous determination of tocotrienols, tocopherols, retinol, and major carotenoids in human plasma. Clin. Chem. 2003, 49, 2056–2066. [Google Scholar] [CrossRef] [PubMed]
- Colmán-Martínez, M.; Martínez-Huélamo, M.; Miralles, E.; Estruch, R.; Lamuela-Raventós, R.M. A new method to simultaneously quantify the antioxidants: Carotenes, xanthophylls, and vitamin A in human plasma. Oxid. Med. Cell Longev. 2016, 2016, 1–10. [Google Scholar] [CrossRef] [PubMed]
- Kopec, R.E.; Schweiggert, R.M.; Riedl, K.M.; Carle, R.; Schwartz, S.J. Comparison of high-performance liquid chromatography/tandem mass spectrometry and high-performance liquid chromatography/photo-diode array detection for the quantitation of carotenoids, retinyl esters, α-tocopherol and phylloquinone in chylomicron-rich fr: Fat-soluble compounds from chylomicron fractions. Rapid Commun. Mass Spectrom. 2013, 27, 1393–1402. [Google Scholar] [PubMed]
- Van Meulebroek, L.; Vanden Bussche, J.; Steppe, K.; Vanhaecke, L. High-resolution Orbitrap mass spectrometry for the analysis of carotenoids in tomato fruit: Validation and comparative evaluation towards UV–VIS and tandem mass spectrometry. Anal. Bioanal. Chem. 2014, 406, 2613–2626. [Google Scholar] [CrossRef] [PubMed]
- Vallverdú-Queralt, A.; Martínez-Huélamo, M.; Arranz-Martinez, S.; Miralles, E.; Lamuela-Raventós, R.M. Differences in the carotenoid content of ketchups and gazpachos through HPLC/ESI(Li+)–MS/MS correlated with their antioxidant capacity. J. Sci. Food Agric. 2012, 92, 2043–2049. [Google Scholar] [CrossRef] [PubMed]
- Turner, T.; Burri, B.J. Rapid Isocratic HPLC Method and Sample Extraction Procedures for Measuring Carotenoid, Retinoid, and Tocopherol Concentrations in Human Blood and Breast Milk for Intervention Studies. Chromatographia 2012, 75, 241–252. [Google Scholar] [CrossRef]
- Karppi, J.; Nurmia, T.; Olmedilla-Alonso, B.; Granado-Lorencio, F.; Nyyssönen, K. Simultaneous measurement of retinol, tocopherol and six carotenoids in human plasma by using an isocratic reversed-phase HPLC method. J. Chromatogr. B 2008, 867, 226–232. [Google Scholar] [CrossRef] [PubMed]
- Arranz, S.; Martínez-Huélamo, M.; Vallverdu-Queralt, A.; Valderas-Martinez, P.; Illán, M.; Sacanella, E.; Escribano, E.; Estruch, R.; Lamuela-Raventos, R.M. Influence of olive oil on carotenoid absorption from tomato juice and effects on postprandial lipemia. Food Chem. 2015, 168, 203–210. [Google Scholar] [CrossRef] [PubMed]
- Daykin, C.A.; Foxall, P.J.D.; Connor, S.C.; Lindon, J.C.; Nicholson, J.K. The comparison of plasma deproteinization methods for the detection of low-molecular-weight metabolites by 1H nuclear magnetic resonance spectroscopy. Anal. Biochem. 2002, 304, 220–230. [Google Scholar] [CrossRef] [PubMed]
- Fang, L.; Pajkovic, N.; Wang, Y.; Gu, C.; van Breemen, R.B. Quantitative Analysis of Lycopene Isomers in Human Plasma Using High-Performance Liquid Chromatography Tandem Mass Spectrometry. Anal. Chem. 2003, 75, 812–817. [Google Scholar] [CrossRef] [PubMed]
- Bruce, S.J.; Tavazzi, I.; Parisod, V.; Rezzi, S.; Kochlar, S.; Guy, P.A. Investigation of human blood plasma sample preparation for performing metabolomics using ultrahigh performance liquid chromatography/mass spectrometry. Anal. Chem. 2009, 81, 3285–3296. [Google Scholar] [CrossRef] [PubMed]
- Su, Q.; Rowley, K.G.; Balazs, N.D.H. Carotenoids: Separation methods applicable to biological samples. J. Chromatogr. B Anal. Technol. Biomed. Life Sci. 2002, 731, 393–418. [Google Scholar] [CrossRef]
- Priego Capote, F.; Jiménez, J.R.; Granados, M.M.; de Castro, M.D.L. Identification and determination of fat-soluble vitamins and metabolites in human serum by liquid chromatography/triple quadrupole mass spectrometry with multiple reaction monitoring. Rapid Commun. Mass Spectrom. 2007, 21, 1745–1754. [Google Scholar] [CrossRef] [PubMed]
- Matsubara, A.; Uchikata, T.; Shinohara, M.; Nishiumi, S.; Yoshida, M.; Fukusaki, E.; Bamba, T. Highly sensitive and rapid profiling method for carotenoids and their epoxidized products using supercritical fluid chromatography coupled with electrospray ionization-triple quadrupole mass spectrometry. J. Biosci. Bioeng. 2012, 113, 782–787. [Google Scholar] [CrossRef] [PubMed]
- Albahrani, A.A.; Greaves, R.F. Fat-soluble vitamins: Clinical indications and current challenges for chromatographic measurement. Clin. Biochem. Rev. 2016, 37, 27–47. [Google Scholar] [PubMed]
- Albahrani, A.A.; Rotarou, V.; Roche, P.J.; Greaves, R.F. A simultaneous quantitative method for vitamins A, D and E in human serum using liquid chromatography-tandem mass spectrometry. J. Steroid Biochem. Mol. Biol. 2016, 159, 41–53. [Google Scholar] [CrossRef] [PubMed]
- Official Methods of Analysis of AOAC International. Available online: http://www.eoma.aoac.org/app_e.pdf (accessed on 15 April 2016).

© 2016 by the authors; licensee MDPI, Basel, Switzerland. This article is an open access article distributed under the terms and conditions of the Creative Commons Attribution (CC-BY) license (http://creativecommons.org/licenses/by/4.0/).