


Abstract
To elucidate how the organic cation structure modulates the thermal decomposition of energetic molecular perovskites, DFTB3 molecular dynamics simulations were performed on three systems—PAN-2, PAN-H2 and PAN-M2—assembled from piperazine, homopiperazine and N-methylpiperazine cations with K+ and NO3−, at 2000, 3000 and 4000 K. By jointly analyzing the evolution of pressure and potential energy, K+ coordination with N/O atoms, N–H and C–N bond scission, ring integrity and final products, an atomic-scale decomposition picture was established. All three materials follow a common cascade—deprotonation of the organic cation, ring-opening of the cyclic framework, and ring fragmentation with oxidation—whose temporal character shifts with increasing temperature from a stepwise pathway (the half-lives of deprotonation and ring-opening differing by over 6 ps at 2000 K) to quasi-concerted disintegration (below 1 ps at 4000 K). Deprotonation is temperature-dominated, with apparent activation energies of 44–55 kJ·mol−1, and bond scission occurs abruptly upon crossing a distance threshold; ring-opening requires substantially higher activation energies (ca. 135–158 kJ·mol−1), whereas the effects of ring size and 1-methylation on framework stability are weaker than those of temperature. The nitrate anion acts as an endogenous oxidant, undergoing stepwise deoxygenation (NO3− → NO2 → NO) to drive the formation of H2O and CO/CO2, with product compositions depending on the cation carbon number. The N-coordination fraction in the K+ coordination shell rises synchronously with deprotonation and peaks near the ring-opening half-life, serving as a probe of framework disintegration, albeit one bounded by the temperature regime of nitrate decomposition. These findings reveal a coupling mechanism linking the cationic framework structure, anionic oxygen supply and the K+ coordination response, providing atomic-scale insight into the molecular design and thermal decomposition mechanisms of energetic molecular perovskites.
1. Introduction
As a class of specialized functional materials capable of rapidly releasing energy under external stimuli, energetic materials find wide applications in national defense, aerospace propulsion, mineral exploitation, public safety, and other fields, with their comprehensive performance directly governing equipment effectiveness and engineering applicability [1,2]. Traditional organic energetic materials, such as RDX, HMX, and CL-20, store energy through high-energy intramolecular chemical bonds and are consequently subject to the inherent trade-off between energy content and sensitivity; moreover, their synthesis involves complicated processes, which pose considerable challenges for practical applications [3,4]. In recent years, the emerging class of molecular perovskite energetic materials, in which protonated organic fuels and inorganic oxidizing anions are assembled via ionic interactions into a highly symmetric ABX3-type framework, has achieved uniform fuel–oxidizer integration at the molecular level. Owing to their outstanding advantages of high energy density, structural tailorability, and excellent thermal stability, these materials have become an important research direction in the development of next-generation energetic materials [5]. Such molecular perovskite energetic materials differ fundamentally from the hybrid lead-halide perovskites widely used in optoelectronics, where the B-site Pb2+ cations and X-site halides form an inorganic semiconducting framework that governs the electronic structure, with the A-site organic cations mainly stabilizing the lattice [6,7]. In energetic perovskites, the B site is instead occupied by electrochemically inert cations such as K+ or NH4+, the X site by oxidizing oxygen-containing anions such as ClO4− or NO3−, and the A site by protonated organic fuel cations, so that fuel and oxidizer are densely packed in an alternating three-dimensional lattice [5,8].
Beyond composition, the ABX3 framework itself offers distinct structural advantages for energetic applications. Arranging the fuel and oxidizer on distinct sublattices enables uniform mixing at the molecular level and shortens the diffusion paths of the redox partners, and the oxygen balance can be tuned independently by varying the A-, B-, or X-site components [5,9]. The highly symmetric, densely packed three-dimensional lattice ensures high packing efficiency and crystal density, while the extended ionic interactions, together with the confinement of the organic cations within the inorganic cage, endow these salts with thermal stability markedly higher than that of conventional nitramine explosives [9]. The framework topology is highly tunable, as demonstrated by hexagonal perovskite variants that further enhance crystal density and enthalpy of formation [10].
Since Chen’s group reported the first molecular perovskite energetic material, (H2dabco)[K(ClO4)3] (DAP-2), in 2018 [9], extensive efforts have been devoted to structural modulation and performance optimization. By substituting the A-site organic cation, B-site metal ion, or X-site oxidizing anion, the lattice strain and framework interaction strength can be systematically tuned, thereby modulating detonation properties and thermal stability [11,12]. Han et al. effectively improved the combustion and thermal decomposition properties of these materials by incorporating functional additives such as graphene and MXene [13,14].
This design strategy has been successfully extended to monocyclic piperazine-based cation systems: Shang et al. [8] synthesized a series of metal-free molecular perovskite energetic materials, including PAP-4, PAP-M4, and PAP-H4, using piperazine-1,4-diium, 1-methylpiperazine-1,4-diium, and homopiperazine-1,4-diium as A-site cations, respectively, demonstrating the feasibility and structural tailorability of piperazine-based cations as A-site components of perovskite frameworks. However, existing studies have focused predominantly on systems combining perchlorate as the X-site anion with DABCO-based cage-type A-site cations; the thermal decomposition mechanisms of molecular perovskites with nitrate anions as the oxidizing component and piperazine-based cations as the fuel component remain largely unexplored, and the microscopic mechanisms by which organic cation structure modulates thermal decomposition behavior remain elusive [15,16].
Thermal decomposition characteristics constitute a key metric for evaluating the service safety and energy-release behavior of energetic materials. Macroscopic parameters such as decomposition peak temperature and total mass loss cannot fully characterize thermal behavior, because the complete decomposition process involves multiple coupled stages—proton transfer, ionic coordination rearrangement, framework collapse, and multistep redox reactions—that jointly determine thermal performance [17,18]; in-depth analysis of this process thus provides an effective route to elucidating microscopic reaction mechanisms. In a study on the thermal decomposition of (H2dabco)[K(ClO4)3], Jia et al. [19] found that strong Coulomb interactions between K+ and ClO4− confine protonated H2dabco2+ at low temperatures, and that the anionic framework collapses to trigger proton transfer only after thermal energy overcomes this confinement, indicating that deprotonation is a suprathreshold event crossing an energy barrier rather than gradual thermal elongation of the N–H bond. Similarly, by comparing the pyrolysis pathways of ZIF-8 and ZIF-67 using in situ characterization and theoretical calculations, Wu et al. [20] showed that distinct Zn–N and Co–N coordination environments directly account for their different pyrolysis behaviors, and that coordination-feature evolution corresponds temporally with framework collapse, indicating that the metal-center coordination environment can serve as an effective signal for tracking framework disintegration. These studies show that thermal decomposition analysis not only assesses material safety but also provides a window into microscopic reaction mechanisms. Nevertheless, in molecular perovskite energetic materials, the evolution of the metal-ion coordination environment during decomposition remains rarely investigated; whether coordination-shell composition can serve as a probe of decomposition progress, and the temporal sequence between key steps such as deprotonation and ring-opening, await further exploration.
Experimental studies of the thermal decomposition behavior of energetic materials currently rely mainly on coupled TG–DSC, in situ FTIR, and MS techniques. These techniques provide the decomposition temperature range, macroscopic kinetic parameters, and the composition of final gaseous products, but cannot directly observe bond scission, coordination changes, or the evolution of active intermediates at the atomic scale. Molecular dynamics simulations can help overcome this limitation: by combining TG–DSC–FTIR–MS with ab initio molecular dynamics (AIMD), Zhai et al. revealed the microscopic mechanism of the proton-transfer-initiated decomposition of DAP-4 [18]; however, the high computational cost limits the application of AIMD to large systems and long timescales. Using a parameterized Hamiltonian, the density-functional tight-binding (DFTB) method substantially improves computational efficiency while maintaining accuracy and has been successfully applied to simulate the shock-induced decomposition of HMX and early-stage events in FOX-7 pyrolysis, and to predict the thermal explosion delay times of explosives [21,22].
To address the above issues, this work constructs K-based nitrate molecular perovskite systems using three organic cations with distinct structures—piperazine, homopiperazine, and 1-methylpiperazine. All three cations have been experimentally validated as A-site components of molecular perovskites [23], and their structural differences—ring size, number of N–H sites, and steric hindrance—represent precisely the key dimensions governing deprotonation capability and framework flexibility. Moreover, neither the combination of the K–NO3− framework with piperazine-based cations nor its thermal decomposition mechanism has been reported previously. Using the DFTB3 method implemented in CP2K, we simulate the thermal decomposition of the three systems at different temperatures and track changes in coordination structures, bond scission behavior, ring integrity, and reaction species, thereby unraveling their microscopic decomposition mechanisms at the atomic scale, clarifying the modulating role of organic cation structure, and establishing the intrinsic correlation between structural differences and reaction pathways.
2. Computational Methods and Models
2.1. Self-Consistent-Charge Density-Functional Tight-Binding Method
The density-functional tight-binding (DFTB) method starts from the total-energy expression of density functional theory, expands the electron density fluctuation about a reference density in a Taylor series, and parameterizes the Hamiltonian matrix elements within the tight-binding approximation [24]. In DFTB, the total energy is decomposed into an orbital-energy term and a repulsive-energy term: the orbital energy is related to the electronic structure of the system, while the repulsive energy is obtained through parameterization. The method thus avoids, to a certain extent, the explicit evaluation of electron–electron interactions, thereby substantially improving computational efficiency [24]. In non-self-consistent DFTB, the reference density is taken as a superposition of neutral-atom densities; when pronounced charge transfer occurs in the system, this reference density deviates considerably from the true electron density, which limits the applicability and transferability of the method.
In 1998, Elstner et al. [25] addressed these limitations by proposing an improved scheme, namely the self-consistent-charge density-functional tight-binding (SCC-DFTB) method. Within the DFTB framework, this method introduces a self-consistent charge iteration scheme: the redistribution of atomic charges is explicitly included in the calculation, the Hamiltonian is corrected accordingly and then solved again, and this procedure is repeated until the charge distribution converges, yielding a self-consistent iterative process analogous to that for the Kohn–Sham equations in density functional theory. This improvement enables SCC-DFTB to more accurately describe charge transfer in the system and significantly enhances the transferability of the method.
In the self-consistent-charge density-functional tight-binding (SCC-DFTB) method, the total energy of the system is expanded as a Taylor series and truncated at second order, yielding:
where EBS is the band-structure energy, ERep is the repulsive energy, and E2nd is the second-order correction to the energy, which accounts for the energy change arising from the deviation of the electron density from that of the neutral system due to charge transfer.
In this work, the DFTB3 method is adopted, which further introduces a third-order energy term on top of the second-order expansion of SCC-DFTB [26,27]. The total energy of DFTB3 can be written as:
Here, E3rd denotes the third-order energy correction term. For clarity, the explicit expressions of the individual terms in SCC-DFTB are presented first, followed by the third-order extension of DFTB3.
EBS, ERep and E2nd are given respectively by:
Here, fi is the occupation number of orbital i, RIJ is the distance between atoms I and J, VRep,IJ(RIJ) is the repulsive pair potential between the two atoms, and Γ is the Hartree-exchange correlation kernel; the contribution of δn(r) is atom-centered and can be expanded in a series of radial and angular functions:
Here, is the normalized radial dependence of the electron density on atom I, and Ylm is the angular spherical harmonic function. The total charge of the system is given by:
This leads to a simplified form of the second-order energy term:
Here, ΔqI is the amount of charge transfer on atom I, with . The quantity γIJ is an integral expressed as:
The third-order energy correction term introduced in DFTB3 on this basis is expressed as:
Here, is the third-order kernel function, which describes the nonlinear response of the atomic hardness to charge variation. In addition, DFTB3 introduces an extra short-range damping correction to the γ functions involving hydrogen atoms, so as to improve the description of hydrogen bonding and proton-transfer barriers.
According to tight-binding theory, a self-consistent calculation is performed on the valence-electron wavefunctions, followed by a charge analysis upon convergence to obtain the variation in the atom-centered charges. To solve the Kohn–Sham equations, the wavefunctions are expanded as a linear combination of a set of non-orthogonal atomic orbitals φv:
where cvi denotes the coefficient describing the contribution of the v-th atomic orbital to the i-th molecular orbital. A set of algebraic equations is derived by applying the variational principle to the Kohn–Sham energy functional:
Here, Hμv is the Hamiltonian matrix element, defined as Hmv = ⟨fm|H0|fv⟩, and Sμv is the overlap matrix element, defined as Smv = ⟨fm|fv⟩. Furthermore, the Hamiltonian, overlap integrals and repulsive interactions are evaluated through two-center calculations based on density functional theory, which significantly improves the accuracy and transferability of the self-consistent-charge density-functional tight-binding method.
Moreover, in standard SCC-DFTB, the interatomic Coulomb interaction γab is determined by the Hubbard parameters, which serve in the DFTB framework as measures of both chemical hardness and covalent radius. For hydrogen atoms, this correspondence does not hold strictly, leading to a systematically biased description of hydrogen bonds in hydrogen-containing systems by the standard γ function. To address this issue, DFTB3 introduces a modified γh function for interactions involving hydrogen atoms, making γab more repulsive in both the covalent and hydrogen-bonding regions and thereby improving the description of hydrogen-bond binding energies and proton-transfer barriers. In this work, this correction is enabled via the HB_SR_GAMMA keyword with the damping exponent set to 4.85, consistent with the recommended settings for the 3ob parameter set used herein [28,29,30].
2.2. Molecular Models of the Pan-Series Perovskites
The perovskite unit cells of the PAN series used in this study were taken from the Cambridge Crystallographic Data Centre (CCDC) database [23] (CCDC Nos. 2403002, 2403001 and 2405709), and their crystallographic parameters are listed in Table 1.
Table 1.
Crystallographic data of the three perovskite compounds.
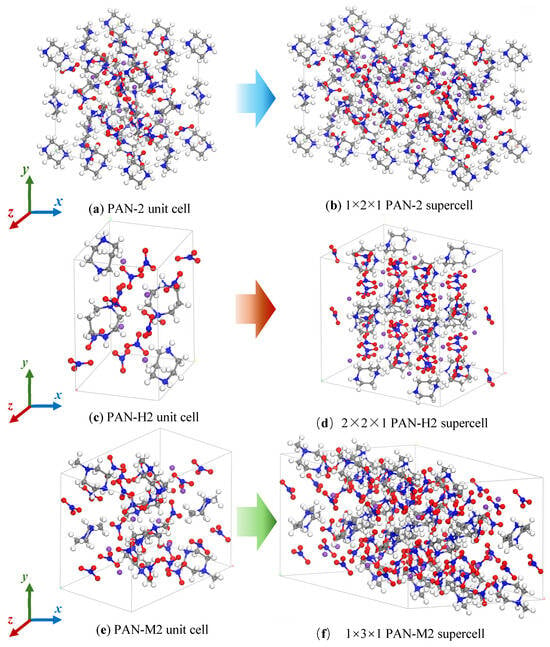
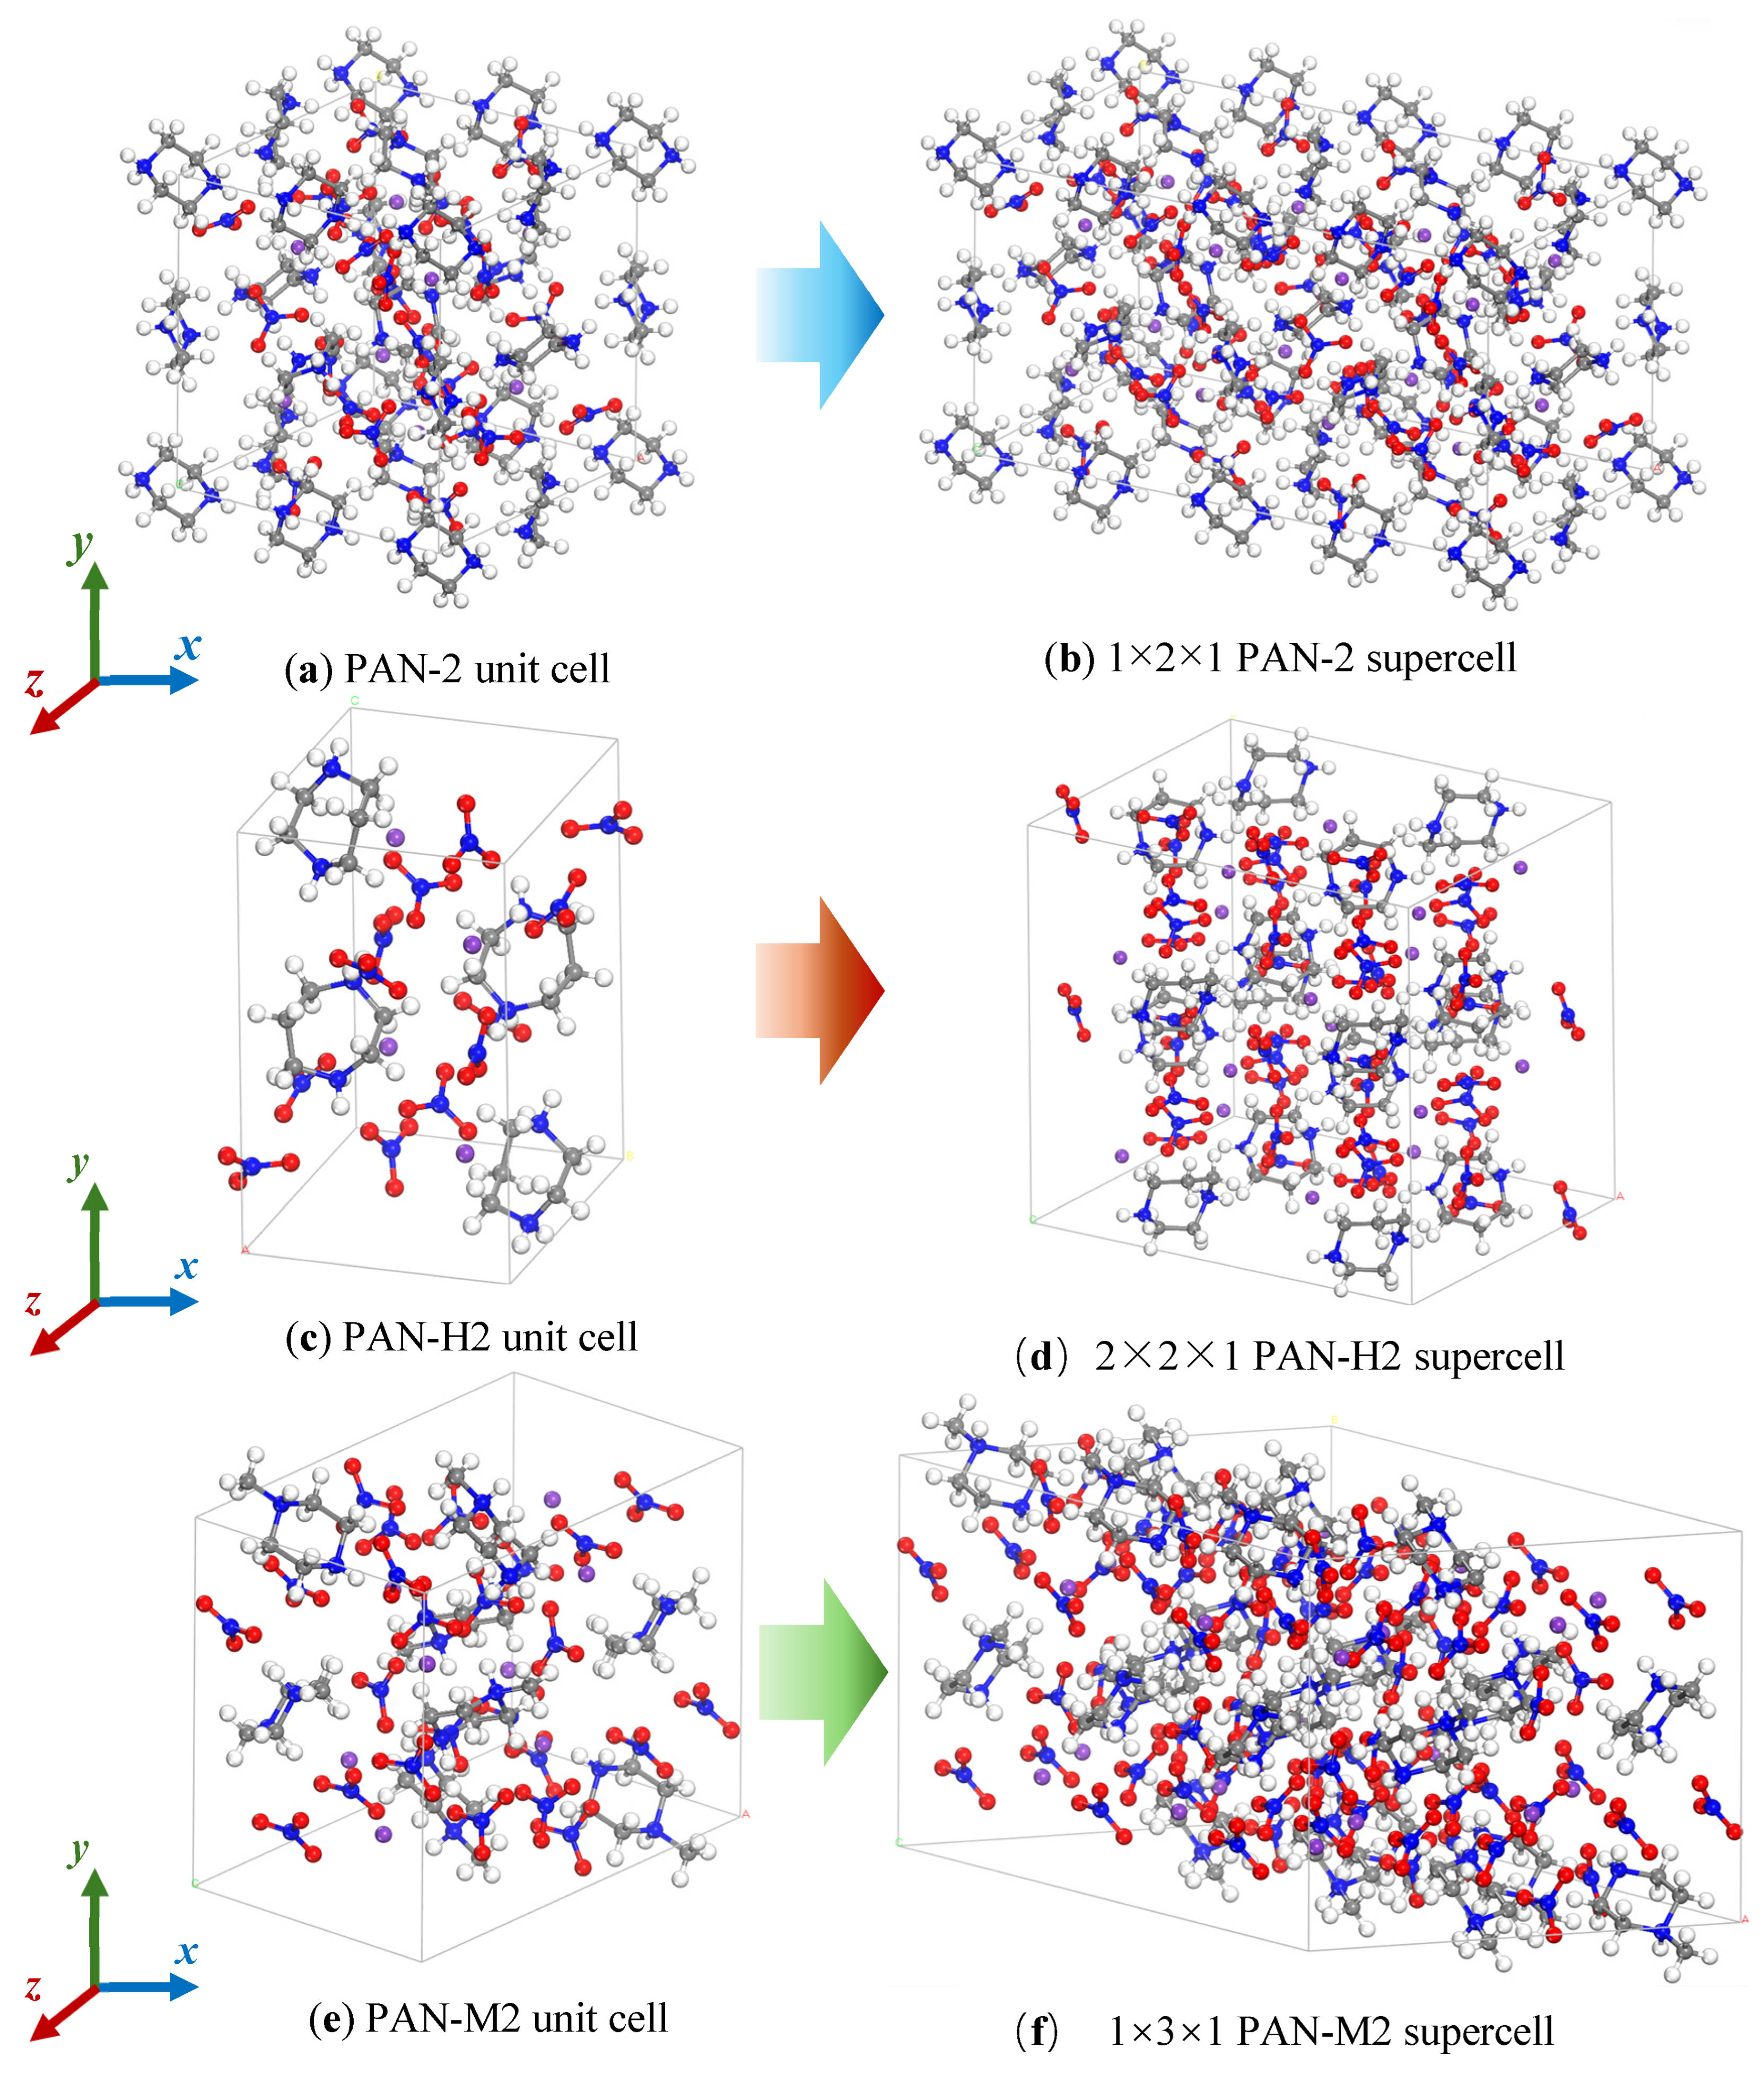
Each PAN-2 unit cell contains 8 piperazinium cations, 24 nitrate anions, and 8 potassium cations, totaling 248 atoms; each PAN-H2 unit cell contains 4 homopiperazinium cations, 12 nitrate anions, and 4 potassium cations, totaling 136 atoms; and each PAN-M2 unit cell contains 8 N-methylpiperazinium cations, 24 nitrate anions, and 8 potassium cations, totaling 272 atoms, as shown in Figure 1a,c,e. The C, H, N, O, and K atoms are shown in gray, white, blue, red, and purple, respectively. To construct supercells for high-temperature thermal decomposition simulations, the PAN-2, PAN-H2, and PAN-M2 unit cells were expanded into 1 × 2 × 1, 2 × 2 × 1, and 1 × 3 × 1 supercells, respectively, yielding periodic supercells containing 496, 544, and 816 atoms, as shown in Figure 1b,d,f.
Figure 1.
Structures of the unit cells and supercells of the PAN-series perovskites.
To obtain supercell structures stable at ambient temperature, the three supercells were first geometry-optimized at a pressure of 0 Pa using the conjugate-gradient algorithm, yielding relaxed lattice parameters. Convergence was considered achieved when the change in the maximum atomic displacement between two consecutive steps was below 3.0 × 10⁻³ bohr, the change in the maximum root-mean-square displacement was below 1.5 × 10⁻³ bohr, the change in the maximum force was below 4.5 × 10⁻⁴ hartree/bohr, the change in the maximum root-mean-square force was below 3.0 × 10⁻⁴ hartree/bohr, and the residual pressure was below 100 Pa. The maximum relative deviation of the optimized lattice constants from the experimental cell parameters does not exceed 2%, as shown in Table 2.
Table 2.
Comparison of cell parameters for PAN-series perovskites before and after optimization.
Subsequently, the optimized PAN-series supercells were subjected to molecular dynamics simulations in the canonical (NVT) ensemble. The system was thermostatted at 298 K using a Nosé–Hoover thermostat with a time constant of 300 fs. The SCF convergence criterion was set to 10−6 a.u., the integration time step to 0.2 fs, and the total simulation time to 10 ps. Finally, a 10 ps relaxation was performed in the isothermal–isobaric (NPT) ensemble at 298 K and 0 GPa, with the temperature and pressure controlled by the Nosé–Hoover thermostat and the Parrinello–Rahman barostat [31,32,33], respectively, yielding the equilibrated supercell structures under ambient conditions.
All molecular dynamics simulations in this study were performed using the CP2K package. The electronic structure of the systems was solved with DFTB3, the third-order self-consistent-charge extension of the density-functional tight-binding method. The third-generation Grimme dispersion correction (D3) was employed to account for weak dispersion interactions [34], and the built-in hydrogen-pair damping scheme of DFTB3 (HB_SR_GAMMA) was applied to improve the description of hydrogen bonding and proton transfer. The interatomic interaction parameters were taken from the 3ob parameter set [35,36,37], which was parameterized against the PBE exchange-correlation functional.
The molecular dynamics simulations were performed in the canonical (NVT) ensemble, with the temperature controlled by a Nosé–Hoover thermostat at three target temperatures of 2000, 3000 and 4000 K. The time step was set to 0.2 fs for 75,000 steps, corresponding to a total duration of 15 ps. The thermostat employed a third-order Yoshida integration algorithm combined with a multiple time step scheme [38,39], and the temperature coupling time constant was set to 300 fs. During the simulations, the system energy, atomic trajectories, stress tensor, atomic forces and cell parameters were recorded. To assess statistical fluctuations, three independent replicate simulations were conducted for each system–temperature condition, with initial configurations sampled from different time points of the 298 K relaxation trajectory and initial velocities reassigned, yielding 27 trajectories in total; the replicate statistics are provided in Tables S3 and S4, Section S1.6 of the Supporting Information.
3. Results and Discussion
3.1. Pressure Evolution During the Reaction
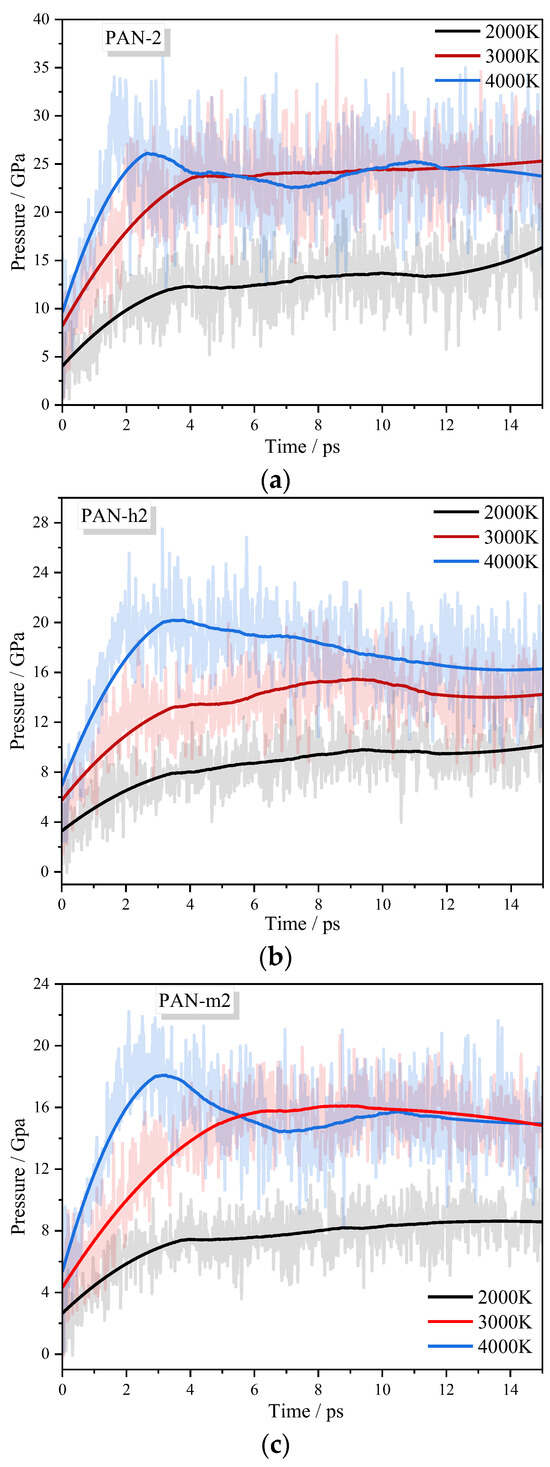
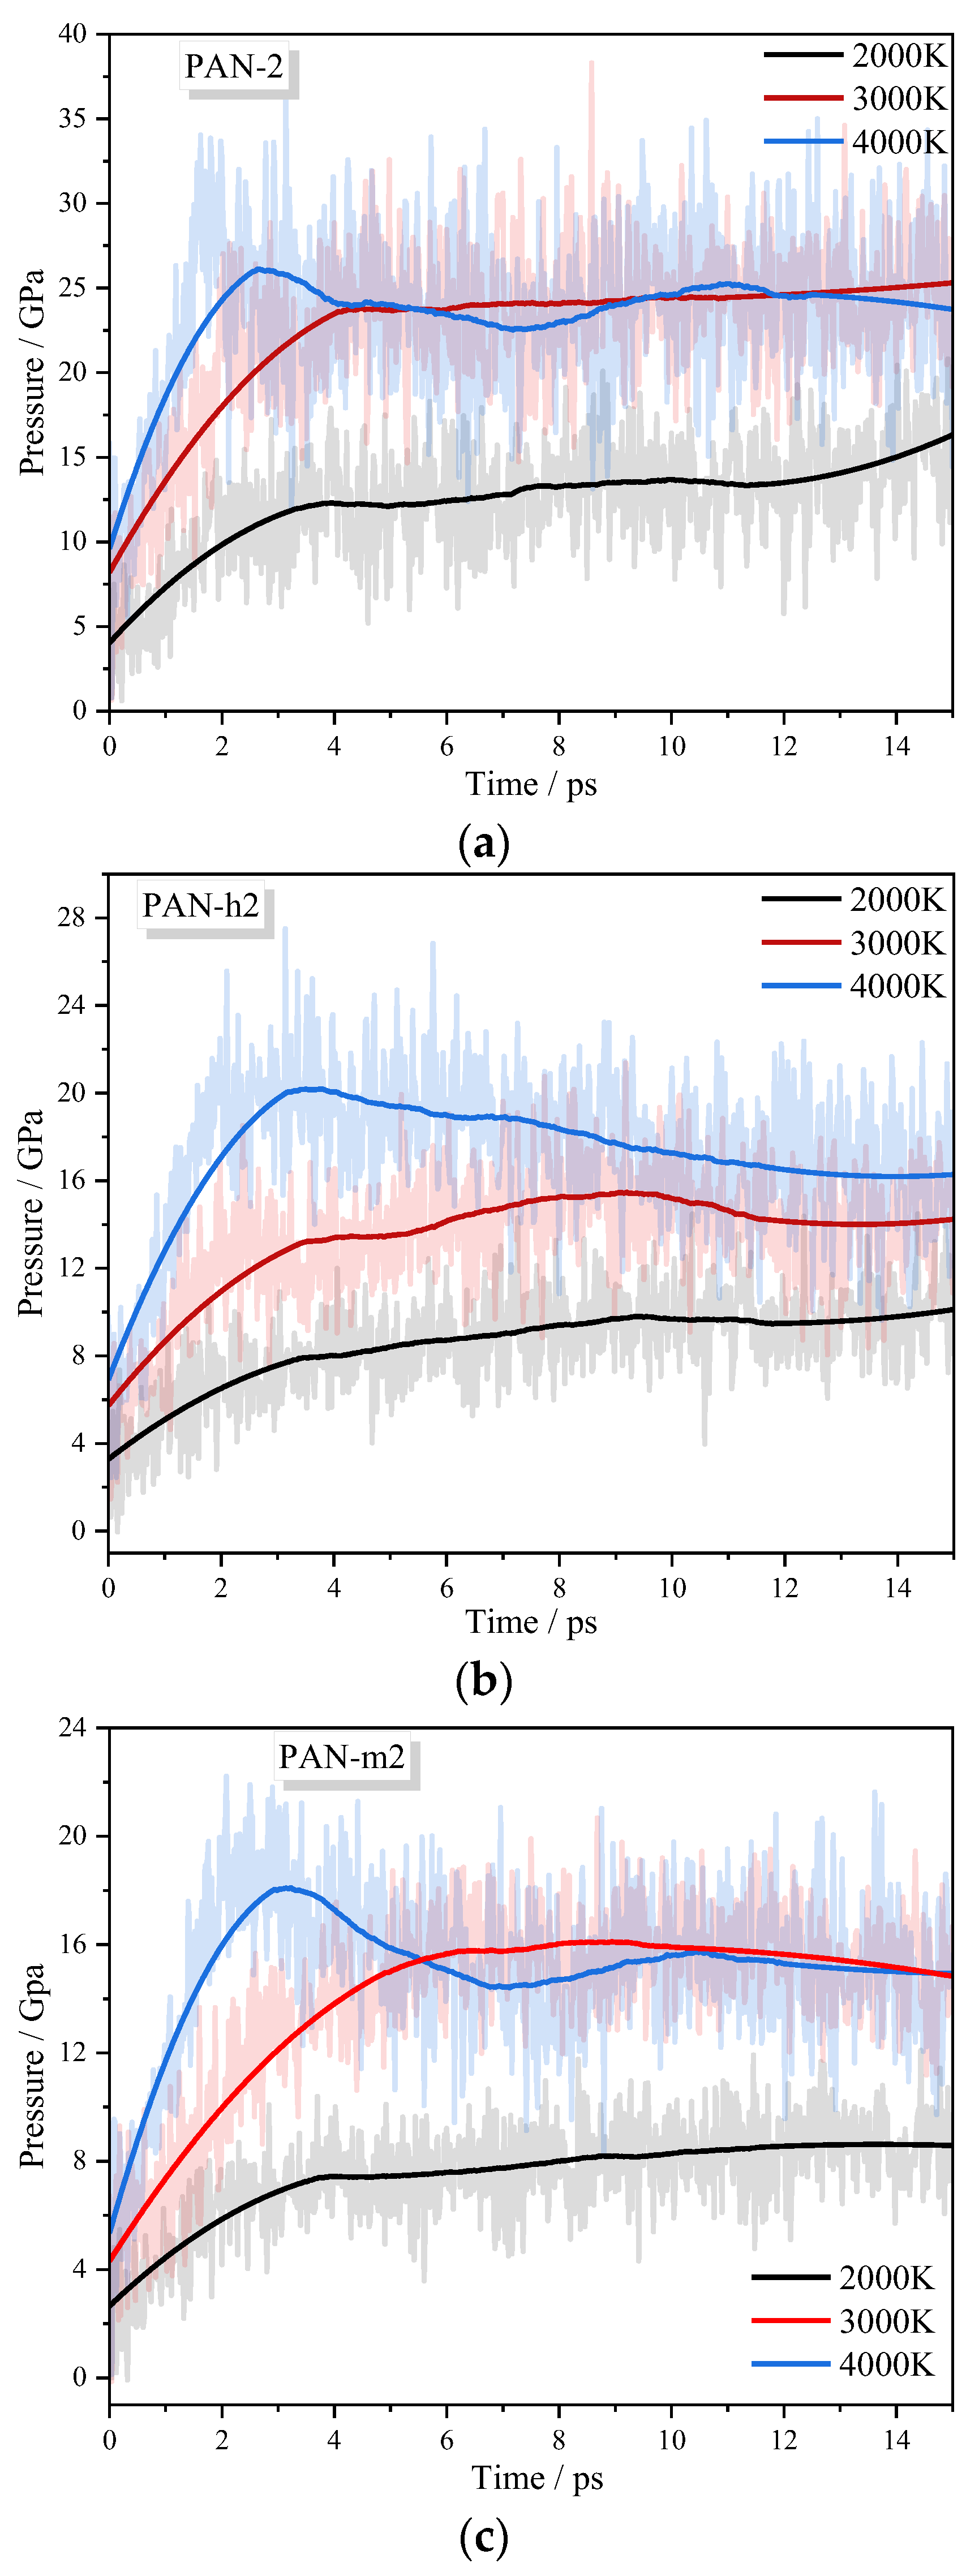
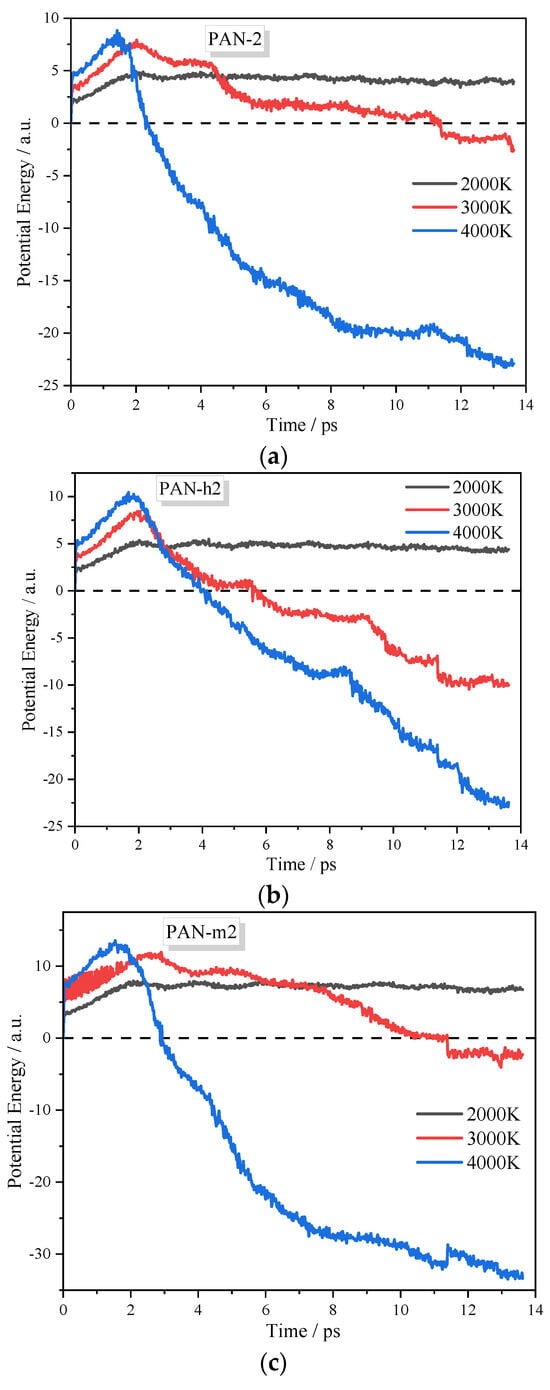
Figure 2 present the time evolution of the system pressure and Figure 3 present the potential energy of the three PAN-series supercells at 2000, 3000 and 4000 K, respectively. In Figure 2, the lightly shaded traces denote the raw data, while the dark solid lines represent the smoothed data. In Figure 3, the potential energy is referenced to the average potential energy of the initial configuration after relaxation and equilibration, i.e., ΔE(t) = E(t) − E0. As can be seen from the figures, both the pressure and the potential energy exhibit pronounced temperature dependence and a sequential temporal correlation, allowing the entire process to be divided into three stages.
Figure 2.
Time evolution of the system pressure at different temperatures: (a) PAN-2; (b) PAN-H2; (c) PAN-M2.
Figure 3.
Time evolution of the system potential energy at different temperatures: (a) PAN-2; (b) PAN-H2; (c) PAN-M2.
Initiation stage (ca. 0–2 ps): The potential energies of all three systems rise rapidly and reach their maxima at approximately 1–2 ps. The energy increase in this stage mainly corresponds to two types of endothermic events that may occur earliest: (i) scission of the N–H bonds of the piperazinium cations; and (ii) thermal activation and incipient cleavage of the N–O bonds of the nitrate anions. Bond scission requires overcoming an energy barrier, and in the NVT ensemble the energy required for chemical initiation is supplied by the heat bath, leading to an increase in the potential energy. Meanwhile, the gaseous precursors generated by bond scission cause the system pressure to rise rapidly.
Exothermic rearrangement stage (ca. 2–8 ps): The potential energy decreases continuously from its maximum as the system evolves from the initiation stage into a stage of radical rearrangement and secondary reactions—dehydrogenation, backbone depolymerization and the formation of small-molecule products are predominantly exothermic, and the released heat is extracted through the heat bath, lowering the potential energy. The curves at 3000 K and 4000 K cross zero successively: at 4000 K the zero crossing occurs at approximately 2–3 ps, whereas at 3000 K it differs among the systems (ca. 3 ps for PAN-2, ca. 4 ps for PAN-H2, and ca. 7–8 ps for PAN-M2), indicating that higher temperatures lead to an earlier onset of net exothermicity. In this stage, the number of gaseous products increases rapidly, and the pressure climbs accordingly to its maximum. Notably, the pressure maximum (ca. 3–5 ps) systematically lags behind the potential-energy maximum (ca. 1–2 ps), because the potential-energy peak corresponds to the period of concentrated bond-scission initiation, whereas the build-up of pressure relies on the diffusion and homogenization of gaseous fragments, which requires additional time.
Stabilization stage (> 8 ps): The potential energy decreases more gradually and levels off at a stable negative plateau, corresponding to the completion of exothermic recombination and the stabilization of the products. The final relative potential energies (net energy changes) of the systems are ranked as follows: at 4000 K, PAN-M2 (ca. 30 eV/atom) > PAN-2 (ca. 23 eV/atom) > PAN-H2 (ca. 21 eV/atom); at 3000 K, PAN-H2 (ca. 10 eV/atom) > PAN-M2 (ca. 8 eV/atom) > PAN-2 (ca. 3 to 4 eV/atom); at 2000 K, all three systems end at positive values of approximately 3 to 4 eV/atom. In other words, higher temperatures result in deeper net exothermicity and more complete decomposition, whereas at 2000 K essentially no thermal decomposition occurs within 15 ps, with only limited bond scission at the early stage, which manifests as a weak net endothermicity.
The above analysis shows that the thermal decomposition of the three supercells exhibits systematic temperature and composition dependencies in the macroscopic thermodynamic quantities: the magnitude and rate of the pressure rise, the “rise-then-fall” evolution pattern of the potential energy, and the net heat release all increase with temperature, following a consistent ranking among the three systems. However, as statistical averages over the entire system, pressure and potential energy can only characterize the overall intensity and energetic change in the decomposition process, without revealing the microscopic origins of these differences. The essence of thermal decomposition lies in the selective scission and reformation of local chemical bonds, whose initiation rates and reaction pathways are jointly governed by the local coordination environment, the distribution of weak bonds, and the framework flexibility of the initial configuration. To further investigate the decomposition kinetics of the three systems at different temperatures, the microscopic mechanisms are discussed below from multiple perspectives.
3.2. Cation Structures and Initial Coordination Environments
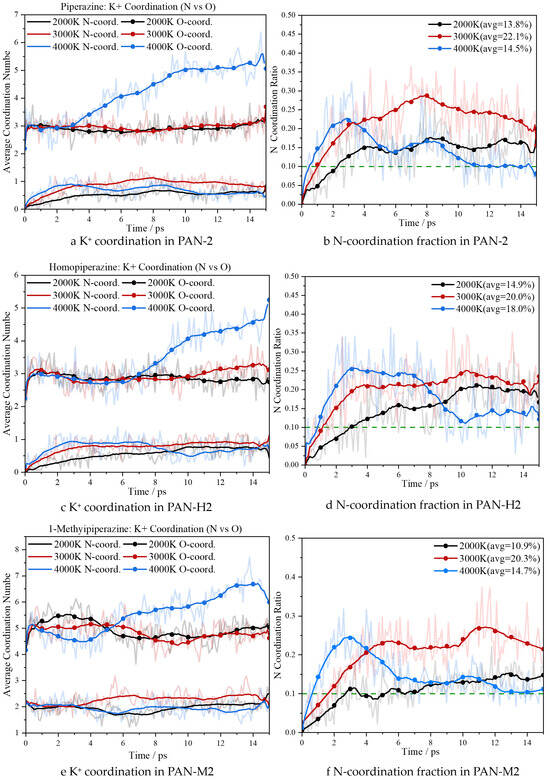
The differences in the macroscopic thermal behavior may arise from the initial structures of the reactants. To further clarify the role of the principal reactant species in the decomposition process, this section analyzes the influence of the initial reactant structures on the local chemical environment by calculating the geometric configurations of the three cations and their coordination modes with K+. Figure 4 compares the composition of the K+ coordination shells in the three supercells. It can be seen that the coordination environment of K+ exhibits a clear stage-wise response to the progress of thermal decomposition. Before the reaction starts, the K+ coordination shell is dominated by the O atoms of the nitrate anions, whereas the N atoms of the organic molecules (hereafter referred to as organic N) hardly participate in coordination, being locked within the intact heterocycles with restricted N–H orientations. As deprotonation occurs and the ring-opening cascade proceeds, N-containing fragments are released in large quantities, and the N-coordination fraction rises synchronously to its maximum, indicating that the composition of the K+ coordination shell can effectively signal the moment of organic framework disintegration.
Figure 4.
Time evolution of the K+ coordination composition in the three systems.
Upon further increasing the temperature (4000 K), the N-coordination fraction declines while the O-coordination number increases markedly, and the decline of the former coincides almost exactly with the onset of the rise of the latter. This is because the nitrate anions themselves decompose at high temperatures, releasing free O atoms and O-containing small molecules that enter the coordination shell in large quantities; the decrease in the N fraction therefore reflects a dilution of the coordination components rather than a reversal of the decomposition progress. A comparison among the three systems further shows that PAN-M2 exhibits the lowest organic-N coordination at 2000 K, whereas PAN-2 exhibits the highest N coordination at 3000 K, and these coordination differences mainly reflect the variations in the deprotonation degree and the carbon-to-nitrogen stoichiometric ratio of the respective systems.
The above results indicate that the composition of the K+ coordination shell responds to the progress of thermal decomposition in a stage-wise manner. This response may exhibit a quantitative correspondence with the timing of deprotonation and ring-opening, which will be further analyzed in the following discussion.
3.3. Comparison of Deprotonation Kinetics During the Reaction
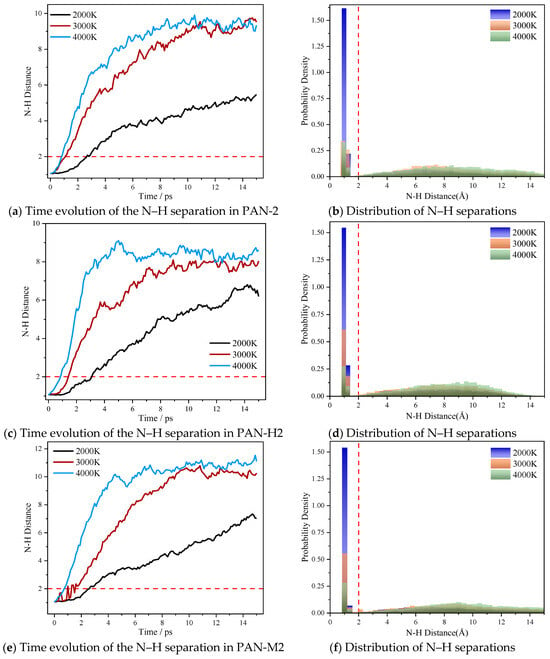
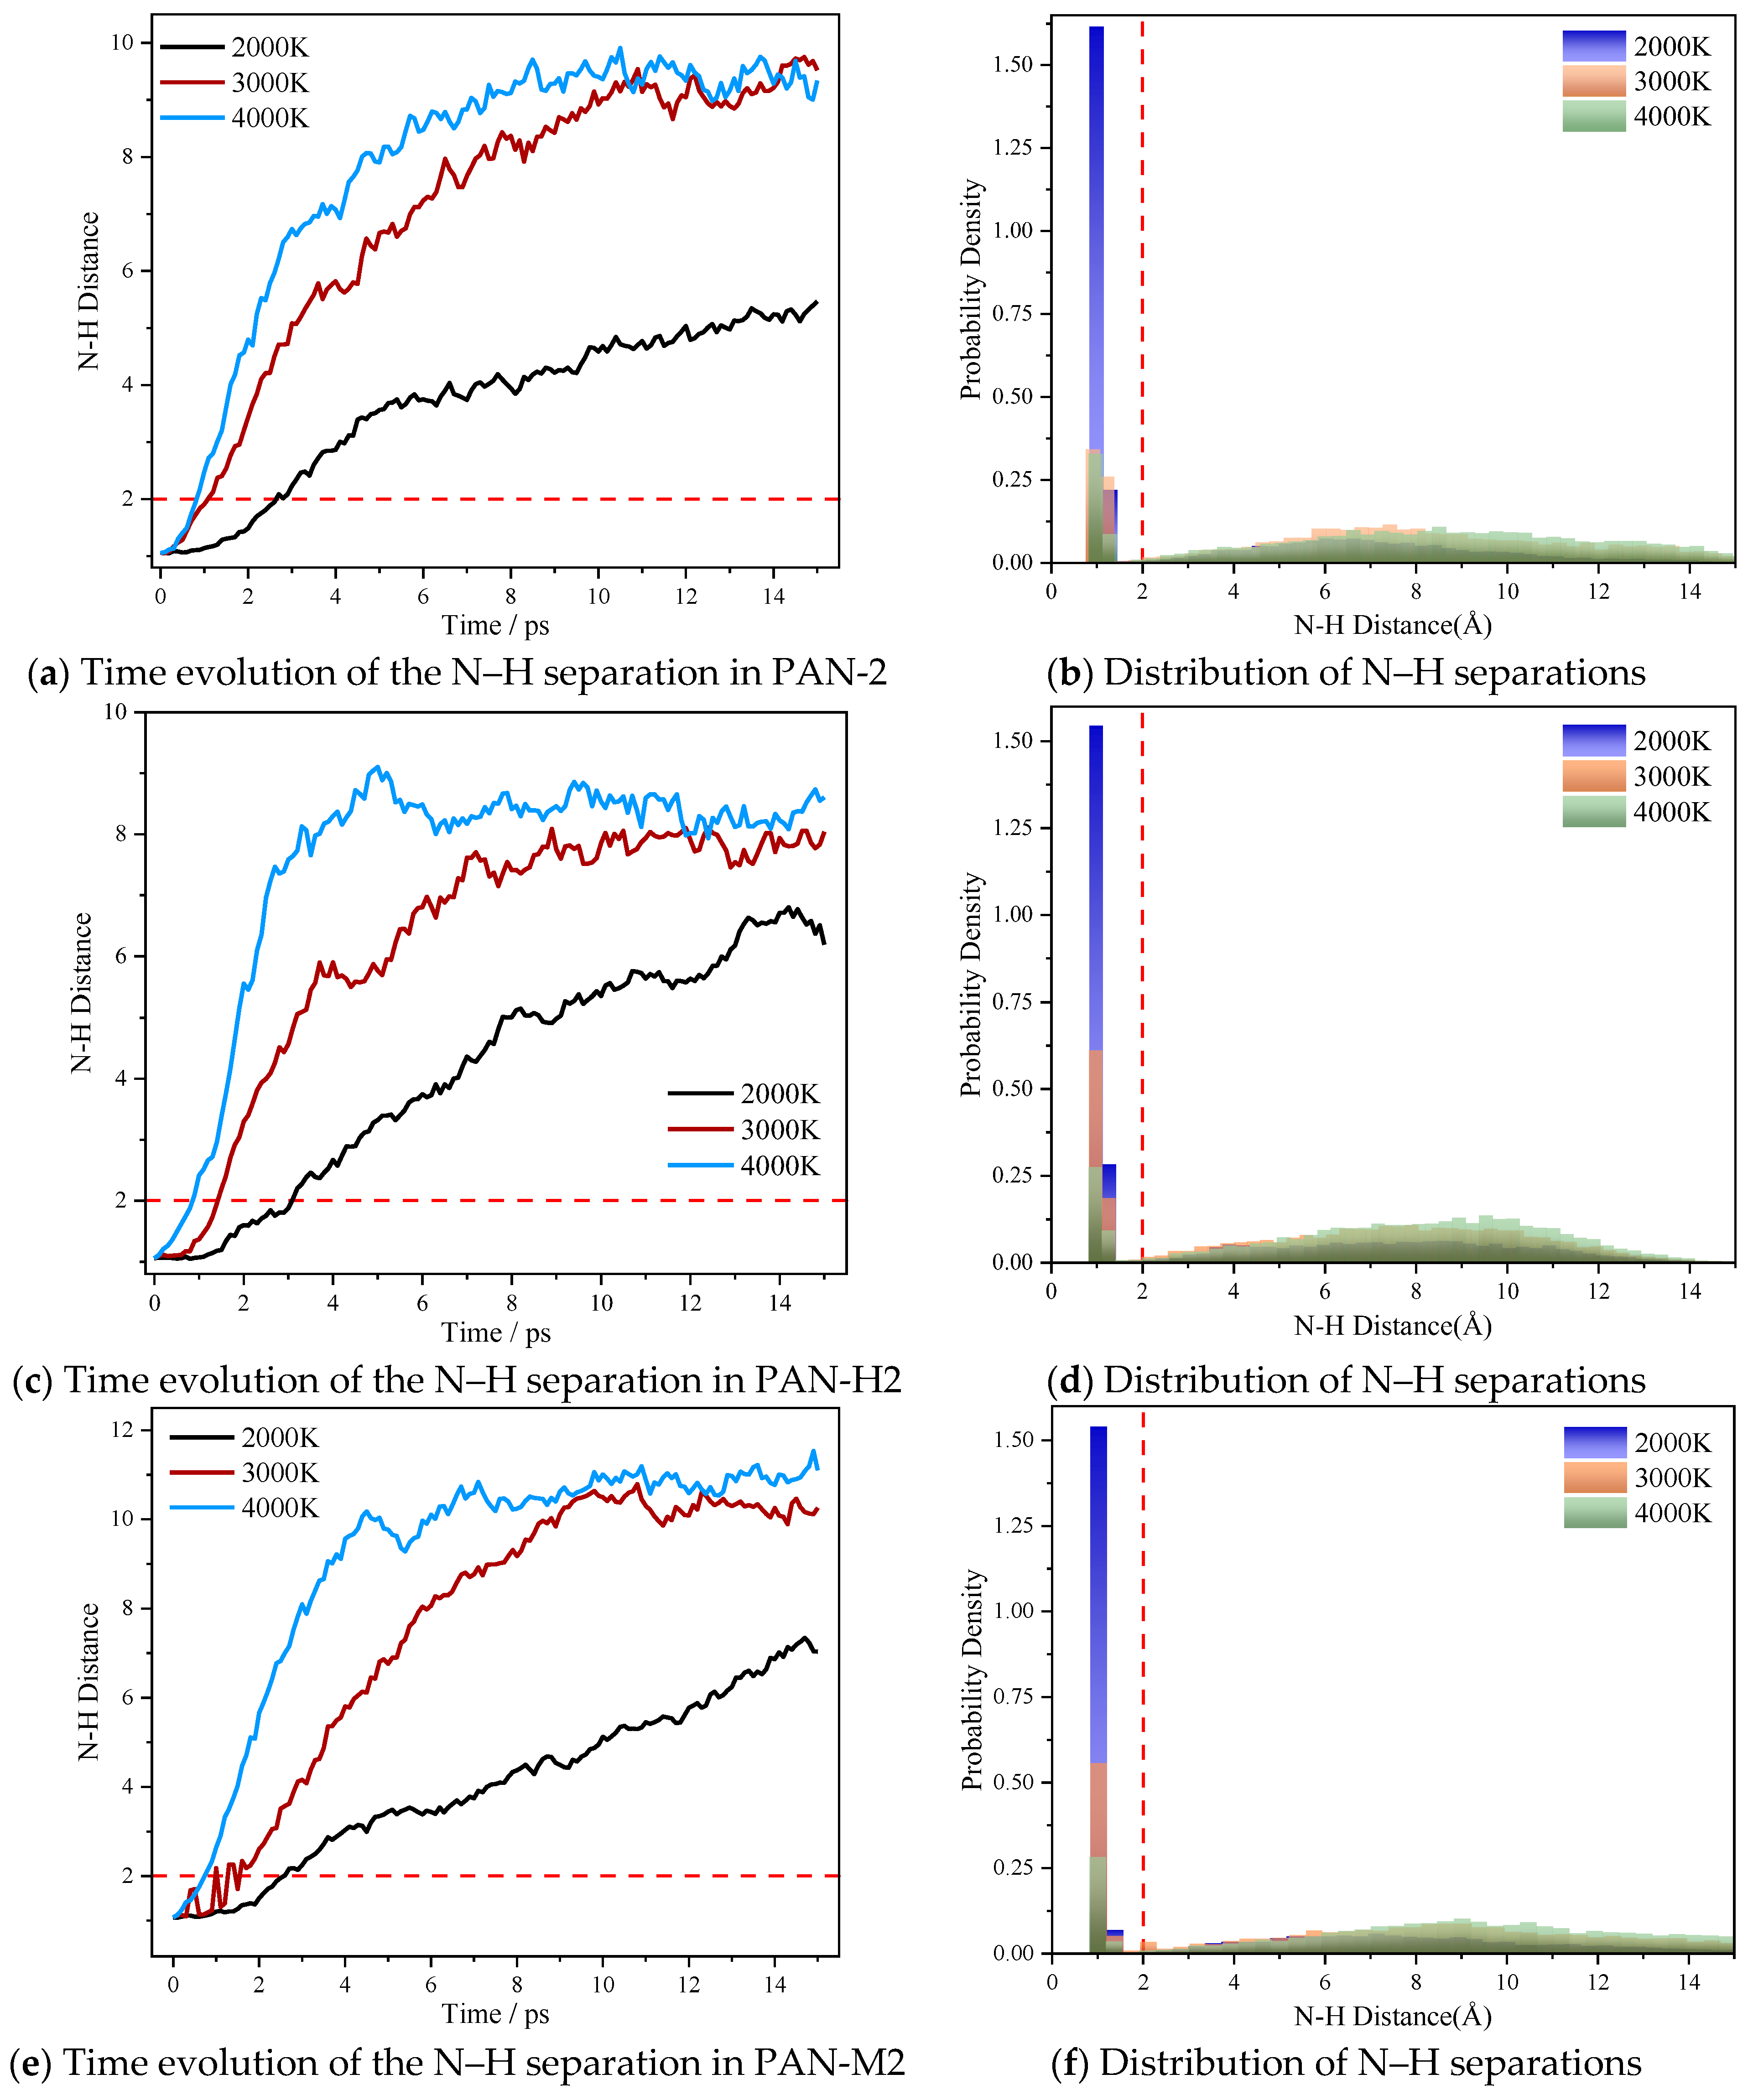
Figure 5 presents the time evolution and distribution of the average N–H separation between the tracked N and H atoms in the three systems (PAN-2, PAN-H2, and PAN-M2). As shown in Figure 5a,c,e, the higher the temperature, the faster the N–H separation increases and the larger its plateau value. Taking PAN-2 as an example, at 4000 K the average separation rises from about 1 Å to above 8 Å within the first 2–5 ps and then enters a plateau; at 3000 K, a similar extent is reached only after 7–10 ps; whereas at 2000 K, it reaches only about 5 Å at 15 ps.
Figure 5.
Time evolution and distribution of the average N–H separation in the three systems. The horizontal dashed line indicates the critical value of the N–H bond length (2 Å), which was used as the criterion for bond dissociation.
As shown in Figure 5b,d,f: (i) the separation distributions exhibit a pronounced minimum near 2.0 Å (dashed line), which cleanly separates the bonded and dissociated states; (ii) the mean of the bonded peak (ca. 1.05 Å) coincides with the initial bond length, and its width increases only slightly with temperature; (iii) the integrated area of the tail increases monotonically with temperature, quantitatively consistent with the upward shift in the mean separation in Figure 5a,c,e. Based on these three observations, the following conclusion can be drawn: the N–H separation distributions in all systems and at all temperatures exhibit a bimodal character—the narrow, intense peak at ca. 1.0 Å corresponds to the vibrational distribution of the intact N–H bonds around their equilibrium positions, while the broad, shallow tail extending beyond ca. 2 Å corresponds to the separations between the dissociated H atoms and the N atoms. Moreover, with increasing temperature, the peak at 1 Å decreases markedly for all three systems, while new maxima emerge at larger separations.
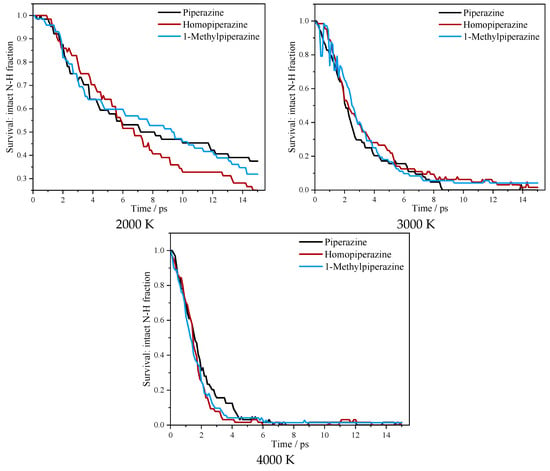
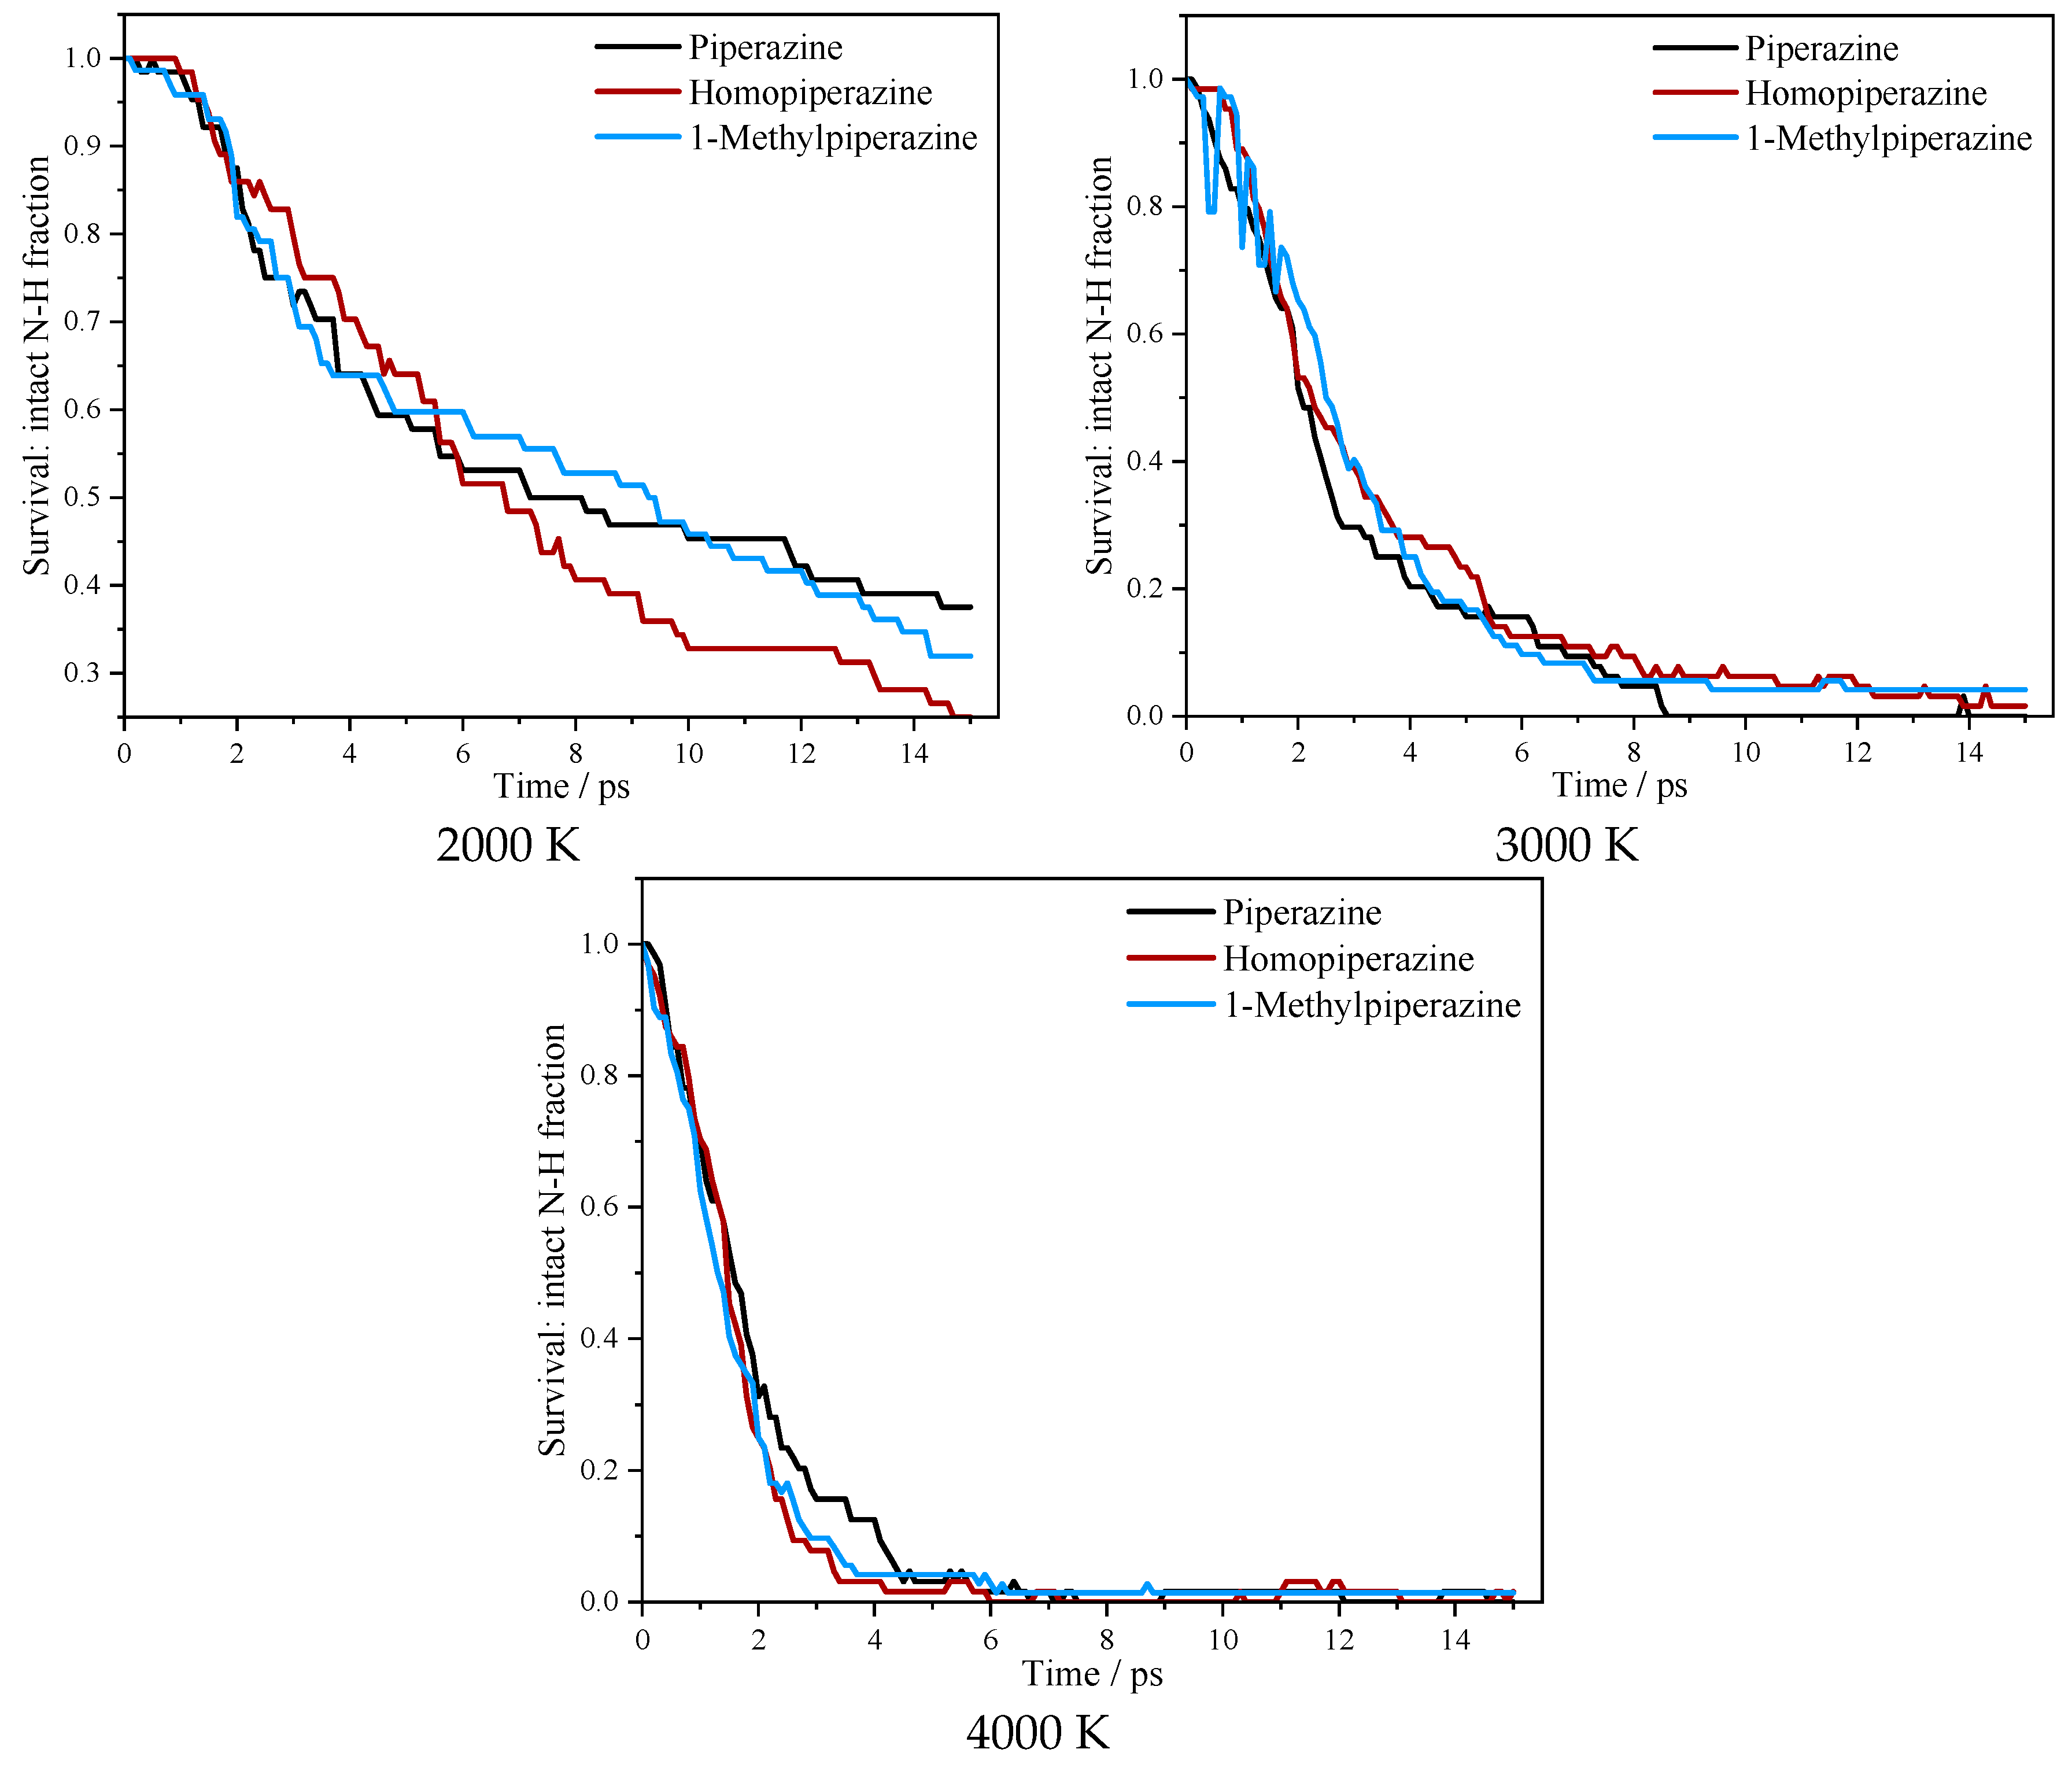
Figure 6 presents the time evolution of the survival fraction of the initial N–H bonds (survival curves). At 4000 K, the survival fractions of all three systems decay to zero within approximately 2–3 ps, with half-lives of about 1–1.5 ps, indicating that at this temperature thermal energy readily overcomes the deprotonation barrier and bond scission occurs almost “instantaneously”. At 3000 K, the decay slows markedly, with the survival fraction approaching zero after approximately 5–6 ps while retaining a long tail. At 2000 K, the decay is the slowest: after 15 ps, the three systems still retain survival fractions of 0.25–0.38 (ca. 0.38 for the piperazine system, ca. 0.30 for the 1-methylpiperazine system, and ca. 0.25 for the homopiperazine system), consistent with the tail weights in Figure 5b,d,f, indicating that deprotonation is only partial at this temperature. Notably, the differences among the survival curves of the three systems almost vanish at 4000 K, and only at 2000 K can one discern that the homopiperazine system decays slightly faster than the piperazine and 1-methylpiperazine systems, demonstrating that the contribution of structural and chemical effects is weaker than that of thermal activation.
Figure 6.
Time evolution of the survival fraction of the initial N–H bonds.
Table 3 summarizes the bond-by-bond statistics of all trackable N–H bonds at each temperature (64 bonds each for piperazine and homopiperazine, and 72 for 1-methylpiperazine; the complete data are given in Section S1.1 of the Supporting Information). The initial bond-length distributions are essentially identical across all systems and temperatures (1.055–1.069 Å), indicating that the kinetic differences arise mainly from thermal motion rather than from the initial structures. The half-scission time T50(NH) shortens markedly with increasing temperature (e.g., for piperazine, 7.2 ps → 2.0 ps → 1.5 ps), far exceeding the differences among the systems at the same temperature, demonstrating that temperature is the dominant factor governing the deprotonation rate.
Table 3.
Statistics of the thermal decomposition of N–H bonds.
To quantify this temperature sensitivity, we approximate the survival curves as single-exponential decays, derive the effective rate constants at each temperature from k = ln 2/T50, and perform a least-squares fit of ln k versus 1/T based on the linearized Arrhenius equation (see Section S1.2 of the Supporting Information for the computational details). The resulting apparent activation energies are listed in Table 3 (46.4 kJ·mol−1 for piperazine, 43.7 kJ·mol−1 for homopiperazine, and 54.7 kJ·mol−1 for 1-methylpiperazine). Meanwhile, the temperature-induced variation in the rate (T50 changing by a factor of ca. 4–5) is substantially larger than the inter-system differences at the same temperature (ca. 30–50%); together, these observations support that temperature is the dominant factor controlling the deprotonation rate, whereas the contribution of structural variation is secondary and exhibits a certain temperature dependence (e.g., 1-methylpiperazine has the longest T50 at 2000 K but the shortest at 4000 K). It should be noted that high-temperature molecular dynamics simulations constitute an accelerated-dynamics approach, and the resulting Ea characterizes the apparent sensitivity of the rate to temperature within the probed temperature window, which is not equivalent to the gas-phase static barrier of the elementary reaction.
Further statistics on the bonds that remain intact (r(N–H) < 1.7 Å) show that heating mainly broadens the vibrational distribution of the bonded state rather than continuously stretching the equilibrium bond length: the bonded-state mean increases only from ca. 1.051 Å (2000 K) to ca. 1.059 Å (4000 K), whereas the standard deviation increases from ca. 0.076 Å to ca. 0.090 Å. On this basis, the 1.7 Å scission criterion corresponds to roughly 7–8 standard deviations above the mean of the bonded-state distribution, which lies far beyond the range of thermal fluctuations. This corroborates the picture that “scission is an abrupt event upon crossing a threshold, rather than a gradual stretching and weakening of the chemical bond”, and is mutually corroborated by the pronounced minimum between the bonded peak and the dissociated low-intensity peak in Figure 5b,d,f.
Taken together, Figure 5 and Figure 6 and Table 3 show that, within the investigated temperature range, N–H bond scission is the earliest and most ubiquitous event in the thermal decomposition of these organic cations. Its rate is governed predominantly by temperature, whereas the contribution of structural modifications (ring expansion and 1-methylation) is secondary and exhibits a certain temperature dependence. At 2000 K, deprotonation is only partial within 15 ps, and this condition can thus be regarded as the “onset temperature” window of the deprotonation process.
3.4. Ring Stability Analysis During the Reaction
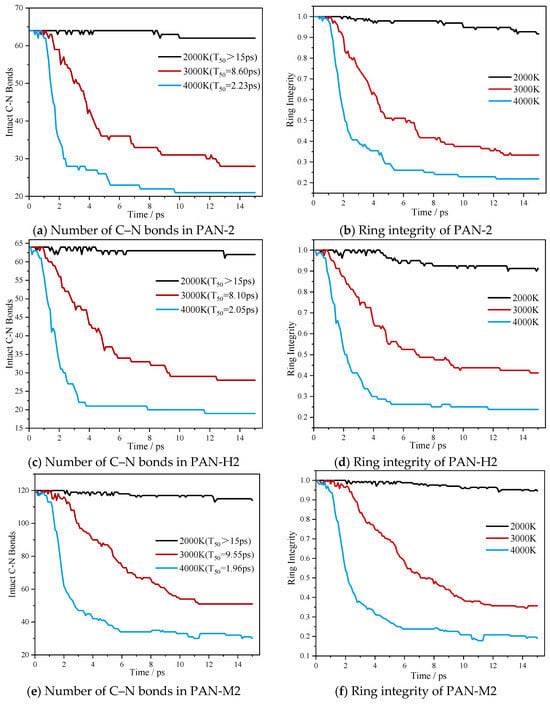
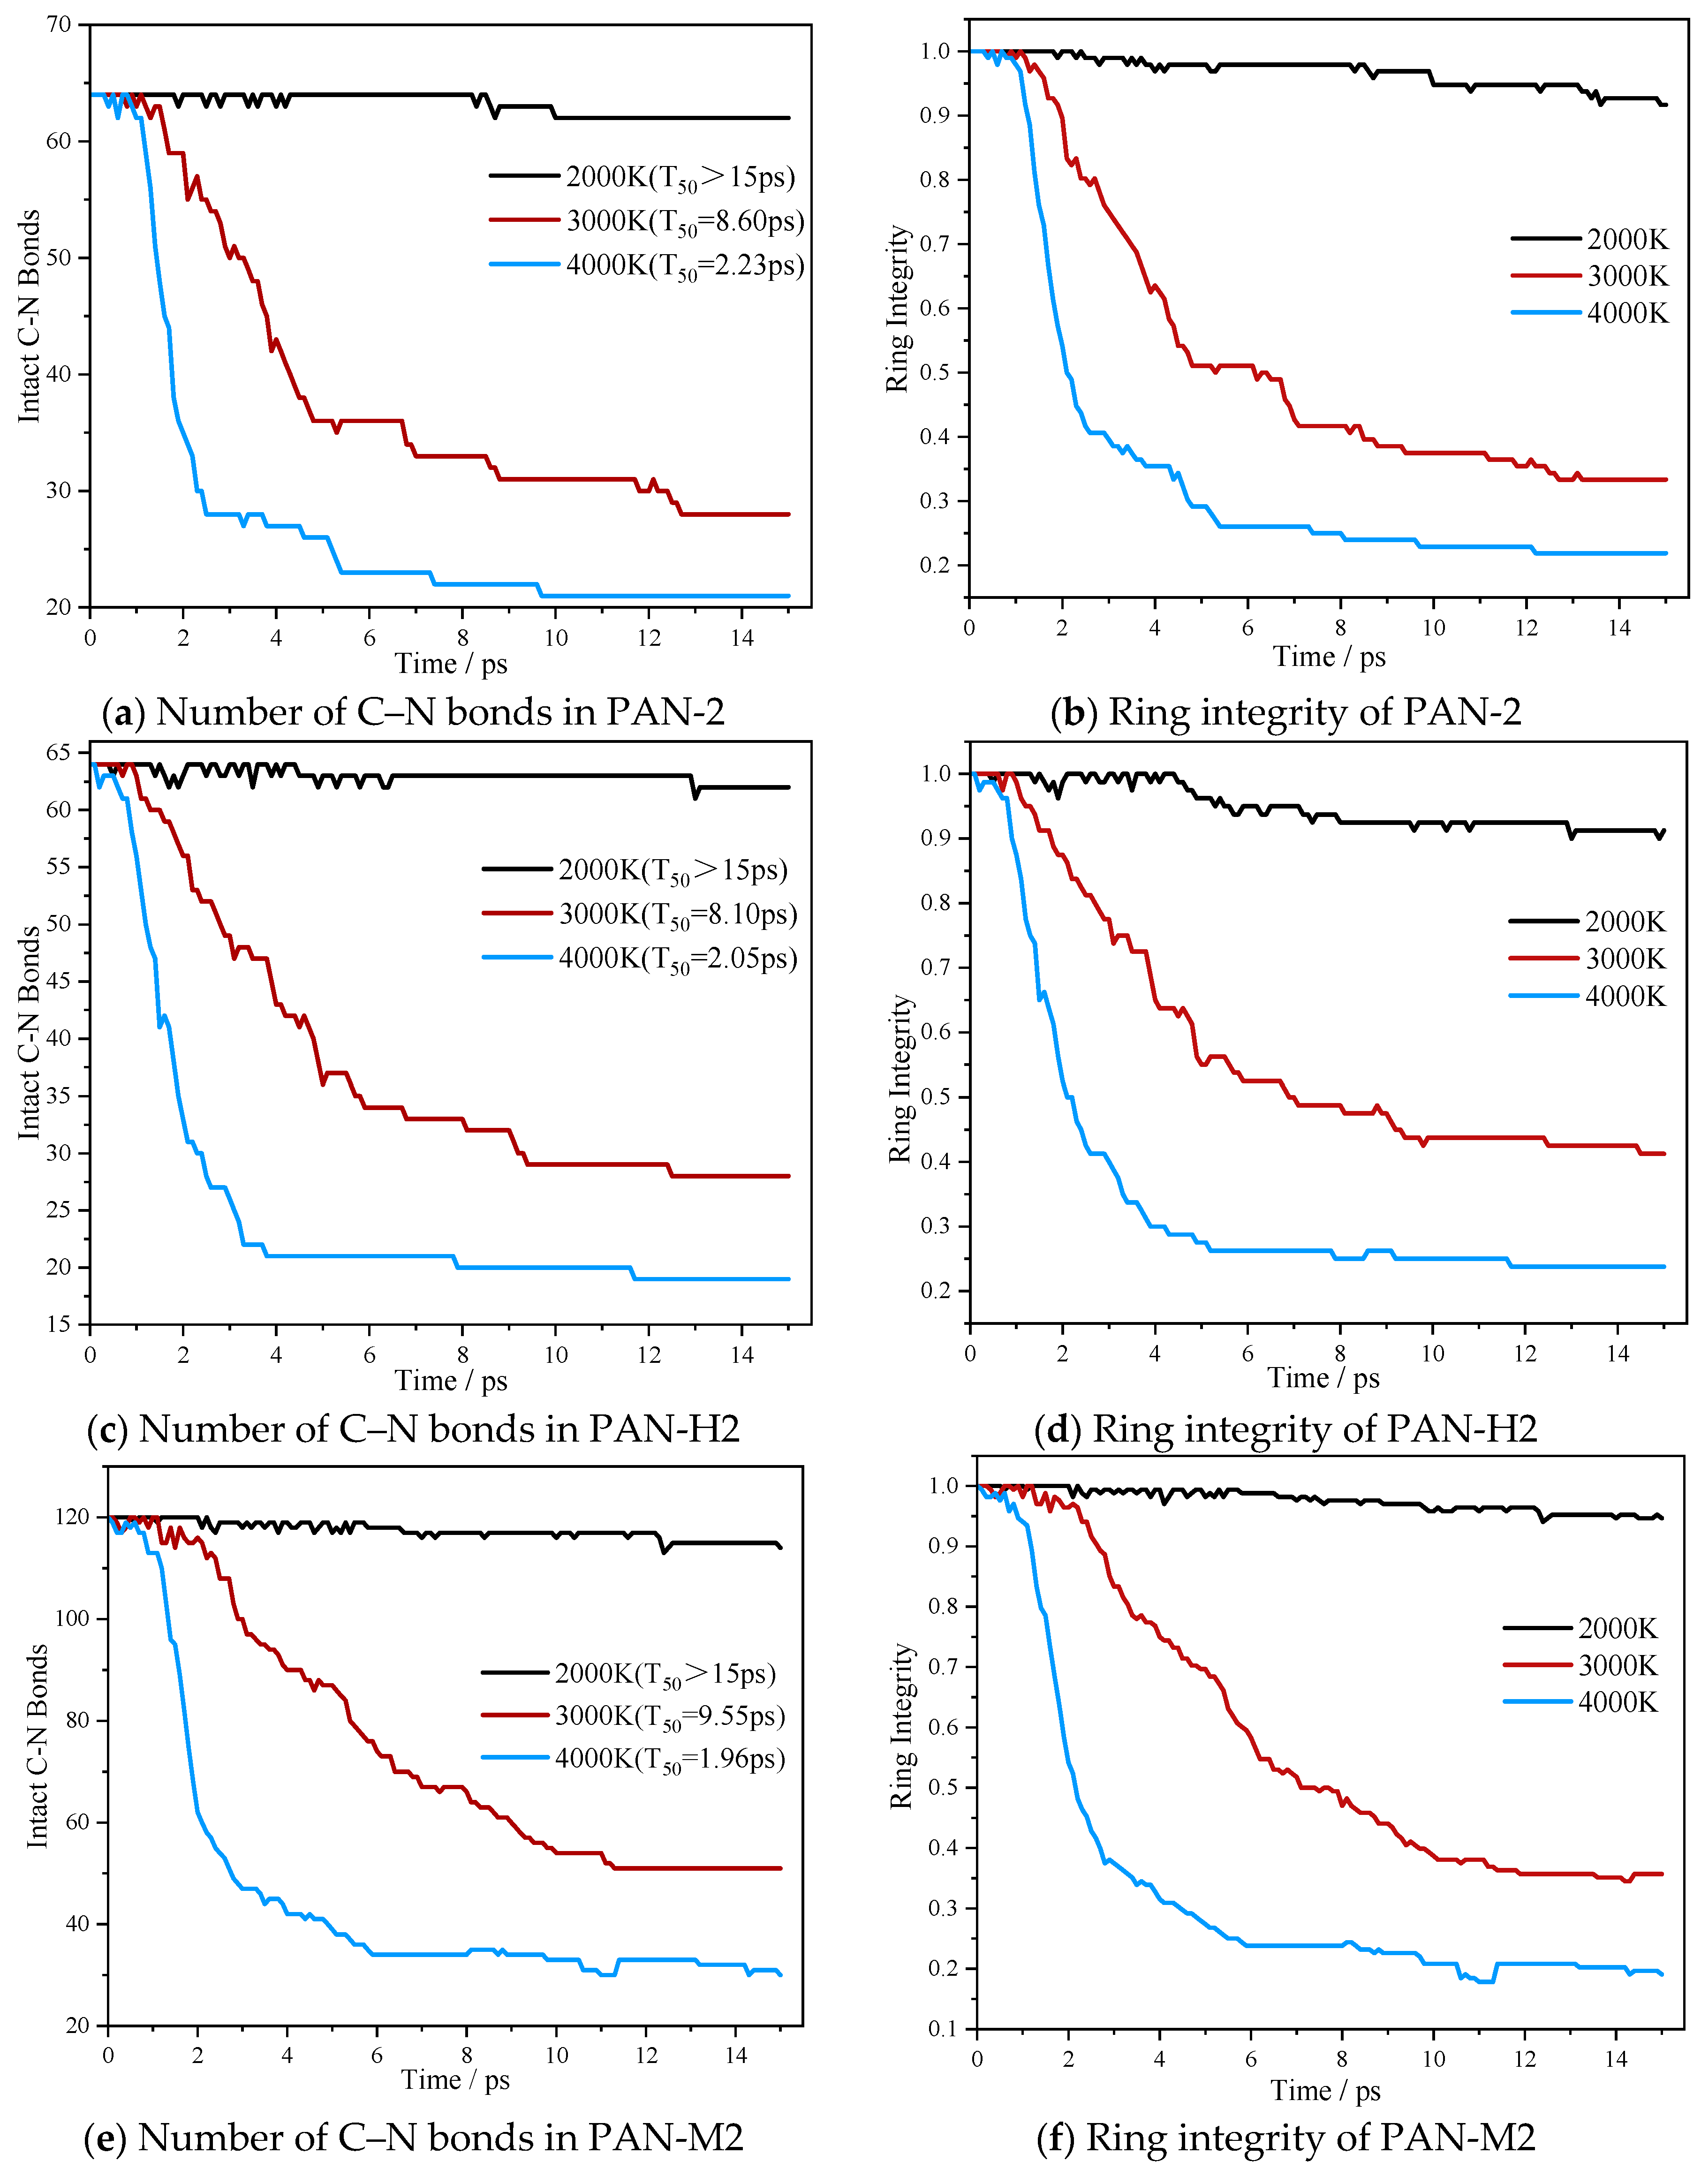
Figure 7 presents the time evolution of the number of backbone C–N bonds and the ring integrity for the three systems. As shown in Figure 7, temperature has a pronounced influence on the extent of ring-opening: at 2000 K, the three curves remain essentially flat over 15 ps (final integrity values of 0.964–0.973, with 93.8–96.9% of the C–N bonds intact); at 3000 K, the curves decrease in a multi-step fashion, entering a slow-decay regime after ca. 5 ps and reaching final values of 0.333–0.361; at 4000 K, the rings collapse rapidly within 3–4 ps to a plateau of 0.174–0.219. Notably, none of the 18 system–temperature conditions achieves complete ring disintegration within 15 ps, indicating that the ring-opening products are dominated by partially fragmented frameworks.
Figure 7.
Time evolution of backbone C–N bond counts and ring integrity.
Table 4 lists the key parameters characterizing the backbone decomposition of the three systems (complete data are given in Section S1.3 of the Supporting Information). Based on the T50(CN) values in Table 4, the apparent activation energies for ring-opening at 3000 K and 4000 K were calculated, yielding ca. 135–158 kJ·mol−1—markedly higher than the 44–55 kJ·mol−1 obtained for N–H scission in the preceding section. This is energetically consistent with the temporal sequence of “deprotonation first, ring-opening afterwards”: ring-opening requires crossing a higher barrier and is therefore “frozen” at lower temperatures, proceeding appreciably only after deprotonation is complete and the temperature is further elevated. It should be noted that the ring-opening Ea values are estimated from only two temperature points and thus carry considerable uncertainty; they are presented here merely as a reference for the apparent trend.
Table 4.
Key ring-opening parameters for the three systems.
In Table 4, Δt50 is defined as the difference between T50(CN) and T50(NH). At 2000 K, Δt50 > 6.2–9.0 ps: deprotonation is largely complete (62.5–75.0%) while ring-opening has barely occurred, favoring the stepwise picture of “deprotonation first, ring-opening afterwards”—N–H scission converts the ammonium-type nitrogen into a neutral amino group, and the resulting rearrangement of its charge and bonding state presumably weakens the intraring C–N bonds. At 3000 K, Δt50 shrinks to 5.8–7.1 ps, and the interval between the two events shortens but remains discernible. At 4000 K, Δt50 is only 0.55–0.73 ps, such that deprotonation and ring-opening can no longer be strictly ordered in time, corresponding more closely to a quasi-concerted disintegration process.
The T50(NH) values and dissociation fractions in this section are taken directly from the statistics of Section 3.3. Combining the results of both sections, it can be concluded that, at lower temperatures, the thermal decomposition of all three cations tends to proceed stepwise along the sequence “deprotonation → backbone ring-opening (accompanied by demethylation for 1-methylpiperazine)”. As the temperature increases, the differences in the rates of the individual steps gradually narrow, and at 4000 K the three systems undergo violent disintegration almost simultaneously. The influence of ring expansion and 1-methylation on the stability of the cyclic framework is far smaller than that of temperature.
3.5. Product Distributions of the Three Systems
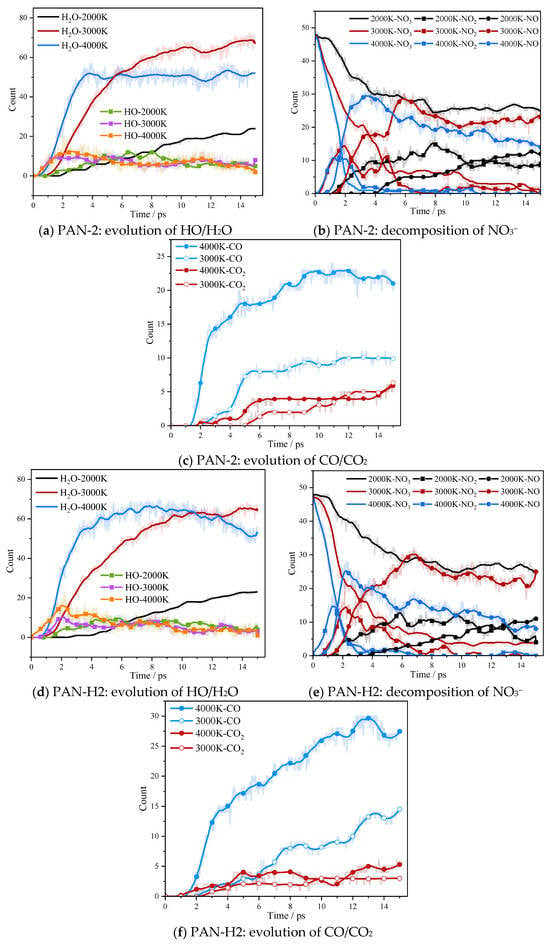
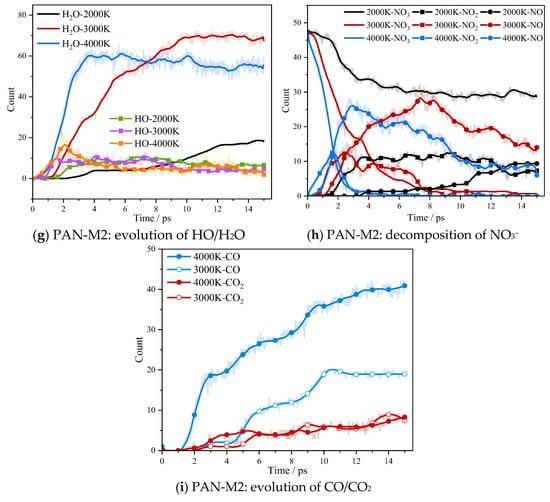
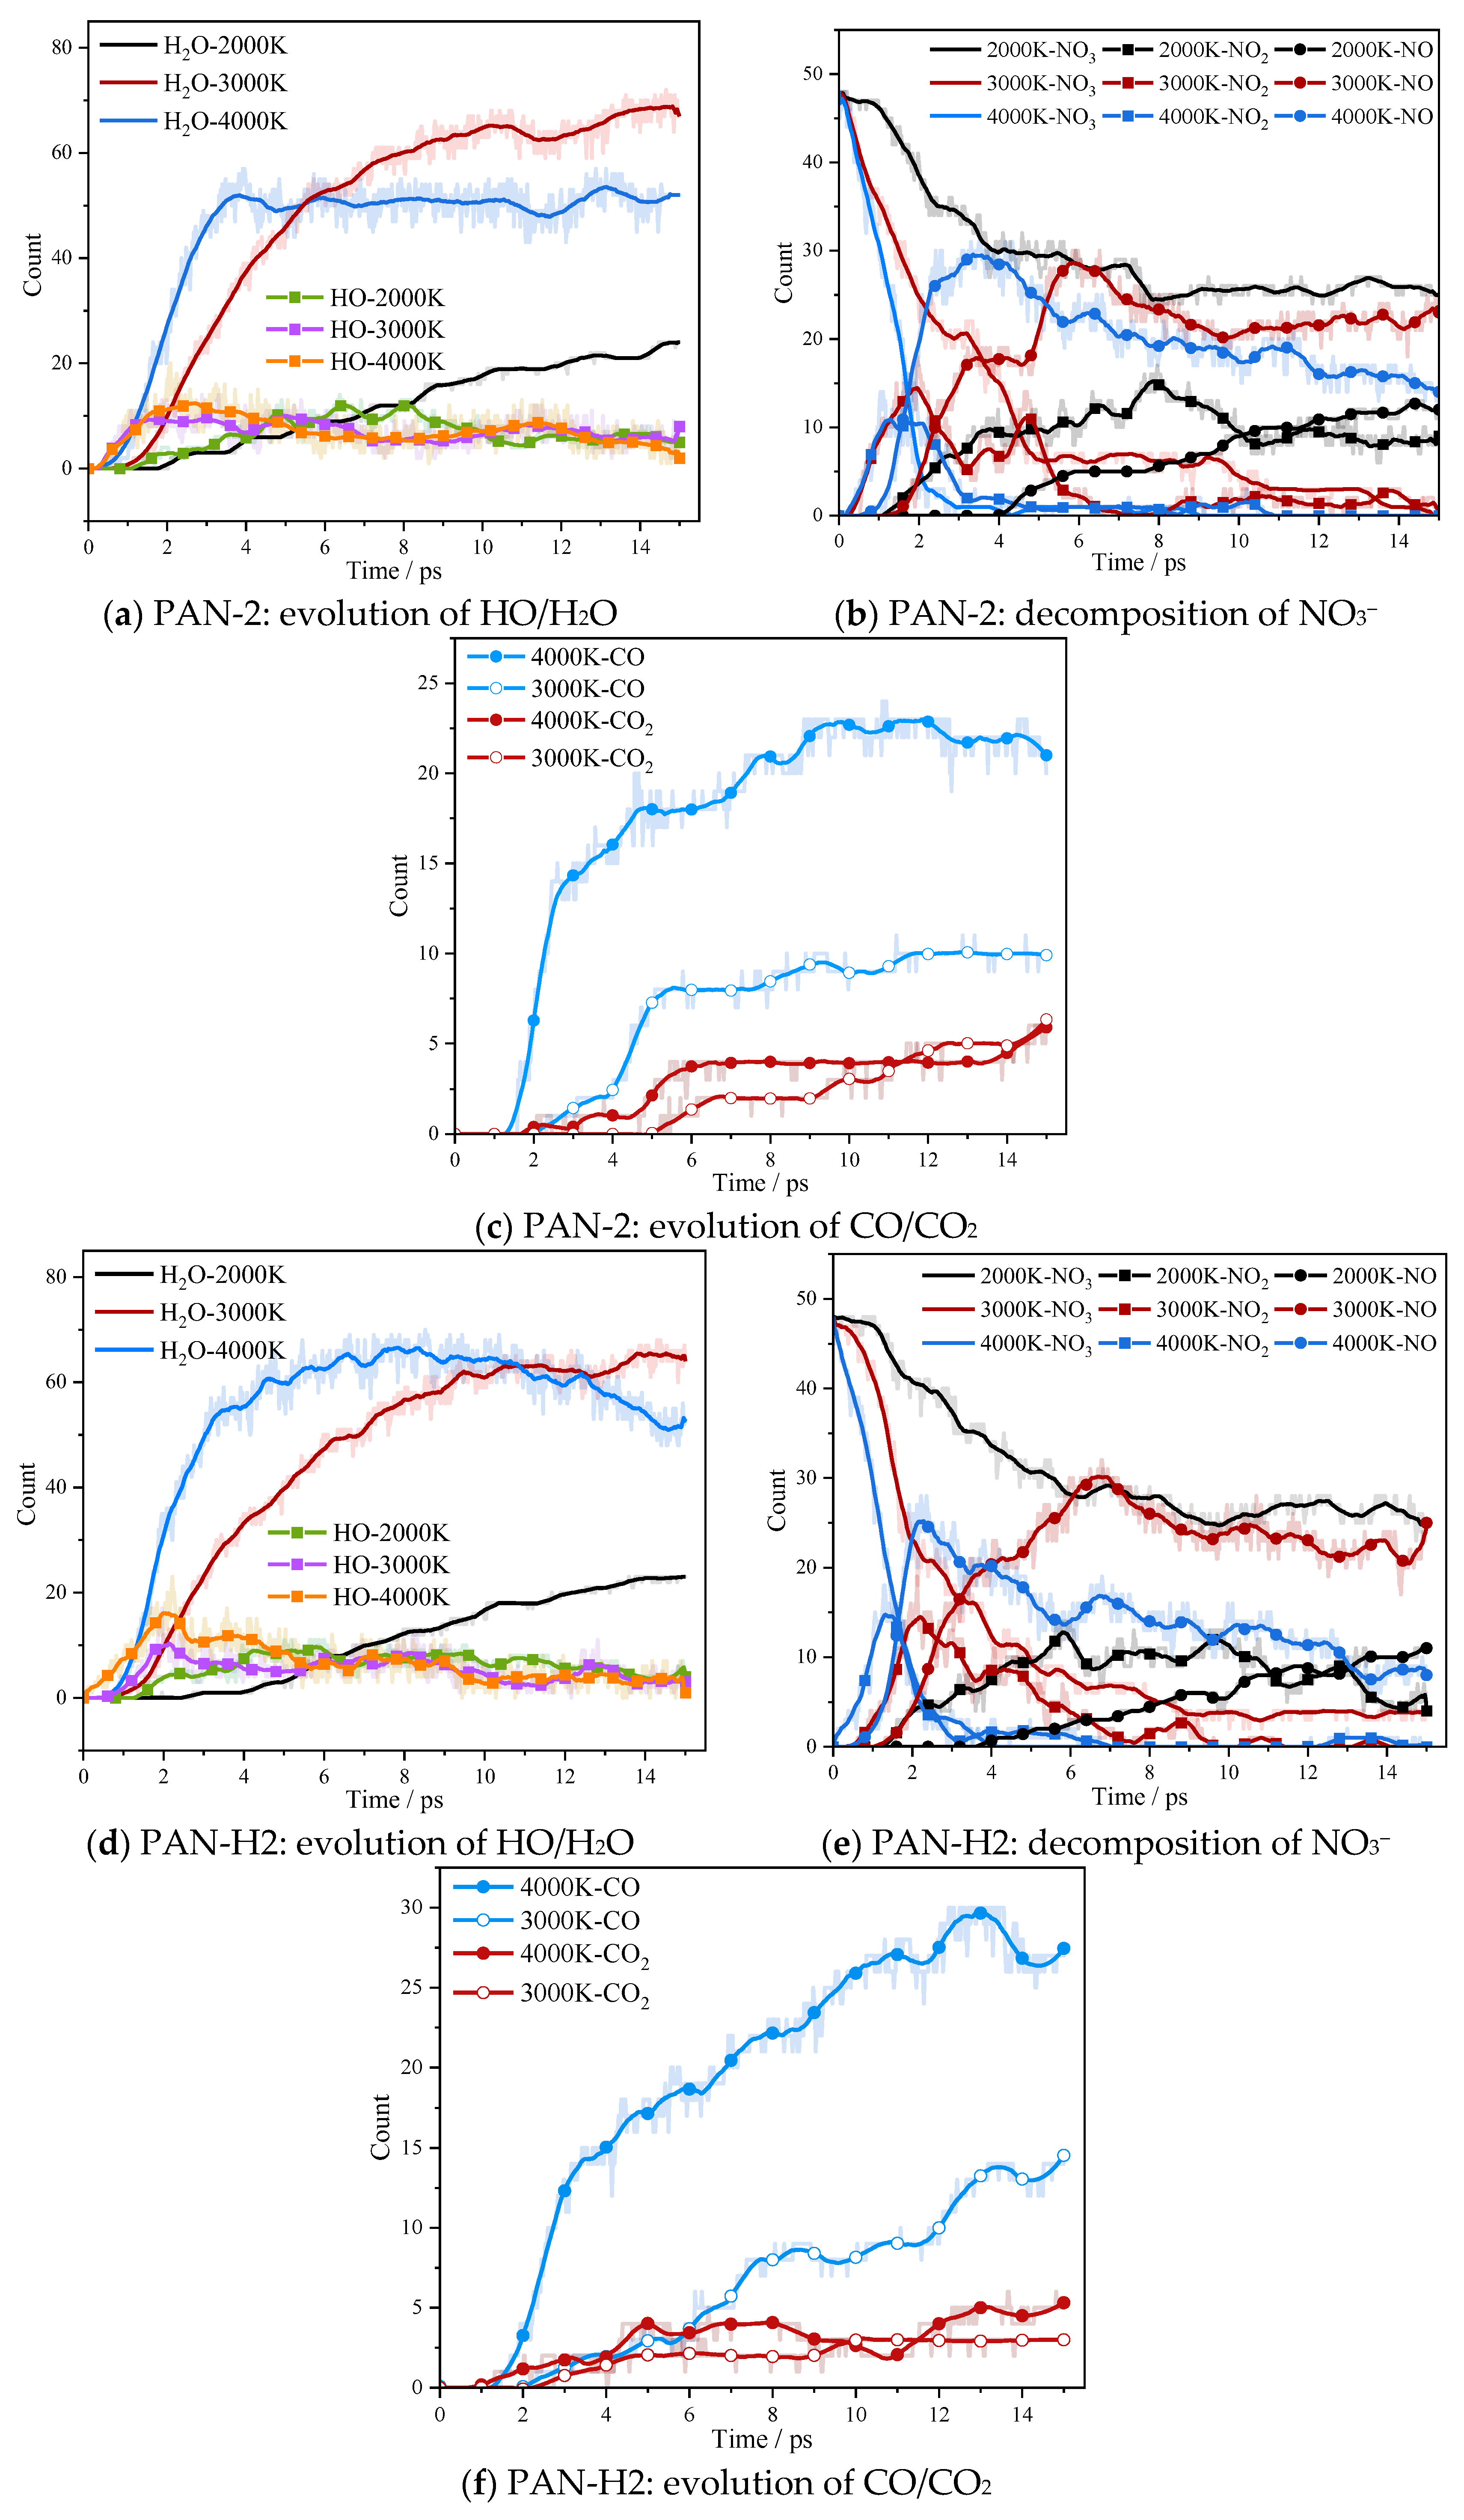
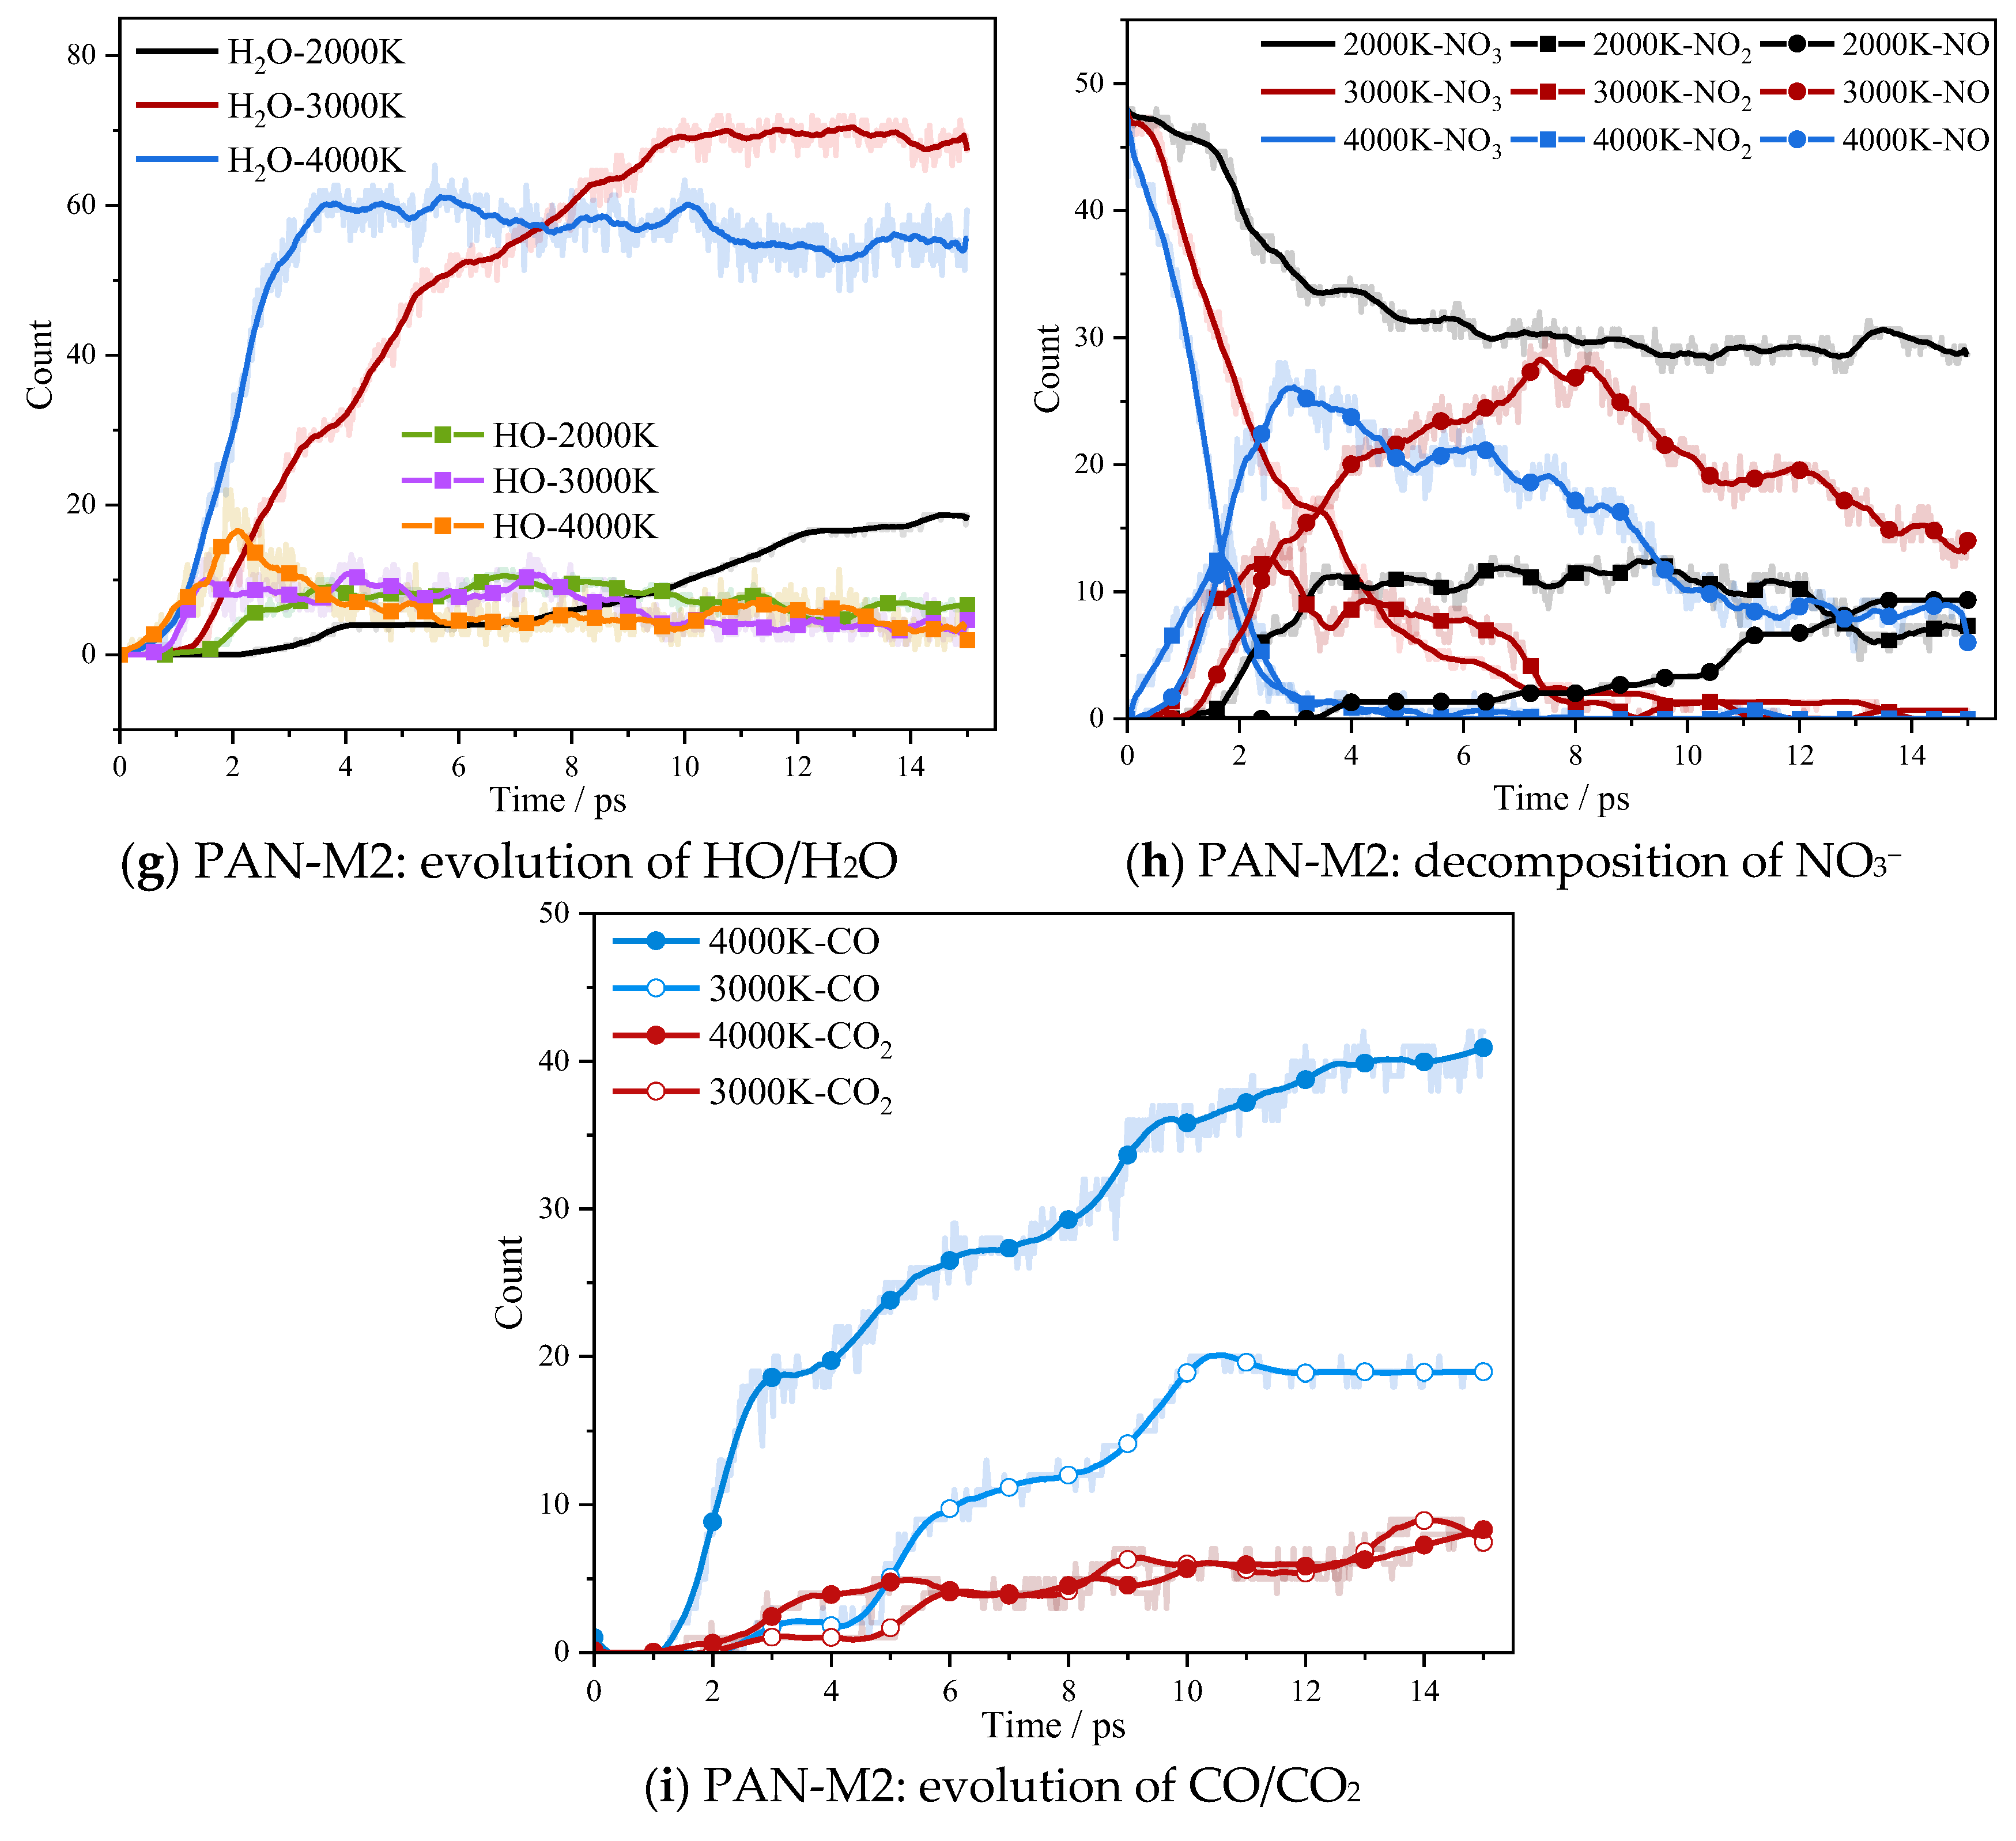
Figure 8 presents the time evolution of the populations of the major final products in the three systems. At all temperatures, H2O is the most abundant oxygen-containing final product; the NO3− count decreases monotonically with time, whereas NO2 and NO exhibit the “rise-then-fall” behavior characteristic of intermediates; CO and CO2 accumulate to observable levels only at 3000 K and above. This product combination indicates that the nitrate anion acts as an endogenous oxidant during thermal decomposition: the active oxygen released through its stepwise deoxygenation (NO3− → NO2 → NO) drives the oxidation of hydrogen to HO/H2O and of carbon to CO/CO2, which, together with the cationic framework disintegration observed in the preceding sections, constitutes a two-component decomposition pathway of “cationic deprotonation and ring-opening coupled with anionic oxygen supply”. The evolution curves of the ring-fragmented small molecules are given in Figure S1 (Section S1.4 of the Supporting Information).
Figure 8.
Time evolution of major final-product populations.
As shown in Figure 8a,d,g, the accumulation rate and final count of H2O increase with temperature overall, yet its terminal value is slightly higher at 3000 K than at 4000 K for all three systems (ca. 68 vs. 50 for PAN-2; ca. 70 vs. 60 for PAN-M2). Given that the CO count happens to be the highest at 4000 K (reaching ca. 41 for PAN-M2, about twice that at 3000 K), it is plausible that at such temperatures part of the water already formed participates in subsequent reactions—for instance, the reaction of carbonaceous oxidation fragments with water to form CO—thereby reducing the apparent accumulation of water. The HO (hydroxyl) counts remain low at all temperatures: HO accumulates slowly at 2000 K, whereas at 3000/4000 K only a transient peak appears (at 1–3 ps), consistent with the picture of HO being an intermediate precursor of water that is “frozen” at low temperatures but rapidly consumed at high temperatures. The CO yield increases with the carbon number: the CO counts of PAN-M2 and PAN-H2 (both C5) are markedly higher than that of PAN-2 (C4), consistent with the contribution of their additional carbon atom; CO2 remains far less abundant than CO under all conditions, indicating that carbon oxidation preferentially stops at the CO stage.
As shown in Figure 8b,e,h, the decay rate of NO3− exhibits a clear temperature ordering (4000 K > 3000 K > 2000 K): it is almost completely consumed within ca. 5 ps at 4000 K, nearly depleted within 10–15 ps at 3000 K, whereas at 2000 K about half of the initial amount remains at 15 ps. This ordering agrees with the overall decomposition extents established in the preceding sections, suggesting that the consumption rate of nitrate is likely controlled by the supply rate of H/C fragments released from the decomposition of the cationic framework (deprotonation and ring-opening). The “rise-then-fall” profiles of NO2 and NO are typical of intermediates in consecutive reactions, and are most distinct at 3000 K, where the longer-lived intermediates accumulate most appreciably; at 4000 K, only brief peaks appear owing to the rapidity of the subsequent conversions. Notably, PAN-M2 exhibits the slowest NO3− decay at 3000 K, which is consistent with its largest deprotonation T50 and highest ring integrity at this temperature, once again demonstrating the correlation between the anion consumption rate and the decomposition extent of the cation.
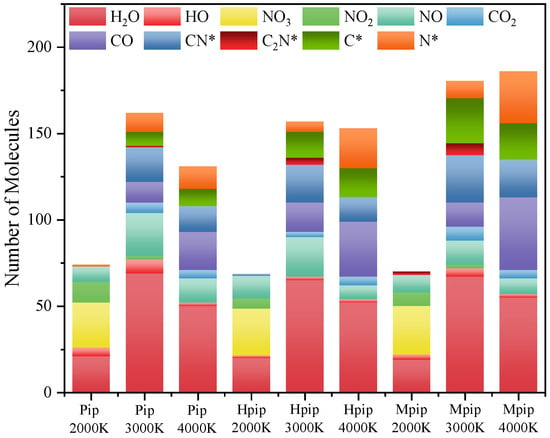
Figure 9 summarizes the product inventories at 15 ps, where an asterisk (*) denotes an indeterminate number of H atoms. As shown in Figure 9, the total product population increases with temperature, and PAN-M2 exhibits the highest total product population at 3000/4000 K—consistent with its highest CO yield and most active ring-fragmentation channels at elevated temperatures, and possibly also related to the additional reactive sites introduced by its demethylation side reaction. From the perspective of elemental balance: carbon flows mainly into CO (together with a small amount of CO2), in addition to H2O as the product of hydrogen oxidation; nitrogen is partitioned between nitrate reduction products (NO2, NO) and backbone-nitrogen elimination products (CN, HCN, NHx); and hydrogen is incorporated predominantly into H2O. The C5 systems (PAN-H2 and PAN-M2) exhibit systematically higher yields of carbon-containing fragments and CO than the C4 system PAN-2, quantitatively consistent with the difference in carbon number.
Figure 9.
Product populations at the end of the reaction. An asterisk (*) denotes an indeterminate number of H atoms in the product.
Table 5 presents a partial comparison between the simulation results of this work and the TG-DSC-MS-FTIR experimental results reported for the PAN series [23]. Combining the three hyphenated techniques, the thermal decomposition of the PAN series was experimentally divided into three stages: the first stage is a phase-transition process with no significant release of small molecules; the second stage involves the rupture of the perovskite framework and the fragmentation of the A-site cations, releasing H2O, CO2, nitrogen oxides and small-molecule intermediates; and the third stage involves redox reactions among the intermediates, producing final gaseous products such as NO2 together with solid products such as K2CO3 and K2O. The “deprotonation → ring-opening → ring fragmentation and oxidation” cascade revealed by our simulations corresponds to the second experimental stage, for which it provides an atomistic microscopic mechanism; the secondary NO2 → NO conversion and the oxidation of carbonaceous fragments observed in the simulations are qualitatively consistent with the redox processes of the intermediates in the third stage.
Table 5.
Comparison of representative simulated products with experimental signals.
At the level of product species, the simulations agree closely with the experiments: H2O is the most abundant oxygen-containing final product in the simulations, consistent with the experimental observation that the m/z = 18 signal in TG-MS is significantly more intense than those of the other products [23]; the stepwise NO3− → NO2 → NO deoxygenation pathway obtained in the simulations agrees with the experimental detection of NO (m/z = 30; FTIR bands at 1911 and 1844 cm−1) and NO2 (m/z = 46); and the simulated predictions of nitrogen- and carbon-containing small molecules, such as HCN (m/z = 27), NHx (m/z = 17) and CH4 (m/z = 16), are all supported by experimental signals. In addition, the experimental formation of H2O has been identified as one of the major contributors to the exothermicity of the system, in agreement with our attribution of the potential-energy decrease to oxidation and small-molecule formation in Section 3.1. It should be noted that the simulation temperatures (2000–4000 K) are far higher than the experimental decomposition temperatures, falling within the regime of accelerated dynamics; the above comparison is therefore qualitative and holds only at the level of product species and reaction sequences, without implying a quantitative correspondence in decomposition temperatures. The formation of minor products such as N2O and HCHO, as well as solid residues such as K2CO3, involves time scales longer than the 15 ps window of the present simulations and will be examined in future work by combining extended simulations with experimental characterization of the solid residues.
Combining the analyses in Section 3.2, Section 3.3, Section 3.4 and Section 3.5, it is clear that the thermal decomposition of PAN-2, PAN-H2 and PAN-M2 proceeds through distinct stage-wise events, which are strongly correlated with the compositional changes in the K+ coordination shell identified in Section 3.2—that is, the K+ coordination composition acts as a probe of the stage-wise progression of the decomposition. To quantitatively correlate the coordination curves in Figure 4 with the stage-specific decomposition instants established in this work, we define τ10% as the instant at which the N-coordination fraction first reaches 0.10. This threshold is chosen for two reasons: it lies well above the initial baseline level (ca. 0.03), avoiding false triggering by thermal fluctuations, and it is well below the saturation values of all curves, ensuring that this instant is well-defined for every system–temperature condition.
Table 6 compares τ10% with T50(NH) and T50(CN). Several observations can be made. First, in all systems τ10% shifts systematically earlier with increasing temperature and is numerically always earlier than T50(NH) of the same system (by ca. 3.0–6.0 ps at 2000 K and by ca. 0.6–1 ps at 3000–4000 K), consistent with the fact that τ10% reflects the onset instant of deprotonation events whereas T50 represents a median. Second, the average N-coordination fractions in the K+ coordination shells at 2000 K (13.8%, 14.9% and 10.9% for PAN-2, PAN-H2 and PAN-M2, respectively) exhibit an inverse ordering relative to the T50(NH) values at 2000 K, which provides, from another perspective, evidence that τ10% is robust against the choice of threshold. Moreover, at 3000 K the N-coordination fraction reaches its maximum near T50(CN) (at ca. 8.1 and 10.8 ps for PAN-2 and PAN-M2, corresponding to T50(CN) values of 8.6 and 9.6 ps, respectively), whereas at 2000 K no maximum appears within 15 ps for any of the three systems, exactly matching the censored behavior of T50(CN) beyond the simulation window (>15 ps), demonstrating that the late-stage response of the probe corresponds to backbone ring-opening. Finally, the applicability of the probe has a well-defined boundary: at 4000 K, the N fraction reaches its maximum at ca. 2.5–3 ps and then declines, while the O-coordination number rises continuously over the same period, reflecting the dilution of the coordination shell by free oxygen following the rapid disintegration of the nitrate anions; the probe is no longer applicable in this temperature regime.
Table 6.
Comparison of τ10% with the characteristic decomposition times.
3.6. Reaction Pathway Analysis of the Three Systems
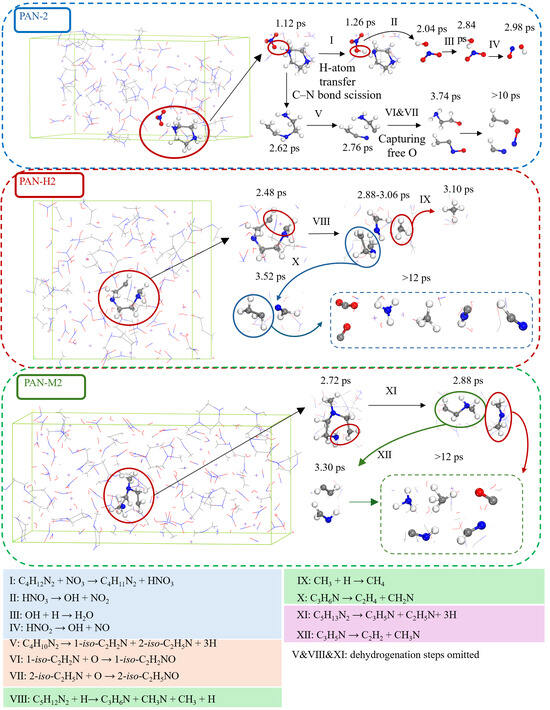
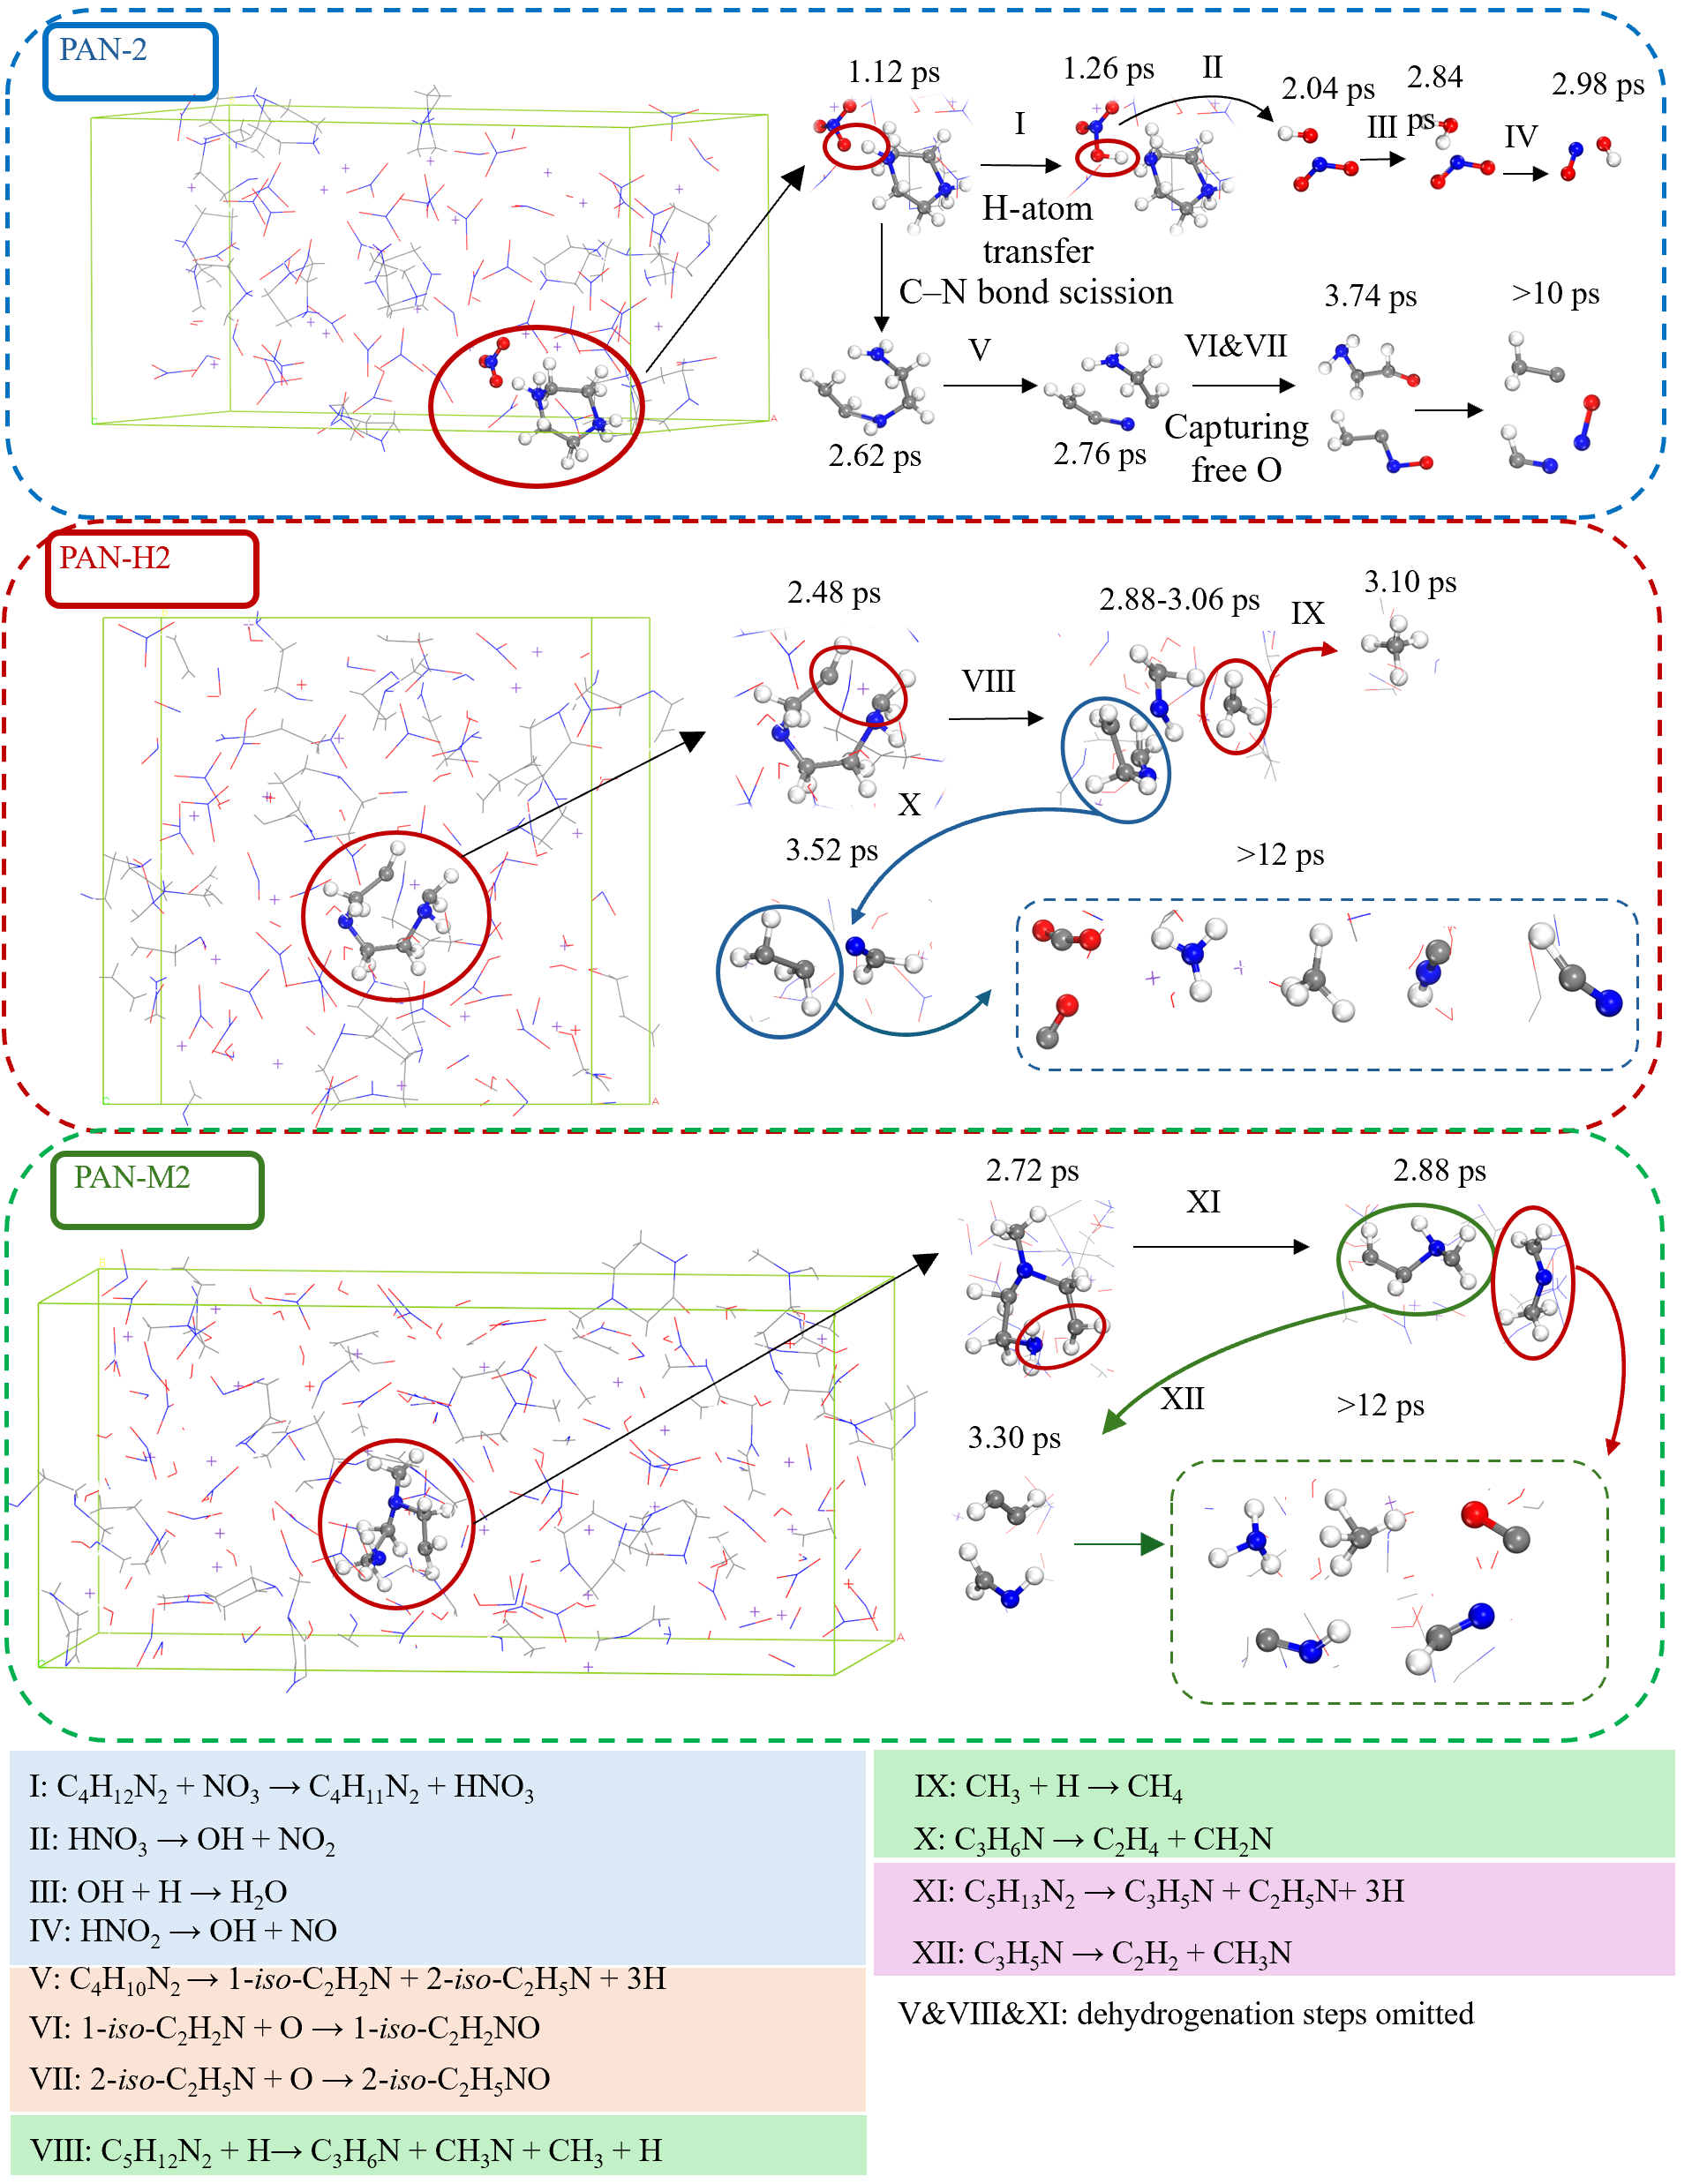
Figure 10 presents selected reaction pathways and products in the thermal decomposition of the three systems at 3000 K, and Figure S2 presents those at 2000 K and 4000 K (Section S1.5 of the Supporting Information). In this section, to distinguish isomeric products, the isomers involved are named in the format “index-iso-molecular formula”.
Figure 10.
Selected decomposition pathways and products at 3000 K.
Reactions I, II, III and IV in Figure 10 illustrate the pathways of nitrate decomposition and water formation: a nitrate anion in the environment combines with a hydrogen atom detached from an organic cation to form an HNO3 moiety, which subsequently decomposes into NO2 and OH; the OH species further combines with a free H atom to form a water molecule, while NO2 undergoes further decomposition to release an O atom or combines with a hydrogen atom, exhibiting a stepwise decomposition process. The pathways of nitrate decomposition and H2O formation are similar among the three systems, whereas the decomposition of the three organic cations differs slightly.
Reactions V–VII show selected decomposition pathways of the piperazinium cation in PAN-2. After deprotonation of the cation, an intraring C–N bond breaks at 2.62 ps, and the six-membered ring undergoes further dehydrogenation (intermediate dehydrogenation steps omitted in the figure) and ring-opening to yield two C2 fragments with different degrees of dehydrogenation, 1-iso-C2H2N and 2-iso-C2H5N (reaction V). The two fragments then capture free O atoms from the environment to form the corresponding oxygenated products 1-iso-C2H2NO and 2-iso-C2H5NO (reactions VI and VII), which further fragment after 3.74 ps and evolve into terminal small molecules such as CH4 and H2O after 10 ps. It should be emphasized that the free O atoms in reactions VI and VII are precisely the products of the stepwise deoxygenation of nitrate (reactions II and IV); this “fragment capturing free oxygen” process directly corroborates, at the atomic scale, the endogenous-oxidant mechanism of nitrate proposed in Section 3.5—anionic oxygen supply and cationic fragment oxidation are directly coupled through the free O atoms.
The decomposition pathway of the homopiperazinium cation in PAN-H2 (reactions VIII–X) differs from that of PAN-2. After deprotonation, the seven-membered ring framework undergoes ring-opening fragmentation at ca. 2.48 ps with the participation of free H atoms (reaction VIII, intermediate dehydrogenation steps omitted), generating C3H6N and CH3N fragments together with a free CH3 radical. The free CH3 rapidly combines with H atoms from the environment to form CH4 (reaction IX, 2.88–3.06 ps), while the C3H6N fragment further decomposes into small molecules such as C2H4 (reaction X, 3.10 ps), and by 3.52 ps the framework has completely fragmented into chain-like segments. In contrast to PAN-2, where ring-opening produces two C2 fragments, homopiperazine, owing to its seven-membered ring structure, exhibits a C3 + C2 fragmentation pattern accompanied by the emergence of the CH3/CH4 channel, which is directly related to the additional CH2 unit of its seven-membered ring.
The 1-methylpiperazinium cation in PAN-M2 decomposes along reactions XI and XII: the deprotonated C5H13N2 undergoes asymmetric ring-opening at 2.72 ps to form two fragments, C3H5N and C2H5N (reaction XI), and C3H5N subsequently undergoes further dehydrogenation and fragmentation into C2H2 and CH3N (reaction XII, 3.30 ps). In this system, the methyl group remains mainly on the nitrogen-containing fragment after ring-opening (CH3N, i.e., a methanimine-type species), which, together with the demethylation side reaction observed in Section 3.4 (the N–CH3 intact fraction drops to 0.33 at 3000 K), demonstrates that 1-methylation introduces an additional ring-fragmentation channel into the system.
Combining the pathway analyses of the three systems, the following conclusions can be drawn: (i) all three systems share an identical anionic decomposition pathway (reactions I–IV), namely “proton transfer to form HNO3 → deoxygenation of HNO3 to NO2 and OH → formation of H2O/further deoxygenation of NO2 to NO”, confirming at the reaction-equation level the role of nitrate as an endogenous oxidant that supplies oxygen stepwise; (ii) the cationic decomposition pathways exhibit a pronounced structural dependence: piperazine ring-opening yields two C2 fragments, homopiperazine fragments in a C3 + C2 manner accompanied by the CH4 formation channel, and 1-methylpiperazine undergoes asymmetric ring-opening with the methyl group retained on the nitrogen-containing fragment; (iii) in all three systems, the first H-transfer event (1.12–2.72 ps) precedes the respective first ring-opening event, and the event sequence at the single-molecule level is consistent with the statistical Δt50 trend established in Section 3.3 and Section 3.4. The reaction pathways at 2000 K and 4000 K are generally similar to those at 3000 K, differing only in the event instants and intermediate lifetimes, as detailed in Figure S2 of the Supporting Information.
4. Conclusions
Using DFTB3 molecular dynamics simulations, this work investigates the thermal decomposition of three K-based nitrate molecular perovskite energetic materials—piperazine (PAN-2), homopiperazine (PAN-H2) and 1-methylpiperazine (PAN-M2)—at 2000–4000 K. From the macroscopic thermal behavior to the atomistic mechanisms, the following main conclusions are drawn:
- (1)
- The thermal decomposition of all three systems follows a cascade sequence of “deprotonation → ring-opening of the cyclic framework → ring fragmentation and oxidation”, in which N–H bond scission (deprotonation) is the earliest and most ubiquitous initiating event. The apparent activation energies of deprotonation (44–55 kJ·mol−1) are substantially lower than those of C–N ring-opening (ca. 135–158 kJ·mol−1, estimated from two temperature points), energetically supporting the stepwise mechanism of “deprotonation first, ring-opening afterwards”. Quantified by Δt50, the difference between the half-lives of the two events, the temporal interval shrinks from more than 6 ps at 2000 K to less than 1 ps at 4000 K—that is, the decomposition proceeds stepwise at low temperatures but approaches quasi-concerted disintegration at high temperatures.
- (2)
- Ring expansion and 1-methylation exert weaker influences on the thermal decomposition than temperature, yet they alter the fragmentation pathways: piperazine ring-opening yields two C2 fragments; homopiperazine exhibits C3 + C2 fragmentation accompanied by the CH3/CH4 formation channel; and 1-methylpiperazine undergoes asymmetric ring-opening accompanied by a demethylation side reaction (the N–CH3 intact fraction drops to 0.33 and 0.29 at 3000 K and 4000 K, respectively), with the methyl group retained mainly on nitrogen-containing fragments. The differences in the decomposition pathways of the three systems correspond directly to the ring size and substituent structure of the cations.
- (3)
- The reaction pathways and product distributions jointly confirm the endogenous-oxidant role of nitrate: the protons released from the cations are captured by nitrate to form HNO3, which undergoes stepwise deoxygenation along NO3− → NO2 → NO, releasing active oxygen that drives the formation of H2O and CO/CO2; ring-opened fragments directly capture free O atoms to form oxygenated fragments (reactions VI and VII), realizing the direct coupling of “anionic oxygen supply–cationic oxidation” at the atomic scale. The yields of CO and carbon-containing fragments of the C5 systems are systematically higher than those of the C4 system, consistent with the difference in carbon number. The simulated product compositions are qualitatively consistent, at the level of product species, with the TG-MS/FTIR experimental observations on the PAN series (signals of H2O, NO, NO2, CO2, HCN, NHx, CH4, etc.).
- (4)
- The composition of the K+ coordination shell acts as a probe of the framework disintegration process. The rise in the N-coordination fraction is synchronized with the onset front of deprotonation events (τ10% is systematically earlier than the deprotonation half-life), and its maximum occurs near the ring-opening half-life; the absence of a maximum at 2000 K corresponds exactly to the censored behavior of the ring-opening half-life beyond the simulation window. The probe fails in the temperature regime where nitrate itself decomposes rapidly (4000 K) owing to the dilution of the coordination shell, and its applicability boundary is thus well-defined.
It should be noted that the molecular dynamics simulations in this work fall within the regime of accelerated dynamics; the resulting apparent activation energies characterize the apparent sensitivity of the rates to temperature within the simulated temperature window and are not equivalent to the static barriers of the elementary reactions, and the ring-opening activation energies, estimated from only two temperature points, carry considerable uncertainty. In addition, the coordination-shell probe strategy fails at high temperatures (4000 K) due to the rapid disintegration of nitrate, and its applicability over a broader temperature range remains to be further validated.
Supplementary Materials
The following supporting information can be downloaded at: https://www.mdpi.com/article/10.3390/molecules31224222/s1, Table S1. Statistics of the thermal decomposition of N–H bonds. Table S2. Key ring-opening parameters for the three systems. Table S3. Uncertainties of the characteristic instants across three replicates. Table S4. Uncertainties of the apparent activation energies across three replicates. Figure S1. Time evolution of the ring-fragmented small-molecule products. Figure S2. Selected decomposition pathways and products at 2000 and 4000 K.
Author Contributions
Conceptualization, J.W.; Methodology, R.L.; Software, R.L.; Validation, R.L., Y.S. and J.L.; Formal Analysis, R.L.; Investigation, R.L.; Resources, J.W.; Data Curation, R.L.; Writing—Original Draft Preparation, R.L.; Writing—Review & Editing, J.W., R.L., Y.S. and J.L.; Visualization, R.L.; Supervision, J.W.; Project Administration, J.W.; Funding Acquisition, J.W. All authors have read and agreed to the published version of the manuscript.
Funding
This research received no external funding.
Data Availability Statement
The data supporting the findings of this study are available within the article and its Supporting Information; additional raw data are available from the corresponding author upon reasonable request.
Acknowledgments
The support from Beijing Institute of Technology for this work is gratefully acknowledged.
Conflicts of Interest
The authors declare no conflicts of interest.
References
- Badgujar, D.M.; Talawar, M.B.; Asthana, S.N.; Mahulikar, P. Advances in science and technology of modern energetic materials: An overview. J. Hazard. Mater. 2008, 151, 289–305. [Google Scholar] [CrossRef] [Scilit] [PubMed]
- Klapötke, T.M. The Future of Synthesis Chemistry in Energetics. Propellants Explos. Pyrotech. 2023, 48, e202380331. [Google Scholar] [CrossRef] [Scilit]
- Li, R.; Pang, W.; Zhang, Y.; Trache, D.; DeLuca, L.T. Mechanical Sensitivity Improvement of CL-20 by Using Crystal Passivation: A Brief Review. ACS Omega 2025, 10, 27659–27672. [Google Scholar] [CrossRef] [Scilit] [PubMed]
- Yadav, A.K.; Dharavath, S. Shaping the future of energetic materials: Breakthroughs, barriers, and emerging frontiers. Chem. Commun. 2025, 61, 16547–16559. [Google Scholar] [CrossRef] [Scilit] [PubMed]
- Chen, S.L.; Shang, Y.; He, C.T.; Sun, L.-Y.; Ye, Z.-M.; Zhang, W.-X.; Chen, X.-M. Optimizing the oxygen balance by changing the A-site cations in molecular perovskite high-energetic materials. CrystEngComm 2018, 20, 7458–7463. [Google Scholar] [CrossRef] [Scilit]
- Kojima, A.; Teshima, K.; Shirai, Y.; Miyasaka, T. Organometal Halide Perovskites as Visible-Light Sensitizers for Photovoltaic Cells. J. Am. Chem. Soc. 2009, 131, 6050–6051. [Google Scholar] [CrossRef] [Scilit] [PubMed]
- Saparov, B.; Mitzi, D.B. Organic–Inorganic Perovskites: Structural Versatility for Functional Materials Design. Chem. Rev. 2016, 116, 4558–4596. [Google Scholar] [CrossRef] [Scilit] [PubMed]
- Shang, Y.; Huang, R.K.; Chen, S.L.; He, C.-T.; Yu, Z.-H.; Ye, Z.-M.; Zhang, W.-X.; Chen, X.-M. Metal-Free Molecular Perovskite High-Energetic Materials. Cryst. Growth Des. 2020, 20, 1891–1897. [Google Scholar] [CrossRef] [Scilit]
- Chen, S.L.; Yang, Z.R.; Wang, B.J.; Shang, Y.; Sun, L.-Y.; He, C.-T.; Zhou, H.-L.; Zhang, W.-X.; Chen, X.-M. Molecular perovskite high-energetic materials. Sci. China Mater. 2018, 61, 1123–1128. [Google Scholar] [CrossRef] [Scilit]
- Shang, Y.; Yu, Z.H.; Huang, R.K.; Chen, S.-L.; Liu, D.-X.; Chen, X.-X.; Zhang, W.-X.; Chen, X.-M. Metal-Free Hexagonal Perovskite High-Energetic Materials with NH3OH+/NH2NH3+ as B-Site Cations. Engineering 2020, 6, 1013–1018. [Google Scholar] [CrossRef] [Scilit]
- Zhang, W.X.; Chen, S.L.; Shang, Y.; Yu, Z.-H.; Chen, X.-M. Molecular perovskites as a new platform for designing advanced multi-component energetic crystals. Energ. Mater. Front. 2020, 1, 123–135. [Google Scholar] [CrossRef] [Scilit]
- Shang, Y.; Chen, S.L.; Yu, Z.H.; Huang, R.-K.; He, C.-T.; Ye, Z.-M.; Zhang, W.-X.; Chen, X.-M. Silver(I)-Based Molecular Perovskite Energetic Compounds with Exceptional Thermal Stability and Energetic Performance. Inorg. Chem. 2022, 61, 4143–4149. [Google Scholar] [CrossRef] [Scilit] [PubMed]
- Han, K.; Zhang, X.; Deng, P.; Jiao, Q.; Chu, E. Study of the thermal catalysis decomposition of ammonium perchlorate-based molecular perovskite with titanium carbide MXene. Vacuum 2020, 180, 109572. [Google Scholar] [CrossRef] [Scilit]
- Lu, C.; Wu, S.; Yuan, C.; Qin, H.; Wan, J.; Zhang, J.; Wang, R. The thermal catalytic effects of graphene oxide on the molecular perovskite energetic material (DAP-4). J. Nanoparticle Res. 2025, 28, 8. [Google Scholar] [CrossRef] [Scilit]
- Chen, S.L.; Shang, Y.; Jiang, J.; Huang, M.; Ren, J.-T.; Guo, T.; Yu, C.-X.; Zhang, W.-X.; Chen, X.-M. A new nitrate-based energetic molecular perovskite as a modern edition of black powder. Energ. Mater. Front. 2022, 3, 122–127. [Google Scholar] [CrossRef] [Scilit]
- Yehia, M.; Ismael, S.; Naeem, I.; Sousa-Castillo, A.; Vázquez-González, M.; Correa-Duarte, M.A.; Elbasuney, S. Facile synthesis and decomposition kinetics of novel green energetic molecular perovskite based on nitrate group DAN-4 as an alternative for ammonium nitrate oxidizer. Sci. Rep. 2025, 15, 17733. [Google Scholar] [CrossRef] [Scilit] [PubMed]
- Feng, X.J.; Zhang, K.; Xue, L.X.; Pan, W. Thermal Decomposition Mechanism of Molecular Perovskite Energetic Material (C6NH14)(NH4)(ClO4)3(DAP-4). Propellants Explos. Pyrotech. 2022, 47, e202100362. [Google Scholar] [CrossRef] [Scilit]
- Zhai, P.; Shi, C.; Zhao, S.; Liu, W.; Wang, W.; Yao, L. Thermal decomposition of ammonium perchlorate-based molecular perovskite from TG-DSC-FTIR-MS and ab initio molecular dynamics. RSC Adv. 2021, 11, 16388–16395. [Google Scholar] [CrossRef] [Scilit] [PubMed]
- Jia, Q.; Deng, P.; Li, X.; Hu, L.; Cao, X. Insight into the thermal decomposition properties of potassium perchlorate (KClO4)-based molecular perovskite. Vacuum 2020, 175, 109257. [Google Scholar] [CrossRef] [Scilit]
- Wu, Y.; Sun, H.; Wu, L.; Deetz, J.D. Extracting the mechanisms and kinetic models of complex reactions from atomistic simulation data. J. Comput. Chem. 2019, 40, 1586–1592. [Google Scholar] [CrossRef] [Scilit] [PubMed]
- Jiang, H.; Jiao, Q.; Zhang, C. Early Events When Heating 1,1-Diamino-2,2-dinitroethylene: Self-Consistent Charge Density-Functional Tight-Binding Molecular Dynamics Simulations. J. Phys. Chem. C 2018, 122, 15125–15132. [Google Scholar] [CrossRef] [Scilit]
- He, Z.H.; Chen, J.; Ji, G.F.; Liu, L.-M.; Zhu, W.-J.; Wu, Q. Dynamic Responses and Initial Decomposition under Shock Loading: A DFTB Calculation Combined with MSST Method for β-HMX with Molecular Vacancy. J. Phys. Chem. B 2015, 119, 10673–10681. [Google Scholar] [CrossRef] [Scilit] [PubMed]
- Shang, Y.; Li, J.; Liu, R.; Chen, L. Preparation, characterization, and ignition properties of novel perovskite energetic materials: The PANs-2 series. Results Eng. 2025, 28, 107117. [Google Scholar] [CrossRef] [Scilit]
- Porezag, D.; Frauenheim, T.; Köhler, T.; Seifert, G.; Kaschner, R. Construction of tight-binding-like potentials on the basis of density-functional theory: Application to carbon. Phys. Rev. B 1995, 51, 12947–12957. [Google Scholar] [CrossRef] [Scilit] [PubMed]
- Elstner, M.; Porezag, D.; Jungnickel, G.; Elsner, J.; Haugk, M.; Frauenheim, T.; Suhai, S.; Seifert, G. Self-consistent-charge density-functional tight-binding method for simulations of complex materials properties. Phys. Rev. B 1998, 58, 7260–7268. [Google Scholar] [CrossRef] [Scilit]
- Gaus, M.; Cui, Q.; Elstner, M. DFTB3: Extension of the Self-Consistent-Charge Density-Functional Tight-Binding Method (SCC-DFTB). J. Chem. Theory Comput. 2011, 7, 931–948. [Google Scholar] [CrossRef] [Scilit] [PubMed]
- Yang, Y.; Yu, H.; York, D.; Cui, Q.; Elstner, M. Extension of the Self-Consistent-Charge Density-Functional Tight-Binding Method: Third-Order Expansion of the Density Functional Theory Total Energy and Introduction of a Modified Effective Coulomb Interaction. J. Phys. Chem. A 2007, 111, 10861–10873. [Google Scholar] [CrossRef] [Scilit] [PubMed]
- Gruden, M.; Andjeklović, L.; Jissy, A.K.; Stepanović, S.; Zlatar, M.; Cui, Q.; Elstner, M. Benchmarking density functional tight binding models for barrier heights and reaction energetics of organic molecules. J. Comput. Chem. 2017, 38, 2171–2185. [Google Scholar] [CrossRef] [Scilit] [PubMed]
- Gaus, M.; Goez, A.; Elstner, M. Parametrization and Benchmark of DFTB3 for Organic Molecules. J. Chem. Theory Comput. 2012, 9, 338–354. [Google Scholar] [CrossRef] [Scilit] [PubMed]
- Penz, A.; Gamper, J.; Gallmetzer, J.M.; Purtscher, F.R.S.; Hofer, T.S. Parametrization of Zirconium for DFTB3/3OB: A Pathway to Study Complex Zr-Compounds for Biomedical and Material Science Applications. J. Comput. Chem. 2025, 46, e70140. [Google Scholar] [CrossRef] [Scilit] [PubMed]
- Nosé, S. A unified formulation of the constant temperature molecular dynamics methods. J. Chem. Phys. 1984, 81, 511–519. [Google Scholar] [CrossRef] [Scilit]
- Hoover, W.G. Canonical dynamics: Equilibrium phase-space distributions. Phys. Rev. A 1985, 31, 1695–1697. [Google Scholar] [CrossRef] [Scilit] [PubMed]
- Parrinello, M.; Rahman, A. Polymorphic transitions in single crystals: A new molecular dynamics method. J. Appl. Phys. 1981, 52, 7182–7190. [Google Scholar] [CrossRef] [Scilit]
- Grimme, S.; Antony, J.; Ehrlich, S.; Krieg, H. A consistent and accurate ab initio parametrization of density functional dispersion correction (DFT-D) for the 94 elements H-Pu. J. Chem. Phys. 2010, 132, 154104. [Google Scholar] [PubMed]
- Kubillus, M.; Kubař, T.; Gaus, M.; Řezáč, J.; Elstner, M. Parameterization of the DFTB3 Method for Br, Ca, Cl, F, I, K, and Na in Organic and Biological Systems. J. Chem. Theory Comput. 2015, 11, 332–342. [Google Scholar] [CrossRef] [Scilit] [PubMed]
- Waite, S.L.; Karton, A.; Chan, B.; Page, A.J. Thermochemical stabilities of giant fullerenes using density functional tight binding theory and isodesmic-type reactions. J. Comput. Chem. 2021, 42, 222–230. [Google Scholar] [CrossRef] [Scilit] [PubMed]
- Yu, J.; Horsfield, A. Tight Binding Simulation of the MgO and Mg(OH)2 Hydration and Carbonation Processes. J. Chem. Theory Comput. 2025, 21, 1961–1977. [Google Scholar] [CrossRef] [Scilit] [PubMed]
- Yoshida, H. Construction of higher order symplectic integrators. Phys. Lett. A 1990, 150, 262–268. [Google Scholar] [CrossRef] [Scilit]
- Tuckerman, M.; Berne, B.J.; Martyna, G.J. Reversible multiple time scale molecular dynamics. J. Chem. Phys. 1992, 97, 1990–2001. [Google Scholar] [CrossRef] [Scilit]

Disclaimer/Publisher’s Note: The statements, opinions and data contained in all publications are solely those of the individual author(s) and contributor(s) and not of MDPI and/or the editor(s). MDPI and/or the editor(s) disclaim responsibility for any injury to people or property resulting from any ideas, methods, instructions or products referred to in the content. |
© 2026 by the authors. Licensee MDPI, Basel, Switzerland. This article is an open access article distributed under the terms and conditions of the Creative Commons Attribution (CC BY) license.