


Abstract
This paper analyses the applicability of radar charts for evaluating sewage sludge dewatering efficiency, based on data for anaerobically digested sludge from a large municipal wastewater treatment plant. Four cationic polyelectrolytes, used alone and with the inorganic coagulant PIX C28 at 0–16 kg/t DS (32 variants), were compared in technological and economic terms. Eight normalization methods were assessed on the basis of the radar chart area variability across 12 geometrically distinct axis arrangements, complemented by the TOPSIS method. Min-Max and percentile normalizations proved most suitable (median coefficient of variation of the area: 0.0042 and 0.0118), while maximum-based normalization showed the distance from the best variant. PIX-assisted systems achieved the highest technological effect (mean TOPSIS score 0.938 vs. 0.660 for polyelectrolytes alone; maximum 0.995), allowing a fourfold reduction in polyelectrolyte dose. However, PIX C28 (€363.37/t DS) accounted for 78–95% of the conditioning cost, lowering techno-economic efficiency by about an order of magnitude. The most favourable effect-to-cost ratio was obtained for Zetag 8190 and Super Floc C446 used alone at 8 kg/t DS, whereas at 4 kg/t DS conditioning without the coagulant worsened the multi-criteria assessment despite reduced capillary suction time. The TOPSIS and radar chart assessments were strongly correlated (r = 0.967). These results confirm the need for multi-criteria evaluation, for which radar charts with an appropriately selected normalization method are a useful tool.
1. Introduction
Sewage sludge is an inevitable by-product of the biological treatment of municipal wastewater. It constitutes a complex organic-mineral material whose composition and physicochemical properties significantly affect the processes of thickening, conditioning, and dewatering [1]. The scale of sludge generation is considerable—global production of municipal sewage sludge from urban wastewater treatment plants amounts to 45 million tonnes of dry solids (DS) per year [2].
Mechanical dewatering is a critical step in the sludge treatment chain, understood as a volume reduction process. Regardless of the intended final disposal route—composting, thermal treatment, or land application—dewatering is an essential operation that enables the reduction of sludge volume and mass, as well as lowering the costs of transportation and further processing [1]. In large municipal wastewater treatment plants equipped with dedicated anaerobic digesters (AD), the sludge subjected to mechanical dewatering is typically anaerobically digested sludge. Compared to raw or aerobically stabilised sludges, digested sludge generally exhibits more favourable dewatering characteristics [3].
Sludge dewaterability is a function of numerous interrelated factors: the content and spatial distribution of water within floc structures, the presence and properties of extracellular polymeric substances (EPS), the surface charge of particles, protein and polysaccharide content, floc size and morphology, and the compressibility of the filter cake. Water in sludge is not homogeneous; it can be classified as free water, capillary water, or water chemically or physically bound to solid matter. The effectiveness of mechanical dewatering is limited by the bound water fraction, which cannot be removed by mechanical means alone, or can only be removed with great difficulty. The complex matrix of sludge means that no single universal parameter fully describes its dewaterability [3].
For municipal sewage sludge, chemical conditioning is typically an indispensable step prior to mechanical dewatering, as it improves the separation properties of the sludge and increases process efficiency. The most widely used approach is the dosing of cationic or anionic organic flocculants, which act by neutralising the surface charge of particles and forming polymer bridges between flocs, leading to their aggregation and growth in size [3]. In parallel, iron-based inorganic coagulants marketed under the trade name PIX are widely used in operational practice. These are aqueous solutions of iron (III) sulphate or iron (III) chloride, which act by destabilising colloids through charge neutralisation and by precipitating amorphous iron hydroxides that initiate flocculation. Research indicates that the combined use of a PIX coagulant and a polyelectrolyte yields a cleaner filtrate compared to conditioning with a polyelectrolyte alone, and the final moisture content of the filter cake is markedly improved [4]. The selection of optimal reagent doses under industrial conditions is based on plant-specific sludge studies; given the need to simultaneously evaluate multiple technological and economic parameters, there is a clear need for transparent and practical analytical tools [1,5].
The dewatering efficiency of sewage sludge can be assessed using a range of empirical methods and technological indicators, including: capillary suction time (CST), specific resistance to filtration (SRF), volume of released liquid, TSS removal efficiency, and polyelectrolyte consumption—each of which describes only a selected aspect of the multi-stage the process [3]. A fundamental challenge in the practical assessment of the process is that individual parameters are measured in different units and on different scales, which makes their direct comparison and holistic interpretation impossible [6]. Sewage sludge dewatering efficiency should be evaluated using multiple technological parameters, as a single indicator does not fully capture the complexity of the process. Such an approach, however, requires the reduction of variables expressed in different units and scales to a common, comparable numerical representation. Data normalization is the fundamental step that enables such analysis. The problem of normalising complex data and converting variables of different scales into a unified, comparable numerical form is a key issue for any tool enabling the synthetic assessment of the dewatering process.
A response to the need for synthetic, multi-dimensional result presentation may be the use of radar charts as a data visualisation tool. Radar charts provide a compact representation of multiple variables by arranging axes radially and connecting the corresponding values to form a polygon, whose shape and area directly convey information about the interrelationships between the analysed parameters. Radar charts enable rapid visual comparison of multi-dimensional profiles that are difficult to present and compare in traditional tabular form. A notable limitation of radar charts is the possibility of obtaining different polygon shapes for the same data depending on the order in which variables are arranged along the axes, which directly limits the unambiguity of result interpretation [7]. This issue is particularly significant when no substantive rationale exists to indicate which parameters should be adjacent on the chart, and when the polygon area depends not only on the values of the presented parameters but also on the chosen axis order—a limitation inherent to the geometry of circular representations. For this reason, the effect of axis arrangement should be incorporated into the analysis methodology to reduce the risk of accidental or ambiguous interpretation of results. Based on experimental data, a comparative and economic analysis of selected polyelectrolytes used alone and in combination with the inorganic coagulant PIX C28 was conducted. Several data normalization methods were examined, evaluated in terms of mean, variability, and dispersion of normalised values, with particular emphasis on the variability of the radar chart area as a function of parameter arrangement along the axes. The aim of this study is to demonstrate that radar charts, supported by an appropriately selected normalization method, can serve as a useful and intuitive tool for the analysis and interpretation of results from the multi-parameter process of sewage sludge dewatering.
2. Materials and Methods
Iron based coagulant (PIX) was used as the coagulant in the study. As flocculation aids, polyelectrolytes of varying cationicity in powder or emulsion form were employed. All substances mentioned are commercial products used in municipal wastewater treatment practice.
2.1. Iron Coagulant—PIX C28
Coagulation constitutes an interventional element of advanced primary wastewater treatment, enabling the simultaneous removal of multiple contaminants through the application of coagulants and flocculants that promote floc formation and sedimentation. The choice of coagulant and its dose determines both the quantity of sludge produced and its physical properties, including density, which directly affects the costs and efficiency of subsequent sludge processing. PIX is an inorganic coagulant based on trivalent iron, widely used in the physicochemical treatment of municipal wastewater. Its mechanism of action involves the hydrolysis of iron ions in an aqueous environment, leading to the formation of hydroxide complexes that neutralise the surface charge of colloidal particles, resulting in their destabilisation and aggregation into readily sedimenting flocs. Owing to its high effectiveness in removing suspended solids, phosphorus, and other contaminants, as well as its applicability across a wide range of process conditions, PIX is widely used as a coagulant in wastewater treatment plants [8]. According to the manufacturer’s technical specification, the product has a total iron content of 10.5 ± 0.5%, a ferrous iron (Fe2+) content of max. 0.5%, a chloride content of 19 ± 1.0%, free hydrochloric acid of 0–3%, water-insoluble matter of <0.15 wt.% and a density of 1.32 ± 0.05 g/cm3 at 20 °C. Its freezing point is below −30 °C, the recommended storage time is up to 6 months, and the product is intended to be dosed undiluted. The fixed PIX C28 dose of 10 L/m3 of sludge corresponds to 13.2 kg of product per m3, i.e., approximately 391 kg of product (41 kg Fe) per tonne of DS at the mean DS concentration of 33.72 kg/m3.
2.2. Sewage Sludge
The study was conducted on anaerobically digested sludge collected from the anaerobic digester (AD) of a large municipal wastewater treatment plant. The sludge was sampled daily throughout the measurement period, and on each test day reference measurements of all analysed dewatering parameters (CST, SRF, volume of released liquid and TSS in the centrate) were performed for the unconditioned sample (dose 0), so that each series of conditioning tests was referenced to the current properties of the sludge. During the measurement period, the pH of the sludge averaged 7.25 (range 7.14–7.34), and the mean dry solids (DS) concentration was 33.72 kg/m3, of which organic matter accounted for 65%. The mean concentration of volatile fatty acids (VFA) was 312.6 g CH3COOH/m3, the mean alkalinity was 3667.7 mg CaCO3/dm3, and the mean chemical oxygen demand (COD) was 32,528 g O2/m3.
2.3. Organic Substances—Cationic Polyelectrolytes
Cationic polyelectrolytes are high-molecular-weight polymers with a positive electrical charge, widely used as conditioning agents for sewage sludge prior to dewatering. Their mechanism of action involves the neutralisation of the negative surface charge of colloidal particles present in the sludge, leading to the destabilisation of the system and the formation of larger, more readily sedimenting agglomerates. In practice, cationic polyelectrolytes are used both alone and in combination with inorganic coagulants such as PIX, where they exhibit a synergistic effect—the coagulant destabilises colloidal particles, while the polyelectrolyte promotes the formation of compact flocs with improved filtration properties [9]. Several polyelectrolytes were selected for testing in order to evaluate their sludge dewatering enhancement properties. The polyelectrolytes tested were characterised by high or moderate cationicity. A summary of the tested chemical agents is presented in Table 1 below.
Table 1.
Parameters of selected conditioning agents with market prices. All products was sourced by Brenntag Polska sp. z o.o. ul. J. Bema 21, 47-224, Kędzierzyn-Koźle, Poland.
The contents of individual components in the commercial formulations are reported as ranges. The polyelectrolytes were characterised solely on the basis of the manufacturers’ documentation. The exact molecular weight, charge density and composition of these commercial products are not disclosed, as they are protected by the manufacturers as trade secrets and proprietary know-how. Accordingly, the molecular weight is reported as the class declared by the supplier, the cationicity is used as an indicator of charge density, and the composition is limited to the substances and concentration ranges indicated in the SDS; for ACE 80202, these data were not provided by the supplier (N/D). Independent molecular characterisation of the reagents and analysis of floc structure were beyond the scope of this study. Information on the base polymers of the emulsions was supplemented using the product technical data sheets.
2.4. Sample Conditioning Procedure
Conditioning tests were carried out on anaerobically digested sludge collected from the AD on each test day, so that every series was referenced to a same-day unconditioned sample. For each variant, 100 mL of sludge was placed in a bottle and the conditioning agents were added at the specified doses; in the PIX-assisted systems, PIX C28 (1 mL per 100 mL of sludge, corresponding to 10 L/m3) was dosed first, followed by the polyelectrolyte. After each reagent addition, the sample was mixed by vigorous manual shaking until complete homogenisation, the same standardized procedure was followed for all variants. The contact time between reagent addition and measurement was kept constant for all samples, and the measurements were performed immediately after conditioning. Particular attention was paid to the reproducibility of mixing, so that differences between variants reflected the effect of the applied reagents and doses rather than variations in sample preparation. The tests were designed as a comparative laboratory study conducted under uniform conditions, providing a consistent dataset for the evaluation of radar charts and normalization methods.
2.5. Dewatering Parameters
Sewage sludge dewatering is one of the key stages in sludge processing, aimed at reducing sludge volume through the removal of as much water as possible. The effectiveness of this process depends on numerous factors, related both to the properties of the sludge itself and to the mechanical dewatering method employed. Depending on the sludge composition and properties, as well as the technological and economic requirements, various methods of mechanical and chemical dewatering are applied [8].
It should be noted that CST, SRF and the centrifugation test in the MPW 350 laboratory centrifuge (MPW, Warsaw, Poland) are not alternative dewatering methods, but laboratory tests of sludge dewaterability, each describing a different aspect of the process: CST provides a rapid indication of conditioning quality, SRF characterizes the filtration properties relevant to filter and belt presses, and the centrifugation test reflects liquid separation and centrate quality relevant to decanter centrifuges. They were therefore treated as complementary evaluation criteria rather than competing methods, which constitutes the basis of the multi-factor assessment adopted in this study.
2.6. Capillary Suction Time (CST)
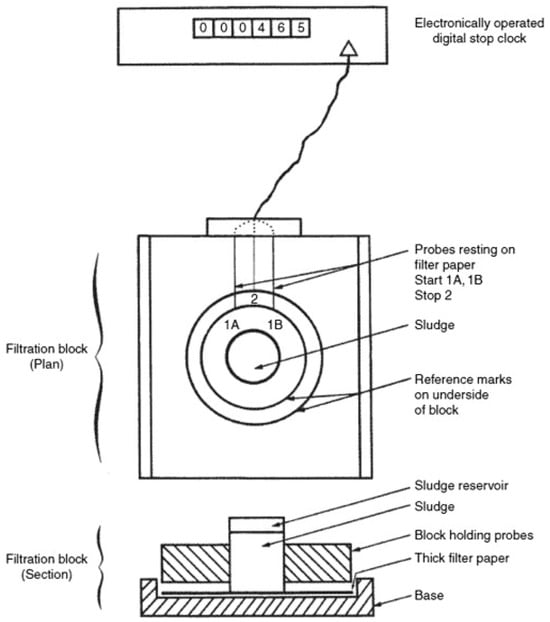
The capillary suction time (CST) was determined using a dedicated measurement device. As a preliminary step, two cylinders of different diameters included in the apparatus were tested to select the one that would provide sufficiently long measurement times for sludge conditioned with the highest polyelectrolyte doses, while maintaining reasonable values for unconditioned sludge [10]. CST measurement was performed in accordance with the APHA 2710 G methodology [11]. A cylinder with a diameter of 1.8 cm was selected for further measurements, placed on Whatman No. 17 filter paper (Whatman Ltd., Maidstone, UK). The cellulosic composition of the filter paper, combined with its specific surface properties, ensures effective phase separation and is widely used in both CST measurements and general laboratory practice in the chemical industry. Water absorbed by the filter paper moves in a piston-like manner, spreading radially across its surface. The arrival of the liquid front at the first electrical contact initiates timing, while the closing of the second contact, located at a greater distance from the cylinder, stops it [12]. In the experimental studies, the raw sludge exhibited CST values ranging from 426 to 683 s, which are high values indicating poor dewaterability of the unconditioned sludge. All average measurements were obtained by 2 or 3 repeats. Example of CST measurement device was presented on Figure 1 below:
Figure 1.
Diagram of a device for measuring CST (own elaboration).
2.7. Specific Resistance to Filtration (SRF)
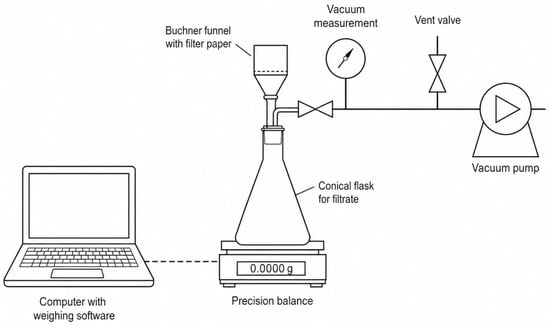
The specific resistance to filtration was determined using a measurement set-up consisting of an electronic balance coupled with software recording the increase in filtrate mass as a function of time, connected to a vacuum system attached to a Büchner funnel. A volume of 50 cm3 of sludge was measured each time and introduced into the funnel fitted with a filter paper pre-wetted with distilled water. During the measurement, a faster or slower increase in filtrate volume was observed depending on the dewaterability of the sludge [13]. The measurement was terminated when either a crack appeared in the filter cake or the sludge released at least 5 g of water. Measurements were conducted at two vacuum levels: 25 and 50 kPa, determined according to EN 14701-2 [14], with modifications: vacuum of 25 and 50 kPa. For raw sludge not subjected to any conditioning, SRF values ranged from 83.16 to 197.68 m/kg. The wide range of values reflects the use of two different pressure levels: SRF values at 25 kPa for the “0” sample ranged from 83.16 to 89.0 m/kg, while at 50 kPa the range was 138.61 to 197.68 m/kg. To ensure better clarity of data shown in this article all SRF values were divided by 1012. Example of SRF measurement device shown below at Figure 2:
Figure 2.
Schematic diagram of the SRF measurement apparatus (own elaboration).
2.8. Supernatant Parameters
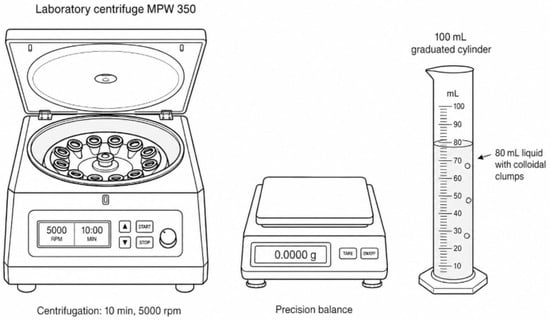
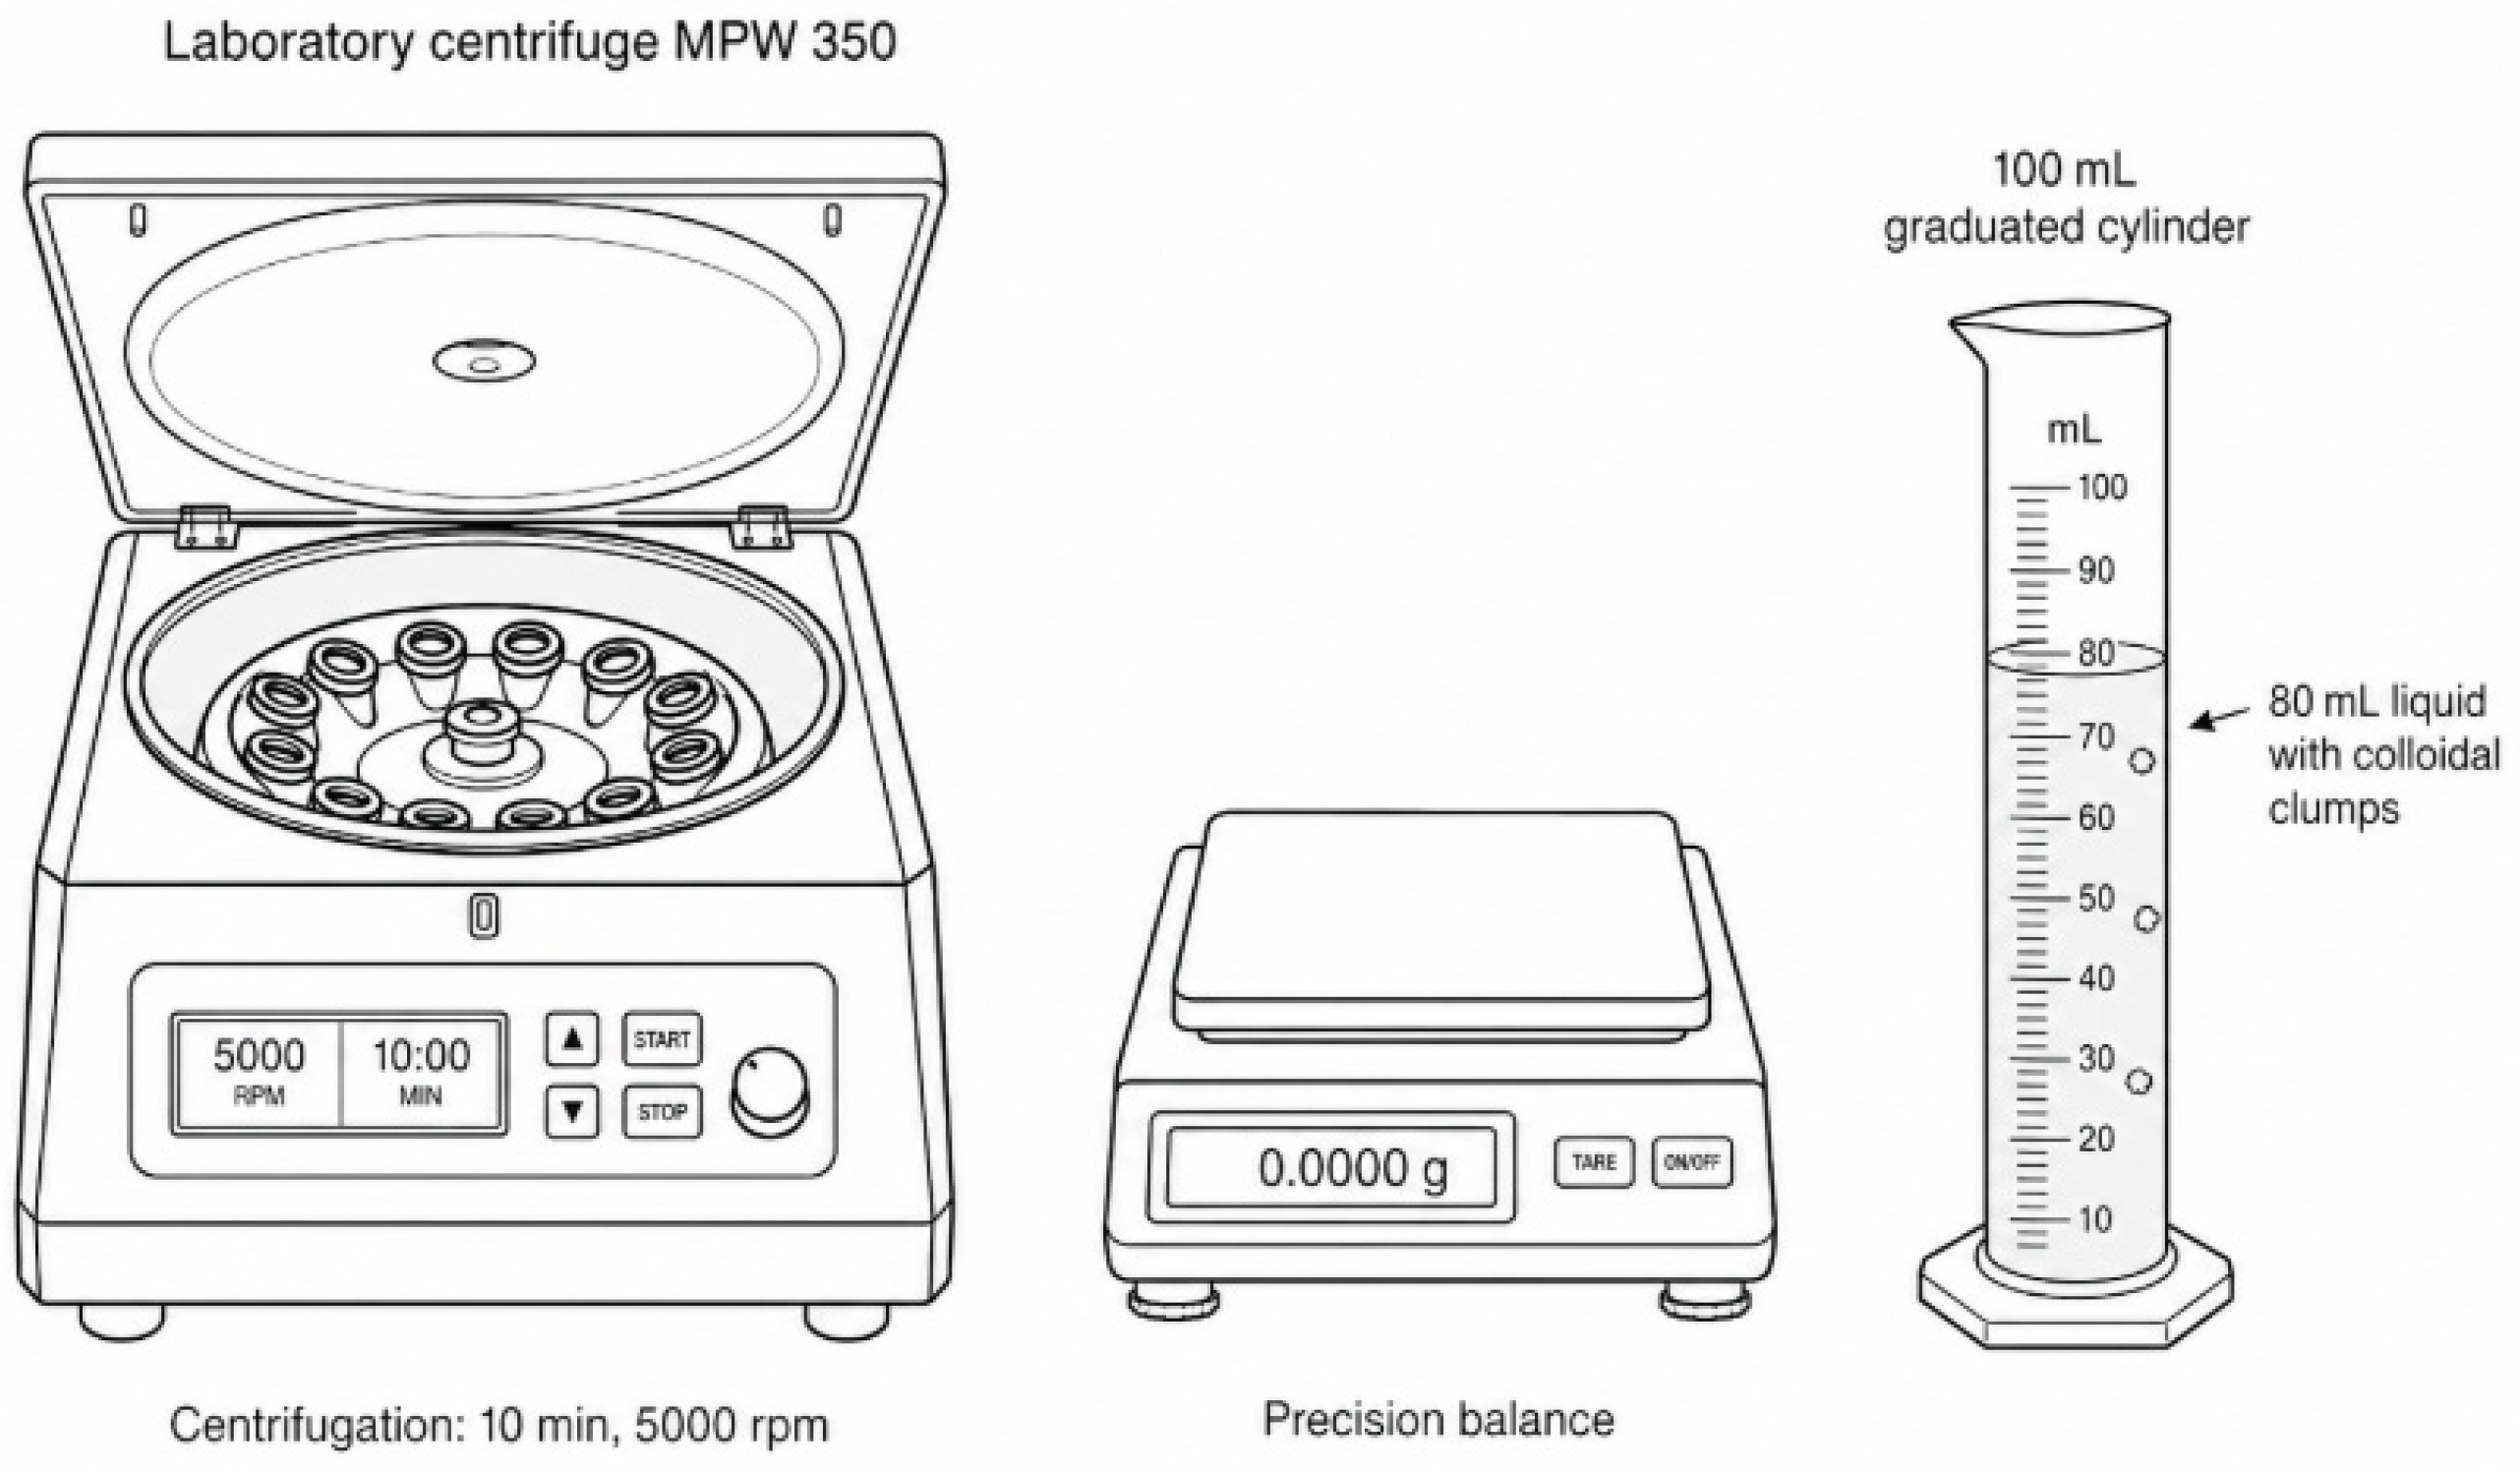
The volume of released liquid and the TSS concentration in the centrate were determined by centrifugation of sludge samples in an MPW 350 laboratory centrifuge at a centrifugal acceleration of approximately 5600× g. The sludge was placed in dedicated containers and centrifuged for 10 min at 5000 rpm, enabling effective separation of the solid and liquid phases. The resulting supernatant was transferred to a measuring cylinder and its volume recorded. Total suspended solids (TSS) were determined in the obtained supernatant as a measure of centrate quality after dewatering [15]. TSS measurement was performed in accordance with the APHA 2540D [16] methodology. For raw sludge not subjected to any conditioning processes, the volume of released liquid ranged from 112.0 mL to 120 mL. Devices used to determine supertant parameters are presented below on Figure 3:
Figure 3.
Schematic diagram of the MPW 350 laboratory centrifuge with sample vials (own elaboration).
3. Data Normalization Methodology
Comparison of parameters expressed in different units requires prior data normalization, the purpose of which is to convert all results into a dimensionless form that enables their direct comparison and interpretation. In search of the method best suited to the specific nature of data from the sewage sludge dewatering process, eight normalization methods were examined. Their formulas are summarised in Table 2, and their main properties and limitations in Table 3. For parameters where a lower value indicates better dewatering performance (CST, SRF and TSS in the centrate), the inverted formulas were applied, so that a higher normalised value consistently corresponds to a more favourable technological outcome.
Table 2.
Formulas of the normalization methods examined in the study.
Table 3.
Characteristics of the normalization methods examined in the study.
3.1. TOPSIS Method
TOPSIS is a multi-criteria decision-making algorithm based on vector normalization, in which each variable value is divided by the Euclidean norm of its corresponding column, thereby preserving the direction of vectors and proportions between observations [19]. The evaluation of alternatives is based on simultaneous reference to the Positive Ideal Solution (PIS) and the Negative Ideal Solution (NIS). The PIS represents the best possible values of all criteria, while the NIS represents the most unfavourable values. The optimal alternative is the one characterised by the greatest distance from the NIS and the smallest distance from the PIS. The algorithm allows for the assignment of weights to individual criteria; however, in this study, equal weights were assigned to all analysed dewatering parameters, reflecting their assumed equivalence and eliminating subjective analyst preferences. This approach is consistent with the classical formulation of the method, applied as an averaged decision-making factor [18].
3.2. Radar Chart Construction Methodology
Radar chart construction is preceded by data normalization, the purpose of which is to convert all analysed dewatering parameters into a dimensionless form. The resulting normalised values serve as direct input data for the chart, where each vertex of the resulting polygon corresponds to one normalised parameter value. The area of the polygon is calculated using the following formula:
where:
- —denotes the radius corresponding to a given criterion
- —denotes the number of analysed parameters
- The result of the area calculation is expressed in square units .
The area of the polygon formed on a radar chart is sensitive to the order in which parameters are arranged along the axes; a change in axis arrangement leads to a change in the area value while the input data remain unchanged [25]. To eliminate this effect and ensure the objectivity of result presentation, the normalization methods selected are those characterised by a practical application and degree of robustness to changes in axis order. This criterion is critical for reliable comparison of conditioning effectiveness, as the chart area constitutes a direct measure of the performance of the analysed polyelectrolyte or polyelectrolyte–coagulant system.
3.3. Techno-Economic Analysis Methodology
The economic analysis was conducted for all sludge conditioning systems selected on the basis of the technological test results for polyelectrolytes and polyelectrolyte-PIX C28 systems; all relevant data are provided in Table 1. Conditioning costs were calculated for polyelectrolyte doses of 4, 8, and 16 kg/t DS with a fixed PIX C28 coagulant dose of 10 L/m3 of sludge. The prices of the active substances of the polyelectrolytes were adopted in accordance with the rates presented in Table 1. The price of PIX C28 was taken as €0.93/kg of solution. The total conditioning cost was expressed in €/t DS and €/m3 of sludge from the AD, at an average DS concentration of 33.72 kg/m3. For the integrated evaluation of individual conditioning systems, a techno-economic efficiency index was defined as the ratio of the increment in the technological indicator—the TOPSIS score and the radar chart area, respectively—to the conditioning cost expressed in €/t DS. Using the increment relative to the unconditioned state (dose = 0 kg/t DS) as the numerator of both indices made it possible to exclude the baseline properties of the unconditioned sludge and to evaluate only the technological effect resulting from the application of a given reagent.
For the variant without reagent dosing (dose = 0 kg/t DS), the efficiency index is undefined, as the conditioning cost equals zero and the ratio cannot be calculated. The values of the individual techno-economic efficiency indices were calculated using the following formulas:
where:
- —techno-economic efficiency index for TOPSIS/radar
- —value of the TOPSIS index for dose “i”
- —value of the TOPSIS index for dose “0”
- —conditioning cost [€/t DS]
- —area of the radar chart for dose “i”
- —area of the radar chart for dose “0”
4. Results
The results presented in this section cover all aspects of the sewage sludge dewatering analysis, including data normalization and comparison of normalization outcomes.
4.1. Data Normalization Results
Polyelectrolyte tests and polyelectrolyte–PIX C28 system tests were carried out as part of the experimental programme. A sample of the collected results from individual tests is presented in the Table 4 below:
Table 4.
Summary of raw laboratory experimental results—excerpt.
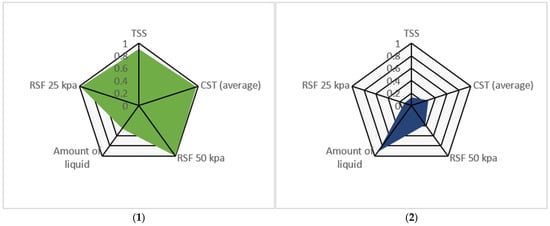
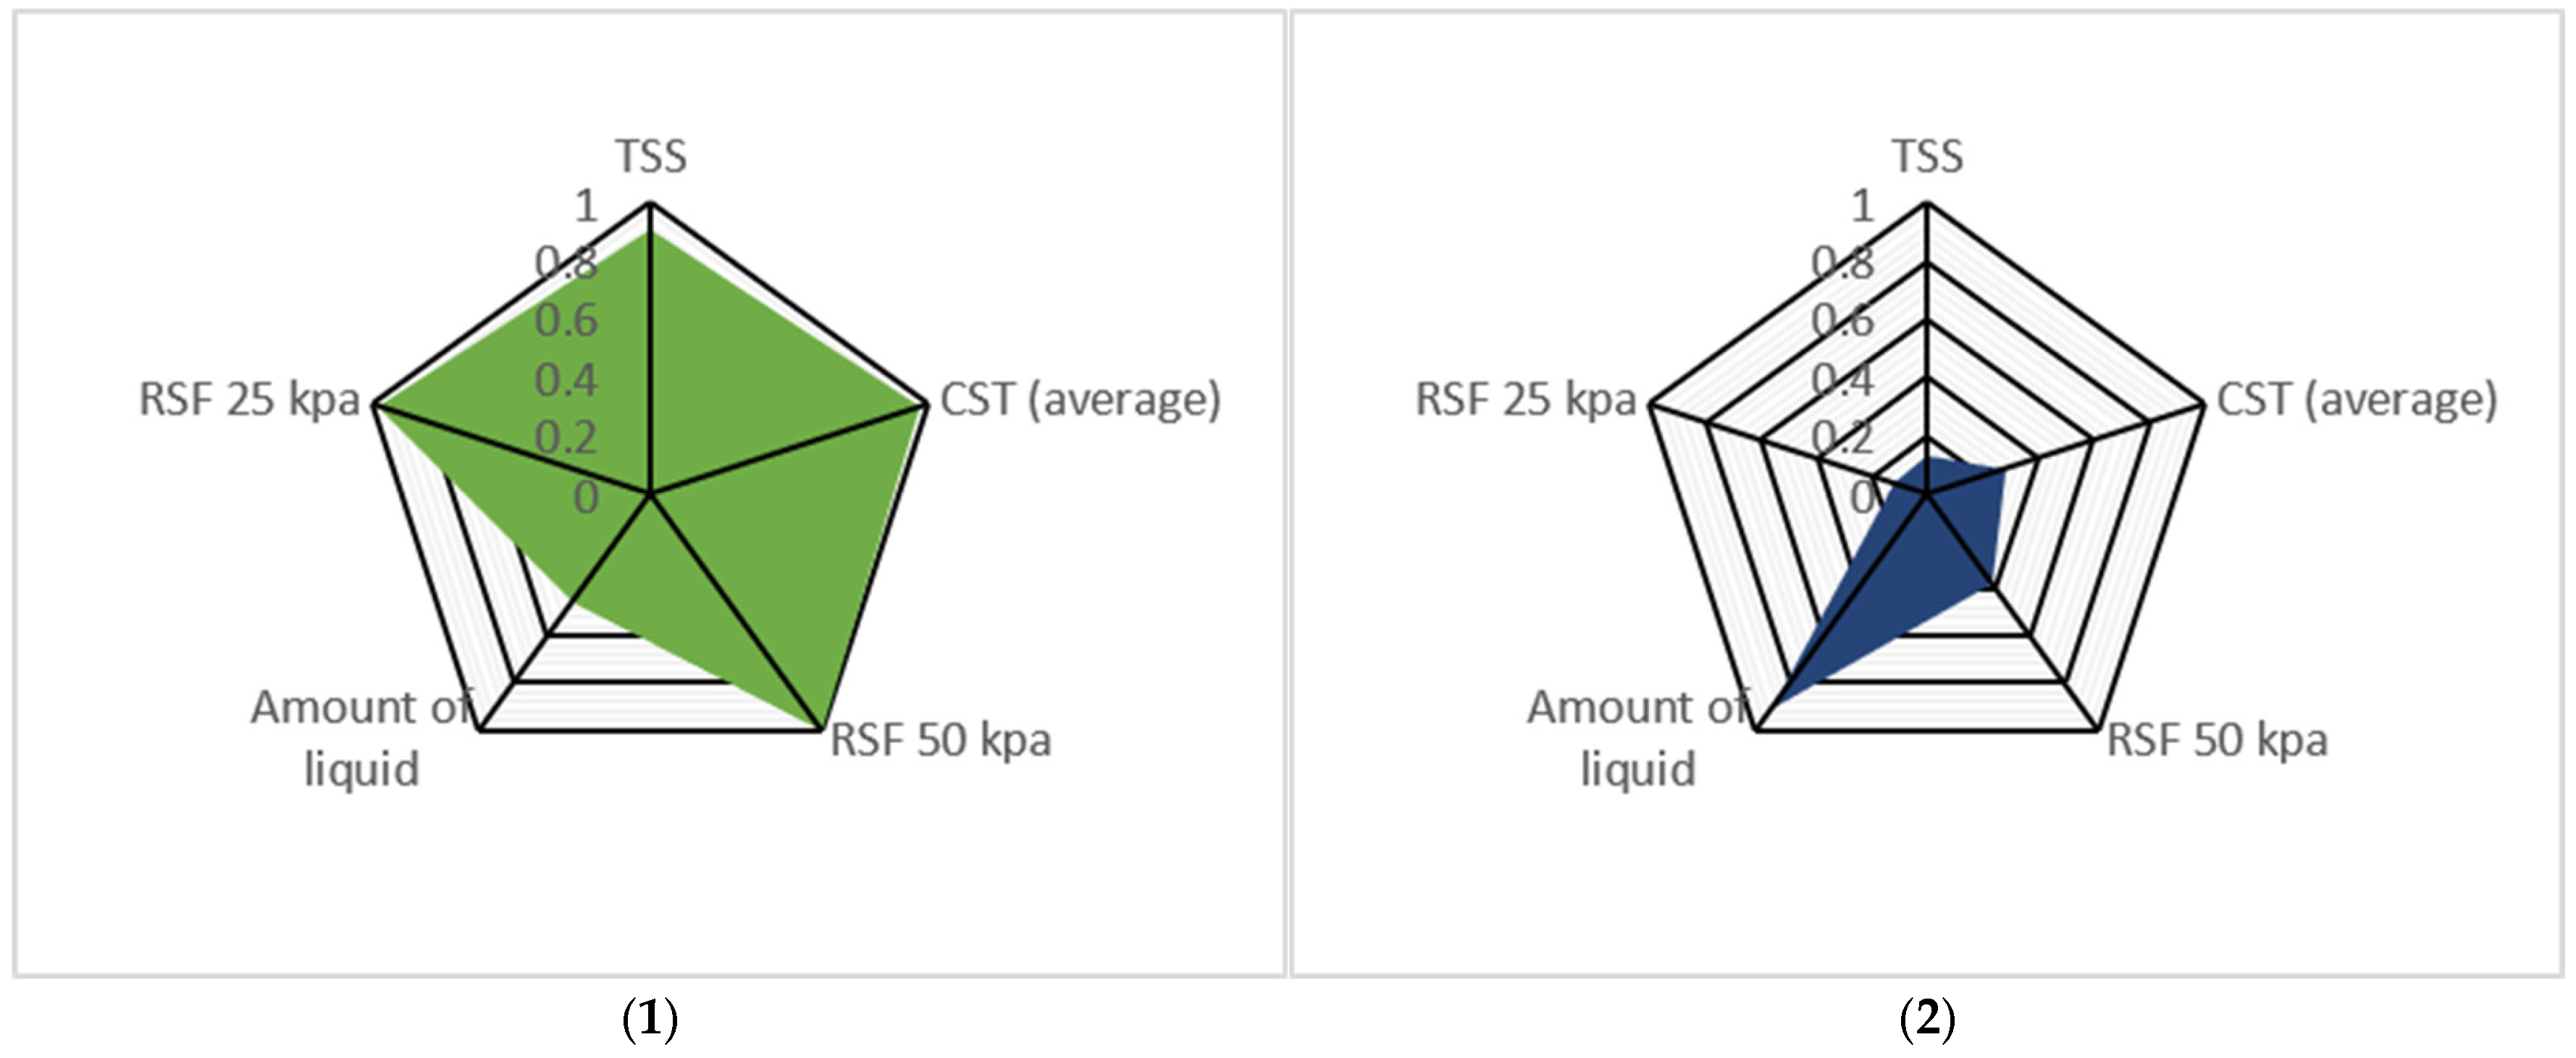
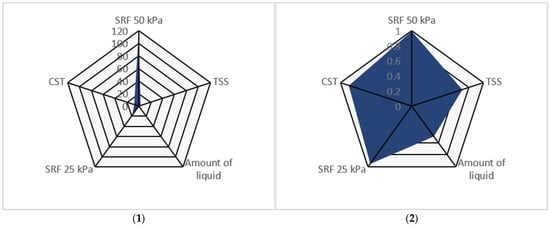
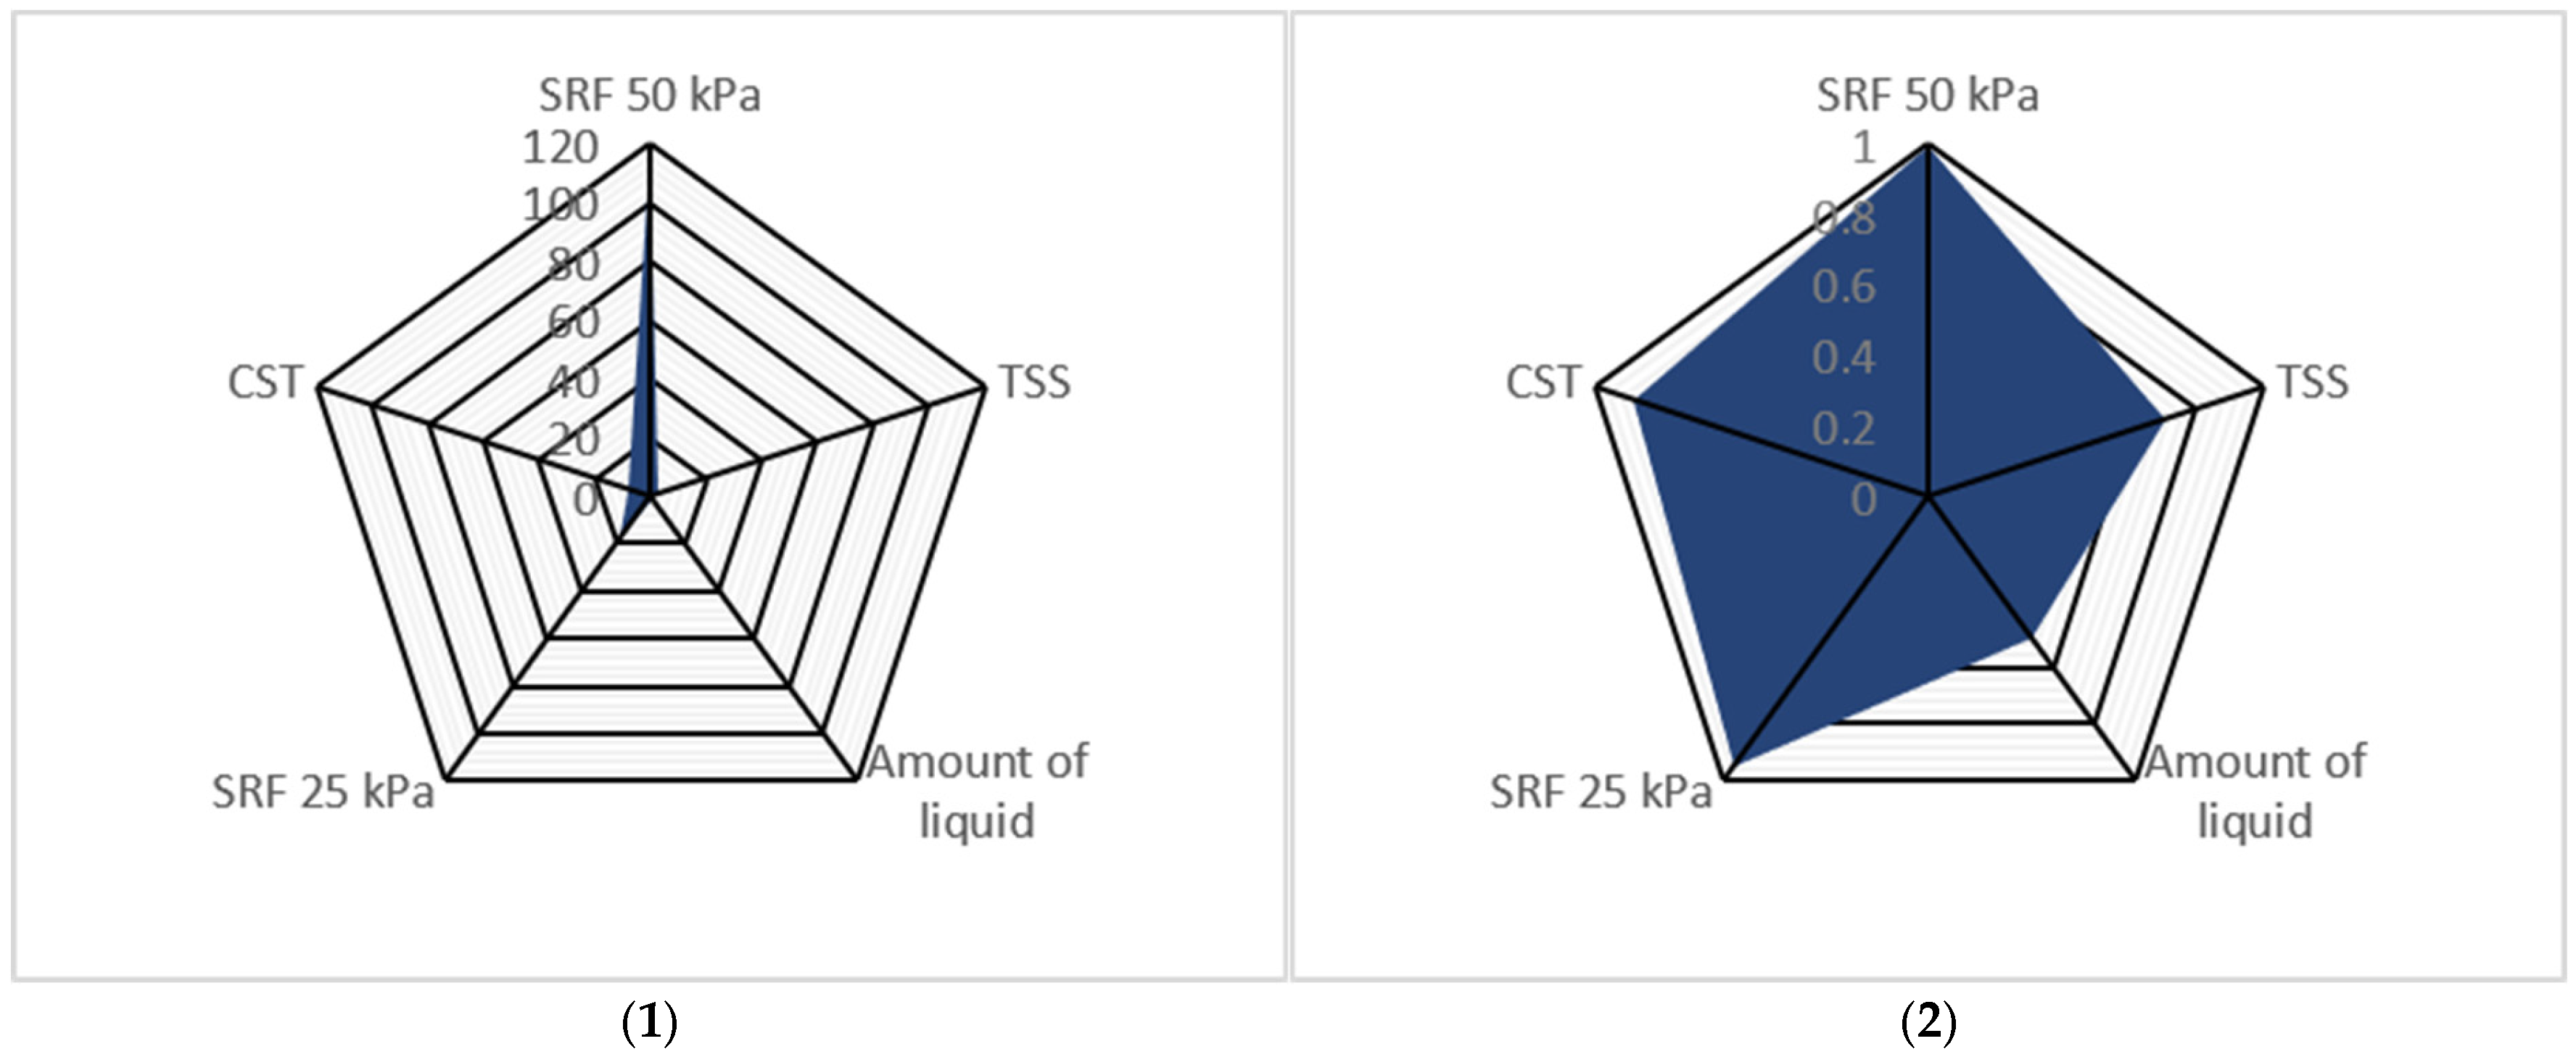
For each of the discussed normalization methods, data transformation was applied covering all analysed dewatering parameters. In order to identify the method characterised by the lowest sensitivity of the radar chart area to axis arrangement order, a systematic review of all geometrically distinct permutations of parameter arrangements was conducted. Taking into account the rotational and reflective symmetry of radar charts, 12 geometrically distinct configurations were identified from the 120 mathematically possible permutations of five axes, and the corresponding polygon area. An example comparison of the area values, together with the corresponding radar chart for a selected axis arrangement, is presented in Table 5 and Figure 4 below:
Table 5.
Example excerpt of Min-Max normalized data for a given axis arrangement on the radar chart (axis order in the chart corresponds to the column order in the table).
Figure 4.
Example radar chart for Zetag 9246FS (emulsion) + PIX C28, dose 8 kg/t DS after Min-Max normalization (1) and maximum-based normalization (2) (axis order consistent with data arrangement in Table 5).
The obtained area values for all twelve geometrically distinct axis configurations were compiled collectively and compared within each normalization method applied. The assessment of area variability was conducted using the following statistical measures: arithmetic mean, minimum and maximum values, standard deviation, coefficient of variation (CV), and dispersion, understood as the difference between the maximum and minimum area values across all analysed axis permutations. Tabular summaries for individual normalization methods are presented in Supplementary Materials.
In order to select the normalization method best suited to the characteristics of the collected dataset, a comparative analysis of radar chart area stability was conducted for the eight methods under consideration. The primary evaluation criteria were the CV and the area dispersion, determined separately for each polyelectrolyte–dose variant. The dataset comprises 32 variants: eight conditioning systems, with and without PIX C28, each tested at doses of 0, 4, 8 and 16 kg/t DS. Normalization was performed on the full dataset, as the reference samples (dose 0) define the unfavourable end of the scale for each parameter; however, they were excluded from the summary statistics, which therefore refer to the 24 conditioned variants. Analysis of the zero dose is performed on each day of testing to allow comparison against the current dewatering properties of the sludge, which may change over time; the subject of the evaluation is the effect of the applied reagents rather than the dewaterability of the unconditioned sludge, consistent with the TOPSIS and economic analyses. Moreover, systems tested on the same day share a common reference sample, so the eight dose 0 variants represent only five independent samples. Hereafter, the mean CV and the median CV denote the arithmetic mean and the median of the CV values of the 24 conditioned variants, unless a subgroup is explicitly indicated; the mean is sensitive to a few unstable variants, whereas the median reflects the typical behaviour of a method.
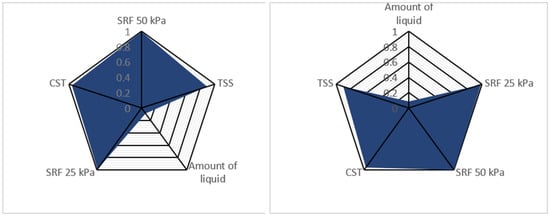
Mean-based normalization and logistic scaling around the mean were rejected without detailed comparative analysis, as this follows directly from their constructional properties. Examples of this normalizations are shown on Figure 5. Mean-based normalization generates area values that increase exponentially with dose; for the eight variants at 16 kg/t DS, the mean area dispersion amounted to 3109.75 u2, with a maximum of 16,544.14 u2 for the Zetag 8190 + PIX C28 system, making a clear comparison of variants impossible. Logistic scaling showed an apparently lowest variability (mean CV = 0.0186, median CV = 0.0148); however, this results largely from the construction of the transformation: parameters with low relative variability are mapped close to 0.5 regardless of their technological significance (the normalized volume of released liquid ranged only from 0.48 to 0.52), while the non-linear transformation distorts the proportions between the remaining parameters and reduces the ability of the radar chart to differentiate between variants (the ratio of the largest to the smallest mean chart area was 7.7, compared with 25.1 for Min-Max normalization).
Figure 5.
Examples of mean-based (1) and logistic (2) normalization for Zetag 9246FS (emulsion) dose 8 kg/t DS + PIX.
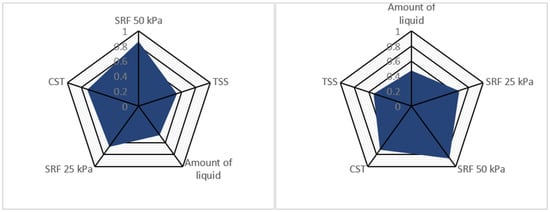
The zero-shift transformation achieved a mean CV of 0.0716 and a median CV of 0.0138, comparable to Min-Max normalization; it was, however, rejected on constructional grounds. Examples of different axis positioning for zero-shift normalization are presented on Figure 6. In the absence of a common upper scale limit, the axes are not expressed on a comparable scale: in the analysed dataset, the normalized volume of released liquid did not exceed 0.20, while the remaining parameters reached values close to 1, so that this parameter was practically underrepresented in the chart area.
Figure 6.
Examples of different axis positioning for zero-shift normalization for Zetag 9246FS (emulsion) dose 8 kg/t DS + PIX.
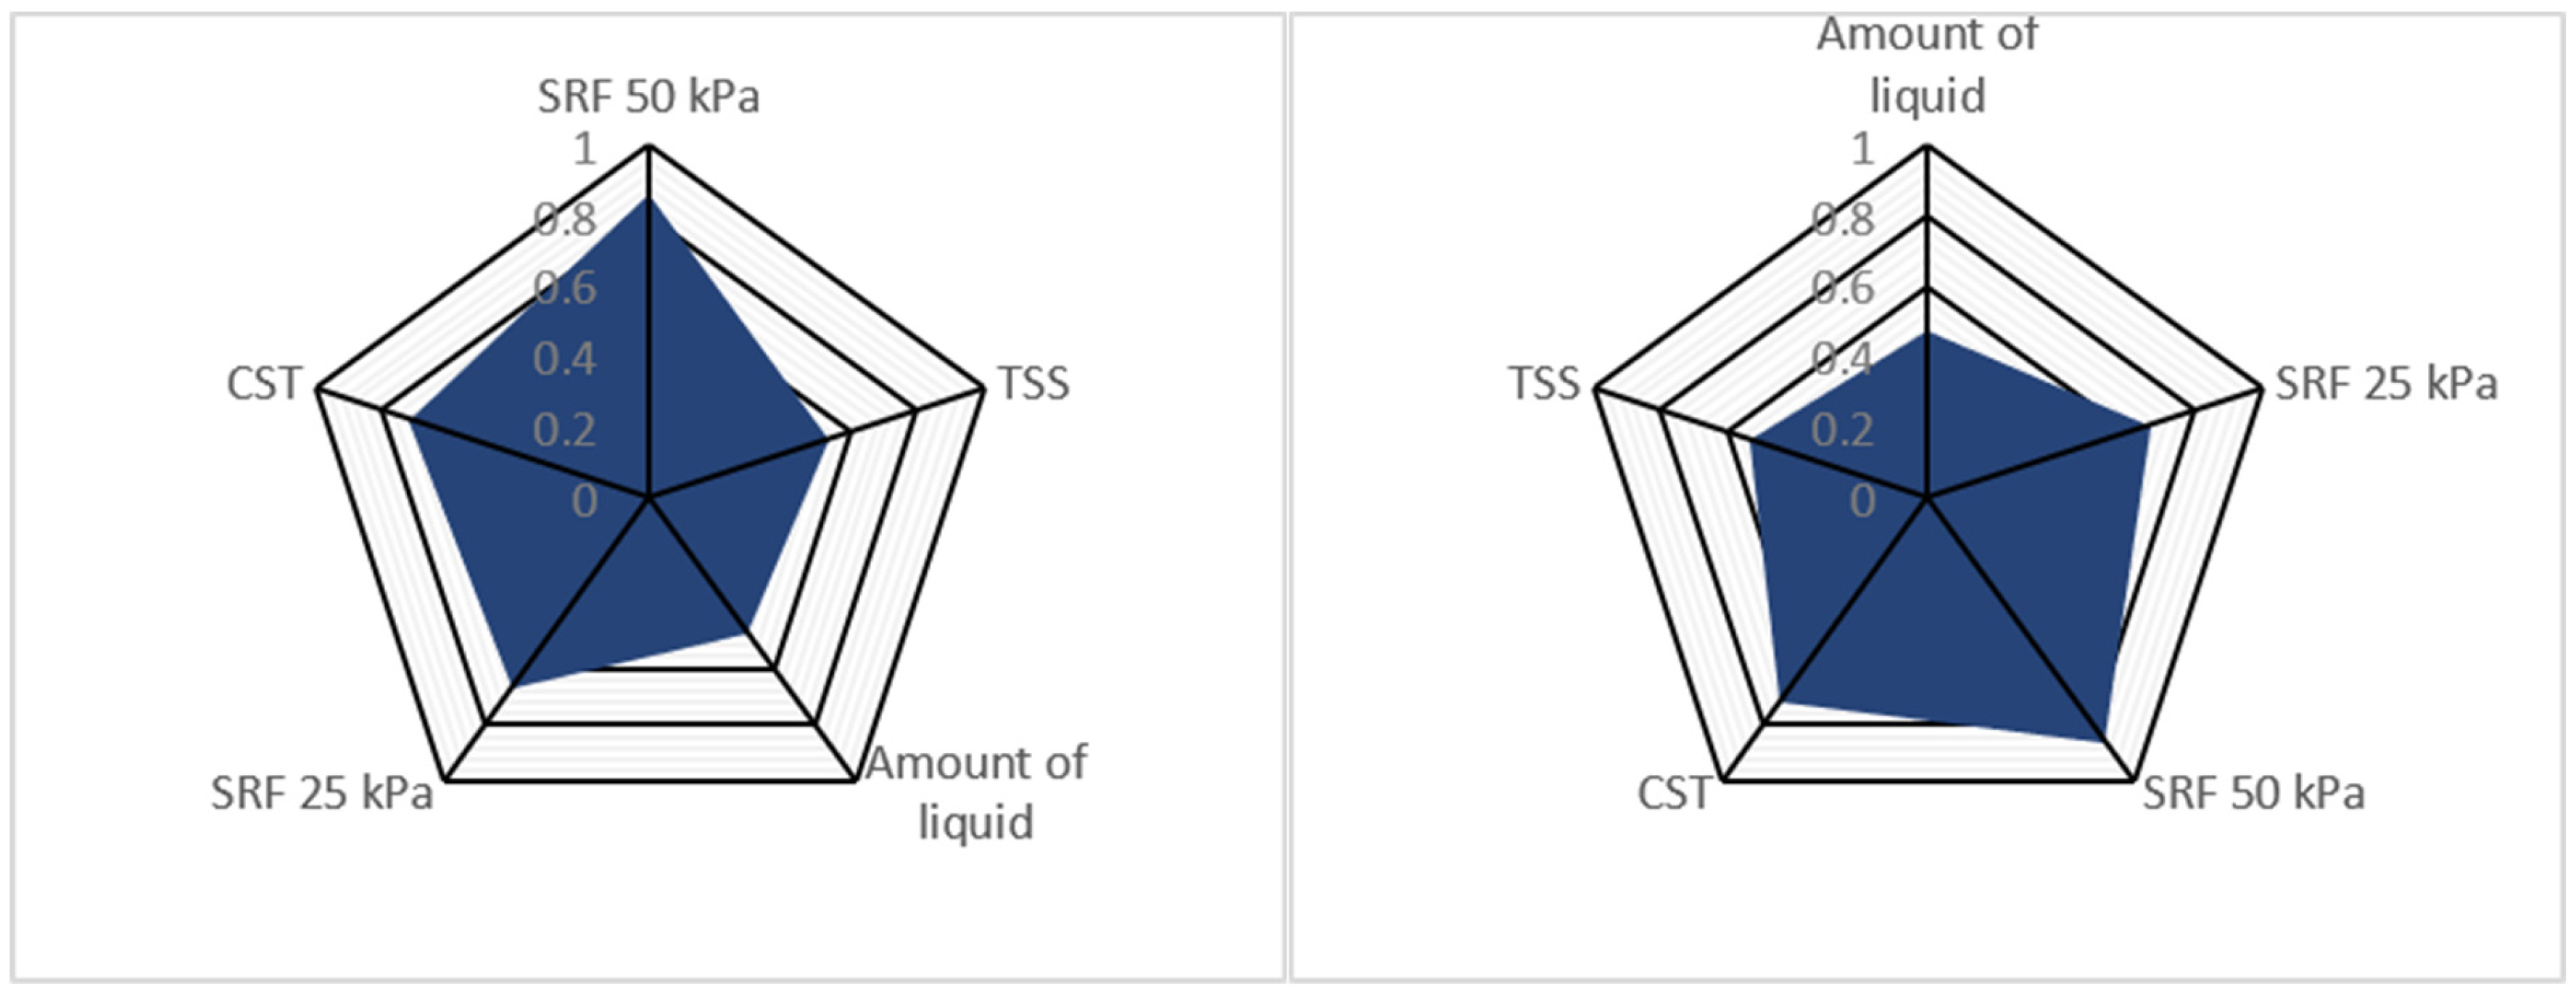
Logarithmic transformation showed lower stability (mean CV = 0.1091, median CV = 0.0174), with a maximum CV of 0.9429 for Super Floc C446 at 4 kg/t DS. Examples of different axis positioning for logarythmic normalization are shown on Figure 7. The non-linear nature of the transformation systematically distorts proportions: effective variants become difficult to distinguish while poor variants are excessively amplified. Maximum-based normalization performed least favourably in statistical terms (mean CV = 0.3382, median CV = 0.3229). Nevertheless, it expresses each value as a fraction of the dataset leader, which makes it particularly useful from an operational perspective: it shows directly how close a tested variant is to the best variant in the tested pool and, when paired with economic analysis, whether the technological advantage of the leader justifies higher conditioning costs.
Figure 7.
Examples of different axis positioning for logarythmic normalization for Zetag 9246FS (emulsion) dose 8 kg/t DS + PIX.
The fixed reference point method achieved very good results for systems with PIX C28 (mean CV = 0.0085, median CV = 0.0057), while for polyelectrolytes alone the stability dropped radically (mean CV = 0.2668, maximum CV = 1.0000). Despite partially satisfactory statistical results, the method was excluded for methodological reasons, as the need to select external reference points introduces an element of subjectivity that allows for manipulation of the ranking without any intervention in the measurement data.
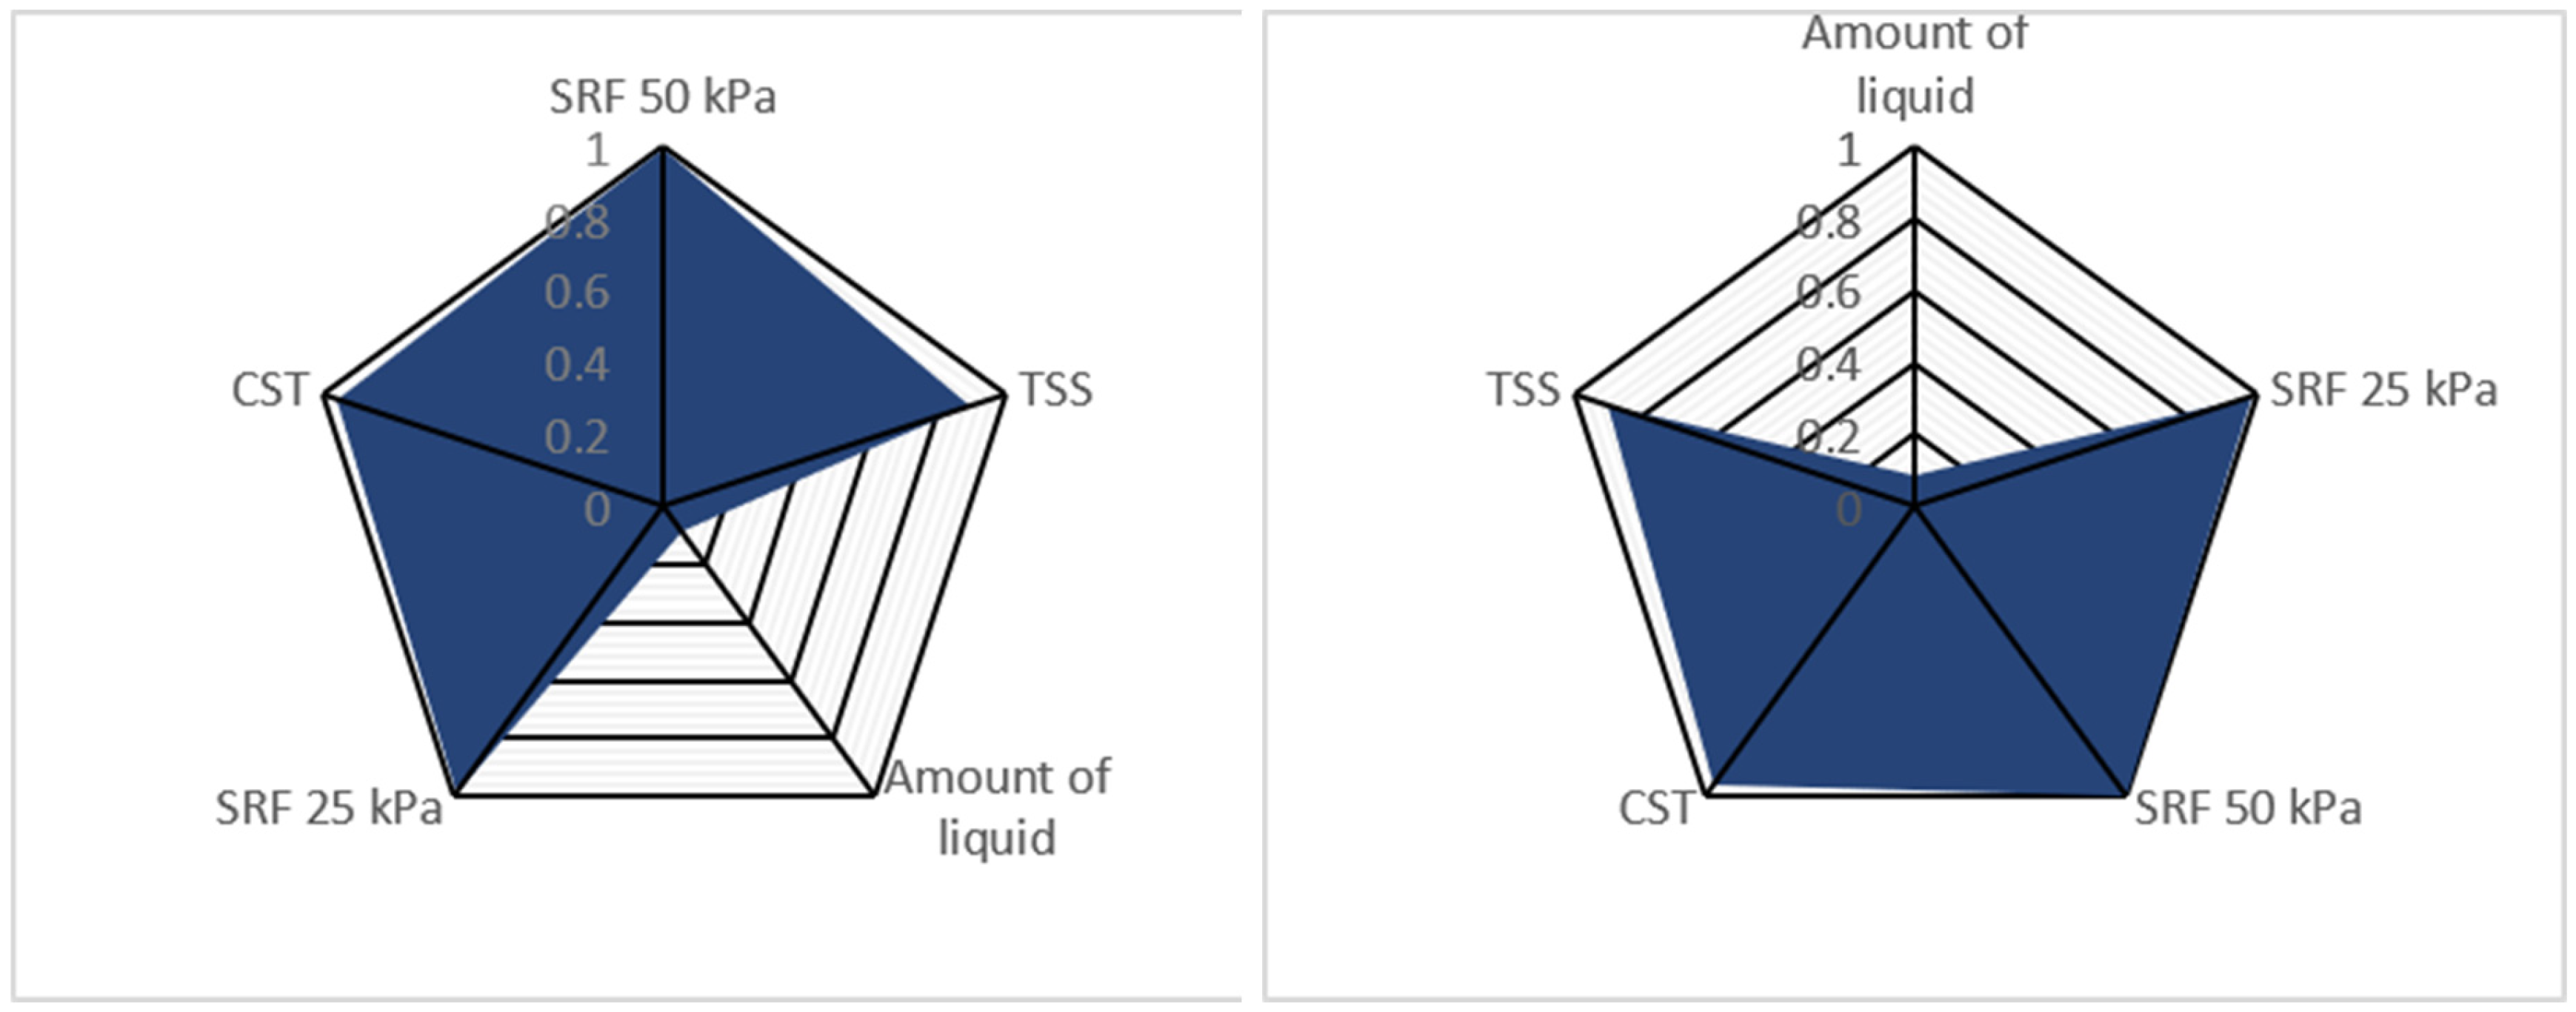
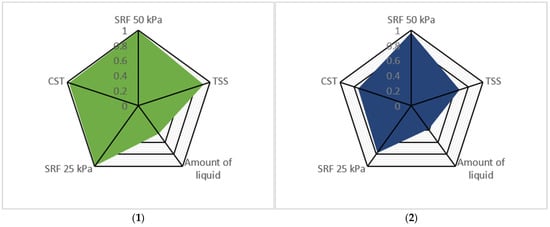
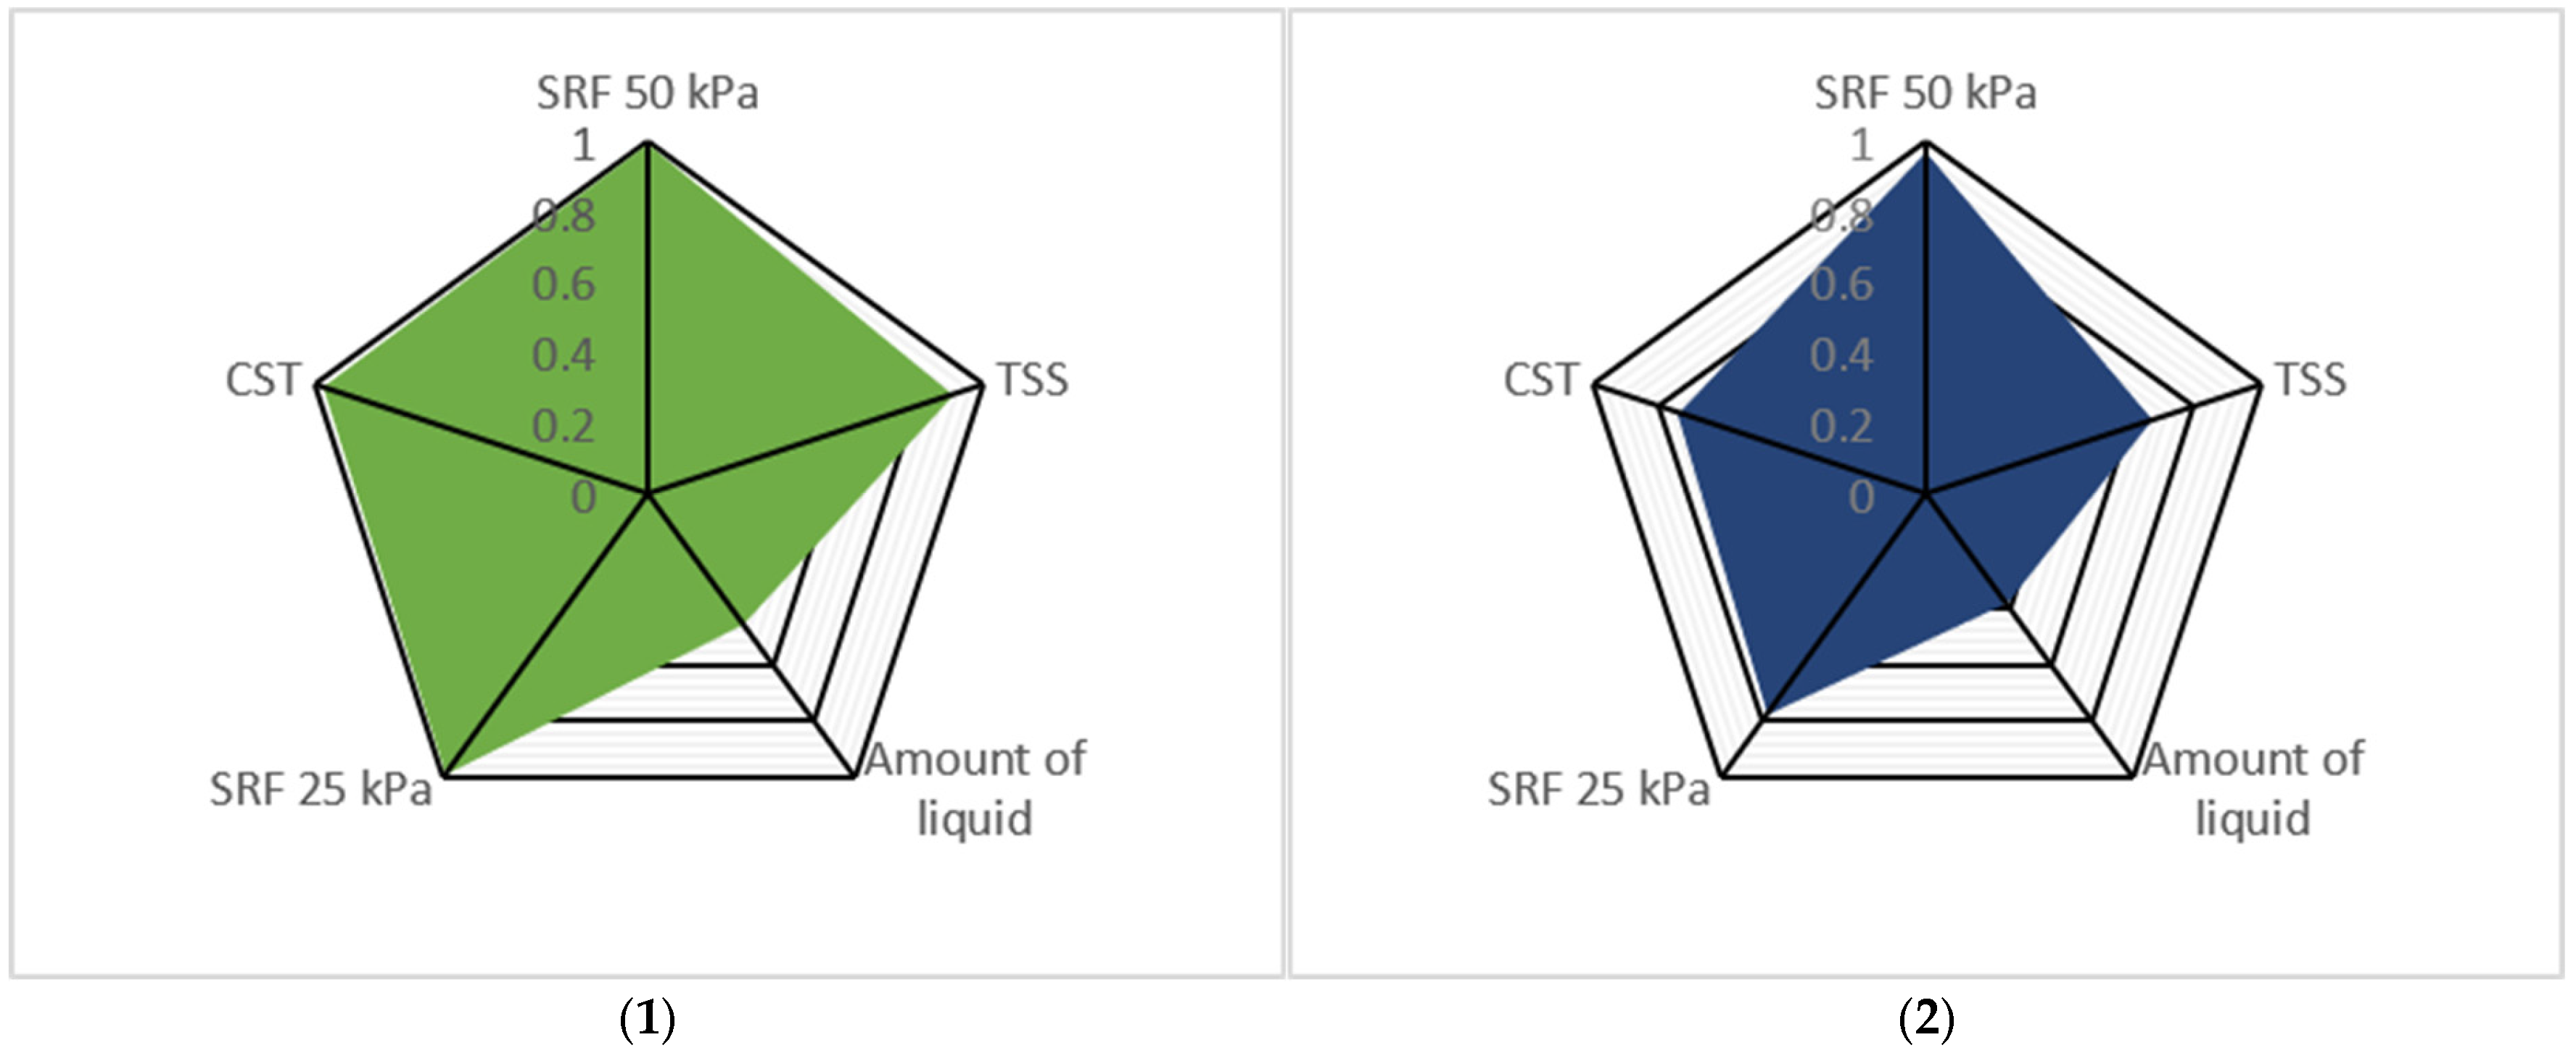
Min-Max normalization and percentile normalization demonstrated the most favourable balance between stability and discriminatory power. Min-Max achieved a mean CV of 0.0665 and the lowest median CV of all methods (0.0042); the highest values concern polyelectrolytes without PIX at 4 kg/t DS (Super Floc C446: 0.8285; Zetag 8190: 0.5263) and reflect a characteristic of the data rather than a methodological artefact (systems with PIX: mean CV = 0.0050). Examples of Min-Max [1] and percentile [2] normalization are shown on Figure 8. A notable limitation remains the sensitivity to outliers. Percentile normalization (mean CV = 0.0860, median CV = 0.0118) is robust to extreme values owing to its rank-based construction, as reflected in a lower maximum CV (0.7295) and standard deviation of CV (0.1819) than for Min-Max (0.8285 and 0.1945). The drawback is the irreversible loss of information about the absolute distances between values.
Figure 8.
Examples of Min-Max (1) and percentile (2) normalization for Zetag 9246FS (emulsion) dose 8 kg/t DS + PIX.
A trend common to all methods except mean-based normalization was observed: the mean CV of the variants tested at a given dose was highest at 4 kg/t DS and decreased markedly at 8 and 16 kg/t DS (Min-Max: 0.1880, 0.0104 and 0.0010). This reflects the conditioning process rather than an artefact of normalization: at 4 kg/t DS the parameters responded unevenly, producing irregular polygons whose area is most sensitive to axis order, whereas at higher doses the polygons became nearly regular.
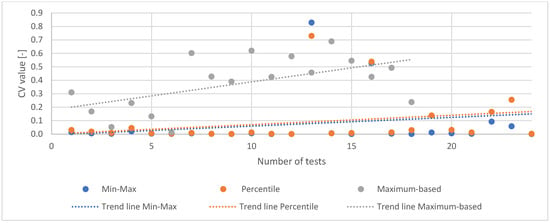
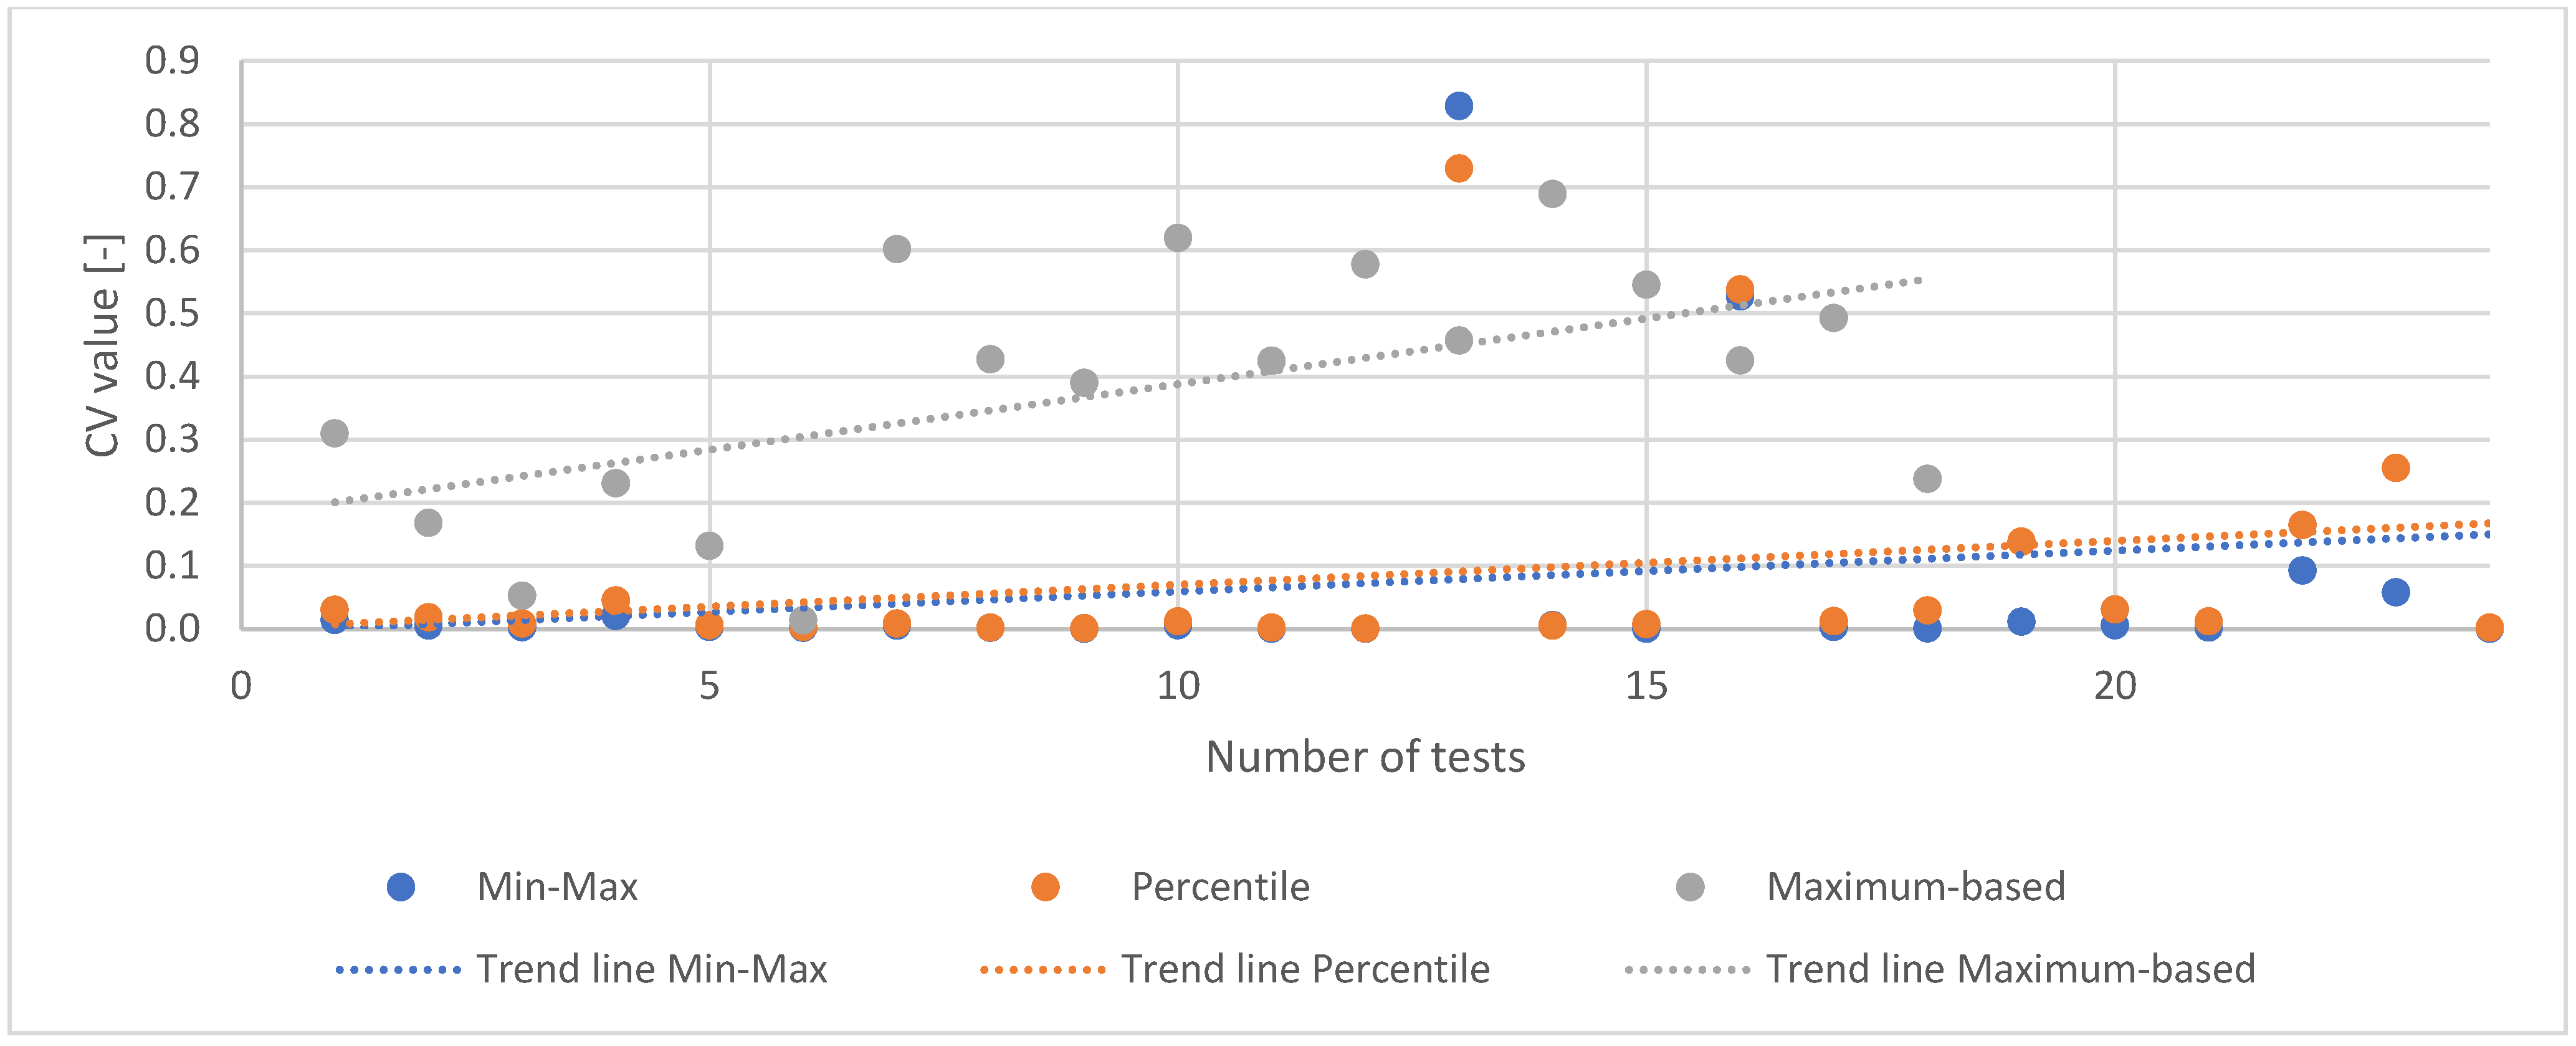
Three complementary normalization methods were selected as most suitable for radar chart presentation: Min-Max normalization, providing an intuitive reference to the worst-to-best performance continuum, particularly reliable for systems with PIX C28; percentile normalization, robust to extreme values; and maximum-based normalization, deliberately retained despite its lowest stability, as it best reflects the operational perspective by showing the distance of each variant from the leader of the tested pool. An example scatter of CV values for the selected normalization methods is presented below on Figure 9. Greater concentration of points along a single horizontal line indicates lower data divergence. The Y-axis shows CV values and the X-axis shows the sequentially numbered conditioned variants (dose 0 excluded):
Figure 9.
Example plot illustrating differences in CV values for Min-Max, Percentile and Maximum-based normalizations and logistic scaling around the mean.
4.2. TOPSIS Analysis Results
The TOPSIS analysis was conducted for eight conditioning systems: four polyelectrolytes used alone and the same four polyelectrolytes in combination with PIX C28 coagulant. Each system was tested at doses of 4, 8 and 16 kg/t DS and, additionally, at a zero-dose serving as the reference sample for the sludge collected on a given test day, yielding a total of 32 variants, of which 24 represent conditioned combinations. Systems tested on the same day share a common reference sample, hence the identical dose-0 values for selected pairs of systems in Table 6. The reference samples define the baseline dewatering properties of the sludge and were therefore excluded from the summary statistics of conditioning effectiveness, as the subject of the evaluation is the effect of the applied reagents rather than the dewaterability of the unconditioned sludge. Five dewatering parameters were adopted as evaluation criteria, all assigned equal weights in accordance with the methodological assumption. The results, expressed as the relative closeness of each variant to the Positive Ideal Solution, are presented in tabular form, enabling direct comparison of conditioning effectiveness both within individual polyelectrolytes at different doses and between variants without and with the coagulant additive. The table with TOPSIS analysis results is presented below:
Table 6.
Summary of TOPSIS analysis results.
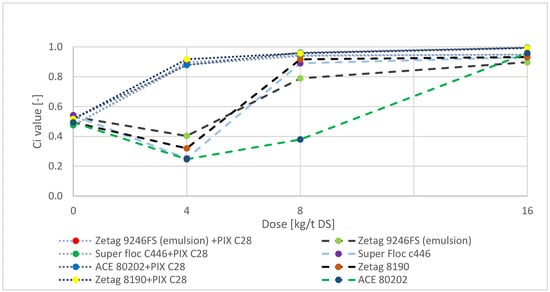
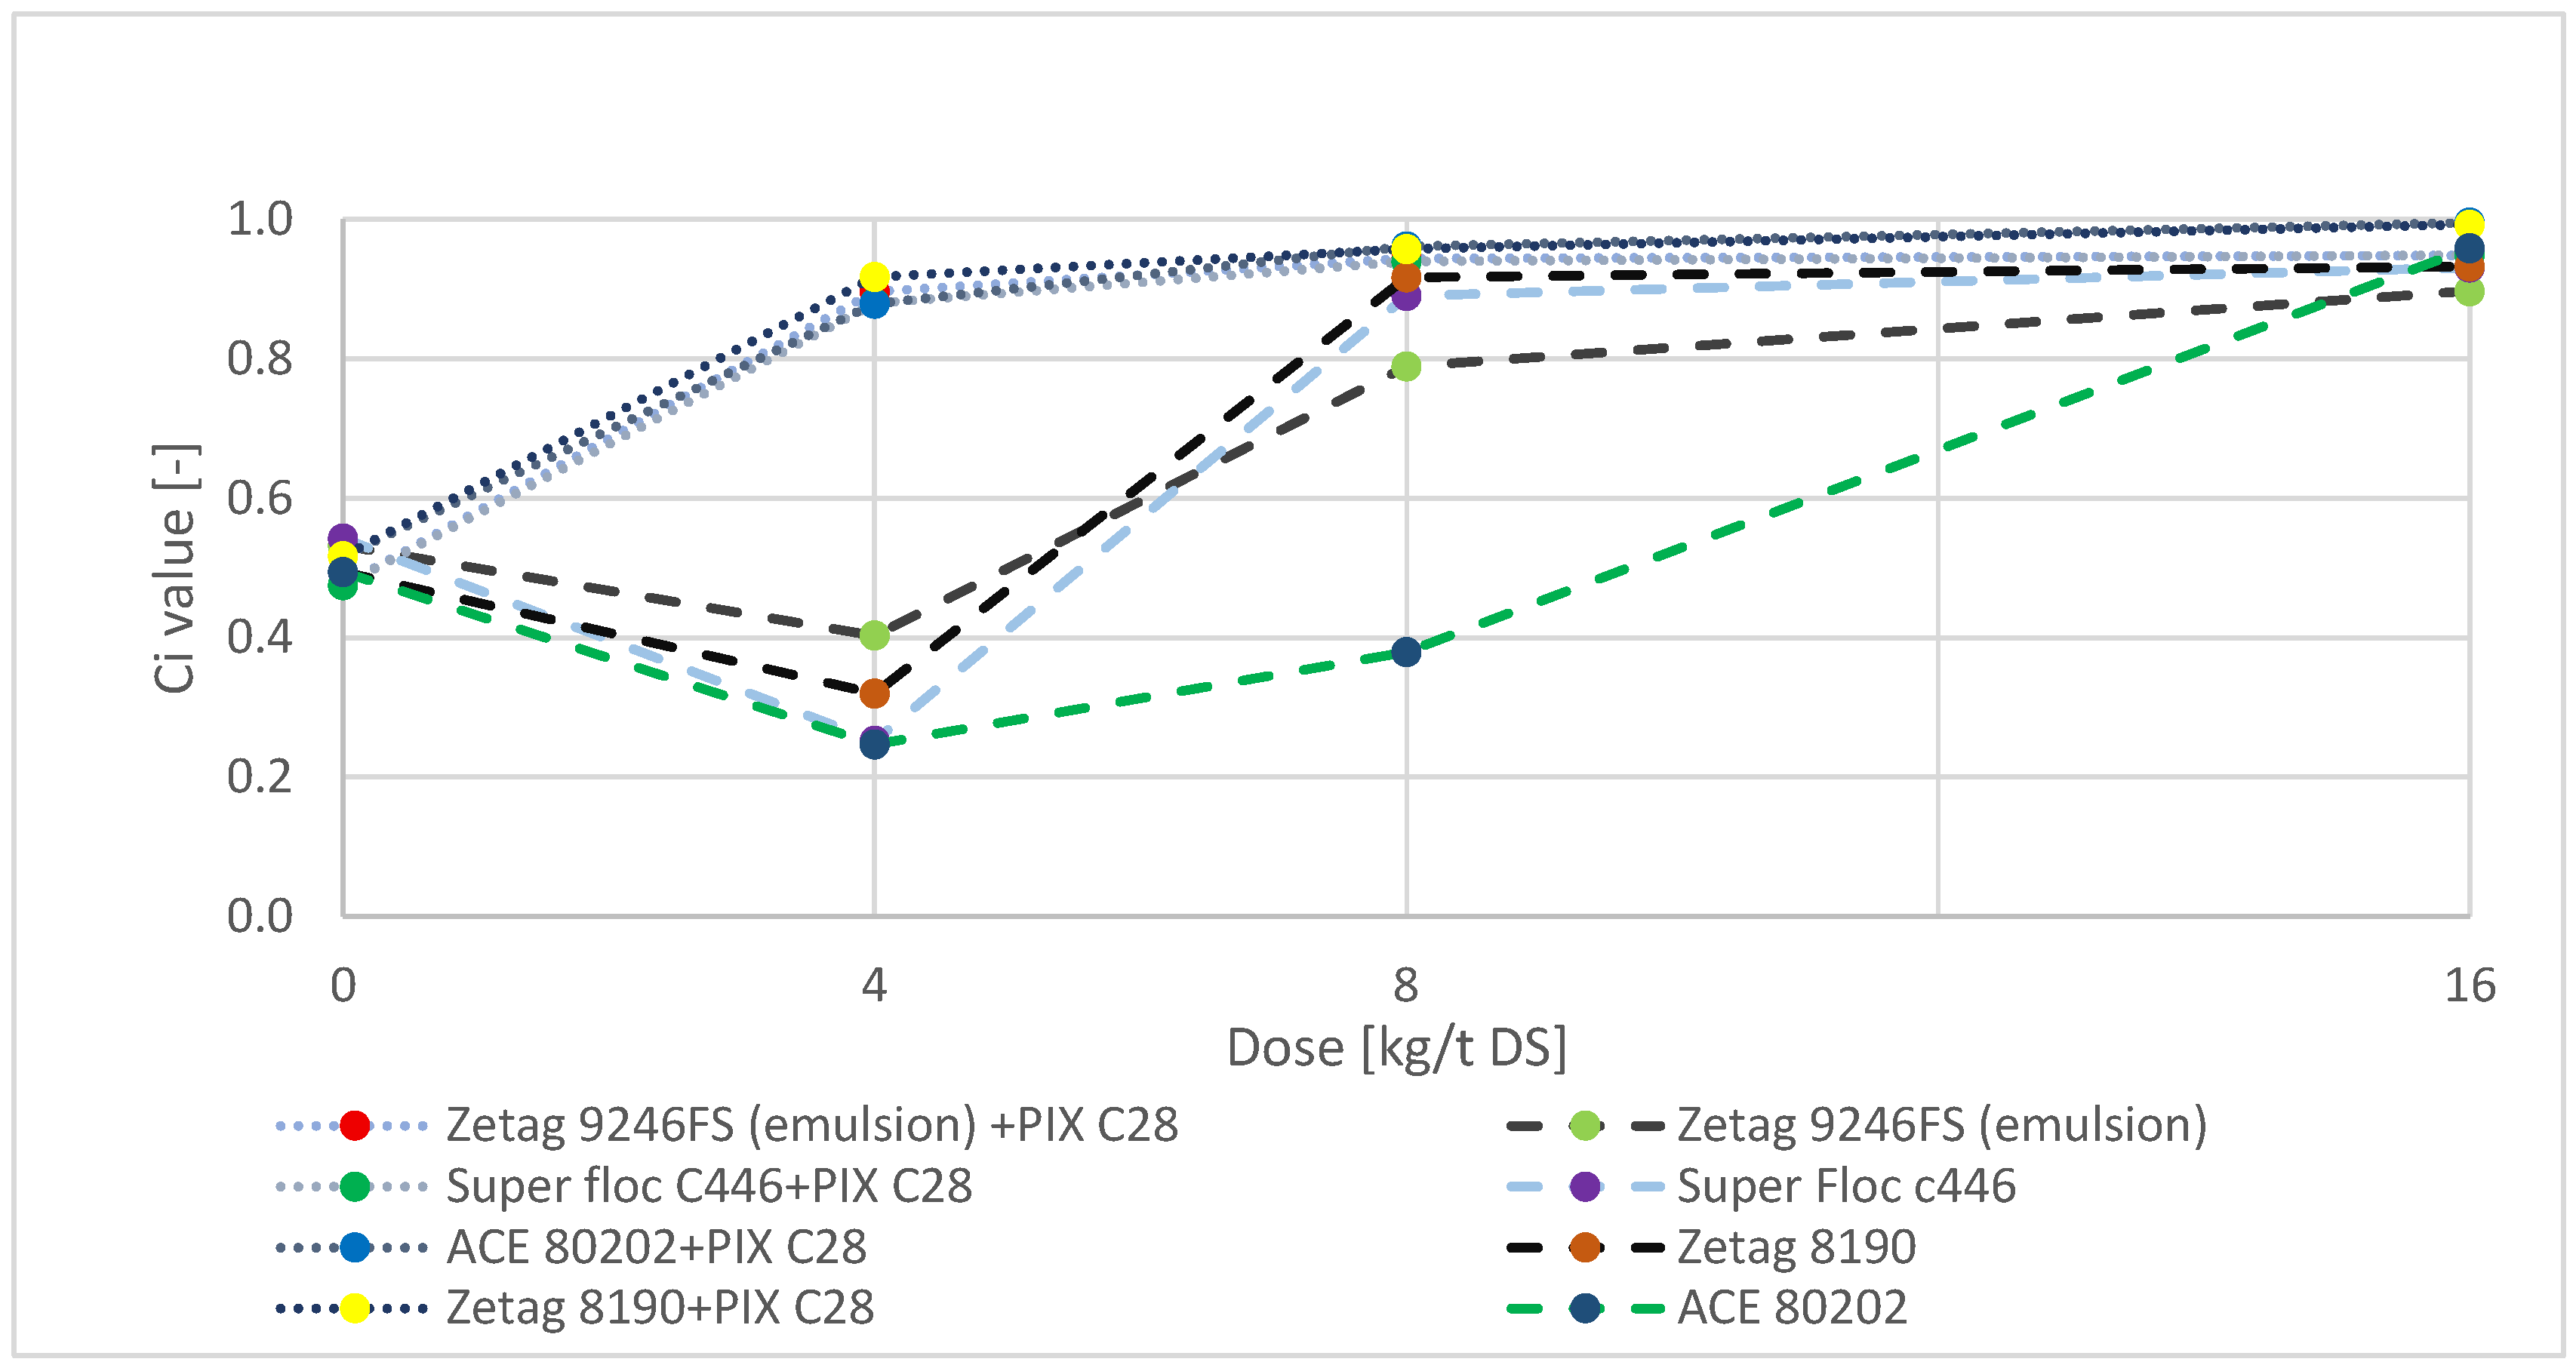
The TOPSIS analysis conducted with equal weights for all dewatering parameters revealed a clear and consistent differentiation of the Ci index depending on both the type of conditioning system applied and the polyelectrolyte dose. Ci values are presented on Figure 10 below:
Figure 10.
Plot of Ci index values for individual polyelectrolytes and doses.
Analysis of the Ci index as a function of dose revealed a clear and persistent superiority of conditioning systems supported by PIX C28 coagulant over polyelectrolytes used alone. In the absence of conditioning, the Ci index was comparable across all tested systems, confirming a similar baseline for all trials. Already at a dose of 4 kg/t DS, the Ci values of PIX C28 systems rose sharply to the range of 0.88 to 0.92, while polyelectrolytes used alone not only failed to improve their effectiveness but showed a temporary decline in all tested cases. This indicates that the polyelectrolyte dose applied was insufficient to achieve complete flocculation; although partial aggregation improved CST and liquid release, the fine fraction remained uncaptured, resulting in higher SRF and suspended solids in the centrate (see Section 4.3). At doses of 8 and 16 kg/t DS, the coagulant-assisted systems stabilised above 0.90, with the highest values achieved by ACE 80202+PIX C28 (Ci = 0.9950) and Zetag 8190 + PIX C28 (Ci = 0.9924). Among systems without the coagulant additive, a particularly anomalous profile dose–Ci was observed for ACE 80202: conditioning at 4 kg/t DS resulted in a marked deterioration in effectiveness (Ci = 0.247) relative to the unconditioned sample. The effectiveness of this system only reached a level comparable to the other polyelectrolytes at a dose of 16 kg/t DS (Ci = 0.959), suggesting that the threshold for effective conditioning with this reagent lies significantly above the doses used in other variants.
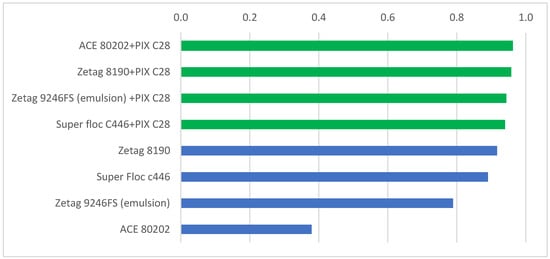
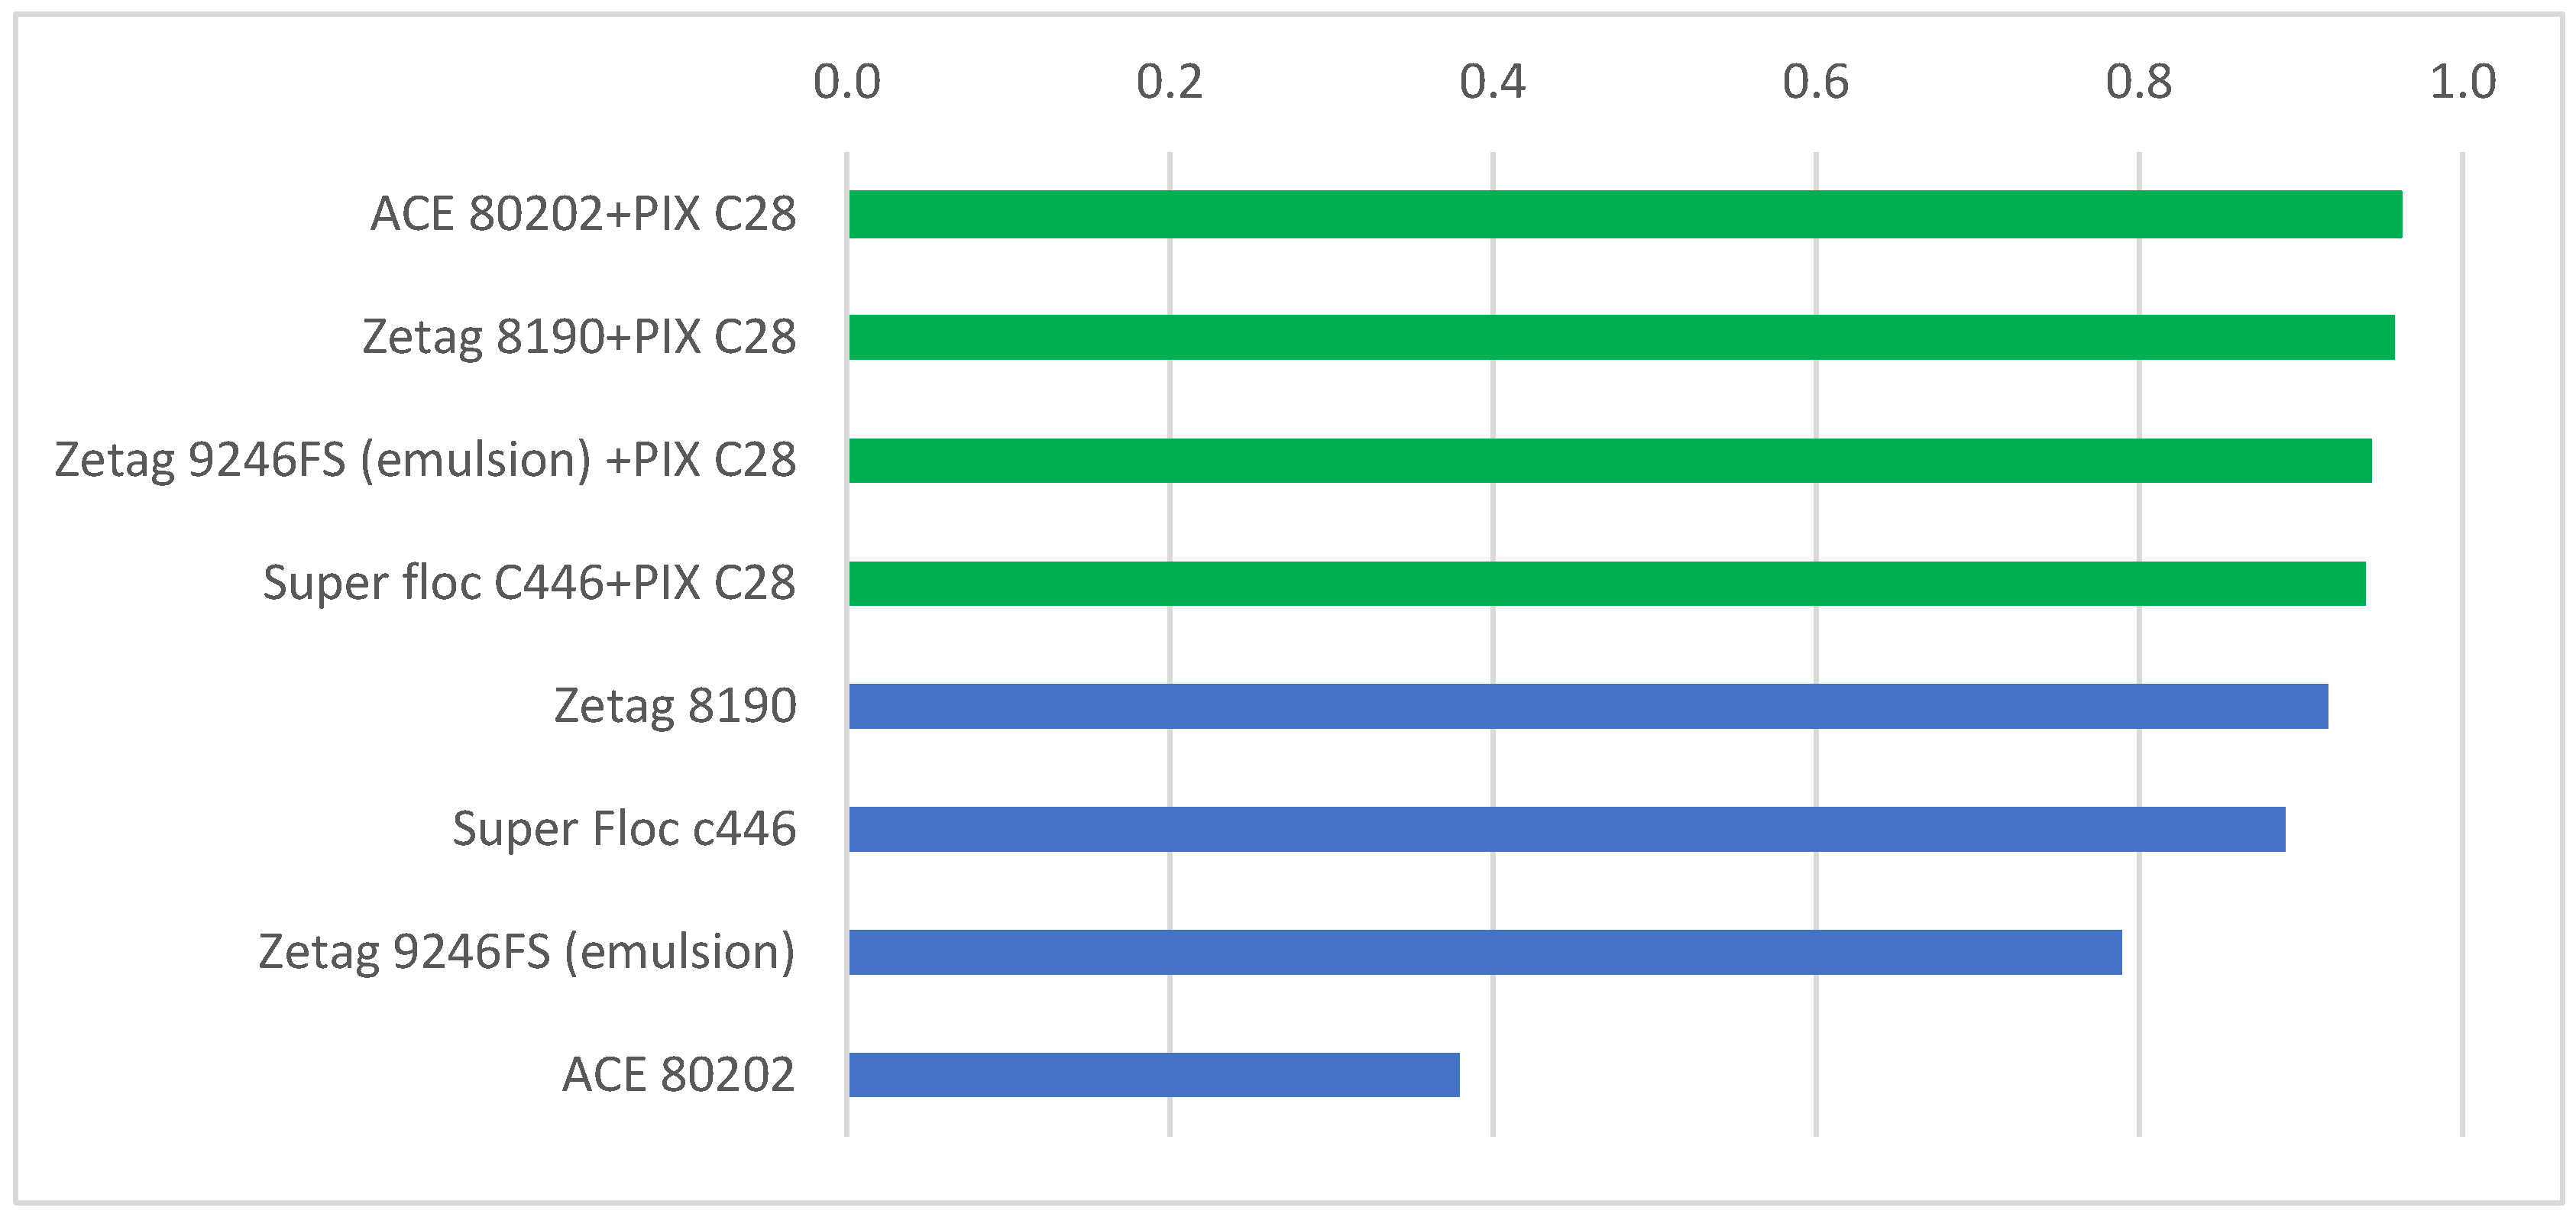
Comparing results at the intermediate dose of 8 kg/t DS shows that conditioning effects begin to converge between the two groups: the best polyelectrolytes used alone, Zetag 8190 (Ci = 0.917) and Super Floc C446 (Ci = 0.890), approach the PIX C28 systems (Ci = 0.940–0.961) but do not reach them. In terms of the mean radar chart area, the two groups partially overlap, as both polyelectrolytes used alone (1.77–1.78 u2) exceed the Zetag 9246FS + PIX C28 system (1.75 u2). Nevertheless, all PIX C28 systems still outperform the best standalone polyelectrolyte in the TOPSIS assessment, and the difference remains significant from a techno-economic perspective, given the higher cost of two-stage conditioning. The ranking comparison is presented on Figure 11 below:
Figure 11.
Ranking of polyelectrolytes and polyelectrolytes–coagulant systems at a dose of 8 kg/t DS.
4.3. Economic Analysis Results
The conditioning costs of sewage sludge depend on the type and dose of the polyelectrolyte and, in two-stage conditioning, on the cost of the inorganic coagulant. For a comprehensive evaluation of the analysed conditioning systems, the unit reagent costs were combined with the technological results obtained in the laboratory tests to determine the techno-economic efficiency indices, enabling the identification of systems providing the most favourable ratio of technological effect to conditioning cost. The cost of PIX C28 was calculated for the fixed dose of 10 L/m3 of sludge, a solution density of 1.32 kg/L (according to the product technical specification) and a price of €0.93/kg, which corresponds to €12.25/m3 of sludge and, at a mean DS concentration of 33.72 kg/m3, to €363.37/t DS. The cost of the polyelectrolytes ranged from €18.84 to €100.96/t DS, depending on the reagent and dose. Consequently, the coagulant accounted for 78–95% of the total conditioning cost in all PIX-assisted systems. The euro exchange rate of 18 April 2026 was adopted, i.e., PLN 4.24/€. The results of the economic analysis are presented in Table 7 below:
Table 7.
Summary of economic analysis for the tested sewage sludge conditioning systems.
The techno-economic efficiency indices express the increment in technological effect obtained per unit of conditioning cost. A higher index value indicates a more favourable ratio of technological effect to cost incurred, meaning more technological benefit per euro spent on conditioning one tonne of sludge DS. Negative index values indicate a deterioration in the overall multi-criteria assessment relative to the unconditioned state, meaning that the reagent dose applied did not reach the effectiveness threshold and the cost incurred brought no net improvement. As both indices share the same cost denominator, their correlation partly reflects the common cost term; the consistency of the two assessments was therefore verified on the technological increments before division by the cost. The increments in the TOPSIS score and in the radar chart area were strongly correlated (r = 0.967, R2 = 0.935, n = 24), confirming that the TOPSIS-based and radar-chart-based assessments are consistent regardless of the cost; nevertheless, the two indices are complementary rather than interchangeable, as they aggregate the dewatering parameters in different ways.
The analysis revealed a clear discrepancy between the technological and the economic assessment. PIX-assisted systems achieved the highest technological effect: already at a polyelectrolyte dose of 4 kg/t DS, their Ci values (0.88–0.92) were comparable to those obtained by polyelectrolytes used alone at 16 kg/t DS (0.90–0.96). The addition of the coagulant therefore allowed the polyelectrolyte dose to be reduced fourfold without loss of technological effect. However, at the applied dose of 10 L/m3, the cost of PIX C28 (€363.37/t DS) exceeded the resulting savings in polyelectrolyte (at most €75.72/t DS) several times over and accounted for 78–95% of the total conditioning cost. As a result, the techno-economic efficiency indices of all PIX-assisted systems (TOPSIS: 0.00095–0.00116; radar chart: 0.00278–0.00450) were approximately an order of magnitude lower than those of the most efficient polyelectrolytes used alone. Within the PIX-assisted group, the index values changed only slightly with the polyelectrolyte dose and were highest at 8–16 kg/t DS, as the fixed coagulant cost dominated the total cost and increasing the polyelectrolyte dose from 4 to 16 kg/t DS raised it by only 15–20%.
Polyelectrolytes used without PIX at a dose of 4 kg/t DS showed negative values for both indices, indicating a deterioration in the overall multi-criteria assessment relative to the baseline state. This effect does not reflect a uniform deterioration of dewaterability. At this dose, CST decreased and the volume of released liquid increased relative to the reference sample, whereas SRF and the suspended solids concentration in the centrate increased markedly. Such a pattern is consistent with incomplete flocculation: at an insufficient polymer dose, charge neutralization and inter-particle bridging are only partial, producing small, weak flocs that fail to capture the fine fraction. The uncaptured fines are carried into the centrate and contribute to the blinding of the filter medium and cake pores, which outweighs the improvement in CST in the multi-criteria assessment. A particularly pronounced deterioration in the TOPSIS assessment was noted for ACE 80202 without PIX and Super Floc C446 without PIX. At a dose of 8 kg/t DS, the polyelectrolytes used alone reached the highest efficiency of all tested variants, led by Zetag 8190 (TOPSIS: 0.01122; radar chart: 0.03983) and Super Floc C446 (0.00924; 0.03272). Increasing the dose to 16 kg/t DS reduced the efficiency of these reagents by approximately 38–48%, as the additional technological effect was small relative to the doubled cost. ACE 80202 was the exception, reaching a positive TOPSIS-based efficiency only at 16 kg/t DS, which confirms that its effective dose threshold lies above that of the other polyelectrolytes.
Under the tested conditions, the most favourable ratio of technological effect to conditioning cost was therefore achieved by Zetag 8190 and Super Floc C446 used alone at a dose of 8 kg/t DS. PIX-assisted conditioning provided the best technological results, but at the applied coagulant dose it was not economically justified; since the coagulant cost determined the total cost of these systems, reducing the PIX C28 dose is a prerequisite for their cost-effectiveness. Optimisation of the coagulant dose was beyond the scope of this study and is recommended for future work. It should also be noted that laboratory conditions do not account for the requirements of real-scale installations, such as filter cake moisture content or variability in sludge composition, which may necessitate different doses at technical scale.
The comparison between PIX-assisted systems and polyelectrolytes used alone is subject of a further limitation. The two series were carried out on different days, so the comparison refers to the conditioning systems as a whole and is based on increments relative to the same-day reference samples. A PIX-only control was not included: in preliminary tests, the addition of PIX C28 with short mixing improved the sludge properties, but prolonged and intensive mixing caused shear forces to break up the previously formed large flocs, returning the particles to suspension, reducing settling efficiency and directly impairing sludge dewaterability. As the effect of the coagulant alone depended strongly on the mixing conditions and could not be reproduced reliably, PIX C28 was applied as an additive at a fixed dose and a consistent contact time, followed by polyelectrolyte dosing. Separating the individual contribution of the coagulant would require a paired design including a PIX-only control. Similar results were obtained for other iron-based coagulants [26].
5. Conclusions
The analysis combining radar charts, supported by data normalization, with the TOPSIS method provided a consistent picture of the dewatering efficiency of sewage sludge conditioned with polyelectrolytes and polyelectrolyte–PIX C28 systems.
Of the eight normalization methods analysed, three complementary methods were selected (CV values refer to the 24 conditioned variants, dose 0 excluded): Min-Max (mean CV = 0.0665, median CV = 0.0042), percentile (mean CV = 0.0860, median CV = 0.0118) and maximum-based (mean CV = 0.3382, median CV = 0.3229). A low CV confirms only robustness to axis order: logistic scaling showed the lowest mean CV, yet it compresses parameters of low relative variability to approximately 0.5 and distorts proportions and is therefore unsuitable for sludge dewatering data. Maximum-based normalization was retained despite its weak stability, as it shows directly how close each variant is to the leader of the tested pool, which is of key operational importance; its role is interpretative, while the areas used in the techno-economic assessment were based on Min-Max normalization.
PIX C28-assisted systems achieved the highest technological effect, with a mean Ci of 0.9382 (median 0.9461) compared to 0.6597 (median 0.8398) for polyelectrolytes used alone; the gap between the mean and the median of the latter group results mainly from the deterioration observed at 4 kg/t DS. At this dose, CST improved while SRF and suspended solids in the centrate increased, indicating incomplete flocculation. CST and SRF depend on similar sludge properties but are not interchangeable: CST is a rapid indicator of conditioning quality, whereas SRF describes the filtration properties relevant to the press. SRF measured at 25 and 50 kPa additionally reflects cake compressibility, which strongly affects dewatering in successive zones of a filter press, where the sludge is not subjected to a constant pressure.
At the applied dose, PIX C28 accounted for 78–95% of the conditioning cost, so the efficiency indices of PIX-assisted systems were approximately an order of magnitude lower than those of the most efficient polyelectrolytes used alone. The most favourable ratio of technological effect to cost was achieved by Zetag 8190 and Super Floc C446 used alone at 8 kg/t DS, whereas at 4 kg/t DS both indices were negative. Reducing the PIX C28 dose is therefore a prerequisite for the cost-effectiveness of two-stage conditioning. The increments in the TOPSIS score and in the radar chart area were strongly correlated before division by the cost (r = 0.967, R2 = 0.935), confirming the consistency of both assessments; the indices remain complementary rather than interchangeable. Laboratory results should be treated as an optimisation guide rather than an absolute criterion for dose selection at technical scale.
Radar charts constitute an effective tool for visualising the results of the sewage sludge dewatering process, provided that the normalization method ensures area stability with respect to axis arrangement. Min-Max and percentile normalization guarantee to the greatest extent that the radar chart area is a reproducible measure of conditioning effectiveness, while maximum-based normalization complements them with the operational perspective of the distance from the best variant.
Supplementary Materials
The following supporting information can be downloaded at: https://www.mdpi.com/article/10.3390/molecules31224069/s1, In the supplementary material, we include all obtained results, as well as additional tables containing data for the radar charts and the TOPSIS analysis. Table S1. Summary of normalization Min—Max; Table S2. Summary of normalization Maximum Scaling; Table S3. Summary of normalization Zero—Baseline; Table S4. Summary of normalization Logarithmic transformation; Table S5. Summary of normalization Percentile ranking; Table S6. Summary of normalization Mean normalization; Table S7. Summary of normalization Fixed reference point; Table S8. Summary of normalization Logistic mean scaling; Table S9. Summary of normalization; Table S10. Summary of TOPSIS Score.
Author Contributions
S.M., B.P., N.G. and M.M.-H. contributed to the methodology and formal analysis. B.P. and N.G. performed validation, while S.M. and B.P. conducted the investigation. The original draft was prepared by S.M., B.P. and N.G. B.P. and M.M.-H. were responsible for reviewing and editing the manuscript, as well as project administration. All authors have read and agreed to the published version of the manuscript.
Funding
This research received no external funding.
Institutional Review Board Statement
Not applicable.
Informed Consent Statement
Not applicable.
Data Availability Statement
All data used in this article were obtained through experiments and can be found in Supplementary Material.
Acknowledgments
This article utilizes AI tools—specifically ChatGPT (version GPT 5.6 Sol), solely for the purpose of translating the text into English. All data and the analysis thereof are derived from experiments conducted by the authors.
Conflicts of Interest
The authors declare no conflict of interest.
References
- Kamizela, T.; Worwąg, M.; Kowalczyk, M. Environmentally Safe Method for Conditioning and Dewatering Sewage Sludge Using Iron Coagulant, Cellulose and Perlite. Energies 2024, 17, 134. [Google Scholar] [CrossRef] [Scilit]
- Ferrentino, R.; Langone, M.; Fiori, L.; Andreottola, G. Full-Scale Sewage Sludge Reduction Technologies: A Review with a Focus on Energy Consumption. Water 2023, 15, 615. [Google Scholar] [CrossRef] [Scilit]
- Pavez-Jara, J.; Korving, L.; Jeison, D.; de Kreuk, M.K. Dewatering Assessment of Sewage Sludge: A Remaining Challenge. Rev. Environ. Sci. Bio/Technol. 2026, 25, 25. [Google Scholar] [CrossRef] [Scilit]
- Bień, B.; Bień, J.D. Use of Inorganic Coagulants and Polyelectrolytes to Sonicated Sewage Sludge for Improvement of Sludge Dewatering. Desalin. Water Treat. 2014, 52, 3767–3774. [Google Scholar] [CrossRef] [Scilit]
- Kutryn, J.; Piecuch, T.; Koszalińska, P. Odwadnianie Komunalnych Osadów Ściekowych Na Laboratoryjnej Wirówce Sedymentacyjnej Typu MPW-350 Oraz Na Przemysłowej Wirówce Typu Noxon DC20-Problem Przeniesienia Skali (Eng. Dewatering of Municipal Sewage Sludge in a Laboratory Sedimentation Centrifuge Type MPW-350 and in an Industrial Centrifuge Type Noxon DC20—The Scale-up Problem). Rocz. Ochr. Sr. 2009, 517–542. [Google Scholar]
- Pirouzi, A.; Asrami, M.R.; Sabzehmeidani, M.M. Advancement Factors in Sludge Dewatering Technology for Wastewater Treatment from Engineering and Economic Perspectives: A Review. Environ. Funct. Mater. 2024, 3, 171–186. [Google Scholar] [CrossRef] [Scilit]
- Dorador, A. Optimizing Feature Ordering in Radar Charts for Multi-Profile Comparison. arXiv 2025, arXiv:2510.20738. [Google Scholar]
- Chen, Y.; Chio, C.; Boteju, R.; Lu, G.; Dang, Q.L.; Qin, W. Sludge Dewatering: A Review of Conventional Methods and Microbial Assisted Approaches. J. Environ. Manag. 2026, 405, 129776. [Google Scholar] [CrossRef] [Scilit]
- Bediako, J.K.; El Ouardi, Y.; Massima Mouele, E.S.; Mensah, B.; Repo, E. Polyelectrolyte and Polyelectrolyte Complex-Incorporated Adsorbents in Water and Wastewater Remediation—A Review of Recent Advances. Chemosphere 2023, 325, 138418. [Google Scholar] [CrossRef] [Scilit]
- Gray, N.F. Capillary Suction Time (CST). In Progress in Filtration and Separation; Academic Press: Cambridge, MA, USA, 2015; pp. 659–670. [Google Scholar] [CrossRef] [Scilit]
- Aarne, P. Capillary Suction Time as a Fundamental Measure of Sludge Dewaterability. J. Water Poll. Control Fed. 1988, 60, 215–220. [Google Scholar]
- Lee, D.J.; Hsu, Y.H. A Rectangular Capillary Suction Apparatus. Ind. Eng. Chem. Res. 1994, 33, 1593–1599. [Google Scholar] [CrossRef] [Scilit]
- January, B.; Wystalska, K. Osady Ściekowe: Teoria i Praktyka (Eng. Sewage Sludge: Theory and Practice), 2002nd ed.; Wydawnictwo Politechniki Częstochowskiej: Częstochowa, Poland, 2002; Volume 1000. [Google Scholar]
- ISO 18997-2:2013; Characterisation of Sludges—Filtration Properties—Part 2: Determination of the Specific Resistance to Filtration. ISO: Geneva, Switzerland, 2013.
- Rice, E.W.; Baird, R.B.; Eaton, A.D. Standard Methods for the Examination of Water and Wastewater, 23rd ed.; American Public Health Association: Washington, DC, USA; American Water Works Association: Denver, CO, USA; Water Environment Federation: Alexandria, VA, USA, 2017. [Google Scholar]
- Degen, J.; Nussberger, F.E. Notes on the Determination of Suspended Solids. Sew. Ind. Wastes 1956, 28, 237–240. [Google Scholar]
- Kampalasiri, C.; Pitiruek, K.; Sureeyatanapas, P. An Enhanced TOPSIS Method for Resilient Supplier Selection under Data Uncertainty. Int. J. Manag. Sci. Eng. Manag. 2026, 21, 36–51. [Google Scholar] [CrossRef] [Scilit]
- Sarraf, R. Effect of Normalization on TOPSIS and Fuzzy TOPSIS. In Proceedings of the Conference on Information Systems Applied Research, Washington, DC, USA, 3–6 November 2021. [Google Scholar]
- Lakshmi, T.M.; Vetriselvi, K.; Anand, A.J.; Venkatesan, V.P. A Study on Different Types of Normalization Methods in Adaptive Technique for Order Preference by Similarity to Ideal Solution (TOPSIS). Int. J. Eng. Res. Technol. 2016, 4, 1–7. [Google Scholar] [CrossRef]
- Mazziotta, M.; Pareto, A. EVERYTHING YOU ALWAYS WANTED TO KNOW ABOUTNORMALIZATION (BUT WERE AFRAID TO ASK). Riv. Ital. Econ. Demogr. Stat. 2021, LXXV, 41–52. Available online: https://www.rieds-journal.org/rieds/article/view/29/27 (accessed on 12 October 2026).
- Roszkowska, E. Entropy and Normalization in MCDA: A Data-Driven Perspective on Ranking Stability. Entropy 2026, 28, 114. [Google Scholar] [CrossRef] [Scilit]
- Filipowicz-Chomko, M. The Impact of the Selection of Criteria Normalization Techniques on the Stability of Rankings Obtained Using the TOPSIS. Algorithm 2021, 7–31. [Google Scholar] [CrossRef]
- Tang, L. How Large Is the Error Effect When Summing or Averaging Nonlinear Field Normalization Citation Counts at the Paper Level? arXiv 2025, arXiv:2511.02255. [Google Scholar]
- Guo, Y.; Tong, C.; Wang, T.; Zhou, L.; Wang, M. Research Trends in Autogenous Dentin Graft: A Bibliometric and Cluster Analysis (2006–2025). Int. Dent. J. 2026, 76, 109448. [Google Scholar] [CrossRef] [Scilit]
- Rajaseharan, V.; Vimal, S. Radar Chart: Unleashing the Power of Comparative Data Visualization. Preprint 2025. [Google Scholar] [CrossRef]
- Cao, X.; Yu, R.; Wang, X. Impact of Conditioning Agent Addition Sequence on Dewatering Performance of Advanced Anaerobic Digested Sludge. Water 2024, 16, 695. [Google Scholar] [CrossRef] [Scilit]

Disclaimer/Publisher’s Note: The statements, opinions and data contained in all publications are solely those of the individual author(s) and contributor(s) and not of MDPI and/or the editor(s). MDPI and/or the editor(s) disclaim responsibility for any injury to people or property resulting from any ideas, methods, instructions or products referred to in the content. |
© 2026 by the authors. Licensee MDPI, Basel, Switzerland. This article is an open access article distributed under the terms and conditions of the Creative Commons Attribution (CC BY) license.