


Abstract
Multimodal online reviews, which integrate textual content with user-uploaded images, have emerged as a significant information source for consumer decision-making and enterprise service enhancement in electronic commerce. Sarcastic reviews, characterized by positive textual statements that are contradicted by negative visual evidence, systematically distort sentiment analysis and subsequent evaluations. Most existing research on multimodal sarcasm detection is limited to binary classification. In contrast, many conventional review-based decision models permit cross-criterion trade-offs, allowing favorable performance on secondary attributes to obscure deficiencies in tolerance-sensitive attributes. To bridge the gap between misleading review content and reliable decision support, this study introduces an integrated three-module framework, the RDSF-MSD-SC. The first module, the Deep Feature Fusion Sarcasm Detection Model (DFF-SDM), combines RoBERTa-based contextual text analysis with CLIP-based cross-modal alignment to detect reviews in which linguistic and visual cues diverge. The second module, the Large Language Model-Driven Structured Semantic Correction Mechanism (LLM-SSCM), reinterprets identified sarcastic reviews and translates their implicit negative sentiment into structured evaluation units (problem dimension, problem severity, and correction confidence) that can be directly utilized by decision models. The third module, Non-Compensatory Decision-Making based on Contextual Tolerance and Mismatch Rate (NCDM-CTMR), aggregates the resulting severity matrix using context-specific tolerance vectors, penalizing breaches of tolerance rather than averaging them out. An empirical analysis of 8623 multimodal reviews from eight major U.S. passenger airlines demonstrates that DFF-SDM achieves an F1-score of 0.86, LLM-SSCM attains an expert-assessed correction quality score of 0.92, and NCDM-CTMR identifies Delta as the most context-appropriate airline with zero mismatch in a time-sensitive business travel scenario. Delta maintained the top ranking in 99.82% of the 20,000 Monte Carlo simulations conducted under a simplified mismatch formulation. Ablation analysis showed that the full pipeline recovered negative evidence from approximately 87% of the 2847 expert-labeled sarcastic reviews, a rate bounded by DFF-SDM’s recall of 0.87; the no-correction and no-detection variants recovered approximately 0%. Compared to the WSM, TOPSIS, and VIKOR baselines, the proposed framework yields a more threshold-sensitive differentiation among mid-tier alternatives.
1. Introduction
Online reviews, including increasingly prevalent image–text combinations, have become important information sources for e-commerce search, product evaluation, and purchase decision-making [1,2,3]. This role is especially salient in online travel, where online travel agency (OTA) platforms, such as TripAdvisor, Expedia, and Booking.com, support travelers’ information search, comparison of alternatives, and purchase decisions [4,5]. On these platforms, the composition of reviews, whether text-only or supplemented with user-uploaded images, substantially influences perceived review helpfulness and consumer purchase intention [6,7]. Notably, negative online reviews provide actionable evidence of recurring service failures and changing customer-experience problems, enabling firms to monitor service-quality deficiencies, identify emerging failure patterns, and initiate more timely corrective actions [8,9].
Within social media-style communication, users’ emotional expressions have become increasingly implicit and indirect. Sarcasm, characterized by concealment and expressive force, is frequently employed to convey dissatisfaction and criticism [10,11]. Multimodal sarcastic reviews often exhibit inconsistency between textual and visual semantics [1,12]. For example, a user may upload an image documenting a damaged product or an unsatisfactory service environment while describing the experience with superficially positive language such as “excellent quality” or “very satisfied.” This cross-modal semantic reversal represents a form of inherently misleading content on e-commerce platforms. It distorts the apparent emotional polarity of reviews relative to users’ intended meanings and can cause conventional sentiment-analysis models to misclassify their true evaluative orientation [13,14]. When such outputs are subsequently incorporated into ranking or recommendation systems, the interpretation error may propagate into downstream decisions. When such interpretation errors are incorporated into ranking or recommendation systems, they may propagate into travelers’ search and choice processes on OTA platforms [4,5].
At the same time, the aggregation of review-derived negative feedback in downstream decision models is as important as its accurate detection. Weighted-sum models and distance-based methods such as TOPSIS allow trade-offs among criteria, meaning that strong performance on some attributes may partially compensate for weak performance on others [15]. Compromise-ranking methods such as VIKOR also aggregate criterion-level evaluations, although their aggregation logic differs from that of fully additive models [16]. Such trade-offs may be problematic when consumers have low or zero tolerance for failure on a specific criterion. For instance, a time-sensitive business traveler may consider severe punctuality failure unacceptable, regardless of an airline’s strengths in service quality, baggage handling, or other secondary attributes. In this study, the term masking effect refers to a situation in which an unacceptable deficiency on a tolerance-critical dimension is obscured by favorable performance on other criteria, thereby producing recommendations that may be inconsistent with the decision-maker’s actual preferences.
These two challenges, misleading content and compensatory aggregation, are generally addressed independently in the literature. Existing sarcasm-detection studies, including recent multimodal models, primarily formulate the task as sarcasm classification, with limited attention to transforming detected sarcasm into structured evidence for downstream decision applications [13,14,17,18,19,20]. In contrast, review-driven MADM research extracts aspect-level sentiment but continues to aggregate review-derived evaluations within multi-criteria decision frameworks [15,21,22]. Even with high classification accuracy, a sarcasm label alone does not provide the structured, dimension-specific evidence required by decision models. Addressing this gap constitutes the primary motivation for the present study.
Specifically, this study addresses three interrelated research questions: (Q1) How can multimodal sarcastic reviews, in which text and images convey contradictory signals, be reliably identified? (Q2) Once identified, how can their implicit negative meanings be reinterpreted as structured, dimension-specific evidence suitable for direct consumption by decision models? (Q3) How can such structured evidence be aggregated in a manner that accounts for users’ asymmetric tolerance across service dimensions rather than averaging severe defects? An integrated framework, RDSF-MSD-SC, is proposed to address Q1–Q3 within a single end-to-end pipeline and is validated using multimodal airline reviews from TripAdvisor and Skytrax, combined with public operational statistics for eight major U.S. carriers.
The primary contributions of this study are summarized as follows:
- (1)
- Integrated review decision pipeline. This study connects three stages that are typically examined in isolation: multimodal sarcasm detection, semantic correction, and non-compensatory decision support. These are integrated into a unified pipeline that transforms misleading multimodal reviews into decision-ready evidence. This approach addresses the gap between sarcasm classification research and data-driven MADM studies, which have received limited attention in the literature.
- (2)
- LLM-driven, structured semantic correction. Beyond identifying whether a review is sarcastic, a large language model was employed to reinterpret the review and generate a structured triple comprising the problem dimension, problem severity, and correction confidence. Combined with an explicit quality-assurance protocol, this process converts implicit negative meanings into quantifiable inputs for downstream models, thereby addressing a key limitation of detection-only pipelines.
- (3)
- Non-compensatory decision logic with contextual tolerance. A mismatch-based aggregation rule was developed to penalize the extent to which a candidate’s severity on a given dimension exceeds the user’s tolerance for that dimension in that context. This approach mitigates the masking effect of compensatory aggregation and yields context-sensitive recommendations based on structured data generated by the correction module.
The remainder of this paper is organized as follows. Section 2 reviews the relevant literature on multimodal sarcasm detection and review-based MADM, clarifying the gap between sarcasm classification and decision-ready evidence. Section 3 introduces the methodological premise of the framework and details its three modules. Section 4 presents an empirical study on airline reviews, including detection performance, correction quality, the airline–problem matrix, the decision process, benchmark comparisons, stability analysis, and an ablation study. Section 5 addresses the theoretical contributions, practical implications, and limitations of the present study. Section 6 concludes.
2. Literature Review
2.1. Sarcasm in Online Reviews and Consumer Responses
Online consumer reviews do not always convey evaluations in a literal manner. Consumers may use exaggeration, mockery, irony, and sarcasm to express dissatisfaction, intensify criticism, or make an unpleasant consumption experience more engaging for other readers. A cross-language and cross-sector analysis of negative Amazon reviews identified sarcasm as an impoliteness strategy used by consumers, suggesting that it constitutes part of the communicative repertoire of electronic word-of-mouth rather than merely an annotation anomaly [23]. In hospitality contexts, this issue becomes particularly consequential when consumers visually document observable service failures while using superficially positive, ironic, or exaggerated language in the accompanying text. Prior research on hotel reviews has therefore emphasized the importance of detecting affective and semantic inconsistency both within textual content and across textual and visual modalities [12].
The effects of such content on review readers are potentially ambivalent. Research on pseudo-reviews—humorous or mocking texts that resemble conventional product reviews—shows that consumers generally perceive them as less helpful than authentic positive or negative reviews. When interspersed with authentic reviews at moderate levels, pseudo-reviews may also weaken product attitudes and purchase intentions [24]. Although pseudo-reviews are conceptually distinct from genuine sarcastic complaints grounded in actual consumption experiences, this literature offers relevant adjacent evidence on how readers respond to mockery, exaggeration, and incongruity in review environments. More recent studies further suggest that humorous and sarcastic review content may operate through competing mechanisms: amusement can enhance affective engagement, whereas increased uncertainty may weaken the relationship between review valence and purchase intention [25]. Similarly, humor in negative reviews may increase consumers’ intention to revisit a review-hosting platform through hedonic value and narrative transportation, although entertainment value does not necessarily improve the diagnostic usefulness of the underlying product information [26].
Taken together, these findings highlight an important distinction between the engagement value and decision value of sarcastic reviews. Such reviews may attract attention, entertain readers, and encourage continued platform engagement, while simultaneously obscuring the reviewer’s intended evaluation and increasing uncertainty about the product or service failure being described. Consequently, simply discarding sarcastic reviews may remove legitimate evidence of consumer dissatisfaction, whereas processing only their literal surface polarity may misclassify negative experiences as favorable evaluations. Sarcastic reviews may contain managerially relevant evidence of service deficiencies, but this evidence becomes more useful for decision support when the implied meaning, affected service dimension, and severity of the underlying problem are explicitly recovered and structured. This distinction motivates the shift from sarcasm classification to the detection-and-correction framework developed in the present study. Section 2.2 therefore reviews the progression of multimodal sarcasm detection from classification-oriented architectures to generative and large-model-assisted interpretation.
2.2. Multimodal Sarcasm Detection: From Classification to Decision-Ready Evidence
Multimodal sarcasm detection (MMSD) has developed through several overlapping stages, from rule-based and text-centered approaches to multimodal fusion, pretrained vision–language architectures, and, more recently, generative large-model-assisted methods [1,17,18,19,20]. Early rule-based approaches relied on manually designed linguistic indicators, such as negation, sentiment contrast, and rhetorical patterns [27]. Although these features provided interpretable cues, their dependence on predefined linguistic rules and domain knowledge limited their ability to generalize across implicit, context-dependent, and cross-domain expressions of sarcasm.
Subsequent text-centered neural approaches replaced handcrafted rules with learned semantic and contextual representations. Zhang et al. [28] used a bidirectional gated recurrent neural network to combine local linguistic information with contextual cues from historical tweets, while Tay et al. [29] developed an attention-based architecture that explicitly modeled incongruity between literal and implied meanings. Prior work has also shown that contextual information concerning authors, audiences, and preceding discourse can improve sarcasm detection beyond isolated textual features [30]. Nevertheless, text-only models cannot directly represent inconsistency between a written evaluation and the accompanying visual evidence, even though such inconsistency is often central to multimodal sarcasm.
Multimodal fusion methods addressed this limitation by incorporating visual, acoustic, and conversational signals. Schifanella et al. [18] combined textual features with visual semantics to identify sarcasm in multimodal social-media posts. Cai et al. [1] subsequently proposed a hierarchical fusion framework that integrates textual representations, image features, and image attributes. In the audiovisual domain, Castro et al. [17] introduced MUStARD, an audiovisual sarcasm dataset compiled from television programs, with utterance-level labels and accompanying acoustic, visual, and conversational context. Their results showed that combining multimodal cues improves detection performance relative to reliance on individual modalities alone. Collectively, these studies established that sarcasm may arise from interactions among verbal, visual, acoustic, and contextual cues rather than from textual content in isolation.
The emergence of large-scale pretrained vision–language models, particularly CLIP [31], has enabled textual and visual content to be represented within a shared semantic space. Recent task-specific MMSD models have used this capability to capture finer-grained text–image incongruity. InterCLIP-MEP [19] uses Interactive CLIP to embed inter-modal information into both textual and visual encoders and further incorporates a dynamic memory-enhanced predictor to improve inference robustness. By contrast, AdS-CLIP [20] introduces adapters into the upper layers of the CLIP encoders and uses adapter-state sharing, through which textual adapter states guide visual representation learning. This design supports parameter-efficient cross-modal adaptation while preserving lower-layer unimodal representations. These models represent specialized discriminative architectures designed and trained specifically for multimodal sarcasm classification.
More recent studies have extended MMSD toward generative and large-model-assisted reasoning. Tang et al. [32] proposed a generative multimodal sarcasm model that combines a visual-instruction template with demonstration retrieval and introduced the RedEval out-of-distribution test set to evaluate model generalization. Chen et al. [33] developed CofiPara, a large-multimodal-model-assisted coarse-to-fine framework in which competing rationales are generated for coarse-grained sarcasm-detection pretraining and subsequent fine-grained sarcasm target identification. Rather than proposing another detection classifier, Ouyang et al. [34] introduced PunchBench to evaluate the ability of multimodal large language models to comprehend humor and sarcasm conveyed through image–caption punchlines. Together, these studies suggest that large generative models can provide reasoning and explanatory information beyond conventional binary classification, although their effectiveness remains sensitive to task formulation, demonstration selection, and reasoning support. Motivated by these developments, the present study evaluates GPT-4o under zero-shot and four-shot prompting conditions as general-purpose multimodal baselines, thereby assessing whether a general-purpose model can serve as an effective substitute for the specialized first-stage detector.
The use of generative models also introduces an important reliability concern. Large language and multimodal foundation models may produce interpretations that are plausible in form but insufficiently supported by the source text or image. Recent hallucination research has therefore emphasized the need for explicit detection, verification, and mitigation mechanisms across language, image, video, and audio modalities [35,36,37]. This concern is especially relevant to multimodal sarcasm, because textual and visual signals may be intentionally inconsistent, making it more difficult to distinguish the intended rhetorical reversal from an unsupported model inference. Accordingly, the quality-assurance protocol presented in Section 3.3.4 evaluates output completeness, semantic consistency with the source review, and quantifiability before a generated unit can enter the decision module. Outputs that fail the prescribed threshold are regenerated once and excluded from severity aggregation if they remain invalid. This procedure does not eliminate hallucination, but it provides a traceable screening mechanism for reducing the propagation of unreliable interpretations into downstream decisions.
Despite these advances, most MMSD studies continue to treat sarcasm recognition as the endpoint, typically producing a binary label, a confidence score, a rationale, or an identified sarcasm target. These outputs are valuable for interpretation, but they are not necessarily structured for direct use in downstream decision models. In review-based decision support, a sarcasm label alone does not identify the affected product or service dimension, quantify the severity of the implied problem, or indicate the reliability of the reconstructed meaning. Although recent generative and rationale-based approaches have begun to move beyond binary classification, the systematic conversion of multimodal sarcastic content into standardized, dimension-specific decision units remains underexplored. The present study addresses this interface gap by introducing a semantic-correction stage that transforms detected sarcastic reviews into structured units comprising problem dimension, problem severity, and correction confidence before they are incorporated into non-compensatory decision analysis.
2.3. Multi-Attribute Decision-Making Methods Based on Online Reviews
Multi-attribute decision-making (MADM) based on online reviews has transitioned from expert-driven, subjective evaluations to data-driven, objective approaches, with ongoing improvements in data utilization and decision-making logic.
Classical MADM methods such as Analytic Hierarchy Process (AHP), Technique for Order Preference by Similarity to Ideal Solution (TOPSIS), and VIseKriterijumska Optimizacija I Kompromisno Resenje (VIKOR) provide systematic frameworks for structuring criteria, eliciting preferences, and ranking alternatives [15,16]. However, these methods do not by themselves transform large-scale unstructured reviews into criterion-level evidence; this requires a preceding natural-language-processing layer. Moreover, TOPSIS and VIKOR permit inter-criterion trade-offs, which may be undesirable when a decision-maker has low or zero tolerance for failure on a specific dimension.
The data-driven paradigm has addressed several of these challenges by incorporating natural language processing (NLP) and sentiment analysis. Aspect-level sentiment analysis is a central method for transforming unstructured review text into quantifiable evaluation indicators [3]. For example, Zuheros et al. [21] proposed the SA-MpMcDM framework, which integrates aspect-level sentiment scores derived from deep learning into a multi-person, multi-criteria decision-making model to enable alternative ranking based on sentiment intensity; the methodology was validated on a case study of restaurant choice using TripAdvisor reviews. To enhance the reliability of review information, Pasi et al. [22] proposed a multi-criteria decision-making approach based on the Choquet integral to assess the credibility of user-generated content while explicitly accounting for interactions among credibility features. Additionally, researchers have introduced dynamic factors: Korfiatis et al. [38] reconstructed the service-quality evaluation dimensions using topic modeling, and Yager and Kacprzyk [39] showed how ordered weighted averaging operators can support flexible aggregation of criterion values under different attitudinal configurations.
Non-compensatory preference structures have long been modeled through outranking methods, particularly those in the ELECTRE family. Figueira et al. [40] provided a systematic account of concordance, discordance, preference, and veto thresholds, while Greco et al. [41] reviewed the broader development of MCDA and the preference and aggregation models used to generate decision recommendations. Review-based decision models have also incorporated behaviorally asymmetric preference structures. For example, Liu and Teng [42] developed a probabilistic linguistic TODIM method for product selection based on online product reviews. Foundational work on TODIM [43] and ELECTRE [44] further demonstrates that decision logic need not be limited to simple additive scoring. However, these methods have not yet been systematically linked to structured, dimension-specific evidence recovered from multimodal sarcastic reviews.
Despite these advancements, current data-driven MADM methods continue to exhibit three major shortcomings. First, many review-driven decision models aggregate criterion-level evaluations into an overall preference score [15,21]. Without an explicit veto or tolerance mechanism, strong performance on some attributes may offset serious deficiencies on others. Second, existing methods do not effectively leverage the implicit negative feedback contained in such reviews, which can be misclassified by conventional sentiment-analysis models. Third, most models lack an explicit mechanism for representing user-specific, context-dependent, and potentially zero-tolerance thresholds across different defect types.
2.4. Research Gaps and Focus of This Paper
A synthesis of the two bodies of literature reveals two significant gaps that motivate the present study.
- Gap 1 (between detection and decision support). Existing multimodal sarcasm detection research typically ends at the classification stage and rarely re-encodes detected sarcasm into structured representations that are suitable for decision models. In contrast, review-based multi-attribute decision-making (MADM) studies often assume that sentiment analysis outputs can be aggregated directly using compensatory methods. Consequently, valuable negative feedback embedded in sarcastic reviews is frequently misclassified or disregarded if detected.
- Gap 2 (between aggregation rules and user tolerance). Even when severity information is available, fully compensatory aggregation rules fail to capture users’ low or zero tolerance for deficiencies in specific service dimensions. This limitation reduces the practical relevance of the review recommendations.
To address these gaps, this study integrates multimodal sarcasm detection, large language model-driven structured semantic correction, and non-compensatory decision-making within a unified pipeline. The objectives are as follows: (1) to develop a deep feature fusion model capable of capturing both textual internal contradictions and cross-modal semantic conflicts, thereby ensuring sufficient recall to identify reviews requiring reinterpretation; (2) to design a large language model-based mechanism that converts detected sarcasm into structured negative evaluation units; and (3) to propose a non-compensatory decision rule that penalizes breaches of user tolerance in these structured units according to context-specific weights.
3. Methodology
3.1. Methodological Premise
Reliable review-based decision support requires two key components that are often addressed independently: (i) accurate interpretation of ambiguous review content, particularly when linguistic cues conflict with visual evidence, and (ii) an aggregation mechanism that reflects users’ asymmetric tolerance for service failures, ensuring that defects in tolerance-critical dimensions are not obscured by strong performance in less-critical areas. The proposed framework integrates these components into a unified review intelligence pipeline rather than treating them as separate tools. Accordingly, three explicitly coupled modules are introduced: the detection module identifies reviews requiring reinterpretation; the correction module re-encodes these reviews into a structured format suitable for the decision module; and the decision module processes this structured data using a non-compensatory rule.
The resulting framework, termed the Review-Intelligence Decision-Support Framework fusing multimodal sarcasm detection and semantic correction (RDSF-MSD-SC), is depicted in Figure 1. It comprises three modules: (1) the Deep Feature Fusion Sarcasm Detection Model (DFF-SDM), which integrates RoBERTa-based contextual text features with CLIP-based cross-modal alignment features to identify potentially sarcastic reviews; (2) the LLM-Driven Structured Semantic Correction Module (LLM-SSCM), which reinterprets these reviews and generates structured negative evaluation units; and (3) the Non-Compensatory Decision-Making Module (NCDM-CTMR), which aggregates the resulting severity matrix using context-specific tolerance vectors and a mismatch-based rule.
Figure 1.
Overall architecture of the proposed RDSF-MSD-SC framework. Module 1 (DFF-SDM) integrates RoBERTa and CLIP ViT for multimodal sarcasm detection with the threshold . Module 2 (LLM-SSCM) performs LLM-driven structured semantic correction with an explicit quality-assurance protocol. Module 3 (NCDM-CTMR) consumes the resulting severity data for non-compensatory mismatch-based decision-making via .
3.2. Deep Feature Fusion Sarcasm Detection Model (DFF-SDM)
DFF-SDM serves as the first-stage sarcasm-screening module in the proposed pipeline. For each multimodal review, it estimates a sarcasm confidence score and forwards reviews that exceed the detection threshold to LLM-SSCM for further interpretation. Its role is to identify reviews whose surface polarity may be unreliable; it does not recover the reviewer’s intended meaning or produce dimension-specific decision units, which are handled by the downstream semantic-correction module. The model combines contextual text representations from RoBERTa-base [45], consisting of 12 layers with a hidden dimension of d = 768, with cross-modal alignment information extracted from the CLIP ViT-B/32 visual encoder and its paired text encoder.
Rather than relying solely on generic pretrained representations, DFF-SDM explicitly constructs four task-specific conflict signals: textual internal conflict (TIC), global text–image semantic deviation (1 − SimG), dimension-level cross-modal contradiction (CMA), and sentiment-polarity contradiction (SPC). These signals represent complementary forms of inconsistency both within the review text and between the textual and visual modalities. They are then integrated through a compact discriminative classifier to estimate the probability that a review is sarcastic.
A possible alternative would be to use a general-purpose multimodal large language model, such as GPT-4o, as the first-stage detector. However, the detection and semantic-correction modules serve different methodological purposes and require different types of output. DFF-SDM performs binary discrimination using explicitly defined conflict signals, whereas LLM-SSCM performs generative multimodal interpretation and converts implicit meanings into structured outputs that specify the affected problem dimension, problem severity, and correction confidence. The proposed staged architecture therefore separates discriminative screening from structured semantic reinterpretation. To examine whether this separation is empirically justified, Section 4.2.1 compares DFF-SDM directly with GPT-4o under zero-shot and four-shot prompting conditions using the same image–text pairs and evaluation folds. Thus, the use of a specialized first-stage detector is evaluated empirically rather than assumed a priori.
3.2.1. Text Processing
Given a review text , its feature extraction first converts into a subword sequence via the RoBERTa tokenizer , and then encodes the sequence with the pre-trained RoBERTa-base model to obtain a contextual word embedding matrix:
where each row corresponds to the contextual vector of token , and serves as the global textual representation.
In parallel, is processed by a dependency parser (implemented with spaCy’s en_core_web_trf pipeline) to generate a dependency tree, from which structured evaluation triples are extracted by traversing predefined dependency patterns (nsubj, dobj, amod, advmod, acomp):
where , , and represent the evaluation subject, dependency relation, and evaluation object, respectively.
For semantic-syntactic alignment, each element of an extracted triple is mapped back to the RoBERTa embedding space. The alignment function returns the contextual vector of token (using the first subword when is split). The polarity function is implemented as a linear classifier fine-tuned on the SST-5 corpus [46] that maps a token-level contextual vector to a polarity score in , with positive values indicating positive polarity:
A triple is considered valid for conflict scoring only if both and carry interpretable polarity. We define the indicator iff (a) both and are content words (noun, verb, adjective, or adverb) rather than function words; (b) , excluding near-neutral tokens; and (c) the relation belongs to the predefined evaluative set {nsubj, dobj, amod, advmod, acomp}. The valid pair set is , and the textual internal conflict score is as follows:
If , we set .
3.2.2. Image Processing
Each review image is encoded with the CLIP visual encoder (ViT-B/32), and is encoded with the paired CLIP text encoder . The global semantic similarity between text and image is as follows:
A low (equivalently, a high ) signals an overall semantic deviation between text and image.
To localize the conflict to a specific evaluation aspect, we define an airline-specific dimension set {punctuality, service quality, cabin environment, baggage handling, fare value, flight safety}. The dimension set was constructed by (i) extracting high-frequency aspect terms from a 1000-review pilot sample using unsupervised aspect extraction, (ii) merging synonymous aspects manually, and (iii) aligning the results with the service-quality categories used by the U.S. Department of Transportation. For each dimension , two short prompt phrases are written by the authors: describes a positive realization of the dimension (e.g., “a clean and tidy aircraft cabin”) and describes a negative realization (e.g., “a dirty and chaotic aircraft cabin”). The dimension-level contradiction is then as follows:
A large positive indicates that the image is more similar to the negative prompt than to the positive one. Because empirical inspection of the pilot sample showed that sarcastic posts typically concentrate their visual cues on a single problematic aspect rather than distributing evidence across many dimensions, we aggregated across dimensions by taking the maximum:
A dimension is considered locally triggered when , with calibrated against the elbow point of the contradiction distribution on the pilot sample (see Section 4.2.1).
We additionally define a sentiment-polarity contradiction indicator . The image-sentiment component comprises a Vision Transformer encoder and a multilayer perceptron classification head. The visual encoder was first initialized using the FER-2013 facial-expression dataset [47] and was subsequently fine-tuned for binary visual-sentiment classification using the Flickr and Twitter image data described by You et al. [48]. The resulting classifier predicts the image-level sentiment The textual sentiment is determined from the sign of . Accordingly, Thus, indicates disagreement between the textual and visual sentiment orientations.
3.2.3. Sarcasm Confidence Calculation and Classification
The four conflict-oriented features are concatenated into and passed to a sigmoid linear classifier:
where ∈ and are learnable parameters. The fusion classifier was trained using binary cross-entropy loss and the Adam optimizer [49] with a learning rate of , a batch size of 64, and a maximum of 50 epochs. Early stopping was applied according to validation loss with a patience of five epochs. During fusion-classifier training, the RoBERTa and CLIP encoders and the pretrained sentiment-classification components used to calculate TIC and SPC were frozen; only the fusion parameters and were optimized.
The sarcasm-detection threshold was selected using only the training data to maximize the F1-score and was fixed before evaluation on the corresponding held-out instances. The resulting threshold was = 0.7. A review satisfying is classified as a candidate sarcastic review and forwarded to LLM-SSCM for structured semantic correction. The complete architecture of the DFF-SDM is illustrated in Figure 2.
Figure 2.
Detailed architecture of the Deep Feature Fusion Sarcasm Detection Model (DFF-SDM). The text branch (left) processes through RoBERTa encoding and dependency-based triple extraction to compute the textual internal conflict score (TIC). The image branch (right) processes through the CLIP ViT encoder to derive global similarity (SimG), dimension-level cross-modal alignment (CMA) contradiction, and sentiment-polarity contradiction (SPC). The four features are concatenated and classified via a fully connected layer with sigmoid activation (threshold ).
3.3. LLM-Driven Structured Semantic Correction Module (LLM-SSCM)
The LLM-SSCM serves as the primary methodological component of the framework. Instead of generating new marketing-oriented content, it reinterprets the implicit negative meaning present in detected sarcastic reviews and produces a structured representation. In this capacity, the LLM functions as a semantic restructuring engine that connects ambiguous review content to the decision module.
3.3.1. Conditional Generation and Context Construction
For each detected sarcastic review, the correction process can be written abstractly as follows:
where the contextual representation fuses the multimodal features produced by the detection module:
and is the instruction prompt.
3.3.2. Model and Decoding Settings
We used GPT-4o (gpt-4o-2024-08-06) accessed via the OpenAI API as the backbone, with temperature = 0.2, top-p = 0.9, and a maximum generation length of 512 tokens. JSON mode decoding was enabled to ensure a structured output. The image is passed alongside the text through the multimodal input channel, and the dimension labels triggered by are appended as auxiliary hints.
The prompt follows a four-shot in-context learning template:
- A system instruction describing the role (“You are a careful annotator interpreting potentially sarcastic airline reviews. Output only valid JSON.”)
- A schema description specifying the output fields (, , , )
- Accordingly, four exemplars drawn from the pilot sample, each containing a review text, a short image caption, the triggered dimensions, and the expected structured output
- A target review with its text, attached image, triggered dimensions, and detection score
The full prompt template is provided in the public repository of this study.
3.3.3. Structured Output for Decision Support
Each corrected review is reduced to a standardized decision unit as follows:
where is the problem dimension (drawn from the decision attribute set), is the problem severity, and is the LLM’s self-reported confidence in its reinterpretation.
To ensure that severity scores are comparable across reviews and reviewers, is computed post hoc as a weighted combination of three signals rather than left to free-form LLM judgment:
SentInt represents the intensity of the negative sentiment contained in the LLM-reinterpreted statement. The SST-5-based sentiment classifier produces a raw polarity score of where more negative values indicate stronger negative sentiment. For an accepted negative reinterpretation , the magnitude of negative polarity is defined as
The value is clipped to the polarity range observed in the pilot sample, and , and then linearly mapped to the [1,5] severity scale:
Consequently, a greater negative-polarity magnitude produces a higher sentiment-intensity score. The lower and upper bounds were estimated using only the pilot sample. Outputs with are treated as unsuccessful negative reinterpretations and returned to the quality-assurance procedure in Section 3.3.4 rather than being incorporated into severity aggregation. denotes the within-review mention frequency of dimension , rescaled to [1,5], and is the evidence-type weight, where when the image evidence triggers CMA for the corresponding dimension; otherwise. The weights sum to one and are elicited from three domain experts via the analytic hierarchy process (AHP) [50] on a 1–9 Saaty scale; the resulting weights pass the consistency check .
3.3.4. Quality Assurance and Interface Verification
Large language models can hallucinate and produce inconsistent outputs. To control this risk, each generated unit is screened by a quality score as follows:
with , , .
- checks completeness: the JSON output contains all required fields with valid types.
- measures semantic consistency as the cosine similarity between the Sentence-BERT [51] embedding of the LLM rationale and the embedding of the original review text, with values above 0.5 indicating sufficient grounding.
- checks quantifiability: is a member of the decision attribute set and falls within the allowed range.
Units with are returned to the LLM with the failure reasons appended to the prompt for a second attempt; units still failing after the second attempt are flagged as low-confidence and excluded from severity aggregation. Interface verification with the decision module is enforced by the following indicator:
where is the decision attribute set used in Section 3.4.
As no external gold-standard dataset exists for the intended meaning of multimodal sarcastic reviews, the quality of these structured outputs is evaluated through expert assessment rather than against ground-truth labels. The implications of this design choice are discussed in Section 4.2.2 and Section 5.3.
3.4. Non-Compensatory Decision-Making Module (NCDM-CTMR)
NCDM-CTMR aggregates the structured units produced by LLM-SSCM under a context-specific tolerance vector and non-compensatory rule. The intuition is straightforward: instead of asking “how high is the average score?”, the rule asks, “by how much does the candidate exceed the user’s tolerance on each dimension?”
3.4.1. Construction of the Problem–Airline Association Matrix
Let denote the set of candidate airlines, and {punctuality, denied boarding, service quality, baggage handling} denote the four service dimensions in the decision module, listed in the order in which they appear throughout Section 4 (on-time performance, denied boarding rate, service quality, and baggage handling rate, indexed k = 1, 2, 3, 4, respectively). is a subset of restricted to the dimensions for which publicly available operational indicators are reported in Section 4.1. The problem set of airline on dimension is as follows:
where is the textual description of the problem (either an LLM-reinterpreted statement or a non-sarcastic negative comment), and is the associated severity. Problem descriptions were encoded using Sentence-BERT (all-mpnet-base-v2) [51]:
Similar problems are grouped into typical patterns by -means clustering of :
The number of clusters is selected per dimension by the silhouette score [52], scanning ; the selected values lie in the range to .
The aggregated severity for is a weighted average:
where the per-problem weight is , with as a time-decay factor ( in months relative to the reference date; so that a comment loses half of its weight per year). is the reviewer credibility score (based on the reviewer’s total number of reviews and helpful votes, normalized within the platform). is the LLM correction confidence; for non-sarcastic comments, .
3.4.2. Contextual Tolerance Vector Modeling
The tolerance vector for travel context is as follows:
Tolerance values were obtained by combining the AHP weights with fuzzy linguistic ratings:
where is a feature vector describing the context (e.g., business vs. leisure, time sensitivity, baggage volume), and is the AHP weight vector. The AHP questionnaire was completed by five experts (three civil aviation managers and two academic researchers in service operations management) on a 1–9 Saaty scale [50]; the resulting weights passed the consistency check, with . Linguistic ratings (“low”, “medium”, “high”) are mapped to fuzzy triangular membership functions {(1.0, 1.5, 2.0), (2.0, 2.5, 3.0), (3.0, 3.5, 4.0)} on the severity scale, and the tolerance for each dimension is the defuzzified centroid weighted by . As tolerance values are derived from a designed scenario, rather than estimated from observed booking behavior, we treat them as design parameters and assess their influence through the sensitivity analysis in Section 4.5.
3.4.3. Mismatch Calculation and Decision Optimization
The mismatch of airline under context is as follows:
In Equation (21), denotes the context-adjustment coefficient for dimension under travel context , whereas denotes the dimension-specific travel-urgency factor. The penalty for dimension k is zero whenever ≤ , ensuring that candidates with all service severities within tolerance receive zero mismatch. The base specification retains the hard tolerance threshold to preserve analytical transparency and permit direct verification of zero-mismatch cases. A boundary-softened variant with is evaluated separately in Section 4.5. The final selection rule is as follows:
Figure 3 summarizes the complete NCDM-CTMR pipeline and visually contrasts non-compensatory penalty logic with the traditional compensatory aggregation paradigm. To reduce the subjectivity that often accompanies multi-criteria decision frameworks, the decision parameters above are obtained through data-driven dimension extraction, calibration on a pilot sample, or explicit scenario design, rather than free-form expert tuning. The sensitivity of the final ranking to these parameters is examined in Section 4.5.
Figure 3.
Detailed architecture of the NCDM-CTMR. The left column constructs the Problem–Airline Association Matrix from LLM-corrected severity data through SBERT encoding, -means clustering, and weighted aggregation with time decay and reviewer credibility. The center column models contextual tolerance using AHP and fuzzy logic, which is fed into the mismatch calculation. The right panel contrasts the compensatory aggregation paradigm (in which high scores can offset low scores) with the proposed non-compensatory mode (in which tolerance breaches trigger penalties).
4. Empirical Study
The three-stage framework introduced in Section 3 was implemented, and its effectiveness was evaluated using a real-world airline-selection task. The empirical workflow mirrors the framework’s decision chain, encompassing multimodal review understanding, problem standardization through LLM-driven correction, context-aware tolerance modeling, and mismatch minimization.
4.1. Data Collection and Preprocessing
The empirical setting covers eight major U.S. passenger airlines for which comparable operational and service-quality statistics are available: Alaska, American, Delta, Frontier, JetBlue, Southwest, Spirit, and United. The primary quantitative variables comprise four publicly reported dimensions: on-time arrival performance, mishandled baggage rate, involuntary denied boarding rate, and the American Customer Satisfaction Index (ACSI) airline satisfaction score from the 2025 wave. Multimodal reviews were collected from TripAdvisor and Skytrax for the period from January 2023 to December 2024. Reviews were retained only if they contained a textual body of at least 30 English words and at least one attached image, yielding 8623 unique reviews after deduplication.
Among the 8623 retained reviews, 2847 were labeled as sarcastic, representing 33.02% of the study corpus. This proportion reflects the class distribution of the filtered and annotated dataset rather than the population prevalence of sarcasm across all airline or online travel agency reviews. Because the dataset was limited to relatively detailed multimodal reviews containing both text and user-uploaded images, it may include a higher level of observable text–image incongruity than the broader population of predominantly text-only reviews. The reported proportion should therefore be interpreted as corpus-specific. It refers to the expert-annotated labels and is distinct from the proportion later classified as sarcastic by DFF-SDM.
The operational statistics correspond to the 2024 calendar year for on-time arrival, baggage handling, and denied boarding, whereas customer satisfaction is based on the 2025 ACSI wave. Since the review and operational data are not strictly synchronous, the operational indicators are used as a stable baseline for characterizing recent carrier performance, while the review data provide dimension- and context-specific severity adjustments through LLM-SSCM. Table 1 summarizes the dataset.
Table 1.
Dataset summary: multimodal review corpus and distribution across airlines.
Inter-annotator agreement was assessed using Fleiss’ [53]. The resulting value of indicates strong agreement according to the interpretive benchmarks of Landis and Koch [54]. Disagreements were resolved by majority vote. The resulting labeled corpus was used to train and evaluate DFF-SDM (Section 4.2.1), whereas a random subset of 500 sarcastic reviews was set aside for expert evaluation of LLM-SSCM (Section 4.2.2).
4.2. Multimodal Review Processing and Construction of the Airline–Problem Matrix
In the review-understanding stage, RoBERTa-derived contextualized textual representations detect semantic polarity conflicts within comments, whereas CLIP-based cross-modal consistency features determine whether attached images corroborate or contradict the linguistic surface. Reviews surfaced as candidates by DFF-SDM are then passed to LLM-SSCM, which transforms them into structured decision units , bridging unstructured discourse and the downstream decision layer.
4.2.1. DFF-SDM Performance Evaluation
A total of 8623 manually labeled reviews were evaluated using stratified five-fold cross-validation. In each iteration, four folds were used for model training and hyperparameter selection, while the remaining fold was reserved exclusively for evaluation. The same fold assignments were used for all models to ensure a consistent basis for comparison. Sarcasm was defined as the positive class; accordingly, the reported precision, recall, and F1-score refer to the performance of the sarcastic class. Hyperparameter selection for DFF-SDM included the sarcasm-classification threshold , the cross-modal contradiction threshold , and the fusion-classifier hyperparameters. All preprocessing and hyperparameter selection procedures were performed using only the training partition of each fold.
DFF-SDM was compared with two recent task-specific multimodal sarcasm-detection models, InterCLIP-MEP [19] and AdS-CLIP [20]. Both models were re-implemented and trained on the present airline-review corpus using the architectures and hyperparameter settings reported in their respective publications.
To provide a direct comparison with a general-purpose multimodal large language model, GPT-4o was also evaluated under zero-shot and four-shot prompting conditions using the same image–text pairs, ground-truth labels, and fold assignments. The fixed model snapshot gpt-4o-2024-08-06 was used with temperature = 0 and a constrained output schema consisting of a binary sarcasm label and a confidence score. In the four-shot condition, all demonstrations were selected exclusively from the training partition of the corresponding fold; no test instances or test labels were used during prompt construction. Within each fold, the same four demonstrations and prompt template were applied consistently to all test instances. The complete prompts and fold-level predictions are provided in the public repository.
Table 2 reports the mean performance and standard deviation across the five held-out folds, and Figure 4 presents a visual comparison of the five models.
Table 2.
Sarcasm-detection performance comparison using stratified five-fold cross-validation (mean ± standard deviation across held-out folds).
Figure 4.
Sarcasm-detection performance across four evaluation metrics for DFF-SDM and the four baseline models, including InterCLIP-MEP (Chen et al., 2026) [19] and AdS-CLIP (Jana et al., 2026) [20]. Values represent the mean across five held-out folds, and error bars indicate standard deviations. Significance brackets above the F1-score bars indicate paired comparisons between DFF-SDM and each baseline (, paired -tests based on fold-level F1-scores).
As shown in Table 2, DFF-SDM achieved the highest performance across all four evaluation metrics. Its F1-score exceeded that of GPT-4o by 0.12 under zero-shot prompting and by 0.08 under four-shot prompting. The most pronounced difference was observed in precision: DFF-SDM achieved a precision of 0.85, compared with 0.68 and 0.72 for the zero-shot and four-shot GPT-4o configurations, respectively. Although GPT-4o maintained relatively high recall, its lower precision resulted in more non-sarcastic reviews being incorrectly forwarded to the downstream correction stage. Such false-positive cases may introduce irrelevant inputs and additional noise into the structured severity matrix.
Four-shot prompting improved GPT-4o relative to the zero-shot configuration, increasing its F1-score from 0.74 to 0.78 and its recall from 0.81 to 0.84. This improvement indicates that demonstrations provide useful task and domain guidance. Nevertheless, with the present corpus, the specialized DFF-SDM detector provided a more favorable balance between precision and recall. These results support its use as the first-stage screening module, with GPT-4o reserved for the subsequent semantic-reinterpretation task. This conclusion is specific to the present airline-review corpus, model snapshot, and prompting configurations and should not be interpreted as evidence that specialized detectors universally outperform multimodal large language models.
Figure 4 confirms the performance pattern reported in Table 2. DFF-SDM consistently achieved higher mean scores than the four baselines, including both GPT-4o prompting configurations. Its recall of 0.87 is consistent with its intended role as a high-recall screening module; nevertheless, approximately 13% of ground-truth sarcastic reviews remained undetected. This limitation establishes an upper bound on the proportion of sarcastic negative evidence that can subsequently be recovered by LLM-SSCM and is considered again in the ablation analysis in Section 4.6.
4.2.2. LLM-SSCM Quality Evaluation
A random sample of 500 reviews flagged sarcastically by DFF-SDM was processed by LLM-SSCM and evaluated by three independent domain experts on three criteria: output completeness, semantic consistency, and quantifiability. Each criterion was scored on a scale, and the average across scores is presented in Table 3. Figure 5 provides a visual summary of these expert scores, together with the data flow from the 8623 raw reviews through detection to LLM-driven correction.
Table 3.
LLM-SSCM expert-assessed correction quality (n = 500; three independent experts).
Figure 5.
LLM-SSCM expert evaluation and review-processing pipeline. (a) Expert evaluation scores across three criteria plus the overall score (n = 500); the dashed line marks the 0.85 reference baseline. (b) Data flow from 8623 raw reviews through sarcasm detection (33.0% sarcastic) to LLM-driven correction with an expert-assessed quality score of 0.92.
Because no external gold-standard dataset is currently available for the intended meanings of multimodal sarcastic reviews, the reported overall score should be interpreted as an expert-assessed correction quality score rather than as strict ground-truth accuracy. Accordingly, the manuscript consistently uses the term expert-assessed correction quality to distinguish expert evaluation of output completeness, semantic consistency, and quantifiability from conventional prediction accuracy. The methodological implications of relying on expert assessment are discussed further in Section 5.3.
To improve implementation transparency, we also report the computational usage of LLM-SSCM. The module processed 2914 reviews using gpt-4o-2024-08-06. The retained API calls consumed approximately 4.7 million input tokens and 1.2 million output tokens. The mean sequential wall-clock time was approximately 4.1 s per review, including image transmission, API response generation, and structured-output parsing, and the complete correction run required approximately 3.3 h. Based on API rates of USD 2.50 per million input tokens and USD 10.00 per million output tokens, the estimated API cost of the retained calls was approximately USD 23.75. These implementation values may vary depending on network conditions, API rate limits, model pricing, and the degree of request parallelization.
4.2.3. Construction of the Airline–Problem Matrix
To ensure cross-airline comparability, official indicators are normalized onto a common problem-severity scale , where 1 indicates the mildest problem and 5 the most severe. For benefit-type indicators:
For cost-type indicators:
Table 4 and Table 5 report the raw operational indicators and resulting severity matrix. The review-derived severity from the LLM-SSCM is fused with operational severity through the aggregation rule in Equation (18) (the review-derived component is scaled to match the range).
Table 4.
Raw operational indicators for the eight candidate airlines (calendar year: 2024; American Customer Satisfaction Index 2025 Wave).
Table 5.
Standardized severity matrix of airline-specific problems (after Equations (24) and (25) and fusion with LLM-corrected review severity).
The resulting severity landscape is visualized in Figure 6, where the heatmap highlights Delta’s consistently low severity across all dimensions and Frontier’s elevated severity on on-time, denied-boarding, and service dimensions.
Figure 6.
Standardized severity matrix visualization. (a) Heatmap of problem severity across eight airlines and four dimensions (Table 5); color scale from 1 (mild) to 5 (severe). (b) Grouped bar chart enabling cross-airline comparison within each dimension.
4.3. Stepwise Decision Process for Identifying the Best Airline
4.3.1. Business-Travel Scenario
To illustrate the decision logic, this section evaluates a time-sensitive domestic business-travel scenario. The context weight vector is and the tolerance vector is over the four dimensions in order (on-time, denied boarding, service, baggage). Both vectors are obtained from the AHP/fuzzy procedure described in Section 3.4.2. Note that, for the business-travel context, the punctuality tolerance is set tighter than for a leisure context; in Section 4.5, we examine the effect of relaxing it.
Applying Equation (21) to the severity matrix in Table 5 and the tolerance vector above yields the per-dimension penalties and total mismatch scores reported in Table 6, with the penalty decomposition visualized in Figure 7.
Table 6.
Penalty decomposition and final ranking under the business-travel context.
Figure 7.
Penalty decomposition and tolerance boundary analysis. (a) Stacked horizontal bars of mismatch penalties by dimension for each airline (Table 6). (b) Radar chart comparing the top-4 airlines’ severity profiles against the contextual tolerance boundary τ(c); severity values exceeding the dashed boundary trigger mismatch penalties.
As shown in Figure 7 and quantified in Table 6, Delta’s severity profile lies entirely within the tolerance boundary under this context, yielding zero mismatch across all dimensions. Southwest ranks second because of its excellent service and only a mild punctuality penalty. JetBlue, by contrast, is penalized heavily by a punctuality mismatch despite its strengths in baggage handling and customer experience. This example illustrates a feature of the non-compensatory rule: the most context-appropriate airline is not necessarily the one with the highest average score, but the one whose structured problem profile least violates the context-specific tolerance frontier.
4.3.2. Leisure-Travel Scenario
To examine whether the proposed decision logic responds to a different set of scenario-specific priorities, the same airline severity matrix reported in Table 5 was evaluated under a leisure-travel context. The leisure-oriented weight vector was and the corresponding tolerance vector was , with the four elements representing on-time performance, denied boarding, service quality, and baggage handling, respectively. These values were derived using the same AHP and fuzzy-linguistic procedure described in Section 3.4.2, based on a leisure-oriented context specification. Relative to the business-travel scenario, the leisure scenario assigns lower relative importance to punctuality and greater importance to service quality and baggage handling.
Table 7 reports the resulting penalty decomposition and total mismatch scores. Southwest achieves zero mismatch and is ranked first. Delta and JetBlue each obtain a total mismatch score of 0.041 and are therefore tied for second; no secondary tie-breaking rule is imposed. Alaska ranks fourth with a total mismatch of 0.197, followed by Spirit, United, American, and Frontier.
Table 7.
Penalty decomposition and final ranking under the leisure-travel context.
The change in the top-ranked alternative is consistent with the scenario-specific tolerance structure. Southwest’s service severity of 1.000 and baggage severity of 1.636 remain within the corresponding leisure tolerances of 1.55 and 1.90. Delta and JetBlue each incur a small service-quality penalty because their service severity of 1.800 exceeds the leisure tolerance. In comparison, Delta is ranked first under the business-travel context, whereas Southwest is ranked first under the leisure-travel context. This result demonstrates that NCDM-CTMR can generate context-responsive rankings when the relative weights and tolerance thresholds are changed, rather than producing an invariant ordering across designed scenarios.
4.4. Benchmark Comparison Against Conventional MCDM Models
To probe the robustness of the mismatch-based formulation, the severity matrix (incorporating LLM-SSCM-corrected review severity) and the AHP weight vector are also fed into three established multi-criteria decision-making (MCDM) baselines: the Weighted Sum Model (WSM), the Technique for Order Preference by Similarity to an Ideal Solution (TOPSIS), and VIseKriterijumska Optimizacija I Kompromisno Resenje (VIKOR). All four models therefore consume identical inputs; only the aggregation rule differs. The resulting rankings under each method are listed in Table 8.
Table 8.
Ranking comparison across four decision models on the same input severity matrix.
Figure 8 summarizes the ranking trajectories reported in Table 8. All four models identify Delta as the most appropriate airline and Southwest as the strongest alternative, indicating that this conclusion is robust across modeling paradigms and not an artifact of the proposed non-compensatory formulation. Differences emerge in the middle tier. The compensatory baselines (WSM, TOPSIS, VIKOR) allow strengths of one dimension to offset weaknesses of another: for instance, American Airlines is ranked 5th by VIKOR (benefiting from compensatory aggregation) but 6th by the proposed model (penalized for exceeding the denied-boarding tolerance). Relative to the baselines, the proposed model provides more threshold-sensitive differentiation among mid-tier alternatives, which is particularly relevant when LLM-SSCM has elevated the recorded severity of specific service defects: under the non-compensatory rule, those elevated severities are not absorbed by strong performance on other dimensions.
Figure 8.
Airline ranking trajectories across the four decision models (bump chart). Rank 1 is at the top. Delta, Southwest, Alaska, United, and Frontier maintain identical ranks across all four models, while American, Spirit, and JetBlue exhibit rank shifts of 1–2 positions under the compensatory baselines.
4.5. Stability Analysis
To assess sensitivity to the hard threshold in Equation (21), a boundary-softened variant, , replaces with where introduces a small positive shift in the penalty trigger. The resulting ranking remains unchanged. For Delta, (Delta, for all four dimensions: −0.66 for on-time performance, −0.95 for denied boarding, −0.35 for service quality, and −0.92 for baggage handling. Delta, therefore, retains a mismatch score of 0.000 under . The Kendall rank correlation between the original and boundary-softened rankings across the eight airlines is 1.000, indicating complete rank-order invariance to this local modification.
To examine the robustness of the empirical recommendation more broadly, three complementary diagnostics were conducted. First, a Monte Carlo sensitivity analysis perturbed the AHP weights multiplicatively by , the tolerance vector additively by , and the severity matrix by uniformly distributed random noise of ±10% across 20,000 independent trials. The perturbed weights were renormalized to sum to one, and the perturbed tolerance and severity values were constrained to the valid severity range. To maintain interpretability, this large-scale analysis used a simplified mismatch formulation that omitted the boundary-softening constant , the context-adjustment coefficients , and the travel-urgency factors . The simplified specification was calibrated to reproduce the baseline ranking before perturbation. Second, to determine whether the omitted parameters materially affected the robustness conclusion, a supplementary Monte Carlo analysis was conducted using the complete parameterization of Equation (21), retaining and , together with the boundary-softened penalty term. A total of 5000 paired trials were performed. The AHP weights, tolerance values, and severity values were perturbed using the same ranges as in the simplified analysis, whereas and were perturbed multiplicatively by . The same primary-parameter draws were used for the simplified and complete formulations within each paired trial, enabling direct comparison of the resulting rankings. Third, a leave-one-criterion-out analysis iteratively excluded each of the four service dimensions to determine whether the top-ranked airline was driven by a single dominant indicator. Table 9 summarizes the results of the simplified Monte Carlo analysis, the supplementary complete-parameter analysis, and the leave-one-criterion-out diagnostic.
Table 9.
Stability diagnostics of the proposed decision model under the simplified and complete mismatch specifications.
The Monte Carlo distributions presented in Figure 9 are consistent with the summary results reported in Panel A of Table 9. Panels (a)–(c) show that Delta’s mismatch distribution remains clearly separated from those of the other carriers under repeated perturbations. The rank-frequency heatmap in Panel (d) further indicates that the leading rankings are concentrated within a relatively small set of permutations. Under the simplified formulation, Delta is ranked first in 99.82% of the 20,000 trials, while Delta and Southwest jointly occupy the top two positions in 98.87% of the trials.
Figure 9.
Monte Carlo sensitivity analysis based on the simplified mismatch formulation over 20,000 trials. (a) Empirical cumulative distribution functions of mismatch scores for the four leading airlines; the vertical dashed line marks Delta’s mean mismatch value, indicating its concentration near zero. (b) Kernel density estimates of the mismatch distributions for Delta and Southwest; the vertical dashed lines indicate the respective mean mismatch values. (c) Box plots of mismatch scores across the eight airlines. (d) Rank-frequency heatmap, with only frequencies exceeding 10% labeled. This figure visualizes the large-scale simplified-formulation analysis; the supplementary complete-parameter analysis is summarized separately in Panel B of Table 9.
The supplementary analysis based on the complete parameterization produced closely comparable results. Delta was ranked first in 99.46% of the 5000 paired trials, and Delta and Southwest remained the top two alternatives in 98.12% of the trials. The mean Kendall rank correlation between the rankings generated by the complete and simplified formulations was 0.987, indicating near-perfect ordinal agreement within the examined perturbation ranges. These results suggest that retaining the context-adjustment coefficients, travel-urgency factors, and boundary-softening term does not materially change the principal robustness conclusion.
The leave-one-criterion-out analysis provides an additional check against single-indicator dominance. Delta remained the top-ranked alternative in all four tests, irrespective of which service dimension was excluded. Taken together, the three diagnostics indicate that the business-travel recommendation is not driven solely by one favorable criterion, a single threshold specification, or the omission of auxiliary parameters from the large-scale simplified simulation. Nevertheless, these results should be interpreted as evidence of local robustness around the designed scenario and parameter ranges, rather than as an exhaustive global sensitivity analysis.
To clarify the role of the tolerance parameters, Figure 10 visualizes mismatch as a joint function of the on-time and baggage-handling tolerances for Delta and Southwest, while holding the denied-boarding and service-quality tolerances constant. This surface analysis complements the stochastic diagnostics by illustrating how the two leading alternatives respond to systematic variation in two decision-relevant tolerance thresholds.
Figure 10.
Tolerance-sensitivity surfaces for Delta and Southwest. (a) Delta: Tolerance Sensitivity Surface. (b) Southwest: Tolerance Sensitivity Surface. The -axis represents mismatch as a function of the on-time tolerance and the baggage-handling tolerance , with the denied-boarding and service-quality tolerances fixed at 2.00 and 2.20, respectively. The red points indicate the baseline business-travel settings (). The surfaces are intended to visualize the effect of systematic tolerance changes; the complete-parameter Monte Carlo results are reported separately in Panel B of Table 9.
4.6. Ablation Study: Contribution of the Correction Module
To isolate the contribution of LLM-SSCM, we compare three configurations of the framework: (i) the full pipeline (DFF-SDM + LLM-SSCM + NCDM-CTMR), (ii) a variant without correction (DFF-SDM + NCDM-CTMR, in which reviews flagged as sarcastic are simply discarded), and (iii) a no-detection baseline that treats all reviews at face value. The quantitative results are reported in Table 10, and the corresponding panel-level comparisons are shown in Figure 11.
Table 10.
Ablation study: impact of the LLM-driven correction module on decision quality.
Figure 11.
Ablation results (Table 10). (a) Sarcastic negative evidence recovery rate under the three pipeline configurations, expressed as a percentage of ground-truth-labeled sarcastic reviews (n = 2847). The full pipeline achieves ≈87%, bounded by DFF-SDM’s recall of 0.87; FN ≈ 370 reviews that escape detection are irrecoverable across all variants. Both the no-correction and no-detection variants yield ≈0%: the former discards all ≈2914 flagged reviews, the latter processes sarcastic reviews at face value. (b) Mismatch score comparison between Delta and Frontier; without correction, Frontier’s severity is underestimated by 13.8%. (c) Kendall τ rank correlation with the full pipeline.
The sarcastic negative evidence recovery rate is defined as the proportion of ground-truth-labeled sarcastic reviews (n = 2847) from which negative content is successfully extracted and incorporated into the severity matrix. DFF-SDM identifies approximately 2914 reviews as sarcastic (TP ≈ 2477, FP ≈ 437, FN ≈ 370), derived from recall = 0.87 and precision = 0.85 applied to the 2847 labeled positives. The full pipeline processes all flagged reviews through LLM-SSCM and retains corrected negative evidence from TP reviews, achieving a recovery rate of approximately 87%, the ceiling imposed by the detector’s recall. The remaining 13% (FN ≈ 370) escape detection and are irrecoverable across all three variants. The no-correction variant discards all ≈2914 flagged reviews, reducing recovery to approximately 0%. The no-detection variant processes all reviews at face value, suppresses the implicit negative content in sarcastic reviews, and yields approximately 0% recovery. The FP ≈ 437 non-sarcastic reviews incorrectly flagged by DFF-SDM are processed by LLM-SSCM; their quality scores Qᵢ (Equation (13)) are expected to be low, and these reviews are excluded from severity aggregation, though they constitute a minor source of noise.
Table 10 and Figure 11 jointly demonstrate that the correction module materially influences the severity matrix. In the no-correction variant, all ≈2914 DFF-SDM-flagged reviews are discarded (≈33.8% of the corpus), eliminating negative evidence from approximately 2477 true sarcastic reviews and reducing the sarcastic negative evidence recovery rate from ≈87% to ≈0%. As this comparison is bounded by DFF-SDM’s recall of 0.87, the recovered 2477 reviews represent only the detectable fraction of the 2847 labeled sarcastic reviews; the FN ≈ 370 reviews that escape detection remain unrecoverable regardless of which correction strategy is applied. Consequently, the severity of airlines with higher sarcasm prevalence is systematically underestimated in the no-correction variant: Frontier’s mismatch score decreases by 13.8%, reflecting the loss of high-severity problem reports that DFF-SDM correctly identifies but the no-correction variant discards. The Kendall rank correlation between the full pipeline and the no-detection variant is 0.714, indicating that ignoring sarcastic content produces a measurably different and less faithful ranking. Taken together, these results establish that detection alone is insufficient and that structured semantic correction is a non-redundant component of the pipeline; within the scope of what the detector surfaces, the correction module recovers negative evidence that would otherwise be entirely absent from the decision model.
4.7. Section Summary
This section provides an empirical validation of the methodology proposed in Section 3. By integrating multimodal sarcasm detection, LLM-driven structured semantic correction, severity normalization, contextual tolerance modeling, and mismatch minimization, the framework converts unstructured public reviews into structured, decision-relevant evidence. Under a time-sensitive business-travel scenario, the framework identifies Delta as the most context-appropriate airline. Benchmark comparisons with WSM, TOPSIS, and VIKOR show that this top recommendation is robust across modeling paradigms, while the proposed model provides more threshold-sensitive differentiation among mid-tier alternatives. The ablation study supports the role of the LLM-driven correction module in capturing negative evidence that detection-only pipelines discard.
5. Discussion
The RDSF-MSD-SC framework has theoretical and practical implications for review-based decision support in electronic commerce, but it also has clear limitations that should inform its interpretation and use.
5.1. Theoretical Contributions
First, this study positions structured semantic correction as a connecting stage between multimodal sarcasm detection and review-based MADM. By converting implicit user-generated content into explicit, dimension-specific evaluation units, the LLM-SSCM module provides decision models with inputs that go beyond a sarcastic/non-sarcastic label. This addresses a gap in the MMSD literature, which has focused primarily on classification, and in the review-driven MADM literature, which has typically assumed that sentiment outputs can be aggregated directly.
Second, the framework bridges multimodal sarcasm detection and data-driven MADM through an explicit interface specification (Equation (14)). The integration of RoBERTa+CLIP fusion, LLM-based structured correction, and contextual tolerance-based mismatch aggregation enriches the multimodal sentiment analysis literature and the non-compensatory MADM literature simultaneously, while keeping the modules loosely coupled through a documented data contract.
Third, the introduction of contextual tolerance and mismatch rate provides a concrete alternative to the compensatory aggregation paradigm. Under the proposed rule, severity values produced by upstream correction cannot be masked by strong performance on secondary attributes, which is desirable when consumers have low or zero tolerance for specific defects.
5.2. Practical Implications
The proposed framework offers a practical mechanism for transforming multimodal review content into context-sensitive, decision-ready evidence. For airlines and online travel agencies, it can function as a review-intelligence layer situated between raw user-generated content and downstream recommendation or service-management systems. DFF-SDM can first identify reviews in which textual and visual signals appear potentially inconsistent. LLM-SSCM can then translate the implied complaint into structured fields that specify the affected service dimension, complaint severity, and correction confidence. These outputs may support customer-service triage, route severe or low-confidence cases to human analysts, update airline-level service-quality profiles, and improve scenario-specific recommendation systems. For instance, punctuality-related complaints may be weighted more heavily for time-sensitive business travelers, whereas baggage-handling or fare-value concerns may be more relevant in other travel contexts. The quality-assurance protocol specified in Equation (13) also provides a governance mechanism to prevent unsupported LLM interpretations from being incorporated directly into operational decisions.
The same architecture may be applicable to other hospitality and mobility services in which consumers frequently combine evaluative language with photographic evidence. Hotels could use the framework to detect sarcastic complaints related to cleanliness, room condition, check-in delays, staff responsiveness, or discrepancies between advertised and actual facilities. Restaurants and food-delivery platforms could apply it to structure complaints concerning food quality, hygiene, waiting time, order accuracy, packaging, and delivery condition. Comparable applications may arise in cruise services, car rentals, ride-hailing platforms, tourism attractions, and short-term accommodation platforms, where superficially positive wording may conflict with images documenting service failures. In these contexts, corrected review units could support not only consumer recommendations but also service-recovery prioritization, branch-level benchmarking, recurring-defect detection, and resource allocation.
Beyond hospitality, the framework may also be adapted to broader electronic-commerce categories, including consumer electronics, household appliances, apparel, furniture, and marketplace delivery services. For example, a review stating that a damaged product arrived in “perfect condition,” accompanied by an image of broken packaging, should not be aggregated as positive feedback. The proposed pipeline could reinterpret such content as a structured defect record involving product damage, packaging failure, delivery quality, or durability concerns. Aggregated outputs could then inform supplier evaluation, return-risk monitoring, product-quality improvement, and after-sales service management.
Nevertheless, cross-industry deployment should not be interpreted as direct empirical generalizability from the present airline case. The framework is transferable primarily at the architectural level. Each new domain would require a domain-specific problem ontology, representative multimodal training and validation data, revised prompt exemplars, recalibrated severity and confidence thresholds, and context-appropriate tolerance vectors. Human review should remain available for low-confidence, high-severity, or safety-critical cases. These adaptation requirements are especially important because sarcastic expression, service expectations, and zero-tolerance attributes may vary substantially across industries, platforms, languages, and cultural settings.
5.3. Limitations
Four limitations are particularly important for interpreting the present results.
- (1)
- Absence of external semantic ground truth for correction. LLM-SSCM is evaluated using expert assessment rather than an external gold-standard dataset of intended meaning, as no such dataset currently exists for multimodal sarcasm at the required scale. The 0.92 score reported in Section 4.2.2 should thus be interpreted as an expert-assessed measure of correction quality rather than strict accuracy. Future research could develop a held-out set in which review authors annotate their intended meaning or employ retrieval-augmented generation to ground LLM outputs in verified factual evidence.
- (2)
- Single-language, single-industry validation. The empirical study is limited to English-language airline reviews. Generalization across languages and domains, including products with varying defect structures and review cultures, remains for future investigation. Cross-cultural differences in sarcastic expression may necessitate culturally adapted correction prompts.
- (3)
- Designed tolerance structure. The contextual tolerance vectors described in Section 4 are derived from a constructed decision scenario (business travel versus leisure travel) using Analytic Hierarchy Process (AHP) and fuzzy linguistic ratings, rather than being estimated from observed booking or choice behavior. The sensitivity analysis offers directional evidence that the ranking is not determined by a single tolerance value; however, the tolerance structure itself remains a design parameter that future studies could estimate from behavioral data.
- (4)
- Local robustness of the designed parameterization. The main 20,000-trial Monte Carlo analysis adopted a simplified mismatch specification that excluded the boundary-softening term, context-adjustment coefficients, and travel-urgency factors. To assess whether this simplification affected the ranking results, a supplementary analysis was conducted using 5000 paired trials in which these parameters were retained. The complete and simplified specifications produced closely comparable rankings, with a mean Kendall rank correlation of 0.987. However, the additional context-adjustment and urgency parameters were perturbed only within ±10% of their designed baseline values. The results should therefore be interpreted as evidence of local robustness within the examined parameter ranges, rather than as an exhaustive characterization of global model behavior.
6. Conclusions
RDSF-MSD-SC is presented as an integrated framework that converts misleading multimodal reviews into decision-ready evidence for e-commerce applications. This framework comprises three explicitly interfaced modules: DFF-SDM, which identifies reviews where textual and visual content provide contradictory signals; LLM-SSCM, which reinterprets detected sarcastic reviews and produces structured negative evaluation units defined by problem dimension, severity, and correction confidence; and NCDM-CTMR, which aggregates the resulting severity matrix using context-specific tolerance vectors and a non-compensatory mismatch rule.
An empirical analysis of 8623 multimodal reviews from eight major U.S. passenger airlines, supplemented by public operational statistics, indicates that DFF-SDM achieves an F1-score of 0.86, surpassing InterCLIP-MEP and AdS-CLIP. LLM-SSCM achieves an expert-assessed correction quality of 0.92 across 500 sampled reviews. NCDM-CTMR identifies Delta as the most context-appropriate airline for time-sensitive business travel, exhibiting zero mismatch across all four service dimensions. Delta retains first place in 99.82% of 20,000 Monte Carlo simulations conducted under a simplified mismatch formulation (see Section 4.5). The ablation study shows that the LLM-driven correction module recovers negative evidence from approximately 87% of the 2847 expert-labeled sarcastic reviews, which is the maximum recoverable proportion under DFF-SDM’s recall of 0.87. This evidence is typically discarded or misclassified as positive by detection-only pipelines. Relative to WSM, TOPSIS, and VIKOR baselines, the proposed model provides greater threshold-sensitive differentiation among mid-tier alternatives while maintaining consensus on the top-ranked recommendation.
The primary contributions of this study are as follows: (i) an end-to-end pipeline that explicitly links multimodal sarcasm detection, LLM-driven structured semantic correction, and non-compensatory decision support, which are typically studied independently; (ii) a structured correction mechanism that converts implicit sarcastic content into quantifiable, dimension-specific evaluation units suitable for direct integration into decision models; and (iii) a contextual tolerance-based mismatch rule that penalizes tolerance breaches instead of averaging them, thereby reducing the masking effect associated with compensatory aggregation. Future research will extend the framework to cross-language and cross-industry settings, integrate external evidence retrieval into LLM-based correction to mitigate hallucination risk, and estimate contextual tolerance structures from observed behavioral and booking data rather than relying solely on expert elicitation.
Author Contributions
Conceptualization, H.H. and C.-C.W.; methodology, H.H.; software, H.H. and C.-C.W.; validation, H.H. and C.-C.W.; formal analysis, H.H. and C.-C.W.; investigation, H.H. and C.-C.W.; resources, C.-C.W.; data curation, H.H.; writing—original draft preparation, H.H.; writing—review and editing, C.-C.W.; visualization, H.H. and C.-C.W.; supervision, C.-C.W.; project administration, C.-C.W.; funding acquisition, C.-C.W. All authors have read and agreed to the published version of the manuscript.
Funding
This research received no external funding.
Institutional Review Board Statement
Not applicable.
Informed Consent Statement
Not applicable.
Data Availability Statement
The derived annotations, prompt templates, cross-validation fold assignments, model-evaluation outputs, and sensitivity-analysis materials used in this study are available in the public GitHub repository at https://github.com/haohongze/RDSF-MSD-SC-Data (accessed on 23 July 2026). Raw review text and user-uploaded images are not redistributed where restricted by the source platforms’ terms of use. All experiments were implemented in Python 3.10. Key dependencies included PyTorch 2.1.0, Transformers 4.38.0 (Hugging Face), spaCy 3.7.2, scikit-learn 1.4.0, and NumPy 1.26.0. The GPT-4o API snapshot used was gpt-4o-2024-08-06.
Conflicts of Interest
The authors declare no conflict of interest.
References
- Cai, Y.; Cai, H.; Wan, X. Multi-modal sarcasm detection in Twitter with hierarchical fusion model. In Proceedings of the 57th Annual Meeting of the Association for Computational Linguistics, Florence, Italy, 28 July–2 August 2019; pp. 2506–2515. [Google Scholar] [CrossRef] [Scilit]
- Mustak, M.; Salminen, J.; Plé, L.; Wirtz, J. Artificial intelligence in marketing: Topic modeling, scientometric analysis, and research agenda. J. Bus. Res. 2021, 124, 389–404. [Google Scholar] [CrossRef] [Scilit]
- Pang, B.; Lee, L. Opinion mining and sentiment analysis. Found. Trends Inf. Retr. 2008, 2, 1–135. [Google Scholar] [CrossRef] [Scilit]
- Zhi, L.; Ha, H.-Y. Evolving consumer preferences: The role of attribute shifts in online travel agency satisfaction and loyalty. J. Theor. Appl. Electron. Commer. Res. 2024, 19, 2880–2895. [Google Scholar] [CrossRef] [Scilit]
- Gao, H.; Zhan, M. Understanding factors influencing click-through decision in mobile OTA search engine systems. J. Theor. Appl. Electron. Commer. Res. 2023, 18, 634–655. [Google Scholar] [CrossRef] [Scilit]
- Wang, L.; Che, G.; Hu, J.; Chen, L. Online review helpfulness and information overload: The roles of text, image, and video elements. J. Theor. Appl. Electron. Commer. Res. 2024, 19, 1243–1266. [Google Scholar] [CrossRef] [Scilit]
- Ahn, Y.; Lee, J. The impact of online reviews on consumers’ purchase intentions: Examining the social influence of online reviews, group similarity, and self-construal. J. Theor. Appl. Electron. Commer. Res. 2024, 19, 1060–1078. [Google Scholar] [CrossRef] [Scilit]
- Joung, J.; Kim, K.-H.; Kim, K. Data-driven approach to dual service failure monitoring from negative online reviews: Managerial perspective. SAGE Open 2021, 11, 2158244020988249. [Google Scholar] [CrossRef] [Scilit]
- Bi, J.-W.; Liu, Y.; Fan, Z.-P. Modelling customer satisfaction from online reviews using ensemble neural network and effect-based Kano model. Int. J. Prod. Res. 2019, 57, 7068–7088. [Google Scholar] [CrossRef] [Scilit]
- Cambria, E.; Schuller, B.; Xia, Y.; Havasi, C. New avenues in opinion mining and sentiment analysis. IEEE Intell. Syst. 2013, 28, 15–21. [Google Scholar] [CrossRef] [Scilit]
- Davidov, D.; Tsur, O.; Rappoport, A. Semi-supervised recognition of sarcasm in Twitter and Amazon. In Proceedings of the Fourteenth Conference on Computational Natural Language Learning, Uppsala, Sweden, 15–16 July 2010; pp. 107–116. [Google Scholar]
- Liu, Y.; Chi, M.; Sun, Q. Sarcasm detection in hotel reviews: A multimodal deep learning approach. J. Hosp. Tour. Technol. 2024, 15, 519–533. [Google Scholar] [CrossRef] [Scilit]
- Eke, C.I.; Norman, A.A.; Shuib, L.; Nweke, H.F. Sarcasm identification in textual data: Systematic review, research challenges and open directions. Artif. Intell. Rev. 2020, 53, 4215–4258. [Google Scholar] [CrossRef] [Scilit]
- Joshi, A.; Bhattacharyya, P.; Carman, M.J. Automatic sarcasm detection: A survey. ACM Comput. Surv. 2017, 50, 73. [Google Scholar] [CrossRef] [Scilit]
- Hwang, C.-L.; Yoon, K. Multiple Attribute Decision Making: Methods and Applications: A State-of-the-Art Survey; Lecture Notes in Economics and Mathematical Systems; Springer: Berlin/Heidelberg, Germany, 1981; Volume 186. [Google Scholar] [CrossRef] [Scilit]
- Opricovic, S.; Tzeng, G.-H. Compromise solution by MCDM methods: A comparative analysis of VIKOR and TOPSIS. Eur. J. Oper. Res. 2004, 156, 445–455. [Google Scholar] [CrossRef] [Scilit]
- Castro, S.; Hazarika, D.; Pérez-Rosas, V.; Zimmermann, R.; Mihalcea, R.; Poria, S. Towards multimodal sarcasm detection (an obviously perfect paper). In Proceedings of the 57th Annual Meeting of the Association for Computational Linguistics, Florence, Italy, 28 July–2 August 2019; pp. 4619–4629. [Google Scholar] [CrossRef] [Scilit]
- Schifanella, R.; de Juan, P.; Tetreault, J.; Cao, L. Detecting sarcasm in multimodal social platforms. In Proceedings of the 24th ACM International Conference on Multimedia, Amsterdam, The Netherlands, 15–19 October 2016; pp. 1136–1145. [Google Scholar] [CrossRef] [Scilit]
- Chen, J.; Yu, H.; Huang, S.; Liu, S.; Zhang, L. InterCLIP-MEP: Interactive CLIP and memory-enhanced predictor for multi-modal sarcasm detection. ACM Trans. Multimed. Comput. Commun. Appl. 2026, 22, 43. [Google Scholar] [CrossRef] [Scilit]
- Jana, S.; Danayak, S.; Sanasam, R.S. Adapter-state sharing CLIP for parameter-efficient multimodal sarcasm detection. In Proceedings of the 2026 IEEE International Conference on Acoustics, Speech and Signal Processing—ICASSP 2026, Barcelona, Spain, 4–8 May 2026; pp. 13187–13191. [Google Scholar] [CrossRef] [Scilit]
- Zuheros, C.; Martínez-Cámara, E.; Herrera-Viedma, E.; Herrera, F. Sentiment analysis based multi-person multi-criteria decision making methodology using natural language processing and deep learning for smarter decision aid: Case study of restaurant choice using TripAdvisor reviews. Inf. Fusion 2021, 68, 22–36. [Google Scholar] [CrossRef] [Scilit]
- Pasi, G.; Viviani, M.; Carton, A. A multi-criteria decision making approach based on the Choquet integral for assessing the credibility of user-generated content. Inf. Sci. 2019, 503, 574–588. [Google Scholar] [CrossRef] [Scilit]
- Feng, W.; Ren, W. Impoliteness in negative online consumer reviews: A cross-language and cross-sector comparison. Intercult. Pragmat. 2020, 17, 1–25. [Google Scholar] [CrossRef] [Scilit]
- de Gregorio, F.; Fox, A.K.; Yoon, H.J. Pseudo-reviews: Conceptualization and consumer effects of a new online phenomenon. Comput. Hum. Behav. 2021, 114, 106545. [Google Scholar] [CrossRef] [Scilit]
- Zifla, E.; Schuff, D.; Mudambi, S.M.; Wattal, S. Not just for fun: The effect of pseudo-reviews on consumer behavior. Comput. Hum. Behav. 2024, 155, 108166. [Google Scholar] [CrossRef] [Scilit]
- Raoofpanah, I.; Groening, C.; Jewell, R. How usefulness and humor in negative online reviews affect review platform usage. J. Consum. Mark. 2025, 42, 614–629. [Google Scholar] [CrossRef] [Scilit]
- Sarsam, S.M.; Al-Samarraie, H.; Alzahrani, A.I.; Wright, B. Sarcasm detection using machine learning algorithms in Twitter: A systematic review. Int. J. Mark. Res. 2020, 62, 578–598. [Google Scholar] [CrossRef] [Scilit]
- Zhang, M.; Zhang, Y.; Fu, G. Tweet sarcasm detection using deep neural network. In Proceedings of the COLING 2016, the 26th International Conference on Computational Linguistics: Technical Papers, Osaka, Japan, 11–16 December 2016; pp. 2449–2460. [Google Scholar]
- Tay, Y.; Luu, A.T.; Hui, S.C.; Su, J. Reasoning with sarcasm by reading in-between. In Proceedings of the 56th Annual Meeting of the Association for Computational Linguistics, Melbourne, Australia, 15–20 July 2018; pp. 1010–1020. [Google Scholar] [CrossRef] [Scilit]
- Bamman, D.; Smith, N.A. Contextualized sarcasm detection on Twitter. In Proceedings of the Ninth International AAAI Conference on Web and Social Media, Oxford, UK, 26–29 May 2015; Volume 9, pp. 574–577. [Google Scholar] [CrossRef] [Scilit]
- Radford, A.; Kim, J.W.; Hallacy, C.; Ramesh, A.; Goh, G.; Agarwal, S.; Sastry, G.; Askell, A.; Mishkin, P.; Clark, J.; et al. Learning transferable visual models from natural language supervision. In Proceedings of the 38th International Conference on Machine Learning, Virtual, 18–24 July 2021; Volume 139, pp. 8748–8763. [Google Scholar]
- Tang, B.; Lin, B.; Yan, H.; Li, S. Leveraging generative large language models with visual instruction and demonstration retrieval for multimodal sarcasm detection. In Proceedings of the 2024 Conference of the North American Chapter of the Association for Computational Linguistics: Human Language Technologies, Volume 1: Long Papers, Mexico City, Mexico, 21 June 2024; pp. 1732–1742. [Google Scholar] [CrossRef] [Scilit]
- Chen, Z.; Lin, H.; Luo, Z.; Cheng, M.; Ma, J.; Chen, G. CofiPara: A coarse-to-fine paradigm for multimodal sarcasm target identification with large multimodal models. In Proceedings of the 62nd Annual Meeting of the Association for Computational Linguistics, Volume 1: Long Papers, Bangkok, Thailand, 11–16 August 2024; pp. 9663–9687. [Google Scholar] [CrossRef] [Scilit]
- Ouyang, K.; Liu, Y.; Li, S.; Liu, Y.; Zhou, H.; Meng, F.; Zhou, J.; Sun, X. PunchBench: Benchmarking MLLMs in multimodal punchline comprehension. In Proceedings of the 63rd Annual Meeting of the Association for Computational Linguistics, Volume 1: Long Papers, Vienna, Austria, 27 July–1 August 2025; pp. 986–1008. [Google Scholar] [CrossRef] [Scilit]
- Ji, Z.; Lee, N.; Frieske, R.; Yu, T.; Su, D.; Xu, Y.; Ishii, E.; Bang, Y.J.; Madotto, A.; Fung, P. Survey of hallucination in natural language generation. ACM Comput. Surv. 2023, 55, 248. [Google Scholar] [CrossRef] [Scilit]
- Huang, L.; Yu, W.; Ma, W.; Zhong, W.; Feng, Z.; Wang, H.; Chen, Q.; Peng, W.; Feng, X.; Qin, B.; et al. A survey on hallucination in large language models: Principles, taxonomy, challenges, and open questions. ACM Trans. Inf. Syst. 2025, 43, 42. [Google Scholar] [CrossRef] [Scilit]
- Sahoo, P.; Meharia, P.; Ghosh, A.; Saha, S.; Jain, V.; Chadha, A. A comprehensive survey of hallucination in large language, image, video and audio foundation models. In Findings of the Association for Computational Linguistics: EMNLP 2024; Association for Computational Linguistics: Stroudsburg, PA, USA, 2024; pp. 11709–11724. [Google Scholar] [CrossRef] [Scilit]
- Korfiatis, N.; Stamolampros, P.; Kourouthanassis, P.; Sagiadinos, V. Measuring service quality from unstructured data: A topic modeling application on airline passengers’ online reviews. Expert Syst. Appl. 2019, 116, 472–486. [Google Scholar] [CrossRef] [Scilit]
- Yager, R.R.; Kacprzyk, J. (Eds.) The Ordered Weighted Averaging Operators: Theory and Applications; Springer: Boston, MA, USA, 1997. [Google Scholar]
- Figueira, J.; Mousseau, V.; Roy, B. ELECTRE methods. In Multiple Criteria Decision Analysis: State of the Art Surveys; Figueira, J., Greco, S., Ehrgott, M., Eds.; Springer: New York, NY, USA, 2005; pp. 133–153. [Google Scholar] [CrossRef] [Scilit] [PubMed]
- Greco, S.; Słowiński, R.; Wallenius, J. Fifty years of multiple criteria decision analysis: From classical methods to robust ordinal regression. Eur. J. Oper. Res. 2025, 323, 351–377. [Google Scholar] [CrossRef] [Scilit]
- Liu, P.; Teng, F. Probabilistic linguistic TODIM method for selecting products through online product reviews. Inf. Sci. 2019, 485, 441–455. [Google Scholar] [CrossRef] [Scilit]
- Gomes, L.F.A.M.; Lima, M.M.P.P. TODIM: Basics and application to multicriteria ranking of projects with environmental impacts. Found. Comput. Decis. Sci. 1991, 16, 113–127. [Google Scholar]
- Roy, B. The outranking approach and the foundations of ELECTRE methods. Theory Decis. 1991, 31, 49–73. [Google Scholar] [CrossRef] [Scilit]
- Liu, Y.; Ott, M.; Goyal, N.; Du, J.; Joshi, M.; Chen, D.; Levy, O.; Lewis, M.; Zettlemoyer, L.; Stoyanov, V. RoBERTa: A robustly optimized BERT pretraining approach. arXiv 2019, arXiv:1907.11692. [Google Scholar]
- Socher, R.; Perelygin, A.; Wu, J.; Chuang, J.; Manning, C.D.; Ng, A.; Potts, C. Recursive deep models for semantic compositionality over a sentiment treebank. In Proceedings of the 2013 Conference on Empirical Methods in Natural Language Processing, Seattle, WA, USA, 18–21 October 2013; pp. 1631–1642. [Google Scholar]
- Goodfellow, I.J.; Erhan, D.; Carrier, P.L.; Courville, A.; Mirza, M.; Hamner, B.; Cukierski, W.; Tang, Y.; Thaler, D.; Lee, D.-H.; et al. Challenges in representation learning: A report on three machine learning contests. Neural Netw. 2015, 64, 59–63. [Google Scholar] [CrossRef] [Scilit] [PubMed]
- You, Q.; Luo, J.; Jin, H.; Yang, J. Robust image sentiment analysis using progressively trained and domain transferred deep networks. In Proceedings of the Twenty-Ninth AAAI Conference on Artificial Intelligence, Austin, TX, USA, 25–30 January 2015; Volume 29, pp. 381–388. [Google Scholar] [CrossRef] [Scilit]
- Kingma, D.P.; Ba, J. Adam: A method for stochastic optimization. In Proceedings of the 3rd International Conference on Learning Representations (ICLR 2015), San Diego, CA, USA, 7–9 May 2015. [Google Scholar]
- Saaty, T.L. The Analytic Hierarchy Process: Planning, Priority Setting, Resource Allocation; McGraw-Hill: New York, NY, USA, 1980. [Google Scholar]
- Reimers, N.; Gurevych, I. Sentence-BERT: Sentence embeddings using Siamese BERT-networks. In Proceedings of the 2019 Conference on Empirical Methods in Natural Language Processing and the 9th International Joint Conference on Natural Language Processing, Hong Kong, China, 3–7 November 2019; pp. 3982–3992. [Google Scholar] [CrossRef] [Scilit]
- Rousseeuw, P.J. Silhouettes: A graphical aid to the interpretation and validation of cluster analysis. J. Comput. Appl. Math. 1987, 20, 53–65. [Google Scholar] [CrossRef] [Scilit]
- Fleiss, J.L. Measuring nominal scale agreement among many raters. Psychol. Bull. 1971, 76, 378–382. [Google Scholar] [CrossRef] [Scilit]
- Landis, J.R.; Koch, G.G. The measurement of observer agreement for categorical data. Biometrics 1977, 33, 159–174. [Google Scholar] [CrossRef] [Scilit]
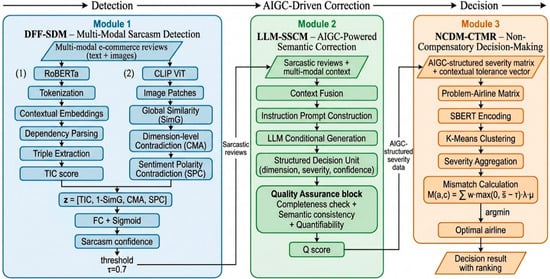
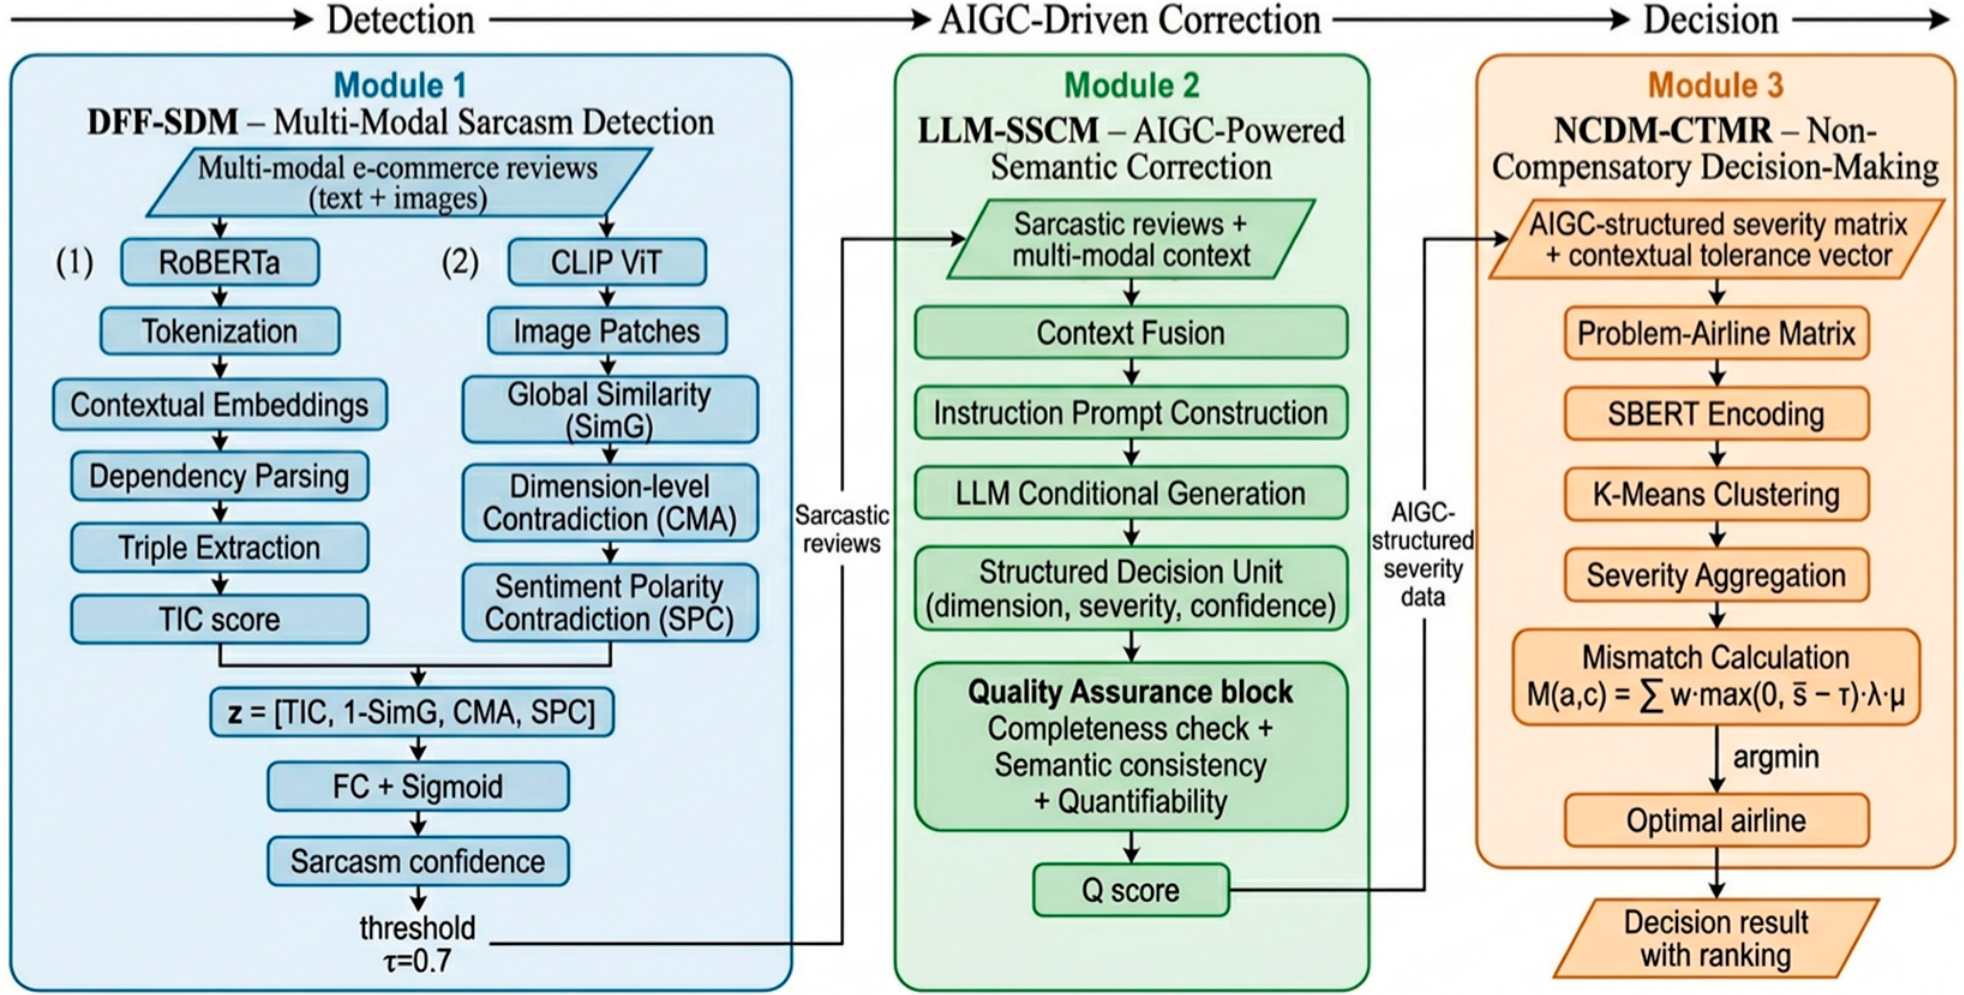
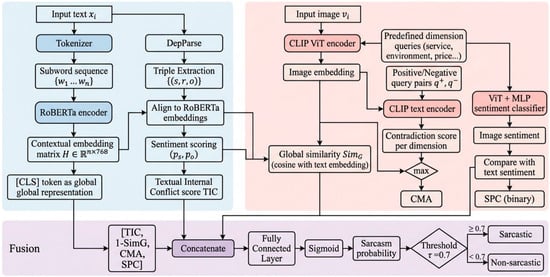
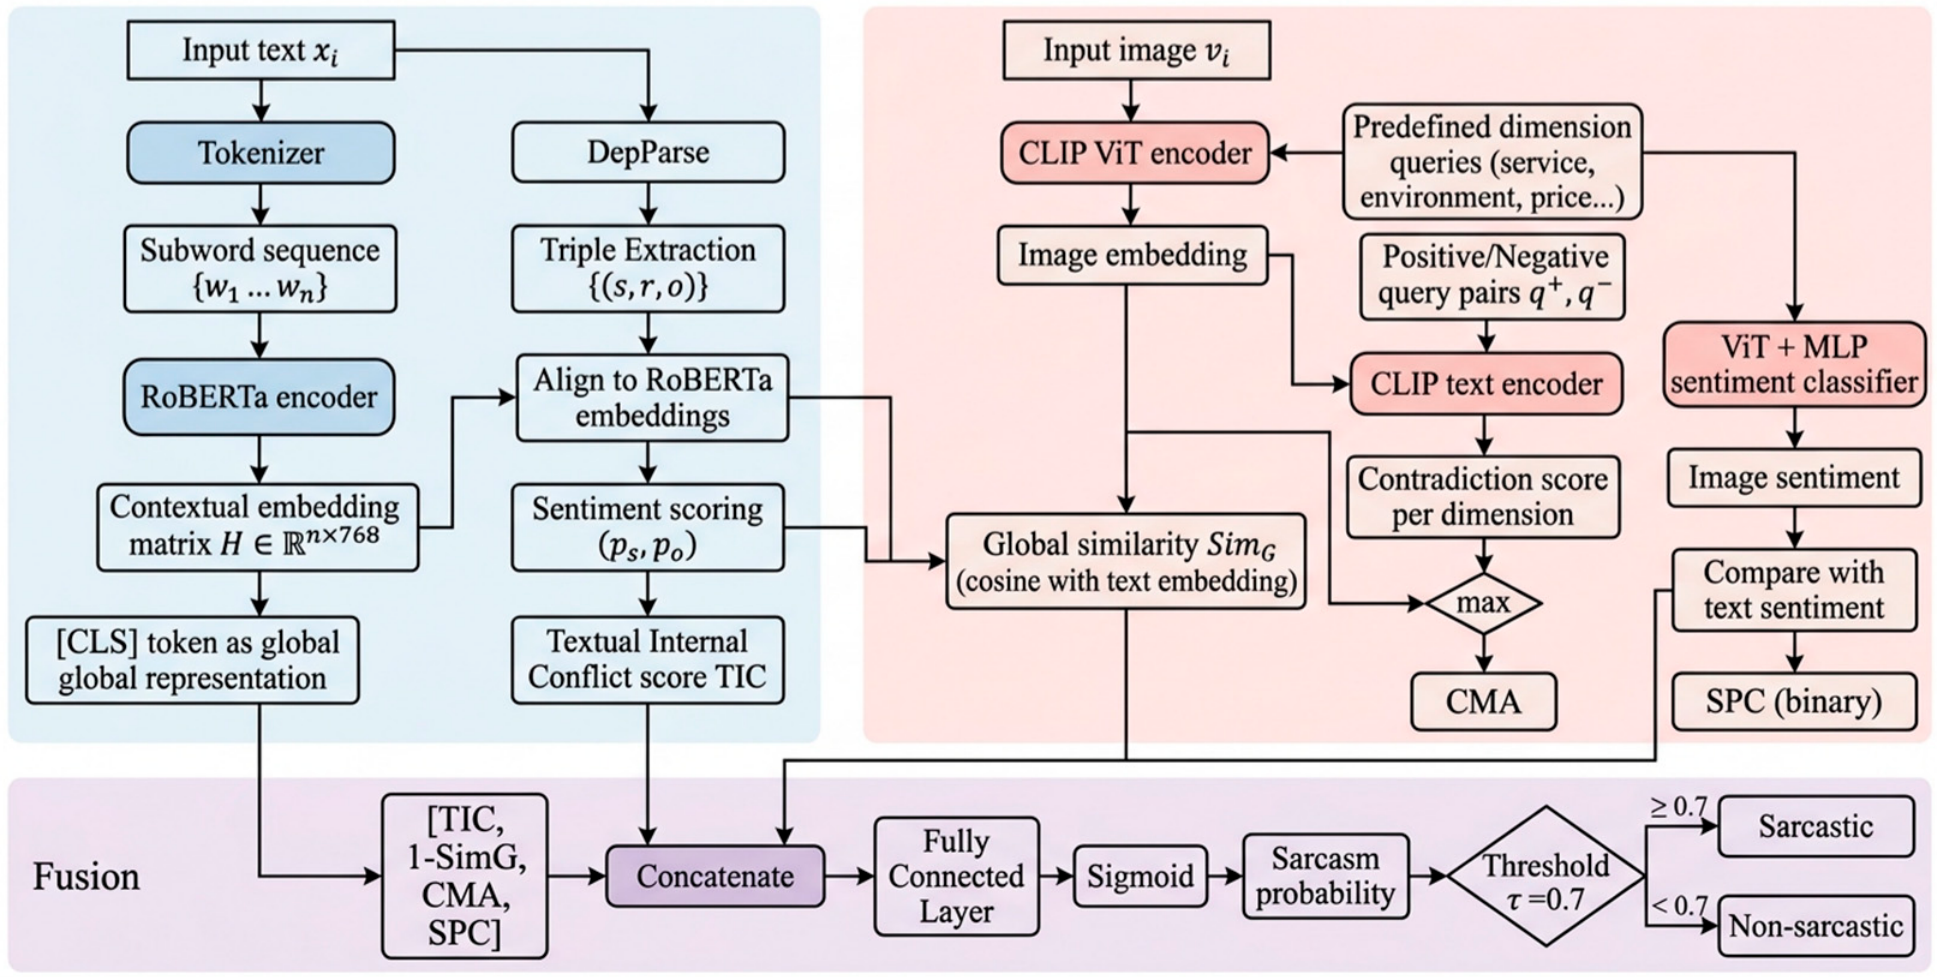
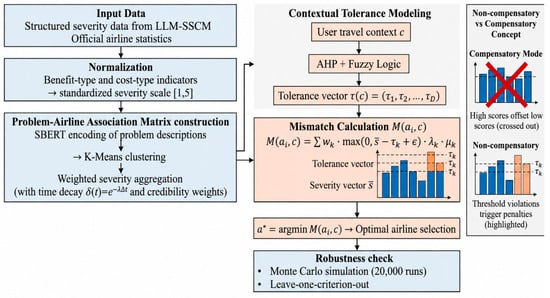
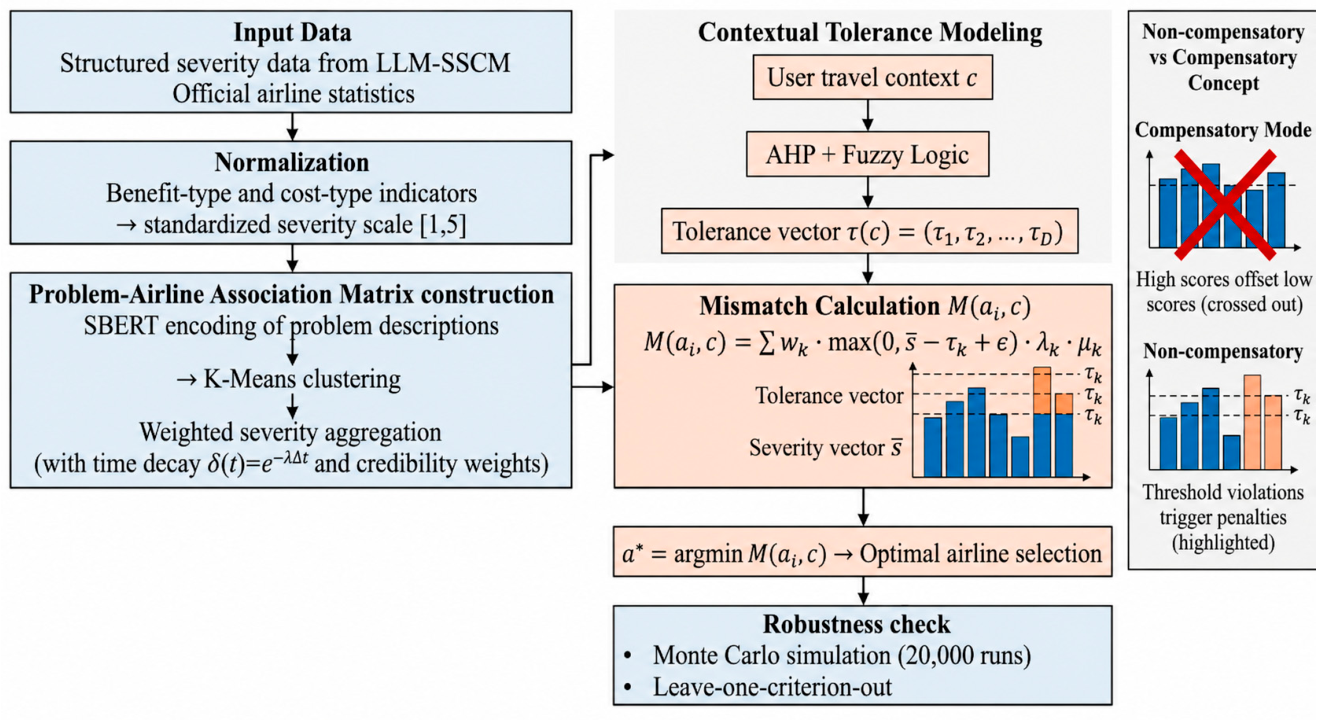
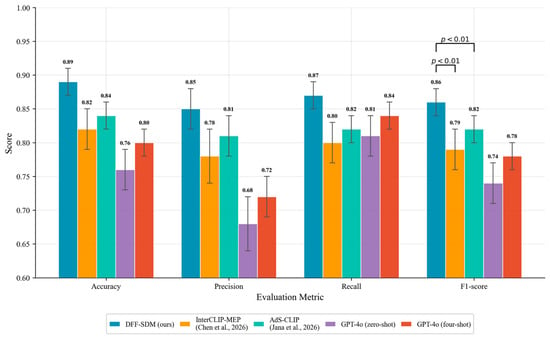
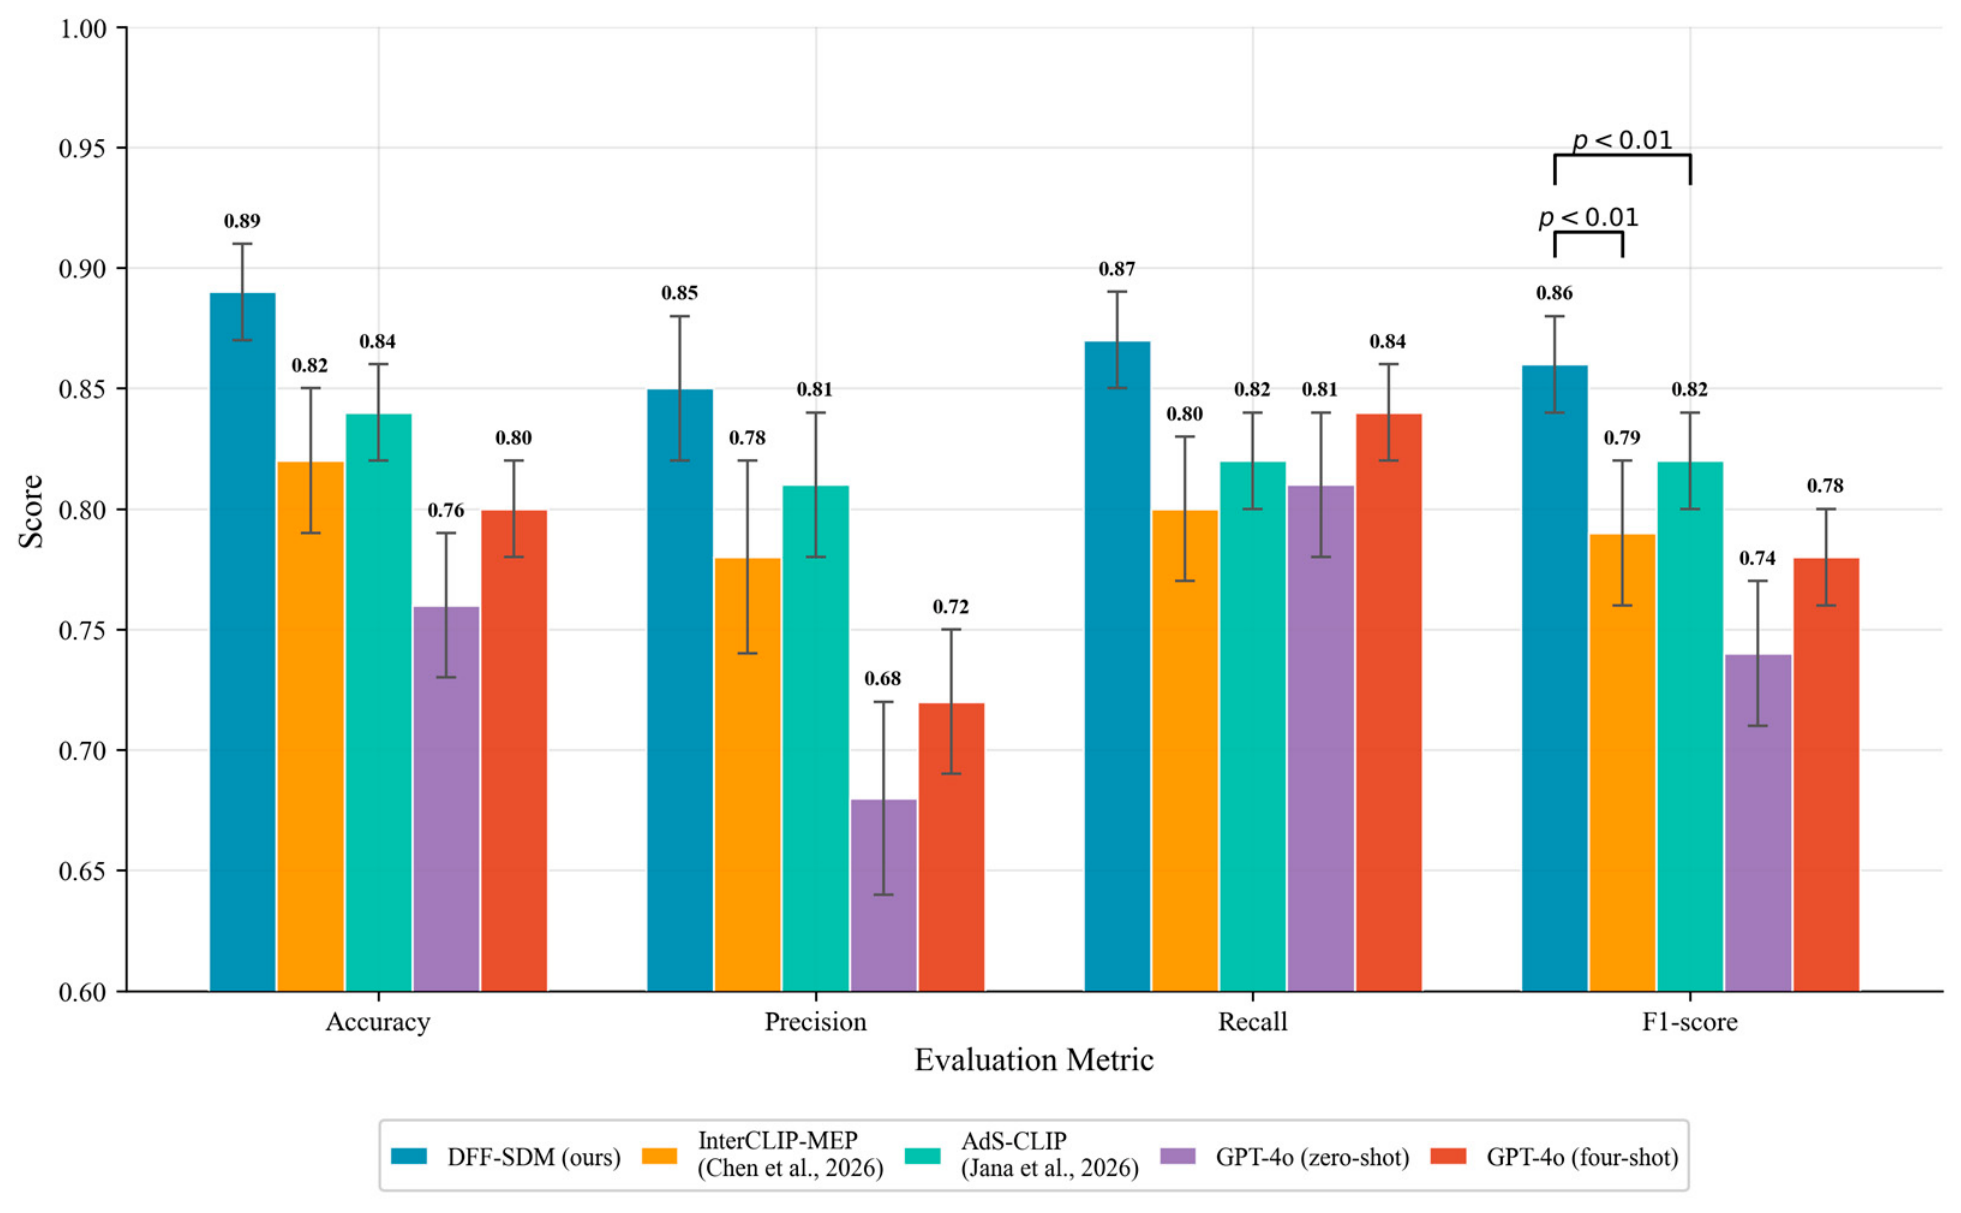
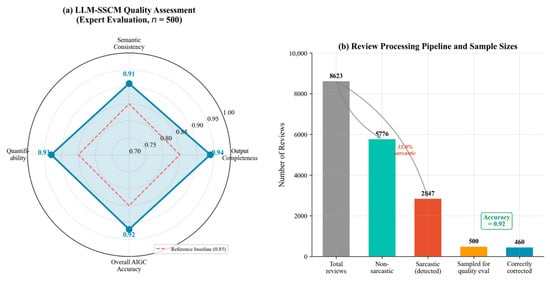
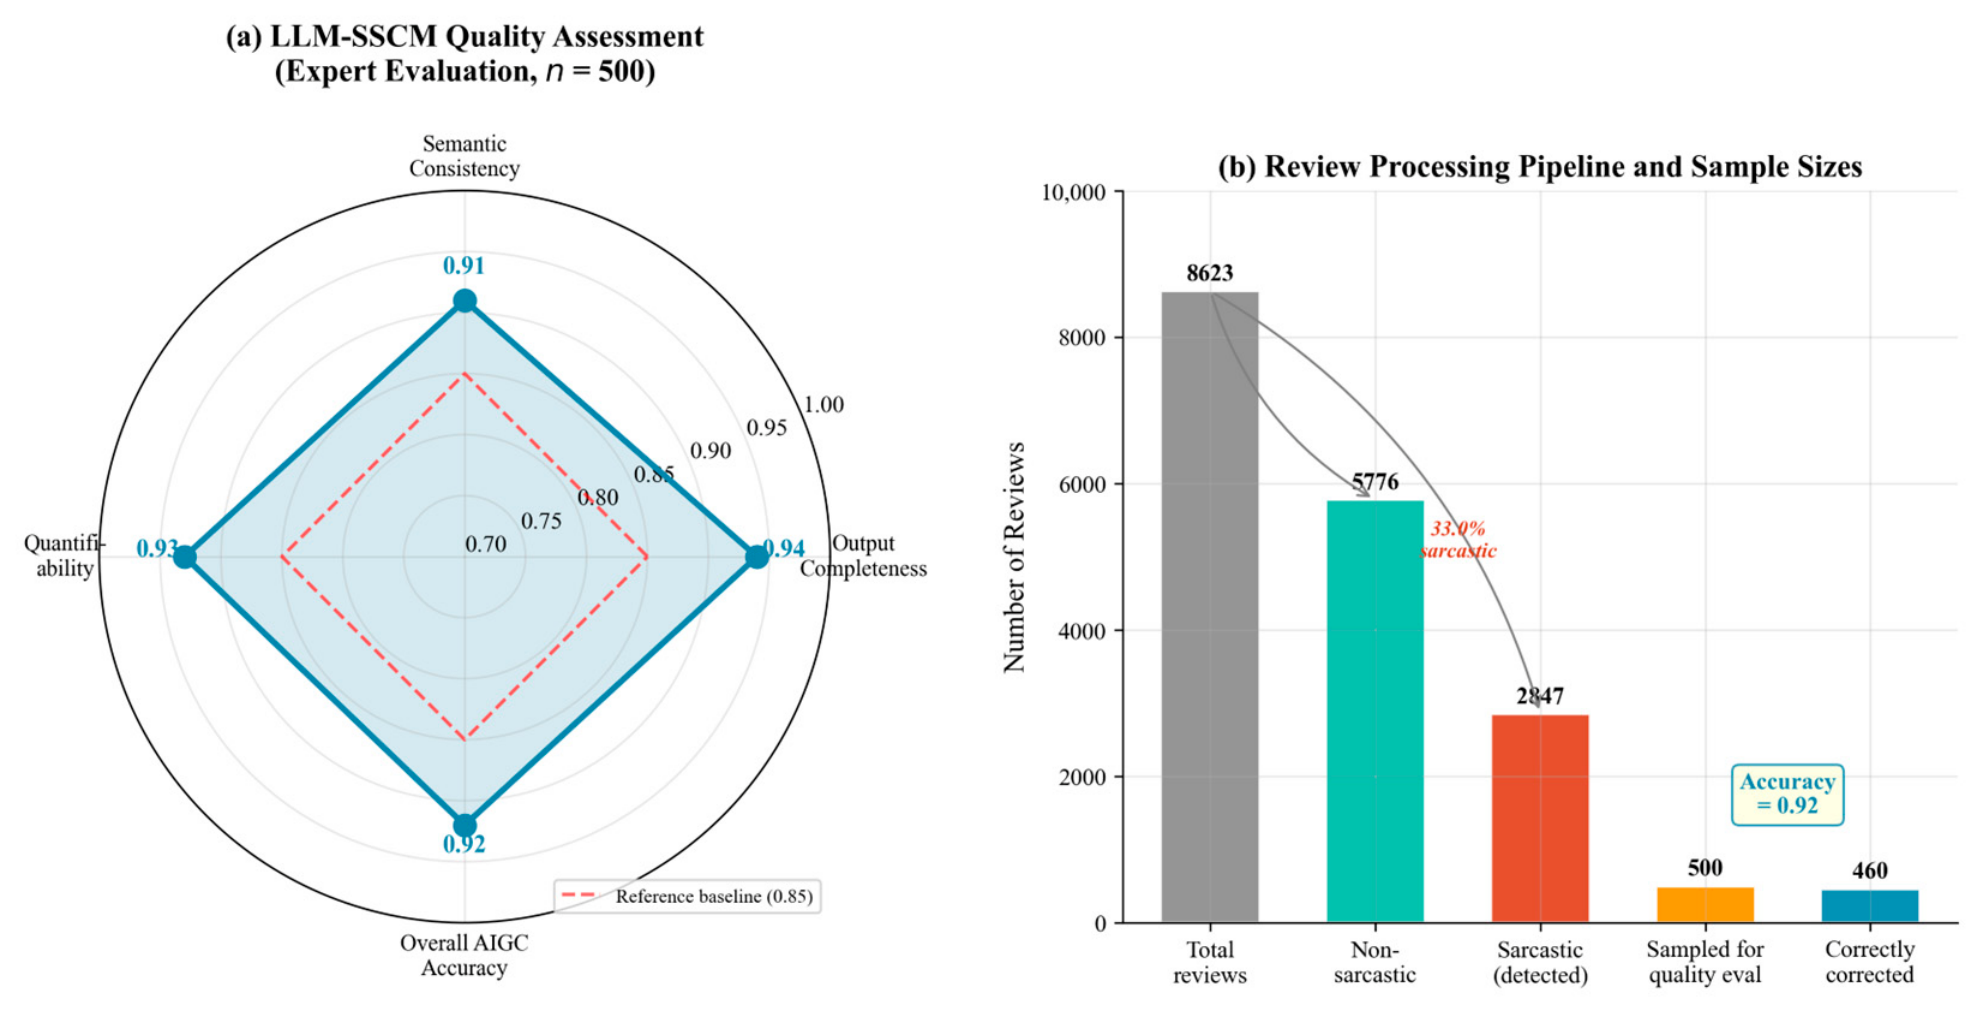
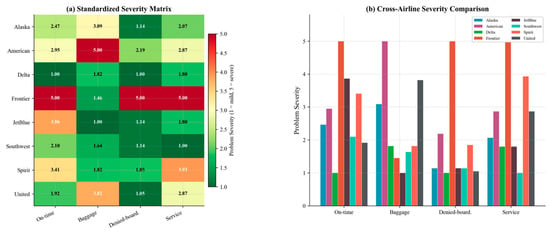
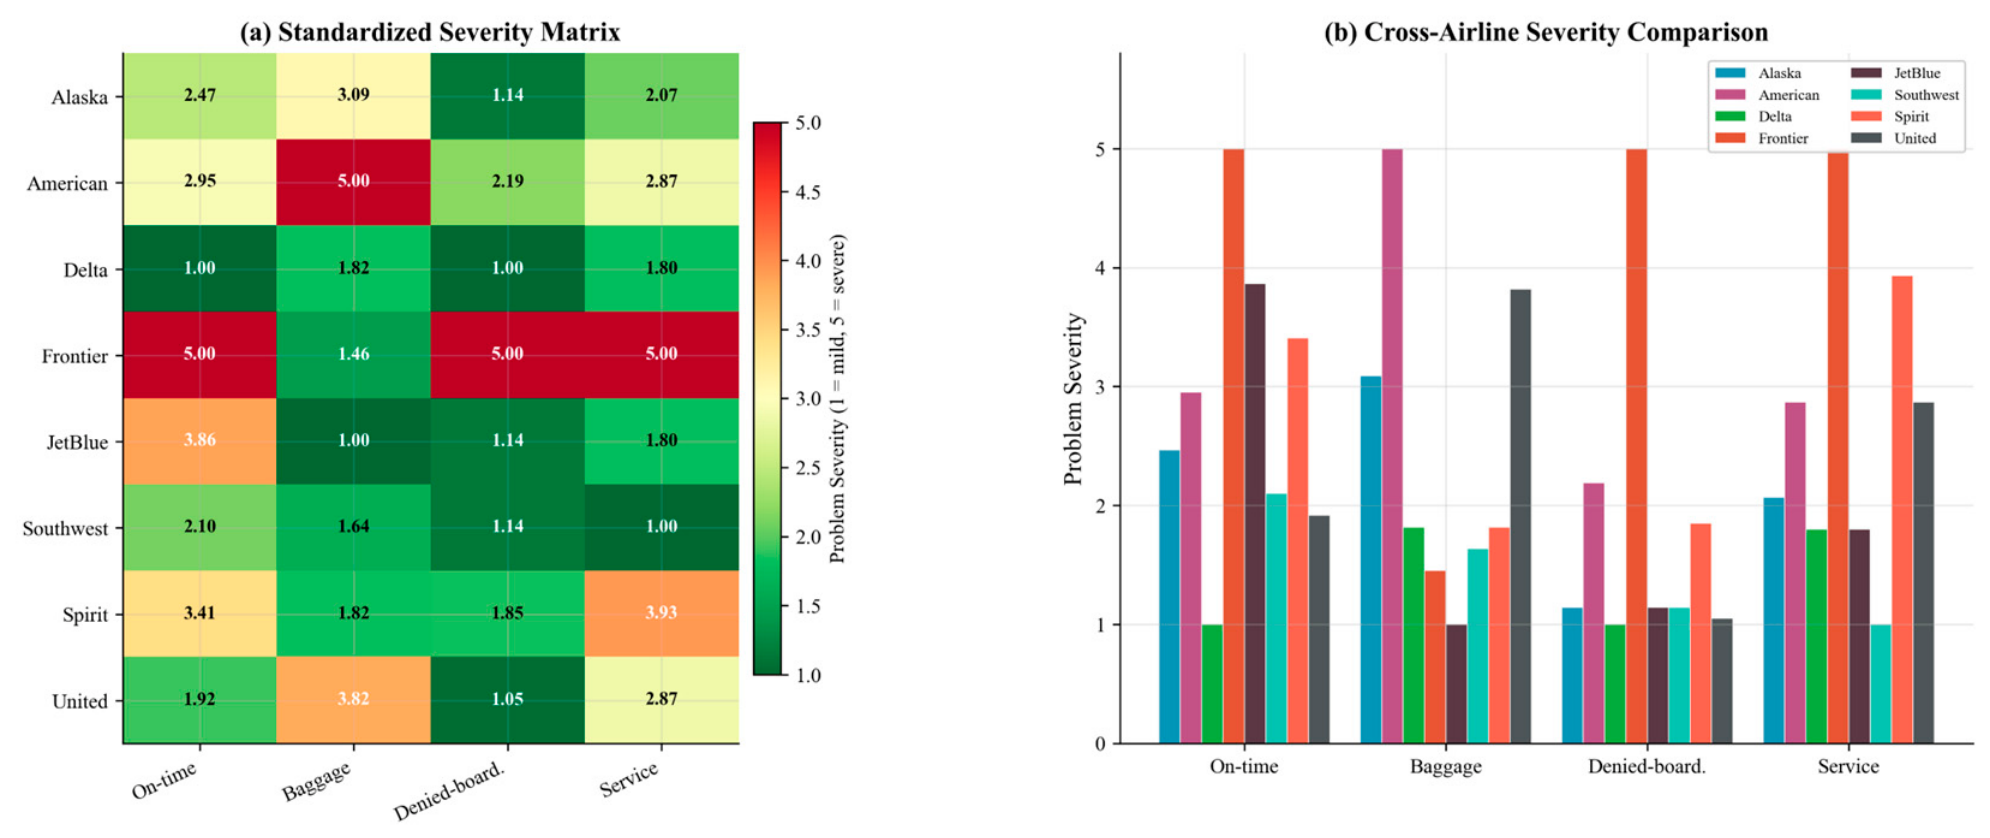
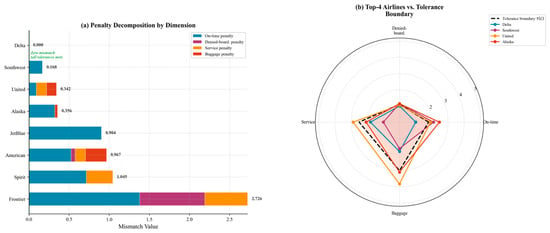
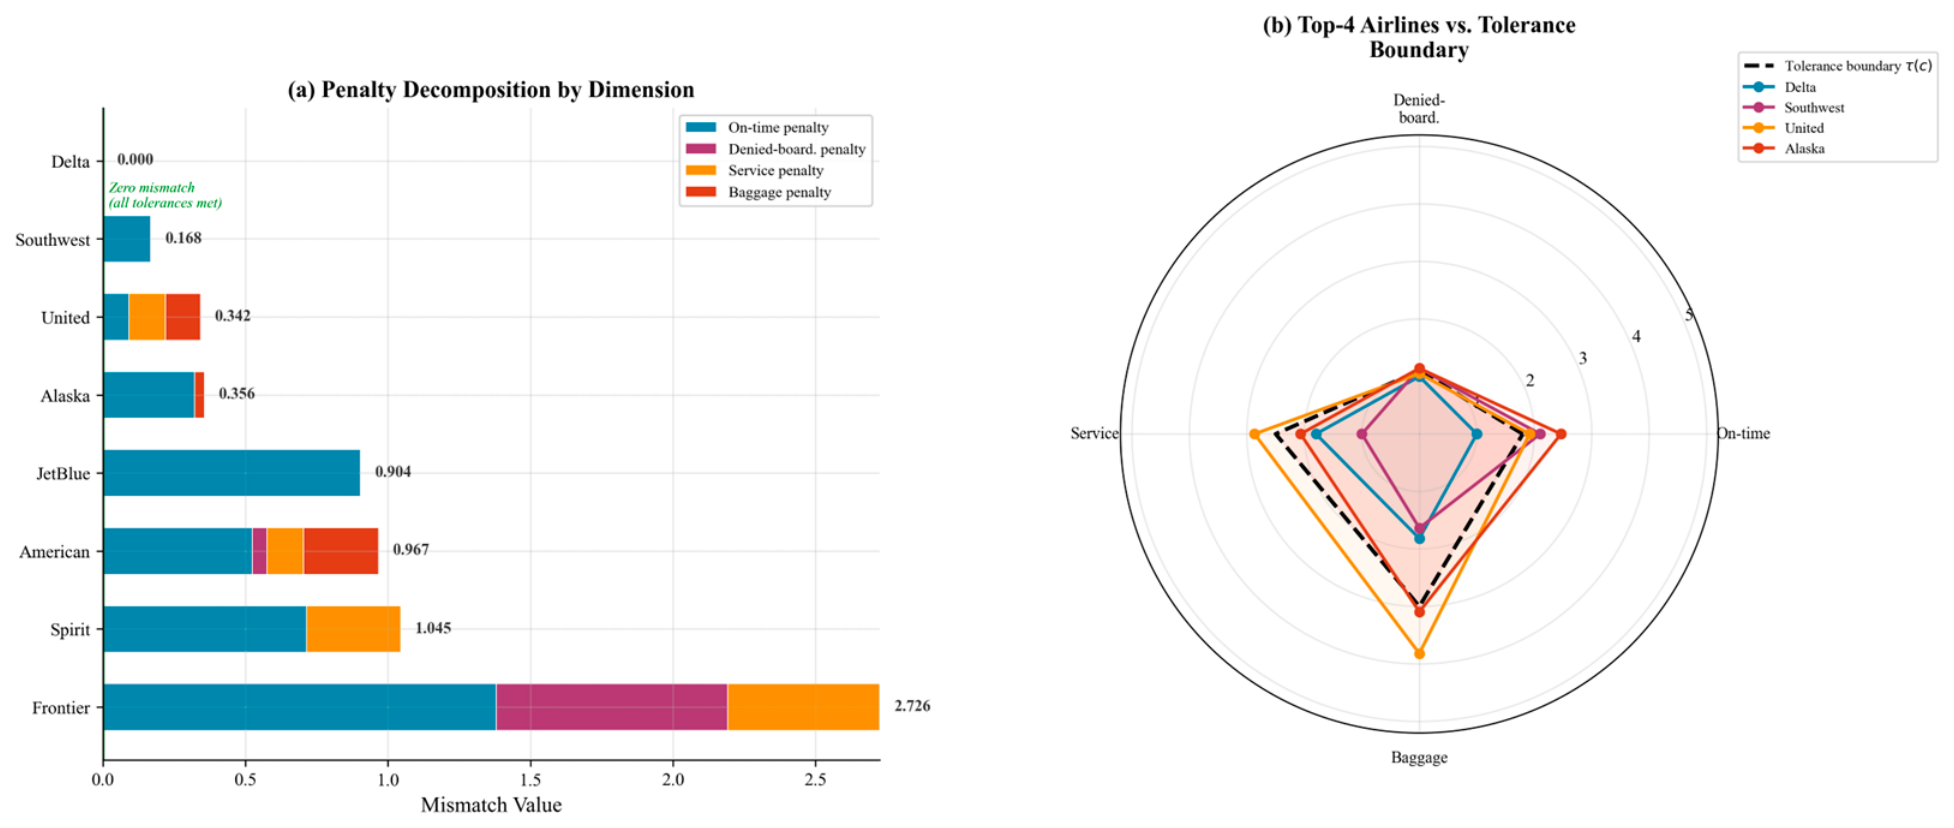
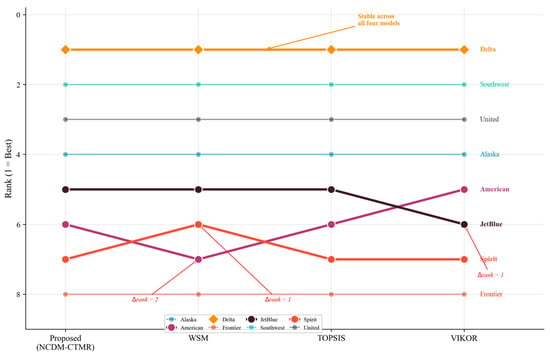
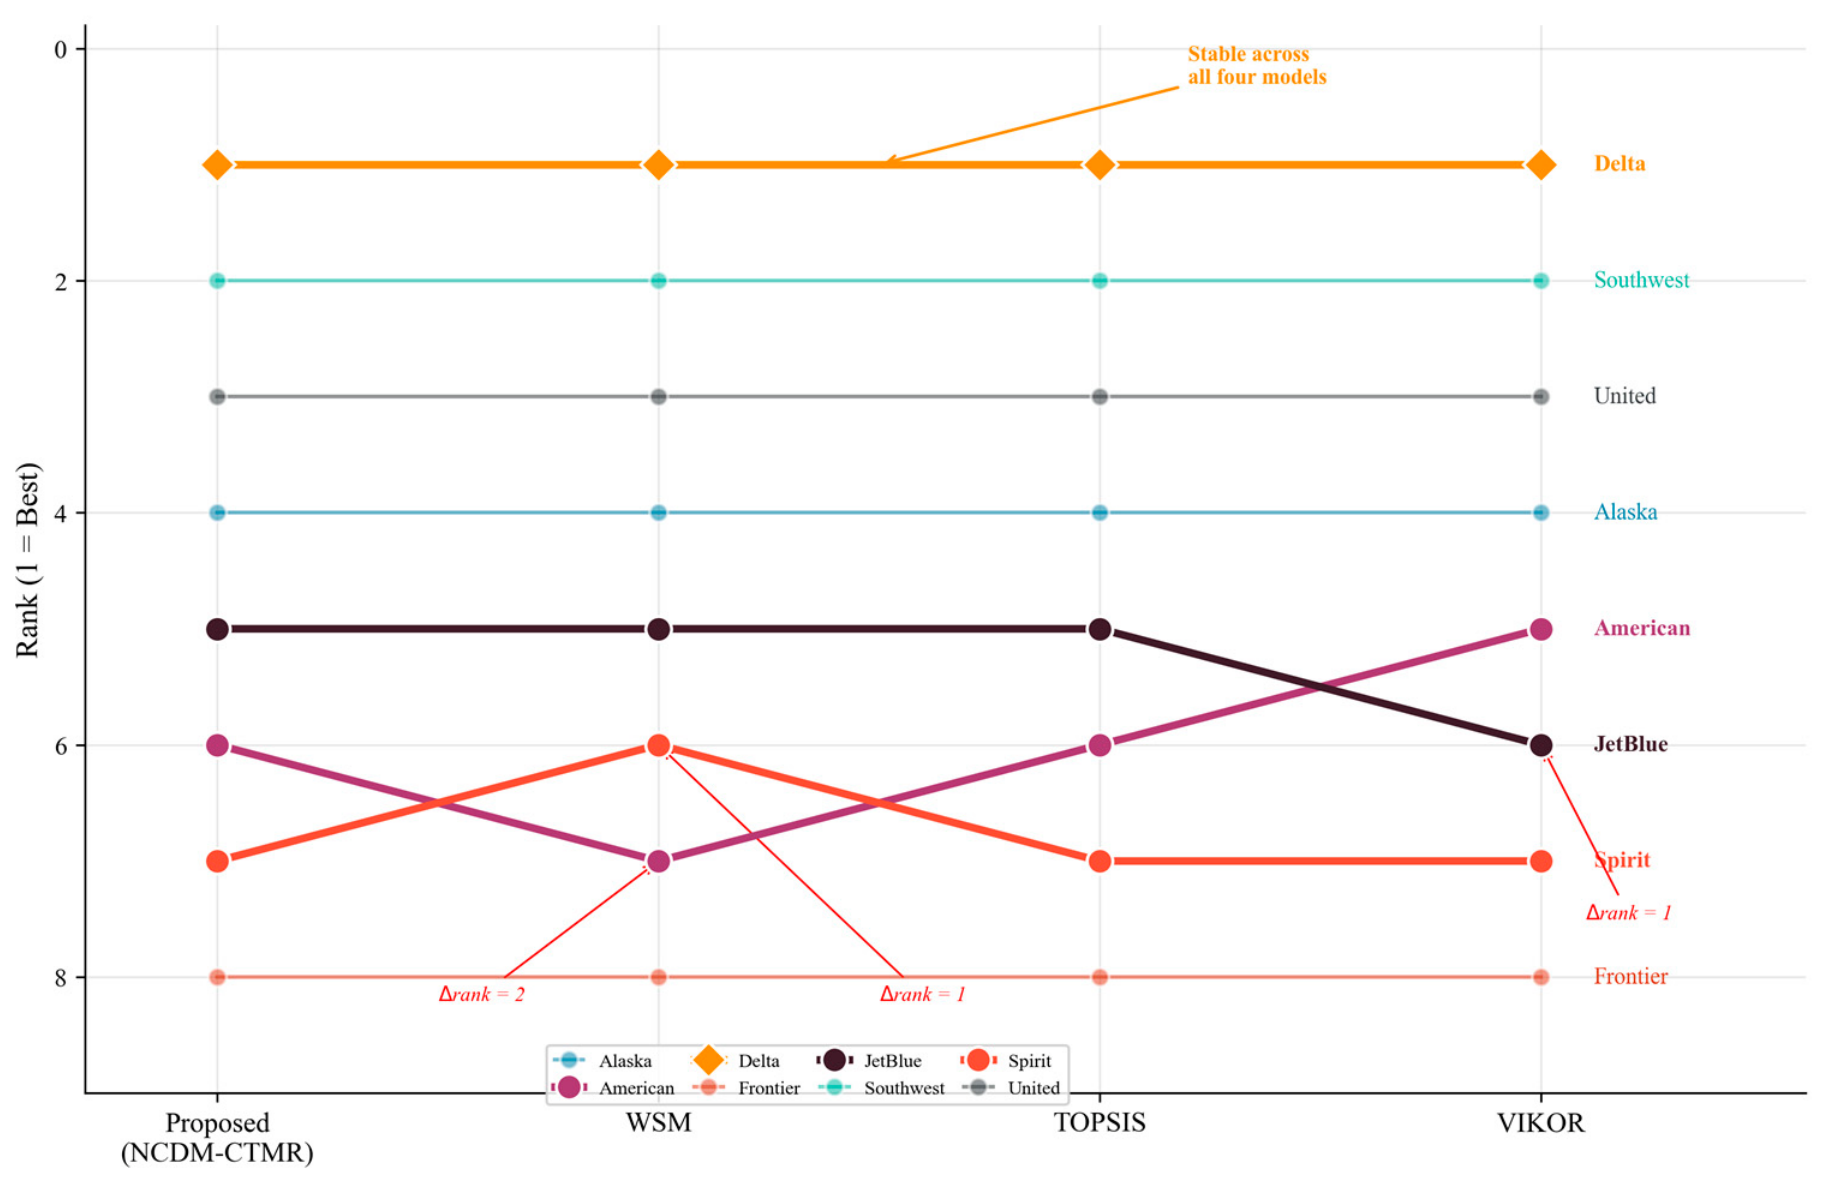
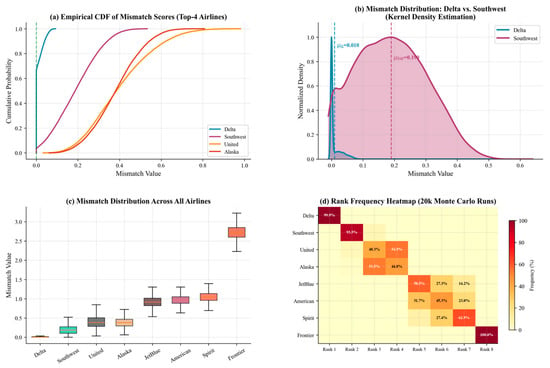
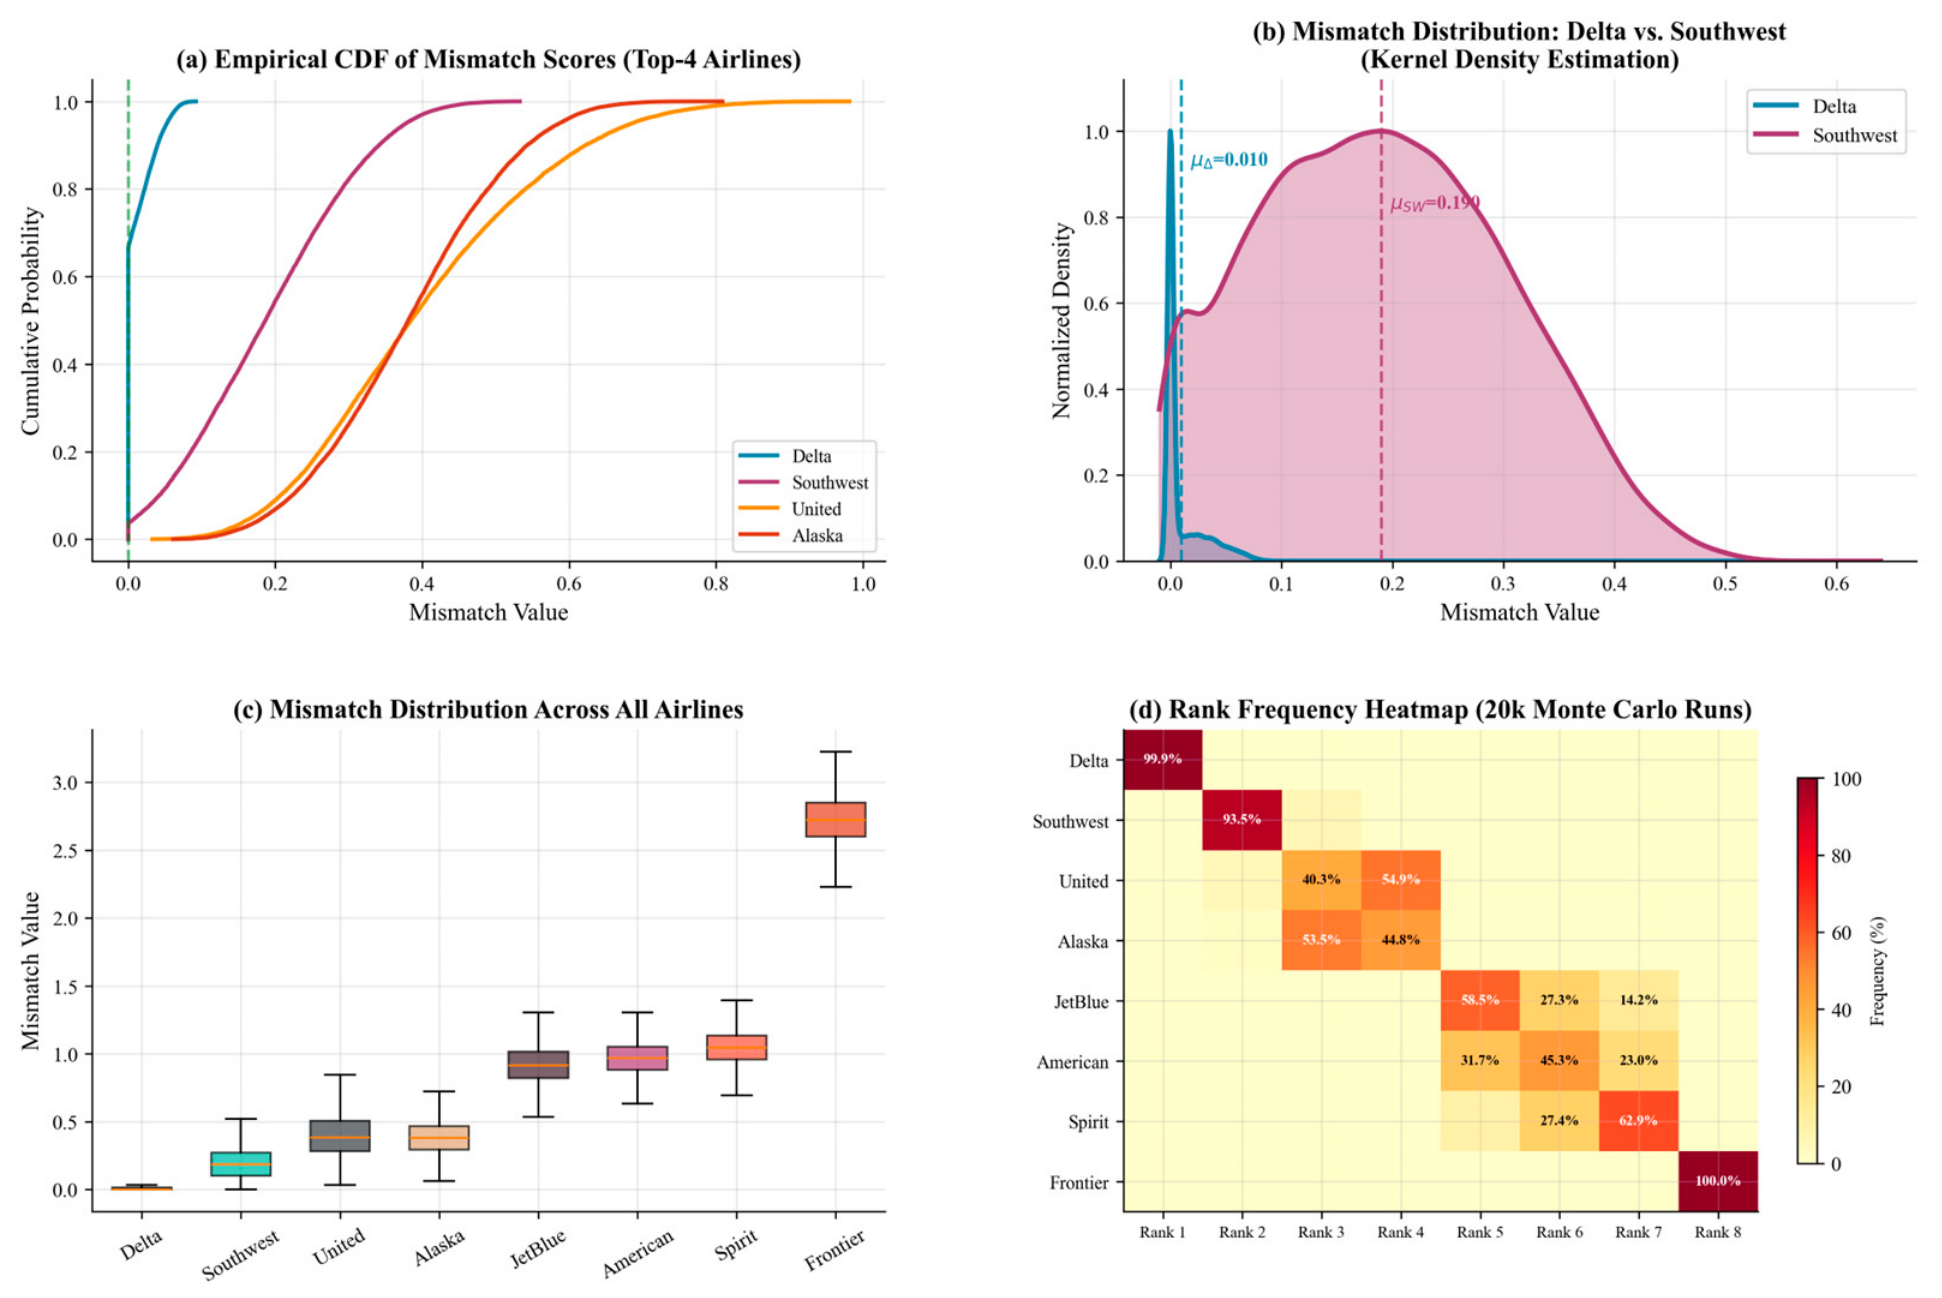
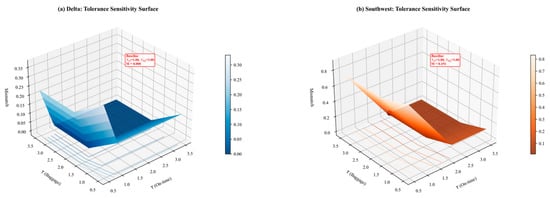
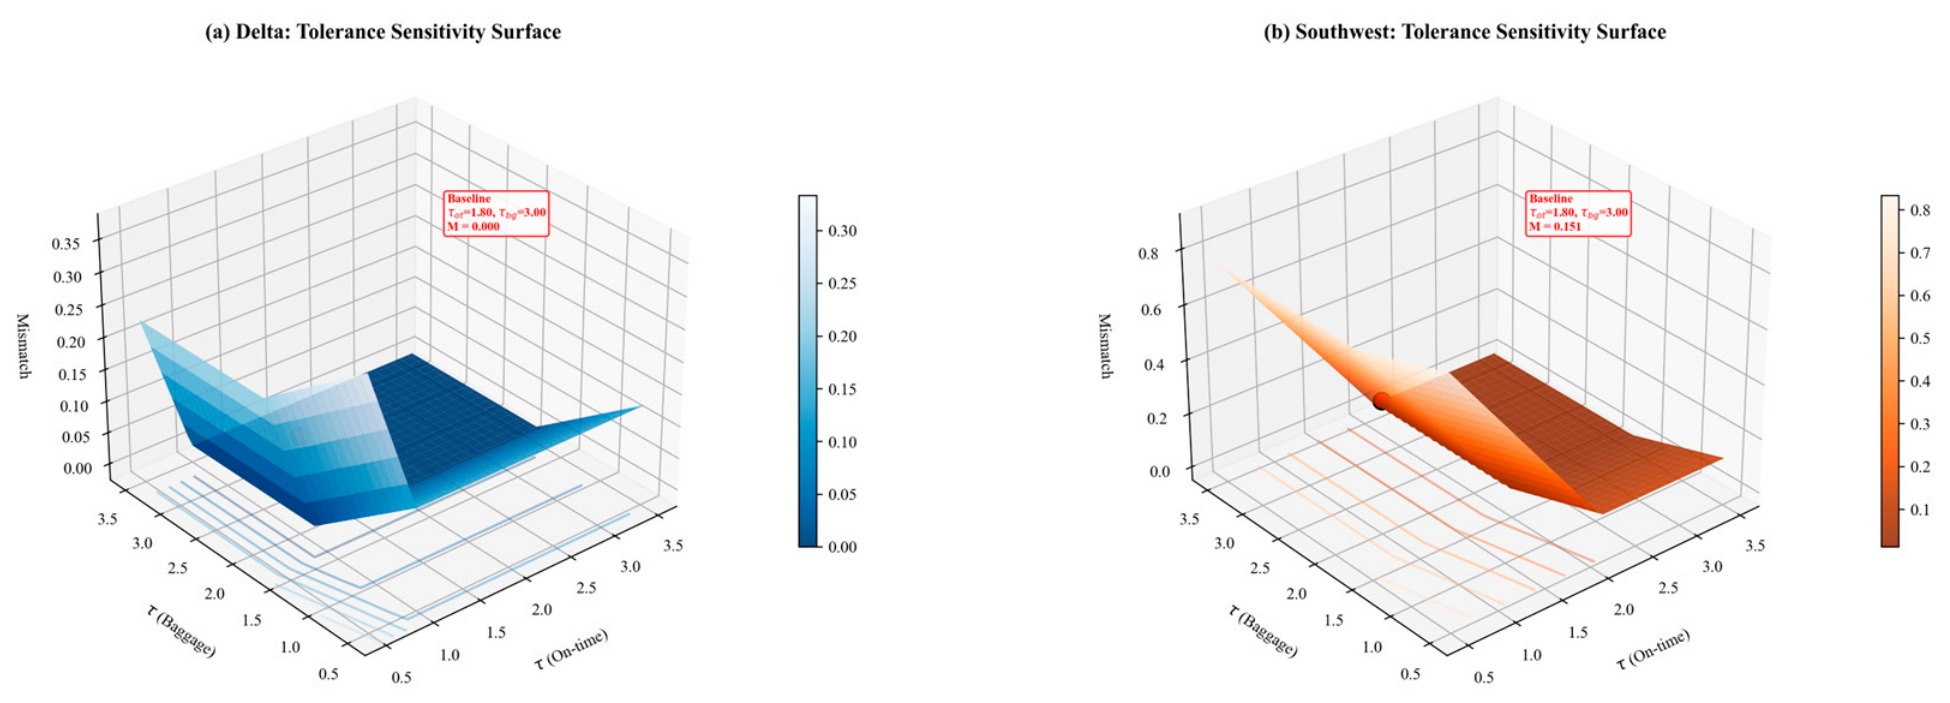
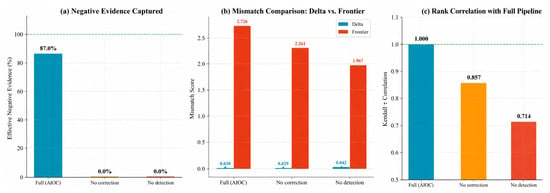
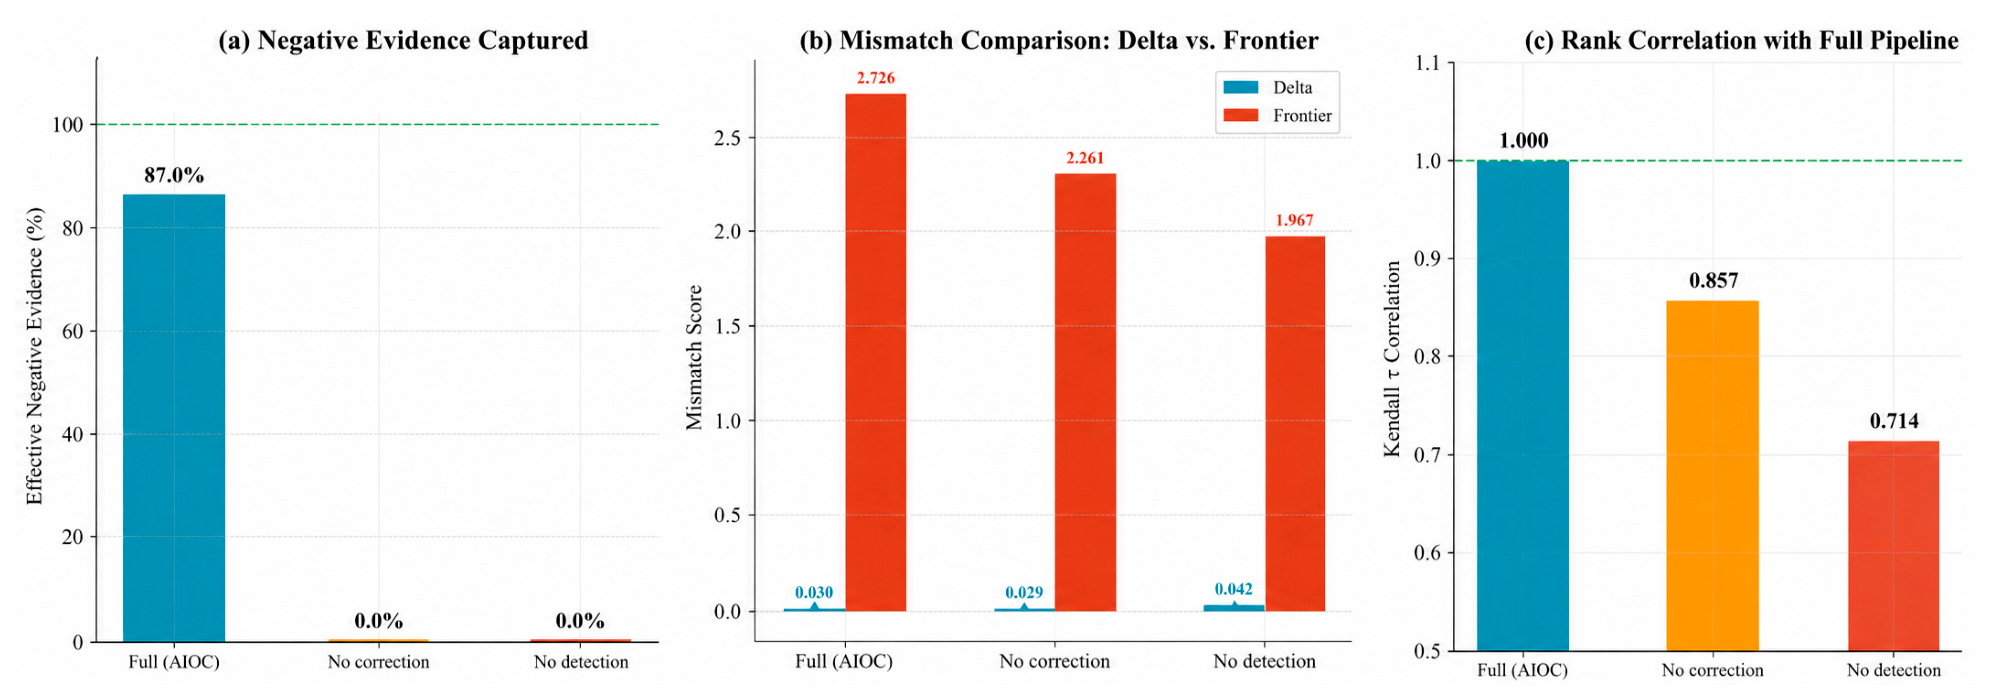

Disclaimer/Publisher’s Note: The statements, opinions and data contained in all publications are solely those of the individual author(s) and contributor(s) and not of MDPI and/or the editor(s). MDPI and/or the editor(s) disclaim responsibility for any injury to people or property resulting from any ideas, methods, instructions or products referred to in the content. |
© 2026 by the authors. Licensee MDPI, Basel, Switzerland. This article is an open access article distributed under the terms and conditions of the Creative Commons Attribution (CC BY) license.