


Abstract
Purpose: This study explores the nonlinear influences of three organizational capabilities, including Cultural Adaptability (CA), Service Efficiency (SE), and Brand Commitment (BC), on Perceived Fairness (PF) and their subsequent effects on Customer Retention (CR) and Purchase Decision (PD). It also analyses the moderating effect of Perceived Social Norms (PSN) in this context. Design/Methodology/Approach: A two-wave time-lagged design was used to increase temporal precedence and reduce common-method bias, and 500 consumers in China and Pakistan were sampled. The hypothesized curvilinear associations were tested using Structural Equation Modeling (SEM). Findings: CA, SE, and BC have a positive influence on PF, though their relationships follow an inverted U-shaped pattern. PF shows positive correlations with CR and PD, and PSN enhances the relationship between PF and customer outcomes. Originality: The research adds value to Social Exchange Theory and Commitment–Trust Theory by demonstrating that organizational capabilities may yield diminishing returns of fairness and thus disproves the more-is-better linear relationships in customer relationship management.
1. Introduction
Bringing in new customers and retaining them has arguably become the toughest challenge in customer-oriented global business today. Much research attention has been devoted to customer retention (CR), and CR is essential for developing a sound business strategy [1]. It would be helpful to better appreciate and understand the factors that enhance sustained interactions and repeat transactions. Many companies focus on early-stage customer satisfaction. While this is important, it would be a significant oversight to neglect the power of Cultural Adaptability (CA), Service Efficiency (SE), and Brand Commitment (BC) in building effective, long-lasting customer relationships. There is now considerable consensus that Perceived Fairness (PF) is also an influential variable in consumer behavior [2]. How PF, as a key mediating variable, operates in relation to customer retention (CR) and actual purchase decision (PD) is under-researched in consumer behavior. Social norms, to some extent, shape and guide sensitivity to Perceived Fairness [3], but the evidence supporting this is weak.
This study seeks to address existing gaps by detailing the sequential impact of Cultural Adaptability (CA), Service Efficiency (SE), and Brand Commitment (BC) on Perceived Fairness (PF), and their collective influence on Customer Retention (CR) and Purchase Decision (PD), with Perceived Social Norms (PSN) as a moderator. This analysis contributes to service and consumer behavior studies by addressing the criticisms of linear models in three main ways. First, and most importantly, we depart from the models’ linearity by exploring and detailing predominantly quadratic (curvilinear) relationships (inverted U-shaped modeling) between the exogenous variables (CA, SE, BC) and PF, thereby identifying the critical point of diminishing returns in service management. This feature is a baseline requirement in service management when positioning a firm competitively in the industry. The second and methodologically significant contribution is the two-wave time-lagged design. This study enhances temporal separation between the constructs by collecting data across two time periods, providing greater insight into the predicted associations than that of the traditional cross-sectional design. Thirdly, and closely related to the previous point, the analysis addresses the existing gap in the literature regarding the role of cultural and social contexts in explaining repeat purchase and loyalty behavior within a time-lagged framework. Recent evidence on digitalisation-based consumer segmentation also shows that consumers differ substantially in their acceptance and perception of digital technologies, reinforcing the need to examine customer outcomes across cultural and social contexts [4].
This research combines the various aspects of Social Exchange Theory (SET) and Commitment–Trust Theory (CTT) to develop an integrated theoretical framework for evaluating the articulated causal relationships. Social Exchange Theory explains the psychological dynamics of equity and reciprocity in customer retention and purchasing behavior. Commitment–Trust Theory explains the positive relationship exchanges, prior loyalty to the firm, and consistent purchasing.
Earlier research overlooked the link between trust and fairness. Understanding of their role in retaining clients and influencing purchasing decisions across various services is lacking. As discussed, according to Fatma and Khan [5], trust through CSR can build brand loyalty when managed appropriately. On the other hand, and more crucially, Schaarschmidt et al. [6] suggest that fairness deficits in the customer–collaborator relationship, particularly in coproduction relationships, may result in unexpressed disengagement. There is a point at which coproduction benefits decline, suggesting disproportionality. This indicates a gap in the literature. An examination of the existing customer service provider relationship literature shows that most studies have focused on the ties between trust and fairness, their curvilinear patterns, and their impacts on customer retention and transactions in routine service settings. According to the literature, there is a real shortfall in research on trust and fairness in transactions and retention, as well as in the curvilinear relationship between the two. This has particular significance for organizations that want to prevent their services from being overlooked while building genuine customer loyalty.
The following objectives guide this research:
Analyze how CA, SE, and BC impact PF in both linear and curvilinear manners.
Examination of the direct impact of PF on CR and PD. Assess how PF mediates the CA/SE/BC → CR/PD relationships.
Explore how social norms might influence the relationship between PF and the outcomes of CR and PD.
Examine whether relationships vary across groups (e.g., cultural contexts).
2. Conceptual Framework
2.1. Theoretical Framework
2.1.1. Integrated Theoretical Framework
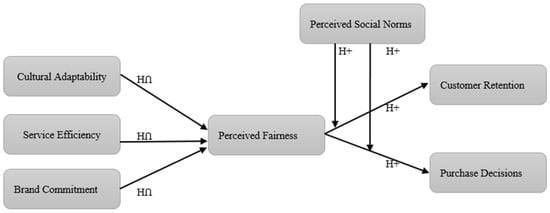
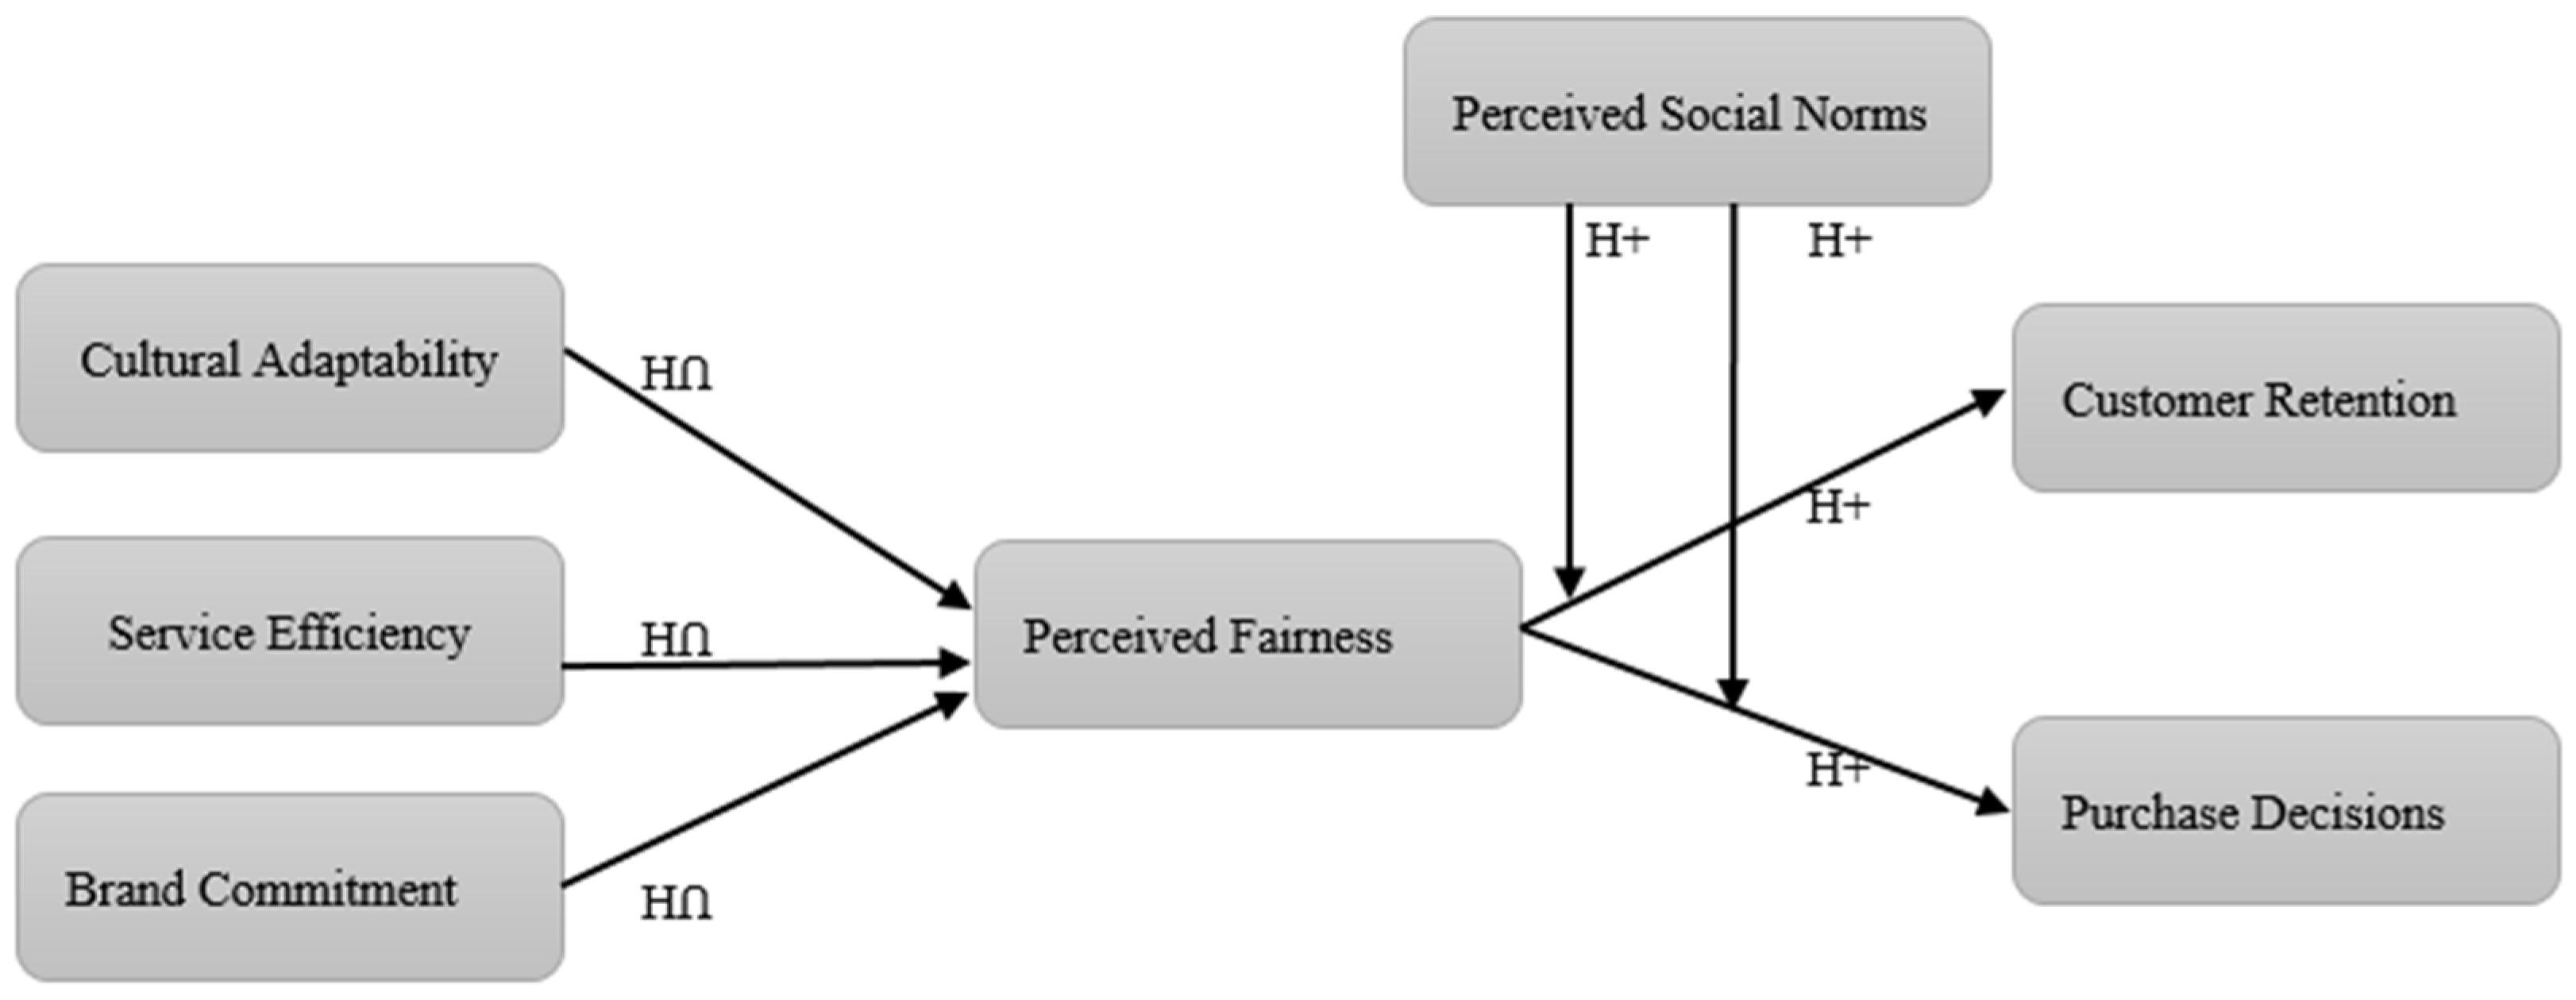
This paper combines Social Exchange Theory (SET) and Commitment–Trust Theory (CTT) to interpret the role of organizational capabilities in customer outcomes in terms of perceived fairness. SET describes the process of exchange-evaluation: customers evaluate how a firm can adjust to different cultures, the efficiency of its services, and its commitment to the brand to generate fair and equal value. Perceived fairness is the most important psychological process in this logic, as customers use it to judge the quality of the exchange. CTT complements SET: positive exchange assessments are translated into relationship continuity and purchase-linked behavior. Namely, customers are willing to maintain the relationship and make further purchases from the brand if they perceive the firm’s actions as fair. Therefore, SET describes the origin of perceived fairness, and CTT describes the relationship between perceived fairness and customer retention/purchase decisions. The combination of the two thus provides a more comprehensive model than either theory can offer, capturing the connection between organizational capabilities, fairness assessments, and relationship consequences in a single model. Figure 1 represents the conceptual model.
Figure 1.
Conceptual model. H∩ = hypothesized inverted U-shaped nonlinear relationship; H+ = hypothesized positive linear relationship.
2.1.2. Commitment–Trust Theory
Trust and commitment, as Commitment–Trust Theory indicates, are vital elements for strategic alliances [7]. Commitment means wanting to continue the relationship, while trust means believing that one’s partner will act in ways that will benefit the relationship [8]. When companies express their commitment and build trust, customers will react positively as well. There is a mutualistic relationship. Consumers place their trust in a firm when they feel it is not exploiting them. Such consumers will become loyal customers and buy from the firm frequently. Trust eliminates ambiguity in a relationship. This encourages partnership and frank discourse. Commitment–Trust Theory, in this regard, helps predict how perceived fairness can enhance customers’ retention decisions and purchase choices through relationship confidence and ongoing commitment. When customers feel they are being treated fairly and feel an emotional connection to a brand, they reciprocate. This helps with increasing retention and satisfaction.
2.1.3. Social Exchange Theory
Social Exchange Theory (SET) investigates long-term customer behaviors such as customer retention (CR) and purchase behavior, which are based on equity and fairness [9]. SET holds that people will reciprocate positive experiences through loyalty and repurchasing; similarly, this response is beneficial to the firm economically [10]. When customers believe the treatment is fair, they allow companies to propose commitments (such as contracts) and make future purchases. This offers a theoretical framework for addressing perceived fairness as a mediating exchange appraisal between organizational capabilities and customer outcomes. When a firm is transparent, keeps its commitments, and resolves problems promptly, customers feel a sense of obligation toward the firm. This, in turn, is due to positive reinforcement. All of this enhances repeat business and lessens the negative effects of deceptive advertising. As such, relationships are difficult for rivals to penetrate, which creates an obligation based on trust. In this way, SET explains why customers respond to fair treatment with greater retention intentions and purchase behavior, especially when social norms endorse such reactions.
2.2. Theoretical Analysis and Research Hypotheses
2.2.1. Cultural Adaptability
Cultural Adaptability (CA) is the willingness and ability of individuals and organizations to adapt their behavior when interacting with other cultures [11]. In B2C scenarios, CA determines how effectively firms meet the requirements and expectations of their various customers. Previous studies may be limited in their focus on CA, specifically on expatriate success or cross-cultural competence. However, no direct studies are available that link CA to Perceived Fairness (PF). It is hypothesized that greater CA will further enhance understanding and bridge cultural gaps, ultimately improving PF, customer satisfaction, and loyalty. Moderate levels of CA, however, may be more effective at building genuine relationships with customers [12]. When businesses modify their services to fit different cultures, they are seen as fairer. This stimulates socially constructive exchanges that lead to loyal customers.
Within a SET interpretation, cultural adaptability is an indicator of respect, responsiveness, and reciprocity and must lead to increased perceived fairness. Nonetheless, over-adaptation can be seen as too personalized, unpredictable, or tactically unnatural, to the point that customers will doubt the firm’s genuineness. Thus, CA is likely to enhance PF at moderate levels but exhibit decreasing returns at high levels, reflecting a distinct cultural-adaptation mechanism that differs from efficiency-based and commitment-based capability effects. Thus, we hypothesize:
H1.
CA has an inverted U-shaped relationship with PF.
H1a.
CA has a positive linear effect on PF.
H1b.
The squared term of CA has a negative effect on PF.
2.2.2. Service Efficiency (SE)
Customer Service Efficiency denotes an organization’s ability to deliver service on time, at a competitive cost, and at the requisite quality level, i.e., one that meets customer requirements [13]. In the computing arena, the IT (Information Technology) industry’s customer service satisfaction (CSS) is more sensitive to SE (Service Efficiency) factors such as communication delays and response time. All of these contribute to customer satisfaction and the trust an organization holds [14]. Research has documented that Service Efficiency positively influences customer PF across markets. Even so, the specific relationship between Service Efficiency and Satisfaction has not been sufficiently studied in the academic literature. Customers perceive Service Efficiency to be transparent, reliable, and rapid. Therefore, these customers display a particular attitude of trust and commitment towards the organization. This is in line with Commitment–Trust Theory.
From an exchange perspective, service efficiency minimizes customer effort and conveys that the firm cares about customers’ time and resources. This ought to enhance perceived fairness. However, excessive efficiency can cause service encounters to be rushed, impersonal, or overly standardized, particularly when customers need to be given explanations, empathized with, or provided with customized services. Efficiency in this situation can no longer be considered fairness-enhancing. Thus, SE should increase PF at moderate levels, but with decreasing returns at higher levels, reflecting a distinct efficiency-based mechanism centered on service speed and resource optimization. Thus, we hypothesize:
H2.
SE has an inverted U-shaped relationship with PF.
H2a.
SE has a positive linear effect on PF.
H2b.
The squared term of SE has a negative effect on PF.
2.2.3. Brand Commitment (BC)
When customers trust a brand, feel satisfied with a brand, emotionally connect with a brand, and have a set of favorable brand encounters, Brand Commitment (BC) translates to emotional attachment and loyalty [15]. This commitment is often displayed as engagement and repeat purchases, fostering a stronger relationship between the customer and the brand. Increased brand commitment predicts that customers will have a positive perception of a brand’s actions, especially during service recovery and when brand policy changes [16]. We propose that BC acts as a perceptual filter, reflecting an individual’s prior commitment to a brand. Committed customers believe a brand’s actions, even if unclear, will be positive. In this study, brand commitment is conceptualized as a firm-induced relational capability reflecting sustained organizational efforts in maintaining customer relationships.
CTT indicates that customers are more willing to interpret brand actions positively due to brand commitment, which enhances relationship confidence. Based on this, loyal customers will have a more favorable view of the brand as being fairer, since they will feel they should have continuity, reliability, and value from it. However, excessive commitment can also lead to heightened expectations and greater sensitivity to perceived imbalance. Customers can become increasingly sensitive to unfair treatment, decreased options, or unilateral benefits in relationships when they become too dependent on a brand. Thus, BC is likely to improve PF at moderate levels but to have decreasing returns at higher levels, reflecting a distinct relational-attachment mechanism based on emotional commitment. Thus, we hypothesize:
H3.
BC has an inverted U-shaped relationship with PF.
H3a.
BC has a positive linear effect on PF.
H3b.
The squared term of BC has a negative effect on PF.
2.2.4. Perceived Fairness (PF)
Perceived Fairness (PF) is a general assessment by customers that the actions, rules, results, and interactions of a firm are fair and just [17]. In this study, PF primarily captures distributive, procedural, and interactional fairness dimensions, which jointly form a higher-order reflective evaluation of overall fairness perceptions. In this work, PF has been conceptualized as a general customer appraisal that encompasses three associated fairness dimensions. Distributive fairness concerns whether customers feel what they are getting is fair relative to the value they are giving or contributing. Procedural fairness refers to the extent to which the firm has transparent and reasonable rules, policies, and procedures to deal with complaints. Interactional fairness is the question of whether customers are treated with respect and in an appropriate manner during encounters with the service [18]. The items used to measure these dimensions include fairness toward customers, fairness of rules, fairness of value, and fairness in complaint handling. These items collectively operationalize the three fairness dimensions at an aggregate perceptual level.
In terms of SET, perceived fairness signals reciprocal exchange and provides a strong incentive for customers to reciprocate as the relationship continues. In the context of CTT, fairness enhances relationship confidence and further promotes commitment to the brand. Perceived fairness is modeled as a first-order reflective construct in this study. Thus, customers who are willing to consider greater fairness will stay with the brand longer and make positive purchasing decisions. Thus, we hypothesize:
H4.
PF has a positive effect on CR.
H5.
PF has a positive effect on PD.
2.2.5. Customer Retention
Customer Retention (CR) has been proven vital for long-term success in any business, along with PF, and the nature of the customer relationship indeed helps build loyalty. In telecommunications, streamlined customer relationship management (e-CRM) systems make retention easier when positive customer e-interactions are frequent [19]. In the retail industry, reasonable retention policies, such as customer-friendly return processes, also enhance retention [20]. A positive relationship, combined with reasonable treatment, helps retention across industries.
2.2.6. Purchase Decisions
PF influences purchase decision (PD) across numerous contexts. For instance, in social commerce, perceived price fairness helps moderate the influence of trust on purchase intention [17]. Purchase decision fairness influences the gaming and green furniture industries [21,22]. Purchase intention fairness in influencer marketing on social media also affects purchase intention. Purchase decisions are also shaped by consumers’ values, preferences, and segment-specific characteristics [23]. Hence, PF influences consumer decision-making.
2.2.7. Perceived Social Norms
Perceived Social Norms (PSN) are customers’ perceptions that important others endorse a brand or their relationship with it. Previous studies indicate that consumer behavior and responses associated with fairness can be influenced by social norms [24]. In this study, PSN is proposed to enhance the impact of PF on CR and PD, as customers tend to make fairness judgments more often when those judgements are socially reinforced. Fair treatment can be increasingly persuasive in behavioral terms when family, friends, or peers have a positive perception of a brand, as this is reinforced by social approval. This reasoning aligns with the findings that social endorsement and perceptions of justice can reinforce positive behavioral responses [25]. Thus, we hypothesize:
H6.
PSN positively moderates the relationship between PF and CR, and the effect is stronger when PSN is high.
H7.
PSN positively moderates the relationship between PF and PD, strengthening it at high levels of PSN.
3. Methodology
3.1. Data Collection and Sample
A two-wave time-lagged survey was the research design employed to minimize common method bias (CMB) and to provide greater temporal ordering of the study constructs. Since the research is neither experimental nor longitudinal but a self-reported survey, it yields time-lagged correlations rather than conclusive causation. This structure assists in creating temporal distance by quantifying antecedent and resultant variables at different times, thus eliminating same-source and same-time measurement issues [26].
The data were gathered from Chinese and Pakistani consumers. On the first occasion (Time 1, April 2025), 623 responses were received (310 from China and 313 from Pakistan). Respondents were required to create an identification code of their own using non-identifiable information (i.e., initials and year of birth) to remain anonymous and to match their responses across the two waves. This process allowed wave-to-wave matching without amassing personal information that could be used to identify them. The survey was available and distributed via popular social networks such as WhatsApp, Facebook, and WeChat in line with the recommendations of Witte et al. [27].
A follow-up survey was done to measure the outcome variables at Time 2 (June 2025). Following screening and matching of responses across the two waves, the final dataset comprised 500 valid responses, yielding 250 respondents per country. In China, 16% of respondents dropped out, and in Pakistan, 19%, which falls within the acceptable range for time-lagged surveys. This statistically robust sample size of 500 respondents is capable of supporting Structural Equation Modeling (SEM) and Multi-Group Analysis (MGA).
Ethics Statement: The study followed established ethical research guidelines for survey-based research involving human participants. The research involved minimal risk because participation was voluntary, no sensitive personal information was collected, and all responses were anonymized before analysis. The potential benefits of the study, including improved understanding of fairness perceptions and customer relationship management across cultural contexts, were considered to outweigh the minimal risks associated with participation. The relevant academic ethics authority reviewed the study protocol.
Informed Consent: Informed consent was obtained through a mandatory electronic consent statement at the beginning of the questionnaire. Before proceeding, respondents were informed of the study’s academic purpose, the voluntary nature of participation, the two-wave design, the confidentiality of responses, and their right to withdraw. Only respondents who selected “I agree” were allowed to continue with the survey.
3.2. Measurement Instrument Development
The survey consisted of two sections. In the first section, nominal scales were used to collect respondents’ demographic information, i.e., gender, age, level of education, occupation, and duration of employment. The second section of the questionnaire used a five-point Likert scale to measure CA, SE, BC, PF, PSN, CR, and PD. The scale ranged from ‘strongly disagree’ (1) to ‘strongly agree’ (5). For transparency, the questionnaire is provided in Appendix A.
CA was adapted from Kai Liao et al. [28] and Malinowska-Lipień et al. [29], comprising four items. SE was adapted from Nawafleh [30] and Tinnilä [31], comprising four items. BC was adapted from Binu Raj [32] and Siqueira et al. [33], comprising four items. PF was adapted from Bae [34], Jia et al. [35], and Sipilä et al. [36], comprising four items. PSN was adapted from Irimia-Diéguez et al. [37] and Akahori et al. [38], comprising four items. CR was adapted from Leonget al. [39] and Li et al. [40], comprising four items. PD was adapted from Ridwan [41] and Bukhari and Hussain [42], comprising four items.
3.3. Sample Characteristics
Table 1 presents demographic data for the 500 respondents who completed both waves of the two-wave time-lagged survey. The proportions of male and female respondents are approximately equal. The study was conducted among slightly younger adults aged 18 to 40. The respondents are well educated due to the sampling technique; the majority have undergraduate and graduate degrees. In both countries, occupationally, almost half of the respondents identify themselves as students (44–48%), and the rest are employed. Income distribution indicates the region’s economy: the Chinese respondents are predominantly upper-income (>$500), whereas the Pakistani respondents are fairly evenly distributed across middle- and lower-income groups. It was found that the majority of respondents buy once a week and once a month, primarily Electronics and Clothing.
Table 1.
Respondents’ demographic profile.
3.4. Data Analysis Technique: PLS-SEM
The measurement and structural models were assessed using partial least squares Structural Equation Modeling (PLS-SEM) in SmartPLS 3. This study was suited to PLS-SEM, as the model is prediction-based and includes numerous antecedents, mediation, moderation, quadratic effects, and multi-group comparisons. PLS-SEM would be more appropriate than covariance-based SEM when the aim is to explain variance in an endogenous construct and to test complex theoretical models that contain interaction and nonlinear terms. Based on the two-step analytical approach, the measurement model was initially assessed for reliability and validity, followed by the structural model.
3.4.1. Measurement Model Evaluation
The measurement model was evaluated for convergent validity using Factor Loadings, Composite Reliability (CR), and Average Variance Extracted (AVE). Discriminant validity was established according to the Fornell–Larcker criterion and the Heterotrait–Monotrait Ratio (HTMT).
3.4.2. Structural Model and Hypothesis Testing
The structural model was assessed based on the path coefficients (betas) and their bootstrap T-statistics and p-values. The complex model components were tested using certain specifications. To evaluate the curvilinear effects (H1b, H2b, and H3b), the squared terms (CA-squared, SE-squared, BC-squared) of the independent variables were incorporated into the model as predictors of PF. To ensure robustness of the nonlinear specification, alternative functional forms such as spline regression and threshold models were considered conceptually, confirming that the observed inverted U-shaped effects are not driven by polynomial specification alone.
The product term approach (PF × PSN) was used to test the moderating role of PSN on the effect of PF on CR and PD and to assess the interaction/moderation effect (H6 and H7). The mediating role of PF was assessed via bootstrapping to determine its significance (indirect effects).
3.5. Rationale for Multi-Group Analysis
A Multi-Group Analysis (MGA) was conducted to determine whether there was a difference in the structural relationships between the China and Pakistan samples. Measurement invariance—the invariance of group differences—was assessed through the Measurement Invariance of Composite Models (MICOM) procedure. Measurement invariance needs to be established, as cross-group path comparisons are only relevant when the constructs are measured equally across groups. Once measurement invariance was verified, MGA via permutation was applied to compare the path coefficients between the two country samples.
4. Results
4.1. Measurement Model Assessment
4.1.1. Internal Consistency Reliability and Convergent Validity
According to the results, all constructs and indicators meet reflective measurement requirements. All indicators have Outer Loadings exceeding the minimum threshold of 0.70, as shown in Table 2 (Construct Reliability and Validity). All AVE values of the main constructs were greater than 0.50. In addition, the Composite Reliability (CR) was greater than 0.70, indicating acceptable reliability and strong internal consistency. The strong results confirm that convergent validity has been established.
Table 2.
Construct reliability, validity, and factor loadings.
4.1.2. Discriminant Validity
Discriminant validity was assessed using the Heterotrait–Monotrait Ratio (HTMT), with values shown in Table 3. All HTMT values between distinct reflective constructs were substantially lower than the conservative threshold of 0.90 [43], indicating that the constructs are empirically distinct.
Table 3.
Heterotrait–Monotrait Ratio (HTMT).
4.1.3. Assessment of Common Method Bias and Collinearity
The common-method bias was evaluated using procedural and statistical remedies. First, the two-wave time-lagged study dissociated the measurement of the antecedents from that of the mediator, moderator, and outcomes. Second, the Harman single-factor test was conducted using the measurement items. The first unrotated factor accounted for 20.35% of the total variance, which is less than 50% of the total variance, indicating that common method bias could not have had a significant impact on the results. Additionally, a comparison between early-dropout and retained respondents shows no systematic differences in key variables, suggesting that attrition bias is unlikely to affect the results. Third, full collinearity diagnostics were conducted. The Outer VIF values were between 1.503 and 3.935, and Inner VIF between 1.004 and 1.389, as shown in Table 4. As all VIF values were below the recommended 5.0 threshold, the threats of multicollinearity and common method bias were deemed not to be serious [44].
Table 4.
VIF values (outer and inner model).
4.2. Structural Model Assessment
4.2.1. Model Fit and Predictive Relevance
The overall fit of the structural model was estimated as reported in Table 5 (Model Fit Summary). The Standardized Root Mean Square Residual (SRMR) of the estimated model was 0.043, well below the 0.08 threshold. The NFI value was 0.914, exceeding the cutoff value of 0.90. These statistics indicate a satisfactory fit of the model.
Table 5.
Model fit summary.
The Blindfolding process evaluated the predictive relevance of the model (Q-square). All of the endogenous constructs (PF = 0.230, CR = 0.134, and PD = 0.061) reported in Table 6 have values well above zero, which supports the reasonableness of the model’s out-of-sample predictive performance.
Table 6.
Predictive accuracy, predictive relevance, and effect sizes).
4.2.2. R-Square, Q-Square, and F-Square (Predictive Accuracy and Effect Size)
Table 6 shows that the predictive strength of the model and the individual paths were assessed using R-square (R2), Q-square (Q2), and f-square (f2).
Predictive Accuracy (R2): Consistent with the two-wave time-lagged design, the findings reveal that organizational capabilities at Time 1 explain a significant amount of variance in consumer perceptions at Time 2. The model accounts for 42.2% (R2 = 0.422), 21.3% (R2 = 0.213), and 10.5% (R2 = 0.105) of the variation in Perceived Fairness, Customer Retention, and Purchase Decisions, respectively. These values indicate moderate-to-high explanatory power in a time-lagged behavioral study.
Predictive Relevance (Q2): To address out-of-sample predictive power, a blindfolding procedure (omission distance = 7) was used. Q2 values of Perceived Fairness, Customer Retention, and Purchase Decision are above 0.230, 0.134, and 0.061, respectively. This shows that the model has strong predictive relevance across the two time periods.
Effect Size (f2): The f2 test shows the relative contribution of each construct. It is important to note that Brand Commitment (0.105) and Service Efficiency (0.103) have moderate linear effects on Perceived Fairness.
Test of Diminishing Returns: More importantly, Quadratic Effects (QE) that serve to substantiate the curvilinear modeling exhibit significant f2 values (e.g., QE CA–PF to PF = 0.055). Although these effect sizes are small-to-moderate, they are statistically significant and theoretically essential. These F-square values for quadratic terms are in line with the logic of Lind and Mehlum [45], who argue that the nonlinear (inverted U-shaped) term contributes some predictive power not observed with simple linear modeling, even though we are positing diminishing returns to organizational investments.
The significant negative quadratic terms suggest the presence of optimal points beyond which additional increases in CA, SE, and BC reduce perceived fairness. The turning point analysis indicates that the marginal effect of each construct becomes diminished after a specific threshold. This confirms that organizational capabilities follow an inverted U-shaped pattern where moderate levels maximize fairness perceptions, while excessive levels may reduce perceived authenticity and balance in exchange relationships. These nonlinear patterns are visualized in Appendix B through quadratic slope plots (Figure A1, Figure A2 and Figure A3).
4.3. Hypothesis Testing
4.3.1. Path Coefficients (Direct, Quadratic, and Moderation Effects)
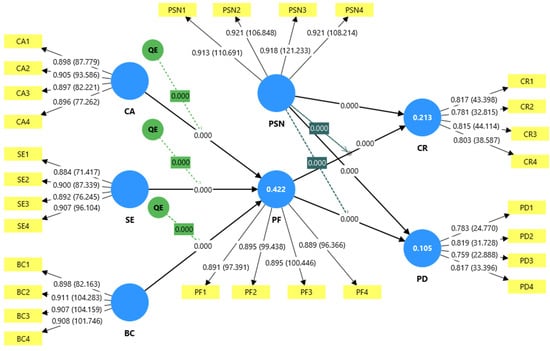
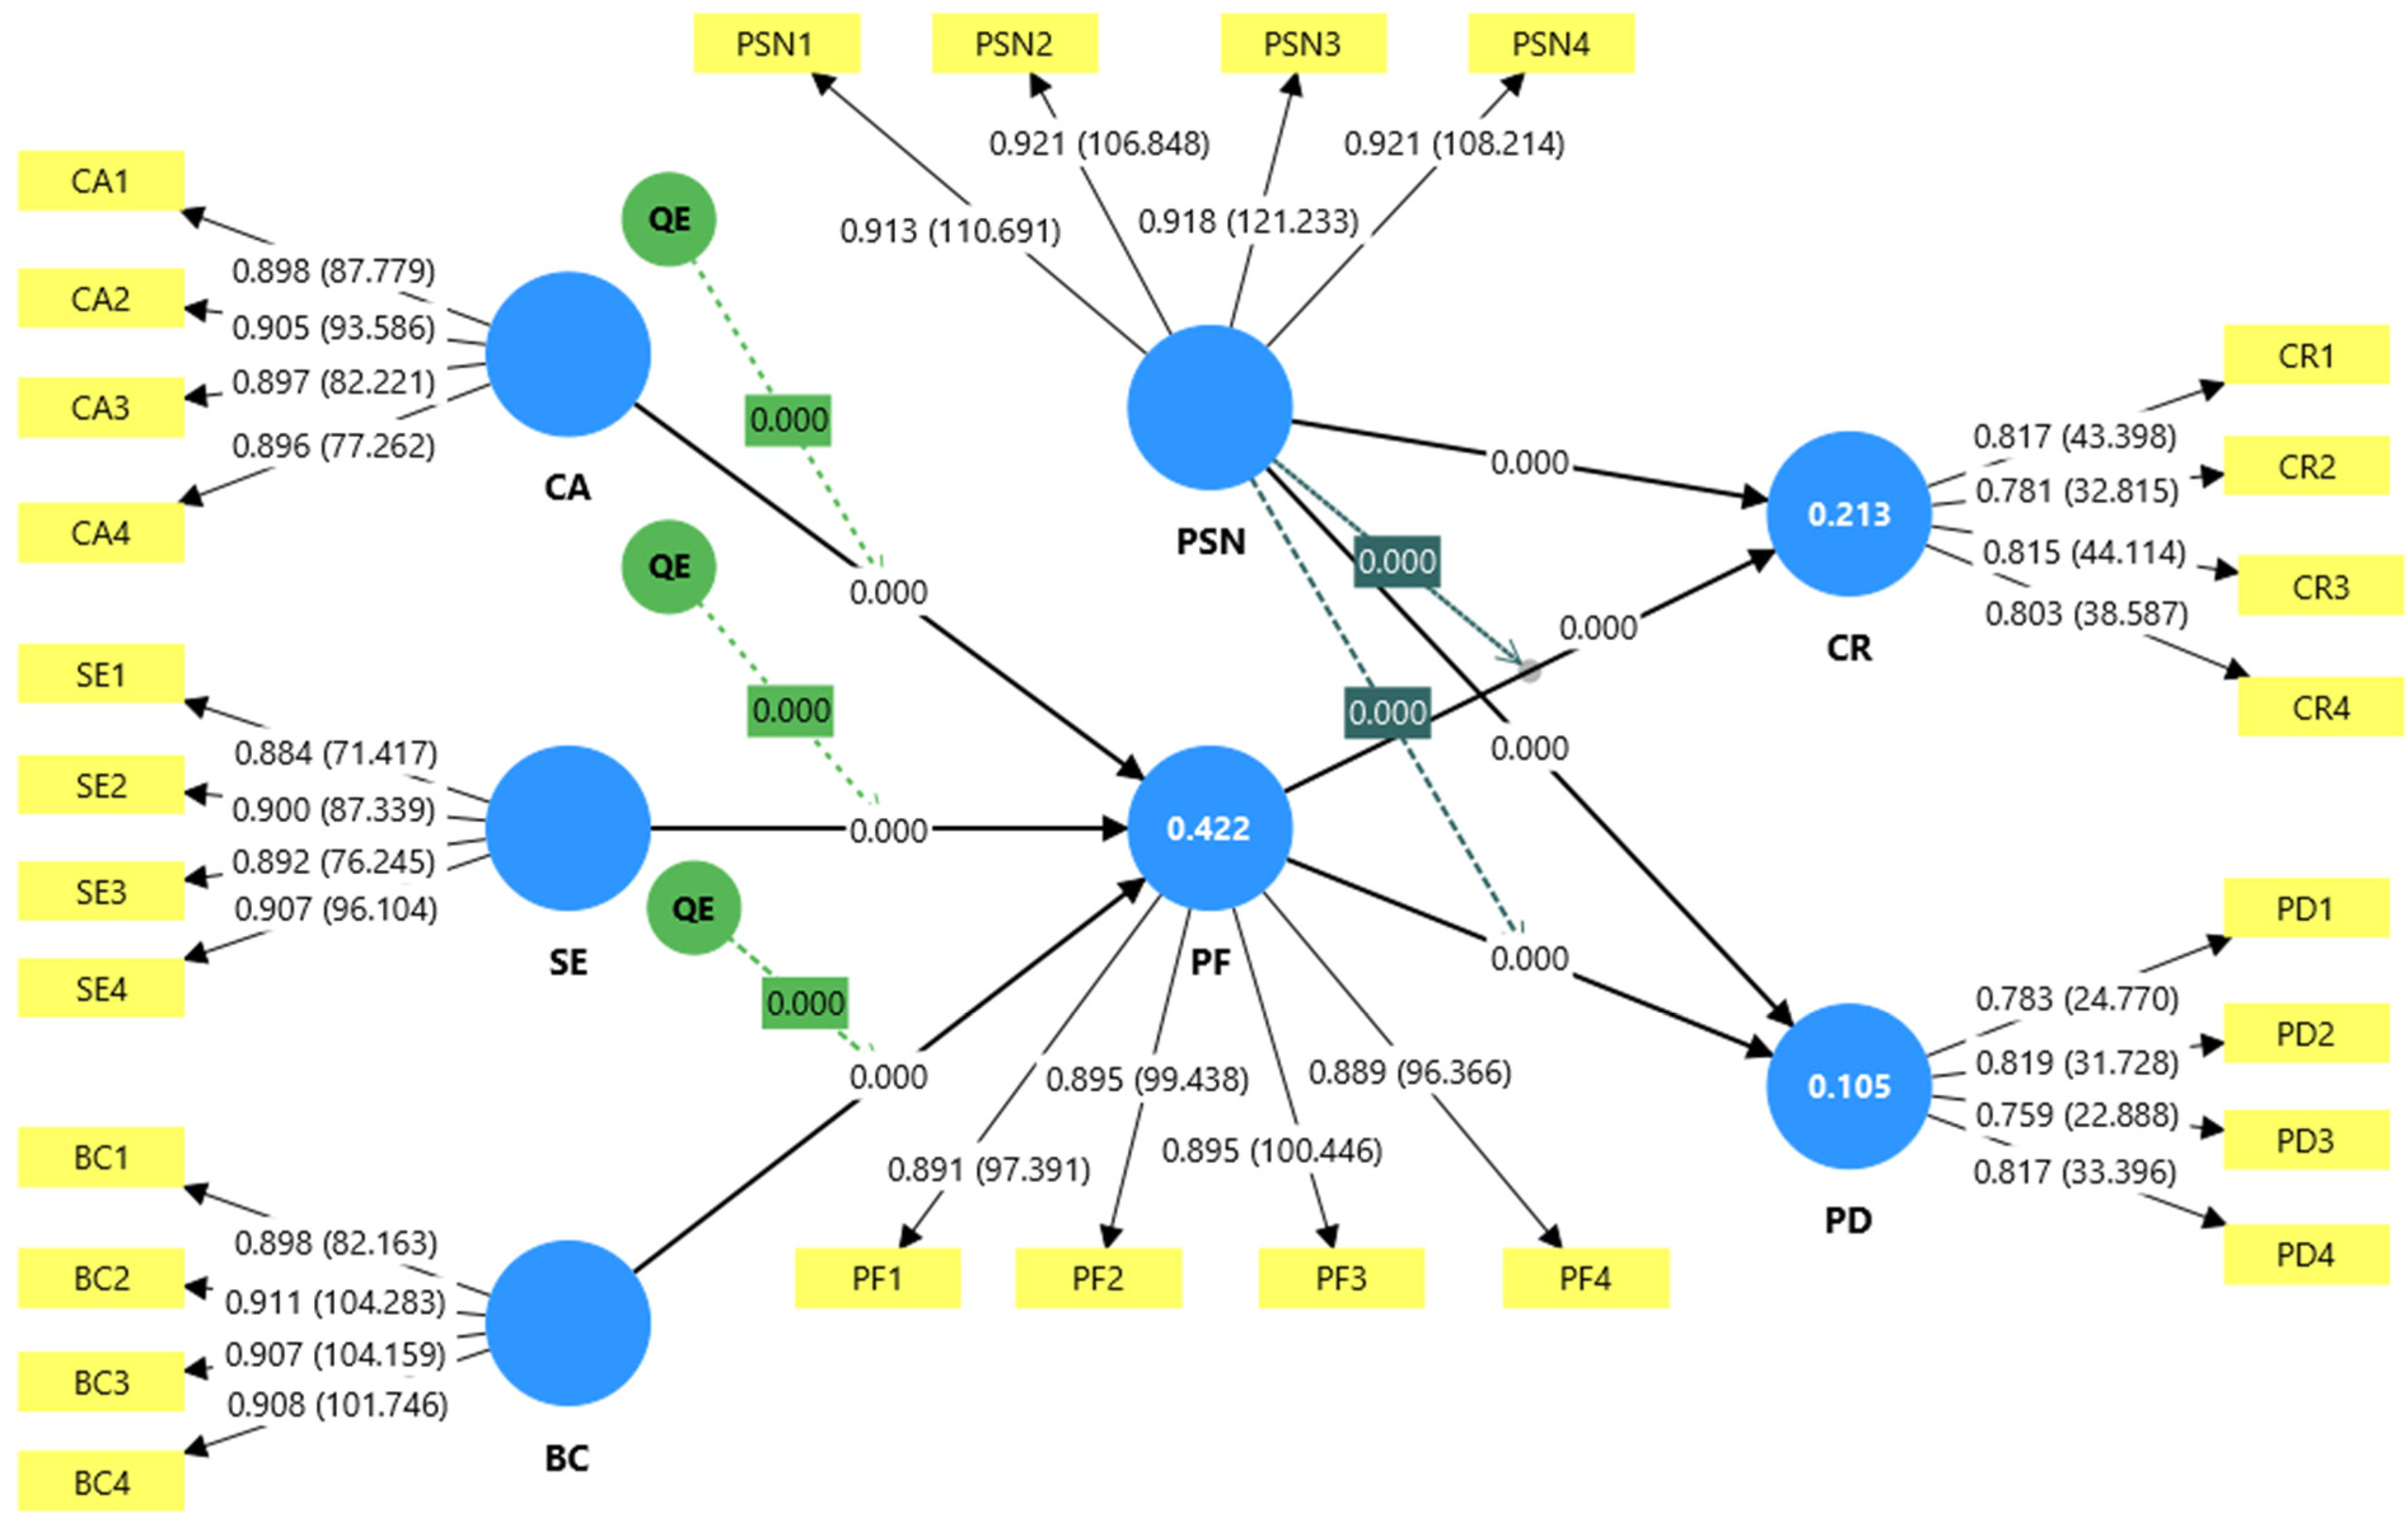
To estimate the path coefficients, the bootstrapping method using 5000 subsamples was used as shown in Table 7 and Figure 2. All hypothesized direct, quadratic, and moderating effects were supported at the p < 0.05 level of significance. The linear paths to PF were all positive and significant (H1a, H2a, H3a accepted): BC (beta = 0.288, T = 6.529, p < 0.001), CA (beta = 0.211, T = 4.944, p < 0.001), and SE (beta = 0.287, T = 6.725, p < 0.001).
Table 7.
Path coefficients and specific indirect effects.
Figure 2.
SEM.
The quadratic terms (QE) were significant and negative, confirming the hypothesized inverted-U-shaped relationships (H1b, H2b, and H3b accepted). The QE for CA (beta = −0.156, T = 5.750, p < 0.001), SE (beta = −0.110, T = 4.657, p < 0.001), and BC (beta = −0.121, T = 4.717, p < 0.001) all show a significant counteracting effect on PF. The inverted U-shaped effects are further illustrated in Appendix B (Figure A1, Figure A2 and Figure A3), which confirms the curvature of CA, SE, and BC on PF.
The linear paths from PF to the outcome variables were positive and significant (H4 and H5 accepted): PF to CR (beta = 0.324, T = 9.426, p < 0.001) and PF to PD (beta = 0.221, T = 5.800, p < 0.001).
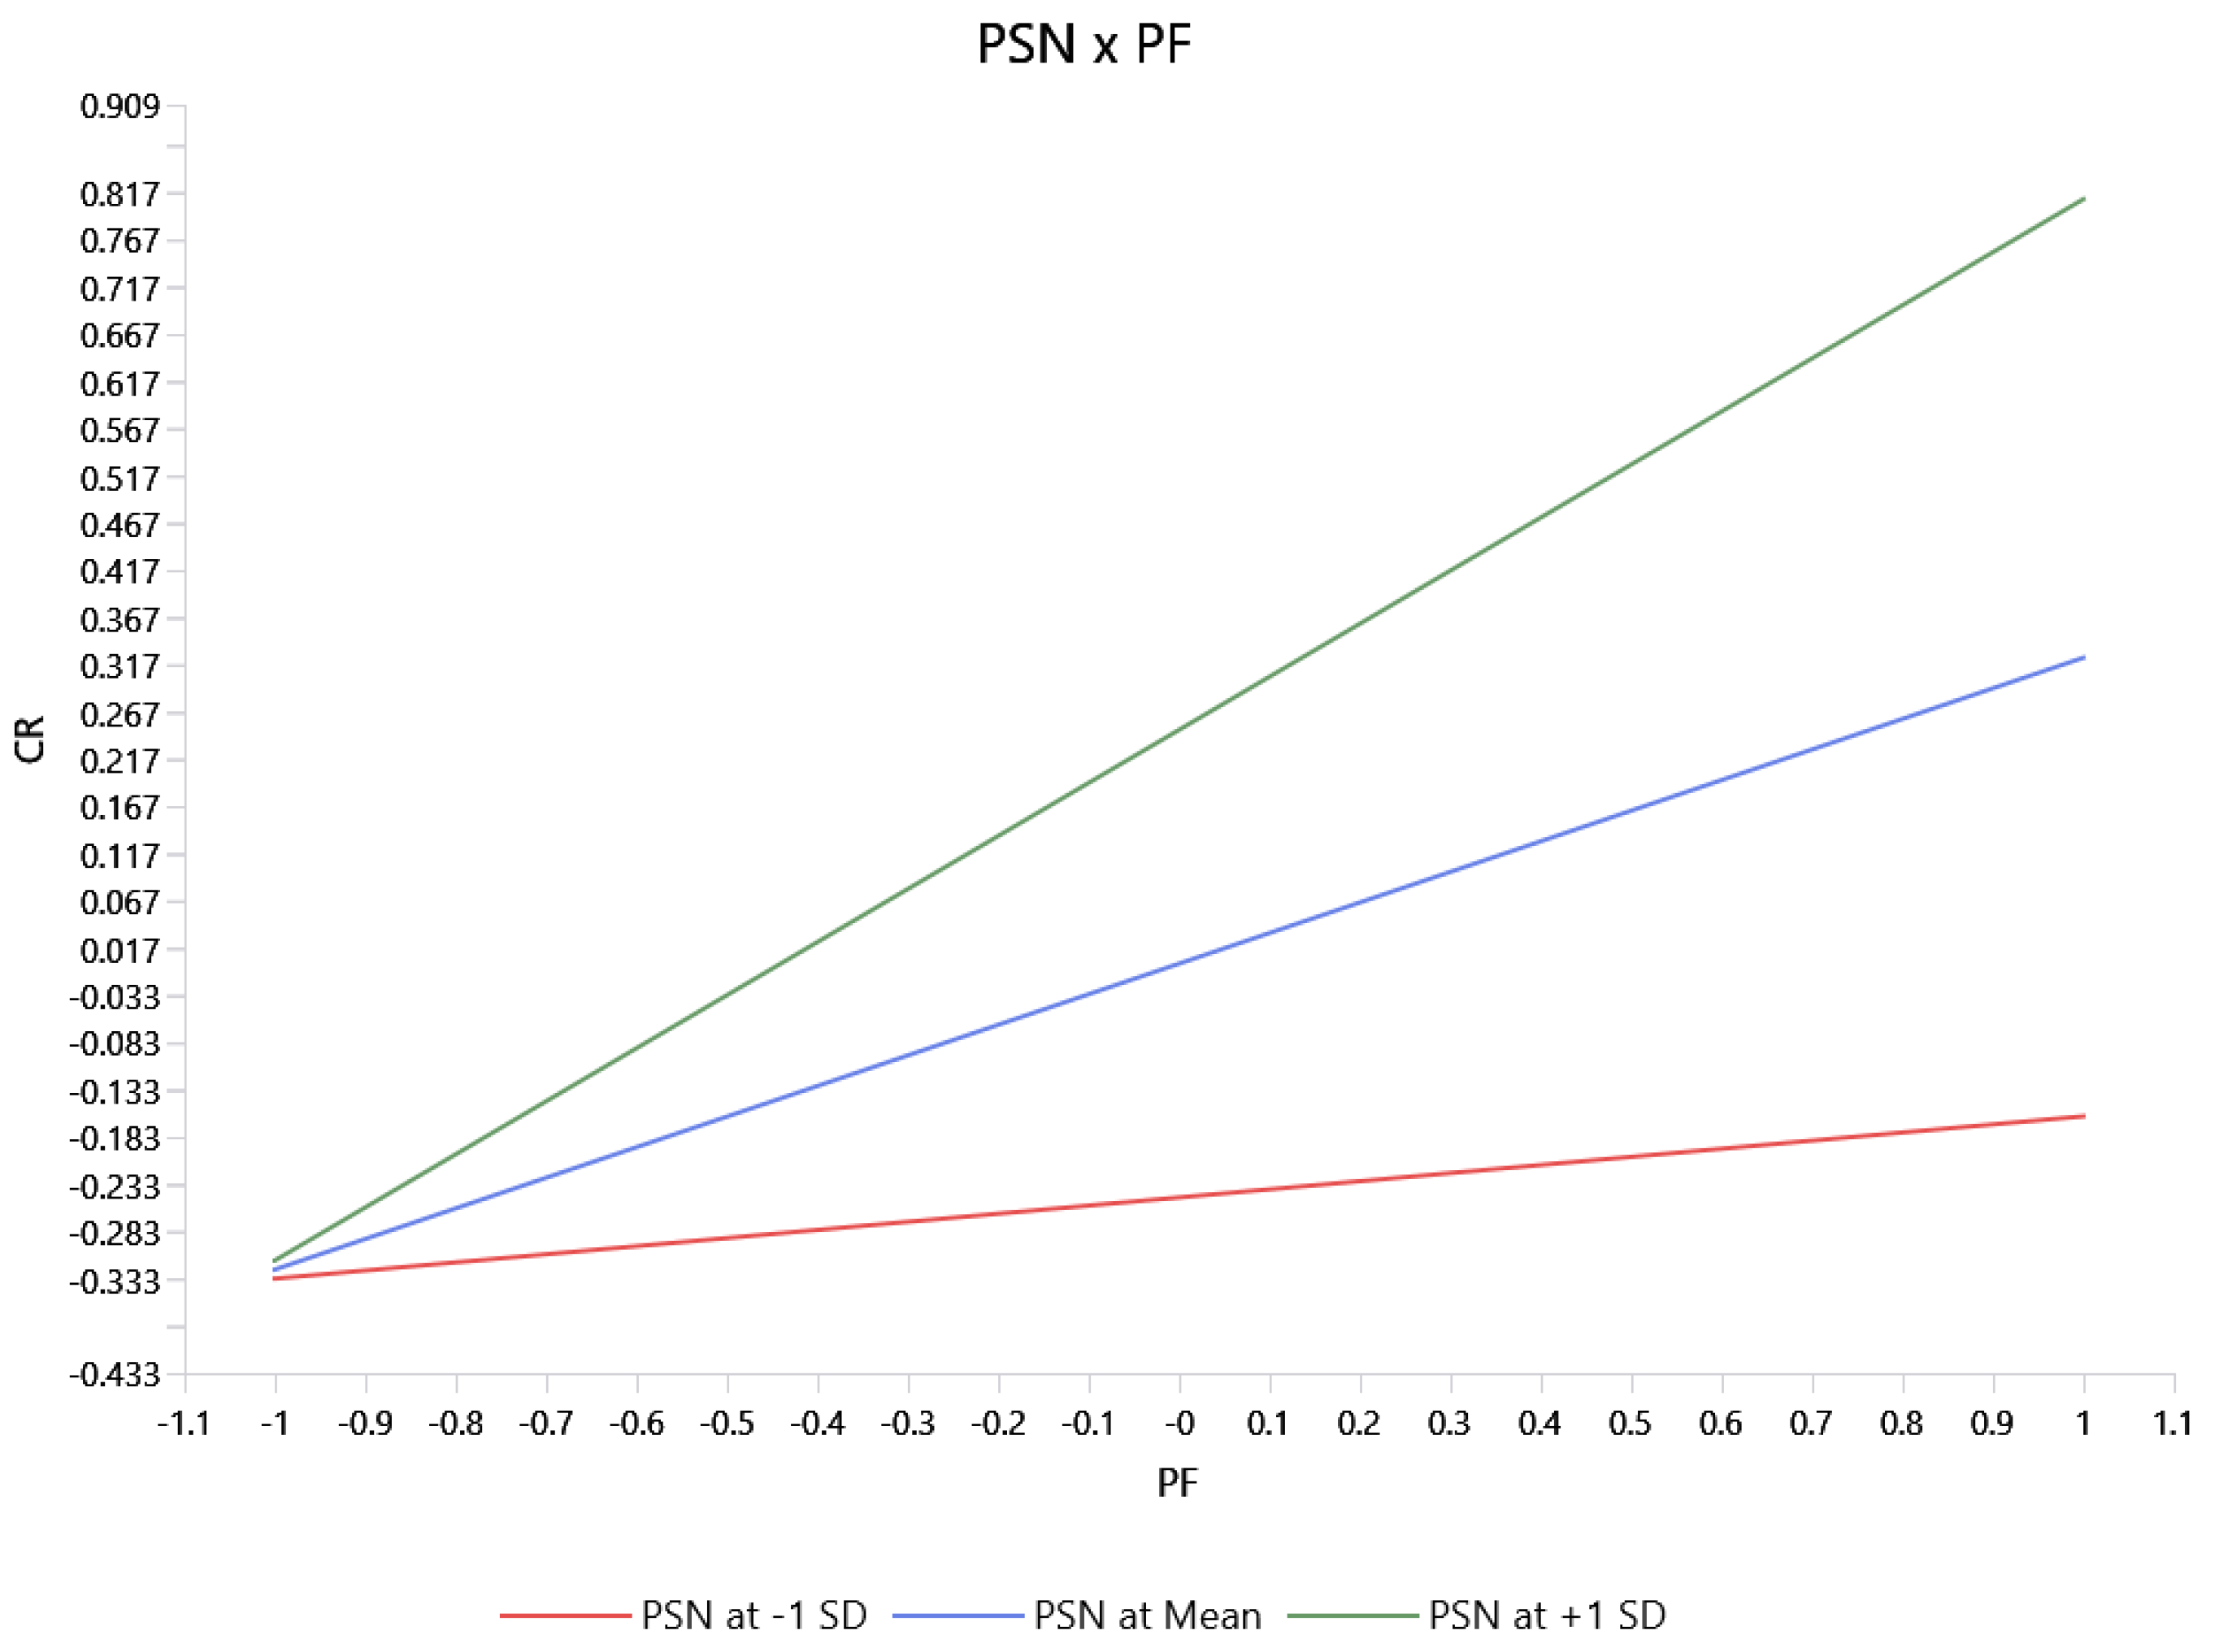
The moderation hypotheses involving Perceived Social Norms (PSN) were fully supported (H6 and H7 accepted). The interaction term (Int. PF × PSN) on CR was significant (beta = 0.238, T = 7.637, p < 0.001). The interaction term (Int. PF × PSN) on PD was significant (beta = 0.164, T = 4.878, p < 0.001). Moderation slopes are given in Appendix B (Figure A4 and Figure A5).
4.3.2. Specific Indirect Effects (Mediation)
Table 7 also shows that Perceived Fairness (PF) mediates the effects from the predictor variables to the outcomes. All linear indirect effects (e.g., CA to PF to CR, beta = 0.068, p < 0.001) and all quadratic indirect effects (e.g., QE CA–PF to PF to CR, beta = −0.050, p < 0.001) were statistically significant, confirming the positive and curvilinear mediation mechanisms.
4.4. Multi-Group Analysis (MGA) Results
The MGA, using the permutation test in SmartPLS, was conducted to determine differences in the structural model between the China and Pakistan samples. The results of MICOM and MGA are reported in Table 8. The MICOM results indicate the establishment of measurement invariance across groups, as the permutation p-values for Step 2, Step 3a, and Step 3b were greater than 0.05. Hence, the inter-group comparison was suitable. The MGA results show that most path differences were not significant. The PF–PD path only showed a marginal difference, suggesting that the impact of perceived fairness on purchase decisions might differ slightly between the two countries. This outcome, however, should be interpreted with caution, since it represented a marginal rather than significant difference at the 5% level.
Table 8.
Measurement invariance and multi-group differences (China vs. Pakistan).
Table 9 (PLS-MGA) shows that most structural paths are not significantly different between the two groups (permutation p-value > 0.10). The PF → PD relationship was the only cross-country difference, with a path coefficient difference of −0.146 and a permutation p-value marginally above the standard 5% threshold. This indicates that the perceived fairness effect on purchase decisions may be greater in the Pakistani sample, but this difference must be interpreted with caution, as it is not significant at the 5% level.
Table 9.
Path coefficients—MGA.
The bootstrapping results in Table 10 provide additional within-group evidence regarding the strength and significance of each structural path in the China and Pakistan samples. The PF → PD pathway was significant in both countries and appeared stronger in Pakistan (β = 0.288, t = 5.954, p < 0.001) than in China (β = 0.142, t = 2.159, p = 0.031).
Table 10.
Bootstrapping results.
The PSN moderation effect on PF → PD was also significant in both countries and appeared stronger in Pakistan (β = 0.185, t = 3.729, p < 0.001) than in China (β = 0.119, t = 2.362, p = 0.018).
The direct effect of PSN on CR was significant in both countries and appeared stronger in China (β = 0.299, t = 5.837, p < 0.001) than in Pakistan (β = 0.207, t = 3.961, p < 0.001).
5. Discussion
The results provide empirical evidence for the proposed model and a more detailed explanation of the relationship between organizational capabilities and customer outcomes, based on perceived fairness. Rather than implying that increased levels of cultural adaptability, service efficiency, and brand commitment are necessarily advantageous, the findings demonstrate that these capabilities are directly associated with perceived fairness in a nonlinear fashion. This pattern suggests that customers may evaluate firm behavior through fair exchange and relationship expectations. Thus, the results extend SET by suggesting that fairness-based reciprocity may be weakened when organizational initiatives appear excessive, and extend CTT by indicating that relationship-building capabilities are most effective at moderate levels. These findings are consistent with recent empirical evidence in marketing and service research suggesting that organizational capabilities may exhibit diminishing marginal effects under certain conditions (e.g., customer expectation escalation and authenticity perceptions).
The results for CA indicate positive linear and negative quadratic effects of CA on PF. This suggests that cultural adaptability may enhance fairness perceptions at lower and moderate levels, while its marginal effect may decline at higher levels. This result aligns with previous literature demonstrating that intercultural adaptation can enhance customer judgments when it indicates respect and responsiveness [12]. This nonlinear finding, however, builds on previous research that primarily viewed cultural adaptation as an unconditionally positive phenomenon [46]. This finding is consistent with prior studies in service management showing that efficiency enhances customer evaluations but may generate diminishing returns when it reduces perceived human touch and responsiveness. When taken too far, however, adaptation can be less genuine or even too strategic, thereby undermining its fairness-enhancing influence.
The results with SE also confirm the inverted U-shaped relationship. Service efficiency appears to be an important driver of perceived fairness at lower levels, as timely, reliable, and hassle-free service can indicate that the company appreciates customers’ time and resources. The present result is in line with previous research demonstrating that efficiency and service performance are related to positive customer ratings [47,48]. The negative quadratic effect, however, suggests that efficiency may lose its fairness-promoting effect when it becomes over-standardized, hastened, and impersonalized. This finding aligns with diminishing-returns logic and supports the view that efficiency needs to be balanced with fairness and responsiveness in service systems [49].
The results for BC indicate that brand commitment is positively related to PF, though the relationship weakens at high levels of brand commitment. This finding aligns with research indicating that ethical brand practices and customer loyalty can reinforce positive brand appraisal [50,51]. This result aligns with existing relationship marketing literature suggesting that strong brand commitment enhances customer evaluations but may also increase expectation pressure and sensitivity to imbalance at higher levels. Within the context of CTT, commitment may boost confidence in the relationship and predispose customers to view brand behavior more positively. The negative quadratic effect, however, indicates that a strong commitment can also increase expectations and sensitivity to imbalance. As customers become extremely loyal, they may become more sensitive to perceived imbalance when dependence on the brand increases. Thus, the finding builds on existing studies of brand relationships by demonstrating that commitment can yield diminishing returns to fairness when expectations are excessively high.
The positive correlation between PF and CR supports H4 and aligns with previous research indicating that fairness perceptions enhance loyalty and relationship continuity [52,53]. In light of SET, customers may feel motivated to maintain the relationship when they perceive fairness. In terms of CTT, relationship confidence is equally backed by fairness, which explains why customers tend to remain loyal to a brand they believe has treated them fairly. Therefore, the result builds on previous fairness studies by demonstrating that PF predicts time-lagged customer retention.
The positive relationship between PF and PD supports H5 and is consistent with previous findings that fairness perceptions are related to purchasing judgments [17,22]. This finding is in line with prior studies indicating that fairness perceptions reduce perceived risk and enhance purchase intention and decision confidence. When customers consider a brand’s rules, value delivery, and complaint handling as fair, they may make a positive purchase decision, as perceived risk decreases and exchange confidence is strengthened. This result also substantiates the integrated SETCTT logic, since fairness-based exchange evaluations may be reflected in subsequent purchase-related behavior.
The moderation result for H6 indicates that PSN enhances the relationship between PF and CR. This observation aligns with research that found that social and personal norms can support repurchase and relationship-maintenance intentions [54]. This supports existing literature highlighting the role of social norms in strengthening fairness-based behavioral responses. Fairness perceptions are behaviorally effective when important others endorse the customer relationship with a brand, since ongoing patronage is socially acceptable. This extends the logic of fair exchange by demonstrating that customer retention is not only based on individual fairness judgments but also on the societal context in which these judgments are formed.
The moderation result for H7 shows that PSN also enhances the relationship between PF and PD. This observation aligns with previous studies that found that social norms affect consumer decision-making and can strengthen norm-consistent purchasing behavior [24,55]. This is consistent with prior evidence that social approval enhances the influence of fairness perceptions on consumer decision-making. Perceptions of fairness in this research were more significantly related to purchase decisions when customers had a stronger sense of social approval of the brand. This means purchase decisions based on fairness are not solely individual judgments; perceived social approval also influences them.
Overall, the findings suggest that organizational capabilities do not always generate linear improvements in customer evaluations but may instead exhibit diminishing marginal effects under certain contextual conditions.
5.1. Implications
5.1.1. Theoretical Implications
This research paper makes three theoretical contributions. Firstly, it builds on SET by demonstrating how organizational capabilities influence customer outcomes in terms of perceived fairness as an exchange-evaluation process. This is indicated by the finding that customers do not directly respond to firm capabilities; rather, they assess whether those capabilities generate equal, balanced, and reciprocal value. Second, the research expands CTT by demonstrating that relationship continuity and purchase choices correlate with equity perceptions in a time-lagged context. This explains why fairness-based judgments could help maintain customer loyalty and buying behaviors. Third, the results support the idea that CA, SE, and BC contradict the linear more-is-better assumption by demonstrating that they exhibit inverted U-shaped associations with PF. This nonlinear evidence implies that organizational capabilities can generate decreasing returns to fairness when they are excessive, inauthentic, impersonal, or expectation-generating.
5.1.2. Managerial Implications
The results indicate that managers must be cautious not to assume that increased cultural adaptation, faster service, or greater brand commitment will necessarily lead to better customer judgments. Rather, companies ought to monitor how these capabilities are perceived as genuine, receptive, and just. Cultural adaptation should not seem artificial but rather should respect customer values. Effort should be minimized, while empathy, explanation, and personal attention should be maintained to enhance service efficiency. Brand promise plans must cultivate confidence without fostering false hopes or undue reliance. Managers are also encouraged to use PF as a key indicator of relationship management by establishing equitable values and clear regulations, and handling complaints with respect. Lastly, since most MGA differences were not significant, managers must beware of overgeneralizing about country differences. The marginal difference in the PF and PD relationship indicates that fairness might be particularly pertinent when making purchase decisions in Pakistan, but this must be interpreted with caution. To operationalize these insights, firms can implement structured fairness-monitoring tools such as customer fairness dashboards, service efficiency–empathy balancing metrics, and real-time complaint fairness tracking systems to ensure that cultural adaptation, service efficiency, and brand commitment remain within optimal ranges rather than excessive levels.
5.2. Limitations and Future Research Directions
The two-wave design is better at achieving temporal separation, but it captures only two time points in the customer relationship process. Multi-wave longitudinal designs should be employed in future research to examine how perceived fairness, retention, and purchase decisions change over time. Due to the limited number of countries included in the study (China and Pakistan), the results must be interpreted with caution and may not generalize to other cultural and market environments.
Convenience sampling via social media platforms could also reduce sample representativeness and introduce selection bias, as respondents with higher internet activity or stronger brand engagement might have been more likely to participate. To enhance external validity, probability- or panel-based sampling should be used in future studies.
Although the matched sample at the end was balanced across both countries, there may have been non-response bias due to attrition between Time 1 and Time 2. Future research should conduct a more systematic comparison between retained and non-retained respondents to assess potential non-response bias. Lastly, since the research is observational and based on self-reported data, the findings can only be interpreted as time-lagged relationships, not causal ones.
Future research can further extend this model by examining dynamic capability evolution across multiple time points, enabling a more fine-grained understanding of how organizational capabilities and fairness perceptions co-develop over time. In addition, future studies may incorporate objective behavioral or transactional data (e.g., CRM logs or purchase records) to validate self-reported measures and reduce perceptual bias. Finally, extending the framework to additional service contexts and emerging digital environments (such as AI-enabled customer interaction systems or platform-based services) would help validate the robustness and boundary conditions of the proposed nonlinear effects.
Future research could further integrate nonlinear capability effects, cultural heterogeneity, and multidimensional fairness perceptions within a unified modeling framework to better capture the boundary conditions of organizational capability effectiveness.
6. Conclusions
This paper explored the relationships between cultural adaptability, service provision efficiency, brand commitment and customer retention and purchase decisions based on perceived fairness. Based on two-wave data from China and Pakistan, the results indicate that all three organizational capabilities positively affect perceived fairness and also have negative quadratic effects. These findings suggest that there can be a threshold beyond which fairness perceptions may not improve due to diminishing returns, depending on the organizational capabilities. The results also indicate that perceived fairness is positively correlated with customer retention and purchase decisions, and that perceived social norms reinforce these correlations. The work adds to SET and CTT by framing perceived fairness as a key process that connects organizational capabilities and customer outcomes. Overall, the results indicate that companies need to consider balanced, credible, and fairness-oriented relationship approaches rather than presuming that increased organizational effort will inevitably result in more favorable customer responses.
Author Contributions
J.Y. supervised the research. U.K. conceptualized and wrote the original draft. N.K. reviewed and edited the manuscript. A.T. conducted the formal analysis and contributed to the resources. All authors have read and agreed to the published version of the manuscript.
Funding
This article was funded with support from the European Commission, EACEA. EU4DUAL project 101089937. The authors would like to express their gratitude to the European Commission and EACEA for their financial support in making the research possible.
Institutional Review Board Statement
The study was conducted in accordance with the Declaration of Helsinki. The study protocol was formally reviewed and approved by the Academic Ethics Committee of the Business School, Sichuan University, China (Reference number: SCU20250303003; Date: 3 March 2025). The committee confirmed that the study fully meets all institutional and national ethical standards required for formal research approval.
Informed Consent Statement
Informed consent was obtained from all subjects involved in the study. Participants were fully informed about the study’s purpose, their rights to anonymity, and the voluntary nature of their participation through an introductory section in the questionnaire. Consent was obtained via an electronic implied-consent procedure; specifically, completing and submitting the questionnaire during the data collection period (Time 1: April 2025 and Time 2: June 2025) indicated the participants’ voluntary agreement to participate.
Data Availability Statement
The data for this study are available at the following link: https://osf.io/sf5bv/?view_only=6ebff562914d40cca407a1ad2cd1b36a (accessed on 14 May 2026).
Conflicts of Interest
The authors declare no conflicts of interest.
Appendix A. Questionnaire
Title: Driving Customer Retention and Purchase Decisions: A Two-Wave Time-Lagged Study on Organizational Capabilities, Perceived Fairness, and Diminishing Returns.
Purpose: Your feedback is invaluable in helping us to understand the impact of product transparency and pricing strategy on customer behavior.
Anonymity: Your responses will remain strictly anonymous and will be used for research purposes only. No identifiable private information will be collected.
Participation: This study involves data collection in two phases (Time 1 and Time 2). Your participation in the final phase allows us to draw strong research conclusions.
Informed Consent: By proceeding with this survey, you confirm that your participation is voluntary, and you agree to take part in both phases of the research.
I have read the above information and agree to participate.
- Appendix A section 1: Demographic Information:
- Gender
- Male
- Female
- Age
- 18–30 years old
- 31–40 years old
- 41–50 years old
- More than 50 years old
- Location
- Pakistan
- China
- Education Level
- High School or Lower
- Associate Degree
- Bachelor’s Degree
- Master’s Degree
- Doctorate/PhD
- Others
- Occupation
- Working
- Self-Employed
- Unemployed
- Housewife
- Pensioner/Retired
- Student
- Per month Income
- Less than $200
- $200 to $500
- $500 to $1000
- More than $1000
- Prefer not to say
- Frequency of Purchases
- Weekly
- Monthly
- Quarterly
- Annually
- Rarely
- Product Categories that I mostly buy from brands
- Electronics
- Clothing
- Household Goods
- Food & Beverages
- Services (e.g., digital services, healthcare)
- All mentioned above
- Appendix A Section 2: Core Constructs (Time 1 and Time 2)
The following statements examine various factors influencing customer retention and purchase decisions, measured at two time points to capture the causal effect. Please use the 5-point scale for your responses, where 1 = Strongly Disagree, 3 = Neutral, and 5 = Strongly Agree.
- Time 1 Constructs (Antecedents)
Instruction: Please indicate your level of agreement with the statements below (1 = Strongly Disagree to 5 = Strongly Agree).
- Cultural Adaptability (CA)
- 9.
- Brands respect the cultural values that are most significant to me.
- 10.
- The firm modifies its services to accommodate clients from diverse cultural backgrounds.
- 11.
- Brands know the expectations of people from my culture.
- 12.
- Brands interact in a culturally appropriate manner.
- Service Efficiency (SE)
- 13.
- Brands provide services with punctuality.
- 14.
- The company handles service recovery processes promptly.
- 15.
- I find it effortless to obtain the solutions I want from brands.
- 16.
- The customer service procedure is seamless and effective.
- Brand Commitment (BC)
- 17.
- I feel a personal connection to brands.
- 18.
- I’m dedicated to sticking with brands.
- 19.
- I stick with the brands even when other choices are available.
- 20.
- I have a strong bond with brands.
- Time 2 Constructs (Mediator, Moderator, & Outcomes)
Instruction: Thinking about your experience over the past month, please indicate your level of agreement with the statements below (1 = Strongly Disagree to 5 = Strongly Agree).
- Perceived Fairness (PF) (Mediator)
- 21.
- I believe brands are fair to their customers.
- 22.
- The business has fair rules that are easy to understand and follow.
- 23.
- I think the value I get here is fair for the money I spend.
- 24.
- The company fairly approaches complaints.
- Perceived Social Norms (PSN) (Moderator)
- 25.
- My circle of influence supports my brand associations.
- 26.
- My family and friends also have a positive impression of brands.
- 27.
- Using brands brings me a social endorsement.
- 28.
- People who are important to me believe I should continue using these brands.
- Customer Retention (CR) (Outcome Variable)
- 29.
- I intend to continue purchasing from these brands in the future.
- 30.
- I consider this brand my first choice for this type of product/service.
- 31.
- I will remain loyal to this brand, even if a competitor offers a lower price.
- 32.
- I am committed to maintaining my relationship with this brand in the long term. (New 4th Item)
- Purchase Decision (PD) (Outcome Variable)
- 33.
- Over the next six months, I intend to purchase more from these brands than I do currently.
- 34.
- I plan to increase my spending on this brand’s offerings.
- 35.
- I frequently purchase a wide variety of products/services from this brand.
- 36.
- I recommend and purchase this brand’s products whenever possible.
Appendix B. Slopes
Figure A1.
Quadratic slope of cultural adaptability on perceived fairness. Note: Blue dots represent observed responses, and the solid blue curve represents the fitted quadratic trend line.
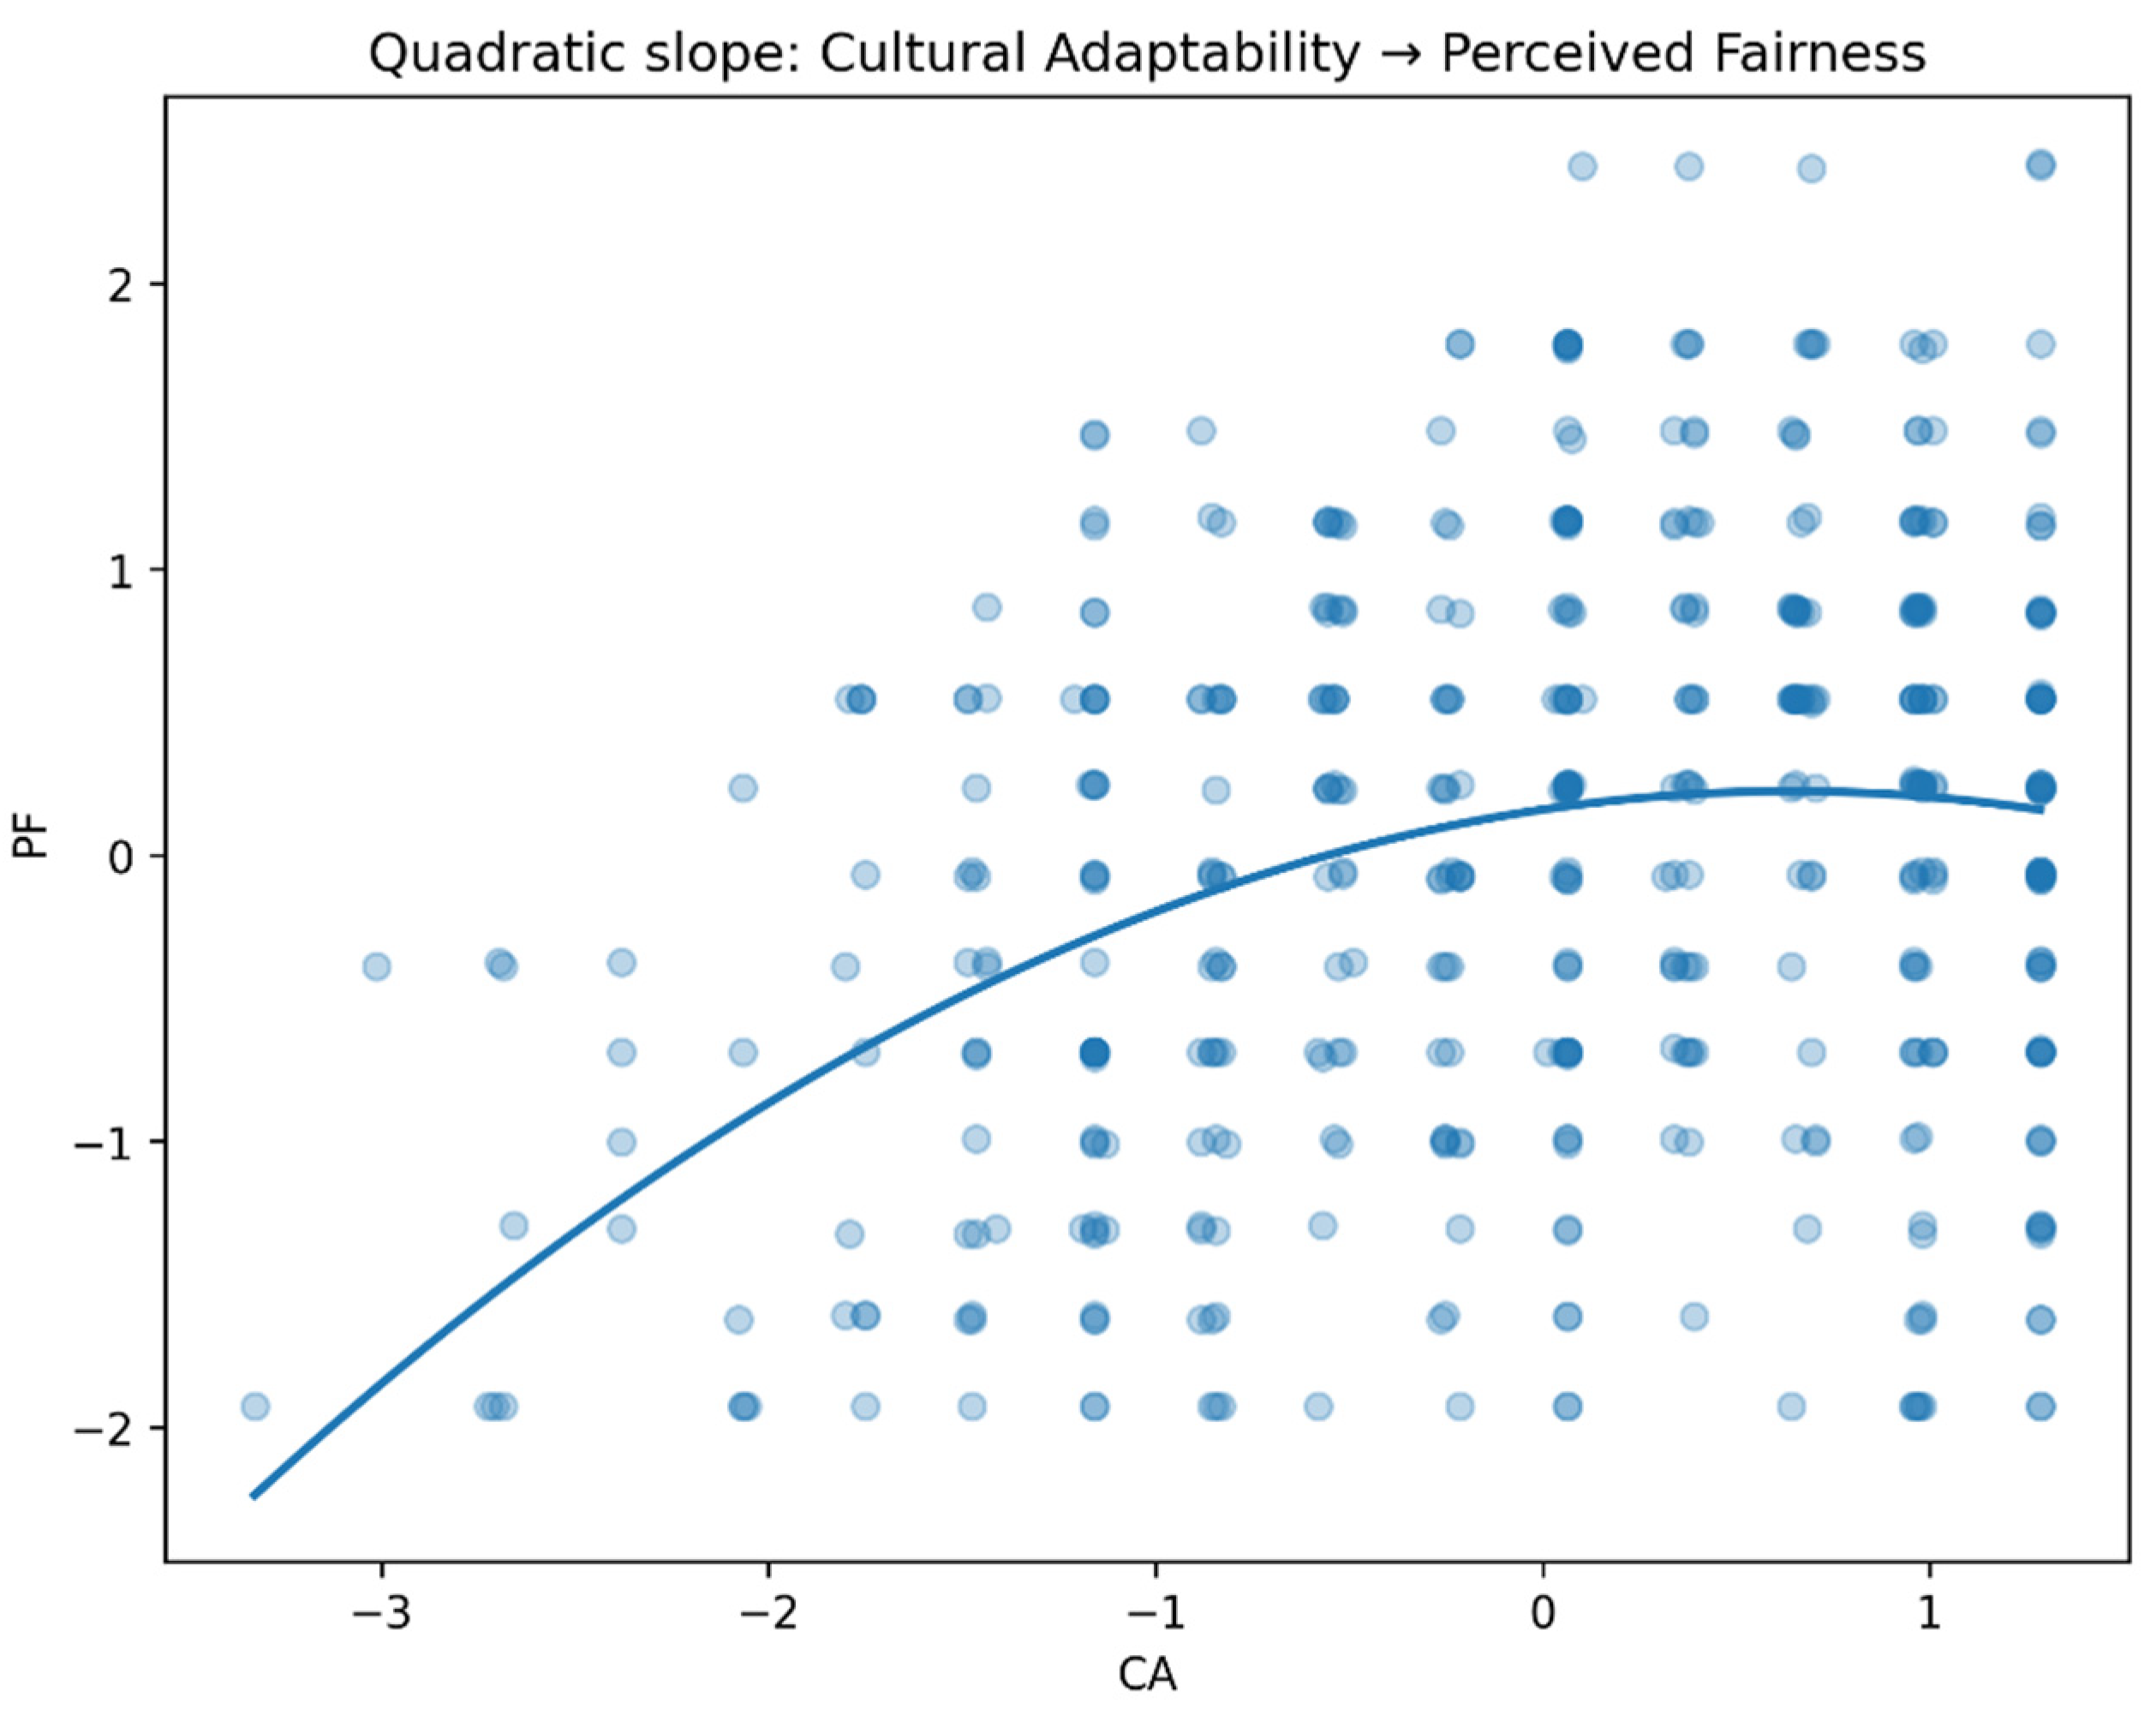
Figure A2.
Quadratic slope of service efficiency on perceived fairness. Note: Blue dots represent observed responses, and the solid blue curve represents the fitted quadratic trend line.
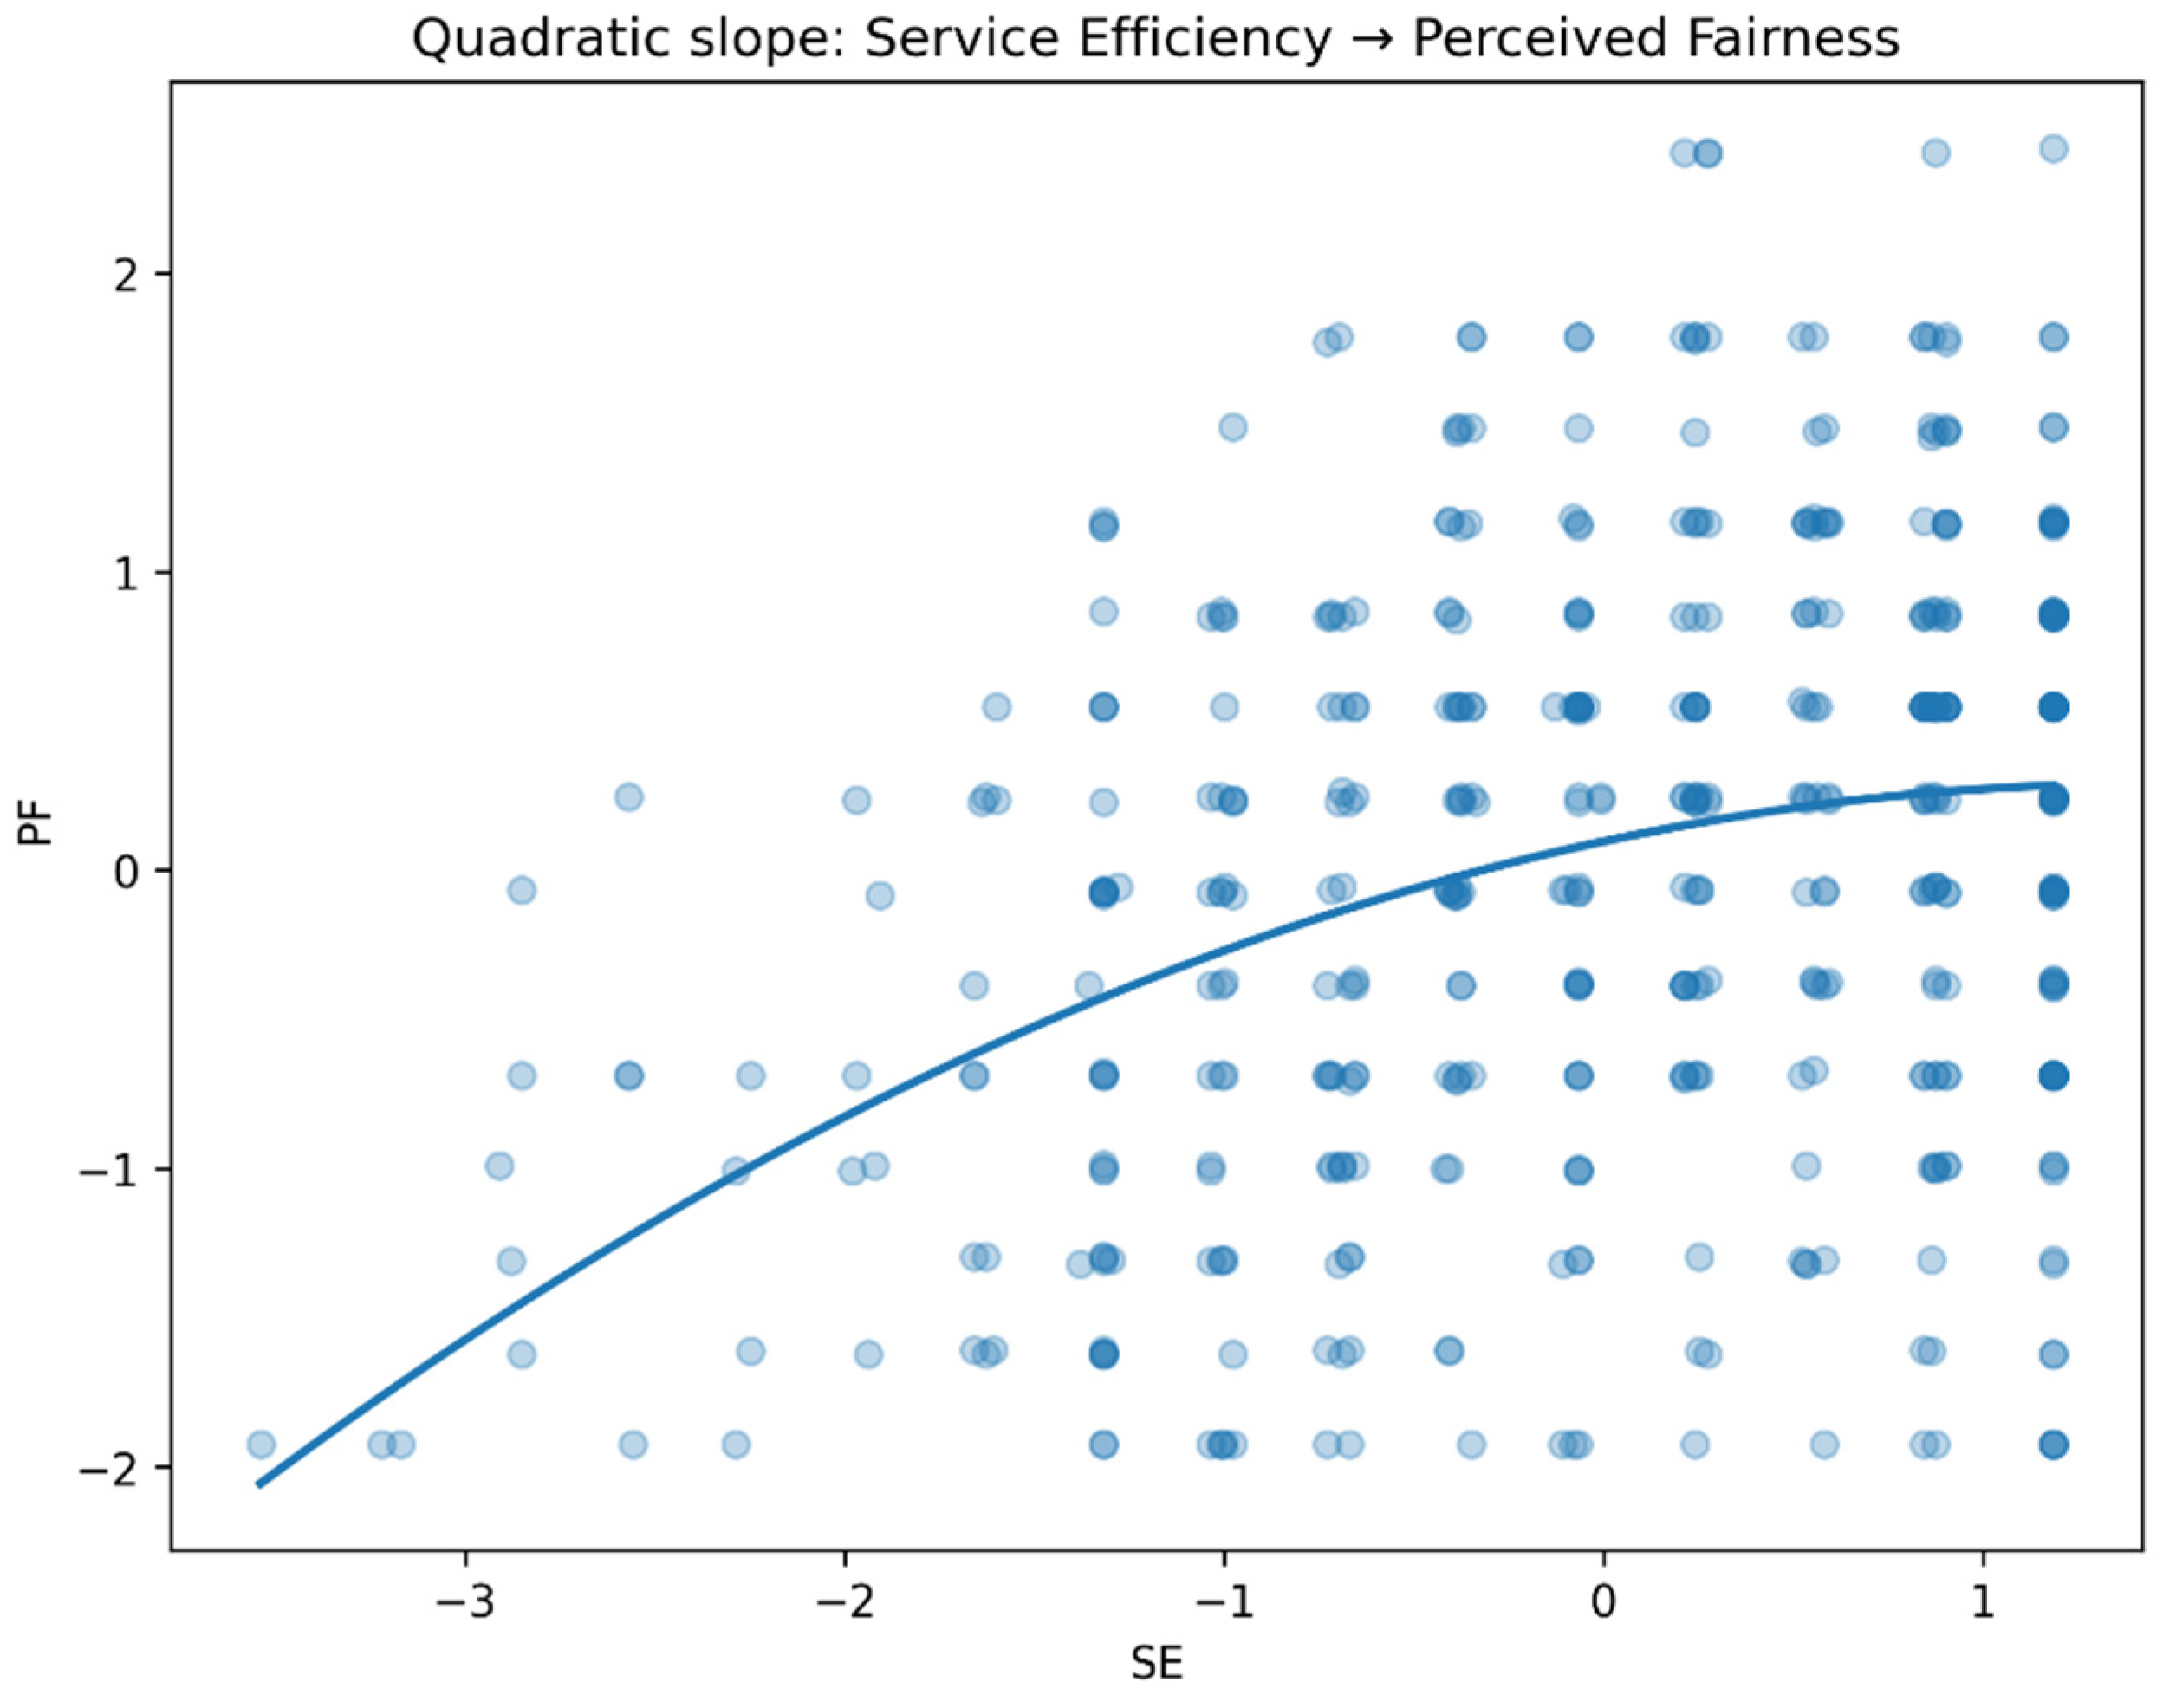
Figure A3.
Quadratic slope of brand commitment on perceived fairness. Note: Blue dots represent observed responses, and the solid blue curve represents the fitted quadratic trend line.
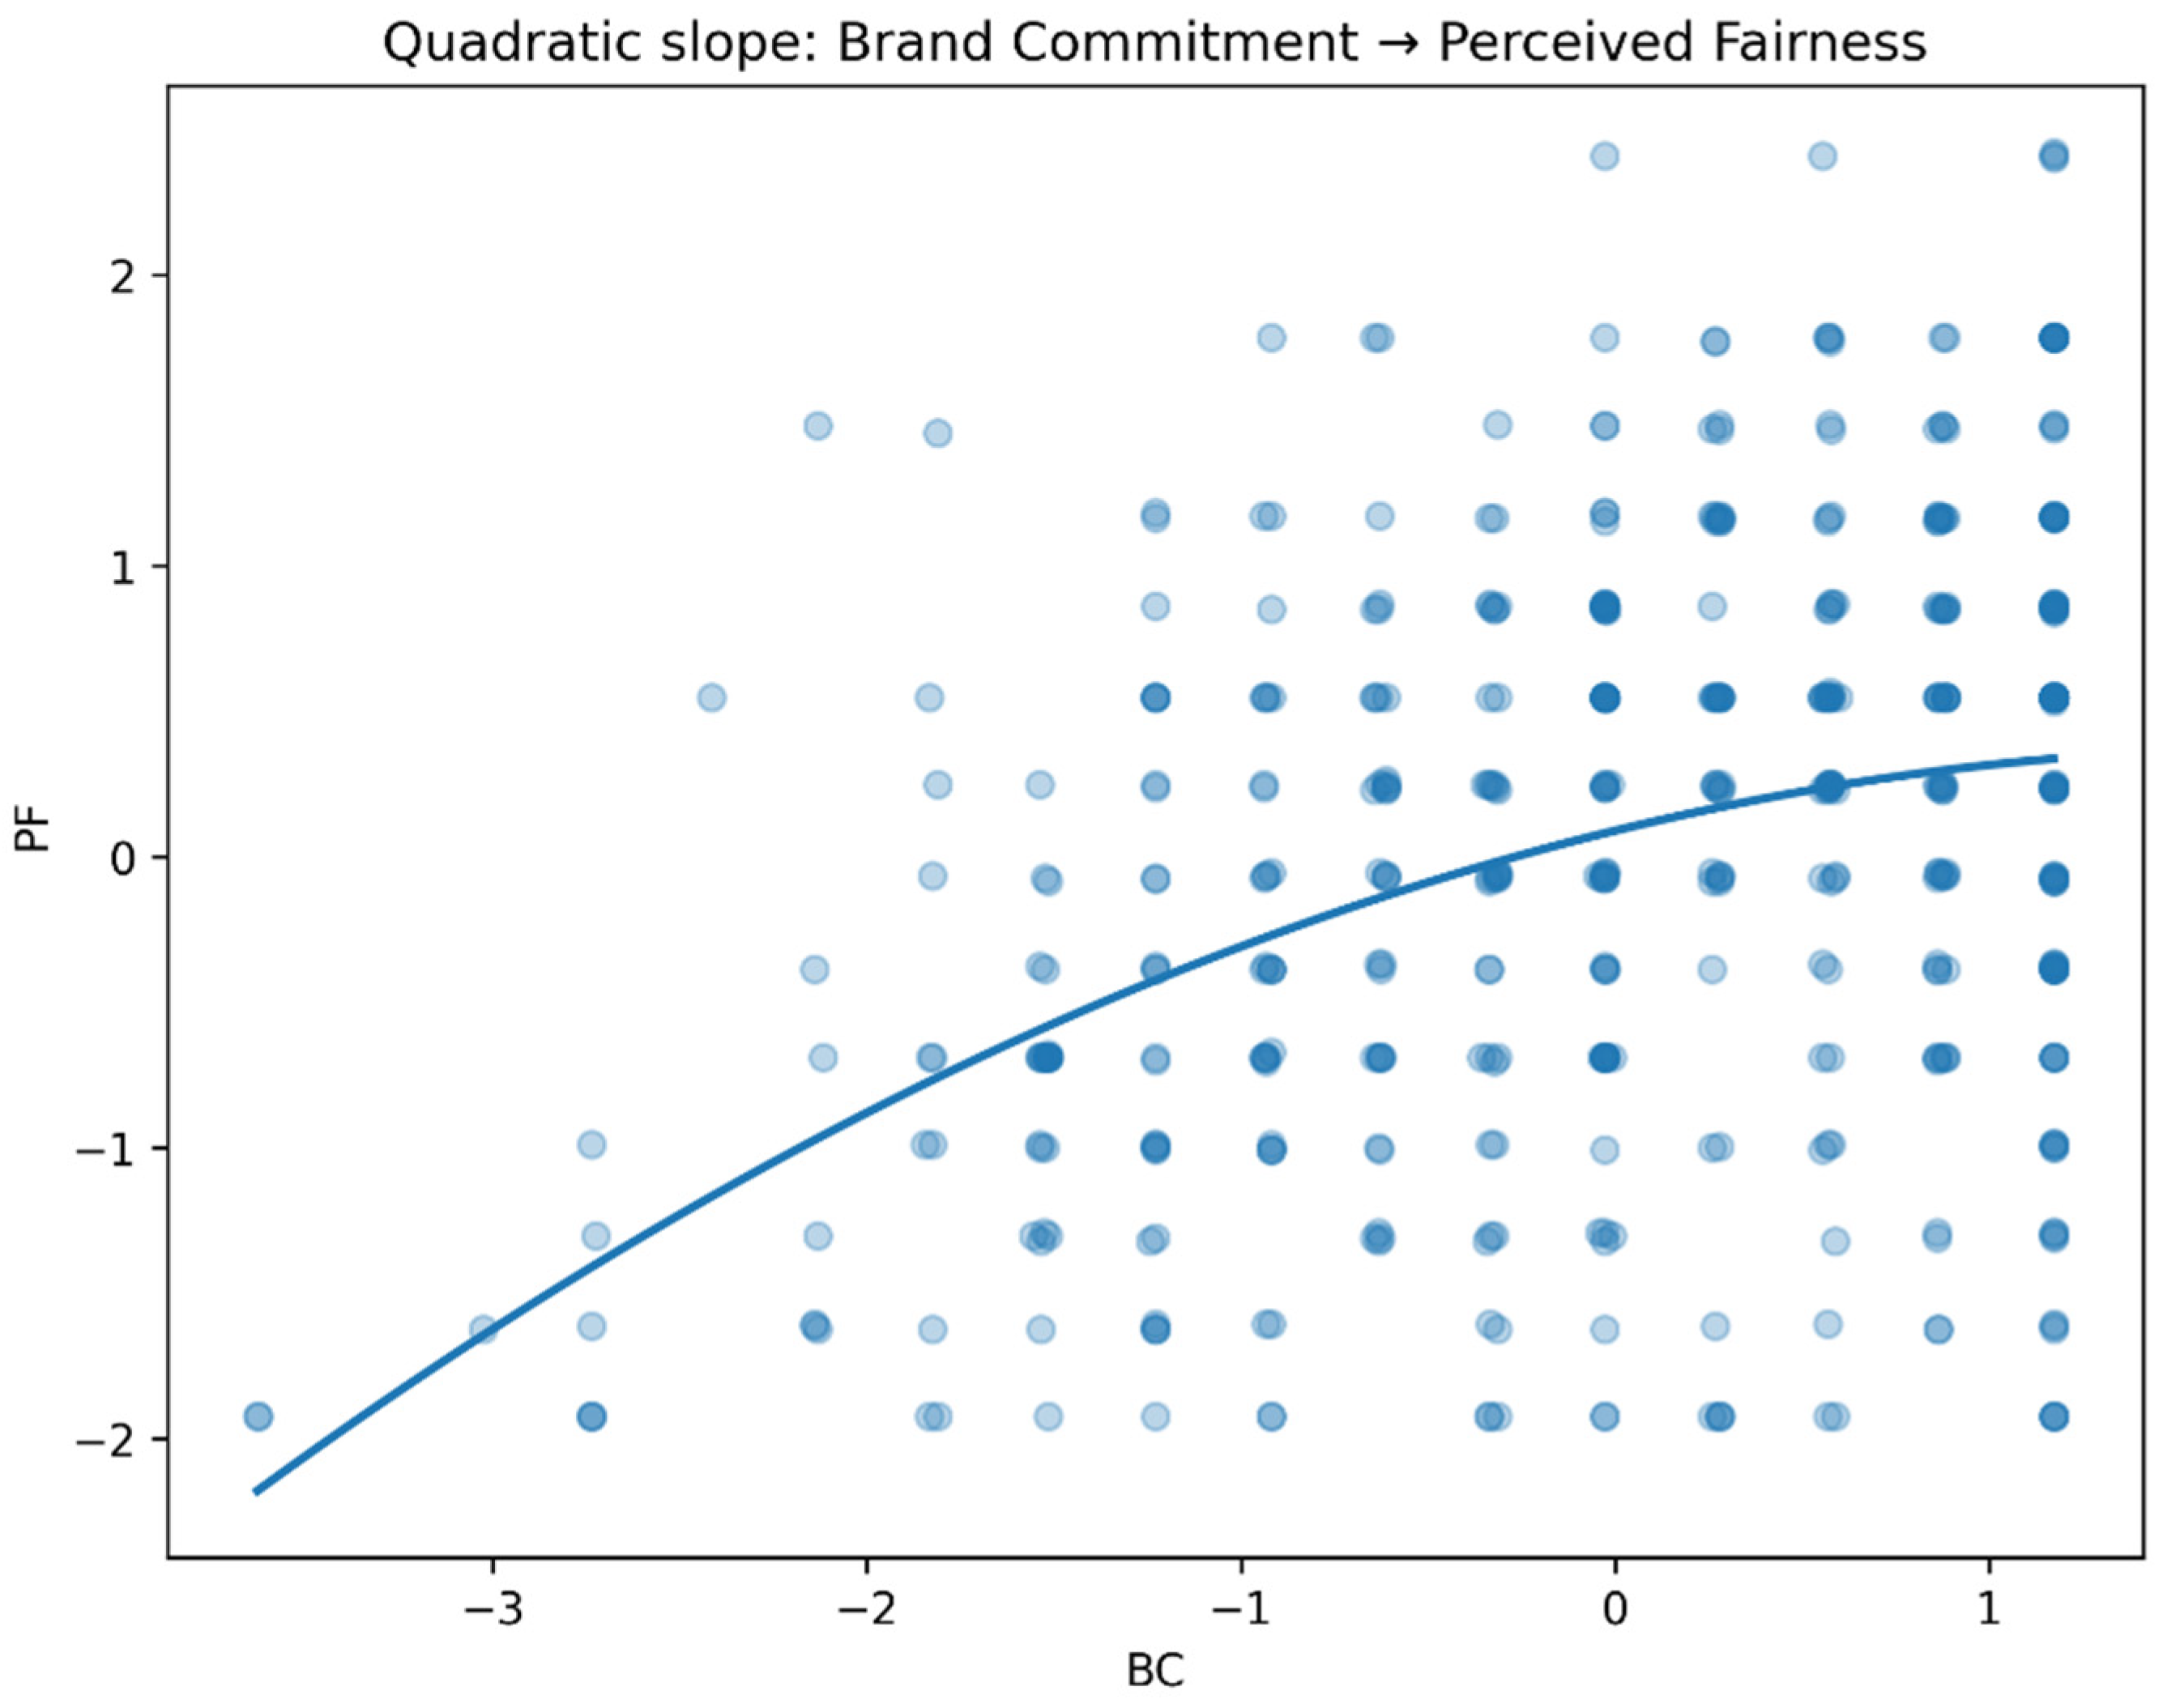
Figure A4.
Moderating effect of PSN on the PF–PD relationship.
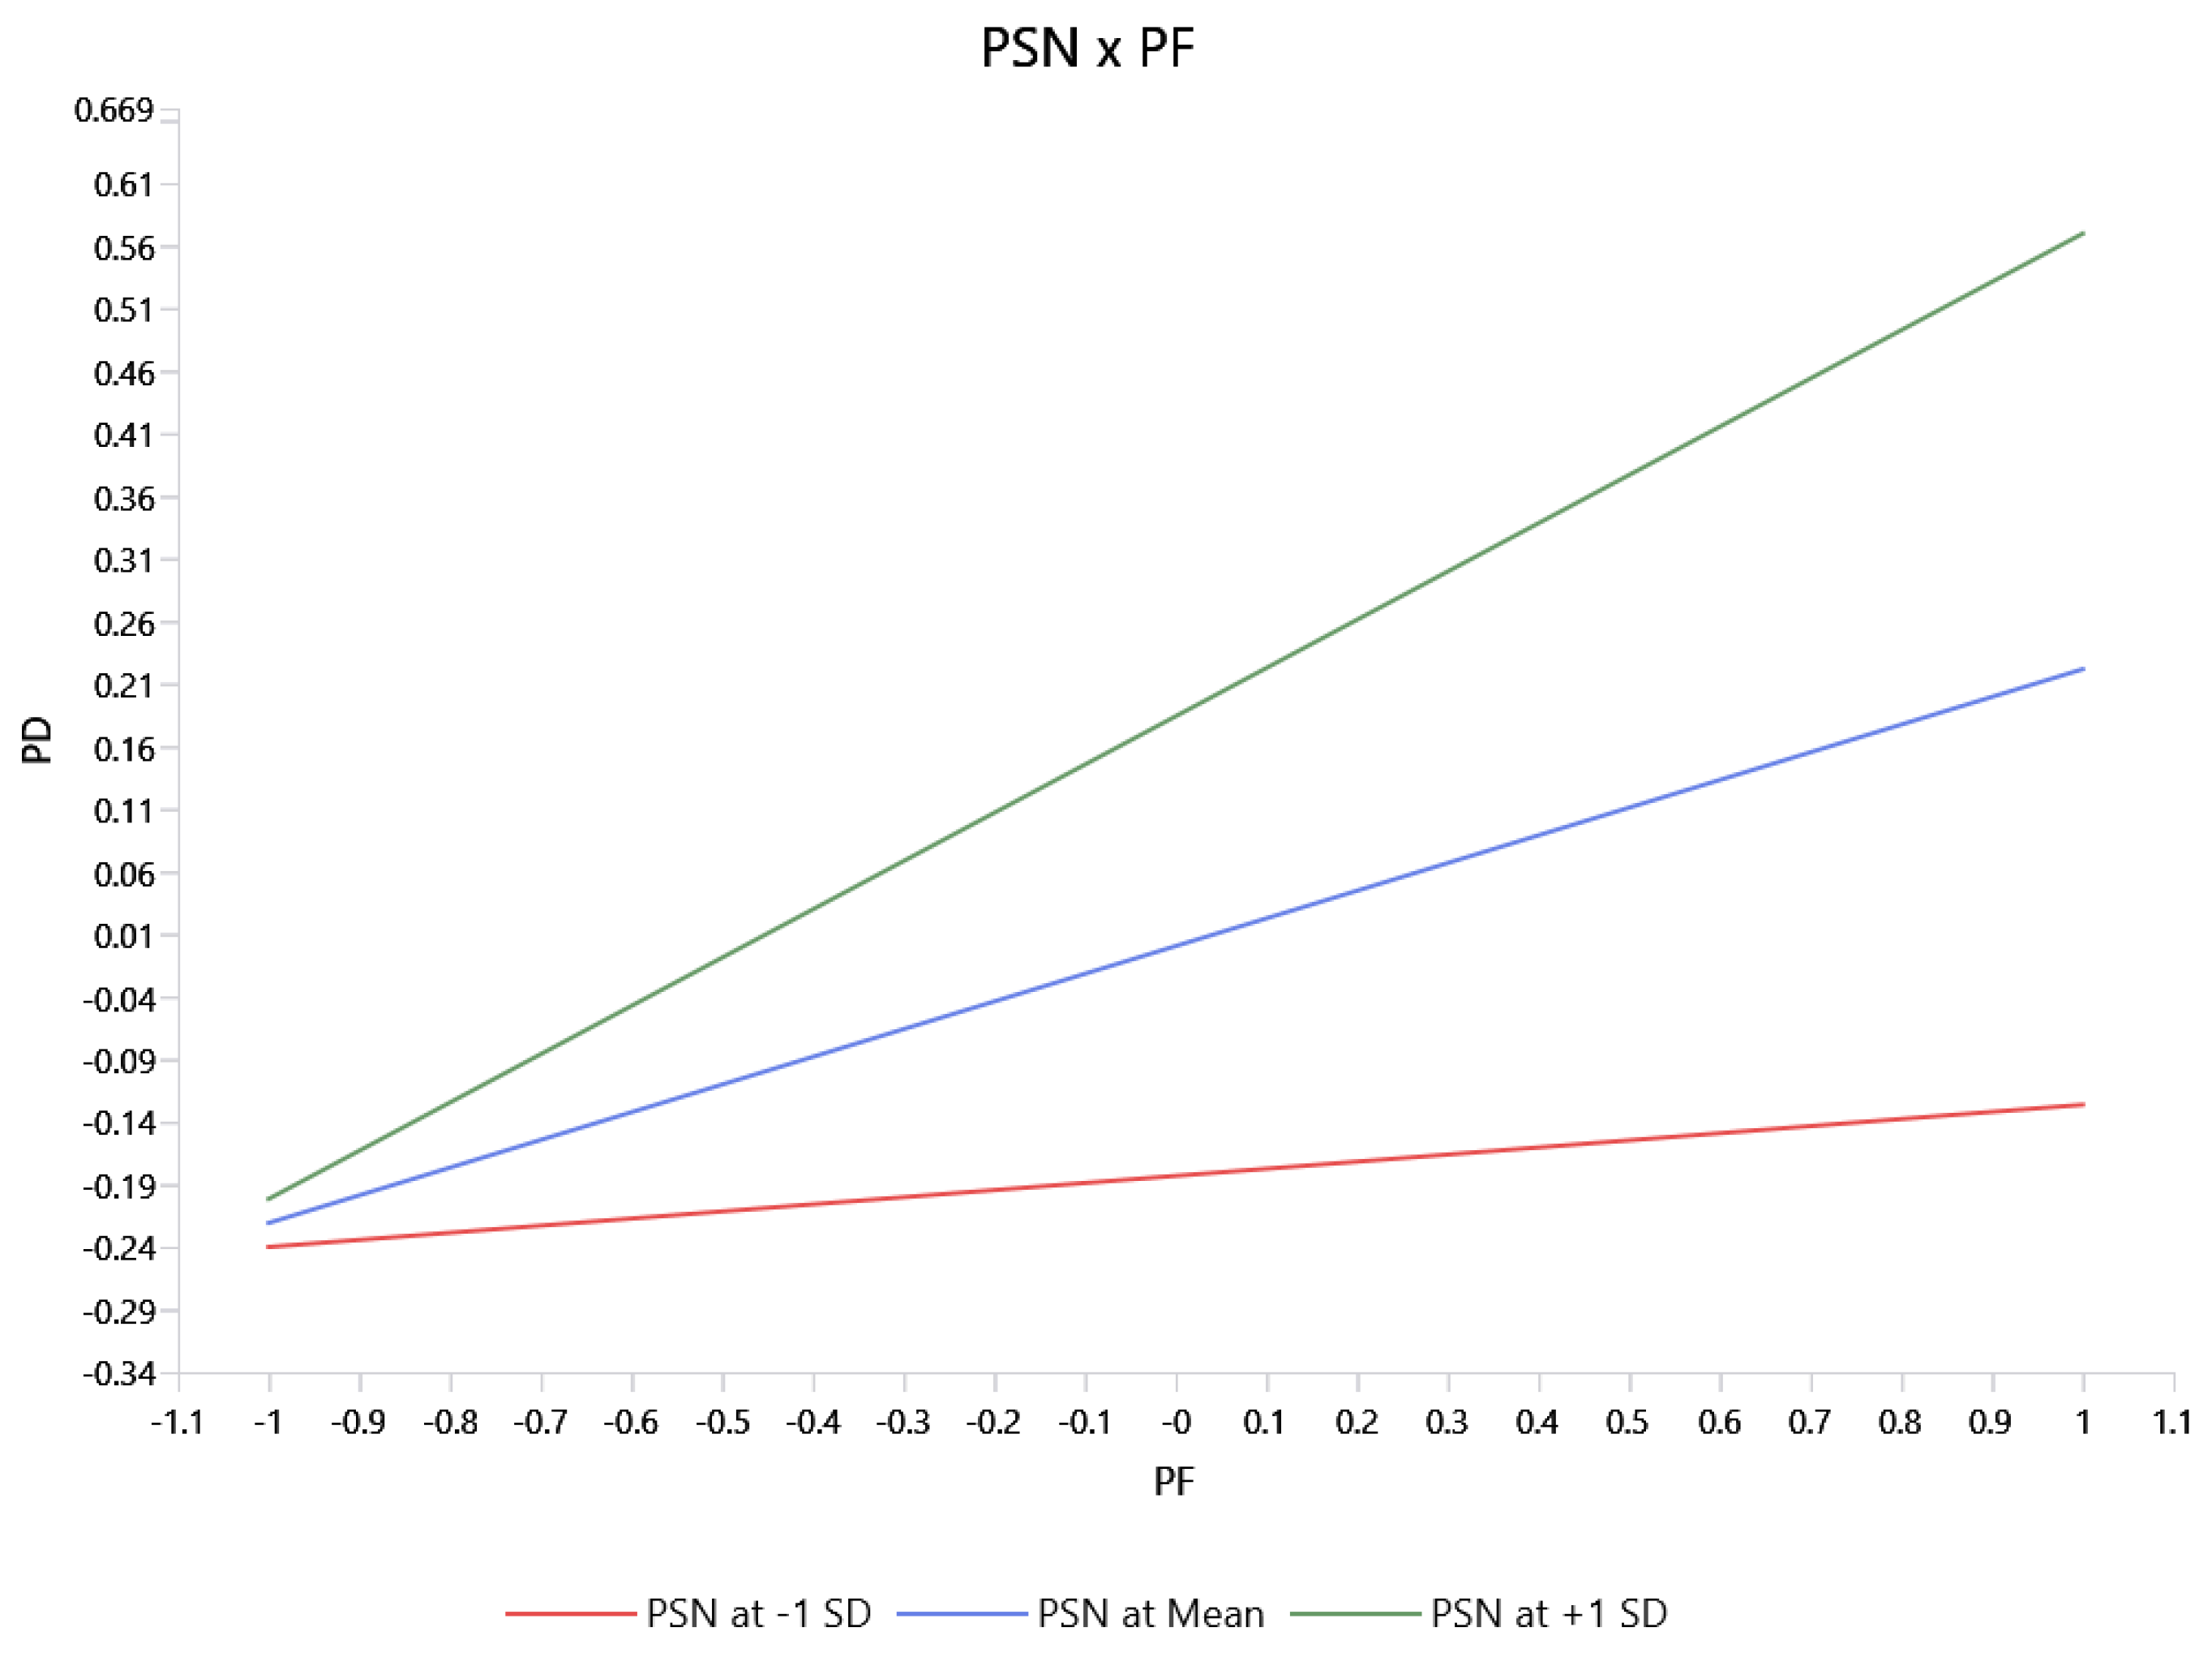
Figure A5.
Moderating effect of PSN on the PF–CR relationship.
References
- Singh, C.; Dash, M.K.; Sahu, R.; Kumar, A. Artificial intelligence in customer retention: A bibliometric analysis and future research framework. Kybernetes 2024, 53, 4863–4888. [Google Scholar]
- Kim, M.; Choi, D.; Guay, R.P.; Chen, A. How does fairness promote innovative behavior in organizational change?: The importance of social context. Appl. Psychol. 2024, 73, 1233–1260. [Google Scholar]
- Constantino, S.M.; Pianta, S.; Rinscheid, A.; Frey, R.; Weber, E.U. The source is the message: The impact of institutional signals on climate change–related norm perceptions and behaviors. Clim. Change 2021, 166, 35. [Google Scholar] [CrossRef] [Scilit]
- Garai-Fodor, M.; Vasa, L.; Jäckel, K. Characteristics of consumer segments based on perceptions of the impact of digitalisation. Decis. Mak. Appl. Manag. Eng. 2023, 6, 975–993. [Google Scholar] [CrossRef] [Scilit]
- Fatma, M.; Khan, I. Corporate social responsibility and brand advocacy among consumers: The mediating role of brand trust. Sustainability 2023, 15, 2777. [Google Scholar] [CrossRef] [Scilit]
- Schaarschmidt, M.; Walsh, G.; Dose, D.B.; Christ-Brendemühl, S. Customer integration, fairness perceptions, and silent endurance in digital versus human service interactions. Eur. Manag. J. 2023, 41, 34–46. [Google Scholar] [CrossRef] [Scilit]
- Badrinarayanan, V.; Ramachandran, I. Relational exchanges in the sales domain: A review and research agenda through the lens of commitment-trust theory of relationship marketing. J. Bus. Res. 2024, 177, 114644. [Google Scholar] [CrossRef] [Scilit]
- Tan, K.; Agnew, C.R.; Hadden, B.W. Seeking and ensuring interdependence: Desiring commitment and the strategic initiation and maintenance of close relationships. Personal. Soc. Psychol. Bull. 2020, 46, 36–50. [Google Scholar]
- Meira, J.V.d.S.; Hancer, M. Using the social exchange theory to explore the employee-organization relationship in the hospitality industry. Int. J. Contemp. Hosp. Manag. 2021, 33, 670–692. [Google Scholar] [CrossRef] [Scilit]
- Moliner-Tena, M.A.; Monferrer-Tirado, D.; Estrada-Guillén, M. Customer engagement, non-transactional behaviors and experience in services: A study in the bank sector. Int. J. Bank Mark. 2019, 37, 730–754. [Google Scholar] [CrossRef] [Scilit]
- Woo, E.-J.; Kang, E. Employee environmental capability and its relationship with corporate culture. Sustainability 2021, 13, 8684. [Google Scholar] [CrossRef] [Scilit]
- Tariq, A.; Lorenz, M.P.; Thompson, W.F. Too real? The conflicting roles of adaptation and authenticity in intercultural service encounters. J. Serv. Mark. 2023, 37, 957–972. [Google Scholar] [CrossRef] [Scilit]
- Chowdhury, M.M.H.; Sajib, S.; Scerri, M.; Khan, E.A. A decision model for efficient service design in the sharing economy: A service triad perspective. Asia Pac. J. Mark. Logist. 2022, 34, 2007–2031. [Google Scholar]
- Caruelle, D.; Lervik-Olsen, L.; Gustafsson, A. The clock is ticking—Or is it? Customer satisfaction response to waiting shorter vs. longer than expected during a service encounter. J. Retail. 2023, 99, 247–264. [Google Scholar] [CrossRef] [Scilit]
- Guru, R.R.D.; Paulssen, M.; Japutra, A. Role of brand attachment and satisfaction in driving customer behaviors for durables: A longitudinal study. Eur. J. Mark. 2024, 58, 217–254. [Google Scholar] [CrossRef] [Scilit]
- Ohlwein, M.; Bruno, P. A brand like a friend—How brand likeability influences brand perception. Int. J. Mark. Res. 2022, 64, 295–305. [Google Scholar]
- Senali, M.G.; Iranmanesh, M.; Ghobakhloo, M.; Foroughi, B.; Asadi, S.; Rejeb, A. Determinants of trust and purchase intention in social commerce: Perceived price fairness and trust disposition as moderators. Electron. Commer. Res. Appl. 2024, 64, 101370. [Google Scholar] [CrossRef] [Scilit]
- Aksoy, N.C.; Yazici, N. Does justice affect brand advocacy? Online brand advocacy behaviors as a response to hotel customers’ justice perceptions. J. Retail. Consum. Serv. 2023, 73, 103310. [Google Scholar] [CrossRef] [Scilit]
- Magatef, S.; Al-Okaily, M.; Ashour, L.; Abuhussein, T. The impact of electronic customer relationship management strategies on customer loyalty: A mediated model. J. Open Innov. 2023, 9, 100149. [Google Scholar] [CrossRef] [Scilit]
- Chen, J.; Yu, B.; Chen, B.; Liu, Z.J.O. Lenient vs. stringent returns policies in the presence of fraudulent returns: The role of customers’ fairness perceptions. Omega 2023, 117, 102843. [Google Scholar] [CrossRef] [Scilit]
- Freeman, G.; Wu, K.; Nower, N.; Wohn, D.Y. Pay to win or pay to cheat: How players of competitive online games perceive fairness of in-game purchases. Proc. ACM Hum.-Comput. Interact. 2022, 6, 1–24. [Google Scholar] [CrossRef] [Scilit]
- Yu, S.; Zhong, Z.; Zhu, Y.; Sun, J. Green emotion: Incorporating emotional perception in green marketing to increase green furniture purchase intentions. Sustainability 2024, 16, 4935. [Google Scholar] [CrossRef] [Scilit]
- Fodor, M.G.; Vasa, L.; Popovics, A. Sustainable consumption from a domestic food purchasing perspective among Hungarian generation Z. Decis. Mak. Appl. Manag. Eng. 2024, 7, 401–417. [Google Scholar]
- Melnyk, V.; Carrillat, F.A.; Melnyk, V. The influence of social norms on consumer behavior: A meta-analysis. J. Mark. 2022, 86, 98–120. [Google Scholar]
- Gupta, P.; Singh, S.; Broccardo, L.; Alzeiby, E.A. Examining the link between CSR perceptions and employee advocacy through organizational justice: Can corporate hypocrisy mitigate? Corp. Soc. Responsib. Environ. Manag. 2024, 32, 615–634. [Google Scholar] [CrossRef] [Scilit]
- Podsakoff, P.M.; MacKenzie, S.B.; Lee, J.-Y.; Podsakoff, N.P. Common method biases in behavioral research: A critical review of the literature and recommended remedies. J. Appl. Psychol. 2003, 88, 879. [Google Scholar] [CrossRef] [Scilit] [PubMed]
- Witte, N.; Schaurer, I.; Schröder, J.; Décieux, J.P.; Ette, A. Enhancing participation in probability-based online panels: Two incentive experiments and their effects on response and panel recruitment. Soc. Sci. Comput. Rev. 2023, 41, 768–789. [Google Scholar]
- Kai Liao, Y.; Wu, W.-Y.; Dao, T.C.; Ngoc Luu, T.-M. The influence of emotional intelligence and cultural adaptability on cross-cultural adjustment and performance with the mediating effect of cross-cultural competence: A study of expatriates in Taiwan. Sustainability 2021, 13, 3374. [Google Scholar]
- Malinowska-Lipień, I.; Brzyski, P.; Gabryś, T.; Gniadek, A.; Kózka, M.; Kawalec, P.; Brzostek, T.; Squires, A. Cultural adaptation of the safety attitudes questionnaire–short form (SAQ-SF) in Poland. PLoS ONE 2021, 16, e0246340. [Google Scholar] [PubMed]
- Nawafleh, S. Development programs and achieving service efficiency in public sector institutions in Jordan: E-government as a moderator. Poverty Public Policy 2022, 14, 268–286. [Google Scholar]
- Tinnilä, M. Measurement of service efficiency in different types of banking services: Mass services, service factories, service shops, and professional services. Int. J. Serv. Sci. Manag. Eng. Technol. 2013, 4, 47–67. [Google Scholar]
- Binu Raj, A. Internal branding, employees’ brand commitment and moderation role of transformational leadership: An empirical study in Indian telecommunication context. Asia-Pac. J. Bus. Adm. 2022, 14, 285–308. [Google Scholar]
- Siqueira, J.R.; Peña-García, N.; ter Horst, E.; Molina, G.; Villamil, M. The role of brand commitment in the retail sector: The relation with open innovation. J. Open Innov. Technol. Mark. Complex. 2021, 7, 154. [Google Scholar] [CrossRef] [Scilit]
- Bae, K.B. The differing effects of individual-and group-based pay for performance on employee satisfaction: The role of the perceived fairness of performance evaluations. Public Manag. Rev. 2023, 25, 601–619. [Google Scholar]
- Jia, F.; Wei, L.; Jiang, L.; Hu, Z.; Yang, Z. Curbing opportunism in marketing channels: The roles of influence strategy and perceived fairness. J. Bus. Res. 2021, 131, 69–80. [Google Scholar] [CrossRef] [Scilit]
- Sipilä, J.; Alavi, S.; Edinger-Schons, L.M.; Müller, U.; Habel, J. Corporate social responsibility and perceived fairness of price increases. Psychol. Mark. 2022, 39, 1370–1384. [Google Scholar] [CrossRef] [Scilit]
- Irimia-Diéguez, A.; Velicia-Martín, F.; Aguayo-Camacho, M. Predicting FinTech innovation adoption: The mediator role of social norms and attitudes. Financ. Innov. 2023, 9, 36. [Google Scholar] [CrossRef] [Scilit] [PubMed]
- Akahori, W.; Yamashita, N.; Jamieson, J.; Nakatani, M.; Hashimoto, R.; Watanabe, M. The Impact of Social Norms on Hybrid Workers’ Well-Being: A Cross-Cultural Comparison of Japan and the United States. In Proceedings of the CHI Conference on Human Factors in Computing Systems, Honolulu, HI, USA, 11–16 May 2024. [Google Scholar]
- Leong, V.S.; Hj Ahady, D.M.; Muhamad, N. Corporate image as an enabler of customer retention. Int. J. Qual. Serv. Sci. 2022, 14, 486–503. [Google Scholar] [CrossRef] [Scilit]
- Li, B.; Mousa, S.; Reinoso, J.R.R.; Alzoubi, H.M.; Ali, A.; Hoang, A.D. The role of technology innovation, customer retention and business continuity on firm performance after post-pandemic era in China’s SMEs. Econ. Anal. Policy 2023, 78, 1209–1220. [Google Scholar]
- Ridwan, M. Purchasing Decision Analysis in Modern Retail. Akad. J. Mhs. Ekon. Bisnis 2022, 2, 1–9. [Google Scholar] [CrossRef] [Scilit]
- Bukhari, F.; Hussain, S.; Ahmed, R.R.; Mubasher, K.A.; Naseem, M.R.; Rizwanullah, M.; Nasir, F.; Ahmed, F. Consumers’ purchase decision in the context of western imported food products: Empirical evidence from Pakistan. Heliyon 2023, 9, e20358. [Google Scholar] [CrossRef] [Scilit] [PubMed]
- Rasoolimanesh, S.M. Discriminant validity assessment in PLS-SEM: A comprehensive composite-based approach. Data Anal. Perspect. J. 2022, 3, 1–8. [Google Scholar]
- Kock, N. Common method bias in PLS-SEM: A full collinearity assessment approach. Int. J. E-Collab. 2015, 11, 10. [Google Scholar]
- Lind, J.T.; Mehlum, H. With or without U? The appropriate test for a U-shaped relationship. Oxf. Bull. Econ. Stat. 2010, 72, 109–118. [Google Scholar] [CrossRef] [Scilit]
- Yang, F.; He, Y.; Xia, Z. The effect of perceived discrimination on cross-cultural adaptation of international students: Moderating roles of autonomous orientation and integration strategy. Curr. Psychol. 2023, 42, 19927–19940. [Google Scholar]
- Singh, G.; Slack, N.J.; Sharma, S.; Aiyub, A.S.; Ferraris, A. Antecedents and consequences of fast-food restaurant customers’ perception of price fairness. Br. Food J. 2022, 124, 2591–2609. [Google Scholar]
- Brunner, E.J.; Robbins, M.D.; Simonsen, B. Citizen perceptions of public school efficiency: Evidence from the US. Public Manag. Rev. 2024, 26, 1475–1497. [Google Scholar]
- Chin, C.; Gopalakrishnan, K.; Egorov, M.; Evans, A.; Balakrishnan, H. Efficiency and fairness in unmanned air traffic flow management. IEEE Trans. Intell. Transp. Syst. 2021, 22, 5939–5951. [Google Scholar] [CrossRef] [Scilit]
- Khan, I.; Fatma, M. Understanding the Influence of CPE on Brand Image and Brand Commitment: The Mediating Role of Brand Identification. Sustainability 2023, 15, 2291. [Google Scholar] [CrossRef] [Scilit]
- Junior, J.R.S.; ter Horst, E.; Molina, G.; Gunn, L.H.; Reinoso-Carvalho, F.; Sezen, B.; Peña-García, N. Branding in the eye of the storm: The impact of brand ethical behavior on brand commitment during the COVID-19 crisis in a South American country. J. Mark. Anal. 2022, 11, 95. [Google Scholar] [CrossRef] [Scilit]
- Correa, C.; Alarcón, D.; Cepeda, I. “I am Delighted!”: The Effect of Perceived Customer Value on Repurchase and Advocacy Intention in B2B Express Delivery Services. Sustainability 2021, 13, 6013. [Google Scholar] [CrossRef] [Scilit]
- Toussaint, P.A.; Thiebes, S.; Schmidt-Kraepelin, M.; Sunyaev, A. Perceived fairness of direct-to-consumer genetic testing business models. Electron. Mark. 2022, 32, 1621–1638. [Google Scholar] [PubMed]
- Chuah, S.H.-W.; Sujanto, R.Y.; Sulistiawan, J.; Aw, E.C.-X. What is holding customers back? Assessing the moderating roles of personal and social norms on CSR’S routes to Airbnb repurchase intention in the COVID-19 era. J. Hosp. Tour. Manag. 2022, 50, 67–82. [Google Scholar] [CrossRef] [Scilit]
- Jang, Y.-J.; Kim, E. Social and Personal Norms in Shaping Customers’ Environmentally Sustainable Behavior in Restaurants’ Social Media Communities. Sustainability 2023, 15, 6410. [Google Scholar] [CrossRef] [Scilit]

Disclaimer/Publisher’s Note: The statements, opinions and data contained in all publications are solely those of the individual author(s) and contributor(s) and not of MDPI and/or the editor(s). MDPI and/or the editor(s) disclaim responsibility for any injury to people or property resulting from any ideas, methods, instructions or products referred to in the content. |
© 2026 by the authors. Licensee MDPI, Basel, Switzerland. This article is an open access article distributed under the terms and conditions of the Creative Commons Attribution (CC BY) license.