


Abstract
Recommendation algorithms on ad-funded content platforms improve matching, but platforms know more about match quality than users and earn revenues that may diverge from users’ interests. We develop two game-theoretic models of the resulting recommendation bias. In a cheap-talk model with Bayesian consumers and asymmetric advertising commissions, truthful recommendation is an equilibrium if and only if the commission gap does not exceed the platform’s reputational stake. Beyond this bound, consumers with a weak outside option accept recommendations that always promote the high-commission item; with a strong outside option, the unique informative equilibrium is in mixed strategies, with bias and consumer discounting sustaining each other, and coexists with a babbling outcome. A platform free to choose its commitment retains partial bias and leaves consumers no better off, whereas any verifiable cap on misleading recommendations benefits consumers. In a Hotelling model of a vertically integrated platform, own-content bias arises from, and in equilibrium is proportional to, the platform’s revenue wedge between its own and third-party content. Bias diverts demand from the third-party provider and misallocates naive consumers; its effect on total welfare depends on whether its cost is a real resource cost. We discuss implications for audits, disclosure, and self-preferencing rules.
1. Introduction
Digital content platforms, including video-sharing sites, streaming services, news aggregators, and social media feeds, have become core infrastructures for the distribution and consumption of information. Because the number of available items far exceeds what any user can inspect, platforms rely on recommendation algorithms to match content with users. Recommendation algorithms improve matching, but they also create scope for recommendation bias: a platform that knows more about match quality than its users may distort its recommendations to raise its own revenue. Such bias lowers the quality of consumers’ choices and raises concerns about fair competition among content suppliers and about consumer protection [1,2,3,4].
Two features of ad-funded content platforms make the problem acute. First, platform revenue depends on which item a user engages with: different items carry different advertising loads and different commissions paid by content suppliers or advertisers. A recommendation is therefore a message sent by an interested party. Second, many platforms are vertically integrated. In addition to intermediating third-party content, they produce or license their own content. The platform then acts both as a competing supplier and as the party that ranks suppliers, which is the familiar setting of self-preferencing.
This paper addresses three questions. (i) When consumers are rational and anticipate that the platform may distort its recommendations, under what conditions can truthful recommendation be sustained in equilibrium, and what form does bias take when it cannot? (ii) How do the platform’s bias and consumers’ distrust determine each other, and can distrust be self-confirming? (iii) How does vertical integration into content supply affect recommendation bias, market shares, content quality, and welfare?
To address (i) and (ii), we model recommendation as a cheap-talk game in the spirit of Crawford and Sobel [5]. A platform privately observes the consumer’s match values for two content items, recommends one of them, and earns an item-specific advertising commission whenever the consumer accepts the recommendation; a consumer who rejects it leaves the platform and relies on independent search. Truthful recommendation is an equilibrium if and only if the commission gap between the items does not exceed the platform’s reputational stake in a good match. Beyond this bound, two regimes arise. If the consumer’s outside option is weak relative to her prior, she accepts every recommendation, and the platform always recommends the high-commission item. If the outside option is strong, the unique informative equilibrium is in mixed strategies: the platform misleads with the probability that keeps the consumer indifferent, and the consumer accepts recommendations of the high-commission item with the probability that keeps the platform indifferent. In this sense, bias and distrust sustain each other. This equilibrium coexists with the babbling outcome of every cheap-talk game, in which recommendations are ignored and the platform has no reason to make them informative; we call it the “distrust trap” and show that it survives a standard credibility refinement. We then study commitment. A truthful rule imposed on the platform raises both the consumer’s payoff and, when consumers are skeptical, the platform’s profit. A platform that can choose its own commitment, however, prefers a policy that keeps some bias and leaves the consumer exactly as well off as without commitment. Consumers therefore gain from transparency only if verifiable restrictions are imposed on the platform’s recommendation policy. A truthful rule is the strongest such restriction, but any verifiable limit on how often the platform recommends the high-commission item against its information makes consumers better off. This matters in practice because an external audit can more plausibly certify that commissions have only a bounded influence on rankings than that they have none.
To address (iii), we embed a reduced-form bias instrument in an extended Hotelling [6] model in which a vertically integrated platform competes with a third-party content provider in advertising intensity and content quality and chooses how strongly to tilt its recommendations toward its own content. Consumers in this model are naive in the sense that they do not correct for the bias. We derive the unique equilibrium in closed form. Bias arises from the platform’s revenue wedge, that is, from the difference between what it earns when a consumer chooses its own content and what it earns when she chooses third-party content, and in equilibrium it is proportional to this wedge. With equal commission rates, a pure intermediary has no wedge and chooses no bias, whereas the integrated platform always biases; with unequal commission rates, a pure intermediary biases too, as in our first model. Bias increases with consumers’ susceptibility and decreases with its cost; it diverts demand from the third-party provider, lowers the provider’s profit, and misallocates consumers relative to their true preferences. Whether total welfare falls depends on whether the private cost of bias is counted as a social loss, and the effect on consumer surplus depends on how both suppliers adjust their advertising loads; we report these numerical results separately from the analytical ones. If consumers are rational, the model becomes one of signal jamming: the platform still biases, but market shares are undistorted and the cost of bias is pure waste.
To show that the analytical results are accurate and can be used in practice, Section 5 reports a set of numerical experiments. We verify every closed-form result by independent computation: a Monte Carlo simulation of Lemma 1, an agent-based simulation of the equilibria of the first model, a brute force search for the platform’s optimal commitment, and a numerical best response computation of the equilibrium of the second model that does not use the closed form. We then calibrate the models to publicly documented contract terms, namely the commission schedule of a large affiliate program and the revenue shares of a large video platform’s partner program, and explain how platforms, regulators, and researchers can map the model’s parameters into observable quantities.
The paper makes three contributions. First, it treats consumers as Bayesian receivers who respond strategically to an interested platform and characterizes the full set of (monotone) equilibrium outcomes, including the role of the consumer’s outside option, the babbling outcome, and the value of different forms of commitment. Second, it embeds a parameterized recommendation bias in a tractable equilibrium model of a vertically integrated platform in which advertising intensity, content quality, and bias are chosen simultaneously, and it identifies the revenue wedge as the driver of bias. Third, both models point to the platform’s lack of commitment as a common friction, while showing that the commitment a platform would choose for itself differs from the commitment that protects consumers. In addition, the paper verifies all analytical results numerically, calibrates them to observed contract terms, and provides a procedure for applying them with platform data. Throughout, we distinguish results that are proved (Lemma 1, Propositions 1–8, Corollaries 1–2, and Remarks 1–4), results obtained numerically (Section 4.5 and Section 5 and Remark 5), and policy interpretations (Section 6); Section 6.1 summarizes this distinction.
The remainder of the paper is organized as follows. Section 2 reviews the related literature. Section 3 develops the cheap-talk model. Section 4 presents the Hotelling model of own-content bias. Section 5 reports the numerical verification, the calibrated scenarios, and the practical application of the results. Section 6 discusses cases, policy implications, and limitations. Section 7 concludes with practical implications and directions for future research. Proofs are in Appendix A, and the code that reproduces all numerical results is provided as Supplementary Material.
2. Related Literature
Recommendation bias and steering. Hagiu and Jullien [1] show that an intermediary may divert search, that is, send consumers first to stores they like less so that they search more because of the trade-off between total traffic and revenue per visit and because of store affiliation and store pricing. De Cornière and Taylor [3] develop a general model of biased intermediation and identify when steering harms consumers, and Bourreau and Gaudin [2] study a streaming platform that biases its recommendations to strengthen its bargaining position with content providers. Inderst and Ottaviani [4,7,8] show how commissions and kickbacks paid by product providers distort the advice of intermediaries and how such distortions can be regulated. Armstrong and Zhou [9] analyze how sellers pay intermediaries for prominence, and Eliaz and Spiegler [10] study how a search engine’s pricing affects the relevance of its results. Choi and Jeon [11] show that ad-funded platforms may choose biased designs when a zero-price constraint on the consumer side binds, with the direction of the bias depending on whether the constraint binds. Teh and Wright [12] study how competition between intermediaries in prices and commissions shapes steering, and Xu and Yang [13] show that, in a seller’s optimal dynamic pricing mechanism with consumer feedback, recommendations that the product’s quality does not warrant arise during discount episodes. Gambato and Peitz [14] study a platform that provides a technology through which consumers disclose their valuations to sellers, who then learn and engage in price discrimination. Peitz and Sobolev [15,16] show that a seller of an experience good may issue “inflated” personalized recommendations that reduce welfare and that bans on such recommendations can raise or lower welfare. Bergemann and Bonatti [17] study a platform that uses consumer data to match consumers with sellers through managed advertising campaigns, while consumers can also search off the platform.
Empirical evidence on recommendation bias. A growing empirical literature measures recommendation bias directly. Aguiar and Waldfogel [18] document the promotional power of streaming platform playlists. Farronato, Fradkin, and MacKay [19], using search data collected through a browser extension installed by a panel of consumers, find that Amazon-branded products are ranked higher than observably similar products. Reimers and Waldfogel [20] develop tests and a structural framework for measuring platform bias and its welfare cost and apply them to data from Amazon, Expedia, and Spotify. Waldfogel [21] finds that, controlling for product characteristics, Amazon’s own products ranked about 24 positions higher in search results on average and that this advantage fell from about 30 to about 20 positions after the European Commission designated Amazon as a gatekeeper under the Digital Markets Act. Recent studies in this journal examine how consumers respond to recommendation systems: transparency of an e-commerce recommendation system raises consumer trust through perceived effectiveness and reduced discomfort [22], and the perceived relevance of AI-personalized recommendations raises consumers’ clicking intentions [23]. These findings motivate both the trust channel of our first model and the parameters of our second model, and Section 5.4 uses them to discuss the models’ testable predictions.
Strategic communication and credibility. Classic models show that advertising and prices can signal product quality credibly because they are costly [24,25]; a recommendation, by contrast, is costless to send, so its credibility must rest on the alignment of interests, which is the premise of cheap-talk models. Crawford and Sobel [5] show that cheap talk is informative only when the sender’s and receiver’s preferences are sufficiently aligned. Chakraborty and Harbaugh [26,27] show that comparative statements allow credible communication even when the sender’s preferences are state-independent. Morgan and Stocken [28] analyze binary recommendations by a sender who may be biased, with mixing in equilibrium. Closest to our first model, Che, Dessein, and Kartik [29] study an agent who recommends one of several projects to a principal with an outside option; the outside option disciplines communication, and the agent panders toward options that look better ex ante. Our model shares this structure but derives the sender’s bias from commission asymmetries and reputational concerns, which yields a mixed-strategy equilibrium whose bias and acceptance probabilities are determined by the two sides’ payoffs. Kamenica and Gentzkow [30] characterize optimal disclosure when the sender can commit, and Lipnowski, Ravid, and Shishkin [31] and Lin and Liu [32] study partial and credible commitment; we use this perspective to compare the commitment a platform would choose with a truthful rule. Farrell [33] and Chen, Kartik, and Sobel [34] propose refinements for selecting among cheap-talk equilibria, which we use to discuss the babbling outcome. Sobel [35] and Benabou and Laroque [36] study how reputational concerns discipline strategic information transmission over time.
Vertical integration and self-preferencing. Hagiu and Wright [37] compare the marketplace and reseller modes of intermediation, and Hagiu, Teh, and Wright [38] ask whether platforms should be allowed to sell on their own marketplaces. De Cornière and Taylor [39] show that a search engine integrated with a publisher may bias its results toward the publisher’s content, with ambiguous welfare effects, and Burguet, Caminal, and Ellman [40] show that integration with content providers changes the search engine’s incentives to distort organic and sponsored results. Zennyo [41] studies a marketplace that earns per-unit commissions from third-party sellers and that, after entering with its own product, may adopt a biased search engine; consumers decide rationally whether to join and how much to search but do not infer the bias. Aridor and Gonçalves [42] model a recommender that also produces content as an information designer who can commit to its recommendation policy, and they show that self-preferencing can foreclose an independent producer and harm consumers. Anderson and Bedre-Defolie [43] analyze a hybrid platform that hosts third-party sellers and sells its own products; steering in their model works mainly through seller fees, with non-price favoring in reduced form. Long and Amaldoss [44] study how a marketplace’s sponsored advertising and private labels shape its incentive to self-preference, and Wang, Han, Ma, and Li [45] show in a game-theoretic model of a retail platform under the hybrid selling mode that the platform favors its own products and that the degree of self-preferencing depends on recommendation accuracy and on whether the recommender system is profit or consumer oriented. Padilla, Perkins, and Piccolo [46] analyze self-preferencing by vertically integrated gatekeepers. Jeon and Drugov [47] study the dynamics of recommendation bias. Kittaka, Sato, and Zennyo [48]; Bougette, Budzinski, and Marty [49]; and Etro [50] survey the theory and the competition policy debate on self-preferencing. The advertising side of our second model builds on media economics. Anderson and Coate [51] model advertising as a nuisance to the audience of ad-funded content, as our parameter γ does, and Peitz and Valletti [52] show how advertising intensity and content choices differ between advertising- and subscription-financed media. More generally, the commission that our platform levies on third-party advertising revenue is a pricing instrument of a two-sided platform [53,54].
Positioning. Relative to these papers, our contribution is twofold. First, unlike models in which consumers follow recommendations or in which the platform can commit to its recommendation policy [41,42], our first model studies a platform that cannot commit and consumers who discount its recommendations rationally. This produces the regime structure of Propositions 2–3 and shows that the commitment a platform would choose, as in [30,42], differs from the commitment that protects consumers (Proposition 4). Second, our second model derives own-content bias jointly with advertising intensity and content quality in an ad-funded setting. This links the size of the bias to the platform’s revenue wedge and to the suppliers’ advertising responses, which in turn determine the effect of bias on consumer surplus. Table 1 summarizes the comparison.
Table 1.
Comparison with closely related studies.
3. Model I: Rational Skepticism and Self-Fulfilling Distrust
3.1. Setup of Model I
A platform hosts two content items, A and B, and a consumer will consume one of them. The consumer’s (latent) utilities from the two items are independent random variables with uniform distributions:
where a > 0, k ∈ (0,1) measures the relative mean quality of item B and σ ∈ (0,1) measures the dispersion of match values. Item A is therefore better ex ante. We say that item j is the better match if uj > u−j (ties occur with probability zero).
The platform observes (uA,uB); the consumer knows only their distribution. When the consumer accepts a recommendation for item j (for example, by clicking through the recommended slot), the platform earns an advertising commission θj, where
In addition, the platform values a good match: whenever a consumer accepts a recommendation that turns out to be the better match, the platform obtains a reputational or retention benefit λ > 0 (for example, from higher future engagement). A consumer who accepts a recommendation for item j obtains a match payoff normalized to 1 if j is the better match and 0 otherwise. A consumer who rejects the recommendation leaves the platform and relies on independent search elsewhere (reviews, previews, and word of mouth), which yields an expected payoff w ∈ (0,1) net of search costs. In this case, the platform earns nothing.
Two features of this specification deserve comment. First, the platform’s zero payoff after a rejection reflects our reading of rejection as leaving the platform, or at least the channel through which commissions are earned. If a consumer who ignores a recommendation could still consume one of the two items on the same platform, the platform would earn a commission in that case too, and its incentives would change. Second, the consumer cannot choose the non-recommended item directly. This restriction never binds when w > p (defined below) because, under the monotone beliefs introduced below, the consumer’s posterior that the non-recommended item is better never exceeds max{1 − p, p} = p < w; it matters only off the equilibrium path when w < p.
The game has two stages.
Stage 1. The platform observes (uA,uB) and sends a recommendation I ∈ {IA,IB}, where Ij is a recommendation of item j.
Stage 2. The consumer observes I, updates her belief by Bayes’ rule, and accepts the recommendation with probability qj ≡ q(Ij) or rejects it.
Because payoffs depend on (uA,uB) only through which item is the better match, the platform’s strategy can be summarized by two misleading probabilities:
which are the probability of recommending A when B is the better match and the probability of recommending B when A is the better match. A truthful platform has α = β = 0. Let p ≡ Pr(uA > uB) denote the prior. By Bayes’ rule, the consumer’s posterior that the recommended item is the better match is expressed as follows:
The denominators are the unconditional probabilities Pr(IA) and Pr(IB). The equilibrium concept is perfect Bayesian equilibrium (PBE). Since the labels of cheap-talk messages are arbitrary, we restrict attention to monotone equilibria: a recommendation for j is weakly more likely when j is the better match (α ≤ 1 − β), and after any recommendation Ij, on or off the equilibrium path, the consumer’s posterior that j is the better match is at least her prior (πA ≥ p and πB ≥ 1 − p). On the equilibrium path, the second requirement follows from the first. Monotonicity rules out equilibria in which the meanings of messages are reversed.
3.2. The Prior Probability That the High-Commission Item Is Better
The joint support of (uA,uB) is the rectangle shown in Figure 1a; the event uA < uB is the shaded triangle above the diagonal.
Figure 1.
(a) Joint support of (uA,uB); the shaded triangle is the event uB > uA. (b) Prior probability p = Pr(uA > uB) as a function of relative mean quality k and dispersion σ. Below the orange curve k = (1 − σ)/(1 + σ) (gray area, h ≤ 0), the supports do not overlap and p = 1.
Lemma 1.
Let h ≡ (1 + σ)k − (1 − σ). Then,
Moreover, p ∈ (1/2,1], and, on the region h > 0, the prior p is strictly decreasing in both k and σ.
The condition h > 0, equivalently k + σ + kσ > 1, is the condition under which item B can be the better match at all. If h ≤ 0, then p = 1, B is never the better match, α is defined on a null event, the platform and the consumer agree that A should be recommended, and the incentive problem disappears. Throughout the rest of Section 3, we therefore assume h > 0, so that p ∈ (1/2, 1). Because payoffs are binary, the match values (uA,uB) affect equilibrium only through p. Lemma 1 and Figure 1 serve to map the primitive parameters (k,σ) into p, and all comparative statics in k and σ below are comparative statics in p.
To verify Lemma 1 independently of the geometric argument, we ran a Monte Carlo simulation (Experiment E1 in Section 5). The simulation was written in Python 3.13 using NumPy 2.5 (random number generator PCG64, seed 20261021). Without loss of generality, we set a = 1. For each of the 46 × 46 grid points (k,σ) ∈ [0.02, 0.9]2, we drew 200,000 independent pairs (uA,uB) from Equation (1) and computed the empirical frequency of uA < uB. Figure 2 compares the simulated frequencies with Equation (4). All 2116 points lie on the 45-degree line, and the maximum absolute deviation is 0.0040. At the 1167 grid points with h > 0, the standard error of the simulated frequency is at most 0.0011, and 94.9% of the deviations lie within 1.96 standard errors of zero, as expected under pure sampling noise. At the remaining points, where p = 1, the simulated frequency is exactly zero. The deviations show no systematic pattern, and the simulation reproduces the boundary k + σ + kσ = 1.
Figure 2.
Monte Carlo verification of Lemma 1. (a) Simulated frequency of uA < uB against the analytic probability from Equation (4) at 46 × 46 grid points, with 200,000 draws per point. (b) Simulation error (simulated minus analytic, in units of 10−3) over the region h > 0; below the black curve p = 1.
3.3. Equilibrium Analysis
We first ask when truthful recommendation can be sustained.
Proposition 1
(Truthful recommendation). A PBE in which the platform recommends truthfully (α = β = 0) exists if and only if θA − θB ≤ λ.
If the platform were truthful, every recommendation would be fully credible, and the consumer would always accept it. When B is the better match, recommending B would then yield θB + λ, whereas recommending A would yield θA. Thus, the platform deviates whenever the commission gap θA − θB exceeds its reputational stake λ. Truthfulness fails because consumers would trust it. In the remainder of this section we assume the following:
so that the incentive conflict binds. Equilibrium then depends on how the consumer’s outside option w compares with the prior p.
Proposition 2
(Blind trust). Let θA − θB > λ and w < p. In every monotone PBE, the platform recommends item A regardless of the state (α = 1, β = 0), and the consumer accepts the recommendation (qA = 1). The consumer’s expected payoff is p, and she consumes the worse match with probability 1 − p.
When the outside option is weak, even an uninformative recommendation of A is worth accepting because A is better ex ante. Consumers therefore accept every recommendation, and the platform recommends the high-commission item in every state. Bias is maximal, but consumers are not deceived: they understand that the recommendation carries no information and accept it because their alternative is worse. We call this case Regime B (blind trust).
Proposition 3
(Informative equilibrium and babbling). Let θA − θB > λ > 0 and w > p. The monotone PBE outcomes are exactly the following.
(i) Informative equilibrium. The platform never misleads toward the low-commission item (β* = 0) and misleads toward the high-commission item with probability α*; the consumer always accepts a recommendation of B and accepts a recommendation of A with probability , where the following hold:
(ii) Babbling (distrust trap). The consumer rejects every recommendation (qA = qB = 0), and the platform earns zero and is indifferent among all recommendation strategies; for example, it recommends A in every state. This outcome exists for all w > p, independently of θA, θB, and λ.
We call the case w > p Regime S (skepticism). In the informative equilibrium, the consumer randomizes after IA only if she is indifferent, which requires the posterior πA in Equation (2) to equal w; this pins down the platform’s misleading probability α*. The platform randomizes when B is the better match only if recommending A and recommending B yield the same payoff, qAθA = qB(θB + λ), which pins down the consumer’s acceptance probability . If consumers accepted recommendations of A with certainty, the platform would always recommend A; if the platform never misled, consumers would always accept. Each side’s behavior is thus disciplined by the other side’s incentives, and bias and distrust sustain each other in equilibrium.
As in all interior mixed-strategy equilibria, for example in inspection games, each player’s mixing probability is determined by the other player’s payoffs: α* depends only on (p,w), and the consumer’s skepticism depends only on the platform’s commissions and reputational stake. Comparative statics of this kind should be read with the usual caveat [55]: a wider commission gap does not change the equilibrium frequency of misleading recommendations, but it raises the consumer’s discounting, which lowers the platform’s revenue from recommending A. The assumption λ > 0 matters for uniqueness. If λ = 0, the platform’s indifference condition becomes qAθA = qBθB, but the platform is then also indifferent when A is the better match. Thus, β = 0 no longer follows, and the set of informative equilibria is larger.
The babbling outcome in part (ii) exists in every cheap-talk game, and here it exists whenever w > p, including when θA − θB ≤ λ and the truthful equilibrium of Proposition 1 exists. It is therefore not caused by commission-driven bias, and it is self-fulfilling in the same sense as any babbling equilibrium: consumers who expect recommendations to be uninformative ignore them, and once they are ignored, the platform has no reason to make them informative. Which outcome prevails cannot be determined within the model. The informative equilibrium Pareto-dominates the babbling outcome since it gives the consumer U* > w (Corollary 1) and the platform a positive profit. Pareto dominance is not a refinement of Bayesian equilibrium, however, and the babbling outcome survives the neologism proofness test of Farrell [33]. A neologism sent by a proper subset of types would, if believed, reveal which item is better and would therefore be accepted. Because θj > 0, every type, including those outside the subset, would gain from sending it, so no proper subset of types is self-signaling. The set of all types induces the prior, after which rejection is optimal because max{p,1 − p} < w; no type gains from such a message, so this set is not self-signaling either. Hence, no credible neologism exists, and the babbling outcome is neologism proof. The no-incentive-to-separate criterion of Chen, Kartik, and Sobel [34] is defined for ordered type spaces with state-dependent sender preferences and does not apply directly to our binary, partly state-independent setting. We conclude that the distrust trap is a genuine possibility. Whether a history of opaque recommendations can lock a platform into it requires a dynamic model, and we present this only as a conjecture (Section 6.4).
The boundary w = p and the case in which the high-commission item is the ex ante worse one are covered by the following remarks.
Remark 1
(Boundary w = p). Let θA − θB > λ > 0 and w = p. In every monotone PBE in which some recommendation is accepted with positive probability, the platform recommends A in every state (α = 1, β = 0), and the consumer accepts with some probability qA ∈ (0, 1]; every such qA can be supported. In all other monotone PBE, every recommendation is rejected. These outcomes contain the limits of Proposition 2 (qA = 1), Proposition 3(i) (α* → 1, ), and Proposition 3(ii).
Remark 2
(Which item is sponsored). The analysis does not require the high-commission item to be the ex ante better one. Let H and L denote the items with the higher and the lower commission, and let pH be the prior that H is the better match. Proposition 1 holds as stated. Propositions 2 and 3(i), Corollary 1(b)–(c), and Proposition 4 below hold with (A,B,p) replaced by (H,L,pH); for instance, if θB > θA + λ, the platform misleads toward B with probability β* = (1 − p)(1 − w)/(pw), which lies in (0, 1) if and only if w > 1 − p. Two qualifications apply when pH < 1/2: the babbling outcome requires w > max{pH,1 − pH}. For pH < w < 1 − pH, there is an additional monotone outcome in which the platform always recommends L and the consumer accepts, supported by pessimistic beliefs after a recommendation of H.
Remark 2 matters for policy because the concern about paid promotion is often that the sponsored item is the ex ante worse one. In that case, the platform misleads toward the sponsored item exactly as in Proposition 3, with pH < 1/2 in place of p.
Figure 3 illustrates the equilibrium. Panel (a) plots the equilibrium misleading probability against relative mean quality k for w = 0.9 in the region h > 0: for low k, p > w and the market is in Regime B with α = 1; once p falls below w, the market is in Regime S and α* declines as k rises. Panel (b) shows the two regimes in the (k,w) plane.
Figure 3.
(a) Equilibrium misleading probability as a function of relative mean quality k for w = 0.9 and three levels of dispersion σ, plotted for h > 0; α = 1 is the blind trust outcome of Proposition 2. (b) Equilibrium regimes for σ = 0.6: in Regime B (gray, w < p), consumers accept every recommendation; in Regime S (shaded, w > p), the informative equilibrium has misleading probability α*.
3.4. Comparative Statics, Welfare, and Commitment
Corollary 1.
In the informative equilibrium of Proposition 3,
(a) α* is strictly increasing in p and strictly decreasing in w; hence, it is strictly decreasing in k and σ.is strictly decreasing in θA and strictly increasing in θB and λ.
(b) The consumer’s expected payoff and the platform’s expected profit are expressed as follows:
(c) The probability that the consumer accepts a misleading recommendation is .
Bias is lower when the prior advantage of item A is smaller, which happens when the two items are closer in mean quality or when match values are more dispersed, because a recommendation of A then carries more information and the platform must mislead less often to keep the consumer’s posterior at w. A better outside option also lowers bias because a consumer with good alternatives requires a more credible recommendation. The consumer’s equilibrium payoff lies strictly between her payoff in the babbling outcome, w, and her payoff under truthful recommendation, 1.
These losses arise because the platform cannot commit. We therefore ask what happens if it can. We distinguish a truthful rule, which restricts the platform to α = β = 0, from a platform-optimal commitment, under which the platform chooses any (α,β) before observing the state, in the sense of Kamenica and Gentzkow [30], and the consumer best-responds (accepting when indifferent).
Proposition 4
(Commitment). Let θA − θB > λ > 0.
(a) Truthful rule. Under a truthful rule, the consumer obtains 1, and the platform obtains ΠT = p(θA + λ) + (1 − p)(θB + λ). If w > p, then
so both sides are strictly better off than in the informative equilibrium and in the babbling outcome. If w < p, the truthful rule raises the consumer’s payoff from p to 1 but lowers the platform’s profit by (1 − p)(θA − θB − λ) relative to Proposition 2.
(b) Platform-optimal commitment. If w > p, the platform’s optimal commitment is β = 0 and α = α*, which yields the following:
This gives the consumer exactly U*. If w < p, the platform’s optimal commitment reproduces the blind trust outcome of Proposition 2.
(c) Bounded bias. Suppose that a verifiable rule restricts the platform to for some and that the platform chooses its commitment subject to this restriction. Let , with α* given by Equation (5). The platform commits to β = 0 and , the consumer accepts both recommendations, and her payoff is expressed as follows:
which is strictly decreasing in on . It equals 1 under a truthful rule () and, when the restriction does not bind, U* if w > p and p if w ≤ p.
Proposition 4 shows that the platform gains from commitment power but would not use it to be truthful. Given the choice, it commits to recommend A whenever A is better and, when B is better, to recommend A with the largest probability that still keeps the consumer willing to accept; the consumer is then indifferent after IA and gains nothing. Consumers therefore gain nothing from a commitment that the platform designs freely. By part (c), however, they gain from any verifiable restriction that keeps the frequency of misleading recommendations below the level the platform would choose: their payoff falls with the permitted frequency , the platform’s own choice α* is the point at which they gain nothing, and the truthful rule is the limiting case . Such restrictions must be imposed on the platform in both regimes, not only when w < p. In Regime S, the platform would accept a truthful rule in preference to no commitment, but it would oppose such a rule if it could design its own policy instead. Part (c) also relates the result to the literature on partial commitment [31,32]: what matters for consumers is how tightly verifiable restrictions bound the platform’s policy, not whether the platform can commit at all. For example, with p = 0.8185 and w = 0.9, the Regime S parameters used in Section 5.2, a cap of raises the consumer’s payoff from U* = 0.909 to 0.955, compared with 1 under a truthful rule. This matters in practice because an audit can more plausibly certify that commissions have a bounded influence on rankings than that they have none.
This distinction clarifies which real instruments correspond to the truthful rule or to a cap on α. In Model I, the commissions θA and θB are common knowledge, so disclosing that a recommendation earns a commission does not by itself restrict (α,β). An instrument maps into such a restriction only if it makes the dependence of recommendations on commissions verifiable, for example, through an external audit that certifies that organic rankings do not depend on commissions or that commissions affect them only to a bounded extent, combined with a requirement that any recommendation that does depend on payments be labeled as such. Labels on paid promotion support such a rule only as part of this combination; by themselves they leave the platform free to choose (α,β).
Remark 3
(The outside option and the platform’s profit). Let θA − θB > λ > 0. As w crosses p from below, the consumer’s payoff is continuous (U* → p), but the platform’s profit falls discontinuously from θA + pλ to Π* as follows:
and total surplus falls by the same amount. For w > p, the platform’s profit Π* does not depend on w.
The platform therefore has a strong incentive to keep consumers’ outside option below p, for instance by making external search or comparison tools harder to reach, while consumers gain nothing from w below p. This links Model I to self-preferencing more broadly and suggests that measures improving consumers’ access to alternatives also affect the platform’s recommendation incentives. Figure 4 illustrates Proposition 4 and Remark 3 for p = 0.8185 (k = σ = 0.6), θA = 1, θB = 0.5, and λ = 0.2.
Figure 4.
Commitment and the outside option in Model I (k = σ = 0.6, so p = 0.8185; θA = 1, θB = 0.5, λ = 0.2). (a) Platform profit without commitment, under a truthful rule and under platform-optimal commitment; the profit without commitment falls discontinuously at w = p (Remark 3). (b) Consumer payoff; platform-optimal commitment gives the consumer the same payoff as no commitment, whereas a truthful rule gives 1.
4. Model II: Own-Content Bias Under Vertical Integration
Section 3 showed how bias arises from commission asymmetries when the platform does not own the content. We now consider a vertically integrated platform that supplies its own content and recommends content. To obtain closed-form equilibria when content quality, advertising intensity, and recommendation bias are chosen simultaneously, we model consumers’ response to bias through a reduced-form susceptibility parameter and assume that consumers are naive: they do not correct for the bias. This is a modeling choice, not an implication of Section 3. Proposition 8 shows that Bayesian consumers who anticipate the bias would undo its effect on market shares, so the misallocation results of this section rest on naivety.
4.1. Setup of Model II
There is one platform, one third-party content provider, and a unit mass of consumers whose tastes x are uniformly distributed on [0, 1] (Figure 5). The platform supplies its own content 1, located at x = 0, and the third-party provider supplies content 2, located at x = 1. Consumers incur a mismatch cost τ > 0 per unit of distance.
Figure 5.
Hotelling line with the platform’s own content at x = 0 and third-party content at x = 1.
Each supplier i ∈ {1, 2} chooses a content quality ui and an advertising intensity di ≥ 0. Raising quality above a baseline v costs . Each unit of advertising lowers a consumer’s utility by γ > 0, capturing both the nuisance of advertising and the consumption time it crowds out, and each consumer generates advertising revenue rdi, where r > 0 is the monetization rate per unit of traffic. The platform retains a share ϕ ∈ (0,1) of the third-party provider’s advertising revenue as a commission.
In addition, the platform chooses a recommendation bias b ≥ 0: by prioritizing its own content in feeds, exaggerating its fit, or hiding third-party alternatives, it raises the utility that consumers perceive from content 1 by μb, where μ > 0 measures consumers’ susceptibility. Bias is costly to the platform: the cost captures the expected costs of regulatory intervention, reputational damage, and the resources needed to design and maintain biased rankings, and κ > 0 increases with consumer sophistication and regulatory oversight. Section 4.5 discusses which of these components are social costs. The perceived utilities of a consumer at x are expressed as follows:
whereas the consumer’s true utility from content 1 is U1(x) − μb. Consumers choose the content with the higher perceived utility. The indifferent consumer and the resulting demands are expressed as follows:
truncated to [0,1]. The profits of the platform and of the third-party provider are expressed as follows:
In the first stage, the platform chooses (d1,u1,b) and the provider chooses (d2,u2) simultaneously. In the second stage, consumers observe the offers and recommendations and choose content. We solve for the Nash equilibrium of the first stage.
Assumption 1.
(i) 3cγκτ > r(κ + cμ2). (ii) v ≥ 3τ.
Part (i) requires the mismatch cost and the curvature of the quality and bias costs to be large relative to the monetization rate and consumers’ susceptibility. It ensures that profits are strictly concave in each firm’s own choices in the region of interior demand and that both contents have positive market shares; in fact, the numerator of in Equation (15) below is positive if and only if part (i) holds. Part (ii) is a sufficient condition for full market coverage: it guarantees that every consumer obtains a nonnegative true utility from the content she chooses in equilibrium.
4.2. Equilibrium
The first-order conditions are expressed as follows:
The term r(d1 − ϕd2) is the platform’s revenue wedge. The platform gains its own advertising revenue rd1 and loses the commission ϕrd2 when one consumer moves from content 2 to content 1, and r(d1 − ϕd2)/(2τ) is the corresponding marginal gain from raising perceived utility. The conditions in (13) imply the following:
so each firm’s advertising intensity is proportional to its market share. Define the following:
where η is the effective bias intensity.
Proposition 5
(Equilibrium). Under Assumption 1 there is a unique equilibrium with interior market shares. Market shares are expressed as follows:
with . The equilibrium choices are expressed as follows:
so that b* > 0, and . These choices are global best responses even when demand is truncated to [0,1] and corner outcomes are allowed.
The proof shows that the regions in which one content captures the whole market are dominated, so the first-order conditions identify the global best responses; we also confirmed numerically, for the baseline parameters and for 300 random parameter vectors, that no deviation with truncated demand is profitable (Supplementary Material). Equation (16) shows that bias is proportional to the platform’s own market share: since the revenue wedge equals , a larger audience for the platform’s content raises its advertising intensity and hence the value of steering one more consumer toward it. Market shares depend on μ and κ only through η = μ2/κ.
4.3. Revenue Wedges and the Source of Bias
To isolate the role of ownership, consider a benchmark in which content 1 is supplied by an independent provider that pays the same commission rate ϕ as provider 2. The platform is then a pure intermediary with profit , while each provider i earns . Note that this benchmark changes two things at once: who owns content 1 and who chooses (d1,u1) and with which revenue share.
Proposition 6
(Equal commission rates). Under Assumption 1, the pure intermediary benchmark with equal commission rates has a unique equilibrium with interior market shares, in which the platform chooses no bias (bN = 0) and . The vertically integrated platform chooses b* > 0.
With equal commission rates, a pure intermediary earns the same amount from either content and has no reason to steer. Once it owns content 1, steering a consumer toward content 1 earns rd1 instead of ϕrd2. What drives bias is this revenue wedge, and vertical integration is one source of it. Commission asymmetries are another, as the following remark and Model I show.
Remark 4
(Unequal commission rates). If provider i pays the commission rate ϕi, with ϕ1 ≠ ϕ2, the pure intermediary chooses the following:
which is positive whenever . For example, with the baseline parameters of Section 4.5, ϕ1 = 0.4 and ϕ2 = 0.2 give bN = 0.076.
In both models, a revenue wedge is the source of bias. In Model II, the first-order condition for b implies that equilibrium bias equals μ/(2τκ) times the platform’s revenue wedge per consumer, which is r(d1 − ϕd2) under integration and r(ϕ1d1 − ϕ2d2) for a pure intermediary. Because the wedge contains the equilibrium advertising loads, this proportionality is an equilibrium identity rather than a comparative statics result; the comparative statics in the primitives are those of Proposition 7. In Model I, the commission gap net of the reputational stake, θA − θB − λ, determines whether bias exists (Proposition 1) but not how large it is: the misleading probability α* depends only on p and w (Section 3.3). The results common to the two models are therefore that bias vanishes when the wedge vanishes (Propositions 1 and 6) and arises once the wedge is large enough.
4.4. Comparative Statics
Proposition 7
(Comparative statics). Under Assumption 1,
(a) is strictly increasing in η; hence, it is increasing in consumer susceptibility μ and decreasing in the cost of bias κ. The bias b*is strictly increasing in μ and strictly decreasing in κ.
(b) The effect of the commission rate on the platform’s market share is expressed as follows:
which is negative if and only if r < 2cγτ; b* moves in the same direction. The region 2cγτ < r < 3cγτ/(1 + cη), in which a higher commission rate raises bias, is non-empty if and only if cη < 1/2.
(c) The third-party provider’s equilibrium profit,
is strictly decreasing in η.
Part (a) confirms that bias is stronger when consumers are easily influenced or when bias is cheap, that is, when consumer sophistication and regulatory scrutiny are low. Part (b) identifies two effects of the commission rate. A higher ϕ raises the platform’s opportunity cost of diverting consumers from content 2, which lowers bias. It also lowers the provider’s share 1 − ϕ of its own advertising revenue and hence its incentive to invest in quality, which weakens content 2 and raises the platform’s share. When the monetization rate is moderate (r < 2cγτ), the first effect dominates; when it is high, the second effect can dominate. Part (c) shows that bias harms the third-party provider, which loses market share and, as a consequence, reduces both its quality and its advertising intensity.
4.5. Demand Distortion and Welfare
Because naive consumers choose by perceived rather than true utility, bias misallocates them. The indifferent consumer under true utilities is , and the consumers in choose the platform’s content although content 2 would give them a higher true utility.
Corollary 2
(Misallocation). Let Assumption 1 hold and let ηr ≤ 2γτ, so that x∘≥ 0. The mass of misallocated consumers and the resulting loss of true consumer utility are expressed as follows:
both of which are strictly increasing in η. If ηr > 2γτ, all consumers of content 1 are misallocated: and .
The condition ηr ≤ 2γτ holds at the baseline used below (ηr = 0.64 < 2) and, evaluated at the higher of the two susceptibility levels, in 82.5% of the random parameter vectors described at the end of this section. The misallocation m* measures how far observed demand departs from consumers’ true preferences: with bias, the platform’s market share overstates consumers’ valuation of its content. In practice, this suggests that traffic data from platforms with own-content bias may be an unreliable indicator of content value for creators, advertisers, and competition authorities. In our model, however, no party learns from traffic, so this is a motivation rather than a result.
Figure 6 illustrates Propositions 5–7 and Corollary 2 for the baseline parameters r = c = γ = τ = 1, ϕ = 0.3, and v = 5, which satisfy Assumption 1 for η < 2.
Figure 6.
(a) Equilibrium bias b* as a function of the cost of bias κ for three levels of consumer susceptibility μ, plotted where Assumption 1 holds. (b) Observed market share of the platform’s content and the share x∘ that would choose it under true utilities, as functions of the effective bias intensity η = μ2/κ; the shaded area is the mass of misallocated consumers m*, and the dotted line marks the symmetric share 1/2 of the equal commission benchmark (Proposition 6). Baseline parameters: r = c = γ = τ = 1, ϕ = 0.3, v = 5.
To evaluate welfare, we compare the equilibrium with a counterfactual in which bias is prohibited (b ≡ 0, equivalently κ → ∞), in which case D1 = N/M. Consumer surplus is computed with true utilities as follows:
and advertising revenues are counted as surplus accruing to the firms. Advertisers do not appear in this measure, which is consistent if they earn zero surplus, that is, if the price r of an advertising exposure equals its value to advertisers. Relaxing this assumption would change little at the baseline: the platform’s and the third party’s advertising loads move in opposite directions, but total advertising exposure per consumer, d1D1 + d2D2, is almost the same with and without bias (1.161 against 1.156). The platform’s equilibrium profit can be written in closed form as follows:
Whether the bias cost is a social loss depends on its components. Resources spent on designing and maintaining biased rankings are a real cost. In contrast, expected fines are transfers, and reputational damage is a loss of future profit that is not otherwise represented in the model. We therefore report total welfare in two ways: TW = CS + π1 + π2, which treats the bias cost as a resource cost, and , which treats it as a transfer. The misallocation loss L* does not depend on this choice. Table 2 reports the equilibrium at the baseline with κ = 1 and μ = 0.8, together with two variants discussed in Section 4.6, and Figure 7 reports welfare changes relative to neutrality as susceptibility varies.
Table 2.
Equilibrium outcomes at the baseline (r = c = γ = τ = 1, ϕ = 0.3, v = 5, κ = 1, μ = 0.8).
Figure 7.
Changes relative to the neutrality benchmark (b ≡ 0) as functions of consumer susceptibility μ (baseline parameters, κ = 1). (a) Consumer surplus and third-party profit. (b) Platform profit before and after the bias cost, and total welfare with the bias cost counted as a resource cost (TW) or as a transfer (TWx).
Four observations emerge. First, the third-party provider bears most of the cost of bias: its profit falls by about one third at the baseline. Second, the welfare verdict depends on the accounting of the bias cost. At the baseline, TW falls by 0.0945, which is less than the bias cost of 0.0988; with the bias cost treated as a transfer, TWx rises slightly, from 4.9869 to 4.9911. Along the whole range of Figure 7, TWx exceeds its neutral level by between 0 and 0.013, whereas TW is lower than under neutrality. The misallocation loss L* = 0.0316 is a clean loss under either accounting, but at the baseline it is more than offset by changes in the suppliers’ offers.
Third, consumer surplus is higher with bias at the baseline (4.0333 against 4.0084), and the reason is the third party’s response rather than the platform’s quality investment. By Equations (14) and (16), the net values of the two offers are expressed as follows:
At the baseline, both bracketed terms are positive, so each supplier’s net offer falls with its own market share because its advertising intensity is proportional to its share; the signs of the brackets depend on parameters in general. Bias raises the platform’s share, so the platform raises its advertising load (+0.1345) by more than its quality (+0.0961), and the net value of its content falls from 4.2162 to 4.1778. The squeezed provider cuts its advertising load (−0.1922) by more than its quality (−0.0673), so the net value of content 2 rises from 4.2973 to 4.4222. Decomposing the change in consumer surplus, the change in the content-1 offer contributes −0.0177, the change in the content-2 offer +0.0675, and the reallocation of consumers −0.0249, for a total of +0.0249. For high susceptibility, misallocation and the heavier advertising load on content 1 dominate, and consumer surplus falls sharply.
Fourth, the platform’s profit at the baseline is lower than under neutrality (0.6309 against 0.6410), although its profit before the bias cost is higher (0.7296 against 0.6410). The gain from steering consumers is real: own advertising revenue rises from 0.5712 to 0.7654, while commission revenue falls from 0.1753 to 0.1185 because the provider shrinks. The net gain before the bias cost (0.0887) is smaller than the bias cost (0.0988), which reflects a commitment problem examined in Remark 5.
To check robustness, we drew parameter vectors at random. For each of 20,000 attempts (random seed 2026), r, c, γ, τ, and κ were drawn independently and uniformly from [0.2,3] and ϕ uniformly from [0.05, 0.95], and v = 10 ≥ 3τ. A draw was discarded if 3cγτ ≤ r or if the admissible range of susceptibility under Assumption 1, with , was shorter than 0.05. For each of the remaining 17,770 vectors, two susceptibility levels were drawn independently and uniformly from and the two equilibria were compared. Higher susceptibility lowered TW in 88.6% of the comparisons but lowered TWx in only 42.4%; it lowered the platform’s profit in 82.7% of the comparisons but its profit before the bias cost in only 19.1%; and it raised consumer surplus in 58.6%. These numerical results confirm that the third-party provider and allocative efficiency bear the costs of bias, while the signs of the effects on total welfare and on the platform depend on how the bias cost is interpreted. The code is provided as Supplementary Material.
4.6. Rational Consumers and Ex Ante Commitment
The misallocation results above require naive consumers. If consumers anticipate the bias, the model becomes a signal-jamming game.
Proposition 8
(Rational consumers). Suppose that consumers know the equilibrium bias be and evaluate content 1 by u1 − γd1 + μ(b − be) − τx. Under Assumption 1, there is a unique equilibrium with interior market shares. In it, be = bR with the following:
Here, market shares, advertising intensities, and qualities equal those under neutrality (D1 = N/M), no consumer is misallocated, the provider’s profit and consumer surplus equal their neutral levels, and the platform’s profit equals its neutral profit minus the bias cost .
With rational consumers, the platform still chooses positive bias at the margin because it takes consumers’ expectations as given, but in equilibrium the bias is fully anticipated and has no effect on choices. Its cost is then pure waste: at the baseline, bR = 0.368, and the platform earns 0.573 against 0.641 under neutrality (Table 2). Together with Proposition 3, this shows that rational discounting by consumers removes the allocative effects of bias in both models, but not the platform’s incentive to bias, which is driven by the revenue wedge in either case.
Remark 5
(Ex ante commitment to bias). Suppose that the platform commits to b before the platform and the provider choose advertising and quality simultaneously, with naive consumers. At the baseline, the platform’s optimal commitment is b ≈ 0.196, which yields a profit of 0.6575, higher than both its profit in the simultaneous move equilibrium (0.6309) and under neutrality (0.6410).
Remark 5, which we establish numerically, makes the commitment interpretation of the platform’s profit loss precise. In the simultaneous move game, the platform does not take into account that its bias induces the provider to shrink, which erodes the commission base; with commitment, it chooses a smaller but still positive bias. Hence, the platform’s preferred commitment is not neutrality, which parallels Proposition 4(b) in Model I: in both models, a commitment chosen by the platform reduces but does not remove bias.
5. Numerical Verification, Calibration, and Practical Application
This section addresses three questions: whether the closed-form results are accurate, what they imply for parameter values that can be related to observed contract terms, and how they can be applied in practice.
5.1. Research Design and Data
This study is theoretical and does not use empirical micro-data on consumers or platforms. All quantitative results in this section are generated from the two models, using the parameter values reported in Table 3, Table 4, Table 5 and Table 6. Two sets of parameters are anchored to publicly documented contract terms, which we use only to place the parameters in empirically relevant ranges. Relative commissions in Model I are taken from the standard commission schedule of the Amazon Associates program, which pays, for example, 10% on luxury beauty products, 5% on digital music, 4.5% on physical books and kitchen products, and 3% on toys and beauty products [56]. The commission share ϕ in Model II is taken from the YouTube Partner Program, under which creators receive 55% of the net revenue from ads on their long-form videos and 45% of the revenue allocated to them for Shorts, so that the platform retains ϕ = 0.45 and ϕ = 0.55, respectively [57]. Both sources were accessed on 13 November 2026. These anchors are published contract terms rather than samples, so questions of sampling and representativeness do not arise; their role is to make the scenarios concrete, not to estimate the models. All other parameters are normalized or varied over wide ranges.
All computations were carried out in Python 3.13 with NumPy 2.5 and SciPy 1.18, and figures were produced with Matplotlib 3.11. Every experiment uses a fixed random seed, and the code that reproduces all numbers, tables, and figures is provided as Supplementary Material (Code S1). Table 3 summarizes the design of the seven numerical experiments.
Table 3.
Design of the numerical experiments.
5.2. Verification of the Analytical Results
Experiment E1 confirms Lemma 1 (Section 3.2 and Figure 2). Experiment E2 checks Propositions 1–3 by simulation. In each scenario, we drew 106 independent pairs (uA,uB) with k = σ = 0.6, let the platform recommend according to the predicted equilibrium strategy, and let the consumer accept according to the predicted acceptance probabilities. We then compared the simulated frequencies and payoffs with the closed-form predictions and computed each player’s payoff from every alternative action given the other player’s strategy. Table 4 reports the results. The simulated posterior after a recommendation of A equals the consumer’s outside option in Regime S, as Proposition 3 requires, and the simulated payoffs coincide with Corollary 1 up to sampling error. In every scenario, no player can gain by deviating. In Regime S, the platform is exactly indifferent between the two recommendations when B is the better match, and the consumer is exactly indifferent after a recommendation of A, which is what sustains the mixed-strategy equilibrium.
Table 4.
Agent-based simulation of Model I (k = σ = 0.6, p = 0.8185, θA = 1, λ = 0.2; 106 interactions per scenario). Analytic values with simulated values in parentheses.
Experiment E3 confirms Proposition 4(b): a brute-force search over committed strategies returns α = 0.501 and β = 0 with a profit of 1.1365, equal to ΠC in Equation (7), compared with ΠT = 1.1092 under a truthful rule. Imposing caps on α confirms Proposition 4(c): with , for example, the search returns α = 0.25 and β = 0, and the consumer’s payoff is 0.955. Experiment E4 computes the equilibrium of Model II without using the closed form. Starting from a random profile, the platform and the provider alternately choose numerical best responses, each maximizing its own profit with demand truncated to [0,1], until the profile converges. At the baseline, the procedure converges in 14 rounds to the closed form of Proposition 5 with a maximum deviation of 1.9 × 10⁻⁸; for 200 random parameter vectors satisfying Assumption 1, the maximum deviation is 5.5 × 10⁻⁷. Experiment E5 confirms that no firm can gain by deviating to any choice, including choices that give one content the whole market. Together, these experiments verify the closed-form results by independent methods.
5.3. Calibrated Scenarios
Model I. Suppose that a platform recommends one of two items whose referral commissions follow the Amazon Associates schedule and whose prices are similar, so that the ratio of commissions per accepted recommendation equals the ratio of commission rates. The affiliate rate pairs serve only to produce commission ratios of realistic size: affiliate fees are paid on sales rather than on advertising engagement, and the paired product categories would not normally compete for a single recommendation slot. Table 5 normalizes θA = 1 and considers three pairs of rates: 10% vs. 3% (θB/θA = 0.30), 4.5% vs. 3% (0.67), and 5% vs. 4.5% (0.90). By Proposition 1, truthful recommendation can be sustained only if the platform’s reputational stake λ is at least θA − θB, that is, at least 70%, 33%, and 10% of the high commission, respectively. With λ = 0.2, the platform is truthful only when the commission rates are close; in the other two cases, the market is in Regime S. The misleading probability α* = 0.50 is the same in both cases because it depends only on p and w. However, consumers discount recommendations much more when the commission gap is large ( against 0.87), and the platform loses 46% of the profit it would earn under a truthful rule when the gap is large, against 11.5% when it is moderate. Because consumers accept misleading recommendations more often when they are less skeptical, the probability of misled consumption is higher for the moderate gap (7.9% of interactions) than for the large gap (4.5%).
Table 5.
Calibrated scenarios for Model I: commission ratios from the Amazon Associates schedule (k = σ = 0.6, p = 0.8185, w = 0.9, θA = 1, λ = 0.2).
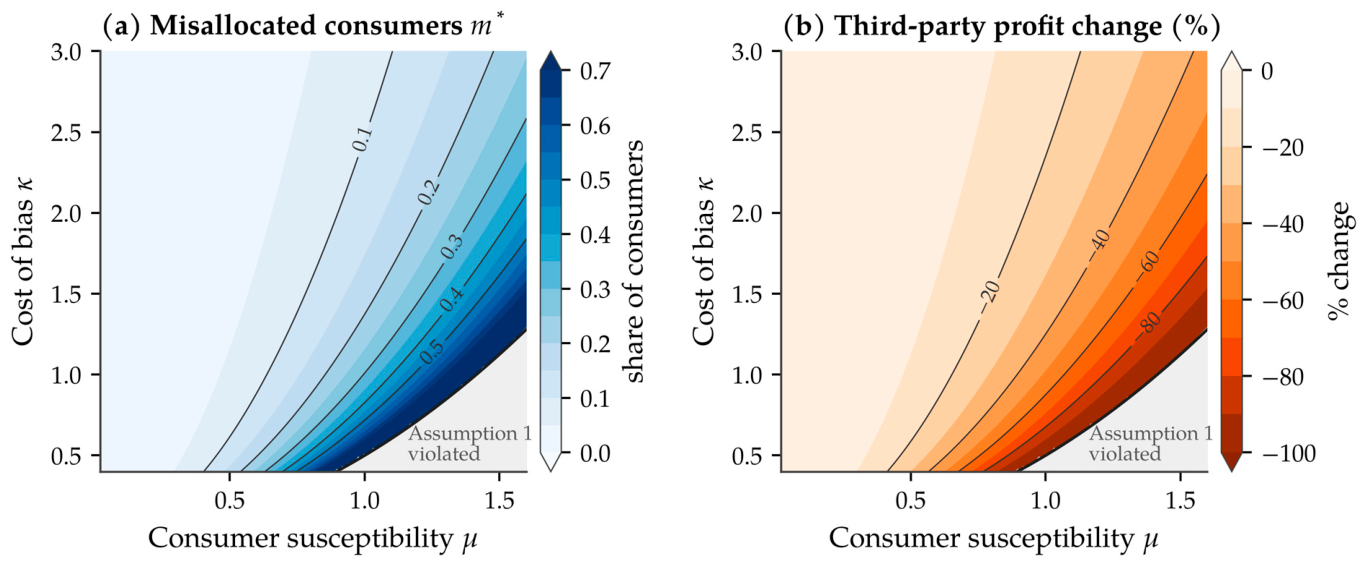
Model II. Table 6 reports the equilibrium with the commission share retained by the platform set to ϕ = 0.45 (long-form videos) and ϕ = 0.55 (Shorts), with r = c = γ = τ = 1, v = 5, κ = 1, and three levels of susceptibility. Moderate susceptibility (μ = 0.8) leads to a bias that shifts the platform’s market share by about 10 percentage points, misallocates about 17% of consumers, and lowers the third-party provider’s profit by about 30%. The revenue share matters less than susceptibility: a higher ϕ slightly lowers bias, consistent with Proposition 7(b), since r < 2cγτ here. Figure 8 extends the long-form scenario to the whole (μ,κ) plane and shows the combinations of susceptibility and cost of bias under which bias becomes economically significant. Because m* depends on μ and κ only through η = μ2/κ, keeping the misallocated share below a given level, say 10%, requires the cost of bias to rise in proportion to the square of consumers’ susceptibility.
Table 6.
Calibrated scenarios for Model II: platform revenue share from the YouTube Partner Program (r = c = γ = τ = 1, v = 5, κ = 1). Changes are relative to neutrality (b ≡ 0).
Figure 8.
Calibrated long-form scenario of Model II (ϕ = 0.45, r = c = γ = τ = 1, v = 5). (a) Share of misallocated consumers m* and (b) percentage change in the third-party provider’s profit relative to neutrality, as functions of consumer susceptibility μ and the cost of bias κ. Assumption 1 fails in the gray region.
5.4. Practical Application
The models can be applied by mapping their parameters to quantities that platforms observe routinely and that regulators can request or audit. Table 7 lists the main parameters, their empirical counterparts, and possible data sources. Under the European Union’s Digital Services Act, vetted researchers can request access to data from very large online platforms, which makes such measurement more feasible [20,58].
Table 7.
Mapping model parameters to observable quantities.
With these inputs, the results can be applied in four steps. First, compare the commission gap with the platform’s reputational stake (Proposition 1): if θA − θB ≤ λ, truthful recommendation can be sustained without intervention. Second, if the gap is larger, compare consumers’ outside option with the prior (Propositions 2–3) to determine whether consumers follow recommendations blindly or discount them. Third, compute the predicted misleading probability, acceptance rate, and probability of misled consumption from Equation (5) and Corollary 1, and the gain from a truthful rule from Proposition 4. Fourth, for an integrated platform, estimate η = μ2/κ and compute bias, misallocation, and the third party’s loss from Proposition 5 and Corollary 2. A regulator can then evaluate how an audit regime that raises κ or a labeling rule that lowers μ would change these outcomes, as in Figure 8.
The models also yield testable predictions. (P1) Users accept recommendations of high-commission items less often when the commission gap is larger (Corollary 1(a)). (P2) In markets where users discount recommendations, the frequency of commission-driven recommendations does not depend on the commission gap but falls when users have better outside options (Equation (5)). (P3) Platforms gain discontinuously when users’ outside option is weak, which creates an incentive to make external search harder (Remark 3). (P4) Own-content bias falls when its expected cost rises (Proposition 7(a)). (P5) Third-party providers facing own-content bias lose market share and reduce both their advertising load and their quality (Proposition 7(c) and Equation (16)). Existing evidence is consistent with some of these predictions, although it was not designed to test our models. Farronato, Fradkin, and MacKay [19] and Waldfogel [21] find that Amazon ranks its own products higher than observably similar products, as Proposition 6 predicts for an integrated platform. Waldfogel [21] also finds that this advantage fell after Amazon’s designation as a gatekeeper under the Digital Markets Act, which is consistent with prediction (P4) if designation raised the expected cost of bias. Finally, the experimental finding that recommendation transparency raises consumer trust [22] is consistent with the mechanism of Proposition 4, under which a verifiable truthful rule raises consumers’ acceptance of recommendations.
6. Discussion
6.1. Two Mechanisms, One Friction
Our two models examine different mechanisms: commission-driven steering between third-party items in Section 3 and ownership-driven self-preferencing in Section 4. In both, bias is driven by a revenue wedge between the items the platform can recommend (the commission gap in Model I, the difference between own advertising revenue and the commission in Model II; Remark 4), and in both the platform cannot commit to how it uses its control over recommendations. In Model I, the lack of commitment produces either blind acceptance with maximal bias or a mixed-strategy equilibrium in which bias and distrust sustain each other, alongside a babbling outcome. In Model II, it leads the integrated platform to choose a bias that harms the third-party provider and, at the baseline, the platform itself. The two models also differ in an important respect. Model I has rational consumers, whereas Model II assumes naive consumers. With rational consumers, Model II becomes a signal-jamming game in which bias is wasteful but does not misallocate consumers (Proposition 8). The models are therefore complementary rather than parts of a single framework: Model I shows what rational discounting implies for communication, and Model II shows how bias interacts with advertising and quality when some consumers do not discount.
Table 8 summarizes which results are proved, which are numerical, and which are interpretations.
Table 8.
Status of the main results.
6.2. Illustrative Cases and Regulatory Practice
Several practices and regulations relate to Proposition 4, although the mapping requires care. Major video platforms require creators to disclose paid promotions, and the platform displays a label to viewers when content includes a paid product placement, sponsorship, or endorsement [59]. These labels are disclosures by creators about their content, not commitments by the platform about how it ranks content. In terms of Model I, they help consumers only to the extent that they make it verifiable which recommendations reflect payments, so that the remaining recommendations can be trusted not to; by themselves they do not restrict the platform’s misleading probabilities. Regulation addresses the platform side more directly. In the European Union, the Digital Services Act requires online platforms to label advertisements and to disclose the main parameters of their recommender systems [58], and the Digital Markets Act prohibits designated gatekeepers from treating their own products and services more favorably in ranking [60]. The latter is the closest real counterpart to a truthful rule with respect to own content. In the United States, the Federal Trade Commission’s revised Endorsement Guides address deceptive endorsements and the distortion of consumer reviews and give an example concerning review sites whose rankings are paid for [61]; they are guidance on deceptive practices, not rules on recommender systems. In China, the provisions on algorithmic recommendation services require providers to publicize the basic principles of their recommendation algorithms and to file them with the regulator [62]. Filing and audit obligations of this kind are the instruments most likely to make the commission-independence of rankings verifiable.
The Naver Shopping case in Korea illustrates the difficulty of policing own-content bias through ex post enforcement. In October 2020, the Korea Fair Trade Commission announced sanctions totaling about KRW 26.7 billion against Naver, most of which concerned the adjustment of its comparison-shopping search algorithm in favor of sellers on its own open-market platform [63], and its formal decision (No. 2021-027) followed on 27 January 2021 [64]. The Seoul High Court upheld the decision in December 2022, but on 16 October 2025, the Supreme Court of Korea (case 2023Du32709) found that the lower court had misapplied the law in holding that the conduct constituted an abuse of dominance, an unfair discriminatory practice, and deceptive customer inducement, and it required the authority to prove restrictive effects in the relevant market [65]. In the language of Model II, slow or uncertain ex post enforcement corresponds to a low cost of bias κ, for which Proposition 7 predicts more intense bias. This is consistent with the view that ex ante instruments, such as audits that raise κ or measures that reduce consumers’ susceptibility μ, can complement enforcement.
6.3. Policy Implications
The results suggest three policy directions, which we present as interpretations of the models rather than as tested conclusions. First, verifiable restrictions on recommendation policies must be imposed. Proposition 4 shows that a platform free to design its commitment retains bias and leaves consumers no better off in both regimes, whereas any verifiable limit on how often it recommends the high-commission item against its information makes consumers better off; a truthful rule is the limiting case. Disclosure of commissions or labels on paid content help only when combined with verifiable rules on how organic rankings are produced, such as external audits that certify that rankings do not depend on payments or depend on them only to a bounded extent. Second, auditing and filing raise the expected cost of bias κ and thereby reduce own-content bias, the misallocation of naive consumers, and the harm to third-party providers (Proposition 7 and Corollary 2). Third, remedies should target the revenue wedge. Since bias arises from the wedge between what the platform earns from different items and vanishes when the wedge vanishes (Propositions 1 and 6 and Remark 4), separating the recommendation function from the content business removes the wedge created by integration, and equalizing commission rates removes the wedge created by commissions, whereas a ban on self-preferencing addresses only the former. Measures that improve consumers’ access to independent search and comparison tools raise w; by Remark 3 the platform has an incentive to keep w low, and by Corollary 1, a higher w lowers the equilibrium misleading probability once w > p.
For platform operators, the analysis implies that credible, verifiable transparency can raise profit relative to no commitment when consumers are skeptical (Proposition 4(a)), and that vertical integration into content creates a wedge that undermines the credibility of the platform’s recommendations. For consumers, the analysis counsels particular caution toward recommendations of a platform’s own content.
6.4. Limitations
Our models are deliberately stylized. Model I considers a single consumer in a static interaction and captures reputation through the reduced-form parameter λ. A dynamic model in which consumers learn about the platform’s type would endogenize reputation and could show whether, and how, a platform enters or escapes a distrust trap over time [35,36,47]; our statement that a history of opaque recommendations can lock a platform into the trap is a conjecture for such a model. Our quantitative results are generated by the models and anchored only to published contract terms; estimating the parameters with platform data (Section 5.4) is left for future work. Model I also uses binary match payoffs, which keep the mixed-strategy equilibrium tractable but abstract from the intensity of preferences, and it assumes that rejection means leaving the platform. Model II relies on naive consumers for its misallocation results, takes consumer susceptibility as exogenous, abstracts from subscription fees and from competition between platforms, and assumes full market coverage. The welfare conclusions of Model II depend on how the cost of bias is interpreted, and the policy conclusions in Section 6.3 require empirical verification. Extending the analysis to partially naive consumers, to competing platforms, and to the empirical estimation of bias parameters are promising directions.
7. Conclusions
7.1. Main Findings
This paper developed two game-theoretic models of recommendation bias on ad-funded digital content platforms. The cheap-talk model shows that consumer skepticism toward recommendations is a rational response to misaligned commission incentives. When the commission gap exceeds the platform’s reputational stake, truthful recommendation cannot be sustained. Consumers with weak outside options then accept recommendations while the platform always promotes the high-commission item, and consumers with strong outside options discount recommendations in a mixed-strategy equilibrium in which bias and distrust sustain each other. This equilibrium coexists with a babbling outcome in which recommendations are ignored. A truthful rule would make consumers better off and, when consumers are skeptical, the platform too; a platform free to choose its own commitment, however, retains partial bias and leaves consumers no better off, whereas any verifiable limit on how often it recommends the high-commission item against its information benefits consumers. The Hotelling model shows that a platform acting as both a content supplier and a recommendation intermediary chooses a bias proportional to its revenue wedge between its own content and third-party content, whereas a pure intermediary with equal commission rates chooses none. Bias increases with consumer susceptibility and decreases with its cost; it diverts traffic from the third-party provider and misallocates naive consumers, and its effects on consumer surplus and total welfare depend on the suppliers’ advertising responses and on whether the cost of bias is a social cost. With rational consumers, bias persists as wasteful signal jamming. Together, the results identify revenue wedges and the platform’s lack of commitment as the sources of recommendation bias, and they suggest that verifiable rules on how rankings are produced, rather than voluntary disclosure, are needed to protect consumers.
The analytical results were verified numerically by simulation and by independent computation, and calibrated scenarios anchored to published contract terms indicate their quantitative relevance. For example, under the commission schedule of a large affiliate program, truthful recommendation requires a reputational stake of up to 70% of the higher commission, and under the revenue shares of a large video platform, moderate consumer susceptibility misallocates about one sixth of consumers and lowers the third-party provider’s profit by about 30% (Section 5.3).
7.2. Practical Implications
The results have implications for several groups of stakeholders. For regulators and competition authorities, Propositions 1–4 identify the conditions under which recommendations are distorted and explain why voluntary disclosure by the platform is unlikely to protect consumers. Effective intervention requires verifiable rules on how rankings are produced, such as independent algorithm audits and algorithm filing, which raise the cost of bias. Such rules need not establish full truthfulness: a verifiable bound on the influence of commissions on rankings already benefits consumers (Proposition 4(c)). Rules on self-preferencing and on access to independent search complement these measures by narrowing the platform’s revenue wedge and strengthening the consumer’s outside option, respectively. The procedure described in Section 5.4 indicates how these effects can be quantified when platform data are available.
For platform operators, the analysis points to a long-run cost of commission-driven recommendations. When users are skeptical, a credible commitment to truthful ranking increases the platform’s own profit (Proposition 4(a)). A platform that expands into content production should also expect its recommendations to lose credibility unless ranking decisions are kept separate from its content business.
Third-party content providers and creators can use Proposition 7 and Figure 8 to assess the traffic and revenue they are likely to lose because of own-content bias, and the results support their case for audits or for revenue-sharing terms that reduce the platform’s revenue wedge. Advertisers should be aware that traffic on a platform that favors its own content may overstate the value of the platform’s own advertising inventory (Corollary 2). Consumers and consumer organizations, in turn, can limit the effect of bias by reducing susceptibility and strengthening outside options, for example, through independent reviews and comparison tools; as shown in Corollaries 1 and 2, this lowers both the probability of misleading recommendations and the misallocation caused by own-content bias.
7.3. Future Research
Several extensions merit further research. The most immediate is empirical: estimating the parameters of both models with platform data, obtained, for example, from randomized recommendation experiments, audit studies or the data access for researchers provided under recent regulation, would make it possible to test predictions (P1)–(P5). On the theoretical side, a dynamic version of Model I in which consumers learn about the platform’s type would endogenize reputation and clarify whether and how a platform can escape the distrust trap. Model II could be extended to partially naive consumers, which would combine the misallocation analyzed in Section 4.5 with the signal jamming of Proposition 8. Competition among platforms, subscription and hybrid business models, and multi-homing by consumers and content providers are also likely to affect the size of the revenue wedge and, hence, the extent of bias. Finally, recommendations generated by large language models and other AI systems raise new questions of verifiability and transparency, to which the distinction drawn in this paper between an imposed truthful rule and a commitment chosen by the platform applies directly.
Supplementary Materials
The following supporting information can be downloaded at: https://www.mdpi.com/article/10.3390/jtaer21120437/s1: Code S1: Python code (supplementary_code.py) that reproduces all numerical experiments (E1–E7 in Table 3), including the Monte Carlo verification of Lemma 1, the agent-based simulation of Model I, the optimal commitment search of Proposition 4, the numerical best response verification and the global optimality check of Proposition 5, Table 2, the consumer surplus decomposition, Remark 4, the random parameter exercise of Section 4.5, and the calibrated scenarios of Section 5.3.
Author Contributions
Conceptualization, X.X. and C.-Z.Y.; methodology, X.X. and C.-Z.Y.; formal analysis, X.X.; software, X.X.; writing—original draft preparation, X.X.; writing—review and editing, C.-Z.Y.; supervision, C.-Z.Y.; funding acquisition, C.-Z.Y. All authors have read and agreed to the published version of the manuscript.
Funding
This research was supported by the National Social Science Foundation of China (Grant No. 24BJL082), the Fundamental Research Funds for the Central Universities, China (CXTD202407), and the Natural Science Foundation of Guangdong Province, China (2025A1515010468).
Institutional Review Board Statement
Not applicable.
Informed Consent Statement
Not applicable.
Data Availability Statement
Data is contained within the article or supplementary material. This study does not use empirical micro-data; no new data were collected. All quantitative results are generated from the models with the parameter values reported in the paper. The publicly available contract terms used to anchor the calibrated scenarios are cited in Section 5.1 [56,57]. The code that reproduces all numerical results, tables, and figures is provided as Supplementary Material (Code S1).
Conflicts of Interest
The authors declare no conflicts of interest.
Appendix A. Proofs
Proof of Lemma 1.
The joint density of (uA,uB) is uniform on the rectangle [a(1 − σ),a(1 + σ)] × [ka(1 − σ),ka(1 + σ)], whose area is (2aσ)(2kaσ) = 4ka2σ2. Since k < 1, the left edge uA = a(1 − σ) intersects the diagonal uB = uA at height a(1 − σ) > ka(1 − σ), and the top edge uB = ka(1 + σ) intersects the diagonal at uA = ka(1 + σ) < a(1 + σ). Hence, if ka(1 + σ) > a(1 − σ), i.e., h > 0, the region {uB > uA} within the rectangle is the right triangle with vertices (a(1 − σ),a(1 − σ)), (a(1 − σ),ka(1 + σ)), and (ka(1 + σ),ka(1 + σ)), whose legs both have length ah. Its area is a2h2/2, so 1 − p = h2/(8kσ2). If h ≤ 0, the region is empty and p = 1. Since h − 2kσ = −(1 − k)(1 − σ) < 0, we have 0 < h < 2kσ on h > 0, so 1 − p < k/2 < 1/2. For monotonicity, ∂(h2/k)/∂k = h[(1 + σ)k + (1 − σ)]/k2 > 0, so p is strictly decreasing in k. Furthermore, 1 − p = (h/σ)2/(8k) with h/σ = (1 + k) − (1 − k)/σ, which is positive and strictly increasing in σ, so p is strictly decreasing in σ. □
Proof of Proposition 1.
Suppose α = β = 0. Then πA = πB = 1 > w, so the consumer accepts both recommendations, qA = qB = 1. When A is the better match, recommending A yields θA + λ > θB, so truth-telling is optimal. When B is the better match, recommending B yields θB + λ and recommending A yields θA, so truth-telling is optimal if and only if θA − θB ≤ λ. Since h > 0, both states occur with positive probability. □
Proof of Proposition 2.
Under monotone beliefs, the consumer’s posterior after IA is at least p, whether or not IA is on the equilibrium path. Since p > w, the consumer strictly prefers to accept IA, so qA = 1. When B is the better match, recommending A therefore yields θA, while recommending B yields at most θB + λ < θA; hence, α = 1. When A is the better match, recommending A yields θA + λ > θB ≥ qBθB, the payoff from recommending B; hence, β = 0. The platform recommends A in every state, and the consumer’s payoff is Pr(uA > uB) = p. □
Proof of Proposition 3.
Write RA = qAθA and RB = qBθB. When A is the better match, the platform compares RA + λqA (from IA) with RB (from IB); when B is the better match, it compares RA with RB + λqB.
Step 1 (one message on path). If only IA is sent, then α = 1 and β = 0 by definition, so πA = p < w and qA = 0; the platform earns zero, and the deviation to IB is unprofitable only if qB = 0, which is supported by the off-path belief πB = 1 − p < w. If only IB is sent, then β = 1 and α = 0 by definition, so πB = 1 − p < 1/2 < w and qB = 0; analogously, qA = 0, supported by the off-path belief πA = p < w. Both cases are babbling outcomes.
Step 2 (both messages on path, (qA,qB) ≠ (0, 0)). If RA > RB + λqB, the platform sends IA when B is better. In addition, since RA + λqA > RB, it also sends IA when A is better, so IB is never sent, a contradiction. If RA < RB + λqB, then α = 0, so IA is sent only when A is better and πA = 1, implying qA = 1 and RA = θA > θB + λ ≥ RB + λqB, a contradiction. Hence, RA = RB + λqB. Then, when A is better, RA + λqA − RB = λ(qA + qB) > 0, so β = 0. With β = 0, IB is sent only when B is better, so πB = 1 > w and qB = 1; the indifference condition becomes qAθA = θB + λ, i.e., . Because qA ∈ (0, 1), the consumer must be indifferent after IA, i.e., πA = w. Using Equation (2) with β = 0, p/(p + (1 − p)α) = w gives α = α*, which lies in (0, 1) because w > p. One verifies directly that these strategies are mutual best responses.
Step 3 (both messages on path, qA = qB = 0). This requires the on-path posteriors to satisfy πA ≤ w and πB ≤ w, which holds, for example, when α = 1 − β, since then πA = p and πB = 1 − p. The platform earns zero regardless of its message and is indifferent. This is again a babbling outcome.
Existence of the babbling outcome for all w > p follows from Step 1 with pooling on IA; the argument does not use θA − θB > λ. □
Proof of Remark 1.
Consider a monotone PBE in which some recommendation is accepted with positive probability. If both messages are on path, Step 2 of the proof of Proposition 3, which does not use w > p until its last sentence, gives β = 0, qB = 1, , and πA = w = p; with β = 0, πA = p requires α = 1, so IB is never sent, a contradiction. If only IB is on path, then β = 1 and α = 0, so πB = 1 − p < p = w and qB = 0; for some recommendation to be accepted, the off-path IA must be accepted with positive probability, and the platform would deviate to it, a contradiction. Hence, only IA is on path, so α = 1 and β = 0, and πA = p = w makes the consumer indifferent, so any qA ∈ (0,1] is a best response. With the monotone off-path belief πB = 1 − p < w, a recommendation of B is rejected, so the platform strictly prefers IA in both states. All remaining monotone PBEs have every recommendation rejected, as in Steps 1 and 3 of the proof of Proposition 3. □
Proof of Remark 2.
None of the arguments in the proofs of Propositions 1–4 and Corollary 1(b)–(c) uses p > 1/2, except through the inequalities 1 − p < w (Step 1 of Proposition 3) and max{p,1 − p} < w (babbling); relabeling the items yields the stated results. If pH < 1/2 and pH < w < 1 − pH, pooling on IL yields πL = 1 − pH > w, so the consumer accepts; with the monotone off-path belief πH = pH < w, a recommendation of H is rejected, and the platform has no profitable deviation. For θB > θA + λ, the indifference condition πB = w with α = 0 gives (1 − p)/((1 − p) + pβ) = w, i.e., β* = (1 − p)(1 − w)/(pw). □
Proof of Corollary 1.
(a) α* is increasing in p and decreasing in w; by Lemma 1, p is decreasing in k and σ on h > 0. The statements about are immediate. (b) After IA, the consumer is indifferent, so her continuation payoff is w; after IB, it is 1. With Pr(IB) = (1 − p)(1 − α*) = (w − p)/w, U* = w + (1 − w)(w − p)/w. The platform earns when A is better (probability p), and θB + λ when B is better, whether it recommends A (by indifference) or B; this gives Π*, and gives the second expression. (c) The probability is ; substituting Equation (5) gives the expression. □
Proof of Proposition 4.
(a) Under a truthful rule, every recommendation is accepted, which gives ΠT and a consumer payoff of 1. Subtracting Π* from ΠT gives p(θA + λ)[1 − (θB + λ)/θA], which is positive because θA − θB > λ; moreover, 1 > U* > w when w > p, and the platform earns zero in the babbling outcome. If w < p, the blind trust equilibrium yields the platform θA + pλ, and θA + pλ − ΠT = (1 − p)(θA − θB − λ) > 0.
(b) Fix a committed strategy (α,β). The consumer accepts Ij if and only if πj ≥ w. If both recommendations are accepted, the platform’s profit is p[(1 − β)(θA + λ) + βθB] + (1 − p)[αθA + (1 − α)(θB + λ)], which is strictly decreasing in β (because θA + λ > θB) and strictly increasing in α (because θA > θB + λ). With β = 0, πB = 1 and πA ≥ w if and only if α ≤ α* when w > p, while any α ≤ 1 is feasible when w ≤ p. Raising β above zero lowers profit and tightens the constraint πA ≥ w, so the optimum is β = 0 and α = min{α*,1}. If only IA is accepted, profit is lower than with the same (α,β) and IB accepted, and the constraint on α is the same; if only IB is accepted, profit is at most θB + λ < ΠT; if neither is accepted, profit is zero. Hence, ΠC is as stated; subtracting ΠT gives (1 − p)α*(θA − θB − λ) = p(1 − w)(θA − θB − λ)/w. Under this commitment, πA = w and πB = 1, so the consumer’s payoff is Pr(IA)w + Pr(IB) = U*. If w ≤ p, the optimum is α = 1, β = 0, which is the outcome of Proposition 2.
(c) The argument in part (b) applies with the additional constraint . As long as both recommendations are accepted, profit is decreasing in β and increasing in α, and with β = 0, both recommendations are accepted for every . Hence, the platform chooses β = 0 and . The consumer then consumes the better item unless B is better and A is recommended, which happens with probability (1 − p)α; this gives Equation (8). At α = α*, 1 − (1 − p)α* = 1 − p(1 − w)/w = U*, and at α = 1, the payoff is p. We confirmed parts (b) and (c) by a brute-force search over (α,β) (Supplementary Material). □
Proof of Remark 3.
For w < p, Proposition 2 gives the platform θA + pλ and the consumer p. For w > p, Corollary 1(b) gives , which does not depend on w, and U* → p as w ↓ p. The difference is , which is Equation (9). Since the consumer’s payoff is continuous, total surplus falls by the same amount. □
Proof of Proposition 5.
Interior solution. In the region where D1 ∈ (0, 1), the platform’s profit is quadratic in (d1,u1,b) with the Hessian given as follows:
whose leading principal minors are −rγ/τ < 0, r(4cγτ − r)/(4τ2) and −r[4cγκτ − r(κ + cμ2)]/(4τ2). The provider’s Hessian in (d2,u2) has determinant (1 − ϕ)r[4cγτ − (1 − ϕ)r]/(4τ2) and diagonal entries −(1 − ϕ)rγ/τ and −c. Assumption 1(i) implies 4cγκτ > r(κ + cμ2) and hence 4cγτ > r, so both profit functions are strictly concave in the firm’s own variables on this region. The first and fourth conditions in Equation (13) give Equation (14). The second, third, and fifth conditions give u1 − v = r(d1 − ϕd2)/(2τc) = rD1/(γc), b = μr(d1 − ϕd2)/(2τκ) = μrD1/(γκ), and u2 − v = (1 − ϕ)rd2/(2τc) = (1 − ϕ)rD2/(γc). Substituting these expressions, together with γ(d1 − d2) = 2τ[D1 − (1 − ϕ)D2], into (11) with D2 = 1 − D1 yields a linear equation in D1 as follows:
whose unique solution is (15). Assumption 1(i) is equivalent to 3cγτ − r − cηr > 0, which implies 3cγτ > r, so that N = (1 − ϕ)(3cγτ − r) + ϕcγτ > 0; since M − cηr = N + (3cγτ − r − cηr) > 0, both and lie in (0,1); the numerator of is positive if and only if Assumption 1(i) holds. The remaining expressions in (16) follow from (14); positivity of b*, , and follows from .
Global optimality. Fix the provider’s choices . The set of platform choices with d1,b ≥ 0 and D1 ∈ [0,1] is convex because D1 is affine, and the platform’s profit is strictly concave on it, so the interior solution maximizes profit on this set. On the set where the untruncated demand exceeds one, D1 = 1 and , which is strictly increasing in d1; raising d1 lowers the untruncated demand continuously, so every such point is dominated by a point with D1 = 1. On the set where the untruncated demand is negative, D1 = 0 and . This upper bound is attained at u1 = v, b = 0, and , at which D1 = 0; this d1 is positive because , using (1 − ϕ)r/(γc) < 3τ. Hence, every point with negative untruncated demand is weakly dominated by a point with D1 = 0. For the provider, when its untruncated demand exceeds one, is increasing in d2, and when it is negative, . Hence, the interior solution is a global best response for both firms. It is the unique equilibrium with interior market shares because the interior first-order conditions have a unique solution.
Full coverage. Since , , and , every consumer’s true utility from the content she chooses is at least v − 3τ ≥ 0 under Assumption 1(ii); perceived utility is at least as large. □
Proof of Proposition 6.
In the benchmark, provider i’s first-order conditions give Di = γdi/(2τ) and ui − v = (1 − ϕ)rdi/(2τc), and the platform’s condition for b gives b = ϕrμ(d1 − d2)/(2τκ). Substituting into D1 − D2 = [(u1 − u2) − γ(d1 − d2) + μb]/τ yields the following:
The bracket is positive under Assumption 1 because 3cγκτ − (1 − ϕ)rκ − ϕrcμ2 > 3cγκτ − r(κ + cμ2) > 0. Hence, d1 = d2, bN = 0, and . Concavity and global optimality follow as in Proposition 5. For the integrated platform, by Proposition 5. □
Proof of Remark 4.
With commission rates ϕ1 and ϕ2, the platform’s profit is , and its first-order condition for b is μr(ϕ1d1 − ϕ2d2)/(2τ) = κb. The providers’ conditions give di = 2τDi/γ, which yields Equation (17). The numerical value is computed in the Supplementary Material. □
Proof of Proposition 7.
(a) with N > 0 and M − cηr > 0, and η enters only through the term −cηr, so is strictly increasing in η. Since b* = μrN/[γ(κM − cμ2r)], the numerator increases and the denominator decreases in μ, and the denominator increases in κ. (b) Since ∂N/∂ϕ=∂M/∂ϕ = r − 2cγτ, differentiating gives (r − 2cγτ)(M − cηr − N)/(M − cηr)2, and M − N − cηr = 3cγτ − r − cηr > 0. As b* is proportional to for given (μ,κ), it moves in the same direction. Under Assumption 1, r < 3cγτ/(1 + cη), so the derivative is positive if and only if 2cγτ < r < 3cγτ/(1 + cη), which is a non-empty interval if and only if 2 < 3/(1 + cη), i.e., cη < 1/2. (c) Substituting Equation (16) into π2 gives the expression, whose coefficient is positive because 4γcτ > (1 − ϕ)r; since is strictly decreasing in η, so is . □
Proof of Corollary 2.
The true utility indifferent consumer satisfies Equation (11) with μb removed, so , which is nonnegative if and only if ηr ≤ 2γτ. In that case, , which is increasing in η by Proposition 7(a). A consumer at who chooses content 1 loses 2τ(x − x∘) in true utility if x > x∘; integrating over gives , and integrating over when x∘ < 0 gives . □
Proof of Proposition 8.
Given beliefs be, demand is , and all first-order conditions in Equation (13) are unchanged. In equilibrium, b = be, so demand coincides with demand under neutrality for given (d1,u1,d2,u2), and the conditions for (d1,u1,d2,u2) coincide with those of the neutral game, whose unique solution has D1 = N/M (set η = 0 in Proposition 5). The condition for b then gives bR = μrD1/(γκ) with D1 = N/M. Since choices coincide with the neutral ones and true and perceived utilities coincide in equilibrium, consumer surplus, the provider’s profit, and the allocation equal their neutral values, and the platform’s profit is its neutral profit minus . Concavity and global optimality follow as in Proposition 5. □
References
- Hagiu, A.; Jullien, B. Why do intermediaries divert search? RAND J. Econ. 2011, 42, 337–362. [Google Scholar] [CrossRef] [Scilit]
- Bourreau, M.; Gaudin, G. Streaming platform and strategic recommendation bias. J. Econ. Manag. Strategy 2022, 31, 25–47. [Google Scholar] [CrossRef] [Scilit]
- de Cornière, A.; Taylor, G. A model of biased intermediation. RAND J. Econ. 2019, 50, 854–882. [Google Scholar] [CrossRef] [Scilit]
- Inderst, R.; Ottaviani, M. Competition through commissions and kickbacks. Am. Econ. Rev. 2012, 102, 780–809. [Google Scholar] [CrossRef] [Scilit]
- Crawford, V.P.; Sobel, J. Strategic information transmission. Econometrica 1982, 50, 1431–1451. [Google Scholar] [CrossRef] [Scilit] [PubMed]
- Hotelling, H. Stability in competition. Econ. J. 1929, 39, 41–57. [Google Scholar] [CrossRef] [Scilit]
- Inderst, R.; Ottaviani, M. Misselling through agents. Am. Econ. Rev. 2009, 99, 883–908. [Google Scholar] [CrossRef] [Scilit]
- Inderst, R.; Ottaviani, M. How (not) to pay for advice: A framework for consumer financial protection. J. Financ. Econ. 2012, 105, 393–411. [Google Scholar] [CrossRef] [Scilit]
- Armstrong, M.; Zhou, J. Paying for prominence. Econ. J. 2011, 121, F368–F395. [Google Scholar] [CrossRef] [Scilit]
- Eliaz, K.; Spiegler, R. A simple model of search engine pricing. Econ. J. 2011, 121, F329–F339. [Google Scholar] [CrossRef] [Scilit]
- Choi, J.P.; Jeon, D.-S. Platform design biases in ad-funded two-sided markets. RAND J. Econ. 2023, 54, 240–267. [Google Scholar] [CrossRef] [Scilit]
- Teh, T.-H.; Wright, J. Intermediation and steering: Competition in prices and commissions. Am. Econ. J. Microecon. 2022, 14, 281–321. [Google Scholar] [CrossRef] [Scilit]
- Xu, W.; Yang, S. Dynamic pricing with recommendation and consumer feedback. RAND J. Econ. 2026, 57, 349–367. [Google Scholar] [CrossRef] [Scilit]
- Gambato, J.; Peitz, M. Platform-enabled information disclosure. Int. J. Ind. Organ. 2025, 99, 103143. [Google Scholar] [CrossRef] [Scilit]
- Peitz, M.; Sobolev, A. Inflated recommendations. RAND J. Econ. 2026, 57, 368–385. [Google Scholar] [CrossRef] [Scilit]
- Peitz, M.; Sobolev, A. Biased recommendations and differentially informed consumers. Econ. Theory Bull. 2025, 13, 245–261. [Google Scholar] [CrossRef] [Scilit]
- Bergemann, D.; Bonatti, A. Data, competition, and digital platforms. Am. Econ. Rev. 2024, 114, 2553–2595. [Google Scholar] [CrossRef] [Scilit]
- Aguiar, L.; Waldfogel, J. Platforms, power, and promotion: Evidence from Spotify playlists. J. Ind. Econ. 2021, 69, 653–691. [Google Scholar] [CrossRef] [Scilit]
- Farronato, C.; Fradkin, A.; MacKay, A. Self-preferencing at Amazon: Evidence from search rankings. AEA Pap. Proc. 2023, 113, 239–243. [Google Scholar] [CrossRef] [Scilit]
- Reimers, I.; Waldfogel, J. A Framework for Detection, Measurement, and Welfare Analysis of Platform Bias; NBER Working Paper No. 31766; National Bureau of Economic Research: Cambridge, MA, USA, 2023. [Google Scholar] [CrossRef] [Scilit]
- Waldfogel, J. Amazon Self-Preferencing in the Shadow of the Digital Markets Act; NBER Working Paper No. 32299; National Bureau of Economic Research: Cambridge, MA, USA, 2024. [Google Scholar] [CrossRef] [Scilit]
- Li, Y.; Deng, X.; Hu, X.; Liu, J. The effects of e-commerce recommendation system transparency on consumer trust: Exploring parallel multiple mediators and a moderator. J. Theor. Appl. Electron. Commer. Res. 2024, 19, 2630–2649. [Google Scholar] [CrossRef] [Scilit]
- Yin, J.; Qiu, X.; Wang, Y. The impact of AI-personalized recommendations on clicking intentions: Evidence from Chinese e-commerce. J. Theor. Appl. Electron. Commer. Res. 2025, 20, 21. [Google Scholar] [CrossRef] [Scilit]
- Nelson, P. Advertising as information. J. Political Econ. 1974, 82, 729–754. [Google Scholar] [CrossRef] [Scilit]
- Milgrom, P.; Roberts, J. Price and advertising signals of product quality. J. Political Econ. 1986, 94, 796–821. [Google Scholar] [CrossRef] [Scilit]
- Chakraborty, A.; Harbaugh, R. Comparative cheap talk. J. Econ. Theory 2007, 132, 70–94. [Google Scholar] [CrossRef] [Scilit]
- Chakraborty, A.; Harbaugh, R. Persuasion by cheap talk. Am. Econ. Rev. 2010, 100, 2361–2382. [Google Scholar] [CrossRef] [Scilit]
- Morgan, J.; Stocken, P.C. An analysis of stock recommendations. RAND J. Econ. 2003, 34, 183–203. [Google Scholar] [CrossRef] [Scilit]
- Che, Y.-K.; Dessein, W.; Kartik, N. Pandering to persuade. Am. Econ. Rev. 2013, 103, 47–79. [Google Scholar] [CrossRef] [Scilit]
- Kamenica, E.; Gentzkow, M. Bayesian persuasion. Am. Econ. Rev. 2011, 101, 2590–2615. [Google Scholar] [CrossRef] [Scilit]
- Lipnowski, E.; Ravid, D.; Shishkin, D. Persuasion via weak institutions. J. Political Econ. 2022, 130, 2705–2730. [Google Scholar] [CrossRef] [Scilit] [PubMed]
- Lin, X.; Liu, C. Credible persuasion. J. Political Econ. 2024, 132, 2228–2273. [Google Scholar] [CrossRef] [Scilit]
- Farrell, J. Meaning and credibility in cheap-talk games. Games Econ. Behav. 1993, 5, 514–531. [Google Scholar] [CrossRef] [Scilit]
- Chen, Y.; Kartik, N.; Sobel, J. Selecting cheap-talk equilibria. Econometrica 2008, 76, 117–136. [Google Scholar] [CrossRef] [Scilit]
- Sobel, J. A theory of credibility. Rev. Econ. Stud. 1985, 52, 557–573. [Google Scholar] [CrossRef] [Scilit]
- Benabou, R.; Laroque, G. Using privileged information to manipulate markets: Insiders, gurus, and credibility. Q. J. Econ. 1992, 107, 921–958. [Google Scholar] [CrossRef] [Scilit]
- Hagiu, A.; Wright, J. Marketplace or reseller? Manag. Sci. 2015, 61, 184–203. [Google Scholar] [CrossRef] [Scilit]
- Hagiu, A.; Teh, T.-H.; Wright, J. Should platforms be allowed to sell on their own marketplaces? RAND J. Econ. 2022, 53, 297–327. [Google Scholar] [CrossRef] [Scilit]
- de Cornière, A.; Taylor, G. Integration and search engine bias. RAND J. Econ. 2014, 45, 576–597. [Google Scholar] [CrossRef] [Scilit]
- Burguet, R.; Caminal, R.; Ellman, M. In Google we trust? Int. J. Ind. Organ. 2015, 39, 44–55. [Google Scholar] [CrossRef] [Scilit]
- Zennyo, Y. Platform encroachment and own-content bias. J. Ind. Econ. 2022, 70, 684–710. [Google Scholar] [CrossRef] [Scilit]
- Aridor, G.; Gonçalves, D. Recommenders’ originals: The welfare effects of the dual role of platforms as producers and recommender systems. Int. J. Ind. Organ. 2022, 83, 102845. [Google Scholar] [CrossRef] [Scilit]
- Anderson, S.P.; Bedre-Defolie, Ö. Hybrid platform model: Monopolistic competition and a dominant firm. RAND J. Econ. 2024, 55, 684–718. [Google Scholar] [CrossRef] [Scilit]
- Long, F.; Amaldoss, W. Self-preferencing in e-commerce marketplaces: The role of sponsored advertising and private labels. Mark. Sci. 2024, 43, 925–952. [Google Scholar] [CrossRef] [Scilit]
- Wang, W.; Han, X.; Ma, Y.; Li, G. Personalized recommendation in a retail platform under the hybrid selling mode. J. Theor. Appl. Electron. Commer. Res. 2024, 19, 3606–3631. [Google Scholar] [CrossRef] [Scilit]
- Padilla, J.; Perkins, J.; Piccolo, S. Self-preferencing in markets with vertically integrated gatekeeper platforms. J. Ind. Econ. 2022, 70, 371–395. [Google Scholar] [CrossRef] [Scilit]
- Jeon, D.-S.; Drugov, M. Dynamic Recommendation Bias; TSE Working Paper No. 26-1742; Toulouse School of Economics: Toulouse, France, 2026. [Google Scholar]
- Kittaka, Y.; Sato, S.; Zennyo, Y. Self-preferencing by platforms: A literature review. Jpn. World Econ. 2023, 66, 101191. [Google Scholar] [CrossRef] [Scilit]
- Bougette, P.; Budzinski, O.; Marty, F. Self-preferencing and competitive damages: A focus on exploitative abuses. Antitrust Bull. 2022, 67, 190–207. [Google Scholar] [CrossRef] [Scilit]
- Etro, F. e-Commerce platforms and self-preferencing. J. Econ. Surv. 2024, 38, 1516–1543. [Google Scholar] [CrossRef] [Scilit]
- Anderson, S.P.; Coate, S. Market provision of broadcasting: A welfare analysis. Rev. Econ. Stud. 2005, 72, 947–972. [Google Scholar] [CrossRef] [Scilit]
- Peitz, M.; Valletti, T.M. Content and advertising in the media: Pay-tv versus free-to-air. Int. J. Ind. Organ. 2008, 26, 949–965. [Google Scholar] [CrossRef] [Scilit]
- Rochet, J.-C.; Tirole, J. Platform competition in two-sided markets. J. Eur. Econ. Assoc. 2003, 1, 990–1029. [Google Scholar] [CrossRef] [Scilit]
- Armstrong, M. Competition in two-sided markets. RAND J. Econ. 2006, 37, 668–691. [Google Scholar] [CrossRef] [Scilit]
- Tsebelis, G. The abuse of probability in political analysis: The Robinson Crusoe fallacy. Am. Political Sci. Rev. 1989, 83, 77–91. [Google Scholar] [CrossRef] [Scilit]
- Amazon Associates. Associates Program Standard Commission Income Statement. Available online: https://affiliate-program.amazon.com/help/node/topic/GRXPHT8U84RAYDXZ (accessed on 13 November 2026).
- YouTube Help. YouTube Partner Earnings Overview. Available online: https://support.google.com/youtube/answer/72902 (accessed on 13 November 2026).
- European Parliament. Regulation (EU) 2022/2065 of the European Parliament and of the Council of 19 October 2022 on a Single Market for Digital Services (Digital Services Act). Off. J. Eur. Union 2022, L 277, 1–102. [Google Scholar]
- YouTube Help. Add Paid Product Placements, Sponsorships & Endorsements. Available online: https://support.google.com/youtube/answer/154235 (accessed on 12 November 2026).
- European Parliament. Regulation (EU) 2022/1925 of the European Parliament and of the Council of 14 September 2022 on Contestable and Fair Markets in the Digital Sector (Digital Markets Act). Off. J. Eur. Union 2022, L 265, 1–66. [Google Scholar]
- Federal Trade Commission. Guides Concerning the Use of Endorsements and Testimonials in Advertising (16 CFR Part 255); Federal Register; Office of the Federal Register, National Archives and Records Administration: Washington, DC, USA, 2023; Volume 88, pp. 48092–48112. Available online: https://www.govinfo.gov/app/details/FR-2023-07-26/2023-14795 (accessed on 12 November 2026).
- Cyberspace Administration of China; Ministry of Industry and Information Technology; Ministry of Public Security; State Administration for Market Regulation. Provisions on the Administration of Algorithmic Recommendation for Internet Information Services; Effective 1 March 2022. Available online: https://www.cac.gov.cn/2022-01/04/c_1642894606364259.htm (accessed on 12 November 2026).
- The Korea Times. Naver Fined W26.7 bil. for Manipulating Search Algorithm. 6 October 2020. Available online: https://www.koreatimes.co.kr/amp/business/tech-science/20201006/naver-fined-w267-bil-for-manipulating-search-algorithm (accessed on 12 November 2026).
- Korea Fair Trade Commission. Decision No. 2021-027 (NAVER Shopping Case), 27 January 2021; Korea Fair Trade Commission: Sejong, Republic of Korea, 2021. [Google Scholar]
- Supreme Court of Korea. Judgment of 16 October 2025, Case No. 2023Du32709 (Revocation of Correction Order and Surcharge Payment Order). Available online: https://www.scourt.go.kr/eng/supreme/decisions/NewDecisionsView.work?pageIndex=1&seq=6049 (accessed on 12 November 2026).
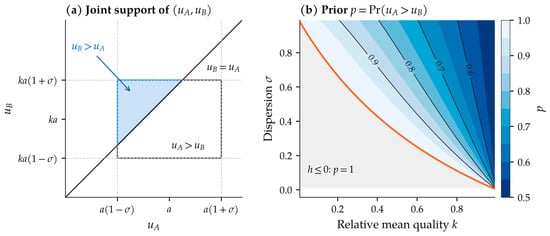
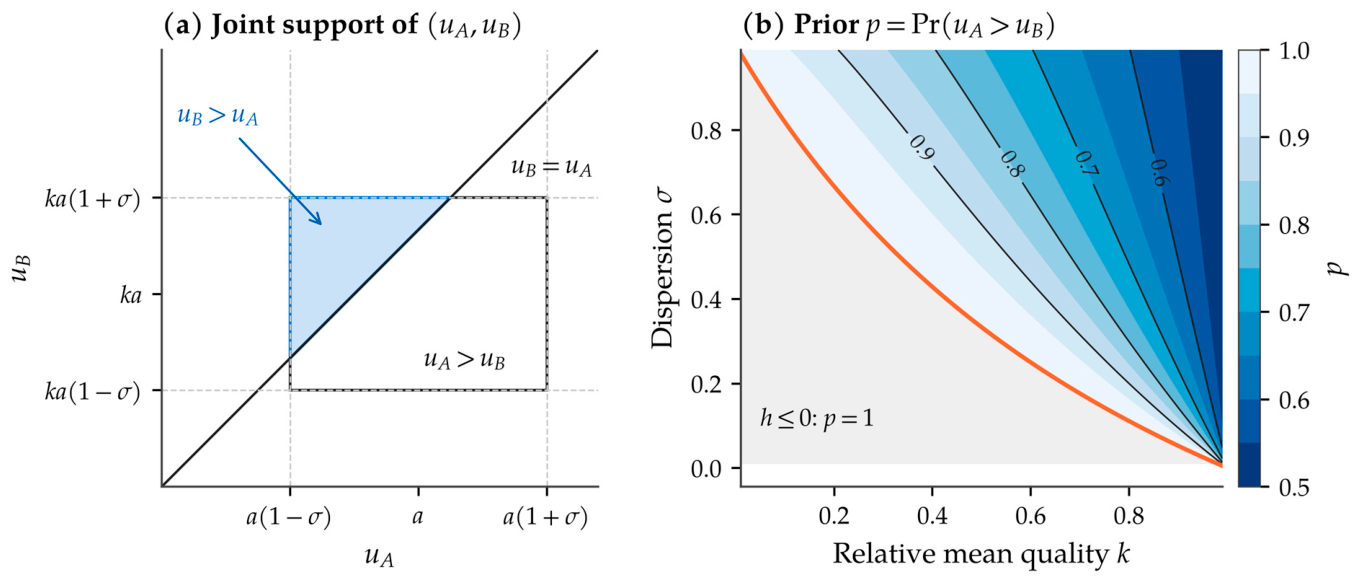
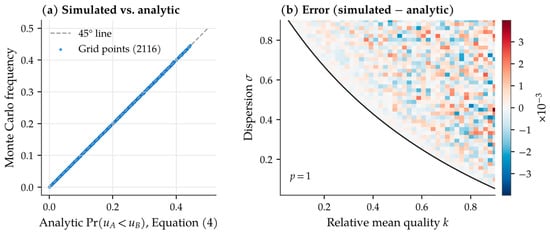
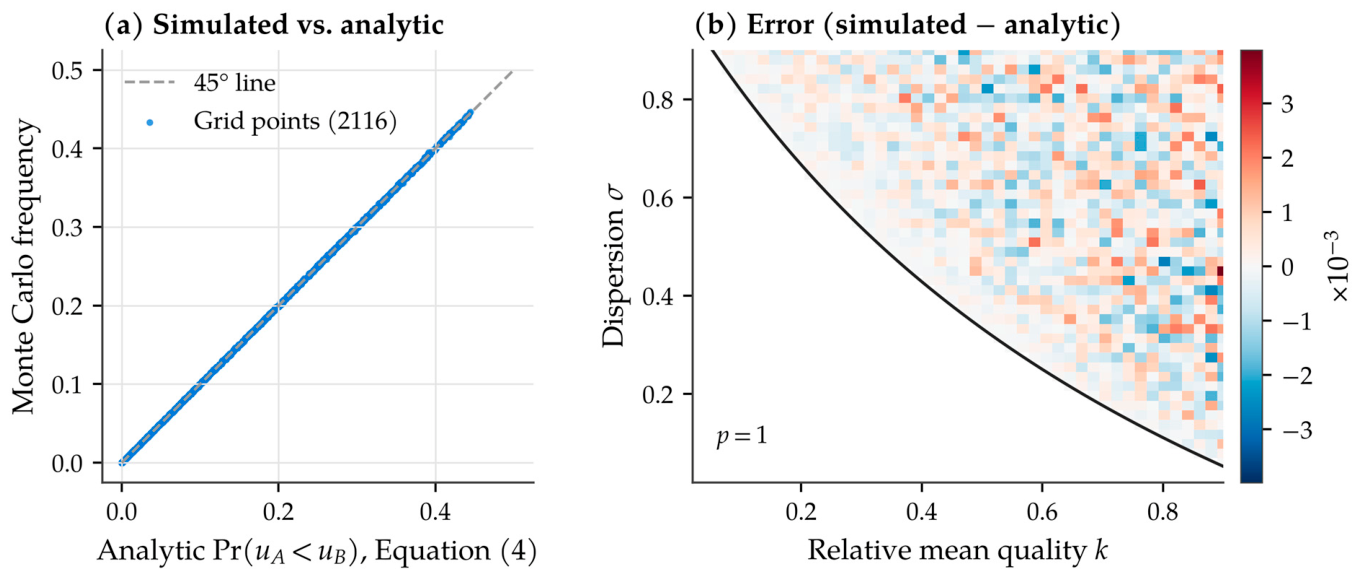
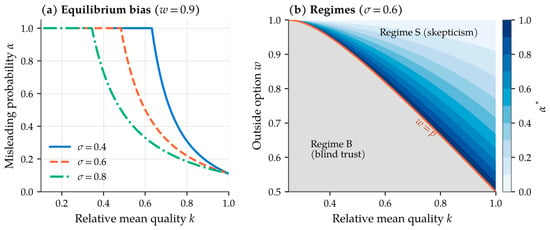
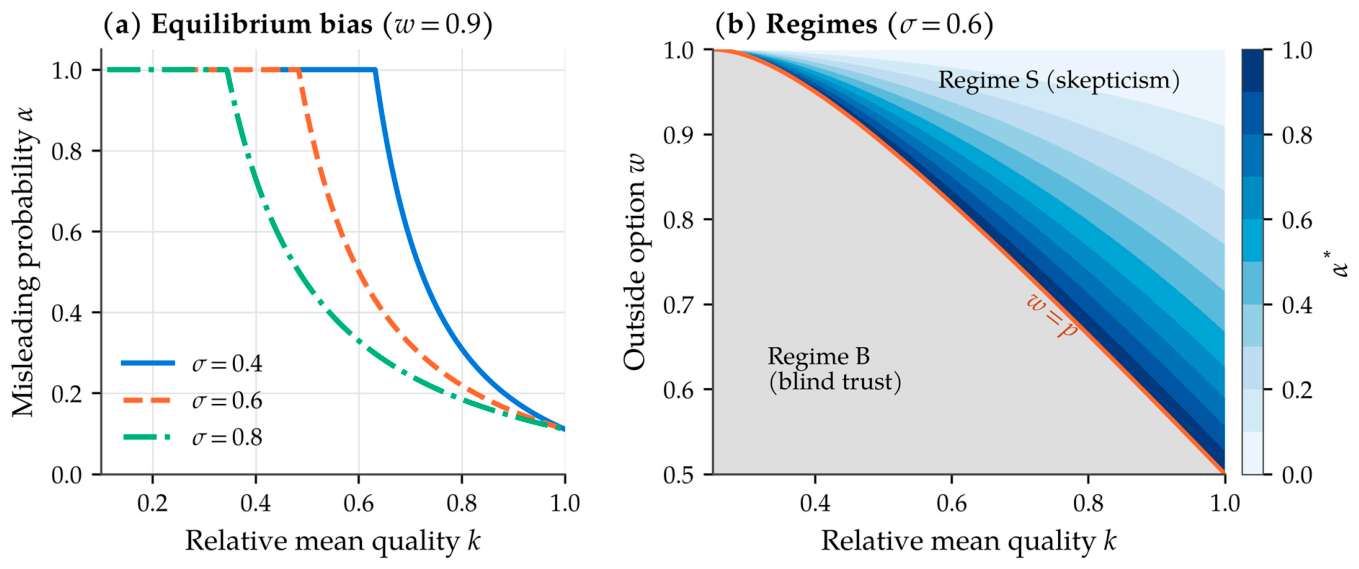
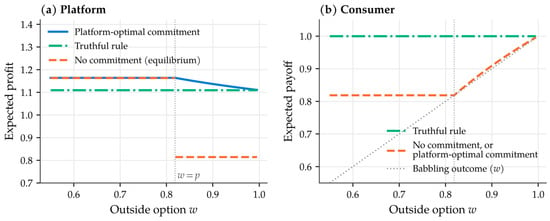
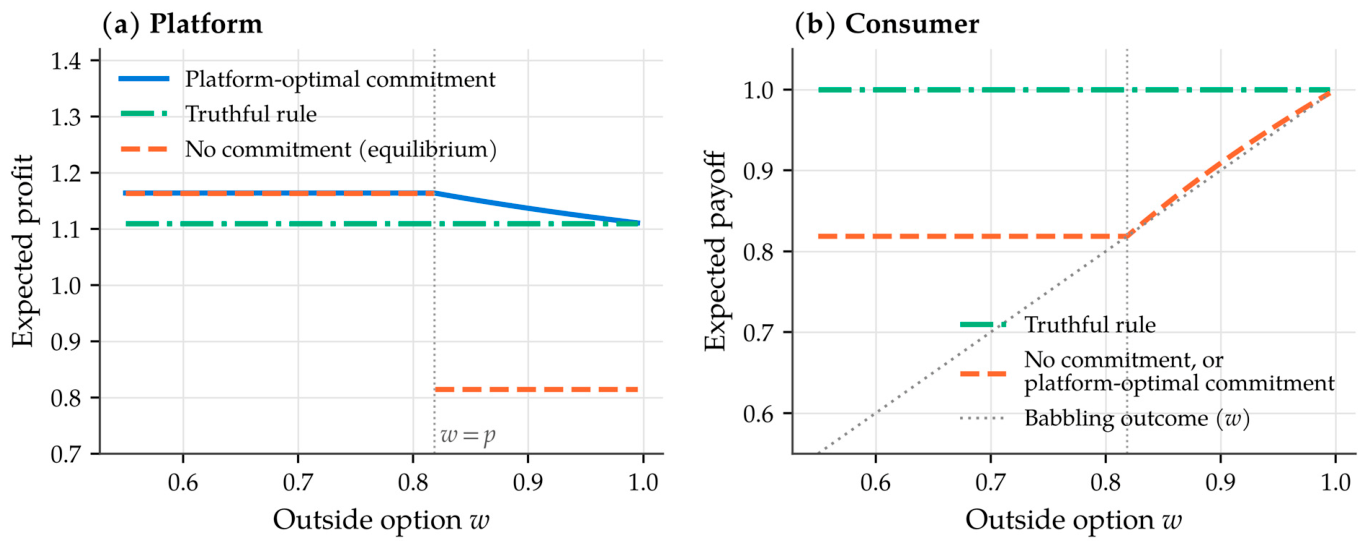


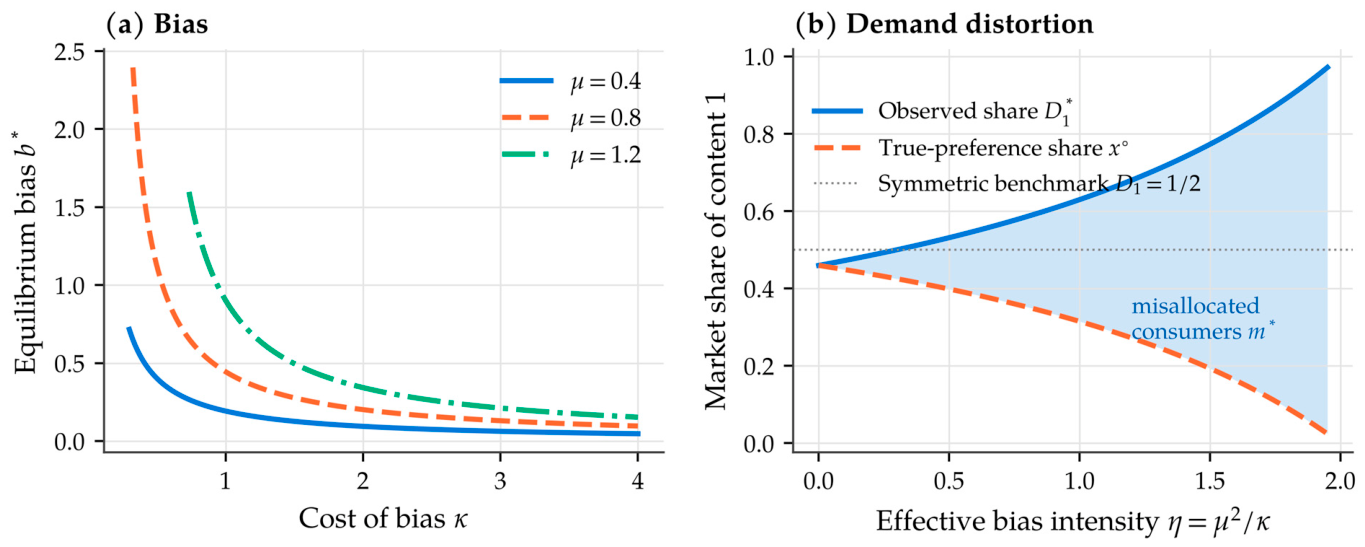
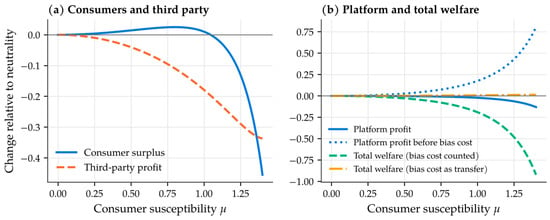
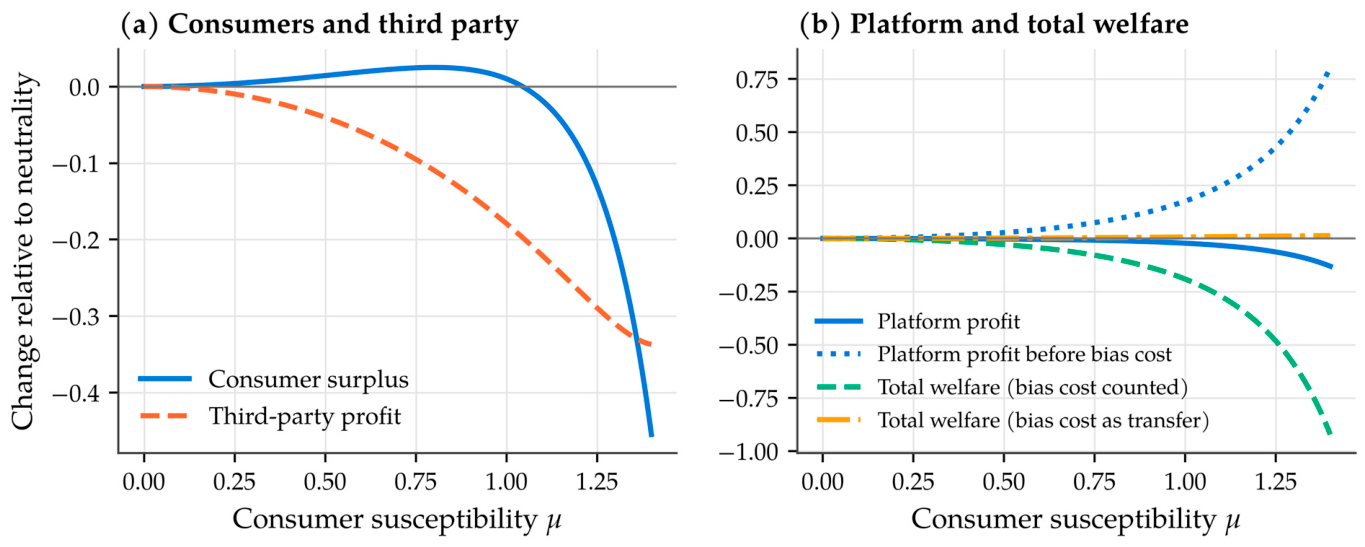

Disclaimer/Publisher’s Note: The statements, opinions and data contained in all publications are solely those of the individual author(s) and contributor(s) and not of MDPI and/or the editor(s). MDPI and/or the editor(s) disclaim responsibility for any injury to people or property resulting from any ideas, methods, instructions or products referred to in the content. |
© 2026 by the authors. Licensee MDPI, Basel, Switzerland. This article is an open access article distributed under the terms and conditions of the Creative Commons Attribution (CC BY) license.