


Abstract
The deep integration of digital technologies with the real economy at the technological level, known as digital-real technological integration (DRI), has become a critical priority for driving industrial transformation and corporate development. However, much attention has been given to how digital technologies foster innovation in supply chain finance (SCF) models, while relatively limited attention has been paid to the role of firm-level DRI in the operational foundations of SCF. Drawing on dynamic capabilities theory, this study examines the relationship between DRI and SCF performance, particularly its financing-scale dimension, and investigates the mediating roles of operational efficiency and innovation capability as well as the moderating effects of environmental uncertainty (EU) and supply chain risk (SCR). Using 9732 firm-year observations of Chinese A-share listed firms from 2010 to 2023, we employ firm- and year-fixed effects regressions, bootstrap mediation tests, interaction analyses, and two-stage least squares (2SLS) estimation. The results show that DRI is positively associated with short-term financing intensity. Both operational efficiency and innovation capability exhibit significant mediating effects. EU does not significantly moderate the relationship between operational efficiency and short-term financing intensity, but it strengthens the positive effect of innovation capability. SCR strengthens the positive effects of both operational efficiency and innovation capability on short-term financing intensity. Further heterogeneity analyses show that the DRI–SCF association is stronger in less-marketized regions, non-digital-economy industries, and firms with more concentrated supply chains, while the difference across firm size is not statistically significant. These findings highlight the distinct capability pathways through which DRI is associated with firms’ financing outcomes and show that the value of these capability manifestations varies across different environmental conditions.
1. Introduction
Supply chain finance (SCF) represents a critical set of financial solutions that leverage operational data and relationships within a supply chain to optimize working capital, thereby enhancing the operational resilience and growth potential of participating firms [1]. Despite its recognized importance, the performance of SCF continues to face significant hurdles rooted in persistent information asymmetries [2,3]. Financial institutions often struggle to assess risks beyond traditional collateral because their visibility into firms’ real operational processes, transaction quality, and intangible capabilities remains limited. This constrains SCF arrangements to asset-based or relationship-dependent models and weakens the efficiency of credit assessment [4]. Concurrently, firms face challenges in credibly communicating the reliability of their complex operations and future repayment capacity to external financiers, thereby limiting the value realization of SCF [5]. In response, digital technologies such as big data analytics and blockchain have been increasingly used to improve information transparency, transaction traceability, and risk assessment in SCF [6,7,8,9,10,11]. Existing studies have mainly examined how digital technologies are embedded into SCF platforms or financing models, implicitly positioning digital technologies as the dominant force in facilitating financing activities. However, effective SCF is not supported merely by the superficial application of digital technologies in financing platforms or models. Rather, it depends fundamentally on firms’ ability to generate trustworthy, continuous, and verifiable operational data from real business processes, including procurement, production, inventory, logistics, and sales. In this study, digital-real technological integration (DRI) refers to the integration of digital technological knowledge with non-digital industrial technologies. Existing studies, however, have paid insufficient attention to this firm-level integration logic and have yet to fully explain the relationship between DRI and SCF performance. This study addresses this gap by examining the relationship between firm-level DRI and SCF performance, thereby shifting the focus from technology-enabled SCF models to the financing implications of firms’ digital-real technological integration.
The operational nature of SCF suggests that financing advantages are not determined solely by the availability of digital financial tools, but by whether firms can make their real business activities observable, reliable, and assessable to external financiers. Although prior studies have documented the broad benefits of digitalization for operational agility, process optimization, and supply chain resilience [12,13,14], the relationship between firm-level DRI and SCF performance remains insufficiently understood. Considering that effective SCF depends heavily on firms’ demonstrable operational performance, process reliability, transaction authenticity, and ability to signal quality and trustworthiness to financial institutions and supply chain partners, it is reasonable to expect that DRI, by providing a technological foundation for operational and organizational transformation, can provide a more solid operational and informational foundation for improving SCF performance. Therefore, a key issue that warrants further investigation is how firms’ DRI is associated with their SCF performance.
Recent studies on DRI suggest that the deep integration of digital and real-economy technologies can reshape firms’ competitive and value-creation outcomes, mainly by strengthening resource integration, technological convergence, and capability development [15,16]. Building on the production-cost and technological-application effects identified in previous research [17,18], integrated technologies can provide a foundation for improving coordination across procurement, production, inventory, and sales, supporting more efficient resource allocation and working-capital utilization. At the same time, the combination of digital and industrial knowledge can support the development of new products, processes, and technological solutions, strengthening firms’ capacity for innovation and renewal. These changes suggest that the financing relevance of DRI may emerge through improvements in how firms manage current operations and develop future growth opportunities and creating opportunities for business-model innovation. Accordingly, this study draws on dynamic capabilities theory (DCT) to examine how DRI relates to SCF performance through operational efficiency and innovation capability. DCT posits that in rapidly changing environments, firms achieve and sustain competitive advantage not primarily through owning valuable resources, but through processes that enable them to sense opportunities and threats, seize those opportunities effectively, and reconfigure operational processes and asset bases accordingly [19,20,21]. DCT provides a valuable framework for understanding how DRI enables firms to transform the coupling of digital elements and real business activities into critical organizational capabilities. While the traditional DCT framework emphasizes the processes of sensing, seizing, and reconfiguring, these processes can give rise to distinct capability manifestations, which may be differentiated according to how firms respond to environmental dynamics. Specifically, capability manifestations may be classified as reactive when they reflect firms’ adjustment to existing operational changes, and as proactive when they reflect forward-looking exploration and strategic renewal. This distinction provides a concise basis for examining the heterogeneous capability mechanisms through which firm-level DRI may affect SCF performance [22].
Specifically, this study treats operational efficiency and innovation capability as two resultant capability manifestations arising from dynamic capability processes, examining their mediating roles in the relationship between DRI and SCF performance. First, effective SCF performance is closely related to the reliability, efficiency, and verifiability demonstrated in firms’ real transactions and daily operations. Operational efficiency, as a reactive capability manifestation, reflects firms’ ability to utilize operating resources effectively, coordinate current assets and current liabilities, and respond promptly to operational demands [23]. Higher operational efficiency enables firms to generate more operating revenue with a given level of working capital, accelerate capital circulation, and maintain smoother business flows, thereby aligning with the requirements of SCF in terms of transaction authenticity, operational stability, cash-flow reliability, and timely risk control [24]. Moreover, innovation capability is treated in this study as a proactive capability manifestation, reflecting firms’ capacity to explore novel solutions, pursue technological renewal, and support future-oriented development. This capability encompasses several facets, such as process innovation [25,26], product innovation [27], and knowledge innovation [28]. On the one hand, innovation capability constitutes a fundamental basis for sustaining competitive advantage and advancing corporate sustainability, making it a salient factor in financial service providers’ financing assessments [29,30,31]. On the other hand, it is essential for firms’ engagement with digitally enabled and value-oriented SCF arrangements, as it supports strategic transformation and organizational adaptation required for improving SCF performance [32]. Therefore, this study aims to explore whether firms’ DRI is associated with SCF performance through operational efficiency and innovation capability.
Furthermore, DCT emphasizes that the effectiveness of firms’ dynamic capabilities in securing competitive advantages is contingent upon the managerial and environmental contexts in which such capabilities are deployed [33]. For the capability mechanism through which DRI affects SCF performance, contextual conditions are particularly important. External environmental uncertainty, such as technological change, demand fluctuations, and market instability, may directly affect firms’ operational stability, information transparency, and controllability, thereby influencing the risk-control foundation on which SCF depends [34]. Meanwhile, supply chain risk reflects the extent of supply–demand mismatch and coordination instability within the supply chain. Higher supply chain risk may increase operational uncertainty and weaken financial service providers’ assessment of a firm’s core credit quality and long-term development potential. Both factors are important contextual conditions under the DCT framework, because dynamic capabilities are essentially concerned with how firms adapt, coordinate, and reconfigure resources in response to uncertainty and risk [35]. Therefore, this study introduces environmental uncertainty and supply chain risk as key boundary conditions to examine how the financing relevance of operational efficiency and innovation capability varies across different external conditions.
To sum up, this study attempts to answer the following three questions:
- (1)
- Is firms’ DRI significantly associated with SCF?
- (2)
- Do operational efficiency and innovation capability mediate the relationship between firms’ DRI and SCF?
- (3)
- How do EU and SCR moderate the relationships between operational efficiency and innovation capability, respectively, and SCF?
To address these questions, this study employs a panel dataset of A-share listed companies in China spanning the period 2010–2023. Based on regression analysis techniques, a series of empirical models have been developed to systematically examine the proposed direct, mediating, and moderating effects. The analysis aims to elucidate how firms’ DRI is associated with SCF through the mediating roles of distinct capability manifestations arising from dynamic capability processes under different external conditions.
This study provides the following three contributions to the literature.
- (1)
- SCF literature: This study extends SCF research by shifting attention from technology-enabled financial models to firms’ own digital-real integration practices [7,15], thereby highlighting the firm-level operational foundations of SCF outcomes beyond platform, risk-assessment, and financing-model innovation [36,37].
- (2)
- Dynamic capabilities theory: This study extends the application of DCT to SCF by explaining the financing relevance of operational efficiency and innovation capability in the DRI context [38,39]. Operational efficiency emphasizes the effective coordination and utilization of existing operating resources, while innovation capability emphasizes knowledge recombination and technological renewal. By explaining how these capability manifestations may inform financing evaluation, this study connects firms’ capability development with their external financing relationships.
- (3)
- Contingency perspective: This study extends the contingency perspective of DCT by showing that the financing relevance of DRI-related capability manifestations [40,41] varies with environmental uncertainty and supply chain risk [42].
2. Literature Review and Research Hypotheses
2.1. Dynamic Capabilities Theory (DCT)
As an extension of the traditional resource-based view (RBV), DCT explains how firms adapt and renew their resource bases and organizational processes in changing environments. It posits that firms adapt to environmental change through their ability to sense changes and opportunities, seize them through coordinated decisions and resource commitments, and reconfigure resources, routines, and organizational structures accordingly [30,43,44]. Rather than focusing on the static ownership of strategic resources, DCT emphasizes the organizational processes through which firms continuously renew and recombine their resource bases. These processes correspond to sensing, seizing, and reconfiguring, which enable firms to identify environmental changes, mobilize appropriate responses, and adjust their existing resource configurations. Through these processes, firms can renew their operational and strategic capabilities and maintain alignment with evolving technological, market, and institutional conditions. This process-based perspective provides the theoretical foundation for examining how DRI strengthens firms’ dynamic capability processes and, in turn, contributes to the development of specific organizational capabilities.
The contemporary literature frequently leverages the dynamic capabilities framework to elucidate the mechanisms through which digitalization redefines organizational competencies and competitive outcomes. Specifically, digital technologies can strengthen firms’ ability to sense changes and emerging opportunities through enhanced information access, seize identified opportunities through more informed and coordinated decision-making, and reconfigure resources and organizational processes with greater flexibility [45,46,47,48,49,50]. These studies suggest that the value of digital transformation does not lie merely in technology adoption, but in firms’ ability to use digital resources to strengthen sensing, seizing, and reconfiguring processes. However, digital-real integration goes beyond general digital transformation by emphasizing the deep coupling between digital elements and real business activities. By embedding digital elements into procurement, production, inventory, logistics, sales, and other substantive operations, DRI creates an organizational context in which firms can continuously collect and interpret operational signals, translate such information into coordinated actions, and adjust resource configurations and business processes accordingly. Accordingly, DRI provides a particularly relevant context for examining how digital resources become embedded in firms’ real operations and strengthen the dynamic capability processes through which organizational capabilities are developed.
In the SCF context, DCT provides a useful lens for explaining how dynamic capability processes embedded in firms’ substantive business operations contribute to the development of organizational capabilities relevant to financing evaluation. Firms’ performance in SCF arrangements depends not only on the availability of external financing mechanisms but also on their operational reliability, transaction continuity, and future value-creation potential [51,52,53]. From this perspective, operational efficiency and innovation capability represent two capability manifestations through which the organizational consequences of these dynamic capability processes can become relevant to SCF performance. The reactive–proactive distinction concerns the primary function of capability development in responding to change. Reactive manifestations emphasize the adjustment and coordination of existing operations, whereas proactive manifestations emphasize exploration and renewal beyond established routines [22]. Operational efficiency is associated primarily with the former because it reflects the effective use of current resources, the coordination of ongoing activities, and the maintenance of operating continuity. Innovation capability is associated primarily with the latter because it supports knowledge recombination, technological exploration, and the development of new solutions [46,54,55]. These orientations can overlap: proactive process redesign may improve operational efficiency, while innovation may respond to immediate operating pressures. Their theoretical distinction therefore lies in their principal contribution to current operational adjustment or technological renewal. In the SCF context, these contributions may become relevant through the reliability of current operations and the potential for future value creation, respectively.
These arguments suggest that the financing relevance of DRI may depend on how the integration of digital and industrial knowledge supports resource coordination and technological renewal. From a DCT perspective, sensing, seizing, and reconfiguring provide a theoretical explanation for how such integration may contribute to the development of operational efficiency and innovation capability. These capability manifestations may, in turn, support SCF by strengthening the operational reliability and renewal potential that inform financing evaluation. Moreover, because DCT emphasizes that the value of dynamic capabilities depends on the external conditions under which they are deployed, this framework also considers environmental uncertainty and supply chain risk as two important contextual factors that may shape the extent to which operational efficiency and innovation capability contribute to SCF performance.
2.2. Digital-Real Integration and SCF
The phenomenon of DRI manifests through the profound embeddedness of digital infrastructure within the physical operational processes of enterprises. Rather than functioning solely as an aggregation of technological tools, DRI fundamentally aligns with the underlying mechanisms of credit assessment in SCF. Achieving superior financing outcomes requires companies to go beyond passive reliance on external funding structures. Instead, success is contingent upon their capacity to bridge information gaps, validate their execution stability, and credibly signal robust solvency alongside sustainable growth prospects to both funding providers and network partners [1,56,57]. Consequently, DRI acts as a critical conduit, converting tangible corporate operations into verifiable data flows and fortified trustworthiness, thereby significantly improving SCF performance.
On the one hand, DRI enhances the credibility of firms’ operational and transactional information. By integrating digital elements with real business processes, firms can make their transaction records, fulfillment activities, inventory status, and operating conditions more authentic, complete, traceable, and verifiable [58,59,60,61]. This helps reduce information asymmetry between firms and external financiers by improving the quality of information available for credit assessment. More importantly, DRI also strengthens cross-organizational coordination among focal firms, core enterprises, supply chain service providers, and financial institutions, which facilitates the reliable transmission and mutual verification of information across the supply chain. As a result, financial institutions can reduce information search, verification, and monitoring costs, assess transaction authenticity and repayment risks more accurately, and build greater trust in firms’ financing applications [62]. Thus, DRI improves SCF performance by making firms’ real operations more credible and assessable.
On the other hand, DRI strengthens firms’ creditworthiness by improving the substantive capabilities underlying their real operations. Unlike a simple digital mapping of business information, DRI can promote the transformation of firms’ real activities by supporting resource integration, process coordination, and data-driven decision-making [15,63]. Such integration enables firms to improve operational stability, enhance coordination with supply chain partners, and reduce credit risks arising from delivery delays, inventory mismatches, or cash-flow disruptions. At the same time, the deeper combination of digital resources and real business activities can support innovation and strategic upgrading, helping firms demonstrate stronger growth potential and sustainable value creation [16,27,64]. These improvements provide financial institutions and supply chain partners with stronger grounds for evaluating firms’ core credit quality and long-term development prospects. Therefore, DRI not only makes firm information more trustworthy, but also enhances the operational and strategic basis of credit support in SCF.
Taken together, DRI can improve SCF performance through both credibility enhancement and creditworthiness strengthening. By making firms’ real operations more transparent, verifiable, stable, and value-creating, DRI helps firms obtain better financing support and realize greater value from SCF. Therefore, we propose the following hypothesis:
H1.
Firms’ DRI is positively associated with SCF performance.
2.3. Mechanisms: Operational Efficiency and Innovation
From a DCT perspective, DRI can enhance firms’ operational efficiency by strengthening the sensing, seizing, and reconfiguring processes embedded in their substantive business operations. Unlike conventional digitalization, which often improves efficiency through the tool-based application of specific technologies in isolated tasks or functional units, DRI emphasizes the reciprocal coupling between digital elements and substantive operational processes. This coupling strengthens firms’ sensing processes by enabling them to continuously capture and interpret real-time feedback from production, procurement, inventory, sales, and other operational activities, thereby identifying demand changes, process deviations, and resource mismatches more promptly [15,63]. On this basis, DRI strengthens firms’ seizing processes by enabling them to translate operational signals into coordinated decisions across production planning, procurement, inventory management, sales execution, and working-capital allocation [65]. This data-enabled coordination helps reduce information delays and improve the alignment of operational decisions across functional boundaries. DRI further supports reconfiguring by enabling firms to adjust workflows, resource allocation, and coordination arrangements with suppliers, customers, logistics providers, and other supply chain participants in response to continuous operational feedback [13]. Through these sensing, seizing, and reconfiguring processes, firms can reduce operational frictions, improve resource utilization, accelerate inventory and working-capital circulation, and maintain smoother business flows, ultimately contributing to higher operational efficiency [12,66].
From a DCT perspective, DRI can strengthen firms’ innovation capability by enhancing the sensing, seizing, and reconfiguring processes involved in knowledge exploration and technological renewal. Compared with digitalization that supports innovation primarily through specific technological tools or isolated R&D applications, DRI embeds digital elements more deeply into the interactions among internal operations, technological development, and external supply chain relationships. First, DRI strengthens firms’ sensing processes by integrating information from production, sales, customer demand, service activities, and external supply chain partners, allowing firms to identify emerging technological opportunities, changing market needs, and potential areas for improvement more promptly [30,67]. Second, DRI strengthens seizing by enabling firms to translate identified technological and market opportunities into R&D priorities, product and process development, and iterative innovation activities that are more closely aligned with operational and market needs. Third, DRI facilitates reconfiguring by enhancing information sharing and resource complementarity among supply chain partners, thereby supporting the recombination of knowledge, technological resources, and interorganizational relationships for cross-organizational learning and collaborative innovation [26,68]. Through these sensing, seizing, and reconfiguring processes, firms can more effectively recombine dispersed knowledge, mobilize innovation resources, and pursue new products, processes, and technological solutions, thereby strengthening their innovation capability [15,16,69]. Therefore, we propose the following hypothesis:
H2a.
DRI is positively associated with operational efficiency.
H2b.
DRI is positively associated with innovation capability.
Operational efficiency further improves SCF performance because it provides an important operational foundation for credit assessment and financing value realization. In the SCF context, financial institutions and supply chain partners evaluate not only the availability of transaction information, but also whether firms can maintain stable, efficient, and reliable business operations [1]. Higher operational efficiency indicates that firms can coordinate internal processes more effectively, utilize working capital more efficiently, reduce inventory backlogs and operational delays, and maintain continuity in real transactions [56]. These characteristics help external financiers assess firms’ operating quality, repayment capacity, and short-term risk exposure more accurately. In addition, efficient operations reduce financing frictions caused by production interruptions, inventory mismatches, or cash-flow disruptions, thereby improving the stability and effectiveness of SCF arrangements [23,53]. Thus, operational efficiency represents a reactive capability manifestation through which the capability-building benefits associated with DRI are reflected in firms’ operational credibility and SCF performance.
Innovation capability can subsequently contribute to SCF performance by providing forward-looking information about firms’ adaptability, technological potential, and future value creation. While operational efficiency mainly reflects firms’ ability to maintain reliable current operations, innovation capability reflects their capacity for strategic renewal, technological upgrading, and future value creation [70]. Firms with stronger innovation capability are more likely to develop new products, improve processes, adapt to changing market conditions, and sustain competitive advantages [27]. For financial institutions and supply chain partners, such capability can provide forward-looking signals regarding firms’ growth potential and ability to adapt to technological and market change. Moreover, when innovation capability develops within a DRI context, it is closely connected with the integration of digital resources and firms’ substantive business activities. The integration of digital elements with technological development, product iteration, operational feedback, and supply chain collaboration can increase the visibility of innovation-related activities and provide additional information for external evaluation. Such information can complement conventional transaction and financial information when financial institutions and core firms evaluate firms’ future development potential in SCF arrangements. Therefore, stronger innovation capability can improve firms’ financing evaluation by providing additional evidence of adaptability and future growth potential, which may increase their ability to obtain SCF resources. Accordingly, innovation capability represents a proactive capability manifestation through which the capability-building benefits associated with DRI are reflected in firms’ future-oriented growth potential and SCF performance [31,32]. Thus, we propose:
H3a.
Operational efficiency mediates the relationship between DRI and SCF performance.
H3b.
Innovation capability mediates the relationship between DRI and SCF performance.
2.4. Boundary Conditions (EU and SCR)
Environmental uncertainty refers to the volatility and unpredictability in firms’ operating environment, which may arise from fluctuating demand, rapid technological change, and unstable market conditions [71]. Under high environmental uncertainty, firms face greater operational risks and more volatile expectations regarding future transactions and cash flows [72]. This also increases the difficulty faced by financial institutions and core firms in assessing firms’ credit quality, repayment capacity, and transaction reliability in SCF activities. In such a context, operational efficiency becomes more valuable because it reflects a firm’s ability to utilize operating resources effectively, maintain stable business activities, and generate revenue with a given level of working capital [73]. Higher operational efficiency indicates faster capital circulation, stronger resource utilization, and greater cash-flow stability. These characteristics provide SCF providers with a more reliable basis for evaluating firms’ operational stability, repayment capacity, and financing quality under uncertain conditions [74]. Therefore, the positive association between operational efficiency and SCF performance may be stronger under greater environmental uncertainty.
At the same time, environmental uncertainty also increases the strategic value of innovation capability [75]. In volatile and rapidly changing environments, firms with stronger innovation capability are better able to identify emerging opportunities, adapt to external changes, and sustain future growth [76]. For SCF providers, innovation capability can serve as an important signal of a firm’s adaptability, long-term viability, and future value creation potential. Such signals become particularly important when uncertainty weakens the predictability of firms’ credit quality and repayment capacity. Thus, we hypothesize:
H4a:
EU plays a positive moderating role between operational efficiency and SCF performance.
H4b:
EU plays a positive moderating role between innovation capability and SCF performance.
SCR reflects coordination frictions and supply–demand mismatches within supply chain networks [77,78]. Elevated SCR may intensify production–demand mismatches and reduce the predictability of routine transactions [79]. In the SCF context, such volatility can make it more difficult for external financiers to assess firms’ cash-flow continuity and repayment risks. Under these conditions, firms may need to demonstrate reliable operational performance to support financing assessments. Here, operational efficiency becomes a particularly relevant reactive capability manifestation. It reflects firms’ ability to allocate resources efficiently, accelerate working-capital turnover, and maintain operational continuity during disruptions. Firms with higher operational efficiency may be better positioned to respond to demand fluctuations and maintain working-capital stability. These operational characteristics may provide useful information for financing assessments, potentially strengthening the positive association between operational efficiency and SCF performance under higher SCR.
Similarly, higher SCR may increase the relevance of innovation capability to financing assessments. When supply chain coordination deteriorates and market demand becomes less predictable, firms may place greater emphasis on innovation and long-term adaptability [80]. Stronger innovation capability can support adjustments to products, processes, and business models in response to external disruptions [81]. For financial institutions and core supply chain partners, innovation capability may provide a forward-looking signal of firms’ adaptability and growth potential. When higher SCR makes future operating and repayment conditions less predictable, innovation-related signals may become more relevant to financing assessments, potentially strengthening the positive association between innovation capability and SCF performance. Accordingly, we propose:
H5a:
SCR plays a positive moderating role between operational efficiency and SCF performance.
H5b:
SCR plays a positive moderating role between innovation capability and SCF performance.
The theoretical framework of this study is shown in Figure 1.
Figure 1.
Conceptual model of the study. Notes: “+” denotes the hypothesized positive relationship or moderating effect. Operational efficiency and innovation capability represent reactive and proactive capability manifestations, respectively. The empirical analysis is based on 9732 firm-year observations of Chinese A-share listed firms from 2010 to 2023 and employs firm and year-fixed effects with the firm-level controls described in Section 3.2.5.
3. Research Design
3.1. Sample Selection and Data Sources
This study uses an unbalanced panel of Chinese A-share listed companies over 2010–2023. Financial firms and ST/PT firms are excluded, while firms from all other industries represented in the A-share market are retained in the sample. The sample begins in 2010, when important institutional developments relevant to both digital-real integration and supply chain finance emerged in China. In October 2010, the Proposal for Formulating the Twelfth Five-Year Plan explicitly called for promoting the deep integration of informatization and industrialization, providing an important policy foundation for the subsequent integration of digital technologies with real economic activities. In the same year, the People’s Bank of China, together with the CBRC, CSRC, and CIRC, issued the Opinions on Further Improving Financial Services for Small- and Medium-Sized Enterprises, which explicitly encouraged the development of factoring, forfaiting, bill discounting, supply chain financing, and other financial products. These parallel policy developments provide a meaningful institutional starting point for examining the relationship between firm-level DRI and SCF.
Financial and firm-level information is obtained primarily from the CSMAR database, while patent and patent-citation information used to construct digital–real integration (DRI) is obtained from the China National Intellectual Property Administration (CNIPA). We merge the datasets at the firm-year level and apply complete-case screening without imputing missing values. Because the mediation and moderation analyses require additional variables with more restrictive data requirements, all main specifications are estimated using a common sample to maintain comparability across models. This procedure yields 9952 firm-year observations with complete information. The fixed-effects estimator subsequently removes 220 singleton observations, resulting in 9732 observations in the reported regressions. Continuous variables denoted by the suffix are winsorized at the 1st and 99th percentiles. The detailed sample-selection procedure is reported in Table S1.
3.2. Variables and Measurements
3.2.1. Dependent Variable: SCF
Following Liu and Shang [82], SCF is proxied by the ratio of the combined value of short-term borrowings and notes payable to total assets. This measure primarily captures the financing-scale dimension of SCF performance, reflecting the extent to which firms use short-term financing resources in their operational and supply-chain activities. Short-term borrowings represent firms’ access to external working-capital financing, whereas notes payable capture trade-related settlement and financing arrangements arising from commercial transactions. Accordingly, a higher value indicates a greater scale of short-term financing resources available to the firm and, in this specific sense, stronger SCF performance in terms of financing capacity. However, this measure should not be interpreted as a comprehensive indicator of financing performance, as it does not directly capture financing costs, efficiency, or risk. To further address potential construct-validity concerns, we also employ a text-based alternative measure of SCF based on the frequency of supply chain finance-related terms in firms’ annual reports in the robustness analysis.
3.2.2. Independent Variable: DRI
Firm-level DRI is measured based on technological convergence by drawing upon the framework proposed by Kwon et al. [83] and Wei, Li and Li [15]. Patent citation information is used to trace the flow and absorption of digital technological knowledge into real-economy technological innovation. Specifically, digital technologies are identified according to the Reference Table between the Classification of Core Industries of the Digital Economy and the International Patent Classification (2023) issued by the CNIPA. The classification covers four major categories: digital product manufacturing, digital product services, digital technology applications, and digital-factor-driven industries. A digital–real technological convergence event is identified when the primary IPC classification of a firm’s invention patent belongs to a non-digital industrial technology and at least one patent cited by that patent is classified as digital technology. Patents are assigned by application year. For multi-applicant records, applicant names are split and matched to listed companies using company names and stock codes; only patents attributable to the listed company itself are retained, and duplicate publication numbers are counted only once per firm-year. We aggregate the number of such qualifying patents at the firm-year level and calculate DRI as the natural logarithm of one plus this count. For example, China Shenhua’s patent “Coal Mill Outlet Temperature Control System and Control Method” (CN106269197B) has a primary IPC classification of B02C25/00, which falls outside the digital-technology categories used in this study. The patent cites “A Multivariable Inference Predictive Control Method for a Medium-Speed Coal Mill” (CN105388765A), whose IPC classification includes G05B13/04, a digital-technology category under our IPC classification scheme. This focal patent is therefore identified as a digital–real technological convergence event, as it represents a non-digital industrial invention that draws on digital control technology through patent citation. Accordingly, this patent-based measure captures the technological dimension of DRI rather than directly observing the deployment of digital technologies in individual operational processes. Detailed IPC classification and matching rules are provided in Supplementary Tables S2 and S3.
3.2.3. Mediation Variables
Operational efficiency captures an enterprise’s proficiency in mobilizing short-term resources to drive sales generation. In alignment with [84,85], this construct is operationalized via the working capital turnover ratio. Specifically, it is computed as the annual operating revenue scaled by the net working capital (defined as fiscal year-end current assets minus current liabilities). A pronounced turnover magnitude signifies superior resource orchestration, demonstrating the firm’s capacity to sustain robust revenue streams without excessively tying up operational capital.
Innovation capability is measured following Hottenrott and Lopes-Bento [86] using the average annual citation frequency of firms’ invention patent applications. Specifically, we calculate the number of citations received by each invention patent application in each citation year and then take the firm-year average, with uncited patents included as zero observations. For each firm-year, the denominator covers all invention patents filed by the firm on or before the corresponding citation year, rather than only patents filed in that year. Firm-years without eligible invention patents are distinguished from those with existing patents that receive no citations. Citations are counted in the calendar year in which they occur, and both self-citations and citations from other firms are included. The measure is not adjusted for differences in patent age or technological field. The citation-year records in the dataset span 2001–2023, with 2023 as the last observed citation year. A higher value indicates stronger patent-based innovation impact, reflecting the annual citation performance of the firm’s existing invention patent portfolio.
3.2.4. Moderating Variables
Environmental uncertainty (EU) reflects the instability of a firm’s external operating environment and is commonly captured by fluctuations in sales revenue. Following Ghosh and Olsen [87], EU is constructed through a multi-step procedure.
We first estimate the abnormal component of firms’ sales revenue using a five-year rolling regression in which sales revenue is regressed on a linear time trend:
The residual term obtained from Equation (1) represents sales fluctuations that cannot be explained by the underlying time trend.
Next, the standard deviation of the residuals over the five-year window is calculated and scaled by the firm’s average sales revenue during the same period to obtain a normalized measure of sales volatility.
Finally, the median of this normalized sales volatility measure across firms in the same industry and year is calculated as the industry-level measure of environmental uncertainty. This industry-year value is assigned to each firm in the corresponding industry and year and used as the final EU measure. A higher value indicates greater environmental uncertainty in the industry in which the firm operates.
We measure corporate supply chain risk (SCR) using the mismatch between production volatility and demand volatility. Supply chain risk reflects the extent to which a firm’s upstream production activities fail to align with downstream market demand. When production fluctuates more strongly than demand, firms are more likely to face supply–demand imbalances, inventory pressure, coordination frictions, and operational uncertainty. Following recent firm-level studies on supply chain risk [88,89], we construct SCR as the ratio of production volatility to demand volatility:
Specifically, Production is measured as the sum of quarterly cost of goods sold and changes in inventory, where inventory changes are calculated as the difference between consecutive quarter-end inventory balances. Demand is measured as the sum of revenue from principal business operations and other business operations. For accounting items reported on a cumulative basis, quarterly flows are obtained by subtracting the previous reporting period’s cumulative value from the current period’s cumulative value within the same fiscal year, while first-quarter values are taken directly from the reported amounts. Both quarterly series are logarithmically transformed and first-differenced before calculating their standard deviations. For each firm-year, production and demand volatility are calculated as the standard deviations of the four quarterly log growth rates ending in the fourth quarter. Accordingly, five consecutive quarterly observations are required, including the fourth quarter of the preceding year to calculate the first-quarter growth rate. Only positive, non-missing values are used, and a complete five-quarter window is required for both production and demand. Firm-year observations with demand volatility at or below are treated as missing to avoid instability caused by a near-zero denominator. The resulting SCR measure is winsorized at the 1st and 99th percentiles. A higher SCR value indicates greater production volatility relative to demand volatility, suggesting a higher level of supply chain risk.
3.2.5. Control Variables
We include a set of firm-level controls that may affect firms’ financing conditions and operational outcomes. Firm size (Size) is controlled for because larger firms generally possess greater resource endowments and stronger financing capacity. Leverage (Lev) captures firms’ capital structure and financial risk, which may influence their access to external financing. Return on assets (ROA) controls for profitability and firms’ ability to generate economic returns from existing assets. Revenue growth (Growth) reflects firms’ growth opportunities and business expansion, which may affect financing demand and operational decisions. Chairperson–CEO duality (Dual) is included to capture differences in corporate governance and managerial power concentration. Firm age (FirmAge) controls for organizational maturity, accumulated experience, and established business relationships. The fixed-asset ratio (Fixed) reflects firms’ asset structure and capital intensity, which may influence both financing capacity and production characteristics. Operating cash flow (CashFlow) captures internal liquidity and firms’ ability to finance operations from internally generated funds. Employee count (Employee1) controls for labor scale and organizational complexity beyond that captured by total firm size. Finally, the ownership share of the three largest shareholders (Top3) is included to account for ownership concentration and its potential influence on monitoring, governance, and corporate decision-making.
3.3. Estimation Method
To examine the proposed hypotheses, this study employs a fixed-effects regression model with firm and year fixed effects to investigate the impact of digital–real integration on supply chain finance performance. All models are estimated using heteroskedasticity-robust standard errors. The baseline specification is expressed as follows:
where is the cross-sectional dimension of the panel data; t is the time series; is the constant term; and , are the regression coefficients. Next, represents firm fixed effects, represents the time fixed effect, and is the error term. The dependent variable represents supply chain finance. The independent variable represents DRI. Finally, Controls indicate all control variables in Table 1.
Table 1.
Descriptive statistics.
To investigate the mediating roles of operational efficiency and innovation capability, we follow the causal-steps approach proposed by Baron and Kenny [90]. Equations (4) and (5) extend the baseline model by introducing the mediating variable (Med). In addition to the regression-based mediation analysis, we use 1000 bootstrap resamples to estimate the indirect effect and its 95% confidence interval. An indirect effect is considered statistically significant when the bootstrap confidence interval does not include zero:
To examine the moderating effects of environmental uncertainty and supply chain risk, four interaction terms are constructed, namely OE × EU, Patentcite × EU, OE × SCR, and Patentcite × SCR. Mod represents the corresponding moderating variable. In addition, DRI is included as a control variable in all moderation models. The moderation model is specified in Equation (6):
4. Results
4.1. Descriptive Statistics
Table 1 presents the descriptive statistics for the main variables, while Table 2 reports the Pearson correlation matrix. An inspection of the correlation coefficients shows that the pairwise correlations among the explanatory variables remain below the conventional 0.7 threshold, suggesting that severe pairwise collinearity is unlikely to be a concern. To further assess multicollinearity, variance inflation factors (VIFs) are reported in Table S4. The VIF values range from 1.020 to 2.540, with a mean of 1.410, providing further evidence that multicollinearity is not a serious issue in the subsequent regression analysis.
Table 2.
Pairwise correlations.
4.2. Results of Basic Regression Model
Table 3 delineates the baseline estimation outcomes. Upon introducing the complete vector of firm-level controls alongside firm and year fixed effects in Model M2, the focal explanatory variable (DRI) exhibits a positive and statistically significant coefficient (, ). This result supports H1 and indicates a positive association between firm-level DRI and short-term financing intensity as measured by the accounting-based dependent variable. To further assess the economic significance of the estimated effect, we consider a one-standard-deviation increase in DRI. Given that the standard deviation of DRI is 0.571, a one-standard-deviation increase in DRI is associated with an increase of approximately 0.0017 in short-term financing intensity. Relative to the sample mean of short-term financing intensity (0.116), this corresponds to an increase of approximately 1.49%. Although modest in magnitude, this estimate suggests that DRI is associated with incremental improvements in the short-term financing intensity. Considering that firms’ financing outcomes are shaped by a combination of operational, financial, and external factors, the estimated association highlights the potential role of DRI as one contributing factor in improving firms’ financing performance.
Table 3.
Results of basic regression model.
4.3. Results of Mediating Effects and Moderating Effects
4.3.1. Mediating Effects of Operational Efficiency and Innovation Capability
Table 4 presents the estimated relationships involving operational efficiency and innovation capability. Models M4 and M5 examine the contemporaneous associations consistent with the proposed operational efficiency pathway, representing the reactive capability manifestation. In M4, DRI is positively associated with operational efficiency. When DRI and operational efficiency are included simultaneously in M5, both coefficients remain positive and statistically significant. The bootstrap indirect effect through operational efficiency is 0.0003, with a 95% confidence interval of [0.00005, 0.0006], providing evidence consistent with H2a and H3a. Models M6 and M7 examine the contemporaneous associations consistent with the proposed innovation capability pathway, representing the proactive capability manifestation. DRI is positively associated with innovation capability in M6, while M7 shows that innovation capability is positively associated with short-term financing intensity for DRI. The corresponding bootstrap indirect effect is 0.0002, with a 95% confidence interval of [0.00005, 0.0003], providing evidence consistent with H2b and H3b. Together, these findings provide evidence of contemporaneous associations consistent with proposed mediation pathways under the maintained model assumptions. Model M8 includes both mediators simultaneously. Operational efficiency (β = 0.001, p < 0.01) and innovation capability (β = 0.004, p < 0.05) remain positively associated with short-term financing intensity, while DRI also remains positive and significant (β = 0.003, p < 0.05). Each mediator thus retains a significant contemporaneous association with the financing outcome conditional on the other.
Table 4.
Results of mediating mechanisms test.
4.3.2. Moderating Effects of EU and SCR
Table 5 reports the moderating relationships involving environmental uncertainty and supply chain risk. In M10, the interaction between operational efficiency and EU is negative but statistically insignificant (), providing no significant evidence that environmental uncertainty weakens the positive effect of operational efficiency on short-term financing intensity; thus, H4a is not supported. As shown in Table S5, the simple slopes remain positive and significant at low, mean, and high levels of EU, although their magnitude declines slightly as EU increases. The marginal-effect and interaction plots in Figure 2 and Figure 3 show the same descriptive attenuation. By contrast, Model M12 reports a positive interaction between innovation capability and EU (), providing tentative support for H4b. The simple slope results show that the conditional effect increases from 0.002 at low EU () to 0.003 at the mean level () and 0.005 at high EU (). These estimates suggest that the positive association between innovation capability and short-term financing intensity becomes stronger at higher levels of environmental uncertainty. Consistently, Figure 2 and Figure 3 indicate that the positive effect of innovation capability on short-term financing intensity strengthens as EU increases.
Table 5.
Results of the moderating mechanisms test.
Figure 2.
Marginal effects of operational efficiency and innovation capability.
Figure 3.
Interaction effects of operational efficiency and innovation capability.
Regarding SCR, Model M14 shows a positive and statistically significant interaction between operational efficiency and SCR (), providing tentative support for H5a. The simple slope increases from 0.0005 at low SCR to 0.0007 at high SCR, with the conditional effect remaining significantly positive across all three levels. In M16, the interaction between innovation capability and SCR is positive and statistically significant at the 1% level (). This finding supports H5b, suggesting that the positive association between innovation capability and short-term financing intensity is stronger at higher levels of SCR. The conditional effect increases from 0.001 at low SCR (), where the effect is positive but statistically insignificant, to 0.004 at the mean level ( and 0.007 at high SCR (, indicating that the positive association between innovation capability and short-term financing intensity becomes statistically significant as SCR increases. Figure 2 and Figure 3 further illustrate these strengthening patterns as SCR increases.
4.4. Endogeneity Tests
Instrumental Variable Estimation
To alleviate potential endogeneity arising from reverse causality, we employ a two-stage least squares (2SLS) instrumental-variable approach. Both stages include firm and year fixed effects and the same set of control variables as the baseline specification. First, following Wei, Li and Li [15], we construct IV using the average DRI of other firms in the same industry and year. Specifically, we adopt a leave-one-out measure that excludes the focal firm from the industry-year average, thereby avoiding the mechanical inclusion of its own DRI. The instrument varies across both industries and years, while firms operating in the same industry and year are likely to be exposed to similar technological trends and digital development conditions, supporting its relevance to firm-level DRI.
Second, following Zhang et al. [91] and Li et al. [92], we construct IV1 based on historical communication infrastructure. Specifically, IV1 is defined as the interaction between the number of fixed telephone lines per 100 persons in the firm’s province in 1984 and the lagged number of national Internet users. Historical telecommunications infrastructure captures predetermined regional conditions for the diffusion of digital technologies, while its interaction with nationwide Internet development introduces time-varying variation in firms’ exposure to digitalization. Given the historical nature of the provincial telephone infrastructure, its direct association with firms’ current short-term financing intensity is expected to be limited. The two instruments are jointly included in the 2SLS estimation, thereby reducing reliance on the peer-based instrument alone.
As reported in Table 6, both instruments are significantly associated with DRI in the first stage. Notably, IV1 exhibits a negative first-stage coefficient (β = −0.3331). This result should be interpreted as a conditional association rather than evidence that historical telecommunications infrastructure directly inhibits digitalization. Since IV1 interacts historical fixed-line telephone penetration with nationwide Internet development, its coefficient captures differences in the evolution of DRI associated with historical infrastructure conditions, after accounting for the other instrument, control variables, and fixed effects. One possible explanation is that regions with relatively limited legacy telecommunications infrastructure may have experienced stronger catch-up in adopting newer digital technologies, whereas historical fixed-line penetration does not necessarily translate into greater contemporary digital–real technological integration. Thus, the negative coefficient may reflect heterogeneous regional digital development trajectories rather than a contradiction of the instrument’s relevance. The Cragg–Donald Wald F statistic is 62.578, while the heteroskedasticity-robust Kleibergen–Paap rk Wald F statistic is 45.701. In addition, the Kleibergen–Paap rk LM statistic is statistically significant, rejecting the null hypothesis of underidentification and providing further evidence of instrument relevance. The Hansen J test yields a p-value of 0.124, indicating that the overidentifying restrictions cannot be rejected rather than confirming the validity of the instruments. In the second stage, DRI remains positively associated with short-term financing intensity (). Accordingly, the 2SLS results provide supplementary evidence broadly consistent with the baseline findings, conditional on the maintained instrumental-variable assumptions, rather than conclusive evidence of a causal relationship.
Table 6.
Endogeneity tests: instrumental variable.
4.5. Results of Robustness Checks
4.5.1. Replacing Dependent Variable
To assess the robustness of our primary findings, we replace the baseline accounting-based SCF measure with a text-based alternative. Following Chen and Huang [93] and Lu et al. [94], we use the frequency of supply chain finance-related keywords in firms’ annual reports to capture SCF-related information disclosure. Specifically, the frequencies of SCF-related terms are aggregated at the firm-year level, and the natural logarithm of one plus the total frequency is used as the alternative measure. As reported in M17 (Table S6), the coefficient of DRI remains positive and statistically significant, indicating that the baseline result is robust to an alternative text-based measure of SCF. These findings suggest that DRI is positively associated with both short-term financing intensity and SCF-related information disclosure, while the two measures capture distinct dimensions. The SCF keyword dictionary is provided in Table S7.
4.5.2. Replacing Independent Variable
As an additional robustness check, we reconstruct DRI using an alternative patent-based measure. Unlike the baseline measure, which identifies digital–real technological convergence through patent citation relationships, the alternative measure captures technological co-classification within the same invention patent. Specifically, a patent is identified as a digital–real convergence patent when its primary IPC classification belongs to a non-digital technology and at least one of its other IPC classifications belongs to a digital technology. The number of qualifying patents is aggregated at the firm-year level and transformed as the natural logarithm of one plus the count. As reported in M18 (Table S6), the coefficient remains positive and statistically significant, further supporting the robustness of the baseline results.
4.5.3. Excluding Special Regional and Industry Samples
Additional robustness analyses are conducted by excluding observations that may be systematically influenced by regional or industry-specific characteristics. Model M19 removes firms located in the four municipalities of Beijing, Tianjin, Shanghai, and Chongqing, as these regions generally possess stronger economic development, more advanced digital infrastructure, and superior resource endowments that may naturally facilitate digital-real integration [16]. M20 further excludes firms operating in communication, software and information technology services, and internet-related industries, which are inherently more digital-intensive than other industries. The estimation results are reported in Table S8. In M19 and M20, the coefficient of DRI remains positive and statistically significant at the 5% and 10% levels, respectively, providing further support for the robustness of the baseline findings across different regional and industry settings.
4.5.4. Using Firm-Clustered Standard Errors
As an additional robustness check, we re-estimate the baseline model using standard errors clustered at the firm level. This specification allows for arbitrary heteroskedasticity and within-firm correlation over time, thereby providing more conservative statistical inference. As reported in Table S9, the coefficient of DRI remains positive and similar in magnitude to the baseline estimate (, although its statistical significance decreases to the 10% level ). We further extend this approach to the mediation regressions. As shown in Columns (2) and (3), DRI is positively associated with operational efficiency (, while operational efficiency is positively associated with short-term financing intensity (). Similarly, Columns (4) and (5) show that DRI is positively associated with innovation capability (), and innovation capability is positively associated with short-term financing intensity (). Overall, the estimated association between DRI and short-term financing intensity remains positive and similar in magnitude, but the weaker statistical significance under firm clustering calls for a cautious interpretation of the baseline evidence. The mediation regressions also remain broadly consistent with the proposed roles of operational efficiency and innovation capability.
4.5.5. Using Industry-by-Year Fixed Effects
To further assess the robustness of the baseline findings to time-varying industry-level heterogeneity, we re-estimate the baseline model by replacing year fixed effects with industry-by-year fixed effects while retaining firm fixed effects and the full set of control variables. This specification accounts for unobserved shocks shared by firms within the same industry in a given year, such as changes in industry-specific economic conditions and policy environments. As reported in Table S10, the coefficient of DRI remains positive and statistically significant at the 5% level (). Overall, these findings indicate that the positive association between DRI and short-term financing intensity persists after accounting for industry-specific time-varying factors.
4.5.6. Replacing Mediation Variables
To further assess the robustness of the mediating mechanisms, we employ alternative measures of operational efficiency and innovation capability. Specifically, operational efficiency (OE1) is measured as the natural logarithm of inventory turnover days, with lower values indicating greater efficiency, while innovation capability (Patent3) is measured as the natural logarithm of one plus the number of invention patent applications. As reported in Table S11, DRI is negatively associated with OE1 (, and OE1 is negatively associated with short-term financing intensity (, consistent with the proposed operational efficiency mechanism. Similarly, DRI is positively associated with Patent3 (, which is positively associated with short-term financing intensity (. The DRI coefficient remains positive and significant across these specifications, providing additional evidence consistent with the proposed mechanisms.
We further examine the correlations between the baseline and alternative measures of the dependent and mediating variables, as reported in Table S12. For the dependent variable, the Pearson and Spearman correlation coefficients are 0.2180 and 0.2303, respectively (both ), indicating a statistically significant but modest positive association between the two measures. For operational efficiency, the Pearson and Spearman correlation coefficients are −0.2268 and −0.4185, respectively, consistent with the opposite directions of the two indicators. For innovation capability, the corresponding coefficients are 0.0761 and 0.0972. All correlations are statistically significant (), although their magnitudes suggest that the alternative measures capture related but distinct aspects of the corresponding constructs. Overall, these findings provide supplementary evidence regarding the consistency of the results across alternative measurement approaches.
4.5.7. Placebo Test
To further assess the robustness of the baseline findings, we conduct a permutation-based placebo test by randomly shuffling DRI values across firm-year observations within each year. This procedure is repeated 500 times while retaining the original dependent variable, control variables, and firm and year fixed effects. As illustrated in Figure S1, the placebo coefficients are concentrated around zero, with a mean of approximately 0.000008. In contrast, the actual DRI coefficient () lies outside the distribution of all 500 placebo estimates. The empirical p-value is below 0.01, indicating that the positive association between DRI and short-term financing intensity is unlikely to be attributable to arbitrary reassignment of DRI under the specified permutation scheme. This result provides additional support for the robustness of our baseline findings.
4.5.8. PSM-OLS Test
To further assess the robustness of the baseline findings to observable differences between firms, we employ propensity score matching followed by OLS regression (PSM-OLS). Specifically, firm-year observations with positive DRI values are assigned to the treatment group, while those with zero DRI values constitute the control group. Propensity scores are estimated using a logit model incorporating the full set of control variables and year indicators, followed by one-to-one nearest-neighbor matching with replacement under the common support restriction. We then re-estimate the baseline model using observations with positive matching weights, retaining firm and year fixed effects and the full set of control variables. Of the 9952 eligible firm-year observations, 3562 receive positive matching weights. After singleton observations are removed by the fixed-effects estimator, the final regression sample comprises 3116 observations. As reported in Table S13, the coefficient of DRI remains positive and statistically significant at the 10% level (). The matching diagnostics further indicate that the mean absolute standardized bias across the full set of covariates, including year indicators, decreases from 18.4% before matching to 2.6% after matching, suggesting a substantial improvement in covariate balance. Sample retention and covariate balance are reported in Tables S14 and S15, respectively; Figures S2 and S3 show covariate balance and common support. These findings suggest that the positive association between DRI and short-term financing intensity persists after matching firms based on observable characteristics, providing additional support for the robustness of the baseline results.
4.5.9. Using Lagged DRI
To further examine the temporal patterns of the relationship between DRI and SCF performance, we re-estimate the baseline model using one-year and two-year lagged DRI. As reported in Table S16, the coefficient of one-year lagged DRI is positive but statistically insignificant (), whereas the coefficient of two-year lagged DRI is positive and significant at the 10% level (). This pattern is consistent with the gradual realization of the potential financing benefits associated with DRI. Specifically, translating digital–real technological integration into improved financing conditions may require time for technological knowledge to be incorporated into business activities, transaction information to accumulate, and financial institutions to recognize improvements in firms’ operational transparency and financing credibility. Consequently, the positive association between DRI and short-term financing intensity may become more apparent over time.
We further examine the temporal relationships between DRI and the proposed mediating variables. As reported in Table S16, one-year lagged DRI is positively and significantly associated with innovation capability (), whereas its association with operational efficiency is statistically insignificant (). Taken together, the lagged results provide evidence for the DRI–innovation capability association, while the operational efficiency association and the one-year financing association are not statistically significant. These regressions examine selected relationships and do not estimate a complete sequence linking earlier DRI, subsequent mediators, and later financing outcomes.
4.5.10. Controlling for Firm Patent Portfolio Size
To assess whether the baseline findings are driven by differences in firms’ overall patenting activity, we re-estimate the baseline model by additionally controlling for firms’ invention patent applications. As reported in Table S17, the coefficient of DRI remains positive and statistically significant at the 5% level (β = 0.003, t = 2.259). This result suggests that the positive association between DRI and short-term financing intensity is not solely attributable to differences in firms’ invention patenting activity. The findings provide further support for the robustness of the baseline results after accounting for firms’ patenting scale.
4.5.11. Examining the Components of Short-Term Financing Intensity
To further examine the components of the baseline measure, we separately use short-term borrowings and notes payable as dependent variables. This analysis addresses the concern that short-term borrowings may finance activities unrelated to identifiable SCF arrangements, and that higher borrowing balances may reflect increased financing needs or liquidity pressures rather than improved financing availability. As reported in Table S18, DRI is positively associated with both short-term borrowings (β = 0.003, p < 0.01) and notes payable (β = 0.001, p < 0.1). These results suggest that the baseline association is not driven exclusively by either component.
4.6. Heterogeneity Analysis
To further examine whether the DRI–SCF association varies across different firm and environmental characteristics, we conduct heterogeneity analyses based on firm size, regional marketization, digital-economy industry membership, and supply-chain concentration. The results show no statistically significant difference between large and small firms, although the positive association is significant only among larger firms. By contrast, clear heterogeneity is observed across the other three dimensions.
As shown in Table 7, the DRI–SCF association is stronger in regions with lower marketization (), among firms outside digital-economy industries (), and among firms with higher supply-chain concentration (). One possible explanation is that DRI provides greater marginal informational and operational value where market-supporting institutions are less developed, where digital technologies are less deeply embedded in routine business activities, and where firms depend more heavily on a limited number of major supply-chain partners. In these settings, improved operational visibility, verifiability, and coordination may be particularly relevant to financing evaluation.
Table 7.
Heterogeneity analysis.
Overall, the results suggest that the financing relevance of DRI is shaped more by institutional, industrial, and supply-chain conditions than by firm size alone.
5. Conclusions and Implications
The main conclusions of this study can be summarized as follows:
- (1)
- Empirical finding: DRI is positively associated with short-term financing intensity. This positive association is observed in several supplementary analyses.
- (2)
- Mechanism: Operational efficiency and innovation capability both significantly mediate the DRI–SCF relationship, revealing two distinct capability pathways through which DRI is associated with short-term financing intensity.
- (3)
- Boundary conditions: Environmental uncertainty strengthens the innovation capability–SCF relationship but does not significantly alter the operational efficiency–SCF relationship, whereas supply chain risk strengthens both relationships; the DRI–SCF association also varies across marketization, industry type, and supply-chain concentration.
- (4)
- Practical implication: Firms can enhance the financing relevance of DRI by translating digital-real integration into both operational efficiency and innovation capability and by aligning capability development with the uncertainty and risk conditions they face.
5.1. Discussion and Theoretical Implications
First, this research advances the understanding of the relationship between DRI and SCF from a firm-centric, capability-building perspective. Our findings confirm a positive association between DRI and SCF performance. While existing studies predominantly emphasize the application of digital technologies in SCF platforms and risk assessment systems [7,36], our work shifts the focus to how firms actively integrate digital elements with real business activities. By developing and testing a theoretical framework grounded in DCT, we illuminate how firms transform digital-real integration into financing-related performance advantages [19,38].
Second, this study contributes to DCT by explaining how operational efficiency and innovation capability may connect DRI with financing outcomes [22,30,39]. Within the DCT framework, sensing, seizing, and reconfiguring provide a theoretical basis for understanding how the integration of digital and industrial knowledge may support the development of these capability manifestations. Operational efficiency reflects the effective coordination of current operating resources and may inform financing assessments through operating reliability and working-capital circulation. Innovation capability reflects firms’ capacity for knowledge recombination and technological renewal and may inform financing assessments through adaptability and future value-creation potential. By specifying the financing roles of operational efficiency and innovation capability, this study extends the discussion of capability value beyond organizational adaptation and competitive advantage to its relevance for external financing.
Third, the moderation results provide further insight into why the financing relevance of these capability manifestations varies across external conditions. The non-significant moderating effect of environmental uncertainty on the operational efficiency–SCF relationship may reflect two offsetting forces. On the one hand, operational efficiency continues to provide useful information about firms’ current resource utilization, operating stability, and working-capital management; on the other hand, greater environmental uncertainty reduces the predictability of future demand, transactions, and cash flows, which may limit the extent to which improvements in current efficiency translate into additional financing advantages. By contrast, innovation capability becomes more informative under high environmental uncertainty because it provides forward-looking signals of firms’ adaptability, renewal potential, and long-term viability when future operating conditions are more difficult to predict [75,76]. Supply chain risk operates through a different mechanism. When supply–demand mismatches and interfirm coordination disruptions intensify, the ability to maintain efficient resource utilization, working-capital circulation, and operational continuity becomes more valuable for financing evaluation, thereby increasing the relevance of operational efficiency [77,79]. At the same time, innovation capability provides evidence of firms’ ability to adjust technologies, products, and organizational arrangements in response to supply chain disruptions. These patterns extend the contingency perspective of DCT by showing that the strategic and financing relevance of capability manifestations arising from dynamic capability processes depends on the specific form of uncertainty and risk confronting the firm [33,40].
5.2. Practical Implications
This study offers several important practical implications for businesses aiming to leverage DRI to enhance SCF performance. First, our findings encourage firms to strategically embrace DRI—the deep coupling of digital elements with real business processes—as a complementary approach to improving SCF performance. Given the relatively modest economic magnitude of the estimated association, with a one-standard-deviation increase in DRI associated with an SCF increase of approximately 1.5% of the sample mean, DRI should be viewed as a supplementary rather than a standalone solution to financing challenges. Firms should actively embed digital technologies into procurement, production, inventory, logistics, and sales to improve the authenticity, completeness, and verifiability of transaction data. By doing so, firms may strengthen the credibility of their transaction information and support financing assessments by financial institutions.
Second, for managers, our findings provide guidance on how to align capability development with external conditions. When environmental uncertainty is high, firms should continue to maintain efficient and stable operations, as our results do not indicate a significant change in the contribution of operational efficiency to SCF performance across different levels of environmental uncertainty. At the same time, managers may place additional emphasis on strengthening innovation capability, as innovation can signal firms’ adaptability, long-term viability, and future value creation potential under uncertain environments. When supply chain risk is high, managers should strengthen both operational efficiency and innovation capability. Improving working-capital turnover, resource utilization, and operational stability can help firms demonstrate their ability to maintain reliable current operations under supply chain disruptions, while stronger innovation capability can provide additional evidence of their ability to adapt, renew technologies and processes, and respond to changing supply chain conditions. Together, these two capability manifestations may provide supplementary information for financing evaluation when supply chain risk is elevated.
Third, for policymakers, this study highlights the potential value of fostering a supportive environment for DRI. Policies should aim to lower the barriers for firms to build their integration capabilities, promote industry-wide data connectivity, and support the development of data-driven financing models that can effectively utilize the enhanced information transparency generated by DRI.
5.3. Limitations and Ideas for Future Research
This study has several limitations. First, although DCT is used to explain the sensing, seizing, and reconfiguring processes underlying capability development, these processes are not directly measured; operational efficiency and innovation capability instead serve as observable capability manifestations. Future research could employ survey or process-level data to capture these underlying processes more directly. Second, the patent-based DRI measure primarily captures the technological dimension of digital–real integration rather than directly observing the extent to which digital technologies are embedded in firms’ procurement, production, inventory, logistics, sales, and other operational processes. Although patent-based technological convergence provides a traceable indicator of firms’ integration of digital and non-digital technological knowledge, it cannot fully capture firm-level operational deployment. Future research could therefore combine patent-based measures with process-level, survey-based, or other direct indicators of operational digital integration to develop a more comprehensive measure of DRI. In addition, the SCF measure used in this study mainly reflects its financing-scale dimension, and future studies could employ broader measures of SCF outcomes. Third, the study focuses on Chinese A-share listed firms and two contextual factors—environmental uncertainty and supply chain risk. Future research could examine other institutional settings, firm types, and boundary conditions to assess the generalizability of the findings. Fourth, the observational design and contemporaneous mediation models limit strong causal interpretation. Although firm and year fixed effects and the IV analysis help address potential endogeneity, the temporal ordering among DRI, the mediators, and SCF cannot be fully established. Given that SCF in this study mainly reflects short-term operating finance, some effects may arise within a relatively short horizon. Future research could use lagged designs or stronger causal identification strategies to further examine these mechanisms.
Supplementary Materials
The following supporting information can be downloaded at https://www.mdpi.com/article/10.3390/jtaer21110410/s1. Table S1: Sample Selection and Distribution; Table S2: IPC Classification Codes and Matching Rules for Identifying Digital-Technology-Related Patents in the Construction of Digital–Real Integration (DRI); Table S3: Unique IPC Matching Rules; Table S4: Variance Inflation Factor Diagnostics; Table S5: Simple Slope Analysis of the Moderating Effects; Table S6: Robustness Checks: Replacing Dependent and Independent Variables; Table S7: Dictionary of Supply Chain Finance Products and Models; Table S8: Robustness Checks: Excluding Special Regional and Industry Samples; Table S9: Robustness Checks: Using Firm-Clustered Standard Errors; Table S10: Robustness Checks: Industry-by-Year Fixed Effects; Table S11: Robustness Checks: Replacing Mediation Variables; Table S12: Correlations between Baseline and Alternative Measures; Table S13: Robustness Checks: PSM-OLS Test; Table S14: PSM Sample Retention; Table S15: Covariate Balance Before and After PSM; Table S16: Robustness Checks: Using Lagged DRI; Table S17: Controlling for Firm Patent Portfolio Size; Table S18: Examining the Components of Short-Term Financing Intensity; Figure S1: Distribution of Placebo Coefficients; Figure S2: Covariate Balance Before and After PSM; Figure S3: Common Support and Propensity Score Distributions.
Author Contributions
Conceptualization, Q.L.; Methodology, G.L.; Software, G.L.; Formal Analysis, G.L.; Investigation, Q.L. and Y.Y.; Data curation, Y.Y.; Writing—Original Draft, G.L.; Writing—Review and Editing, Y.Y.; Supervision, Q.L.; Funding Acquisition, Y.Y. All authors have read and agreed to the published version of the manuscript.
Funding
This research was funded by the Youth Project of the National Social Science Foundation of China (No. 24CGL037).
Data Availability Statement
The raw data supporting the conclusions of this article will be made available by the authors on request.
Conflicts of Interest
The authors declare no conflicts of interest.
References
- Song, H.; Yang, X.; Yu, K. How do supply chain network and SMEs’ operational capabilities enhance working capital financing? An integrative signaling view. Int. J. Prod. Econ. 2020, 220, 107447. [Google Scholar] [CrossRef] [Scilit]
- Song, H.; Li, M.; Yu, K. Big data analytics in digital platforms: How do financial service providers customise supply chain finance? Int. J. Oper. Prod. Manag. 2021, 41, 410–435. [Google Scholar] [CrossRef] [Scilit]
- Berger, A.N.; Udell, G.F. A more complete conceptual framework for SME finance. J. Bank. Financ. 2006, 30, 2945–2966. [Google Scholar] [CrossRef] [Scilit]
- Zhu, Y.; Zhou, L.; Xie, C.; Wang, G.-J.; Nguyen, T.V. Forecasting SMEs’ credit risk in supply chain finance with an enhanced hybrid ensemble machine learning approach. Int. J. Prod. Econ. 2019, 211, 22–33. [Google Scholar] [CrossRef] [Scilit]
- Carpenter, R.E.; Petersen, B.C. Is the Growth of Small Firms Constrained by Internal Finance? Rev. Econ. Stat. 2002, 84, 298–309. [Google Scholar] [CrossRef] [Scilit]
- Caniato, F.; Henke, M.; Zsidisin, G.A. Supply chain finance: Historical foundations, current research, future developments. J. Purch. Supply Manag. 2019, 25, 99–104. [Google Scholar] [CrossRef] [Scilit]
- Chen, L.; Moretto, A.; Jia, F.; Caniato, F.; Xiong, Y. The role of digital transformation to empower supply chain finance: Current research status and future research directions (Guest editorial). Int. J. Oper. Prod. Manag. 2021, 41, 277–288. [Google Scholar] [CrossRef] [Scilit]
- Rijanto, A. Blockchain Technology Adoption in Supply Chain Finance. J. Theor. Appl. Electron. Commer. Res. 2021, 16, 3078–3098. [Google Scholar] [CrossRef] [Scilit]
- Lu, Q.; Qin, W.; Yan, R.; Zhang, S.; Ma, L. The Effect of SMEs’ Digitalization on Supply Chain Financing Performance: Based on the Resource Orchestration Theory. J. Theor. Appl. Electron. Commer. Res. 2025, 20, 20. [Google Scholar] [CrossRef] [Scilit]
- Toorajipour, R.; Oghazi, P.; Sohrabpour, V.; Patel, P.C.; Mostaghel, R. Block by block: A blockchain-based peer-to-peer business transaction for international trade. Technol. Forecast. Soc. Chang. 2022, 180, 121714. [Google Scholar] [CrossRef] [Scilit]
- Jiang, H.; Peng, C.; Ren, D. Supply-chain finance digitalization and corporate financial fraud: Evidence from China. Econ. Model. 2024, 139, 106837. [Google Scholar] [CrossRef] [Scilit]
- Huang, K.; Wang, K.; Lee, P.K.C.; Yeung, A.C.L. The impact of industry 4.0 on supply chain capability and supply chain resilience: A dynamic resource-based view. Int. J. Prod. Econ. 2023, 262, 108913. [Google Scholar] [CrossRef] [Scilit]
- Jiang, Y.; Feng, T.; Huang, Y. Antecedent configurations toward supply chain resilience: The joint impact of supply chain integration and big data analytics capability. J. Oper. Manag. 2024, 70, 257–284. [Google Scholar] [CrossRef] [Scilit]
- Jiang, K.; Xie, X.; Xiao, Y.; Ashraf, B.N. The value of corporate digital transformation: Evidence from bond pricing. China Financ. Rev. Int. 2025, 15, 43–66. [Google Scholar] [CrossRef] [Scilit]
- Wei, X.; Li, G.; Li, P. How does digital-real integration reshape the effective market power of enterprises? From the perspective of dynamic capabilities. Int. Rev. Econ. Financ. 2026, 106, 104914. [Google Scholar] [CrossRef] [Scilit]
- Lu, C.; Li, R. The integration of digital and real economy technologies and corporate value creation efficiency: Evidence from Chinese enterprise patent information. Econ. Anal. Policy 2026, 91, 967–986. [Google Scholar] [CrossRef] [Scilit]
- Wang, Y.; Shi, M.; Liu, J.; Zhong, M.; Ran, R. The impact of digital-real integration on energy productivity under a multi-governance framework: The mediating role of AI and embodied technological progress. Energy Econ. 2025, 142, 108167. [Google Scholar] [CrossRef] [Scilit]
- Tianren, L.; Sufeng, H. Does digital-industrial technology integration reduce corporate carbon emissions? Environ. Res. 2024, 257, 119313. [Google Scholar] [CrossRef] [Scilit] [PubMed]
- Teece, D.J. Explicating dynamic capabilities: The nature and microfoundations of (sustainable) enterprise performance. Strateg. Manag. J. 2007, 28, 1319–1350. [Google Scholar] [CrossRef] [Scilit]
- Eisenhardt, K.M.; Martin, J.A. Dynamic capabilities: What are they? Strateg. Manag. J. 2000, 21, 1105–1121. [Google Scholar] [CrossRef] [Scilit]
- Barreto, I. Dynamic Capabilities: A Review of Past Research and an Agenda for the Future. J. Manag. 2010, 36, 256–280. [Google Scholar] [CrossRef] [Scilit]
- Easterby-Smith, M.; Lyles, M.A.; Peteraf, M.A. Dynamic Capabilities: Current Debates and Future Directions. Br. J. Manag. 2009, 20, S1–S8. [Google Scholar] [CrossRef] [Scilit]
- Qiao, R.; Zhao, L. Highlight risk management in supply chain finance: Effects of supply chain risk management capabilities on financing performance of small-medium enterprises. Supply Chain Manag. Int. J. 2023, 28, 843–858. [Google Scholar] [CrossRef] [Scilit]
- Kortmann, S.; Gelhard, C.; Zimmermann, C.; Piller, F.T. Linking strategic flexibility and operational efficiency: The mediating role of ambidextrous operational capabilities. J. Oper. Manag. 2014, 32, 475–490. [Google Scholar] [CrossRef] [Scilit]
- Damanpour, F.; Gopalakrishnan, S. The Dynamics of the Adoption of Product and Process Innovations in Organizations. J. Manag. Stud. 2001, 38, 45–65. [Google Scholar] [CrossRef] [Scilit]
- Wang, L.; Jin, J.L.; Zhou, K.Z. Technological capability strength/asymmetry and supply chain process innovation: The contingent roles of institutional environments. Res. Policy 2023, 52, 104724. [Google Scholar] [CrossRef] [Scilit]
- Babina, T.; Fedyk, A.; He, A.; Hodson, J. Artificial intelligence, firm growth, and product innovation. J. Financ. Econ. 2024, 151, 103745. [Google Scholar] [CrossRef] [Scilit]
- Robertson, J.; Caruana, A.; Ferreira, C. Innovation performance: The effect of knowledge-based dynamic capabilities in cross-country innovation ecosystems. Int. Bus. Rev. 2023, 32, 101866. [Google Scholar] [CrossRef] [Scilit]
- Azadi, M.; Moghaddas, Z.; Farzipoor Saen, R.; Hussain, F.K. Financing manufacturers for investing in Industry 4.0 technologies: Internal financing vs. External financing. Int. J. Prod. Res. 2024, 62, 8056–8072. [Google Scholar] [CrossRef] [Scilit]
- Warner, K.S.R.; Wäger, M. Building dynamic capabilities for digital transformation: An ongoing process of strategic renewal. Long Range Plan. 2019, 52, 326–349. [Google Scholar] [CrossRef] [Scilit]
- Lu, Q.; Yang, Y.; Yu, M. Can SMEs’ quality management promote supply chain financing performance? An explanation based on signalling theory. Int. J. Emerg. Mark. 2024, 19, 1981–2002. [Google Scholar] [CrossRef] [Scilit]
- Lu, Q.; Zhou, Y.; Luan, Z.; Song, H. The effect of SMEs’ ambidextrous innovations on supply chain financing performance: Balancing effect and moderating effect. Int. J. Oper. Prod. Manag. 2024, 44, 424–461. [Google Scholar] [CrossRef] [Scilit]
- Teece, D.J. Dynamic Capabilities: Routines versus Entrepreneurial Action. J. Manag. Stud. 2012, 49, 1395–1401. [Google Scholar] [CrossRef] [Scilit]
- Rehman, A.u.; Jajja, M.S.S. The interplay of integration, flexibility and coordination: A dynamic capability view to responding environmental uncertainty. Int. J. Oper. Prod. Manag. 2023, 43, 916–946. [Google Scholar] [CrossRef] [Scilit]
- Gani, M.O.; Takahashi, Y.; Bag, S.; Rahman, M.S. Firms’ dynamic capabilities and supply chain risk management: A B2B perspective. Benchmarking Int. J. 2023, 30, 4119–4139. [Google Scholar] [CrossRef] [Scilit]
- Chod, J.; Trichakis, N.; Tsoukalas, G.; Aspegren, H.; Weber, M. On the financing benefits of supply chain transparency and blockchain adoption. Manag. Sci. 2020, 66, 4378–4396. [Google Scholar] [CrossRef] [Scilit]
- Du, M.; Chen, Q.; Xiao, J.; Yang, H.; Ma, X. Supply chain finance innovation using blockchain. IEEE Trans. Eng. Manag. 2020, 67, 1045–1058. [Google Scholar] [CrossRef] [Scilit]
- Schilke, O.; Hu, S.; Helfat, C.E. Quo vadis, dynamic capabilities? A content-analytic review of the current state of knowledge and recommendations for future research. Acad. Manag. Ann. 2018, 12, 390–439. [Google Scholar] [CrossRef] [Scilit]
- Mele, G.; Capaldo, G.; Secundo, G.; Corvello, V. Revisiting the idea of knowledge-based dynamic capabilities for digital transformation. J. Knowl. Manag. 2024, 28, 532–563. [Google Scholar] [CrossRef] [Scilit]
- Yu, K.; Cadeaux, J.; Luo, B.N.; Qian, C. Process ambidexterity driven by environmental uncertainty: Balancing flexibility and routine. Int. J. Oper. Prod. Manag. 2023, 43, 1976–2007. [Google Scholar] [CrossRef] [Scilit]
- Singh, R.; Charan, P.; Chattopadhyay, M. Effect of relational capability on dynamic capability: Exploring the role of competitive intensity and environmental uncertainty. J. Manag. Organ. 2022, 28, 659–680. [Google Scholar] [CrossRef] [Scilit]
- Markovich, A.; Efrat, K.; Raban, D.R. Dynamic capabilities: Interrelations and distinct effects on performance in low and high competitive intensity environments. Balt. J. Manag. 2021, 16, 539–563. [Google Scholar] [CrossRef] [Scilit]
- Teece, D.J.; Pisano, G.; Shuen, A. Dynamic capabilities and strategic management. Strateg. Manag. J. 1997, 18, 509–533. [Google Scholar] [CrossRef] [Scilit]
- Fainshmidt, S.; Pezeshkan, A.; Frazier, M.L.; Nair, A.; Markowski, E. Dynamic Capabilities and Organizational Performance: A Meta-Analytic Evaluation and Extension. J. Manag. Stud. 2016, 53, 1348–1380. [Google Scholar] [CrossRef] [Scilit]
- Li, L.; Su, F.; Zhang, W.; Mao, J.Y. Digital transformation by SME entrepreneurs: A capability perspective. Inf. Syst. J. 2018, 28, 1129–1157. [Google Scholar] [CrossRef] [Scilit]
- Xie, X.; Han, Y.; Anderson, A.; Ribeiro-Navarrete, S. Digital platforms and SMEs’ business model innovation: Exploring the mediating mechanisms of capability reconfiguration. Int. J. Inf. Manag. 2022, 65, 102513. [Google Scholar] [CrossRef] [Scilit]
- Ghosh, S.; Hughes, M.; Hodgkinson, I.; Hughes, P. Digital transformation of industrial businesses: A dynamic capability approach. Technovation 2022, 113, 102414. [Google Scholar] [CrossRef] [Scilit]
- Feroz, A.K.; Zo, H.; Eom, J.; Chiravuri, A. Identifying organizations’ dynamic capabilities for sustainable digital transformation: A mixed methods study. Technol. Soc. 2023, 73, 102257. [Google Scholar] [CrossRef] [Scilit]
- Quayson, M.; Bai, C.; Sun, L.; Sarkis, J. Building blockchain-driven dynamic capabilities for developing circular supply chain: Rethinking the role of sensing, seizing, and reconfiguring. Bus. Strategy Environ. 2023, 32, 4821–4840. [Google Scholar] [CrossRef] [Scilit]
- Dobrovnik, M.; Herold, D.M.; Kummer, S. Exploring supply chain managers’ complex perceptions of dynamic capabilities for digital transformation. Digit. Bus. 2025, 5, 100098. [Google Scholar] [CrossRef] [Scilit]
- Blackman, I.D.; Holland, C.P.; Westcott, T. Motorola’s global financial supply chain strategy. Supply Chain Manag. Int. J. 2013, 18, 132–147. [Google Scholar] [CrossRef] [Scilit]
- Hu, M.; Yang, X.; Zhu, Y.; Uddin, G.S. Spillover effect of corporate digitalization in the supply chain: Perspective of trade credit financing. Glob. Financ. J. 2024, 62, 101009. [Google Scholar] [CrossRef] [Scilit]
- Lu, Q.; Song, L.; Yu, K. The effects of operational and digitalization capabilities on SMSs’ supply chain financing under supply risk. Int. J. Logist. Res. Appl. 2023, 26, 1642–1662. [Google Scholar] [CrossRef] [Scilit]
- Lu, Q.; Liu, B.; Song, H. How can SMEs acquire supply chain financing: The capabilities and information perspective. Ind. Manag. Data Syst. 2020, 120, 784–809. [Google Scholar] [CrossRef] [Scilit]
- Ji, B. Supply chain finance and corporate persistent innovation—From the perspective of dynamic capabilities enhancement. Int. Rev. Econ. Financ. 2025, 103, 104570. [Google Scholar] [CrossRef] [Scilit]
- Jia, F.; Blome, C.; Sun, H.; Yang, Y.; Zhi, B. Towards an integrated conceptual framework of supply chain finance: An information processing perspective. Int. J. Prod. Econ. 2020, 219, 18–30. [Google Scholar] [CrossRef] [Scilit]
- Li, L.; Wang, Z.; Chen, L.; Zhao, X.; Yang, S. Supply chain collaboration and supply chain finance adoption: The moderating role of information transparency and transaction dependence. Supply Chain Manag. Int. J. 2023, 28, 710–723. [Google Scholar] [CrossRef] [Scilit]
- Kshetri, N. 1 Blockchain’s roles in meeting key supply chain management objectives. Int. J. Inf. Manag. 2018, 39, 80–89. [Google Scholar] [CrossRef] [Scilit]
- Liu, L.; Zhang, J.Z.; He, W.; Li, W. Mitigating information asymmetry in inventory pledge financing through the Internet of things and blockchain. J. Enterp. Inf. Manag. 2021, 34, 1429–1451. [Google Scholar] [CrossRef] [Scilit]
- Qiao, R.; Zhao, L. Does supply chain digitalisation reduce supply chain financing risks? Dual mechanisms by integrating logistics, information flow and capital flow. Int. J. Logist. Res. Appl. 2025, 1–22. [Google Scholar] [CrossRef] [Scilit]
- Guo, X.; Xia, W.; Feng, T.; Tan, J.; Xian, F. Blockchain technology adoption and sustainable supply chain finance: The perspective of information processing theory. Corp. Soc. Responsib. Environ. Manag. 2024, 31, 3614–3632. [Google Scholar] [CrossRef] [Scilit]
- Wu, J.; Zhang, Z.; Zhou, S.X. Credit rating prediction through supply chains: A machine learning approach. Prod. Oper. Manag. 2022, 31, 1613–1629. [Google Scholar] [CrossRef] [Scilit]
- Kache, F.; Seuring, S. Challenges and opportunities of digital information at the intersection of Big Data Analytics and supply chain management. Int. J. Oper. Prod. Manag. 2017, 37, 10–36. [Google Scholar] [CrossRef] [Scilit]
- Lu, Q.; Wang, X.; Wang, Y. Enhancing supply chain resilience with supply chain governance and finance: The enabling role of digital technology adoption. Bus. Process Manag. J. 2023, 29, 944–964. [Google Scholar] [CrossRef] [Scilit]
- Dubey, R.; Gunasekaran, A.; Childe, S.J.; Bryde, D.J.; Giannakis, M.; Foropon, C.; Roubaud, D.; Hazen, B.T. Big data analytics and artificial intelligence pathway to operational performance under the effects of entrepreneurial orientation and environmental dynamism: A study of manufacturing organisations. Int. J. Prod. Econ. 2020, 226, 107599. [Google Scholar] [CrossRef] [Scilit]
- Han, Z.; Wang, Z. Digitalization and supply chain finance risk: Evidence from listed firms in the construction industry. Financ. Res. Lett. 2025, 74, 106726. [Google Scholar] [CrossRef] [Scilit]
- Liu, T.; Leng, J.; Zhu, S.; Fu, R. Digital Transformation and Enterprise Innovation Capability: From the Perspectives of Enterprise Cooperative Culture and Innovative Culture. J. Theor. Appl. Electron. Commer. Res. 2025, 20, 136. [Google Scholar] [CrossRef] [Scilit]
- Hong, J.; Zheng, R.; Deng, H.; Zhou, Y. Green supply chain collaborative innovation, absorptive capacity and innovation performance: Evidence from China. J. Clean. Prod. 2019, 241, 118377. [Google Scholar] [CrossRef] [Scilit]
- Li, S.; Kong, X.; Ianenko, M.; Wang, W. The impact of digital transformation on enterprise supply chain finance. Financ. Res. Lett. 2025, 85, 107894. [Google Scholar] [CrossRef] [Scilit]
- Teece, D.J. Business models and dynamic capabilities. Long Range Plan. 2018, 51, 40–49. [Google Scholar] [CrossRef] [Scilit]
- Milliken, F.J. Three Types of Perceived Uncertainty about the Environment: State, Effect, and Response Uncertainty. Acad. Manag. Rev. 1987, 12, 133–143. [Google Scholar] [CrossRef] [Scilit]
- Sreedevi, R.; Saranga, H. Uncertainty and supply chain risk: The moderating role of supply chain flexibility in risk mitigation. Int. J. Prod. Econ. 2017, 193, 332–342. [Google Scholar] [CrossRef] [Scilit]
- Juan, S.-J.; Li, E.Y. Financial performance of firms with supply chains during the COVID-19 pandemic: The roles of dynamic capability and supply chain resilience. Int. J. Oper. Prod. Manag. 2023, 43, 712–737. [Google Scholar] [CrossRef] [Scilit]
- Tseng, M.-L.; Wu, K.-J.; Hu, J.; Wang, C.-H. Decision-making model for sustainable supply chain finance under uncertainties. Int. J. Prod. Econ. 2018, 205, 30–36. [Google Scholar] [CrossRef] [Scilit]
- Kafetzopoulos, D.; Psomas, E.; Skalkos, D. Innovation dimensions and business performance under environmental uncertainty. Eur. J. Innov. Manag. 2020, 23, 856–876. [Google Scholar] [CrossRef] [Scilit]
- Sabahi, S.; Parast, M.M. Firm innovation and supply chain resilience: A dynamic capability perspective. Int. J. Logist. Res. Appl. 2020, 23, 254–269. [Google Scholar] [CrossRef] [Scilit]
- Ho, W.; Zheng, T.; Yildiz, H.; Talluri, S. Supply chain risk management: A literature review. Int. J. Prod. Res. 2015, 53, 5031–5069. [Google Scholar] [CrossRef] [Scilit]
- Van Hoek, R. Research opportunities for a more resilient post-COVID-19 supply chain–closing the gap between research findings and industry practice. Int. J. Oper. Prod. Manag. 2020, 40, 341–355. [Google Scholar] [CrossRef] [Scilit]
- El Baz, J.; Ruel, S. Can supply chain risk management practices mitigate the disruption impacts on supply chains’ resilience and robustness? Evidence from an empirical survey in a COVID-19 outbreak era. Int. J. Prod. Econ. 2021, 233, 107972. [Google Scholar] [CrossRef] [Scilit] [PubMed]
- Afraz, M.F.; Bhatti, S.H.; Ferraris, A.; Couturier, J. The impact of supply chain innovation on competitive advantage in the construction industry: Evidence from a moderated multi-mediation model. Technol. Forecast. Soc. Chang. 2021, 162, 120370. [Google Scholar] [CrossRef] [Scilit]
- Kwak, D.-W.; Seo, Y.-J.; Mason, R. Investigating the relationship between supply chain innovation, risk management capabilities and competitive advantage in global supply chains. Int. J. Oper. Prod. Manag. 2018, 38, 2–21. [Google Scholar] [CrossRef] [Scilit]
- Liu, Y.; Shang, J. Supply chain finance, environmental uncertainty and corporate supply chain resilience. Financ. Res. Lett. 2026, 89, 109298. [Google Scholar] [CrossRef] [Scilit]
- Kwon, O.; An, Y.; Kim, M.; Lee, C. Anticipating technology-driven industry convergence: Evidence from large-scale patent analysis. Technol. Anal. Strateg. Manag. 2020, 32, 363–378. [Google Scholar] [CrossRef] [Scilit]
- Hatane, S.E.; Winoto, J.; Tarigan, J.; Jie, F. Working capital management and board diversity towards firm performances in Indonesia’s LQ45. J. Account. Emerg. Econ. 2023, 13, 276–299. [Google Scholar] [CrossRef] [Scilit]
- Kumar, K.; Sawarni, K.S.; Narayanasamy, S. Does efficiency in working capital management impact the overall performance of firms? Evidence from India. Glob. Bus. Rev. 2024, 09721509231213524. [Google Scholar] [CrossRef] [Scilit]
- Hottenrott, H.; Lopes-Bento, C. Quantity or quality? Knowledge alliances and their effects on patenting. Ind. Corp. Chang. 2015, 24, 981–1011. [Google Scholar] [CrossRef] [Scilit]
- Ghosh, D.; Olsen, L. Environmental uncertainty and managers’ use of discretionary accruals. Account. Organ. Soc. 2009, 34, 188–205. [Google Scholar] [CrossRef] [Scilit]
- Peng, E.Y.; Zhang, D.; Xie, Y.; Linderman, K. Top management incentives and supply chain efficiency: A tournament theory perspective. Int. J. Oper. Prod. Manag. 2026, 46, 821–845. [Google Scholar] [CrossRef] [Scilit]
- Peng, X. Cross-Border Payments and Corporate Supply Chain Risk: The Heterogeneous Effect of Financial Regulation. Emerg. Mark. Financ. Trade 2026, 62, 5216–5238. [Google Scholar] [CrossRef] [Scilit]
- Baron, R.M.; Kenny, D.A. The moderator–mediator variable distinction in social psychological research: Conceptual, strategic, and statistical considerations. J. Pers. Soc. Psychol. 1986, 51, 1173–1182. [Google Scholar] [CrossRef] [PubMed]
- Zhang, B.; Huang, H.; Han, Z.; Chen, X. Digitize to decarbonize: Digital-real integration provides the green development pathway for corporate operation. Int. J. Clim. Chang. Strateg. Manag. 2026, 18, 216–239. [Google Scholar] [CrossRef] [Scilit]
- Li, Q.; Zhao, X.; Wei, Z.; Yin, S. Digital–Real Integration and Supply Chain Resilience: Insights from Stabilization, Complementarity, Extension, and Strengthening Pathways. Appl. Sci. 2026, 16, 4587. [Google Scholar] [CrossRef] [Scilit]
- Chen, R.; Huang, Q. Supply chain finance and soft budget constraints: A nonlinear threshold effect perspective from China’s listed companies. Financ. Res. Lett. 2025, 82, 107560. [Google Scholar] [CrossRef] [Scilit]
- Lu, Q.; Su, K.; Yang, Y.; Yu, Z. Unleashing the value of resource orchestration: How supply chain finance enhances corporate ESG performance. Int. J. Prod. Econ. 2026, 302, 110187. [Google Scholar] [CrossRef] [Scilit]
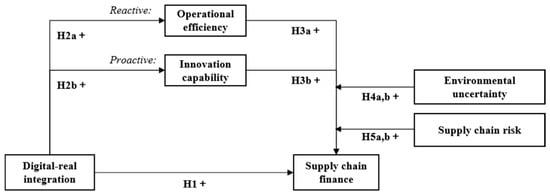
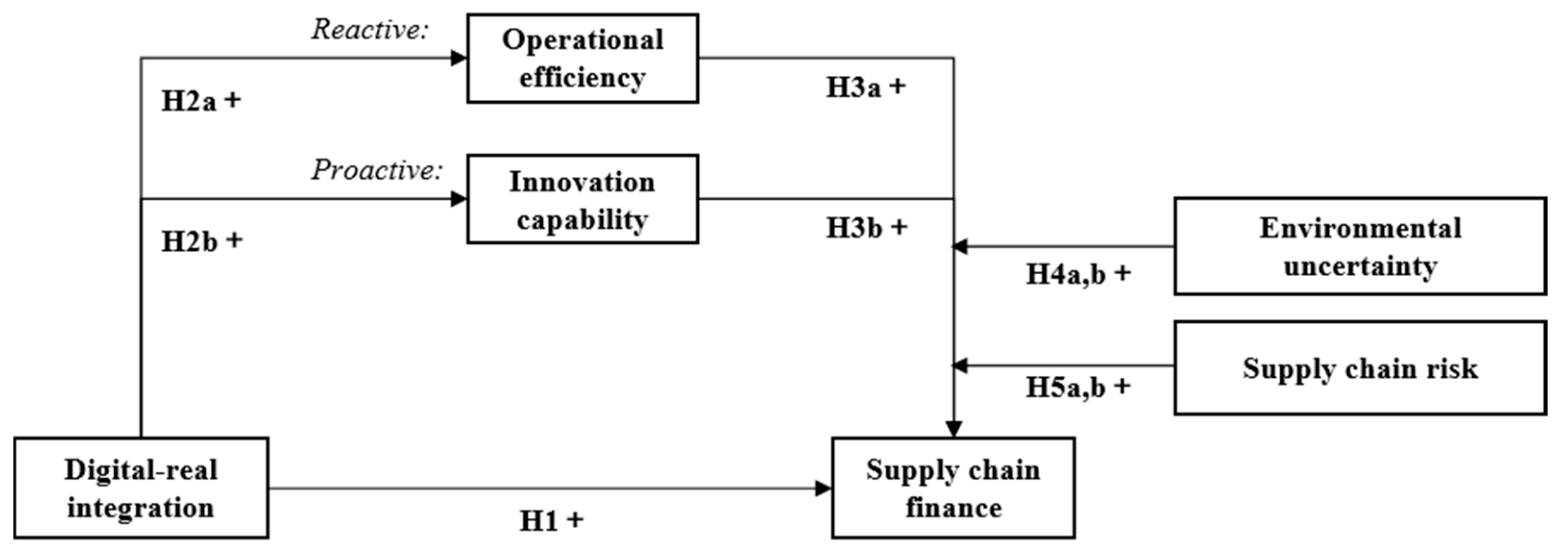
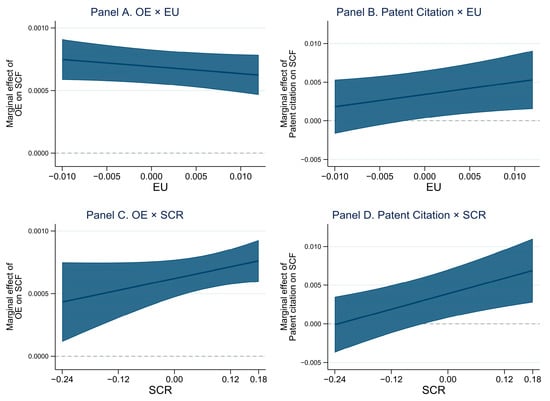
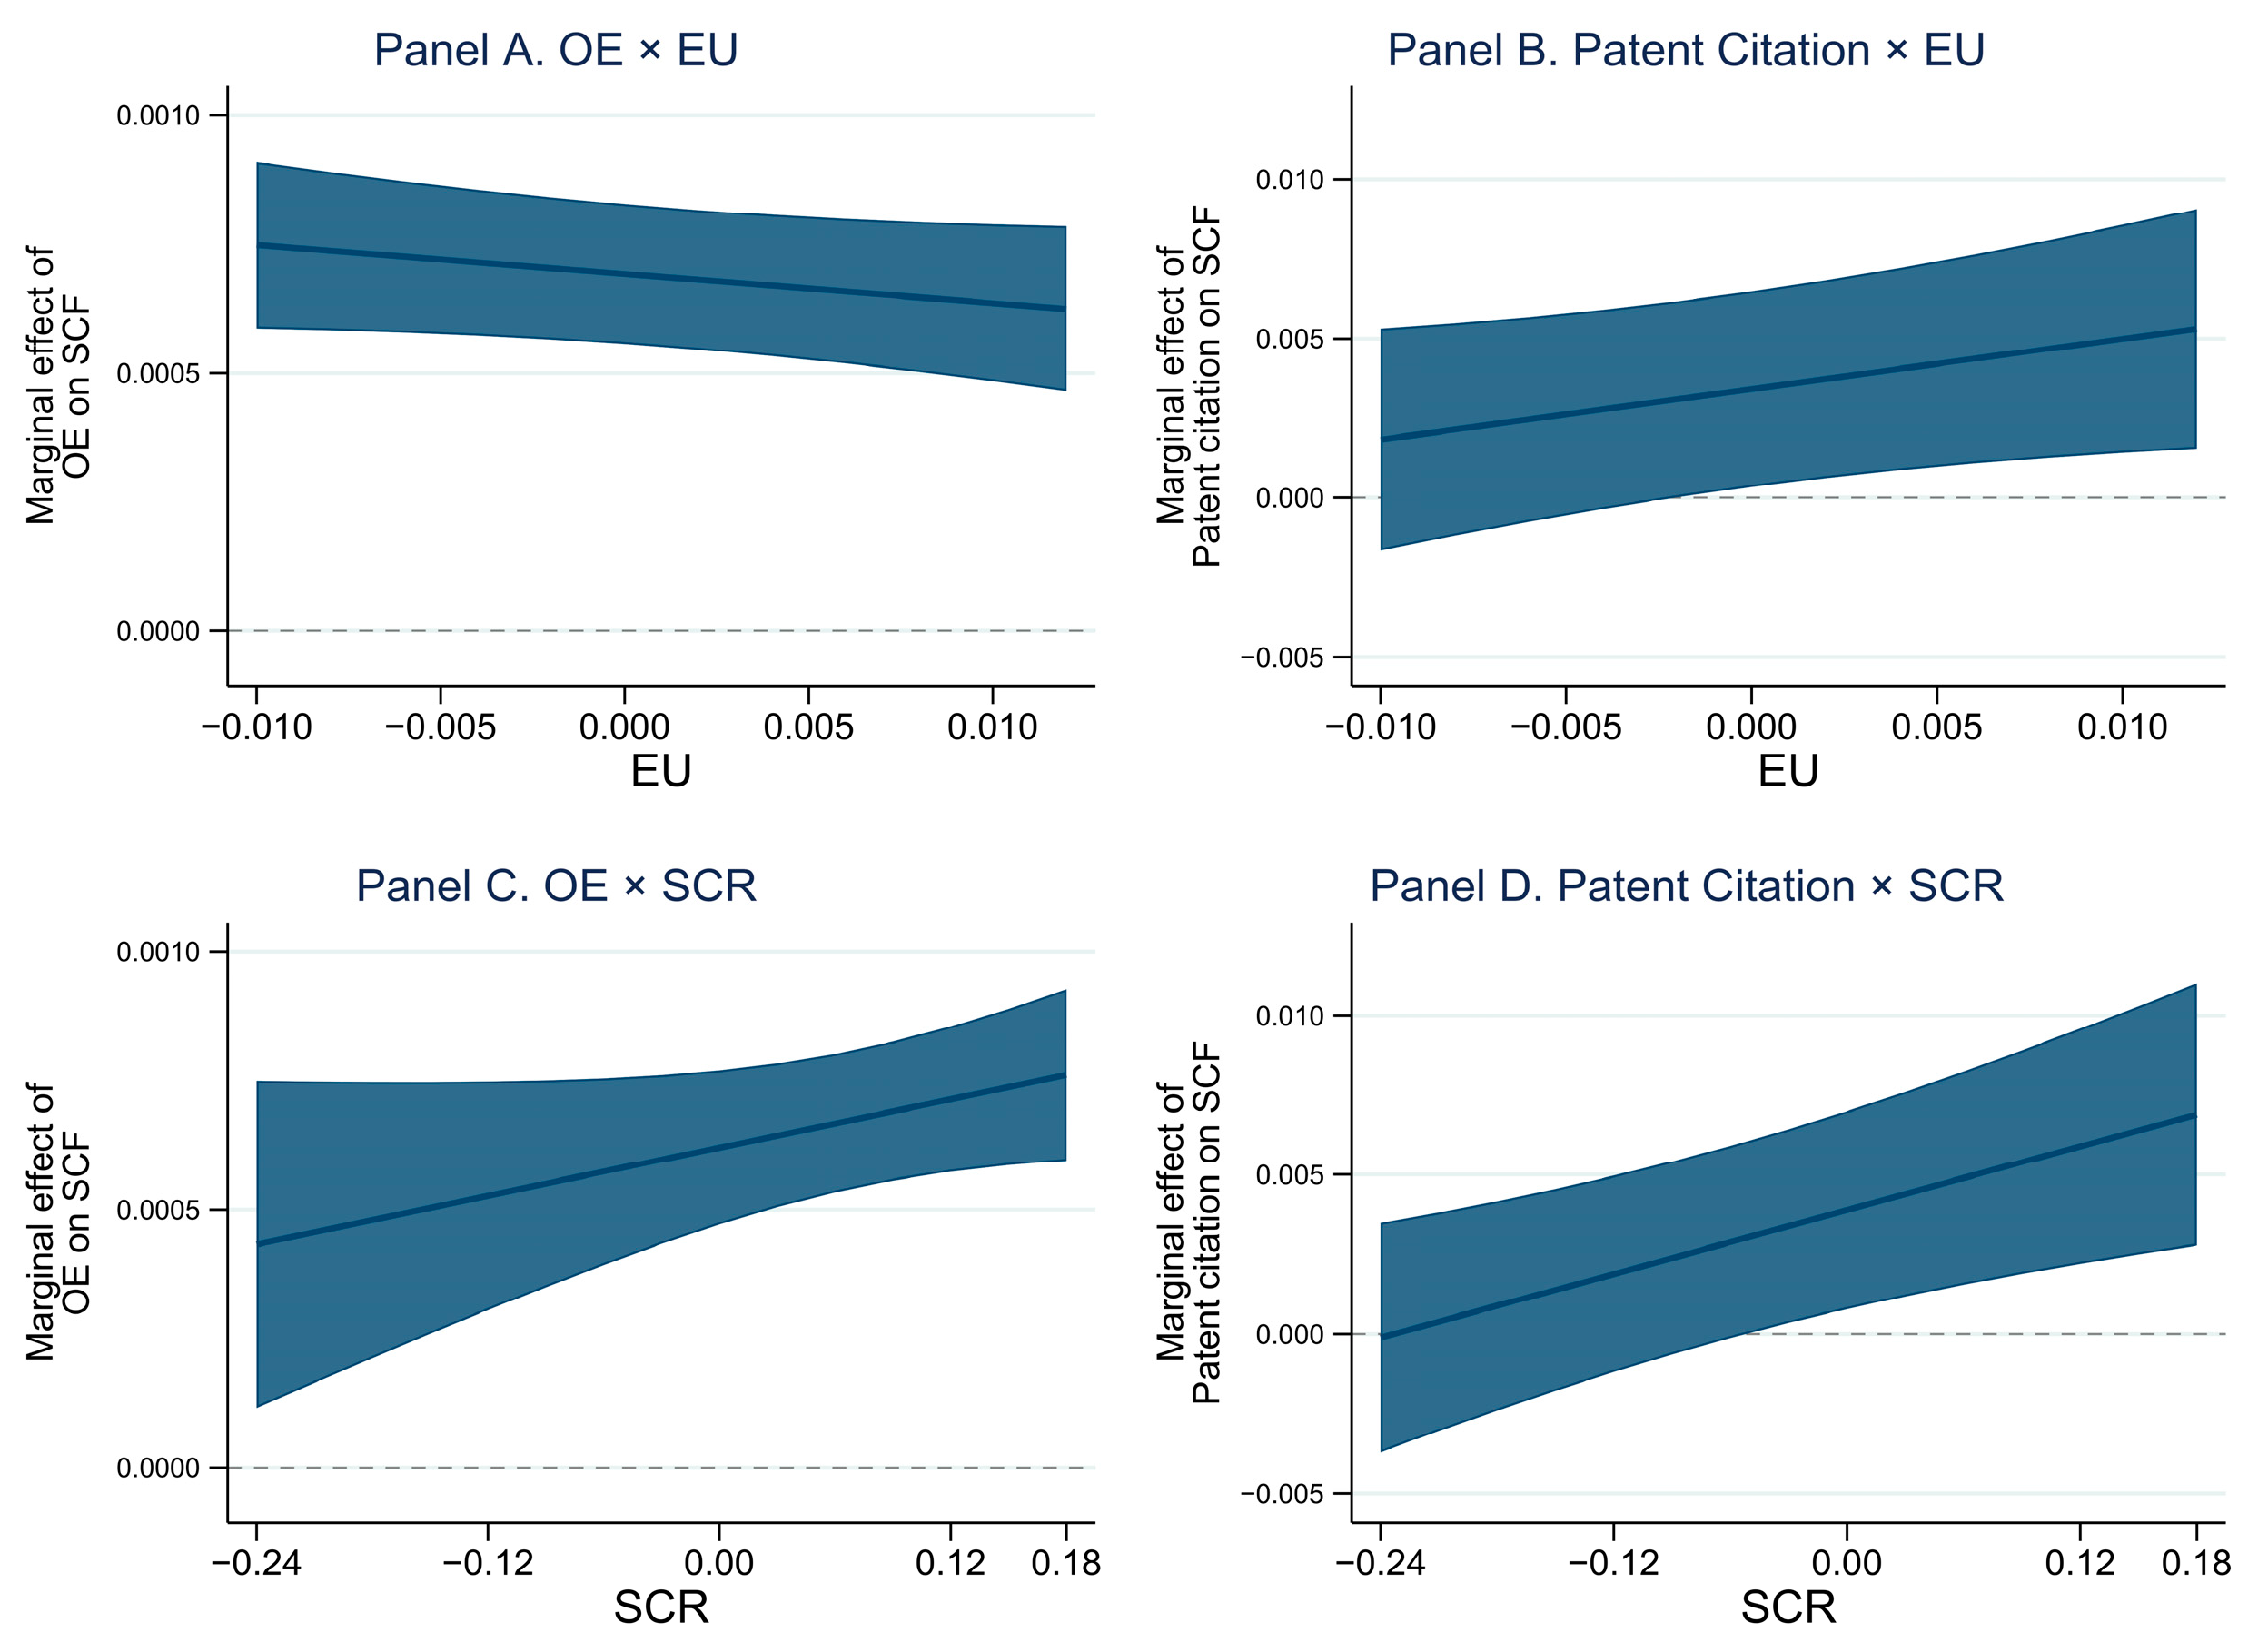
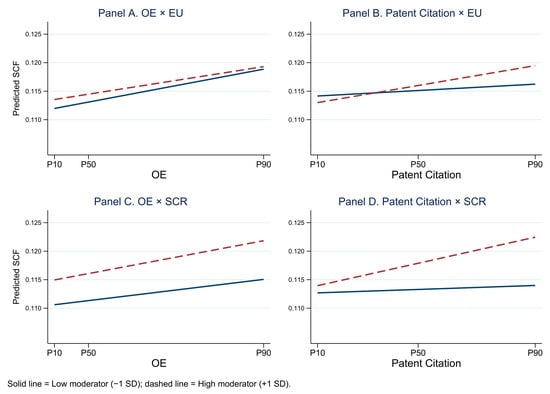

Disclaimer/Publisher’s Note: The statements, opinions and data contained in all publications are solely those of the individual author(s) and contributor(s) and not of MDPI and/or the editor(s). MDPI and/or the editor(s) disclaim responsibility for any injury to people or property resulting from any ideas, methods, instructions or products referred to in the content. |
© 2026 by the authors. Licensee MDPI, Basel, Switzerland. This article is an open access article distributed under the terms and conditions of the Creative Commons Attribution (CC BY) license.