


Abstract
Metaverse advertising has been promoted as an immersive marketing frontier, yet evidence on critical and mixed responses remains limited. This study examines 5924 advertising-relevant comments collected primarily from YouTube, supplemented by Reddit, between March 2020 and June 2026. An abductive mixed-methods computational content analysis combines codebook-based thematic analysis of 250 comments with pretrained sentiment and emotion classifiers. Sentiment classifications were compared with human coding of the 250 comments, performed without access to the automated labels, yielding Cohen’s κ = 0.533 and 70.0% agreement; emotion classifications are treated as exploratory. Neutral sentiment was most common (40.4%), followed by negative (33.2%) and positive (26.4%). Qualitative analysis developed five appraisal tension categories, with promise versus performance being the most frequently coded. Thirty-one comments in the qualitative sample (12.4%) received a tension label. This proportion does not estimate psychological ambivalence, although selected comments expressed simultaneous favorable and unfavorable evaluations. Annual sentiment varied non-monotonically, including a rebound in positive sentiment in 2023. A second sentiment classifier produced highly correlated annual series for 2021–2025, despite differences in estimated proportions. Expectation–disconfirmation theory provides an interpretive lens for perceived promise–performance discrepancies rather than a tested causal mechanism. The findings highlight the credibility of advertising promises and suggest that advertisers distinguish current capabilities from future possibilities.
1. Introduction
In May 2021, a digital Gucci handbag sold on Roblox for roughly US$4115, more than the physical version cost in a boutique, as part of a branded experience that drew close to twenty million visitors [1]. Nike soon opened Nikeland and a dedicated Web3 platform. When Facebook renamed itself Meta in October 2021 and committed billions to an immersive successor to the mobile internet, the message to marketers was clear: the next great advertising medium would be experiential, three-dimensional, and immersive, with analysts projecting metaverse commerce worth trillions by 2030 [2]. Advertising has always followed its audience, and the metaverse, the convergence of virtual and augmented reality into persistent, shared, immersive environments [3,4,5], was framed as the next such migration, with advertisements embedded within, rather than interrupting, the experience. The promise drew luxury houses, sportswear giants, and fast-food chains to stake virtual territory [6]. However, the digital handbag that outsold its physical counterpart was later reported to have lost much of its value, exposing a potential gap between what immersive advertising promised and what the technology delivered. This raises the following questions: How do ordinary consumers experience metaverse advertising? And how does that experience change as hype rises and falls?
These questions are difficult to answer using the existing literature. Metaverse scholarship has been predominantly conceptual rather than consumer-grounded [3,4,6,7]. Empirical work on immersive marketing has largely foregrounded the positive route from immersion to engagement [8,9], while the few studies examining ambivalence suggest that it is an important aspect of consumer responses [10]. Meanwhile, the literature on user-generated content often treats sentiment as a measure of overall valence, potentially obscuring the emotions, structures, targets, and temporal dynamics of consumer responses [11,12]. Consequently, large-scale evidence on how consumers experience metaverse advertising and how these experiences evolve over time remains limited. The present study examines how commenters evaluate metaverse advertising, which appraisal tensions appear in their responses, and how classified sentiment and emotion vary across the observed years. It draws on 5924 advertising-relevant comments collected primarily from YouTube, supplemented by Reddit, during 2020–2026. The analysis combines qualitative coding with automated sentiment and emotion classification.
RQ1.
What sentiment and emotion patterns are expressed in the sampled comments concerning metaverse advertising?
RQ2.
Which appraisal tensions characterize comments concerning metaverse advertising?
RQ3.
How do sentiment and emotion classifications vary across the observed years?
The study develops an interpretive typology of appraisal tensions, with promise versus performance emerging as the most frequently coded category in the qualitative sample. It also examines patterns in sentiment and emotion classifications and their variation over time. Expectation–disconfirmation theory provides an interpretive lens for understanding perceived discrepancies between expectations and actual experiences. The user comments further reveal mixed responses to metaverse advertising, although the analysis does not establish the prevalence of a single dominant form of ambivalence or a general tendency toward alienation.
2. Literature Review and Theoretical Background
This section defines metaverse advertising, reviews the positive bias in consumer response research, introduces ambivalence as an underexamined response, situates the study within computational UGC analysis, and sets out expectation–disconfirmation theory.
2.1. The Metaverse and Metaverse Advertising
The term metaverse, coined by Neal Stephenson in his 1992 novel Snow Crash, denotes a persistent, shared, three-dimensional virtual space in which people interact through avatars [2]. Contemporary treatments converge on its defining attributes, i.e., the space is shared, immersive, real-time, spatial, and digitally mediated, blending virtual and augmented reality with blockchain-based digital assets and social presence [1,3]. Technical surveys treat it as an emerging convergence some distance from full realization [4,5], whereas synthetic accounts characterize it as a persistent universe of shared experience [6]. This gap between aspiration and the technical reality is the condition under which disconfirmation may arise. For marketing, the shift is economic as much as experiential: the metaverse introduces native systems of digital ownership through which brands sell virtual goods and stage branded experiences [7,8]. Metaverse advertising is brand communication embedded within these environments [9,10]: the brand becomes the environment the consumer occupies. Much of this literature remains conceptual, repeatedly calling for consumer-grounded empirical evidence of how advertising in these environments is actually received.
2.2. Immersive Advertising and the Positive Bias in Consumer Response Research
Empirical work on consumer behavior in immersive settings has a markedly positive center of gravity rooted in accounts of flow [11,12] and telepresence [13,14] and extended by work showing that presence enhances brand attitude and purchase intention [15,16,17]. The metaverse literature inherits this: VR retail studies model a route from immersion through flow to purchase intention [18] and a review of forty-eight studies confirmed a concentration on positive states with little attention to ambivalence [19]. Advertising research mirrors this [10,20]. Yet the same tradition records immersion’s costs: advertising value theory frames a tradeoff between entertainment and information benefits versus irritation [21,22], and attitude-toward-the-ad research shows that a medium maximizing an ad’s visibility also maximizes its irritation [23].
2.3. Consumer Ambivalence as a Distinct Response
Ambivalence, distinct from indifference or moderate sentiment, is the phenomenon of holding both positive and negative evaluations simultaneously and is grounded in the premise that inconsistent cognitions create psychological discomfort [24] and that positive and negative evaluations are separable dimensions rather than opposite ends of one scale [25]. The evaluative space model formalizes this separability [26], and the gradual threshold model shows that coexisting reactions produce a behaviorally consequential tension [27]. It is relevant for this study because ambivalent attitudes are more unstable and thus are more likely to be resolved through effortful processing of information in order to cope with the discomfort [28,29]. Ambivalence recurs in the consumption experience: according to [30], expectation–reality discrepancy is one of the key antecedents of consumer ambivalence. Moreover, the metaverse is an arena for ambivalence, since, as was found by [31], as the realism of virtual influencers grows, so do the feelings of coolness and eeriness.
2.4. User-Generated Content and Computational Text Analysis
Studying spontaneous consumer response at scale requires unsolicited, naturalistic, longitudinal data. User-generated content meets these criteria within a mature eWOM literature showing that online evaluations affect sales [32,33,34]. Automated text analysis has inferred market structure [35], linked UGC sentiment to firm value [36,37], and modeled sentiment across platforms [38], where fine-grained analysis outperforms coarse valence [39]. Comments are analyzed as evaluative text rather than situated interactional practice.
2.5. Theoretical Framework: Expectation–Disconfirmation Theory
Expectation–disconfirmation theory (EDT) provides an interpretive lens for examining perceived discrepancies between advertising promises and performance. The theory relates satisfaction and dissatisfaction to comparisons between prior expectations and perceived performance [40], with subsequent applications to technology continuance through the expectation–confirmation model [41]. In this study, EDT helps us to interpret comments that contrast advertised possibilities with what commenters believe the technology delivers. It does not imply that all commenters used the advertised platforms or that their assessments establish actual technological performance. Because prior expectations, verified use, and subsequent satisfaction were not directly measured, the analysis does not test an expectation–disconfirmation mechanism. Similarly, annual sentiment differences are not treated as evidence of collective or market-level disconfirmation.
2.6. Synthesis of the Research Gap
Three strands converge to create a single gap: metaverse marketing scholarship is thin in consumer-grounded evidence [2,42]; immersive marketing research foregrounds the positive immersion-to-enjoyment route [19,43]; and the UGC literature treats sentiment as a single valence [20,44]. No prior study combines a large naturalistic corpus, fine-grained sentiment and emotion analysis, interpretive identification of ambivalence’s structure, and an analysis of temporal variation in the collected comments. The present study addresses this combined gap.
3. Research Methodology
3.1. Research Design and Philosophical Stance
The study employs an abductive, mixed-methods computational content analysis of naturally occurring comments, selected because the research questions concern meaning best recovered from unsolicited text and because measuring temporal dynamics requires classification beyond manual coding. Inductive thematic analysis came first, followed by expectation–disconfirmation theory as an interpretive lens applied to the dominant tension. Two analytic streams were applied in sequence: the qualitative stream surfaced the appraisal tensions and codebook, while the quantitative stream classified every comment for sentiment and emotion. Target assignments were generated separately using keyword-based rules and were not used for quantitative target comparisons.
3.2. Data Collection
Data were gathered primarily from YouTube comment sections, supplemented by Reddit discussion threads concerning metaverse advertising and marketing. YouTube was chosen on the basis of the availability of comments on its video content and the facility to time-stamp them. The complete comments collected for the analysis amounted to 5781 YouTube comments (97.6%%) and 143 Reddit comments (2.4%). Thus, the research mainly focuses on the comments collected from YouTube, while Reddit is a secondary source of material, and does not serve as an equal comparison of the two platforms. The collection period started in March 2020 and ended in June 2026, including both limits mentioned above without any complete year of data collection.
YouTube comments were retrieved programmatically through the YouTube Data API v3. A seed set of relevant videos was identified using metaverse advertising search terms (e.g., “metaverse advertising,” “metaverse marketing,” “brand in the metaverse,” “Meta Horizon Worlds,” “Roblox brand,” “Nikeland,” “Gucci Roblox”), and top-level comments and replies were extracted together with their time-stamps. Reddit data were collected through PRAW (https://praw.readthedocs.io/, accessed on 27 August 2026) and Pushshift (https://github.com/pushshift/api, accessed on 27 August 2026) from metaverse- and marketing-related subreddits using the same seed term set. Both streams were merged into a single time-stamped corpus for cleaning and analysis.
3.3. Data Cleaning and Corpus Construction
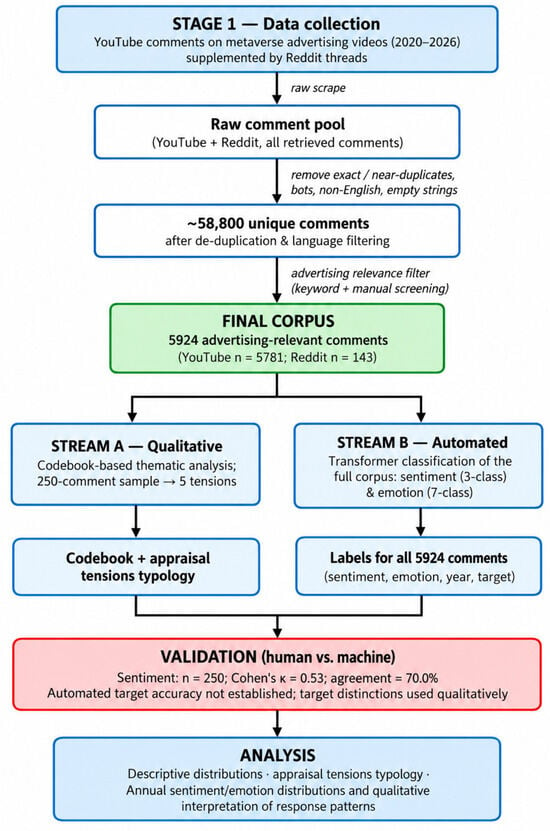
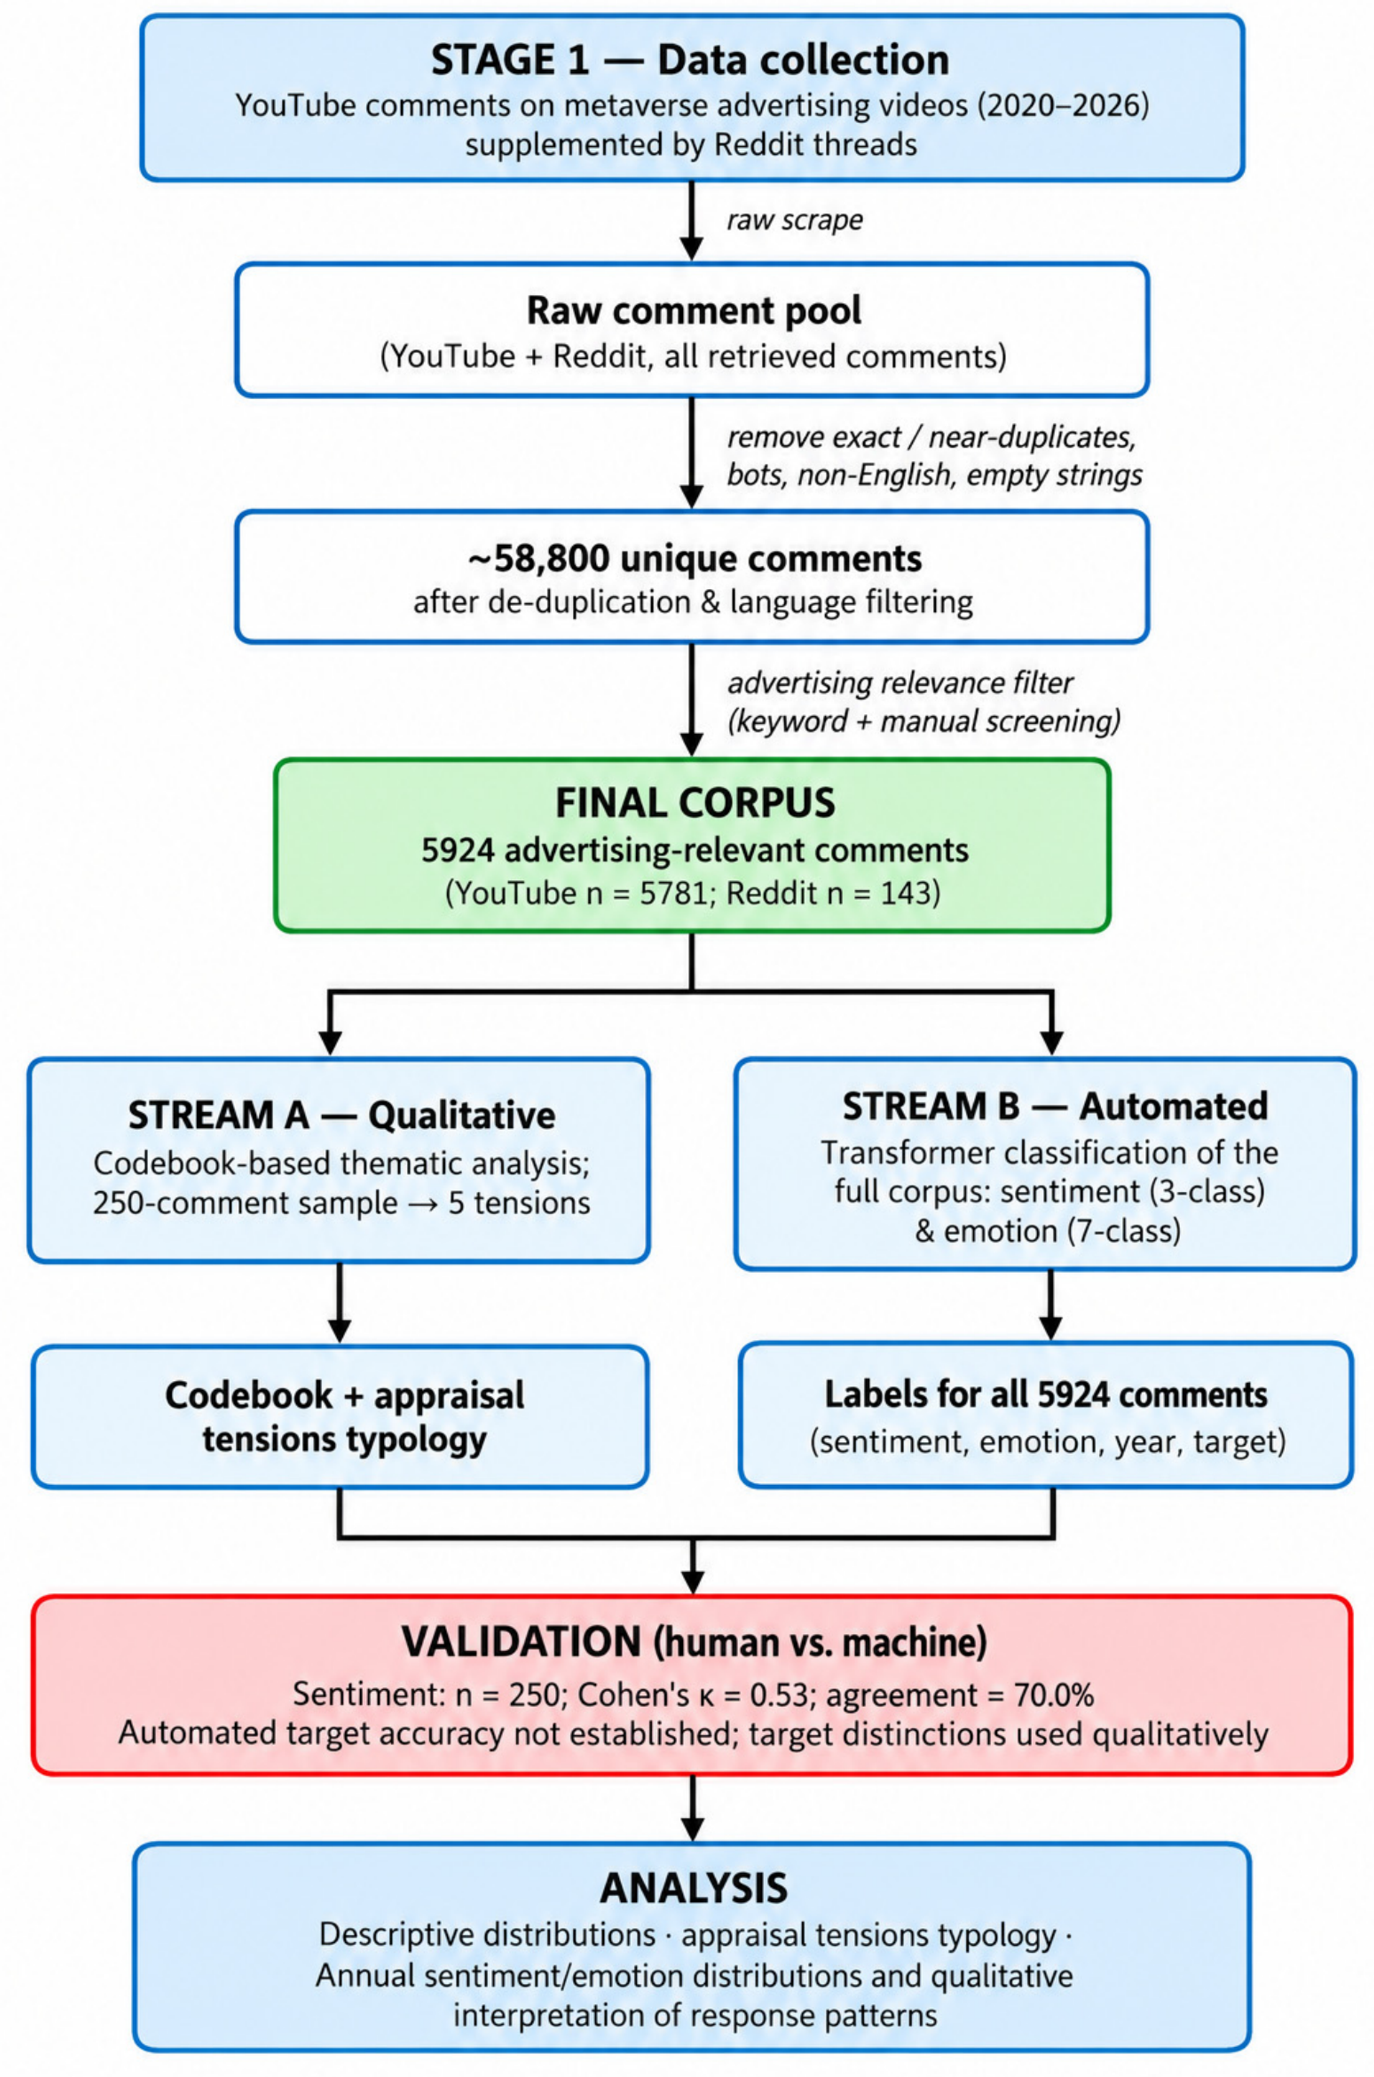
Cleaning removed duplicates, bot-generated content, non-English comments, and blank entries, yielding approximately 58,800 unique comments. A second, advertising relevance phase then applied a two-stage filter: (i) an automated keyword filter retaining comments referring to metaverse advertising, branded activity, or the marketing use of the underlying technology, followed by (ii) a manual relevance review by the first author to remove false positives (e.g., comments using “brand” in a non-marketing sense). This yielded a final corpus of 5924 advertising-relevant comments (YouTube “n” = 5781, 97.6%; Reddit n = 143, 2.4%), spanning 9 March 2020 to 22 June 2026, as summarized in Figure 1.
Figure 1.
Data collection, cleaning, and analysis pipeline.
The population of interest comprises contributors to public English-language discussions of metaverse advertising and branded activities on YouTube and Reddit during the study period. The accessible sampling frame was restricted to the videos and Reddit discussions identified through the study’s collection procedure. The corpus is a non-probability sample of textual contributions, rather than a representative sample of consumers or verified metaverse users. The majority, 97.6%, come from YouTube, while the remaining 2.4% come from Reddit. The conclusions are therefore primarily based on the content of the discussions on YouTube, which may not be representative of how people discuss their views on other platforms. The results may also have been influenced by the use of English-language comments, as well as the selection of videos and internet sources, and by users’ own decisions to post comments.
Comments about platforms, branded activities like Roblox, Meta/Horizon Worlds, and Fortnite are included in the corpus. Some comments refer to a particular platform, but not every comment. The references are used to help explain the contents of the corpus, but they are not a formal structure that sorts comments into platform types. As a result, it is not possible to reliably categorize comments under an overall metaverse context or under a specific platform.
Moreover, the advertising discussed herein includes a range of product categories that have a diverse level of consumer engagement. High-involvement luxury products are the most prominent example (10.9% of reactions, where Gucci is the most notable brand present on the platform), along with tech and digital brands (8.0%, predominantly Meta), fast-moving consumer goods and food brands like Coca-Cola, Wendy’s, and McDonald’s (2.3%), and sportswear brands like Nike and Adidas (1.2% of the comments). This diversity is of analytical importance: responses towards a high-involvement luxury product and low-involvement fast-moving consumer goods placement do not need to be the same, and the level of involvement may have an impact on the intensity of the ambivalent responses, which will be dealt with in the limitations.
During revision, we examined retained source files and available public account metadata to characterize contributors where feasible. Original YouTube comment identifiers were recovered for 2269 corpus records. Metadata retrieval provided usable channel age information for 2219 comments associated with 2191 distinct channels, covering 38.4% of the 5781 YouTube comments. For each channel, age was calculated based on its earliest usable linked comment. The median was 4.01 years, and the middle 50% of values ranged from 1.13 to 10.16 years. The data retrieved showed that 2166 channels had one comment, 23 had two, 1 had three, and another had four. These numbers are for the comments contained within the collected dataset and do not provide information on commenting frequency on these channels throughout their history. Normalized text and time-stamps were used to match the 143 Reddit records to their original source records: 97 came from r/metaverse and 46 from r/oculus. Similar information on account age and past activity was not available for Reddit users. The YouTube metadata covered comments posted between 2022 and 2025, so they reflect only part of the collected data and do not include every contributor or year covered by the study. Account identifiers distinguish channels rather than verified individuals; the total number of unique people contributing to the corpus remains unknown.
3.4. Stream A: Codebook-Based Thematic Analysis
The qualitative strand preceded [45] the full-corpus computational analysis and used a randomly selected sample of 250 comments drawn from the corpus for codebook-based thematic analysis.
The first author manually coded the sample using fields for emotion, target, and tension, supported by interpretive notes. These dimensions structured the analysis, while additional tension labels were developed through engagement with the comments. Related first-order labels were grouped into five higher-order appraisal tensions.
A second human coder independently coded a 50-comment subset without access to the first author’s labels. Disagreements were reviewed using a reconciliation worksheet covering 38 comments. The coders documented agreed interpretations and decision rules to refine the codebook. They subsequently coded a fresh set of 40 comments independently using the revised rules. Independent coding, reconciliation, and reassessment were treated as distinct stages [46]. Category-specific intercoder agreement is reported in Section 3.6.
The 250-comment sample supported the development and illustration of the appraisal tension typology. Its size is not treated as statistical proof of thematic saturation. Frequencies describe the coded sample and are not presented as population estimates for the full corpus. Tension labels encompass both perceived discrepancies and mixed evaluations; they are not automatically treated as evidence of simultaneous positive and negative attitudes.
The qualitative coding was conducted by human researchers. Sentiment and emotion classification of the full corpus was performed separately using the pretrained transformer models described in Section 3.5. Human agreement on individual coding categories does not itself validate the automated classifications or establish agreement on the higher-order tension typology.
3.5. Stream B: Automated Sentiment and Emotion Classification
The quantitative stream classified all 5924 comments using two pretrained transformer models implemented through Python’s Hugging Face Transformers library. Sentiment classification used cardiffnlp/twitter-roberta-base-sentiment-latest [47], assigning negative, neutral, or positive labels. Although “twitter” appears in the checkpoint name, the study corpus consists of YouTube and Reddit comments. Emotion classification used j-hartmann/emotion-english-distilroberta-base, assigning one of seven labels: anger, disgust, fear, joy, neutral, sadness, or surprise. Each classifier assigned the highest-scoring category to each comment, without an additional confidence threshold. Publication year was retained for temporal analysis. Automated target assignments were generated separately using keyword rules, as described in Section 4.4, and are not used for quantitative target comparisons. The emotion classifications were not independently validated against human coding in this corpus and are interpreted as exploratory model outputs. Temporal analysis summarized sentiment classifications by calendar year, reporting annual sample sizes and within-year percentages with pointwise 95% Wilson confidence intervals. An exploratory Pearson chi-square test assessed the association between year and sentiment category for 2021–2025, excluding the sparse 2020 observations (n = 11) and the incomplete 2026 period, which ended on 22 June. Cramér’s V summarized the association’s magnitude. These analyses describe variation within the collected corpus; the confidence intervals and test assume independent comments and do not account for clustering within videos or threads, changes in source composition, or classification error. “Both classifiers were rerun on the same 5924 comments in Google Colab (https://colab.research.google.com/, accessed on 27 August 2026) using a documented environment with Python 3.13.15, Transformers 4.57.6, and PyTorch 2.11.0+cpu.”
No additional fine-tuning was performed. Inference used CPU execution, float32 precision, evaluation mode, and batches of 32 comments. Inputs were right-truncated to 256 tokens, including special tokens, and padded to the longest sequence within each batch. Forty-three comments required truncation for each classifier. Each model assigned the category with the highest softmax score, without an additional confidence threshold. The sentiment checkpoint revision was 3216a57f2a0d9c45a2e6c20157c20c49fb4bf9c7, and the emotion checkpoint revision was 0e1cd914e3d46199ed785853e12b57304e04178b. These settings document the rerun and do not reconstruct the original execution environment. The reported tables and figures retain the original saved classifications. Relative to those outputs, the documented rerun reproduced 99.73% of sentiment labels and 99.31% of emotion labels. The largest absolute difference in annual sentiment proportions was 0.31 percentage points. These comparisons assess computational stability rather than accuracy against human judgement.
To assess sensitivity to sentiment classifier choice, the full corpus of 5924 comments was also classified using j-hartmann/sentiment-roberta-large-english-3-classes. Agreement with the primary classifier was 76.82% (Cohen’s κ = 0.6425). Across 2021–2025, the annual sentiment proportions were highly correlated between classifiers: negative, r = 0.9841; neutral, r = 0.9734; and positive, r = 0.9377. Each correlation was based on five annual observations and is interpreted as exploratory. These results support broadly consistent temporal patterns across the two classifiers, although the estimated sentiment proportions differed. This comparison assesses robustness to classifier choice and does not replace validation against human judgement.
We additionally conducted a worst-case classification error sensitivity analysis. Hypothetical error budgets of 1%, 2%, 3%, 5%, 10%, and 30% allowed up to the corresponding proportion of comment labels, rounded down to whole comments, to change arbitrarily. We calculated bounds on the overall negative–positive sentiment difference and on the increase in positive sentiment between 2022 and 2023. Error budgets applied to the full corpus for the overall comparison and separately within each year for the temporal comparison. We also calculated the minimum number of label changes required to eliminate or reverse the overall ordering. These deterministic bounds assess sensitivity under hypothetical errors; they are not confidence intervals. The 30% scenario does not establish a corpus-wide error rate.
To assess the influence of the small Reddit supplement, we recalculated overall sentiment percentages and annual sentiment percentages for 2021–2025 using only the 5781 YouTube comments, retaining the original saved sentiment labels. We compared these percentages with those from the combined corpus. This analysis assesses sensitivity to including Reddit; it does not correct platform selection bias.
3.6. Reliability and Validation
Human coding reliability is distinguished here from validation of automated classifications against human judgements. For the qualitative coding, an initial independent double-coding round identified disagreements in emotion and target assignments. The coders discussed these disagreements and refined the codebook. They then independently coded a fresh set of 40 comments using the revised rules.
In this second round, Krippendorff’s alpha was 1.00 for target classification and approximately 0.05 for the nine-category emotion classification. These results indicate consistent application of the target categories within this sample but substantial disagreement over fine-grained emotion labels. The target coefficient does not establish agreement on the tension typology or validate the automated target assignments applied to the full corpus.
Target distinctions are therefore retained for qualitative interpretation rather than used to establish a quantitative hierarchy of criticism across advertisements, brands, and technology. Fine-grained emotion results are reported as automated classifications; low agreement between human emotion coders does not itself establish the accuracy of the emotion model.
The first author, who also coded this sample for the qualitative analysis, independently assigned positive, neutral, or negative sentiment labels without access to the automated classifications. Comments were linked to the original corpus through their identifiers and full text. Comparison with the original saved automated sentiment labels yielded Cohen’s κ = 0.533 and 70.0% agreement (175/250), with a macro-averaged F1 score of 0.697. Class-specific precision, recall, and F1 scores are reported in Table 1, and the confusion matrix is reported in Table 2. These results indicate imperfect agreement and warrant caution when interpreting automated sentiment patterns. This assessment concerns sentiment only and does not validate the emotion classifications.
Table 1.
Sentiment classification performance against human coding.
Table 2.
Confusion matrix for automated sentiment classification against human coding.
3.7. Ethical Considerations
This research analyzes publicly available online comments, with attention paid to privacy concerns in online research [48]. To reduce the risk of identifying individual commenters, illustrative excerpts are presented as meaning-preserving paraphrases rather than verbatim quotations, and usernames, profile links, and comment URLs are omitted from the manuscript. The accompanying identifiers are internal research codes. Public accessibility does not eliminate privacy concerns.
4. Findings
This section presents the corpus overview, sentiment and emotion distributions, qualitative appraisal tensions, interpretive role of evaluation targets, annual classification patterns, and illustrative responses to appraisal tensions.
4.1. Corpus Overview
The final corpus comprises 5924 advertising-relevant comments, mostly from YouTube (Table 3), spanning 2020 to 2026.
Table 3.
Corpus composition.
4.2. Sentiment and Emotion Distributions
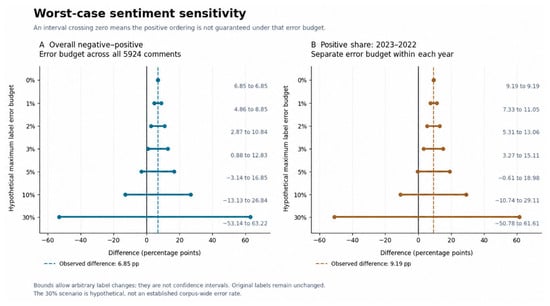
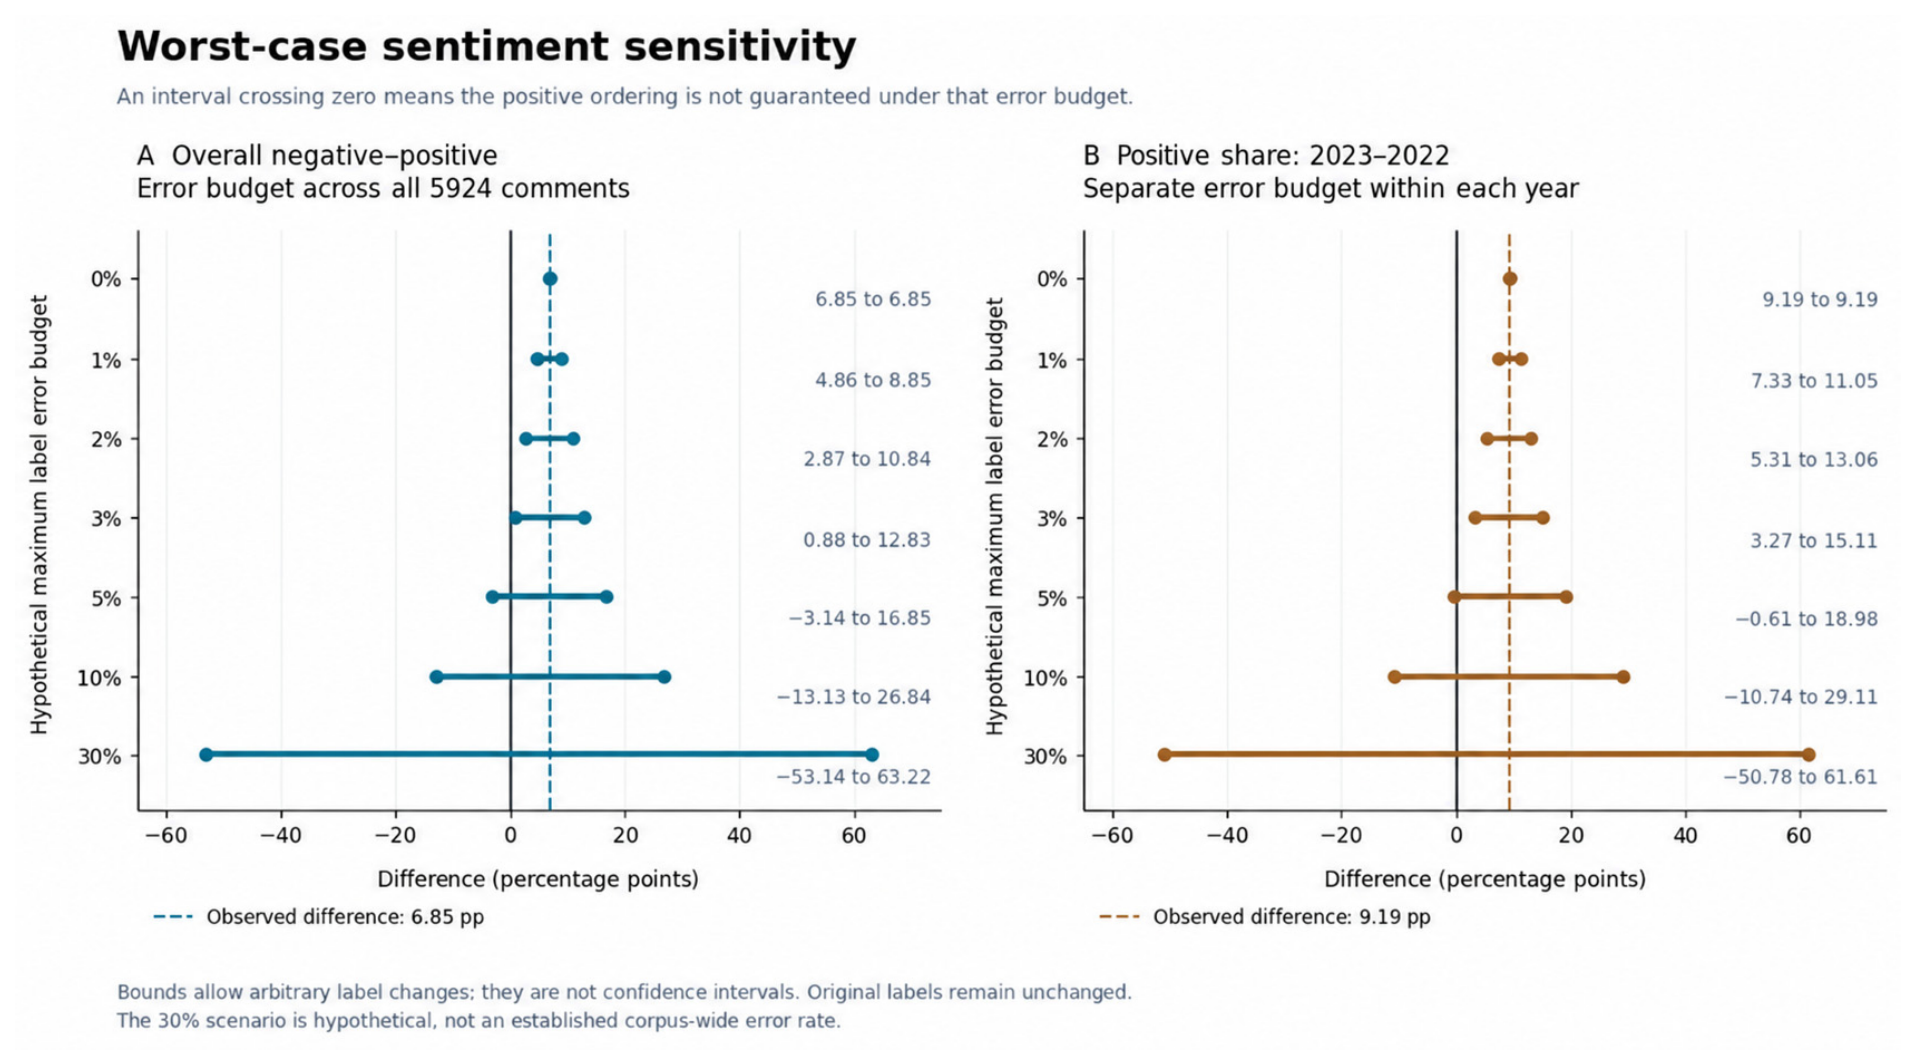
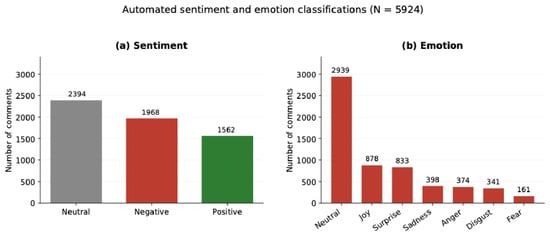
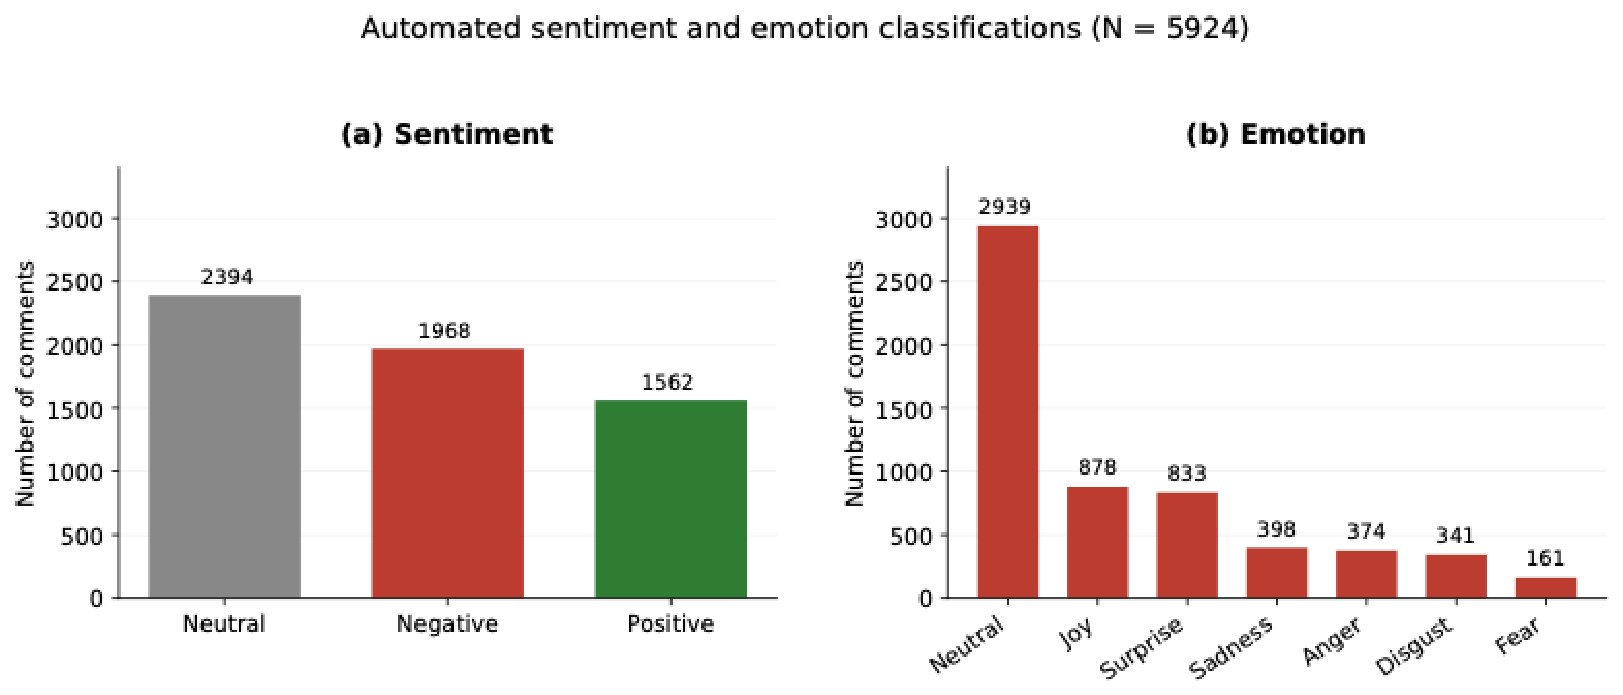
The sentiment classifier assigned neutral labels to 2394 comments (40.4%), negative labels to 1968 (33.2%), and positive labels to 1562 (26.4%). Neutral was therefore the largest category, while negative classifications outnumbered positive classifications by 406 comments (6.85 percentage points). Under a 3% worst-case error budget, the minimum difference remained positive at 0.88 percentage points. However, reassigning 203 negative classifications to positive would eliminate the difference, and 204 such changes (3.44% of the corpus) would reverse it. At a 5% error budget, the possible difference ranged from −3.14 to 16.85 percentage points. The observed ordering therefore describes the automated classifications but is sensitive to adverse classification errors (Figure 2).
Figure 2.
Worst-case sentiment sensitivity analysis. (A) Bounds on the overall negative–positive sentiment difference under corpus-wide error budgets. (B) Bounds on the 2022–2023 positive sentiment difference under separate error budgets within each year. Intervals represent deterministic bounds under hypothetical label changes, not confidence intervals. Error budgets do not estimate actual classification error rates.
The emotion classifier assigned joy to 878 comments (14.8%), surprise to 833 (14.1%), and sadness, anger, disgust, or fear to a combined 1274 comments (21.5%). Among the 833 surprise-labeled comments, 272 were classified as negative in sentiment (32.7%), 313 as neutral (37.6%), and 248 as positive (29.8%). These distributions describe automated model outputs and are interpreted as exploratory findings rather than validated measures of emotion.
The distribution of positive and negative classifications across comments reflects aggregate sentiment heterogeneity, not individual ambivalence. The qualitative analysis considers within-comment ambivalence only where positive and negative evaluations are expressed together. Neither the overall sentiment distribution nor the tension category frequencies establish the prevalence of individual ambivalence across the full corpus. The cross-tabulation in Table 4 shows that surprise classifications occurred across all three sentiment categories. Figure 3 presents the distribution of automated sentiment and emotion classifications.
Table 4.
Cross-tabulation of automated emotion and sentiment classifications (n = 5924).
Figure 3.
Distribution of automated sentiment and emotion classifications.
4.3. Five Appraisal Tensions in the Coded Comments
This study explores evaluative tensions in comment discourse instead of directly measuring psychological ambivalence. Expressed ambivalence is a positive and negative assessment that is expressed in a single comment on metaverse advertising or brands and technologies. These evaluations may concern different aspects or targets, so their coexistence does not necessarily establish conflicting attitudes toward the same object. The thematic analysis developed five broader appraisal tension categories, summarized in Table 5. These include mixed evaluations as well as contrasts between advertised expectations and perceived performance that do not necessarily indicate ambivalence. At the corpus level, the categories describe recurring discourse patterns; the distribution of positive and negative evaluations across separate comments represents aggregate sentiment heterogeneity. Within-comment mixed evaluations may suggest psychological ambivalence, but commenters’ internal states and their prevalence cannot be established from these data.
Table 5.
Five appraisal tension categories developed from the qualitative sample.
Fifteen first-order tension labels were grouped together to form the five higher-order tensions. as shown in Table 6 The coding worksheet has 31 tension-labeled comments out of 250 comments commented (12.4%). These tags reflect various types of evaluative tension such as the discrepancies between expectations of advertising promises and performance, and, in some of the comments, express positive and negative evaluations. Positive and negative attitudes are not always simultaneous in a tension label. The typology thus refers to the patterns in the coded discourse, and the explicit mixed evaluations offer illustrative evidence of the ambivalence in a subset of comments.
Table 6.
Derivation of the five higher-order tensions from first-order codes.
The highest number of tensions coded in this sample were in the area of promise versus performance. This involved actual differences between the representations and the experience or capabilities of commenters. This can be expressed as disappointment with no accompanying positive assessment and thus not necessarily as ambivalence. Praises using mixed evaluation also point out something good about an advertisement’s music or visual presentation but mention something bad about the message, or something good about the technologies but something bad about the message. The other tensions are those that are observed in the sample and have not been established as a statistically significant hierarchy.
4.4. Qualitative Interpretation of the Target of Evaluation
The qualitative coding distinguished evaluations concerning the advertisement, the brand or company, and the underlying technology. This distinction helped identify what a comment was evaluating when interpreting the appraisal tensions. It is used here as an interpretive dimension rather than as evidence that criticism predominantly concerned one target.
The original full-corpus target assignments were generated using keyword rules. Brand keywords took precedence over technology keywords, and comments matching neither set were assigned to the advertisement category. These operational rules differ from contextual human interpretation: a company name can occur in a comment about a technological problem, and the absence of a brand or technology keyword does not establish that a comment evaluates the advertisement itself.
Accordingly, the automated target categories are not used to establish comparative levels of criticism across advertisements, brands, and technology. Human agreement on target coding in a separate coding exercise is distinguished from the accuracy of these full-corpus automated assignments. The qualitative target distinction is retained to contextualize the thematic interpretation without asserting a corpus-wide hierarchy of targets.
4.5. Annual Variation in Sentiment
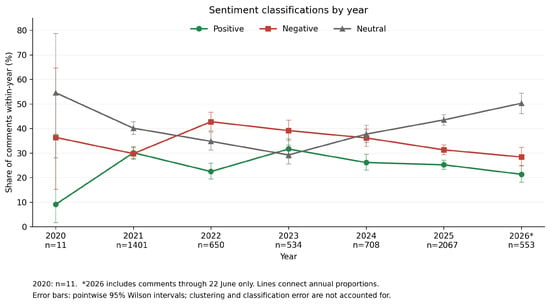
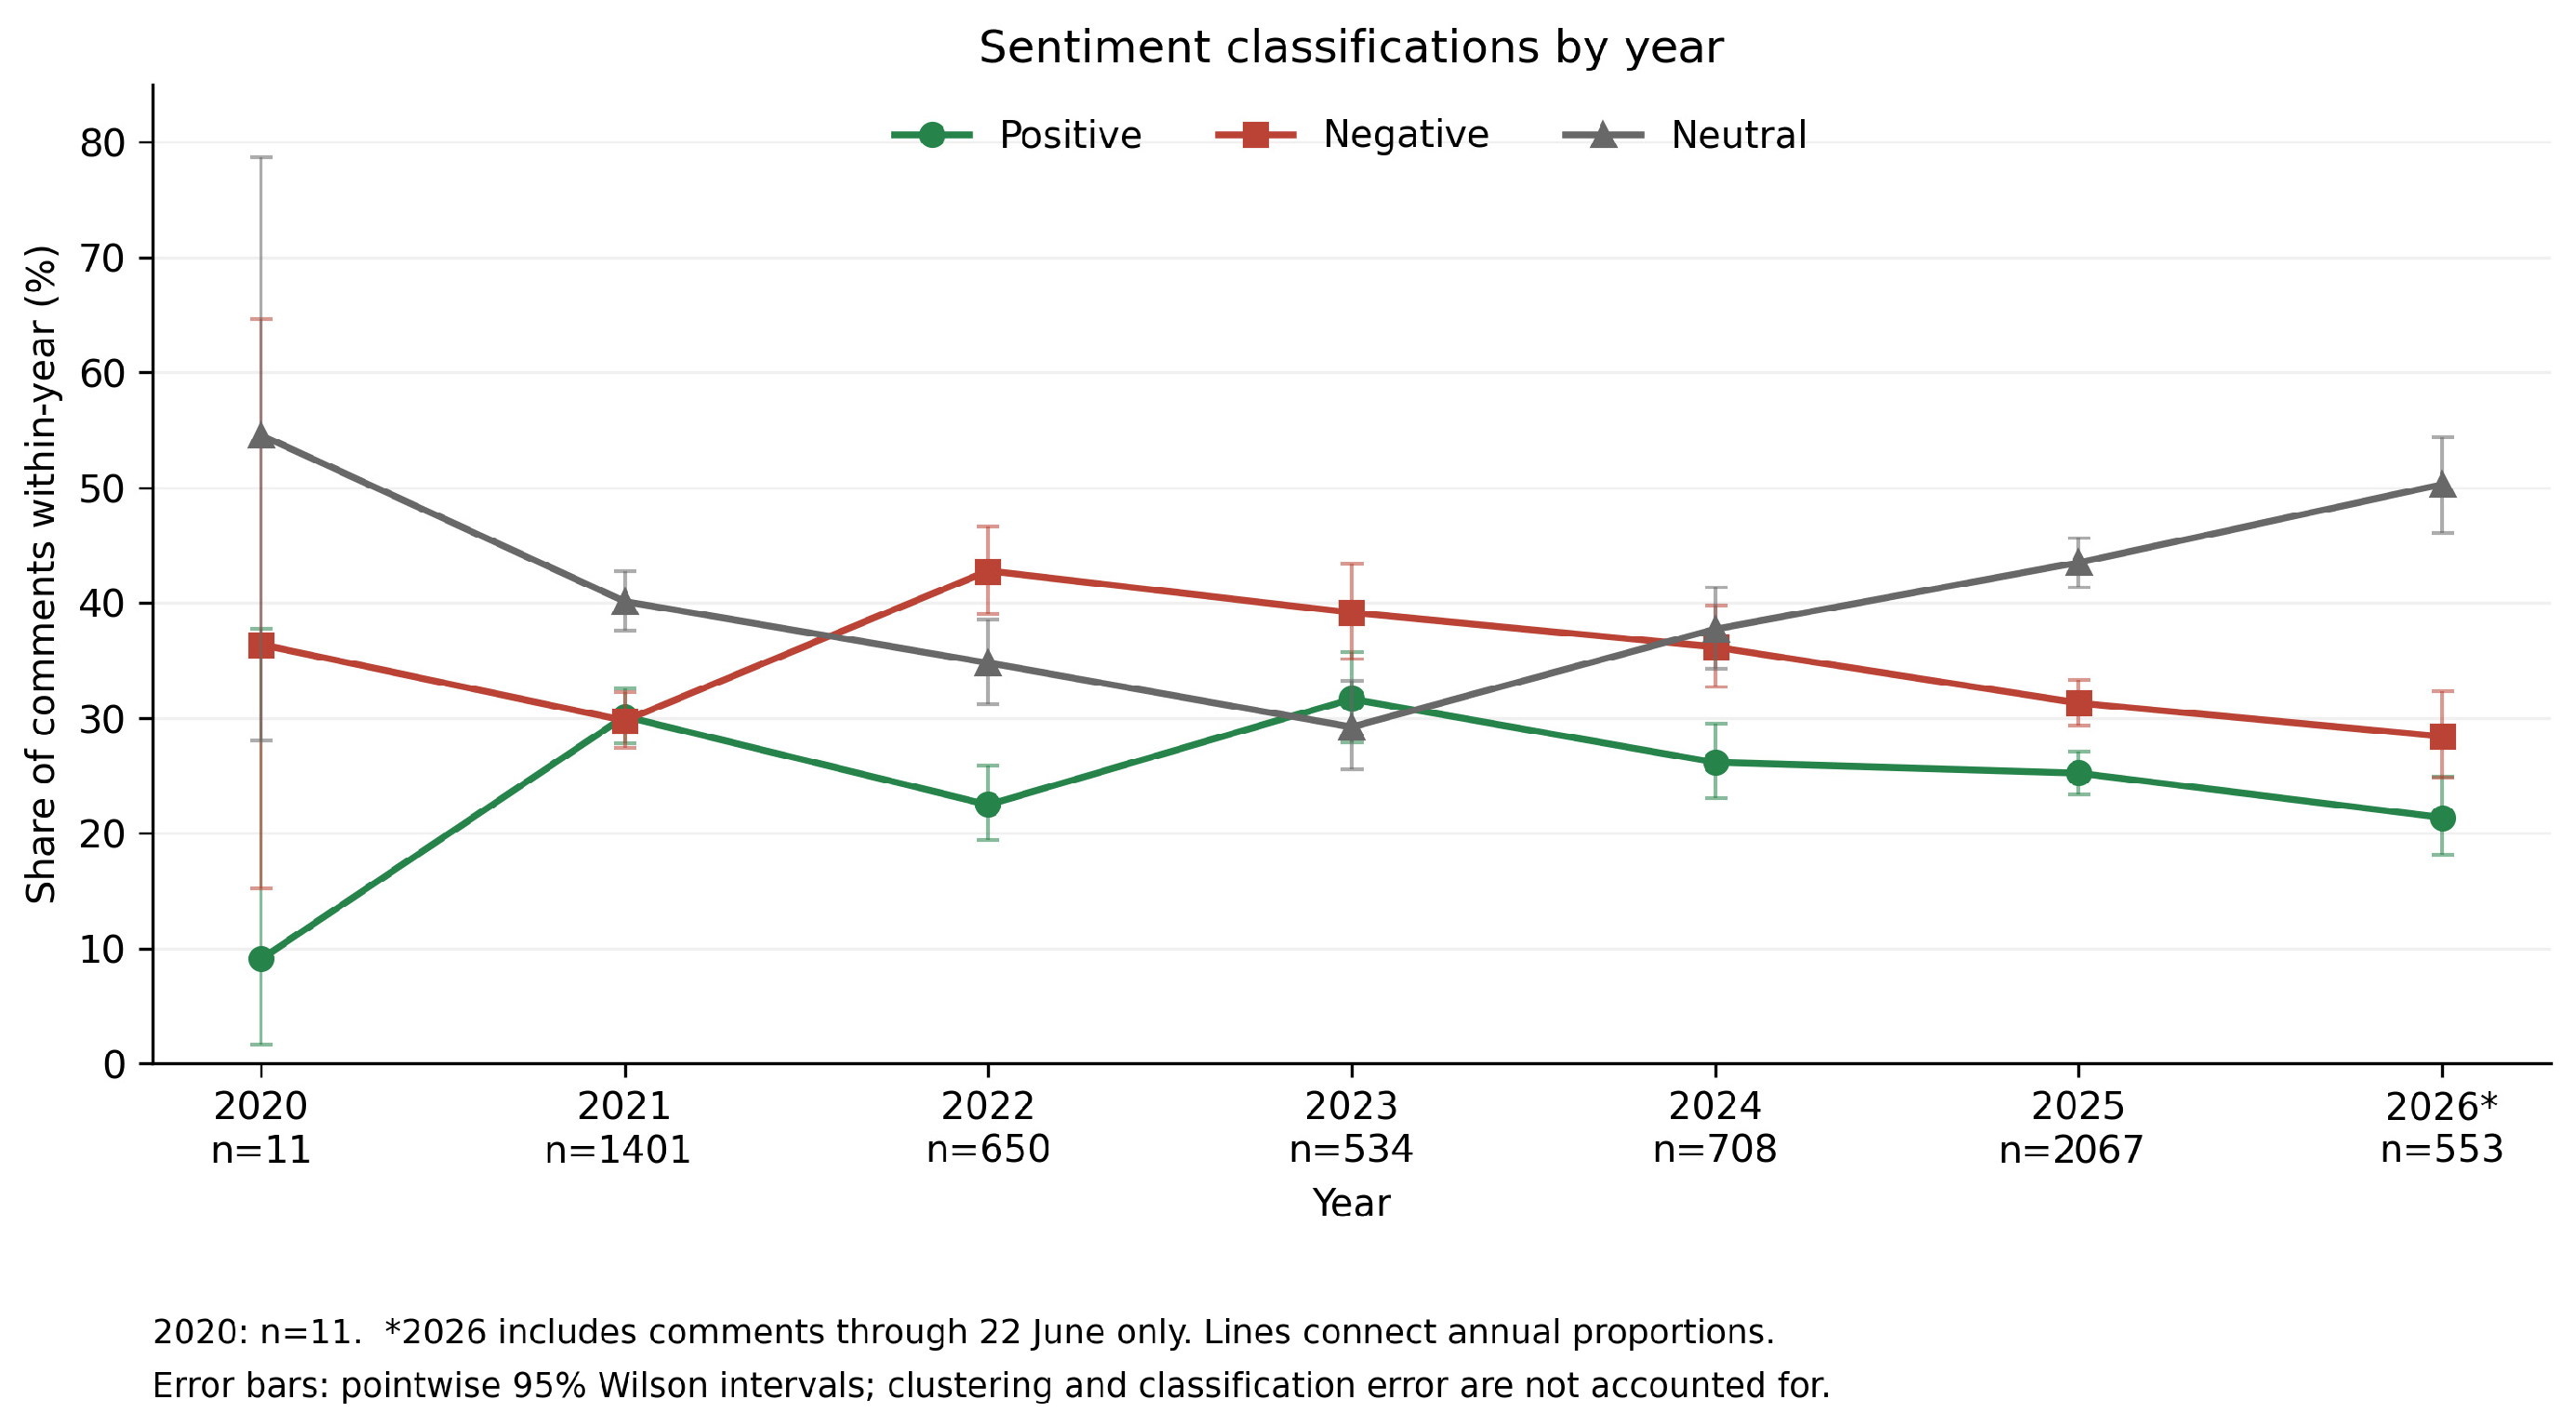
The annual distribution of automated sentiment labels varied non-monotonically across the observation period. Negative sentiment had its highest observed share in 2022 (42.8%). Positive sentiment increased from 22.5% in 2022 to 31.6% in 2023, exceeding its 2021 share of 30.1% before declining to 26.1% in 2024 and 25.2% in 2025. This pattern shows that positive classifications did not follow a continuous decline after 2021. Positive classifications increased from 146/650 comments in 2022 (22.46%) to 169/534 in 2023 (31.65%). The rebound itself is sensitive to mistakes made while categorizing. The analysis does not prove that temporal comparisons are robust (see Figure 2). If we disregard Reddit, overall sentiment values were modified by just 0.2 percentage points at most. For the period of 2021–2025, the maximum absolute difference between YouTube-only sentiment values and those in a combined estimation was 1.14 percentage points. The change in the number of positive classifications was 9.62 percentage points for YouTube alone and 9.19 percentage points for the overall analysis over the year 2022–2023. Based on the indicated limitations of comparisons, it can be concluded that the influence of Reddit is insignificant compared to the strength of YouTube. However, this fact does not allow talking about representativeness. Boundary years should be treated carefully. In the 2020 sample, only 11 comments were left, and there was only 1 positive comment, making it impossible to indicate the starting point clearly. The 2026 data consist of the results only until 22 June, which explains the positive percentage of 21.3% and neutrality of 50.3%. To conduct an analysis without these extreme years, we disregarded 2020 and 2026 data and worked with the 5360 comments from 2021–2025. An exploratory Pearson chi-square test showed a link between both year and sentiment category: χ2(8) = 75.87, nominal p < 0.001, with Cramér’s V = 0.084. In addition, all expected cell frequencies were greater than five. This test studied the differences in composition from one year to another but does not show whether there is a continuous change, a hype cycle effect, or any impact of a particular industry event. The test together with confidence intervals assumes that comments are independent. However, since comments can be grouped within videos or threads, and sources can differ from year to year, these results should be treated with caution as general patterns regarding the whole dataset. Neutral classification itself does not imply psychological neutrality. Table 7 presents the annual sample sizes and sentiment proportions with 95% Wilson confidence intervals.
Table 7.
Year-wise distribution of automated sentiment labels with 95% Wilson confidence intervals.
4.6. Emotional Composition over Time
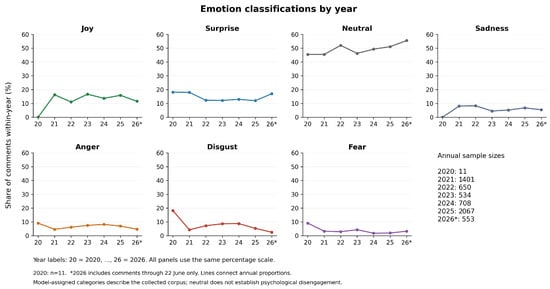
Figure 4 presents the annual sentiment classifications, while Figure 5 shows the annual proportions of model-assigned emotion categories. For instance, joy constituted 16.3 percent of the comments in 2021, then decreased to 11.1 percent of comments in 2022, then rose to 16.7 percent in 2023. Neutral was the most dominant emotion in each analyzed year. The exploratory classifications here are automated but they do not indicate the presence of psychological disengagement, disappointment, or a long-lasting hype cycle.
Figure 4.
Annual sentiment classifications with pointwise 95% Wilson confidence intervals.
Figure 5.
Annual proportions of model-assigned emotion categories.
4.7. Interpreting Commenters’ Responses to Appraisal Tensions
The qualitative reading suggested several ways in which commenters articulated their responses to appraisal tensions. One involved tentative openness: a commenter considered the technology’s future potential while questioning whether their own interest merely reflected attraction to novelty (MAC_0576). Another involved cynical dismissal: a commenter regarded the Meta identity as a promotional device rather than a convincing proposition (MAC_0620). A third involved distinguishing different aspects of a company’s conduct: a commenter acknowledged its investment in advancing virtual reality while expressing distrust of its data practices (MAC_0608).
These examples illustrate interpretive response patterns rather than psychological resolution or behavioral disengagement. In particular, MAC_0608 distinguishes technological contribution from data practices; it does not establish that the commenter blamed technological immaturity. These qualitative patterns do not establish a corpus-wide progression towards disengagement. The temporal analysis describes changes in sentiment proportions, and a neutral classification should not be interpreted as evidence of psychological disengagement.
5. Discussion
5.1. Principal Findings
This study examined responses to metaverse advertising in 5924 comments. Negative sentiment classifications were more common than positive classifications, although neutral was the largest category. The qualitative analysis of 250 comments developed five appraisal tension categories, with promise versus performance being most frequently coded within that sample. These tensions illustrate perceived discrepancies and, in some comments, coexisting positive and negative evaluations; they do not establish the prevalence of ambivalence across the full corpus. Annual sentiment varied non-monotonically: the positive share declined in 2022, rebounded in 2023, and declined thereafter through the observed portion of 2026. These temporal patterns do not establish a progression towards psychological disengagement or demonstrate that particular industry events caused the changes. Table 8 summarizes the research questions, analytical approaches, and principal findings.
Table 8.
Research questions, analytical approaches, and principal findings.
5.2. Reframing Metaverse Advertising Through Expectation–Disconfirmation Theory
Negative reactions in this corpus should not, by themselves, be interpreted as evidence of a metaverse-specific advertising problem. The study does not include a comparison with conventional advertising and therefore cannot establish whether the observed concerns are distinctive to metaverse contexts. Its qualitative contribution is to identify how some commenters articulate perceived tensions between advertising promises and technological possibilities.
This also qualifies what critical sentiment implies for effectiveness. Negative sentiment alone does not establish advertising ineffectiveness; the present study does not measure behavioral responses or campaign outcomes. The contribution is therefore not a claim that disliking advertising implies advertising ineffectiveness; rather, the qualitative analysis illustrates how some commenters express perceived discrepancies between advertising promises and technological performance, sometimes alongside positive evaluations. These accounts suggest that the credibility of advertising promises warrants attention. However, the study does not measure advertising effectiveness, changes in attention, or psychological disengagement. Neutral sentiment classifications should therefore not be interpreted as evidence that consumers became indifferent or that advertising lost its influence. The promise-versus-performance tension identified in the qualitative sample can be interpreted through expectation–disconfirmation theory [40,41]. Comments coded within this category describe perceived discrepancies between advertised possibilities and what commenters believe the technology delivers. This interpretation draws attention to the credibility of advertising promises alongside immersion and enjoyment. However, the study does not directly measure prior expectations, verify commenters’ product use experiences, or establish that disconfirmation caused the observed sentiment patterns.
The qualitative and temporal analyses therefore provide complementary evidence at different levels: the qualitative analysis illustrates how some commenters articulate perceived promise–performance discrepancies, whereas the temporal analysis describes changes in the sentiment composition of the collected corpus. The non-monotonic annual pattern does not establish a market-level process of collective disconfirmation or psychological disengagement. The study’s contribution lies in identifying appraisal tensions that can inform future tests of expectation–disconfirmation in metaverse advertising. Longitudinal research tracking individuals’ expectations, verified experiences, and subsequent evaluations would be needed to test the proposed mechanism directly.
Alternative explanations may also account for the observed temporal variation. Changes in media coverage, declining novelty, and shifts in the mix of channels and commenters could influence annual sentiment proportions. The present analysis does not distinguish these explanations from an expectation–disconfirmation interpretation. Accordingly, expectation–disconfirmation is used as an interpretive lens rather than an established explanation for the temporal pattern.
5.3. Directions for Testing the Proposed Interpretation
The qualitative findings motivate a tentative proposition for future research rather than establish a tested relationship: perceived discrepancies between advertising promises and experienced performance may be associated with more critical evaluations of metaverse advertising. Testing this proposition would require measuring expectations before exposure or use, subsequent experiences, and resulting evaluation. The temporal findings show fluctuations in classified sentiment. Whether improvements in technological performance influence subsequent responses remains an open question requiring longitudinal research with verified users.
5.4. Theoretical Implications
The study contributes to research on metaverse advertising by identifying appraisal tensions in naturally occurring comments alongside aggregate sentiment patterns. The qualitative categories draw attention to perceived promise and performance discrepancies and, in selected comments, coexisting favorable and unfavorable evaluations. They complement research on positive responses to immersive advertising without establishing that ambivalence characterizes most consumers. Expectation–disconfirmation theory explains the reasons for the apparent incongruities rather than providing a method tested using the data collected. The temporal analysis supplies proof of the non-linear behavior of the emotions attributed to different sentiments expressed in the gathered comments but does not prove the emergence of personal ambivalence or disproval at the market level. Combining qualitative interpretation with computational classification therefore supports complementary descriptions at different analytical levels, subject to the reported validation and sampling limitations.
5.5. Managerial Implications
The qualitative results indicate that it may be necessary for marketers to differentiate between current competences and future possibilities throughout the process while defining means and equipment necessary for advertised solutions. On the other hand, privacy and intrusion issues may highlight the importance of transparency of data handling processes and decisions made by users. Pretesting of a campaign may reveal whether people believe the advertising messages and consider the interactions with brand communications intrusive. These recommendations address concerns expressed in the comments; the study does not establish actual product performance or test their effects on trust, engagement, or purchasing.
5.6. Limitations
The corpus was created using various public English-language conversations, such as those from YouTube videos, and is not representative of the opinion of either consumers or actual metaverse users. The YouTube-only results do not eliminate platform, source selection, and self-selection bias. Information on the age of the channel covered 38.4% of the comments, based on data limited to the years 2022–2025; no systematic profile of the age of the Reddit accounts was produced. The reported counts of comments cover the activity only for the time it took to produce them. The information regarding the demographics, knowledge, product experience, or human identity of the participants is unfounded. The sample includes 250 qualitative records and provides no basis for establishing overall prevalence across the corpus.
For sentiment classification, there was imperfect agreement among humans (κ = 0.533; 70.0%), and results related to emotions have not been validated or confirmed. The agreement of humans with each other does not validate the automated outputs or the entire tension classification system. None of the orders from negative to positive or the increased positive sentiment from 2022 until 2023 is guaranteed. The error budgets are theoretical and do not represent the real error rates for the possible cases. Annual changes are available, meaning the presence of different reasons and causes for these changes. Error intervals gained by the confidence interval method and association method do not cover clustering errors and mistakes during classification. Sparse data from 2020 and lack of coverage from 2026 do not help in making comparisons. Data from the second classifier give support for a similar pattern but do not help make claims about the proper classification process.
6. Conclusions
Metaverse advertising presents possibilities for immersive brand experiences, but how audiences interpret its promises and express contrasting evaluations remains insufficiently understood. This study examined these responses through automated classification of 5924 online comments, collected primarily from YouTube with a small Reddit supplement, and qualitative analysis of 250 comments. Neutral sentiment was the largest automated category (40.4%), followed by negative (33.2%) and positive sentiment (26.4%). The observed negative–positive difference was 6.85 percentage points, but this ordering was sensitive to classification uncertainty. Reassigning 204 negative labels to positive (3.44% of the corpus) would reverse it. Under a hypothetical 5% worst-case error budget, the difference ranged from −3.14 to 16.85 percentage points. Negative classifications therefore exceeded positive classifications in the saved outputs, but this finding was not guaranteed under the tested adverse errors. Annual sentiment varied non-monotonically, including an increase in positive classifications in 2023. A second classifier produced broadly similar annual patterns for 2021–2025, although estimated proportions differed. The 2022–2023 positive sentiment increase was also not guaranteed under a 5% error budget applied separately within each year. These findings describe variation in classified comments without establishing effects of technological performance or industry events. This study makes two contributions: First, it shows how qualitative analysis complements sentiment counts by identifying five appraisal tensions in audience evaluations. Promise versus performance was the most frequently coded tension, while some comments expressed interest alongside doubt. The 31 tension-labeled comments (12.4% of the qualitative sample) included both perceived discrepancies and mixed evaluations; they do not establish the prevalence of psychological ambivalence. Second, the study explicitly assesses classification uncertainty, providing a transparent basis for interpreting headline sentiment proportions cautiously. For marketers, the findings suggest the value of distinguishing demonstrated capabilities from future possibilities and examining how audiences interpret advertising promises. These implications remain limited by the predominantly YouTube-based sample, unverified product use experiences, imperfect sentiment classification, and unvalidated emotion outputs. Expectation–disconfirmation theory offers an interpretive lens for the perceived promise–performance gaps. Future research should test this interpretation using measured expectations, verified experiences, and more balanced sampling across platforms.
7. Future Research Directions
Future explorations could evaluate the notions of expectation–disconfirmation by performing experiments that manipulate the promises made in advertisements and the satisfaction people have with the services received. The longitudinal studies conducted could assess the expectations crucial to the time before experiencing the product and the evaluation after its unsuccessful testing. It is suggested to involve people with real experience in using the product being evaluated and to collect information about their demographics, skills in using technology, and pattern of usage. Including multiple platforms, non-English discussions, and audiences who do not publicly comment would help assess the transferability of the present findings. The five appraisal tensions could guide the development and validation of survey items alongside direct measures of psychological ambivalence. Such research should distinguish simultaneous positive and negative evaluations of the same object from contrasts across objects or changes in opinion over time. Larger, independently human-coded samples could also assess sentiment and emotion classification performance across platforms and years.
Author Contributions
Conceptualization, methodology, literature review, data collection and curation, formal analysis, investigation, visualization, and writing—original draft preparation: K.P.Y.; supervision and administration support: P.S.; writing—review and editing: S.K. All authors have read and agreed to the published version of the manuscript.
Funding
This research received no external funding.
Institutional Review Board Statement
Ethical review and approval were waived for this study because it analyzed only publicly available, user-generated comments that were already in the public domain and involved no interaction with human participants, and no private or personally identifiable information was collected. All quoted comments are presented in a non-identifiable, paraphrased, or aggregated form in accordance with recognized internet research ethics guidelines.
Informed Consent Statement
Not applicable. This study analyzed publicly available YouTube and Reddit comments without direct interaction with contributors. User identifiers are not reported, and illustrative comments are paraphrased to reduce identification risks.
Data Availability Statement
The data analyzed in this study were collected from publicly available YouTube and Reddit comments via the YouTube Data API v3 and the PRAW/Pushshift interfaces. The derived dataset supporting the findings of this study is available from the corresponding author upon reasonable request. Restrictions apply to the redistribution of the raw comment text in accordance with the respective platforms’ terms of service.
Conflicts of Interest
The authors declare no conflicts of interest.
References
- Koohang, A.; Nord, J.H.; Ooi, K.-B.; Tan, G.W.-H.; Al-Emran, M.; Aw, E.C.-X.; Baabdullah, A.M.; Buhalis, D.; Cham, T.-H.; Dennis, C.; et al. Shaping the Metaverse into Reality: A Holistic Multidisciplinary Understanding of Opportunities, Challenges, and Avenues for Future Investigation. J. Comput. Inf. Syst. 2023, 63, 735–765. [Google Scholar] [CrossRef] [Scilit]
- Dwivedi, Y.K.; Hughes, L.; Baabdullah, A.M.; Ribeiro-Navarrete, S.; Giannakis, M.; Al-Debei, M.M.; Dennehy, D.; Metri, B.; Buhalis, D.; Cheung, C.M.K.; et al. Metaverse beyond the Hype: Multidisciplinary Perspectives on Emerging Challenges, Opportunities, and Agenda for Research, Practice and Policy. Int. J. Inf. Manag. 2022, 66, 102542. [Google Scholar] [CrossRef] [Scilit]
- Hadi, R.; Melumad, S.; Park, E.S. The Metaverse: A New Digital Frontier for Consumer Behavior. J. Consum. Psychol. 2024, 34, 142–166. [Google Scholar] [CrossRef] [Scilit]
- Lee, L.-H.; Braud, T.; Zhou, P.Y.; Wang, L.; Xu, D.; Lin, Z.; Kumar, A.; Bermejo, C.; Hui, P. All One Needs to Know about Metaverse: A Complete Survey on Technological Singularity, Virtual Ecosystem, and Research Agenda. Found. Trends Hum.-Comput. Interact. 2024, 18, 100–337. [Google Scholar] [CrossRef] [Scilit]
- Park, S.-M.; Kim, Y.-G. A Metaverse: Taxonomy, Components, Applications, and Open Challenges. IEEE Access 2022, 10, 4209–4251. [Google Scholar] [CrossRef] [Scilit]
- Mystakidis, S. Metaverse. Encyclopedia 2022, 2, 486–497. [Google Scholar] [CrossRef] [Scilit]
- Belk, R.; Humayun, M.; Brouard, M. Money, Possessions, and Ownership in the Metaverse: NFTs, Cryptocurrencies, Web3 and Wild Markets. J. Bus. Res. 2022, 153, 198–205. [Google Scholar] [CrossRef] [Scilit]
- Hennig-Thurau, T.; Aliman, D.N.; Herting, A.M.; Cziehso, G.P.; Linder, M.; Kübler, R.V. Social Interactions in the Metaverse: Framework, Initial Evidence, and Research Roadmap. J. Acad. Mark. Sci. 2023, 51, 889–913. [Google Scholar] [CrossRef] [Scilit]
- Kim, J. Advertising in the Metaverse: Research Agenda. J. Interact. Advert. 2021, 21, 141–144. [Google Scholar] [CrossRef] [Scilit]
- Wongkitrungrueng, A.; Suprawan, L. Metaverse Meets Branding: Examining Consumer Responses to Immersive Brand Experiences. Int. J. Hum. Comput. Interact. 2024, 40, 2905–2924. [Google Scholar] [CrossRef] [Scilit]
- Csikszentmihalyi, M. Flow: The Psychology of Optimal Experience; Harper & Row: New York, NY, USA, 1990. [Google Scholar]
- Hoffman, D.L.; Novak, T.P. Marketing in Hypermedia Computer-Mediated Environments: Conceptual Foundations. J. Mark. 1996, 60, 50–68. [Google Scholar] [CrossRef] [Scilit]
- Lombard, M.; Ditton, T. At the Heart of It All: The Concept of Presence. J. Comput. Mediat. Commun. 1997, 3, JCMC321. [Google Scholar] [CrossRef] [Scilit]
- Steuer, J. Defining Virtual Reality: Dimensions Determining Telepresence. J. Commun. 1992, 42, 73–93. [Google Scholar] [CrossRef] [Scilit]
- Li, H.; Daugherty, T.; Biocca, F. Impact of 3-D Advertising on Product Knowledge, Brand Attitude, and Purchase Intention: The Mediating Role of Presence. J. Advert. 2002, 31, 43–57. [Google Scholar] [CrossRef] [Scilit]
- Schmitt, B. Experiential Marketing. J. Mark. Manag. 1999, 15, 53–67. [Google Scholar] [CrossRef] [Scilit]
- Davis, F.D. Perceived Usefulness, Perceived Ease of Use, and User Acceptance of Information Technology. MIS Q. 1989, 13, 319–340. [Google Scholar] [CrossRef] [Scilit] [PubMed]
- Zhong, Z.; Hamouda, M. The Impact of Immersive and Flow Experiences on Consumer Participation in Hyper-Connected Shopping Platforms: A Metaverse Perspective. J. Consum. Behav. 2024, 23, 2826–2845. [Google Scholar] [CrossRef] [Scilit]
- Erensoy, A.; Mathrani, A.; Schnack, A.; Elms, J.; Baghaei, N. Consumer Behavior in Immersive Virtual Reality Retail Environments: A Systematic Literature Review Using the Stimuli-Organisms-Responses (S-O-r) Model. J. Consum. Behav. 2024, 23, 2781–2811. [Google Scholar] [CrossRef] [Scilit]
- Kumari, V.; Bala, P.K.; Chakraborty, S. A Text Mining Approach to Explore Factors Influencing Consumer Intention to Use Metaverse Platform Services: Insights from Online Customer Reviews. J. Retail. Consum. Serv. 2024, 81, 103967. [Google Scholar] [CrossRef] [Scilit]
- Ducoffe, R.H. Advertising Value and Advertising on the Web. J. Advert. Res. 1996, 36, 21–35. [Google Scholar] [CrossRef] [Scilit]
- Aaker, D.A.; Bruzzone, D.E. Causes of Irritation in Advertising. J. Mark. 1985, 49, 47–57. [Google Scholar] [CrossRef] [Scilit]
- MacKenzie, S.B.; Lutz, R.J.; Belch, G.E. The Role of Attitude toward the Ad as a Mediator of Advertising Effectiveness: A Test of Competing Explanations. J. Mark. Res. 1986, 23, 130–143. [Google Scholar] [CrossRef] [Scilit]
- Miller, M.; Clark, J.; Jehle, A. Cognitive Dissonance Theory (Festinger). In The Blackwell Encyclopedia of Sociology; John Wiley & Sons: Hoboken, NJ, USA, 2017. [Google Scholar] [CrossRef] [Scilit]
- Kaplan, K.J. On the Ambivalence-Indifference Problem in Attitude Theory and Measurement: A Suggested Modification of the Semantic Differential Technique. Psychol. Bull. 1972, 77, 361–372. [Google Scholar] [CrossRef] [Scilit]
- Cacioppo, J.T.; Berntson, G.G. Relationship between Attitudes and Evaluative Space: A Critical Review, with Emphasis on the Separability of Positive and Negative Substrates. Psychol. Bull. 1994, 115, 401–423. [Google Scholar] [CrossRef]
- Priester, J.; Petty, R. The Gradual Threshold Model of Ambivalence: Relating the Positive and Negative Bases of Attitudes to Subjective Ambivalence. J. Personal. Soc. Psychol. 1996, 71, 431–449. [Google Scholar] [CrossRef] [PubMed]
- Conner, M.; Sparks, P. Ambivalence and Attitudes. Eur. Rev. Soc. Psychol. 2002, 12, 37–70. [Google Scholar] [CrossRef] [Scilit]
- van Harreveld, F.; van der Pligt, J.; de Liver, Y.N. The Agony of Ambivalence and Ways to Resolve It: Introducing the MAID Model. Pers. Soc. Psychol. Rev. 2009, 13, 45–61. [Google Scholar] [CrossRef] [Scilit] [PubMed]
- Otnes, C.; Lowrey, T.M.; Shrum, L.J. Toward an Understanding of Consumer Ambivalence. J. Consum. Res. 1997, 24, 80–93. [Google Scholar] [CrossRef] [Scilit] [PubMed]
- Kim, I.; Ki, C.-W.; Lee, H.; Kim, Y.-K. Virtual Influencer Marketing: Evaluating the Influence of Virtual Influencers’ Form Realism and Behavioral Realism on Consumer Ambivalence and Marketing Performance. J. Bus. Res. 2024, 176, 114611. [Google Scholar] [CrossRef] [Scilit]
- Babić Rosario, A.; Sotgiu, F.; Valck, K.; Bijmolt, T. The Effect of Electronic Word of Mouth on Sales: A Meta-Analytic Review of Platform, Product, and Metric Factors. J. Mark. Res. 2016, 53, 297–318. [Google Scholar] [CrossRef] [Scilit]
- Chevalier, J.A.; Mayzlin, D. The Effect of Word of Mouth on Sales: Online Book Reviews. J. Mark. Res. 2006, 43, 345–354. [Google Scholar] [CrossRef] [Scilit]
- Hennig-Thurau, T.; Gwinner, K.P.; Walsh, G.; Gremler, D.D. Electronic Word-of-Mouth via Consumer-Opinion Platforms: What Motivates Consumers to Articulate Themselves on the Internet? J. Interact. Mark. 2004, 18, 38–52. [Google Scholar] [CrossRef] [Scilit]
- Netzer, O.; Feldman, R.; Goldenberg, J.; Fresko, M. Mine Your Own Business: Market-Structure Surveillance Through Text Mining. Mark. Sci. 2012, 31, 521–543. [Google Scholar] [CrossRef] [Scilit]
- Tirunillai, S.; Tellis, G.J. Mining Marketing Meaning from Online Chatter: Strategic Brand Analysis of Big Data Using Latent Dirichlet Allocation. J. Mark. Res. 2014, 51, 463–479. [Google Scholar] [CrossRef] [Scilit]
- Tirunillai, S.; Tellis, G. Does Online Chatter Really Matter? Dynamics of User-Generated Content and Stock Performance. Mark. Sci. 2011, 31, 198–215. [Google Scholar] [CrossRef] [Scilit]
- Schweidel, D.A.; Moe, W.W. Listening in on Social Media: A Joint Model of Sentiment and Venue Format Choice. J. Mark. Res. 2014, 51, 387–402. [Google Scholar] [CrossRef] [Scilit]
- Villarroel Ordenes, F.; Ludwig, S.; De Ruyter, K.; Grewal, D.; Wetzels, M. Unveiling What Is Written in the Stars: Analyzing Explicit, Implicit, and Discourse Patterns of Sentiment in Social Media. J. Consum. Res. 2017, 43, ucw070. [Google Scholar] [CrossRef] [Scilit]
- Oliver, R.L. A Cognitive Model of the Antecedents and Consequences of Satisfaction Decisions. J. Mark. Res. 1980, 17, 460–469. [Google Scholar] [CrossRef] [Scilit]
- Bhattacherjee, A. Understanding Information Systems Continuance: An Expectation-Confirmation Model. MIS Q. 2001, 25, 351–370. [Google Scholar] [CrossRef] [Scilit]
- Giang Barrera, K.; Shah, D. Marketing in the Metaverse: Conceptual Understanding, Framework, and Research Agenda. J. Bus. Res. 2023, 155, 113420. [Google Scholar] [CrossRef] [Scilit]
- Kumar, R.; Mukherjee, S.; Bose, I. Metaverse Advertising and Promotional Effectiveness: The Route from Immersion to Joy. Decis. Support Syst. 2025, 189, 114386. [Google Scholar] [CrossRef] [Scilit]
- Humphreys, A.; Wang, R.J.-H. Automated Text Analysis for Consumer Research. J. Consum. Res. 2018, 44, 1274–1306. [Google Scholar] [CrossRef] [Scilit]
- Braun, V.; Clarke, V. Using Thematic Analysis in Psychology. Qual. Res. Psychol. 2006, 3, 77–101. [Google Scholar] [CrossRef] [Scilit]
- O’Connor, C.; Joffe, H. Intercoder Reliability in Qualitative Research: Debates and Practical Guidelines. Int. J. Qual. Methods 2020, 19, 1609406919899220. [Google Scholar] [CrossRef] [Scilit]
- Loureiro, D.; Barbieri, F.; Neves, L.; Espinosa Anke, L.; Camacho-Collados, J. TimeLMs: Diachronic Language Models from Twitter. In Proceedings of the 60th Annual Meeting of the Association for Computational Linguistics: System Demonstrations; Basile, V., Kozareva, Z., Stajner, S., Eds.; Association for Computational Linguistics: Dublin, Ireland, 2022; pp. 251–260. [Google Scholar] [CrossRef] [Scilit]
- Kozinets, R.V.; Gretzel, U. Netnography Evolved: New Contexts, Scope, Procedures and Sensibilities. Ann. Tour. Res. 2024, 104, 103693. [Google Scholar] [CrossRef] [Scilit]

Disclaimer/Publisher’s Note: The statements, opinions and data contained in all publications are solely those of the individual author(s) and contributor(s) and not of MDPI and/or the editor(s). MDPI and/or the editor(s) disclaim responsibility for any injury to people or property resulting from any ideas, methods, instructions or products referred to in the content. |
© 2026 by the authors. Licensee MDPI, Basel, Switzerland. This article is an open access article distributed under the terms and conditions of the Creative Commons Attribution (CC BY) license.