


Abstract
Although internet access is widespread across the European Union, substantial regional differences persist in online purchasing. This study examines how European regions translate digital connectivity and routine internet use into effective participation in e-commerce. It introduces the regional digital-to-commerce conversion gap, which captures the difference between daily internet use and online purchasing. The analysis is based on 1034 observations for regions at level 2 of the Nomenclature of Territorial Units for Statistics (NUTS 2) in 25 EU Member States during 2019–2024, using official Eurostat data without imputation. Panel models, spatial analysis, and country-grouped machine-learning techniques are combined to examine regional patterns from complementary perspectives. The results show that internet access remains an important foundation for e-commerce participation, but differences in daily internet use and internet banking are more closely associated with regional online purchasing once these factors are considered jointly. E-commerce participation also displays pronounced geographical clustering, although no independent spillover effect between neighbouring regions is identified. The predictive analysis confirms the collective importance of digital access, routine use, and transaction-oriented practices. These findings suggest that regional policies should combine connectivity investment with measures that strengthen practical digital engagement, secure transactions, and consumer participation in online markets.
1. Introduction
Digital connectivity is essential for participation in contemporary markets, public services, education, and social life, but access alone does not ensure effective use. The European Union’s Digital Decade Policy Programme therefore treats connectivity, digital skills, business digitalisation, and digital public services as complementary objectives [1]. The 2026 State of the Digital Decade likewise stresses that technological foundations must be converted into outcomes at greater scale and with greater territorial consistency [2]. This conversion is especially important for e-commerce, where participation requires not only connectivity but also recurrent use, confidence, payment capability, and access to functioning delivery and consumer-protection systems.
Regional data make this problem visible. Eurostat reports substantial differences in online purchasing across NUTS 2 regions even as household internet access approaches saturation in many territories [3]. In the database assembled for this study, the mean shares across available region-year observations are 91.89% for household internet access and 65.43% for online purchasing. The mean regional difference between daily internet use and online purchasing is 17.45 percentage points in 2024. The relevant policy question is therefore not only whether regions are connected but how effectively routine digital engagement is translated into participation in online markets.
Digital-divide research increasingly distinguishes physical access from frequency and diversity of use, digital capabilities, and the benefits obtained from digital engagement [4,5,6,7,8]. Regional studies further show that digital inequality is shaped by income, education, institutions, accumulated technological capabilities, and demographic and territorial conditions, and may persist or polarise rather than converge automatically [9,10,11,12]. Together, these findings suggest that connectivity remains an enabling condition while differences in usage and capability become more salient as access spreads.
Internet banking is used in this study as an observable proxy for transaction-oriented digital capability because it involves remote account management, authentication, security procedures, and digitally mediated financial transactions [13]. It is neither equivalent to e-commerce nor interpreted as its cause. It may also reflect financial development, income, age structure, financial inclusion, and national banking-system characteristics; these conceptual limitations are considered explicitly when interpreting the results.
Three gaps motivate the analysis. First, much European e-commerce evidence is national and therefore cannot identify within-country regional heterogeneity [14]. Second, earlier longitudinal regional research relied on NUTS 1 units and trend-based completion of missing observations [15]. Third, panel, spatial, and machine-learning approaches are rarely integrated, and predictive validation may be optimistic when regions from the same country appear in both training and testing data [16]. These limitations leave unclear whether observed e-commerce disparities reflect within-region change, persistent territorial differences, spatial concentration, or out-of-country predictive relationships.
The study uses a non-imputed panel of 1034 NUTS 2 region-year observations from 25 Member States during 2019–2024. It combines two-way fixed-effects estimation, spatial diagnostics using official NUTS 2024 geometry, and tree ensembles evaluated through country-grouped cross-validation. It addresses three questions: how access, daily use, and internet banking are associated with regional online purchasing; whether online purchasing and the conversion gap are spatially clustered after conditioning on regional characteristics; and whether nonlinear models assign stable predictive relevance to usage-related variables outside the countries used for training.
The contribution is conceptual, empirical, methodological, and policy-oriented. The article links digital-divide research to e-commerce by defining the digital-to-commerce conversion gap; provides recent NUTS 2 evidence while preserving missing values and Eurostat quality flags; distinguishes descriptive spatial concentration from conditional spatial dependence; and separates within-region econometric associations from cross-country predictive evidence. The principal results show that access remains foundational, but its coefficient attenuates when usage indicators are included; daily use and internet banking remain positive correlates; and strong geographical clustering does not imply a statistically identified neighbourhood spillover.
2. Literature Review, Research Gap, and Hypothesis Development
2.1. From Digital Access to Digital Market Conversion
The concept of the digital divide has evolved considerably as internet access has become more widespread. The first generation of studies focused primarily on the distinction between individuals and territories with and without access to digital infrastructure. More recent research distinguishes among a first-level divide related to physical access, a second-level divide associated with digital skills and patterns of use, and a third-level divide concerning the tangible economic and social outcomes obtained from internet use [17]. This distinction is important because access, use, and outcomes represent successive but non-equivalent stages of digital participation.
The corresponding-fields perspective further argues that offline economic, social, cultural, and personal inequalities are reproduced in the digital environment rather than automatically eliminated by technological access [18]. Consequently, individuals and regions with similar connectivity may obtain different benefits from the internet because they differ in human capital, income, institutional support, demographic structure, and opportunities to use digital resources productively. Online purchasing can therefore be interpreted as a third-level digital outcome: it reflects not only whether individuals are connected, but also whether they can transform access and routine use into participation in a digital market.
Empirical research supports the distinction between adoption and effective use. Differences in the intensity and purpose of internet use remain substantial among connected individuals [4,5], while internet adoption and usage patterns respond differently to socioeconomic characteristics [7]. The systematic review conducted by Scheerder et al. shows that digital-divide research has concentrated more extensively on access and use than on tangible outcomes, leaving the third-level divide comparatively underexplored [17]. The recent typology developed for EU citizens similarly demonstrates that widespread connectivity coexists with heterogeneous combinations of access frequency, devices, digital activities, and demographic characteristics [8].
The relationship between access and online purchasing is therefore theoretically ambiguous once connectivity reaches high levels. An infrastructure-centred interpretation predicts that greater household internet access should continue to increase e-commerce participation. Evidence on household connectivity confirms that having internet access at home remains an important prerequisite for online shopping [19]. However, a capability-centred interpretation predicts that the marginal contribution of access declines when connectivity approaches saturation and that variation in routine use and transactional capacity become more important. This leads to the first hypothesis:
H1.
Regional household internet access is positively associated with online purchasing in specifications that exclude usage-related indicators, while its coefficient attenuates when usage intensity and transaction-oriented capability are included.
Daily internet use captures the extent to which digital engagement has become embedded in everyday behaviour. Frequent use can increase familiarity with online interfaces, information search, price comparison, account management, and digital communication. However, frequency alone does not necessarily imply that individuals can perform complex or consequential transactions. Internet banking represents a more demanding form of digital engagement because it involves authentication, remote account management, security procedures, and financial transactions. European research has identified distinct user profiles in the adoption of internet banking, confirming that transactional digital activities require capabilities beyond basic connectivity [13].
Internet banking is not treated as a cause of e-commerce or as a direct measure of trust, financial inclusion, or digital skills. It is an imperfect regional proxy for transaction-oriented digital capability. Its variation may additionally reflect income, age structure, financial-sector development, national banking practices, and the availability of digital payment services. The proposed analytical sequence—access, routine use, transaction-oriented experience, and online purchasing—is therefore a conceptual ordering rather than a tested causal chain.
H2.
Daily internet use and internet banking are positively associated with regional online purchasing and display stronger and more robust relationships than household internet access alone.
2.2. Socioeconomic, Demographic, and Transactional Conditions
Research on online shopping has traditionally drawn on technology-acceptance, trust, perceived-risk, and innovation-adoption frameworks. The integrated trust and technology-acceptance model developed by Gefen et al. shows that online purchasing depends on perceived usefulness and ease of use but also on trust in the online vendor and the digital environment [20]. This is particularly relevant because e-commerce requires individuals to disclose information, evaluate vendors, accept delivery uncertainty, and complete payments without physical interaction.
The determinants of online shopping also differ across demographic groups. Research concerning older consumers identifies performance expectations and social influence as potential adoption drivers, while perceived risk, established shopping traditions, and uncertainty regarding value constitute important barriers [21]. Ageing may therefore reduce aggregate regional online purchasing, although its effect is not necessarily uniform. Older individuals with sufficient experience, support, and digital capabilities may adopt online services successfully, meaning that regional ageing should not be interpreted as an insurmountable technological constraint.
Income and education are also central to both the digital-divide and e-commerce literature. Income affects device affordability, internet subscription, purchasing power, access to banking services, and the capacity to absorb potential transaction risks. Education can facilitate information search, comparison of alternatives, assessment of online credibility, navigation of digital interfaces, and problem solving. European studies repeatedly identify economic development and educational attainment as important dimensions of digital inequality [6,9,10]. Cross-country research also shows that the EU digital divide is multidimensional and closely associated with economic integration and national development, although educational indicators do not always display the uniformly strong effects expected by conventional theory [22].
At the regional level, Szeles and Simionescu find that tertiary education and innovation-related capabilities contribute to several dimensions of the EU digital economy, although older and newer Member States continue to exhibit different transformation patterns [23]. Research on digital skills further indicates that their diffusion across EU regions is spatially uneven and can generate polarization rather than automatic convergence [11]. Regional digitalization is therefore a cumulative process in which connectivity interacts with human capital, economic structure, innovation capacity, and pre-existing technological capabilities [12].
Population density introduces competing theoretical mechanisms. The innovation-diffusion hypothesis suggests that densely populated and urban regions adopt new technologies earlier because they concentrate knowledge, service providers, digitally skilled labour, and innovative consumers. Conversely, the efficiency hypothesis suggests that online shopping may be particularly valuable in less densely populated areas where access to physical retail outlets is more limited. As a result, the expected relationship between density and online purchasing is not necessarily monotonic.
These arguments lead to the following hypothesis:
H3.
Higher regional economic development and tertiary education are associated with greater online purchasing and a smaller digital-to-commerce conversion gap, whereas population ageing is associated with lower online purchasing and a larger conversion gap. The effect of population density remains theoretically ambiguous.
The aggregate regional design does not allow individual psychological mechanisms such as perceived risk, trust, or technology anxiety to be measured directly. The socioeconomic and demographic variables are therefore interpreted as regional contextual conditions rather than substitutes for individual-level behaviour. This distinction also reduces the risk of drawing individual conclusions from aggregate associations.
2.3. Territorial Heterogeneity and Spatial Dependence
The regional dimension is essential because national averages conceal substantial territorial heterogeneity. Early research on the EU regional digital divide identified pronounced differences both between and within Member States and showed that regional income, education, innovation, and institutional characteristics contribute to digital adoption [9]. Multilevel evidence further suggests that the regional divide cannot be addressed solely through national policies, because regional and country-level determinants operate simultaneously [10].
Research on the European digital economy shows that regions follow different technological trajectories and that a uniform set of interventions may not generate equivalent outcomes across territories [23]. The adoption of digital technologies depends partly on regional relatedness and economic complexity, meaning that regions already possessing complementary capabilities may be better able to implement new technologies and obtain productivity benefits [12]. This can generate cumulative advantage: more digitally mature regions convert infrastructure into economic outcomes more rapidly, while regions with weaker human capital and institutional capacity may remain connected but under-activated.
The geography of e-commerce is also shaped by national borders, logistics, retail accessibility, consumer culture, and market integration. Research on cross-border e-commerce in the EU identifies income, language, distance, delivery arrangements, and country-specific barriers as important determinants of online trade [24]. At a more local scale, evidence from the Netherlands shows that geography continues to influence online purchasing. E-shopping can initially display an urban innovation-diffusion pattern while subsequently expanding towards less urbanized territories where online channels may compensate for limited access to physical shops [25].
European regional e-commerce has also been shown to exhibit substantial spatial clustering. Sadowski et al. identify groups of neighbouring regions with similar internet access and online-shopping behavior, indicating that e-commerce development is not randomly distributed across space [15]. Such clustering can emerge through several mechanisms: shared infrastructure networks, common national regulations, cross-border consumer markets, logistics corridors, territorial proximity, and the diffusion of practices between neighbouring regions.
Nevertheless, descriptive spatial clustering should not be interpreted automatically as evidence of causal spillovers. Neighbouring regions may display similar outcomes because they belong to the same country or share comparable socioeconomic characteristics. A statistically significant Moran’s I demonstrates spatial concentration, but it does not establish that an increase in one region causes e-commerce participation to increase in neighbouring regions. Country effects and regional covariates must therefore be considered before a conditional spatial effect is inferred.
This distinction supports two related spatial hypotheses:
H4a.
Regional online purchasing and the digital-to-commerce conversion gap exhibit positive spatial autocorrelation.
H4b.
A positive conditional spatial-lag relationship persists after controlling for country effects and observable regional characteristics.
Separating H4a and H4b is important because the empirical analysis may confirm the existence of descriptive clustering while rejecting the stronger interpretation of an independent spatial spillover.
2.4. Econometric and Machine-Learning Approaches to Digital Adoption
The methodological literature on digital inequality and e-commerce is heterogeneous. Country-level analyses are useful for examining institutional and macroeconomic differences, but they cannot represent within-country regional disparities [14]. Regional research provides a more detailed territorial perspective, although previous European e-commerce analyses have relied on NUTS 1 regions and trend-based completion of missing observations because NUTS 2 information was unavailable for parts of the study period [15]. Other studies apply factor analysis, clustering, composite indicators, or multilevel models to explain digital inequality [8,9,10,11,12,22,23]. These approaches contribute different forms of evidence but rarely distinguish systematically among access, routine use, transactional capability, and online-market outcomes within a recent regional panel.
Panel fixed-effects models are particularly useful in this context because they control for time-invariant regional characteristics, including historical, cultural, geographic, and institutional factors that cannot be measured directly. However, conventional linear models may not adequately capture saturation effects, threshold relationships, or complex combinations among connectivity, digital use, income, education, and demographic structure.
Tree-based machine-learning models provide a complementary analytical perspective. Random forests can approximate nonlinear relationships and interactions without requiring a predefined functional form [26], while extremely randomized trees introduce additional randomization that can reduce variance and provide an alternative ensemble specification [27]. Their role in the present study is predictive and diagnostic rather than causal. The models are used to evaluate whether the determinants identified by the fixed-effects analysis also contribute to prediction when observations from the same country are prevented from appearing simultaneously in training and test samples.
Grouped cross-validation is essential because conventional random splitting can produce overly optimistic predictive results when observations share spatial, temporal, or hierarchical structures [16]. Country-grouped validation offers a more demanding assessment by testing whether relationships learned from some Member States generalize to regions located in other Member States. This is especially relevant when national institutions, survey procedures, and digital cultures generate within-country similarity.
Permutation importance provides an interpretable indication of how much predictive performance deteriorates when the information contained in a variable is disrupted. However, importance scores should be interpreted carefully when predictors are correlated because the contribution of related variables can be redistributed across the model [28]. For this reason, the machine-learning component is treated as a robustness and nonlinear-validation layer rather than as an alternative to econometric inference.
Machine learning has increasingly been applied to e-commerce adoption. For example, Daoud and Kammoun use machine-learning models to predict e-commerce adoption among a cross-sectional sample of manufacturing SMEs and demonstrate their capacity to identify nonlinear combinations of technological, organizational, and environmental factors [29]. Nevertheless, this evidence concerns firm-level adoption in a single national setting. The application of leakage-aware tree ensembles to individual online purchasing across a multinational regional panel remains limited.
The methodological discussion leads to the final hypothesis:
H5.
In country-grouped prediction, daily internet use and internet banking provide greater predictive information than household internet access, while their individual ranking may vary because the predictors are strongly correlated.
2.5. Research Gap and Positioning of the Study
The literature review identifies four interrelated research gaps. First, a conceptual gap remains between digital-divide research and e-commerce research. Digital-divide studies distinguish access, skills, use, and outcomes, whereas e-commerce research emphasises consumer adoption, trust, perceived risk, payment, logistics, and market access [20,21,24,25]. Few studies connect these perspectives by examining the regional distance between routine digital use and realised online purchasing. The proposed digital-to-commerce conversion gap links the two traditions without treating the aggregate indicator as an individual conversion rate.
Second, there is a territorial and data gap. A substantial part of the European evidence is based on country-level observations, which conceal within-country variation. Existing regional e-commerce research uses broader NUTS 1 units and supplements missing observations using temporal trends [15]. A recent, multiannual NUTS 2 analysis that retains the official missing values and data-quality flags remains absent from the literature.
Third, there is a methodological integration gap. Panel econometrics, spatial analysis, clustering, and machine learning have each been used to examine aspects of digitalization or e-commerce. However, they are rarely integrated within a single analytical framework that combines region and year fixed effects, spatial diagnostics, a conditional spatial specification, nonlinear prediction, and country-grouped validation. Consequently, it is often unclear whether identified relationships reflect within-region change, cross-sectional territorial differences, spatial clustering, or predictive associations.
Fourth, there is an interpretational gap concerning spatial dependence. Existing studies document spatial clusters of e-commerce participation, but less attention is devoted to whether such clustering survives the inclusion of national effects and regional socioeconomic characteristics. Distinguishing descriptive spatial concentration from a conditional spatial spillover is necessary before territorial proximity is given a causal or policy interpretation.
The present study addresses these gaps using a non-imputed NUTS 2 panel for 2019–2024. It distinguishes digital infrastructure, routine usage, and transactional capability; introduces the regional digital-to-commerce conversion gap; and triangulates fixed-effects estimation, spatial diagnostics, and country-grouped tree ensembles. This design makes it possible to evaluate whether regional e-commerce disparities primarily reflect remaining infrastructure limitations or the uneven activation of already available digital connectivity.
3. Materials and Methods
The empirical design combines panel econometrics, spatial analysis, and explainable machine learning to examine how European regions transform digital connectivity and routine internet use into effective participation in online markets. These methods serve complementary purposes. Panel fixed-effects models identify associations based on within-region changes over time, spatial diagnostics assess whether regional outcomes are geographically clustered, and tree-based models evaluate nonlinear predictive relationships in previously unseen national contexts. All stages rely exclusively on official statistical observations; no input values were simulated, interpolated, or imputed.
3.1. Data Sources and Sample Construction
All statistical observations were extracted from official Eurostat datasets on 3 August 2026. The main analytical period covers 2019–2024, for which regional digital indicators and the selected socioeconomic controls could be combined at NUTS 2 level with adequate comparability. Although several digital indicators were already available for 2025, the corresponding regional socioeconomic variables were not equally complete when the database was constructed. Therefore, 2025 observations were retained separately and were not included in the main panel.
The resulting database contains 1034 region-year observations corresponding to 196 distinct official NUTS 2 codes and 25 EU Member States. Germany and Greece are excluded from the strict regional panel because the information-society indicators used in the analysis are disseminated for these countries primarily at NUTS 1 level. Combining NUTS 1 observations with NUTS 2 regions would create inconsistent territorial units. Their exclusion reduces geographical coverage and may limit EU-wide generalisability, but it is not based on observed e-commerce performance and is preferable to mixing territorial scales.
The panel is unbalanced. A total of 138 regional codes is represented in all six years, while other regions enter or leave the database because of differences in annual data availability and revisions to the NUTS classification. Historical territorial codes were retained exactly as reported by Eurostat and identified through a separate indicator. The database contains 27 observations associated with historical NUTS codes. These observations were retained in the main analysis but excluded in one of the robustness specifications.
Missing observations were preserved as missing values. All specifications draw complete cases from the same underlying regional panel; Table 1 does not describe three separate datasets but reports progressively stricter availability counts for the digital core and the complete model. Eurostat status flags indicating estimated, provisional, low-reliability observations or breaks in time series were retained. The fully specified model uses 995 observations corresponding to 188 regional codes. Two robustness samples were subsequently constructed: a quality-restricted sample excluding observations with Eurostat quality flags and historical NUTS codes, and a six-year sample containing regional codes observed throughout 2019–2024.
Table 1.
Coverage of the regional panel by year.
Digital-skills indicators were not incorporated into the principal NUTS 2 panel because the most recent regional series is primarily available at NUTS 1 level. Assigning the same NUTS 1 or national value to all NUTS 2 regions would artificially reduce regional variation and underestimate statistical uncertainty. Digital skills were therefore retained as a potential supplementary indicator rather than included in the baseline models.
3.2. Variables and Measurement
The dependent variable is the percentage of individuals aged 16–74 who purchased or ordered goods or services online for private use during the previous 12 months. It captures the regional prevalence of e-commerce participation, not purchase frequency or expenditure, which are not consistently available at the NUTS 2 level for the study period. Expressing the outcome as a deviation from the annual EU regional mean would not change the slope estimates in a model with year fixed effects, because the same year-specific constant would be subtracted from every region and absorbed by those effects.
The digital explanatory variables capture three related stages of participation. Household internet access measures connectivity availability. Daily internet use captures the intensity with which individuals integrate digital technologies into routine activities. Internet banking is used as an imperfect proxy for transaction-oriented capability because it involves authentication, remote account management, security procedures, and financial transactions. It may simultaneously capture income, age composition, financial inclusion, banking-system development, and national institutional conditions; its coefficient is therefore interpreted as an association rather than a capability measure free of confounding.
Four socioeconomic and territorial controls are included. Regional GDP per capita in purchasing power standards captures the level of economic development and purchasing capacity. Tertiary educational attainment represents regional human capital. Population density measures territorial concentration and is transformed using because of its highly skewed distribution. The share of the population aged 65 years or older controls for demographic structures that may influence digital-service adoption.
To distinguish regular internet engagement from participation in online markets, the study constructs the regional digital-to-commerce conversion gap:
where denotes the NUTS 2 region and denotes the year. A larger positive value indicates that daily internet use substantially exceeds online purchasing, suggesting that routine digital engagement has not been fully translated into e-commerce participation.
The indicator is an aggregate regional diagnostic rather than an individual conversion rate. Daily internet use is measured by current frequency, whereas online purchasing refers to activity during the previous 12 months; the indicators are not necessarily based on identical underlying respondents (variable definitions according Table 2). Their difference therefore combines substantive and measurement components. A small number of negative values may occur and do not necessarily represent errors. This limitation is central to the interpretation of Equation (4).
Table 2.
Variable definitions, measurement, and analytical roles.
3.3. Panel Econometric Strategy
The baseline empirical analysis uses two-way fixed-effects models. Region fixed effects control for time-invariant characteristics such as geographic position, long-standing institutional conditions, cultural attitudes, and persistent territorial structures. Year fixed effects absorb common shocks affecting all regions, including the COVID-19 pandemic, EU-level digital policies, macroeconomic changes, and the general expansion of online services.
The principal model is specified as follows:
where contains GDP per capita, tertiary education, log-transformed population density, and the population share aged 65 years or older; represents region fixed effects; denotes year fixed effects; and is the idiosyncratic error term.
Five progressively extended specifications are estimated: To prevent coefficient differences across nested specifications from being driven by changes in sample composition, M1–M5 are estimated on the common complete-case sample used by the full model (995 region-year observations, 188 regions, and 25 countries).
- −
- Model M1 includes household internet access and region and year fixed effects.
- −
- Model M2 adds the socioeconomic and territorial controls while excluding the usage-related indicators.
- −
- Model M3 adds daily internet use and internet banking to the access-only specification.
- −
- Model M4 combines the three digital indicators with the complete set of controls.
- −
- Model M5 tests whether the relationship between connectivity and e-commerce is nonlinear.
For Model M5, internet access is centred around its estimation-sample mean before constructing the quadratic term:
A statistically significant negative coefficient for the squared term would be consistent with diminishing marginal returns to connectivity, whereas a positive coefficient would indicate an accelerating relationship. The centring procedure reduces the mechanical correlation between the linear and quadratic terms and makes the linear coefficient interpretable around the sample mean.
A fifth specification uses the conversion gap as the dependent variable:
Daily internet use is excluded from the right-hand side because it is incorporated into the dependent variable. Since Gap = DailyUse − ECommerce, each coefficient in Equation (4) equals the coefficient from a daily-use regression minus the coefficient from an online-purchasing regression estimated with the same regressors and sample. Reporting all three equations therefore makes the construction transparent and shows whether a covariate is associated more strongly with routine use or with online purchasing; the gap regression is not presented as an independent behavioural mechanism.
The main tables report country-clustered standard errors. This choice permits residual correlation among regions in the same Member State, reflecting national survey procedures, legislation, digital policies, taxation, and institutional conditions. A finite-cluster correction is applied, and conventional significance is evaluated using a Student’s t distribution with G − 1 degrees of freedom, where G is the number of country clusters [30]. Because 25 clusters remain a limited basis for asymptotic inference, the principal digital coefficients are additionally tested through a null-imposed wild cluster bootstrap-t procedure with Webb weights, 9999 replications, and clustering by country [31].
Estimator choice was assessed by comparing the full two-way fixed-effects specification with a random-effects model containing year indicators. The Hausman test evaluates whether the random-effects orthogonality assumption is consistent with the data [32]. The test rejects that assumption (χ2(7) = 61.70, p < 0.001), supporting the fixed-effects specification. A dynamic-panel GMM model was considered but not adopted: the research design contains no lagged dependent variable, the panel has only six years, and no defensible external instruments are available. Under these conditions, GMM would risk weak identification and instrument proliferation without resolving the principal endogeneity concerns.
Multicollinearity is evaluated through pairwise correlations and variance inflation factors. Robustness is examined using:
- A sample excluding all observations carrying Eurostat quality flags or historical NUTS markers; and
- A sample restricted to the 138 regional codes represented in all six years.
Because the models use observational regional data, the estimated coefficients are interpreted as conditional associations rather than causal effects. Fixed effects remove time-invariant regional heterogeneity but cannot eliminate reverse causality or omitted time-varying determinants such as consumer trust, delivery accessibility, platform quality, or regional payment infrastructure.
3.4. Spatial Analysis
The spatial analysis uses the 2024 cross-section because this is the most recent year for which the digital and socioeconomic indicators required by the full model are jointly available. Regional boundaries are obtained from the official GISCO NUTS 2024 geometry [33]. All 190 regional codes available for 2024 were matched to the corresponding official geographical units.
Spatial relationships are represented through a queen-contiguity matrix, according to which two regions are considered neighbours if their polygons share at least one boundary point. The matrix is row-standardised so that the weights assigned to the neighbours of each region sum to one. Of the 190 matched regions, 175 have at least one contiguous neighbour within the analytical sample. Islands and other geographically non-contiguous units are retained in the descriptive maps but excluded from contiguity-based statistics.
Global Moran’s I is used to test whether regional values are spatially clustered [34]:
where is the number of regions, represents the spatial weight between regions and , and . Statistical significance is assessed using 999 random permutations and a two-sided pseudo--value.
Moran-scatterplot quadrants provide a descriptive regional typology: high–high regions combine above-average values with above-average neighbouring values, low–low regions combine below-average values with below-average neighbouring values, and high–low and low–high regions are spatially atypical. These classifications are descriptive and are not treated as statistically significant local clusters unless supported by local permutation tests, consistent with the distinction between global and local spatial association [35].
An exploratory Spatial Durbin-type model is subsequently estimated:
where is the spatially lagged dependent variable, contains the spatial lags of the explanatory variables, and contains country fixed effects. All continuous variables are standardised before estimation. The model is estimated using two-stage least squares, with second-order spatial lags used as instruments for the spatially lagged outcome. Country-clustered standard errors are reported.
The spatial specification uses 173 complete and spatially connected regions from 23 Member States. Given its cross-sectional structure and relatively large instrument set, the model is treated as an exploratory robustness exercise rather than as a source of causal spillover estimates. A significant Global Moran statistic indicates spatial concentration, but it does not, by itself, demonstrate that e-commerce participation in one region causes changes in neighbouring regions [36].
3.5. Explainable Machine-Learning Validation
The final analytical stage uses Random Forest and Extremely Randomised Trees models to evaluate nonlinear relationships and interactions without imposing a predetermined functional form [26,27]. The machine-learning sample contains the same 995 complete observations used in the main fixed-effects model.
The feature set includes household internet access, daily internet use, internet banking, GDP per capita, tertiary education, log population density, the population share aged 65 years or older, and year. Both models contain 500 trees, a minimum terminal-node size of four observations, and a maximum feature share of 0.8 at each split. A common random seed of 2405 is used to ensure reproducibility.
Model validation follows a five-fold grouped cross-validation procedure in which countries, rather than individual observations, define the groups. Consequently, observations from the same Member State cannot appear simultaneously in the training and validation samples. This procedure reduces geographic information leakage and provides a more demanding test of whether the identified relationships generalise to national contexts not encountered during model estimation [16].
Variable importance is assessed through permutation importance. For each validation fold, one feature is permuted while the remaining features are kept unchanged and the increase in validation MAE is calculated. Because access, daily use, and internet banking are strongly correlated, a grouped permutation is also reported: the three digital variables are permuted jointly using the same row permutation, which preserves their internal correlation structure while removing their joint relationship with the outcome. A second block combines GDP per capita, education, density, and ageing.
A larger positive value indicates that the corresponding variable contributes more strongly to out-of-country predictive accuracy. Near-zero or negative importance does not indicate a negative causal effect; it indicates that the variable provides little stable additional predictive information after accounting for the other features.
The machine-learning component is a nonlinear predictive layer rather than a substitute for panel inference. Fixed-effects coefficients describe within-region associations, whereas country-grouped tree models rely primarily on cross-country and cross-regional predictive structure. Individual permutation scores are therefore not expected to reproduce coefficient magnitudes or rankings, especially under predictor correlation [28]. Grouped importance is used to assess the digital block as a whole. Data preparation and statistical analysis were conducted in Python 3.12 using reproducible scripts and fixed random seeds.
4. Results
4.1. Descriptive Patterns of Regional Digital Participation
Before examining the econometric, spatial, and machine-learning results, the descriptive analysis provides an initial overview of regional digital participation and its evolution across the European Union. It distinguishes between three related but conceptually different dimensions: household internet access, the intensity of internet use, and effective participation in online markets. This distinction is important because widespread connectivity does not necessarily translate into regular digital engagement or e-commerce adoption. Table 3 therefore reports the distribution of the main variables for the complete regional panel, while Figure 1 and Figure 2 subsequently illustrate their temporal evolution and spatial variation. Given the unbalanced structure of the dataset, the reported statistics describe the available observations and should not be interpreted as estimates derived from a geographically constant regional sample. Overall, the results indicate substantial progress in digital participation between 2019 and 2024 but also reveal persistent disparities across NUTS 2 regions and a continuing gap between daily internet use and online purchasing.
Table 3.
Descriptive statistics of the regional panel.
Figure 1.
Evolution of regional digital participation indicators in the European Union, 2019–2024. Note: Values are unweighted annual means for the same 135 NUTS 2 regions with complete observations for all four indicators in each year. Source: author’s calculations based on Eurostat data.
Figure 2.
Regional distribution of online purchasing and the digital-to-commerce conversion gap across EU NUTS 2 regions, 2024. Note: The conversion gap is daily internet use minus online purchasing, in percentage points. Grey or hatched territories lack comparable NUTS 2 ICT observations. Germany and Greece are excluded because their relevant regional ICT indicators are primarily disseminated at NUTS 1 level; outermost regions are not shown in the map window. Source: author’s calculations based on Eurostat and GISCO.
Table 3 and Table 4 summarise the analytical variables. Across the available region-year observations, the average share purchasing online is 65.43%, compared with 91.89% for household internet access, 82.95% for daily internet use, and 63.69% for internet banking. The sizeable standard deviations for online purchasing and banking indicate persistent territorial heterogeneity. In the common complete-case sample (N = 995), online purchasing is strongly correlated with internet banking (r = 0.891) and daily use (r = 0.800), while daily use and banking are also highly correlated (r = 0.790). These correlations motivate cautious interpretation of individual coefficients and permutation importance.
Table 4.
Pairwise correlations in the complete full-model sample.
The bivariate relationships are descriptive and do not account for regional or year effects. In particular, high correlations among the three digital indicators mean that coefficient attenuation and individual permutation rankings cannot be interpreted as causal mediation or as a unique decomposition of digital capability.
The cross-sectional variation reported in Table 3 and Table 4 is accompanied by a general upward trend. To avoid changes in sample composition, Figure 1 uses the same 135 regions with complete observations for all four digital indicators in every year from 2019 to 2024.
Figure 1 shows improvement in all four dimensions within the balanced sample. Mean household internet access increased from 88.48% in 2019 to 94.75% in 2024; daily use rose from 77.19% to 89.13%; internet banking from 55.50% to 69.90%; and online purchasing from 55.34% to 70.12%. The common-sample design removes the compositional limitation of annual means from an unbalanced panel, while the fixed-effects models remain the basis for inference.
The upward aggregate trends conceal substantial territorial differences. Figure 2 maps online purchasing and the digital-to-commerce conversion gap across the NUTS 2 regions available for 2024. The first panel captures the level of effective e-commerce participation, whereas the second indicates the extent to which routine internet use exceeds online purchasing.
Figure 2 shows pronounced territorial concentration. Regions with high online purchasing tend to cluster geographically, while lower participation remains visible in several peripheral and less-developed territories. The gap map identifies regions where routine internet use is relatively widespread but e-commerce participation remains lower. The absence of Germany and Greece limits geographical coverage and cautions against treating the map as a complete census of EU NUTS 2 outcomes; retaining a consistent territorial scale nevertheless avoids assigning NUTS 1 values artificially to their constituent regions.
4.2. Fixed-Effects Estimates and Conversion-Gap Decomposition
Table 5 reports the two-way fixed-effects estimates. To separate coefficient attenuation from changes in sample composition, all five specifications are estimated on the same 995-observation complete-case sample used by the full model. M2 isolates the association between access and online purchasing after adding the regional controls but before introducing daily use and internet banking.
Table 5.
Two-way fixed-effects estimates of regional online purchasing.
The common-sample estimates reproduce the original attenuation pattern. A one-percentage-point increase in household internet access corresponds to a 0.679-point increase in online purchasing in M1 (p < 0.01), while the coefficient remains positive and significant after the socioeconomic and territorial controls are added in M2 (β = 0.626, p < 0.01). It falls to 0.076 in M3 and 0.080 in M4 when daily use and internet banking are included. Because all four nested models use the same 995 observations, this attenuation cannot be attributed to changes in sample composition. It remains compatible with overlapping variation and multicollinearity among the digital indicators, and it is not evidence of causal mediation.
In M4, daily internet use has a coefficient of 0.506, and internet banking has a coefficient of 0.239. Both remain significant under conventional country-clustered inference and under the wild cluster bootstrap (p = 0.002 and p = 0.026, respectively). Access is insignificant under both procedures (wild-bootstrap p = 0.667). The Hausman test rejects the random-effects orthogonality assumption (χ2(7) = 61.70, p < 0.001), supporting the use of fixed effects.
Figure 3 illustrates the coefficient pattern across the common-sample access-only, access-plus-controls, digital-use, and full specifications, together with the two restricted-sample robustness estimates. Daily use is the most stable within-region correlate, while the precision of banking decreases in the quality-restricted sample. The figure describes conditional associations and should not be read as a causal sequence.
Figure 3.
Main digital coefficients and 95% confidence intervals based on country-clustered inference.
GDP per capita is positive and significant in M2, but its coefficient falls from 0.201 to 0.079 after daily use and banking are introduced and is significant only at the 10% level in M4. Tertiary education is positive but insignificant. Density and ageing are also imprecisely estimated. These changes reinforce the need to distinguish specifications without usage indicators from models that condition on closely related digital behaviours.
M5 does not identify a significant quadratic connectivity effect. Neither centred access nor its squared term is significant, and within-region explanatory power changes negligibly. The evidence therefore supports coefficient attenuation after usage indicators are added, but not a statistically identifiable universal connectivity threshold.
Table 6 reports Equation (4) together with the two component regressions on the identical 995-observation sample. The gap coefficients equal the daily-use coefficients minus the corresponding online-purchasing coefficients, so the table provides a transparent decomposition rather than an additional causal model.
Table 6.
Decomposition of the digital-to-commerce conversion gap.
No observed covariate has a statistically significant coefficient in the gap equation at the 10% level. Access is more strongly associated with daily use than with online purchasing, whereas banking and GDP per capita are more strongly associated with online purchasing; however, the corresponding coefficient differences are imprecise. The gap is therefore useful mainly as a descriptive territorial diagnostic, not as evidence of a distinct conversion mechanism.
4.3. Robustness Analysis
Two restricted samples were used to evaluate the stability of the main findings (Table 7). The first retains only observations without Eurostat estimation, provisional-value, or series-break flags. The second is limited to regions observed in all six years.
Table 7.
Robustness of the principal digital coefficients.
Daily internet use remains statistically significant in both restricted samples. Internet banking remains significant in the six-year sample but loses precision in the clean-quality sample, where the number of observations falls to 544. Household internet access is not significant under country-clustered inference in either robustness model. The evidence therefore supports the stability of daily use most strongly, while the result for internet banking is positive but somewhat more sensitive to sample restrictions.
4.4. Spatial Patterns and Conditional Dependence
The spatial diagnostics confirm that regional e-commerce participation is geographically concentrated. Table 8 reports the Global Moran statistics and the exploratory conditional spatial specification.
Table 8.
Spatial diagnostics for 2024.
Online purchasing, the conversion gap, and internet banking all display strong positive spatial autocorrelation. The descriptive quadrant allocation identifies 77 high–high regions, 80 low–low regions, nine high–low regions, and nine low–high regions. These counts describe the position of regions relative to their neighbours but are not filtered by local permutation significance.
After country effects and regional covariates are introduced, the residual Moran’s I is modest but statistically significant and negative (I = −0.133, p = 0.021). This indicates weak spatial dispersion in the remaining errors: conditional on the included factors, neighbouring regions tend to display slightly dissimilar residual deviations. The result should not be interpreted as a negative spillover. The standardised spatial-lag coefficient is positive (ρ = 0.342) but statistically insignificant (p = 0.184), so the two diagnostics do not identify a stable conditional dependence mechanism. The analysis therefore supports H4a, concerning descriptive spatial concentration, but does not support H4b, which proposed a persistent conditional spatial relationship.
4.5. Machine-Learning Validation
Table 9 presents the country-grouped predictive results and both individual and grouped permutation importance.
Table 9.
Country-grouped machine-learning performance and permutation importance.
Extra Trees achieves the strongest predictive performance (grouped cross-validated R2 = 0.758; MAE = 6.825; RMSE = 8.077), while Random Forest produces similar results. These statistics evaluate prediction in countries excluded from model training and are not measures of within-region explanatory fit.
Internet banking has the largest individual permutation score in both tree models, followed by daily use, while access contributes little additional information when the other correlated indicators remain in the model (Figure 4). The joint digital block produces a substantially larger MAE increase—8.169 points for Random Forest and 7.853 for Extra Trees—confirming that the three correlated variables collectively carry the dominant out-of-country signal. The individual ordering is not treated as a structural ranking.
Figure 4.
Individual and grouped permutation importance from country-grouped validation.
Negative individual importance values do not indicate negative causal effects; they show that permuting the feature did not reduce predictive accuracy in the held-out countries. The fixed-effects and machine-learning results are complementary rather than identical: fixed effects use within-region changes and give daily use the larger coefficient, whereas tree models exploit between-country and between-region patterns and rank banking first. Because DailyUse and Banking are strongly correlated (r = 0.790), their individual permutation scores can redistribute shared information. The grouped result supports the relevance of the digital-participation block without claiming convergence in the individual ranking.
Overall, H1 is partially supported, H2 is supported for daily use and supported with qualification for banking, H3 is not supported at the 5% level, H4a is supported, H4b is not supported, and H5 is supported as a predictive—not structural—statement.
5. Discussion
This study examined how digital infrastructure, routine use, and transaction-oriented behaviour are associated with regional e-commerce participation. The evidence supports a distinction between access and activation, but not a causal sequence among them. Access remains foundational and is strongly associated with purchasing in models that exclude usage indicators; its coefficient attenuates only after daily use and banking are added. Strong geographical clustering also persists, although the conditional spatial model does not identify a direct neighbouring-region spillover. The econometric, spatial, and predictive analyses therefore provide complementary evidence rather than interchangeable estimates.
5.1. From Digital Connectivity to Online-Market Activation
The first major finding concerns the changing role of internet access. In the access-only fixed-effects specification, a one-percentage-point increase in household internet access is associated with an approximately 0.679 percentage-point increase in online purchasing. The coefficient remains 0.626 after socioeconomic and territorial controls are introduced but decreases to 0.076–0.080 and becomes statistically insignificant after daily internet use and internet banking are included. Importantly, this pattern is obtained when all nested models are estimated on the same 995 observations, ruling out changing sample composition as the explanation for the attenuation.
The attenuation is compatible with the distinction between first-level inequalities in access and later inequalities in usage and outcomes [4,17,18], but it is not a mediation test. Daily use and banking are plausible consequences of access, all three digital indicators originate from the same Eurostat ICT survey, and their values may move jointly with unobserved digitalisation processes. Their high pairwise correlations also reduce the precision of a unique decomposition. Accordingly, the results show how the access coefficient changes under alternative conditioning sets; they do not show that access has become unimportant or quantify an indirect causal effect.
H1 is therefore only partially supported. Connectivity is positively associated with online purchasing in both the access-only and access-plus-controls specifications, showing that infrastructure remains important, especially where coverage or affordability is incomplete. The coefficient becomes small after usage indicators are introduced, but this conditional result should not be used to infer that infrastructure can be withdrawn from policy priorities.
The nonlinear specification does not identify a statistically significant quadratic relationship between household internet access and online purchasing. Consequently, the analysis does not establish a specific connectivity threshold beyond which additional access ceases to matter. The evidence indicates attenuation after accounting for usage and transactional capability but not a statistically identifiable saturation point. This distinction is important because saturation should not be inferred solely from the high observed mean of household connectivity.
5.2. Routine Use and Transactional Digital Capability
Daily internet use emerges as the most stable within-region correlate of online purchasing. In the fully specified model, a one-percentage-point increase in daily internet use is associated with an approximately 0.506 percentage-point increase in online purchasing, holding the other observed factors and fixed effects constant. The coefficient remains statistically significant in both robustness samples, including the sample restricted to regions observed throughout the entire six-year period.
This result indicates that routine digital engagement represents an important intermediate layer between access and e-commerce participation. Frequent internet users are more likely to develop familiarity with digital interfaces, online information searches, account management, authentication procedures, and platform-based interactions. This interpretation is consistent with research showing that digital inequality persists among connected populations because frequency, autonomy, skills, and diversity of use affect the benefits obtained from internet access [4,17].
Internet banking also has a positive association with regional online purchasing. In the main model, a one-percentage-point increase in internet banking is associated with an approximately 0.239 percentage-point increase in online purchasing. The result remains statistically significant in the six-year regional sample, although it loses precision in the sample excluding all Eurostat quality flags. H2 is therefore strongly supported for daily internet use and more cautiously supported for internet banking.
Internet banking should not be interpreted as a direct cause of online purchasing or as a pure measure of transaction readiness. It captures experience with authentication, account monitoring, security procedures, and financial transactions but also reflects income, financial inclusion, age structure, trust, digital-payment availability, and national banking-system characteristics. Region fixed effects and observed controls address only part of this confounding. Reverse relationships are also possible: online shoppers may adopt banking services, and both activities may respond to platform quality or payment infrastructure. The coefficient is therefore evidence of association with a transaction-oriented digital practice, not proof of a capability mechanism.
The conversion gap is useful as a descriptive signal, but Table 6 confirms that it is algebraically the difference between the daily-use and purchasing equations. Moreover, daily use refers to current frequency while online purchasing covers the previous 12 months, and the aggregates need not describe the same respondents. The indicator therefore cannot be interpreted as a literal transition rate or as the proportion of daily users who failed to purchase online. Its value lies in flagging territories where two forms of digital participation remain far apart and warrant closer investigation with harmonised microdata.
5.3. Socioeconomic and Territorial Conditions
The socioeconomic controls provide more limited evidence. Regional GDP per capita and tertiary educational attainment have positive coefficients in the full fixed-effects model, but neither is statistically significant at the conventional 5% level. GDP per capita is weakly significant at the 10% level in some specifications, whereas the education coefficient remains imprecisely estimated. Population density and the share of the population aged 65 years or older are also statistically insignificant.
These results should not be interpreted as showing that income, education, territorial structure, and demographic composition are irrelevant for e-commerce adoption. The fixed-effects estimator identifies associations from changes occurring within the same region over a relatively short period. Variables such as population density, educational structure, and population ageing change slowly, while much of their meaningful variation occurs between regions. Region fixed effects absorb these persistent differences, leaving limited within-region variation from which their coefficients can be estimated.
The absence of a robust age effect may also conceal substantial heterogeneity within older populations. Previous research has shown that online-shopping adoption among older consumers depends on perceived usefulness, risk, self-efficacy, and support conditions rather than age alone [21]. Similarly, population density is an imperfect proxy for logistics accessibility or territorial peripherality. Densely populated regions may benefit from more extensive delivery networks, but density does not directly capture delivery costs, parcel-locker availability, transport connections, or access to cross-border platforms.
H3 is not supported at the conventional 5% significance level. GDP per capita is positive in the full model but only weakly significant, while education, density, and ageing are imprecise; none of the corresponding conversion-gap coefficients is significant. These findings do not establish irrelevance, because slowly changing regional conditions are largely absorbed by fixed effects and the six-year window provides limited identifying variation.
5.4. Spatial Concentration Versus Conditional Spillovers
The spatial results reveal pronounced geographical concentration. Global Moran’s I reaches 0.844 for online purchasing and 0.825 for the digital-to-commerce conversion gap, with permutation-based p-values of 0.001. Internet banking displays an even higher value of 0.889. Regions with high or low values are therefore strongly concentrated in geographical space rather than randomly distributed.
This result is consistent with earlier European research identifying persistent territorial patterns in internet diffusion, digital capabilities, and e-commerce participation [9,22,23]. Neighboring regions may share national institutional frameworks, logistics networks, language, consumer preferences, banking systems, broadband infrastructure, and cross-border market conditions. The geographical dimension of online shopping may therefore remain relevant even though transactions are performed digitally [24,25].
However, the strong raw spatial autocorrelation does not translate into a statistically significant conditional spatial-lag coefficient. In the exploratory Spatial Durbin-type model, the estimated spatial parameter is positive (ρ = 0.342) but insignificant (p = 0.184). The residual Moran’s I is small yet statistically significant and negative (I = −0.133, p = 0.021), indicating weak spatial dispersion rather than remaining positive clustering after country effects and observed covariates are included. Moran’s I diagnoses the spatial arrangement of residuals, whereas the lag coefficient tests a specific conditional dependence channel; their joint interpretation provides no evidence of a stable positive neighbourhood spillover. The negative residual pattern may reflect local contrasts, the contiguity structure, or remaining specification heterogeneity and reinforces the exploratory status of the cross-sectional spatial model.
The distinction between spatial pattern and spatial mechanism is essential. A high Moran statistic indicates that similar regional outcomes are geographically concentrated, but it does not demonstrate that increasing e-commerce participation in one region causes participation to increase in an adjacent region. H4 is therefore supported with respect to positive spatial autocorrelation but not with respect to a conditional spatial spillover. Regional coordination may still be beneficial, particularly for logistics and cross-border infrastructure, but the current evidence does not establish a causal neighborhood effect.
5.5. Nonlinear Predictive Evidence
The country-grouped machine-learning analysis provides a predictive assessment across national contexts. The models attain out-of-fold R2 values of 0.745 and 0.758, indicating that the observed feature set generalises reasonably well to regions in countries excluded from training. These values do not measure the same variation as the within-region fixed-effects coefficients.
Individual permutation importance ranks internet banking first and daily use second, whereas the fixed-effects model gives daily use the larger coefficient. This is not contradictory: fixed effects estimate average associations from change within a region, while the tree models use cross-country and cross-regional predictive variation, nonlinearities, and interactions. Banking may be especially informative about national digital-market environments even when its within-region coefficient is smaller.
Predictor correlation further limits individual ranking. Daily use and banking have a correlation of 0.790 in the full-model sample, so permutation importance may allocate shared information unevenly [28]. Jointly permuting access, daily use, and banking produces much larger losses in predictive accuracy than permuting any single variable. The defensible conclusion is therefore that the digital-participation block has strong predictive relevance; the individual ordering is method- and variation-specific and should not be described as convergent across econometric and machine-learning analyses.
The machine-learning results also help interpret the insignificant quadratic access term. The limited importance of connectivity in the tree models suggests that access provides little additional differentiation across already well-connected regions. Nevertheless, neither the panel model nor the tree ensembles identify a precise universal threshold. Connectivity saturation may vary between countries and may interact with unobserved factors such as affordability, quality of service, trust, and logistics accessibility.
5.6. Theoretical and Methodological Contributions
The study contributes to the digital-divide and e-commerce literature in four respects (synthesis presented in Table 10). First, it extends the distinction between access and use by explicitly examining the transformation of routine digital participation into an observable market outcome. The proposed digital-to-commerce conversion gap links the digital-divide literature to the economic consequences of digital engagement. Its purpose is not to replace established measures of digital inequality, but to identify regions where widespread routine internet use coexists with comparatively limited e-commerce participation.
Table 10.
Assessment of the research hypotheses.
Second, the regional perspective reveals territorial heterogeneity that is obscured in country-level studies. National averages remain useful for evaluating institutional and policy differences, but they may conceal substantial differences between metropolitan, intermediate, peripheral, and less-developed regions within the same Member State. The NUTS 2 framework therefore complements previous country-level evidence on European e-commerce disparities [8].
Third, the study distinguishes spatial concentration from conditional spatial dependence. Strong geographical clustering may reflect national systems and persistent regional characteristics rather than direct spillovers. This distinction prevents descriptive spatial autocorrelation from being interpreted as causal diffusion.
Fourth, the triangulation of panel econometrics, spatial diagnostics, and country-grouped machine learning provides a more comprehensive analytical design. Panel models address unobserved time-invariant regional heterogeneity, spatial statistics examine geographical structure, and grouped validation tests whether the observed relationships generalise beyond the national contexts included in model training. The consistency of their substantive conclusions is more informative than the result of any single method.
5.7. Regional Policy Implications
The results support differentiated rather than uniform regional policy. Regions with incomplete, unaffordable, or unreliable connectivity still require infrastructure investment. Where access is already widespread, monitoring and intervention should additionally cover routine use, practical digital skills, secure payment and authentication, consumer confidence, financial inclusion, and actual online purchasing. Broadband coverage alone is not a sufficient indicator of digital-market participation.
Internet banking should be treated as a diagnostic proxy, not as the exclusive policy target. Local evidence on trust, payment options, logistics, delivery quality, platform access, and the needs of older or infrequent users is required before interventions are selected. This interpretation is consistent with the Digital Decade framework’s complementary treatment of connectivity, capabilities, and digitalisation [1,2].
Spatial concentration also supports coordination in delivery networks, consumer information, and cross-border infrastructure. However, because the conditional spillover is insignificant, policy should not assume that gains will diffuse automatically from high-performing neighbours; place-based measures remain necessary.
5.8. Limitations and Directions for Further Research
Several limitations qualify the findings. The panel is unbalanced and includes changes in NUTS classifications. Germany and Greece are absent because comparable ICT indicators are disseminated primarily at NUTS 1 level; this safeguards territorial consistency but may introduce coverage-related limits to EU-wide generalisation. The 2019–2024 period is also short and includes the exceptional effects of the COVID-19 pandemic.
The aggregate design is subject to ecological limitations and cannot identify individual transitions, purchase frequency, expenditure, or causal mediation from access through use to purchasing. The conversion gap combines indicators with different reference periods and potentially different respondents. Internet banking is an imperfect proxy influenced by financial development, age, income, inclusion, and national banking arrangements.
Comparable NUTS 2 measures of digital skills, consumer trust, logistics accessibility, payment infrastructure, delivery quality, platform availability, cross-border purchasing, and artificial-intelligence exposure were unavailable for the full panel. A national or enterprise-level AI indicator would not be territorially or conceptually equivalent to regional consumer e-commerce participation and was therefore not merged into the model.
Finally, the design remains associational. Fixed effects do not remove omitted time-varying factors; the spatial model is cross-sectional and instrument-rich; and machine-learning importance is predictive rather than structural. Dynamic-panel GMM was not used because no lagged outcome or credible external instruments were specified and the six-year panel creates substantial weak-instrument and instrument-proliferation risks. Future research should use harmonised boundaries, longer panels, regional microdata, direct trust and logistics indicators, and quasi-experimental changes in broadband, payments, or delivery infrastructure.
6. Conclusions
This study investigated how European regions transform digital connectivity and routine internet use into effective participation in online markets. Using 1034 NUTS 2 region-year observations from 25 EU Member States over 2019–2024, the analysis combined two-way fixed-effects models, spatial diagnostics, and country-grouped explainable machine learning. This integrated design made it possible to distinguish the availability of digital infrastructure from usage intensity, transaction-oriented capability, and realised e-commerce participation.
Internet access remains a necessary foundation for e-commerce participation. It is positive and significant both alone and with regional controls, but its coefficient becomes small and insignificant after daily use and internet banking are introduced. Re-estimating the nested models on the same 995 observations preserves this attenuation, demonstrating that it is not driven by sample-composition changes. Because the digital indicators are correlated and may lie on overlapping behavioural pathways, the attenuation does not establish causal mediation or show that access is unimportant. No statistically identifiable nonlinear connectivity threshold is detected.
Daily internet use is the most robust within-region correlate of online purchasing, while banking is also positive but less stable in the quality-restricted sample. In contrast, the country-grouped tree models rank banking first in individual predictive importance. This difference reflects the distinct variation used by the methods and the correlation among predictors. Joint permutation shows that the digital-participation block, as a whole, has substantial out-of-country predictive relevance.
The digital-to-commerce conversion gap offers a territorial diagnostic of the distance between two aggregate forms of participation, but it is not an individual conversion rate. Its component regressions show that none of the observed covariates explains the coefficient difference robustly. Future work should validate the concept using harmonised microdata with aligned reference periods.
The spatial analysis reveals strong geographical clustering of online purchasing, internet banking, and the conversion gap. After conditioning on country effects and regional characteristics, the residual Moran’s I is weakly negative but statistically significant, while the conditional spatial-lag coefficient is positive and insignificant. This combination indicates modest residual dispersion but does not establish an independent or causal spillover between neighbouring regions. Much of the pronounced raw clustering appears to be associated with shared national contexts and persistent territorial characteristics.
The socioeconomic results are less conclusive. Regional income and tertiary education display generally positive coefficients, but their effects are not robust at conventional significance levels. Population density and ageing are also imprecisely estimated. These findings do not imply that territorial and demographic structures are irrelevant. Rather, their limited short-term variation is largely absorbed by region fixed effects, while the relatively short panel restricts the identification of slowly changing regional conditions.
Policy implications are therefore conditional. Infrastructure remains essential where connectivity is incomplete, while well-connected regions may also benefit from support for practical digital use, secure payments, consumer confidence, accessible authentication, financial inclusion, and delivery access. Regional diagnosis should combine access, usage, transaction-oriented behaviour, and realised purchasing rather than treat any single proxy as digital maturity.
The study contributes to the literature by introducing a regional measure of the distance between routine internet use and e-commerce participation, providing recent evidence at the NUTS 2 level, and distinguishing descriptive spatial concentration from conditional spatial dependence. Methodologically, it demonstrates the value of triangulating fixed-effects inference, spatial diagnostics, and leakage-aware predictive validation.
The conclusions remain associational because the analysis relies on aggregate observational data. Future research should harmonise historical NUTS boundaries, extend the temporal coverage, and incorporate regional measures of digital skills, consumer trust, logistics accessibility, payment infrastructure, delivery quality, and platform availability. Regional microdata, multilevel models, and quasi-experimental designs could further clarify the mechanisms through which connectivity and digital capabilities are translated into effective and territorially inclusive participation in European online markets.
Funding
This research received no external funding.
Data Availability Statement
Publicly available datasets were analysed in this study. The original data can be accessed through the Eurostat Data Browser using dataset codes tgs00052, tgs00047, isoc_r_iuse_i, tgs00006, tgs00109, demo_r_d3dens, and demo_r_pjanaggr3 (https://ec.europa.eu/eurostat/databrowser/ accessed on 3 August 2026). The NUTS 2024 geographical data used for the spatial analysis are publicly available from Eurostat GISCO (https://ec.europa.eu/eurostat/web/gisco/geodata/statistical-units/territorial-units-statistics accessed on 3 August 2026). No confidential, personal, or restricted-access data were used in this study.
Acknowledgments
During the preparation of this manuscript, the author used OpenAI (GPT-5.6) for language editing and assistance in checking the presentation of the results. The author reviewed all AI-assisted output and takes full responsibility for the content of the publication.
Conflicts of Interest
The author declares no conflicts of interest.
References
- European Parliament; Council of the European Union. Decision (EU) 2022/2481 of the European Parliament and of the Council of 14 December 2022 establishing the Digital Decade Policy Programme 2030. Off. J. Eur. Union 2022, L 323, 4–26. Available online: https://eur-lex.europa.eu/eli/dec/2022/2481/oj/eng (accessed on 3 August 2026).
- European Commission. State of the Digital Decade 2026: Closing Structural Gaps and Mobilising Investments for 2030 and Beyond; European Commission: Brussels, Belgium, 2026; Available online: https://digital-strategy.ec.europa.eu/en/library/state-digital-decade-2026-closing-structural-gaps-and-mobilising-investments-2030-and-beyond (accessed on 20 August 2026).
- Eurostat. Digital Society Statistics at Regional Level. Available online: https://ec.europa.eu/eurostat/statistics-explained/index.php?title=Digital_society_statistics_at_regional_level (accessed on 20 August 2026).
- van Deursen, A.J.A.M.; van Dijk, J.A.G.M. The digital divide shifts to differences in usage. New Media Soc. 2014, 16, 507–526. [Google Scholar] [CrossRef] [Scilit]
- Brandtzæg, P.B.; Heim, J.; Karahasanović, A. Understanding the new digital divide—A typology of Internet users in Europe. Int. J. Hum. Comput. Stud. 2011, 69, 123–138. [Google Scholar] [CrossRef] [Scilit]
- Demoussis, M.; Giannakopoulos, N. Facets of the digital divide in Europe: Determination and extent of Internet use. Econ. Innov. New Technol. 2006, 15, 235–246. [Google Scholar] [CrossRef] [Scilit]
- Goldfarb, A.; Prince, J. Internet adoption and usage patterns are different: Implications for the digital divide. Inf. Econ. Policy 2008, 20, 2–15. [Google Scholar] [CrossRef] [Scilit]
- Gomes, A.; Dias, J.G. Digital divide in the European Union: A typology of EU citizens. Soc. Indic. Res. 2025, 176, 149–172. [Google Scholar] [CrossRef] [Scilit]
- Vicente, M.R.; López, A.J. Assessing the regional digital divide across the European Union-27. Telecommun. Policy 2011, 35, 220–237. [Google Scholar] [CrossRef] [Scilit]
- Szeles, M.R. New insights from a multilevel approach to the regional digital divide in the European Union. Telecommun. Policy 2018, 42, 452–463. [Google Scholar] [CrossRef] [Scilit]
- Caravella, S.; Cirillo, V.; Crespi, F.; Guarascio, D.; Menghini, M. The diffusion of digital skills across EU regions: Structural drivers and polarisation dynamics. Reg. Stud. Reg. Sci. 2023, 10, 820–844. [Google Scholar] [CrossRef] [Scilit]
- Apostol, S.; Hernández-Rodríguez, E. Digitalisation in European regions: Unravelling the impact of relatedness and complexity on digital technology adoption and productivity growth. Ind. Innov. 2025, 32, 772–801. [Google Scholar] [CrossRef] [Scilit]
- Martínez Guerrero, M.; Ortega Egea, J.M.; Román González, M.V. Application of the latent class regression methodology to the analysis of Internet use for banking transactions in the European Union. J. Bus. Res. 2007, 60, 137–145. [Google Scholar] [CrossRef] [Scilit]
- Bălăcescu, A.; Pătrașcu, A.; Tănăsescu, A. Analysis of disparities in Internet purchases by individuals at the EU state level. Electronics 2023, 12, 982. [Google Scholar] [CrossRef] [Scilit]
- Sadowski, A.; Lewandowska-Gwarda, K.; Pisarek-Bartoszewska, R.; Engelseth, P. A longitudinal study of e-commerce diversity in Europe. Electron. Commer. Res. 2021, 21, 169–194. [Google Scholar] [CrossRef] [Scilit]
- Roberts, D.R.; Bahn, V.; Ciuti, S.; Boyce, M.S.; Elith, J.; Guillera-Arroita, G.; Hauenstein, S.; Lahoz-Monfort, J.J.; Schröder, B.; Thuiller, W.; et al. Cross-validation strategies for data with temporal, spatial, hierarchical, or phylogenetic structure. Ecography 2017, 40, 913–929. [Google Scholar] [CrossRef] [Scilit]
- Scheerder, A.; van Deursen, A.J.A.M.; van Dijk, J.A.G.M. Determinants of Internet skills, uses and outcomes: A systematic review of the second- and third-level digital divide. Telemat. Inform. 2017, 34, 1607–1624. [Google Scholar] [CrossRef] [Scilit]
- Helsper, E.J. A corresponding fields model for the links between social and digital exclusion. Commun. Theory 2012, 22, 403–426. [Google Scholar] [CrossRef] [Scilit]
- Pérez-Hernández, J.; Sánchez-Mangas, R. To have or not to have Internet at home: Implications for online shopping. Inf. Econ. Policy 2011, 23, 213–226. [Google Scholar] [CrossRef] [Scilit]
- Gefen, D.; Karahanna, E.; Straub, D.W. Trust and TAM in online shopping: An integrated model. MIS Q. 2003, 27, 51–90. [Google Scholar] [CrossRef] [Scilit]
- Lian, J.W.; Yen, D.C. Online shopping drivers and barriers for older adults: Age and gender differences. Comput. Hum. Behav. 2014, 37, 133–143. [Google Scholar] [CrossRef] [Scilit]
- Cruz-Jesus, F.; Oliveira, T.; Bacao, F. Digital divide across the European Union. Inf. Manag. 2012, 49, 278–291. [Google Scholar] [CrossRef] [Scilit]
- Szeles, M.R.; Simionescu, M. Regional patterns and drivers of the EU digital economy. Soc. Indic. Res. 2020, 150, 95–119. [Google Scholar] [CrossRef] [Scilit]
- Gomez-Herrera, E.; Martens, B.; Turlea, G. The drivers and impediments for cross-border e-commerce in the EU. Inf. Econ. Policy 2014, 28, 83–96. [Google Scholar] [CrossRef] [Scilit]
- Farag, S.; Weltevreden, J.; van Rietbergen, T.; Dijst, M.; van Oort, F. E-shopping in the Netherlands: Does geography matter? Environ. Plan. B Plan. Des. 2006, 33, 59–74. [Google Scholar] [CrossRef] [Scilit]
- Breiman, L. Random forests. Mach. Learn. 2001, 45, 5–32. [Google Scholar] [CrossRef] [Scilit]
- Geurts, P.; Ernst, D.; Wehenkel, L. Extremely randomized trees. Mach. Learn. 2006, 63, 3–42. [Google Scholar] [CrossRef] [Scilit]
- Nicodemus, K.K.; Malley, J.D.; Strobl, C.; Ziegler, A. The behaviour of random forest permutation-based variable importance measures under predictor correlation. BMC Bioinform. 2010, 11, 110. [Google Scholar] [CrossRef] [Scilit] [PubMed]
- Daoud, Y.; Kammoun, A. Analyzing and forecasting e-commerce adoption drivers among SMEs: A machine learning approach. Hum. Behav. Emerg. Technol. 2024, 2024, 7747136. [Google Scholar] [CrossRef] [Scilit]
- Cameron, A.C.; Miller, D.L. A practitioner’s guide to cluster-robust inference. J. Hum. Resour. 2015, 50, 317–372. [Google Scholar] [CrossRef] [Scilit]
- MacKinnon, J.G.; Webb, M.D. Wild bootstrap inference for wildly different cluster sizes. J. Appl. Econom. 2017, 32, 233–254. [Google Scholar] [CrossRef] [Scilit]
- Hausman, J.A. Specification tests in econometrics. Econometrica 1978, 46, 1251–1271. [Google Scholar] [CrossRef] [Scilit]
- Eurostat. Territorial Units for Statistics (NUTS)—GISCO. Available online: https://ec.europa.eu/eurostat/web/gisco/geodata/statistical-units/territorial-units-statistics (accessed on 20 August 2026).
- Moran, P.A.P. Notes on continuous stochastic phenomena. Biometrika 1950, 37, 17–23. [Google Scholar] [CrossRef] [Scilit]
- Anselin, L. Local indicators of spatial association—LISA. Geogr. Anal. 1995, 27, 93–115. [Google Scholar] [CrossRef] [Scilit]
- Elhorst, J.P. Spatial Econometrics: From Cross-Sectional Data to Spatial Panels; Springer: Berlin/Heidelberg, Germany, 2014. [Google Scholar] [CrossRef] [Scilit]
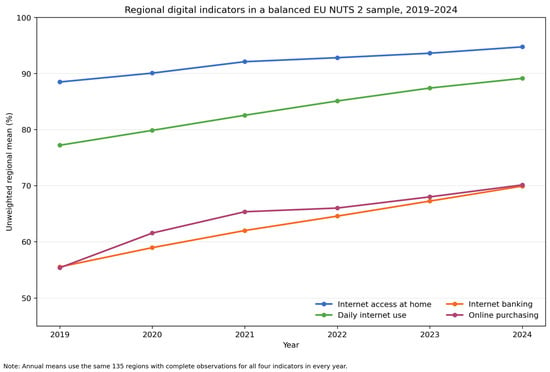
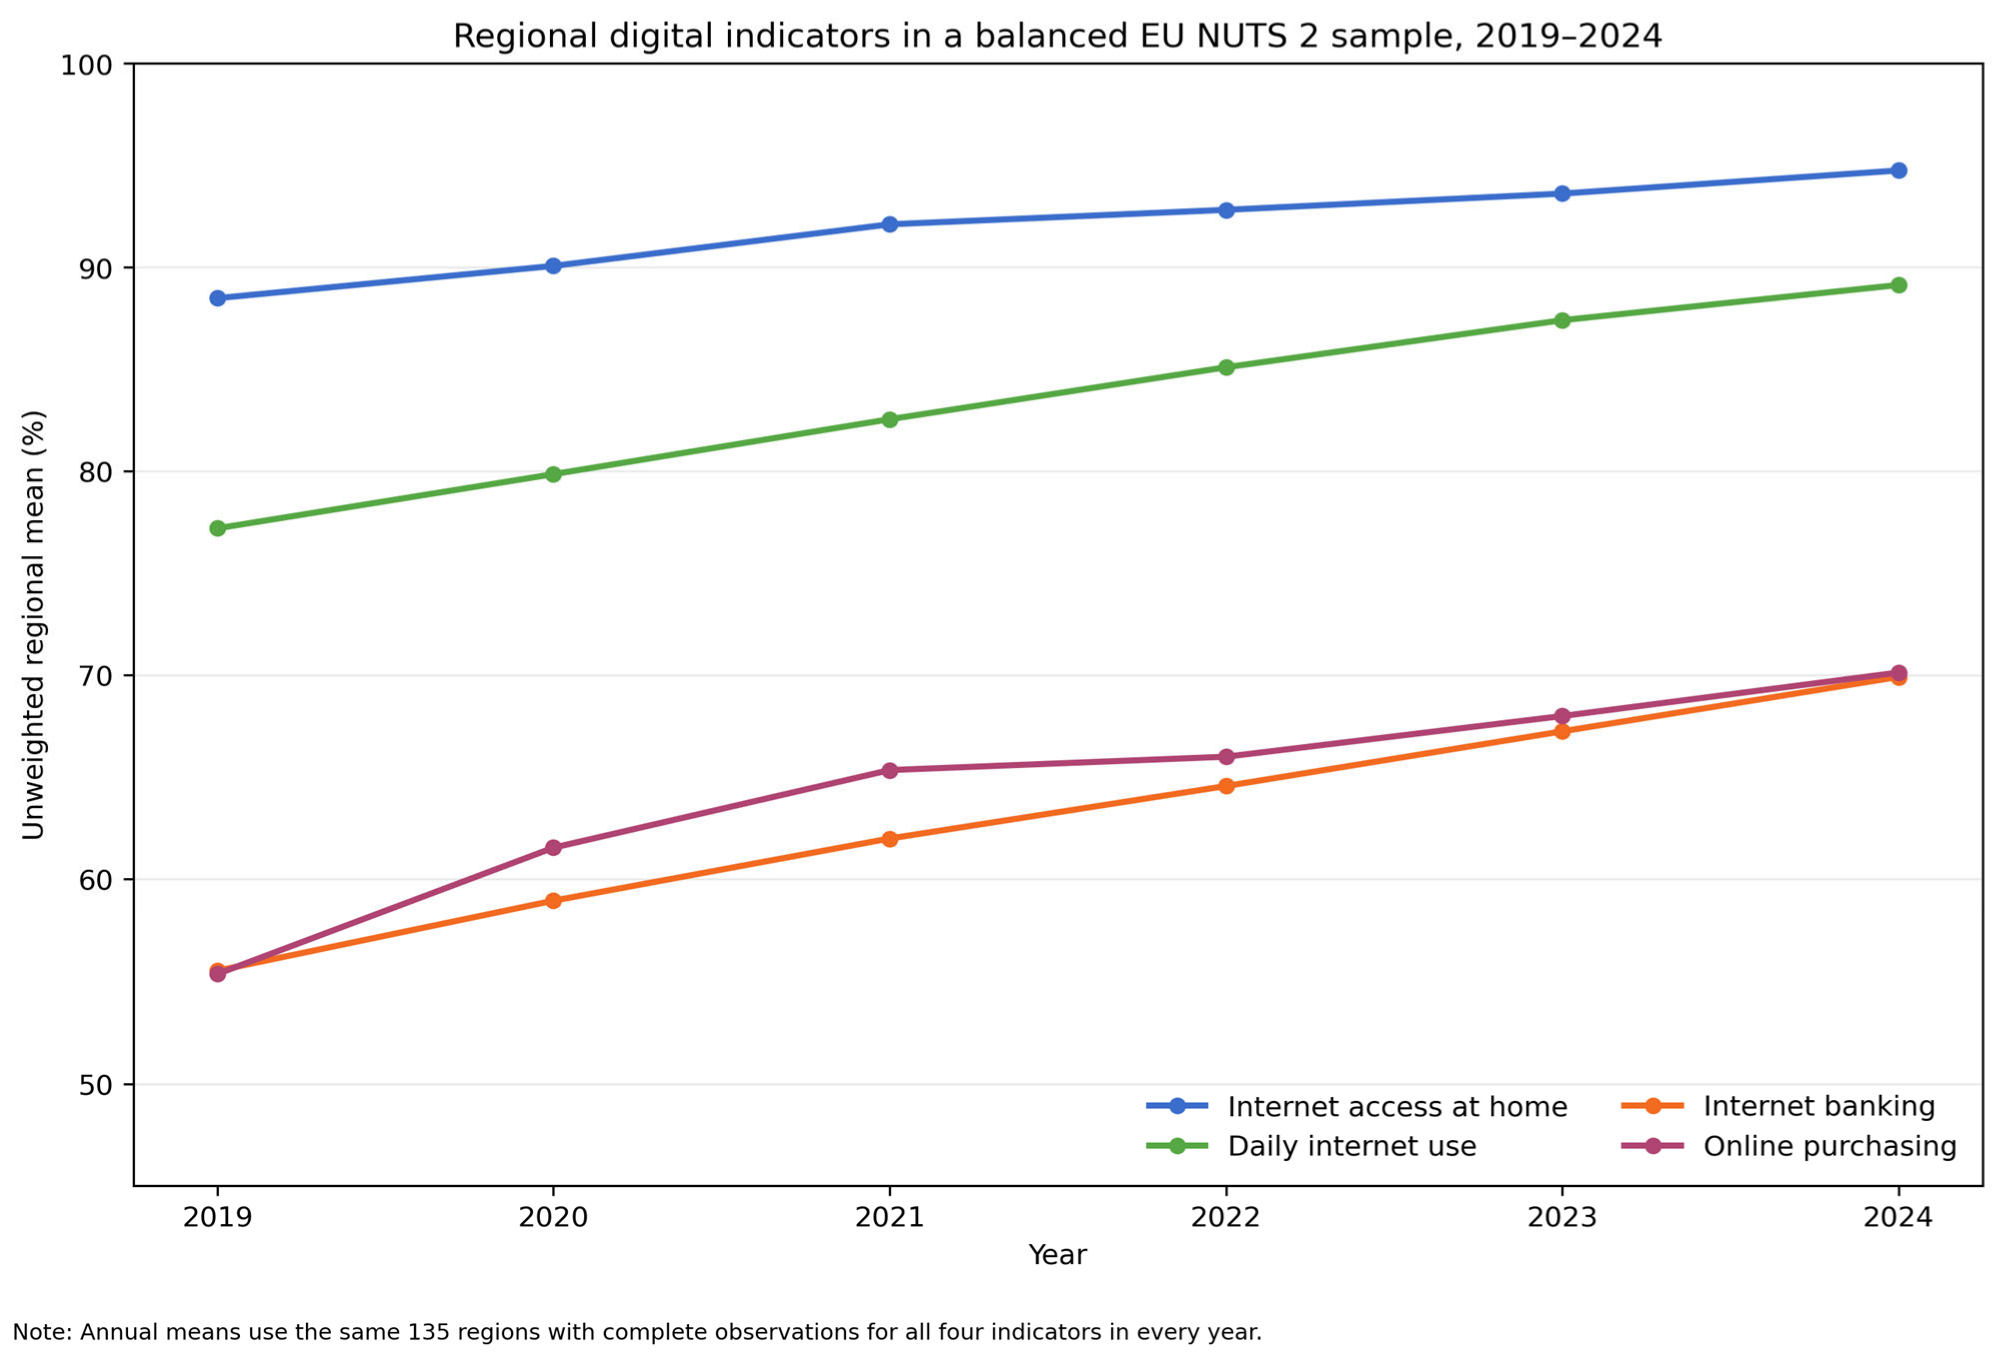
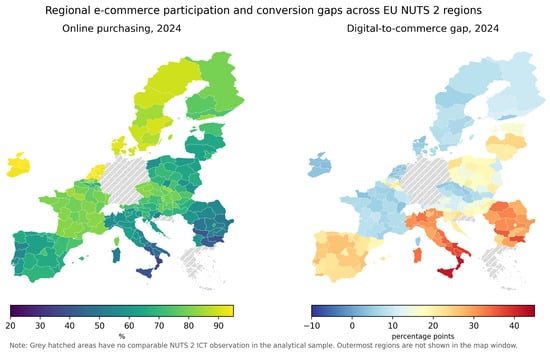
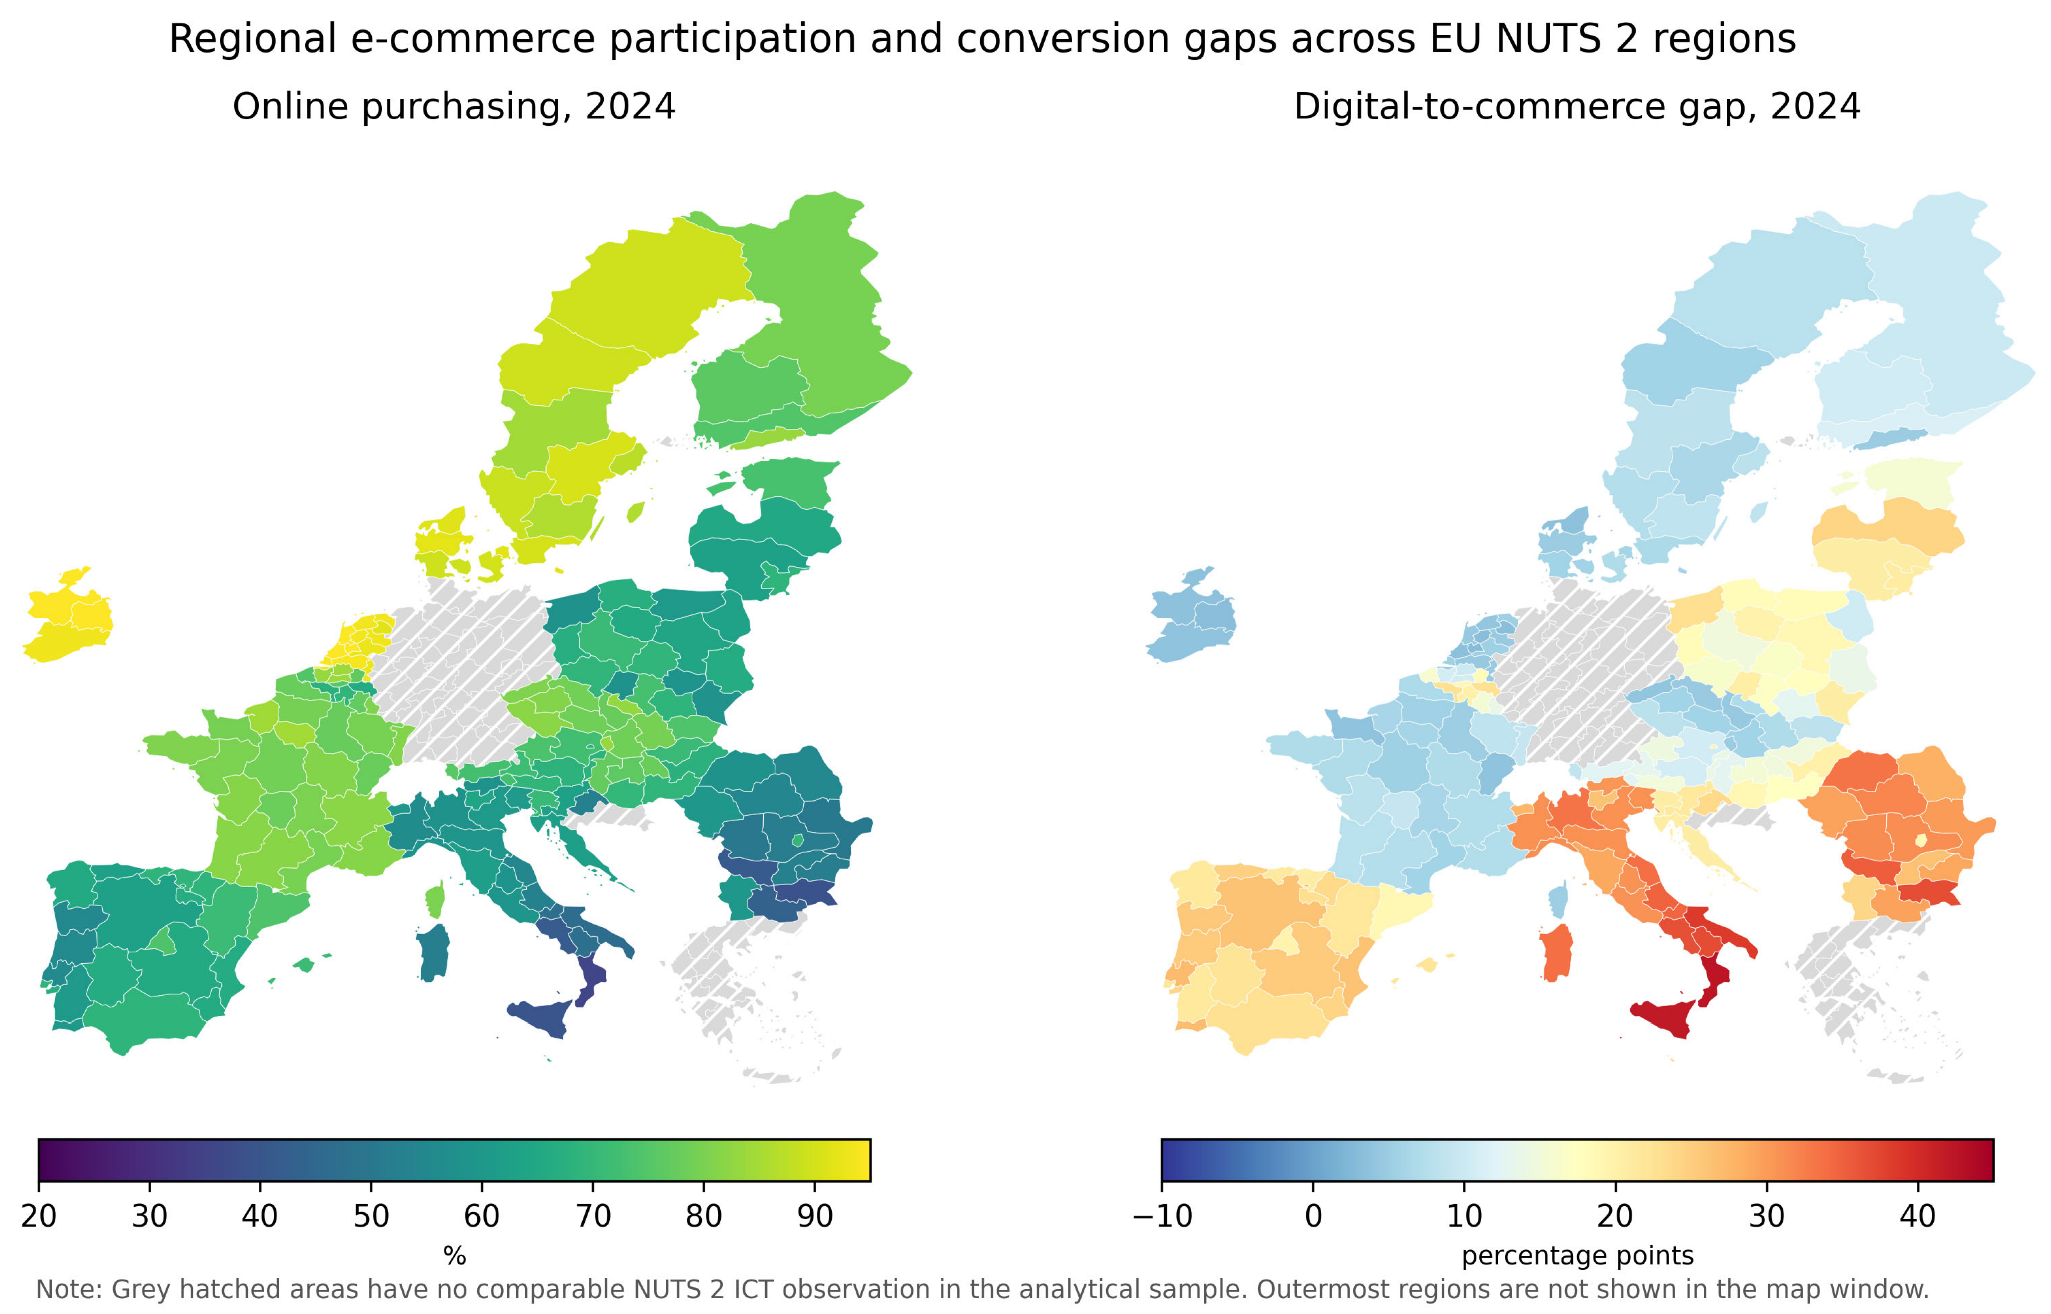
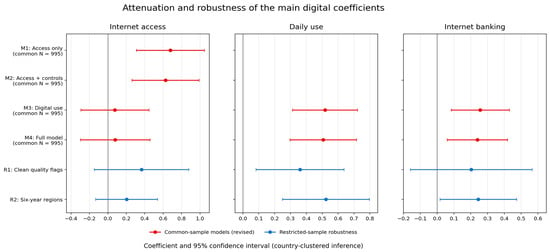
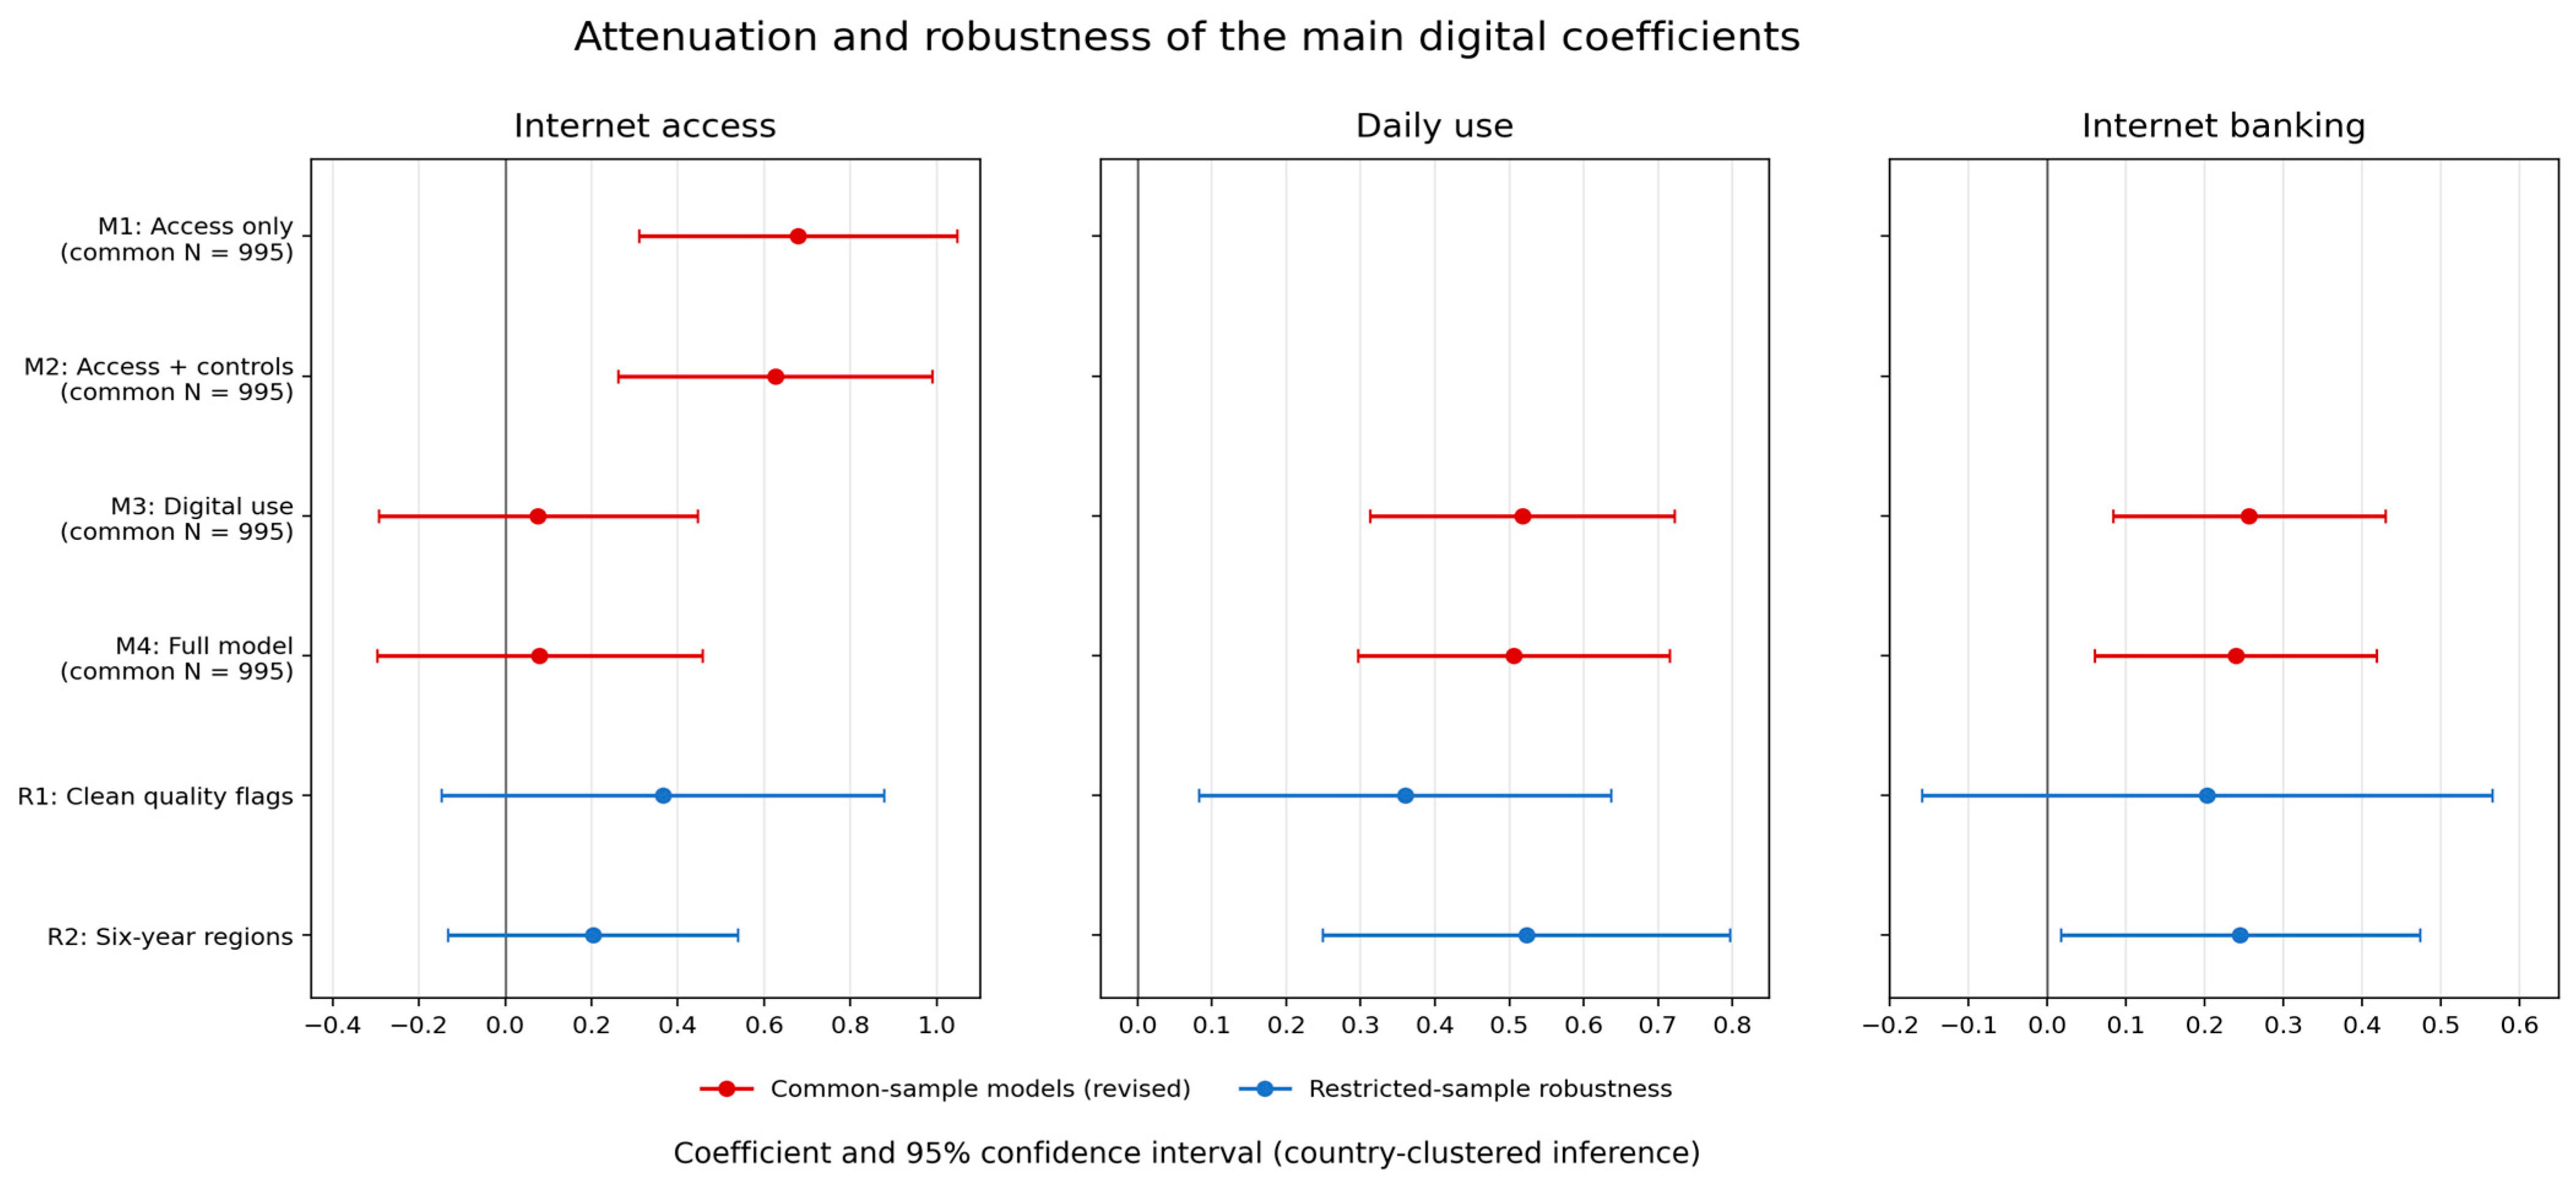
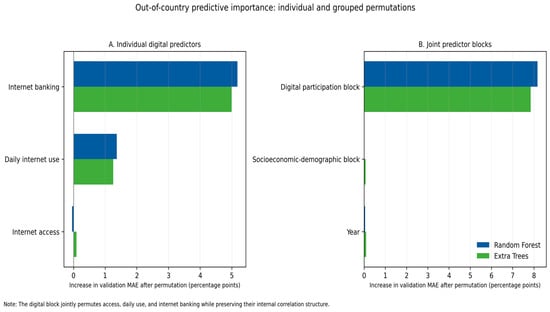
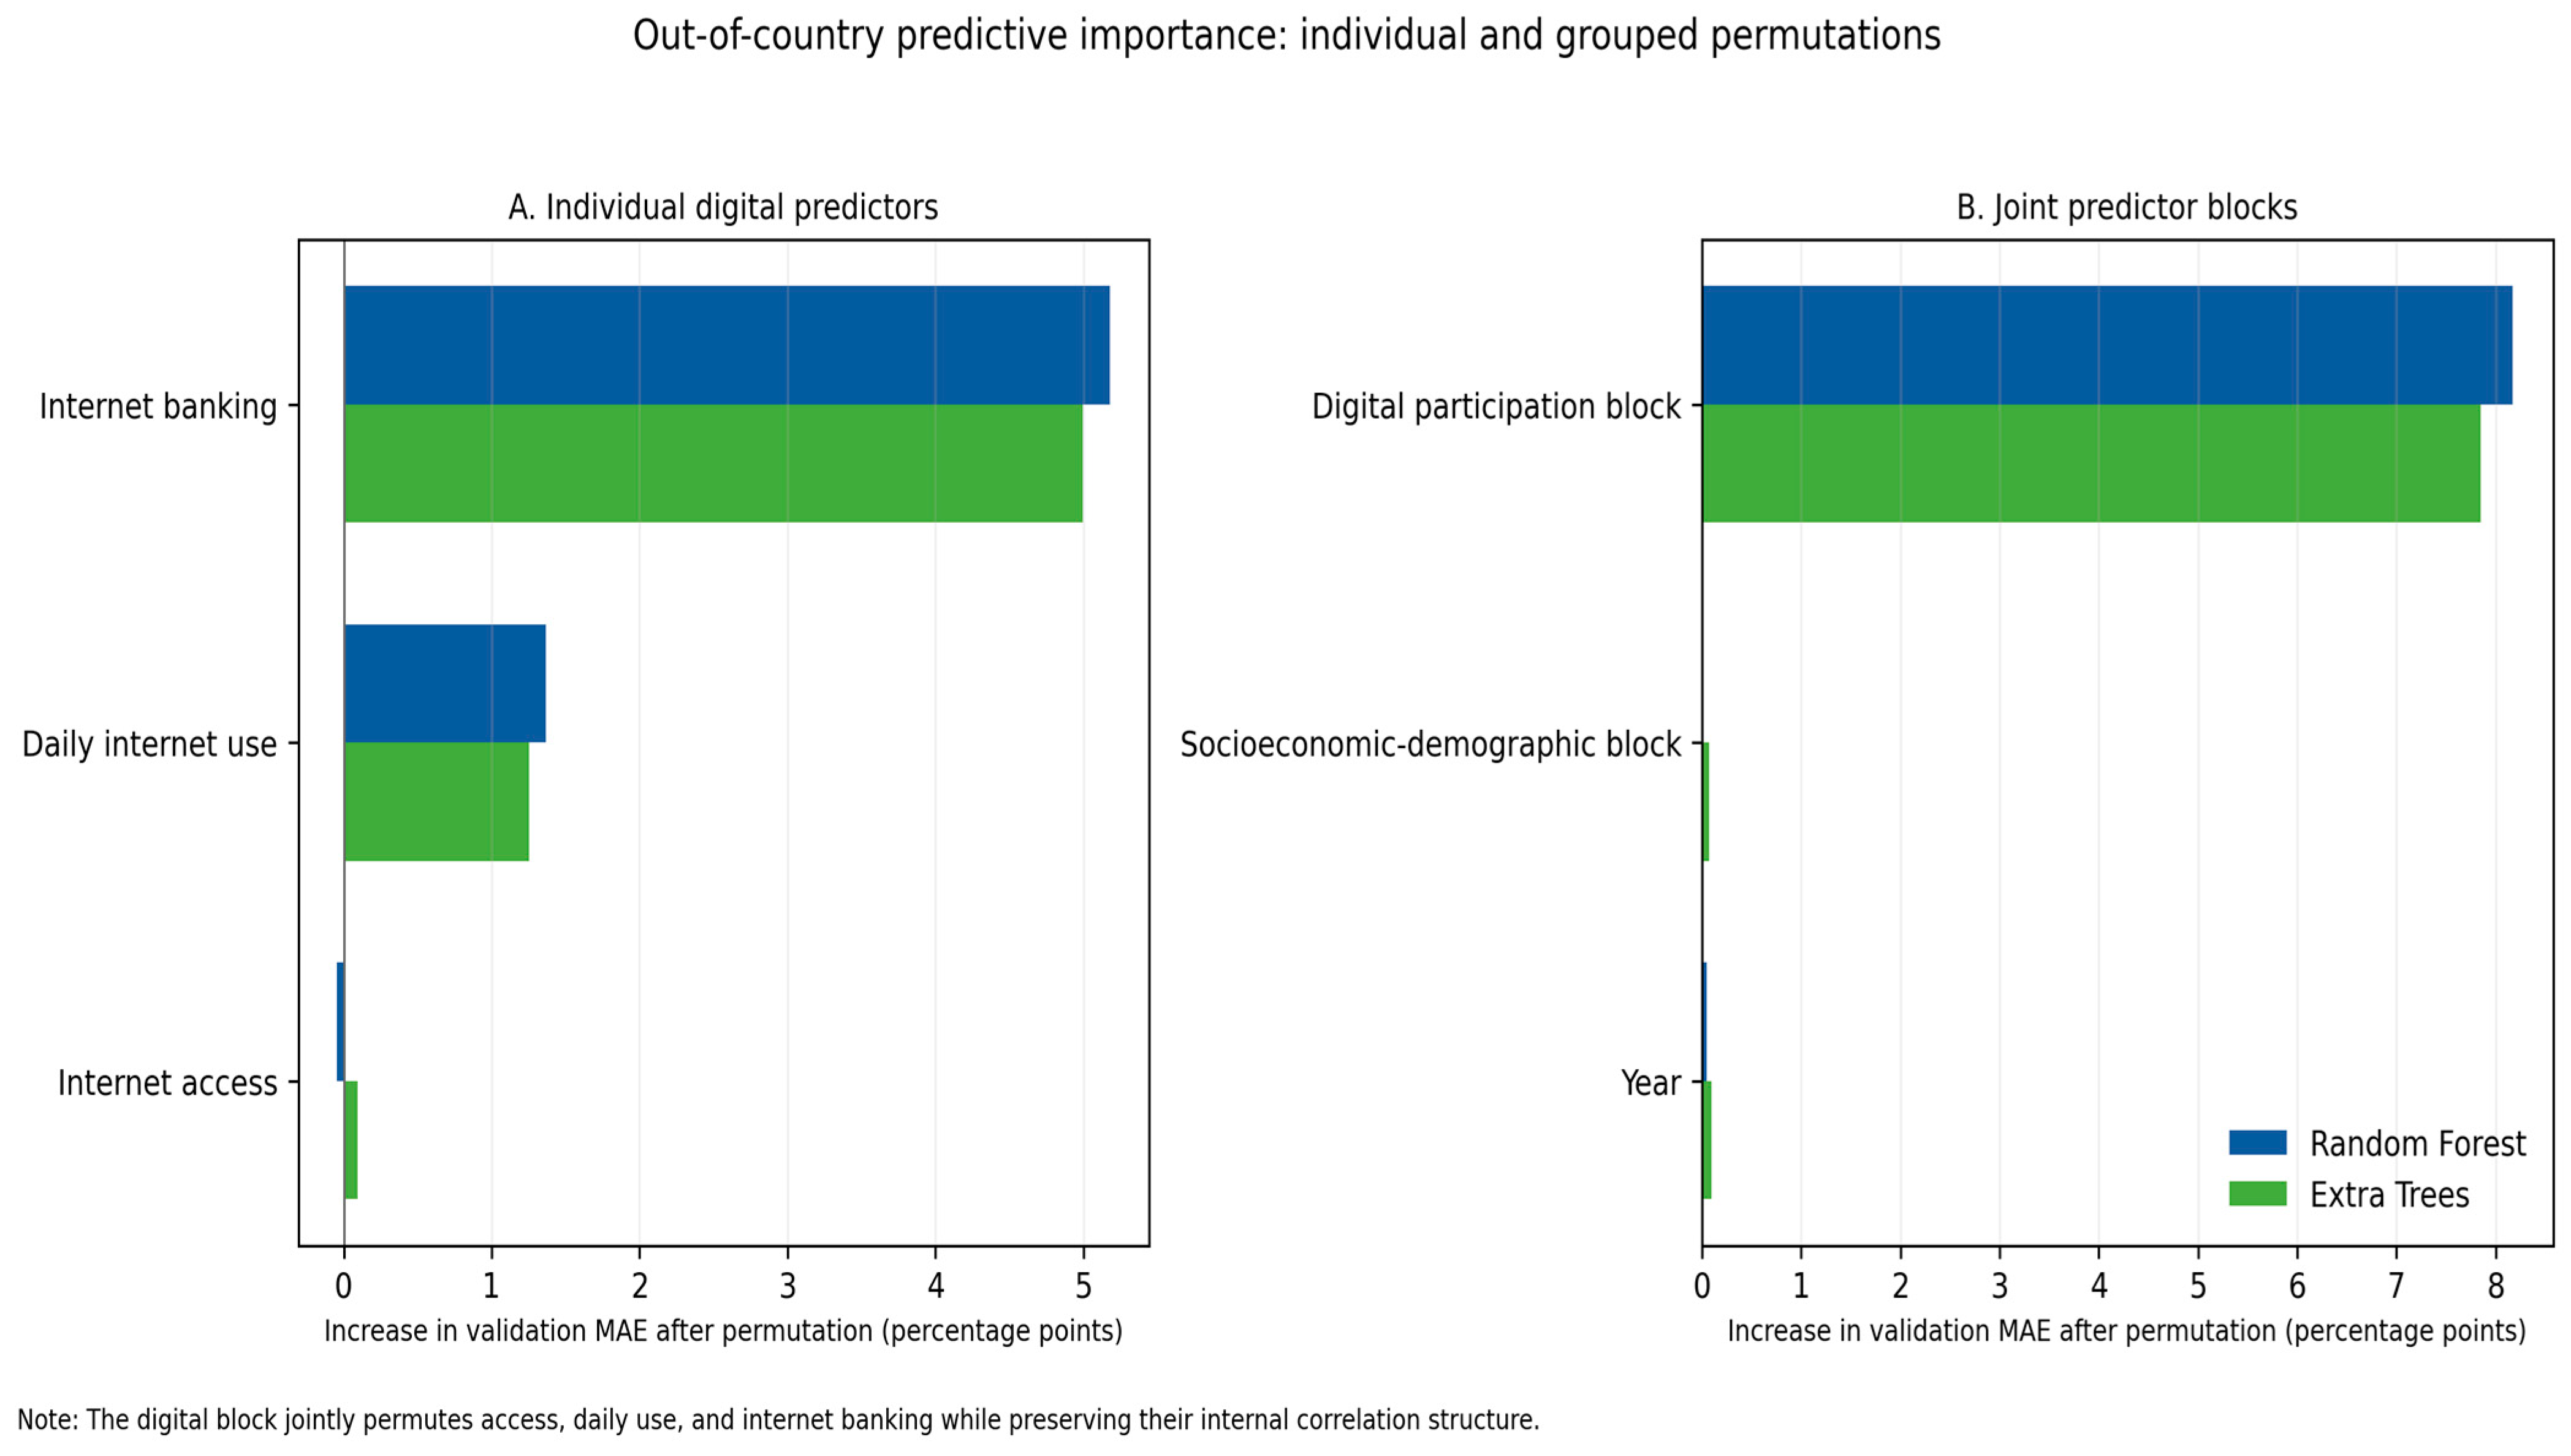

Disclaimer/Publisher’s Note: The statements, opinions and data contained in all publications are solely those of the individual author(s) and contributor(s) and not of MDPI and/or the editor(s). MDPI and/or the editor(s) disclaim responsibility for any injury to people or property resulting from any ideas, methods, instructions or products referred to in the content. |
© 2026 by the author. Licensee MDPI, Basel, Switzerland. This article is an open access article distributed under the terms and conditions of the Creative Commons Attribution (CC BY) license.