


Abstract
Accurately predicting user purchase intentions is a critical challenge in e-commerce operations. Existing methods often rely on simple statistical features, lacking systematic theoretical guidance and model interpretability. To address these limitations, this study proposes a predictive framework that integrates the e-commerce conversion funnel model with interpretable machine learning. Utilizing a real-world dataset of approximately 37 million user behavior logs from Jingdong Group, we construct a five-dimensional feature engineering system comprising basic attributes, conversion rates, behavioral stability, overall activity, and interaction patterns. We evaluate four representative algorithms, including Decision Tree, Random Forest, XGBoost, and CatBoost. Experimental results demonstrate that the proposed multidimensional feature system significantly enhances the predictive performance of all tested models. Notably, CatBoost achieves the highest classification performance, reaching an accuracy of 0.9737 when utilizing all features. Furthermore, feature ablation experiments confirm the indispensable contribution of each extracted feature dimension. To overcome the black-box issue of machine learning models, we employ SHapley Additive exPlanations (SHAP) for in-depth feature attribution analysis. The SHAP results reveal that while basic traffic indicators establish a global baseline for purchase intent, behavioral stability and interaction features also serve as crucial leading indicators for final purchase decisions. This research provides a theory-driven paradigm for feature engineering and offers transparent insights for e-commerce platforms to optimize precision marketing strategies.
1. Introduction
Driven by the continuous enhancement of Internet infrastructure and the widespread adoption of mobile payment technologies, the global e-commerce market has exhibited rapid growth and fundamentally reshaped modern retail business [1,2]. According to data released by the National Bureau of Statistics of China, national online retail sales reached over 15.97 trillion RMB Yuan in 2025, representing a year-on-year increase of 8.6% [3]. As the proportion of online retail sales within the total retail sales of consumer goods continues to boost, e-commerce has established itself as the core driving force of consumer economic growth. However, against the backdrop of diminishing demographic dividends in user acquisition, e-commerce platforms are facing increasingly fierce competition. Consequently, accurately identifying purchase intentions from massive volumes of user behavioral data has emerged as one of the main challenges in the refined operation of e-commerce [4,5].
The massive volumes of behavioral data generated by users on e-commerce platforms, such as search paths, browsing duration, product favoriting, adding-to-cart, order payments, and post-purchase commenting, provide a rich data foundation for user behavior analysis [6,7]. Traditional marketing strategies, which largely rely on demographic characteristics and simple heuristics, may struggle to capture the dynamic and complex nature of user behavior. Consequently, there is an urgent need to leverage data-driven approaches to achieve precise predictions of purchasing behavior and facilitate personalized interventions [8]. Fortunately, consumer behavior theory enables us to understand the user’s purchase decision-making process [9,10]. For instance, the Theory of Planned Behavior (TPB) [11] claims that consumer purchasing behavior is jointly determined by attitude toward the behavior, subjective norms, and perceived behavioral control. TPB offers a theoretical framework for analyzing purchase intentions from a cognitive psychology perspective. The Technology Acceptance Model (TAM) [12] explains the critical driving roles of perceived usefulness and perceived ease of use in users’ adoption of online shopping behaviors.
Traditional consumer behavior theories emphasize the consumer’s sequential characteristics, which progress through attention, interest, search, action, and ultimately, sharing. Interestingly, this process closely aligns with the e-commerce funnel model [13,14]. Users typically navigate a funnel-like pathway, advancing from broad browsing to in-depth interactions (e.g., favoriting or adding items to the cart), and ultimately final conversion (i.e., purchasing). At each stage, users would generate a substantial volume of heterogeneous features indicative of their latent preferences. Therefore, integrating consumer behavior theories with the e-commerce funnel model, augmented by scientific feature engineering, serves as a fundamental prerequisite for accurately profiling users and capturing their underlying purchase motivations [15,16,17].
Feature engineering acts as a critical bridge connecting raw data with machine learning models, and directly dictates the upper bound of predictive performance [18]. User behavior logs encompass diverse interaction records. The core challenge in enhancing predictive efficacy lies in extracting discriminative features from high-dimensional raw behavioral data [19,20]. Bucklin and Sismeiro [21] were among the first to utilize clickstream data to model website browsing behavior, revealing the predictive value of browsing depth and dwell time for purchase conversions. Based on a dynamic conversion model, Moe and Fader [22] demonstrated the correlation between user visit patterns and purchase probabilities. However, existing research on feature construction mostly focuses on a single dimension (e.g., frequency statistics), lacking a multidimensional and systematic feature design grounded in consumer behavior theories. Studies that integrate basic behavioral features, conversion rate features, behavioral stability features, overall activity features, and interaction features remain scarce. Such a multidimensional feature system holds the potential to more comprehensively describe users’ decision-making from initial browsing to final purchase [23,24].
Simultaneously, breakthroughs in artificial intelligence and big data technologies have provided powerful tools for processing high-dimensional e-commerce data [25]. Traditional statistical methods, such as logistic regression, increasingly struggle to meet the predictive demands of complex e-commerce scenarios due to inherent bottlenecks in modeling non-linear relationships and handling high-dimensional sparse features [26]. In recent years, tree-based machine learning algorithms (e.g., Decision Trees and Random Forests) [27,28] and advanced gradient boosting tree algorithms (e.g., XGBoost and CatBoost) [29,30] have demonstrated superior performance in predicting user purchase behavior. Le et al. [31] utilized an ensemble XGBoost model to predict online purchase conversion over a consumer behavior dataset from Google Merchandise Store, reaching an AUC of 79.11%. Chen et al. [32] proposed an improved RF model for customer purchase predictions. The F1-score of this model reached 0.92 over 8062 support samples. Manikandan et al. [33] presented an advanced machine learning approach with feature selection for predicting purchase behavior. They demonstrated a superior accuracy value of 94.75%. The success of machine learning-enabled user behavior prediction models is largely attributed to their exceptional generalization capabilities and efficacy in processing massive amounts of categorical features. However, as model complexity scales, the trade-off between high predictive accuracy and model interpretability becomes pronounced, posing new challenges for both theoretical academic research and practical business deployment [34,35].
Notably, existing research exhibits the following research questions. First, feature engineering lacks systematic guidance from consumer behavior theories and e-commerce funnel models, leading to an underdeveloped multidimensional feature framework. Current studies usually rely on algorithm-driven automated extraction or basic frequency statistics (e.g., simply counting the number of page views or purchases). The underlying business logic of these features is often neglected. For instance, simple statistical features may struggle to capture the stability of user interests or accurately reflect the conversion intent from initial browsing to final purchase [36]. The absence of a multidimensional feature system endowed with actionable business significance directly constrains further breakthroughs in the upper bounds of model predictive performance [37]. Second, there is a pronounced deficit in model interpretability analysis. Consequently, the mechanisms through which key behavioral features influence purchase decisions remain inadequately elucidated [38]. Although machine learning algorithms have achieved great success in predictive accuracy, their internal decision-making mechanisms are highly complex and exhibit black-box characteristics. Most existing research merely stops at reporting the predictive performance metrics, failing to address which specific features dominate users’ purchase decisions. In the practical operations of e-commerce, business practitioners not only need to identify who is likely to make a purchase, but more pressingly, they need to understand why, in order to formulate targeted intervention strategies. The lack of interpretability analyses limits machine learning models from translating the predictive outputs into actionable business insights.
To address these limitations, this study conducts research on user purchasing behavior prediction based on a real-world dataset from JD.com. We propose a predictive framework that integrates business theoretical paradigms with interpretable machine learning. This research not only provides a theory-driven feature engineering paradigm, but also offers potential decision-making support for formulating precision marketing and personalized recommendation strategies on e-commerce platforms. The main contributions of this study are as follows:
- Distinct from feature construction approaches that rely solely on raw data statistics, this study integrates the e-commerce business funnel model to extract high-value business features across five dimensions, namely fundamental attributes, conversion rates, behavioral stability, overall activity, and user interaction. This approach enriches the dimensional representation of user intent and establishes a high-quality data foundation for subsequent model training.
- In response to the high-dimensional and non-linear characteristics of user purchasing features, we construct four machine learning models: Decision Tree, Random Forest, XGBoost, and CatBoost. By employing multidimensional evaluation metrics for rigorous comparative validation, this study comprehensively reveals the performance disparities and applicability boundaries of these algorithms when processing complex, real-world e-commerce behavioral data on both JD.com and Alibaba user purchase behavior datasets.
- To address the black-box issue inherent in machine learning models, this paper introduces the SHAP (SHapley Additive exPlanations) framework to perform feature attribution on the best-performing model. We not only clearly quantify the contribution of features across different dimensions, but also profoundly reveal the marginal impacts of key composite features, such as the browsing rate and intent-to-browse ratio, on purchase decisions. This could enhance the interpretability and actionable business value of the predictive model.
2. Materials and Methods
2.1. Dataset Construction
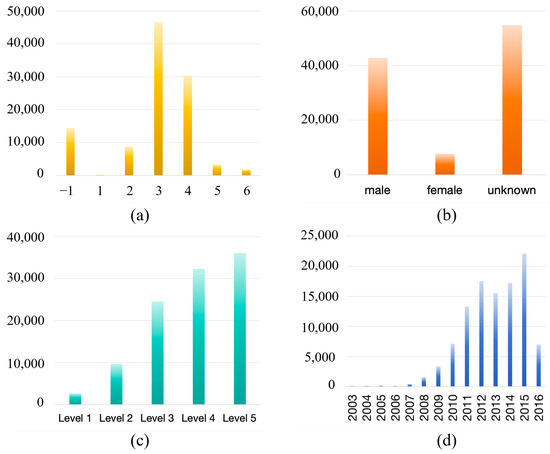
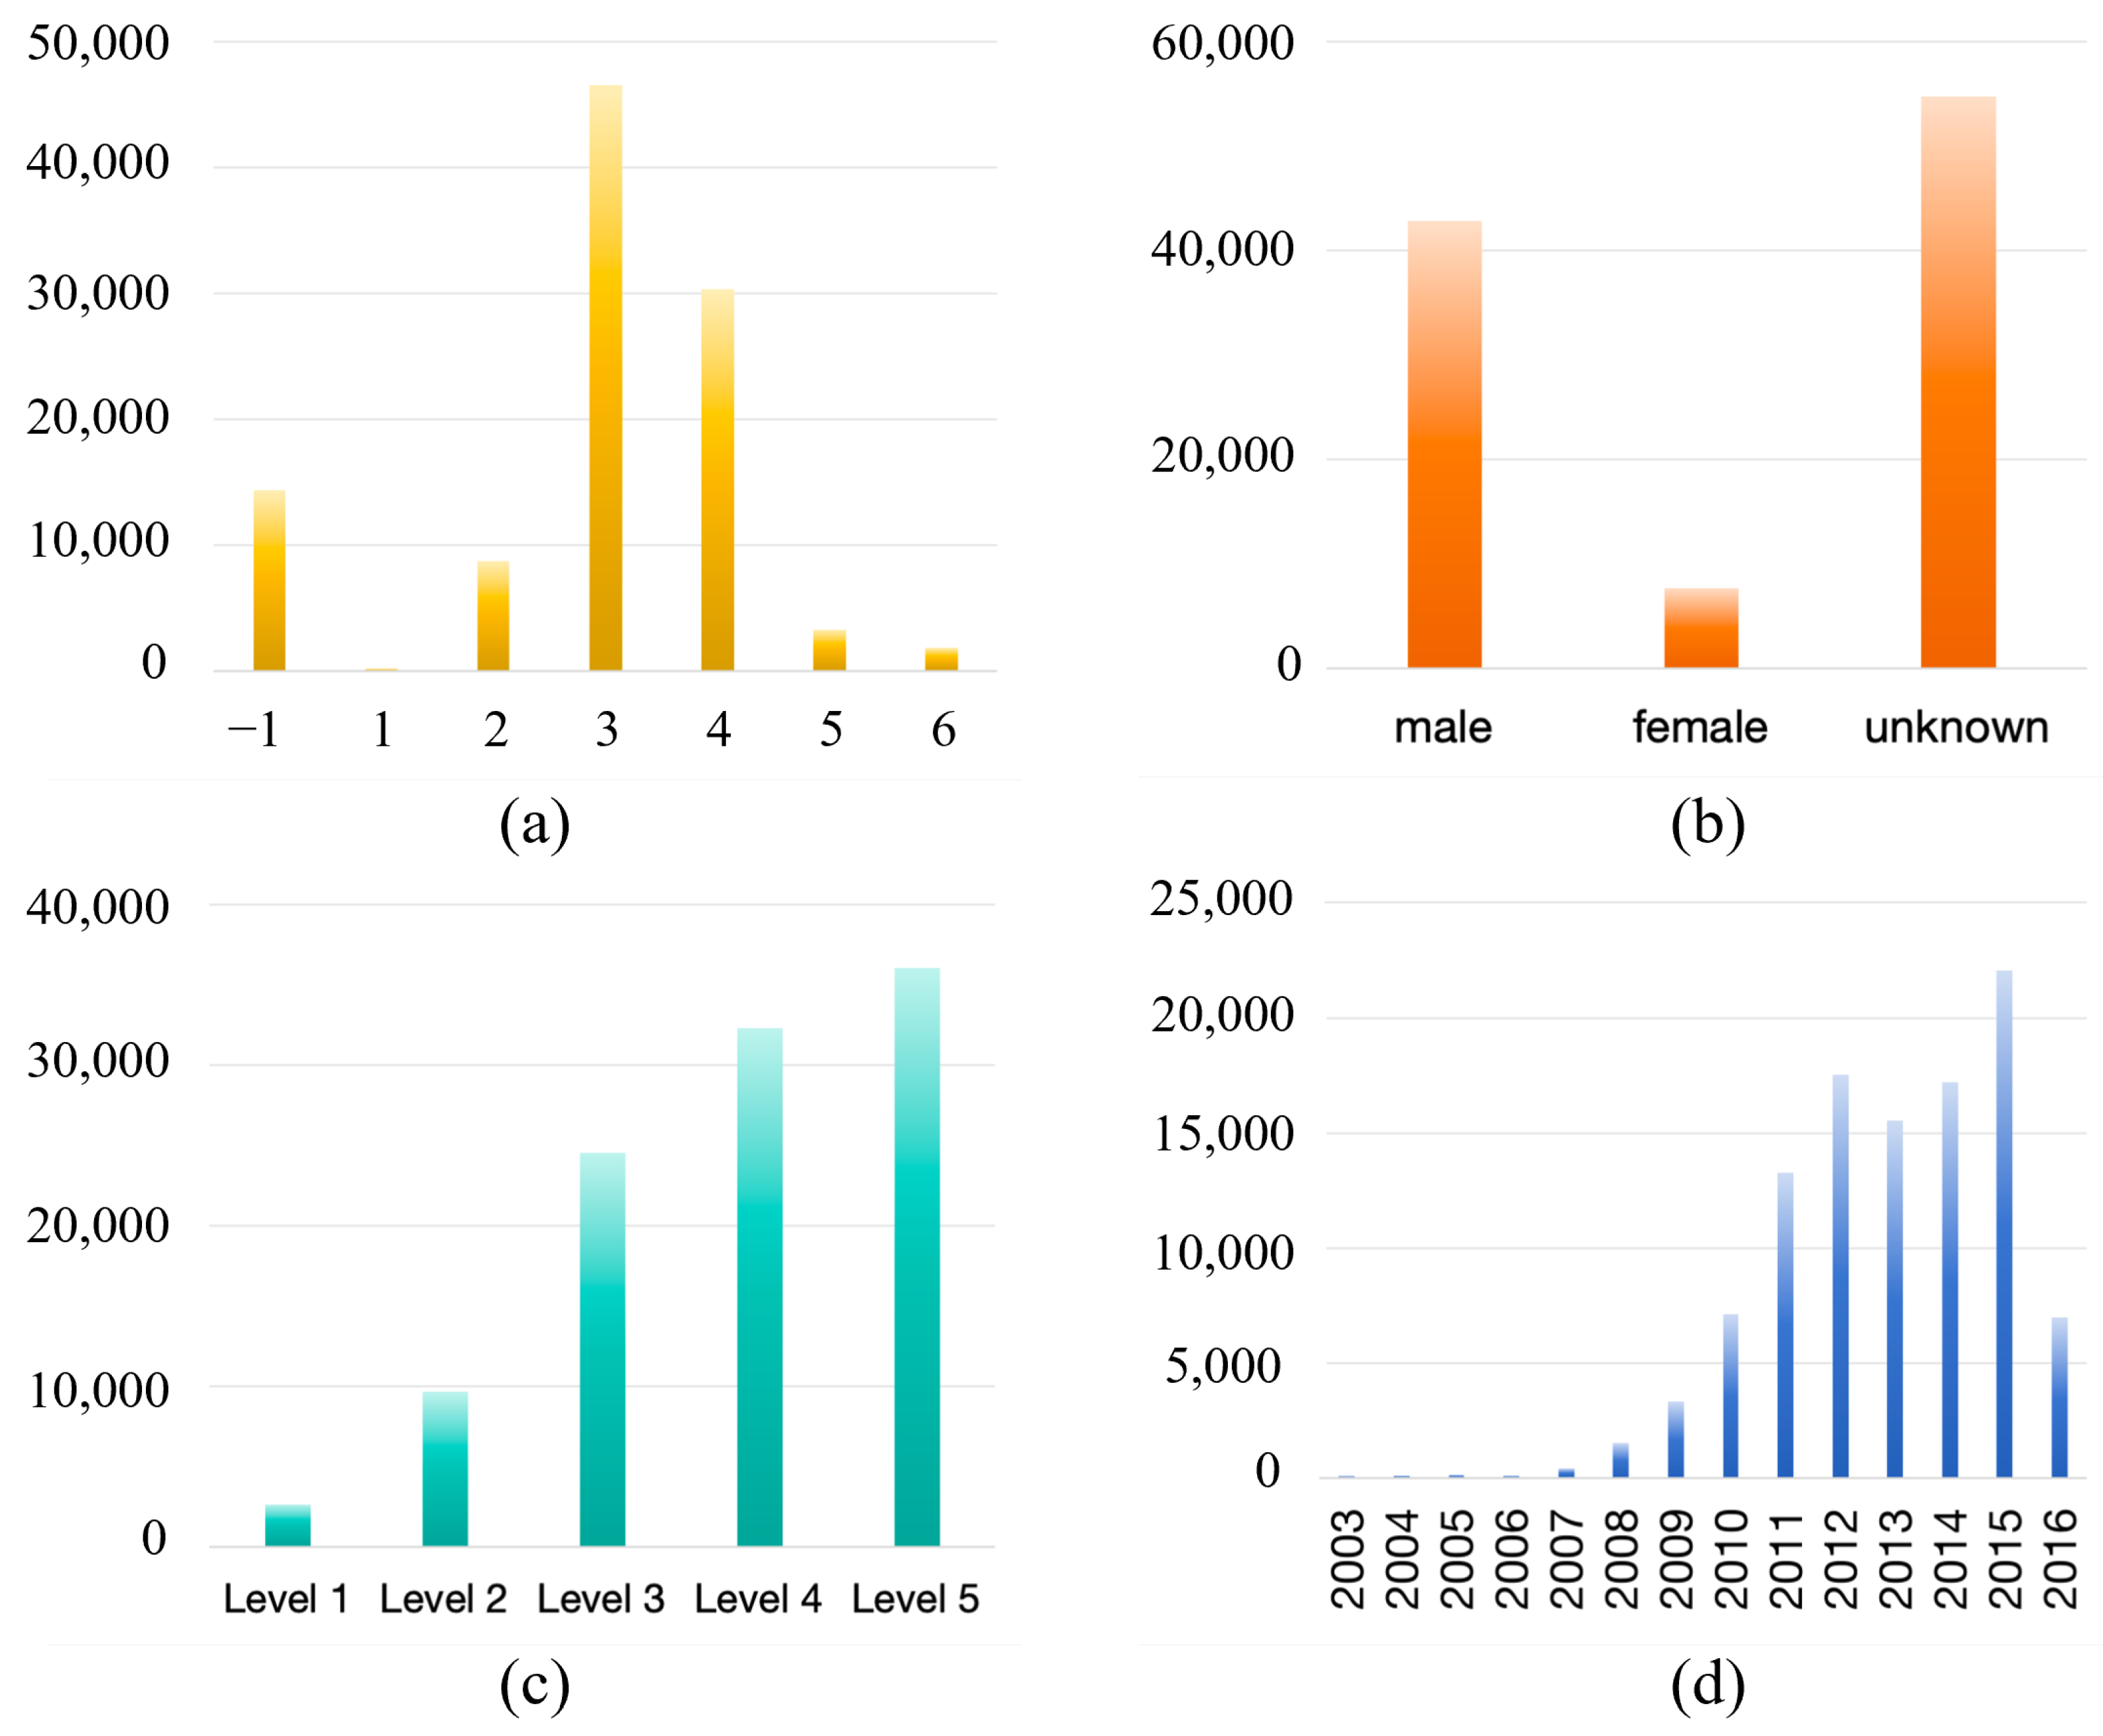
In this study, we adopt a real-world user behavior prediction dataset from JD.com [39]. In brief, JD.com is a leading online retailer in China, covering a comprehensive product category, while accumulating massive user data. This dataset contains real user behavior data from February 2018 to April 2018. To protect user privacy, portions of the data are anonymized. This dataset includes user behavior logs, basic user information, product review information, product information, and merchant store information. Before feeding this dataset to machine learning models, we perform a data cleansing operation, including deleting data records with missing and abnormal values, leading to a total of approximately 37 million user behavior logs. Figure 1 presents a statistics summary of the user attributes.
Figure 1.
A statistics summary of the user attributes. (a) Age distribution (Note: −1 denotes unknown, 1 denotes users under 20 years old, 2 denotes 20–30 years old, 3 denotes 30–40 years old, and so on), (b) gender distribution, (c) account level (Note: High levels indicate the users have purchased more products and participated in more activities on the platform), and (d) account registration year.
It is noted that users between 30 and 50 years old represent its primary consumer group, while male users appear more. According to JD.com’s user level definitions and promotion rules, users progress to higher membership levels primarily through purchase activities, active engagement, and participation in platform events. Consequently, the paying user segment is expected to include a considerable proportion of loyal users, who are generally assigned to higher membership levels (e.g., Levels 3–5). Meanwhile, the number of registered users experiences a steady increase with time.
Given a user, the dataset records his/her basic behavior types (e.g., View, Add-to-Cart, Comment, etc.) and their corresponding counts. Also, we can have access to the date information. Assume that we are trying to predict whether the user would purchase any product on Datet. To formulate the multidimensional feature input, all basic features (e.g., View, Comment, Add-to-cart, Like, and Purchase) in the past 7-day period (i.e., from Datet−7 to Datet−1), as well as basic features at Datet but apart from the Purchase count, are utilized to transform them into high-level features (e.g., conversion, behavior stability, overall activity, and interaction features). An example record of a single user is presented in Table S1. Specifically, for labeling, if a single purchase operation occurs at Datet, this data record would be marked by ‘Buy’; otherwise, the label would be ‘no-Buy’. This leads us to a binary classification problem. So, we are not dealing with predicting the probability of purchasing a specific product from a user, which makes the prediction task easier. Considering personalized recommendations in the e-commerce platform, if the machine learning algorithm predicts that this user has purchase intention, then the retailer would recommend their products or release coupons for sales.
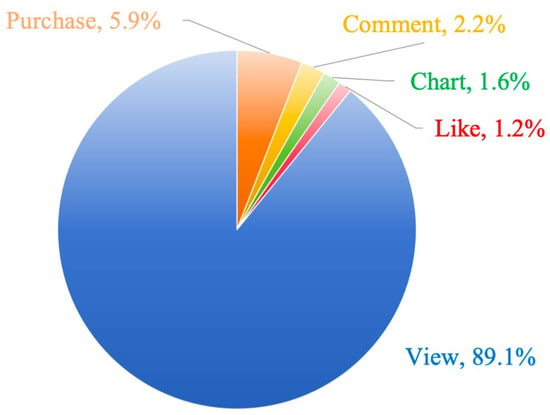
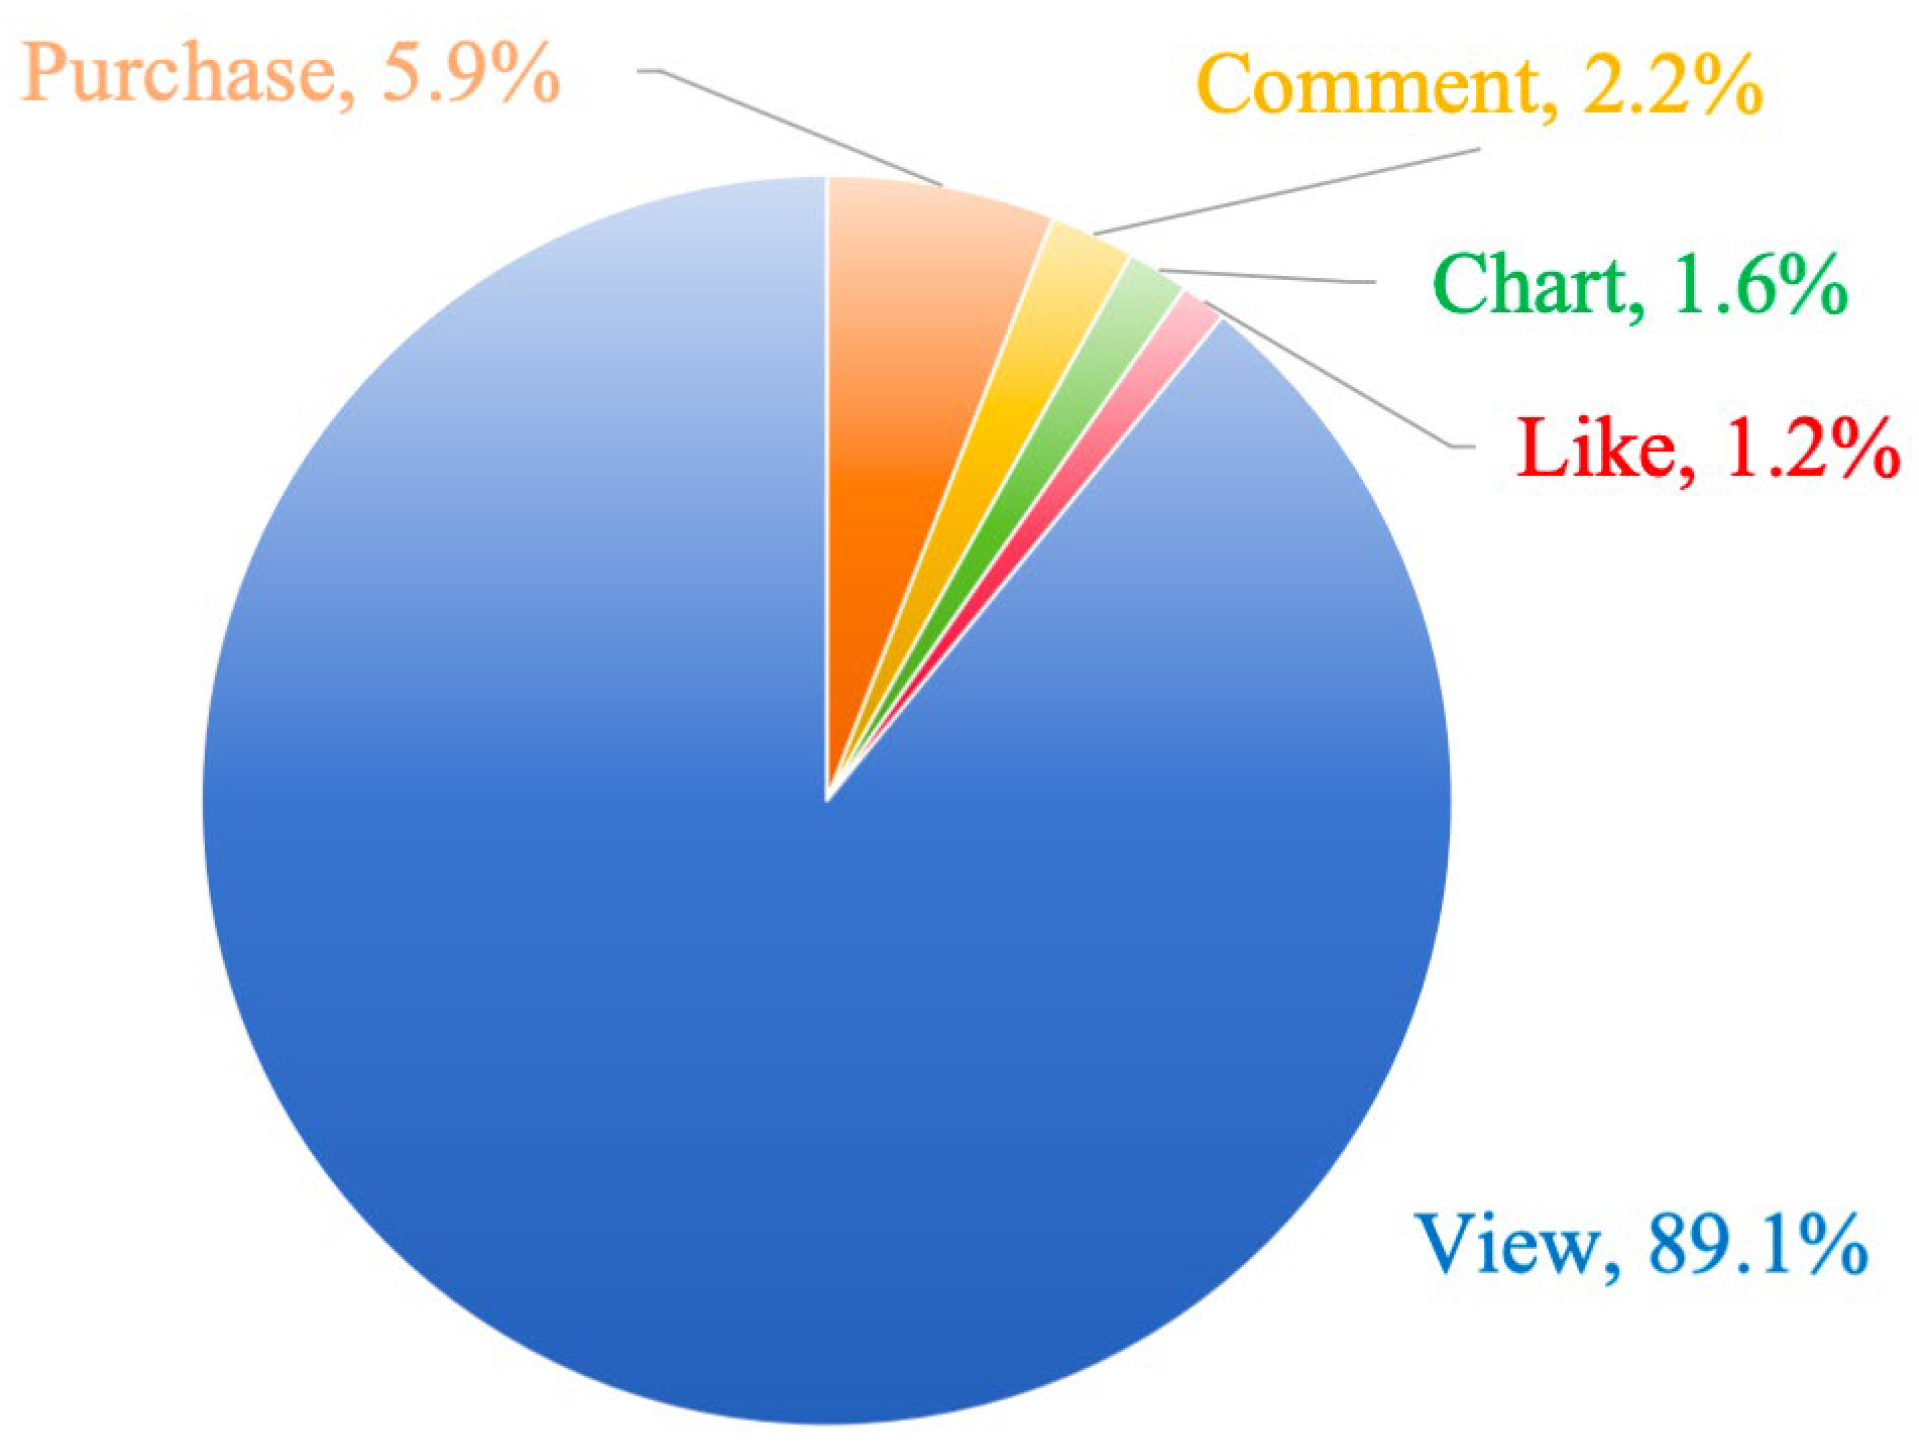
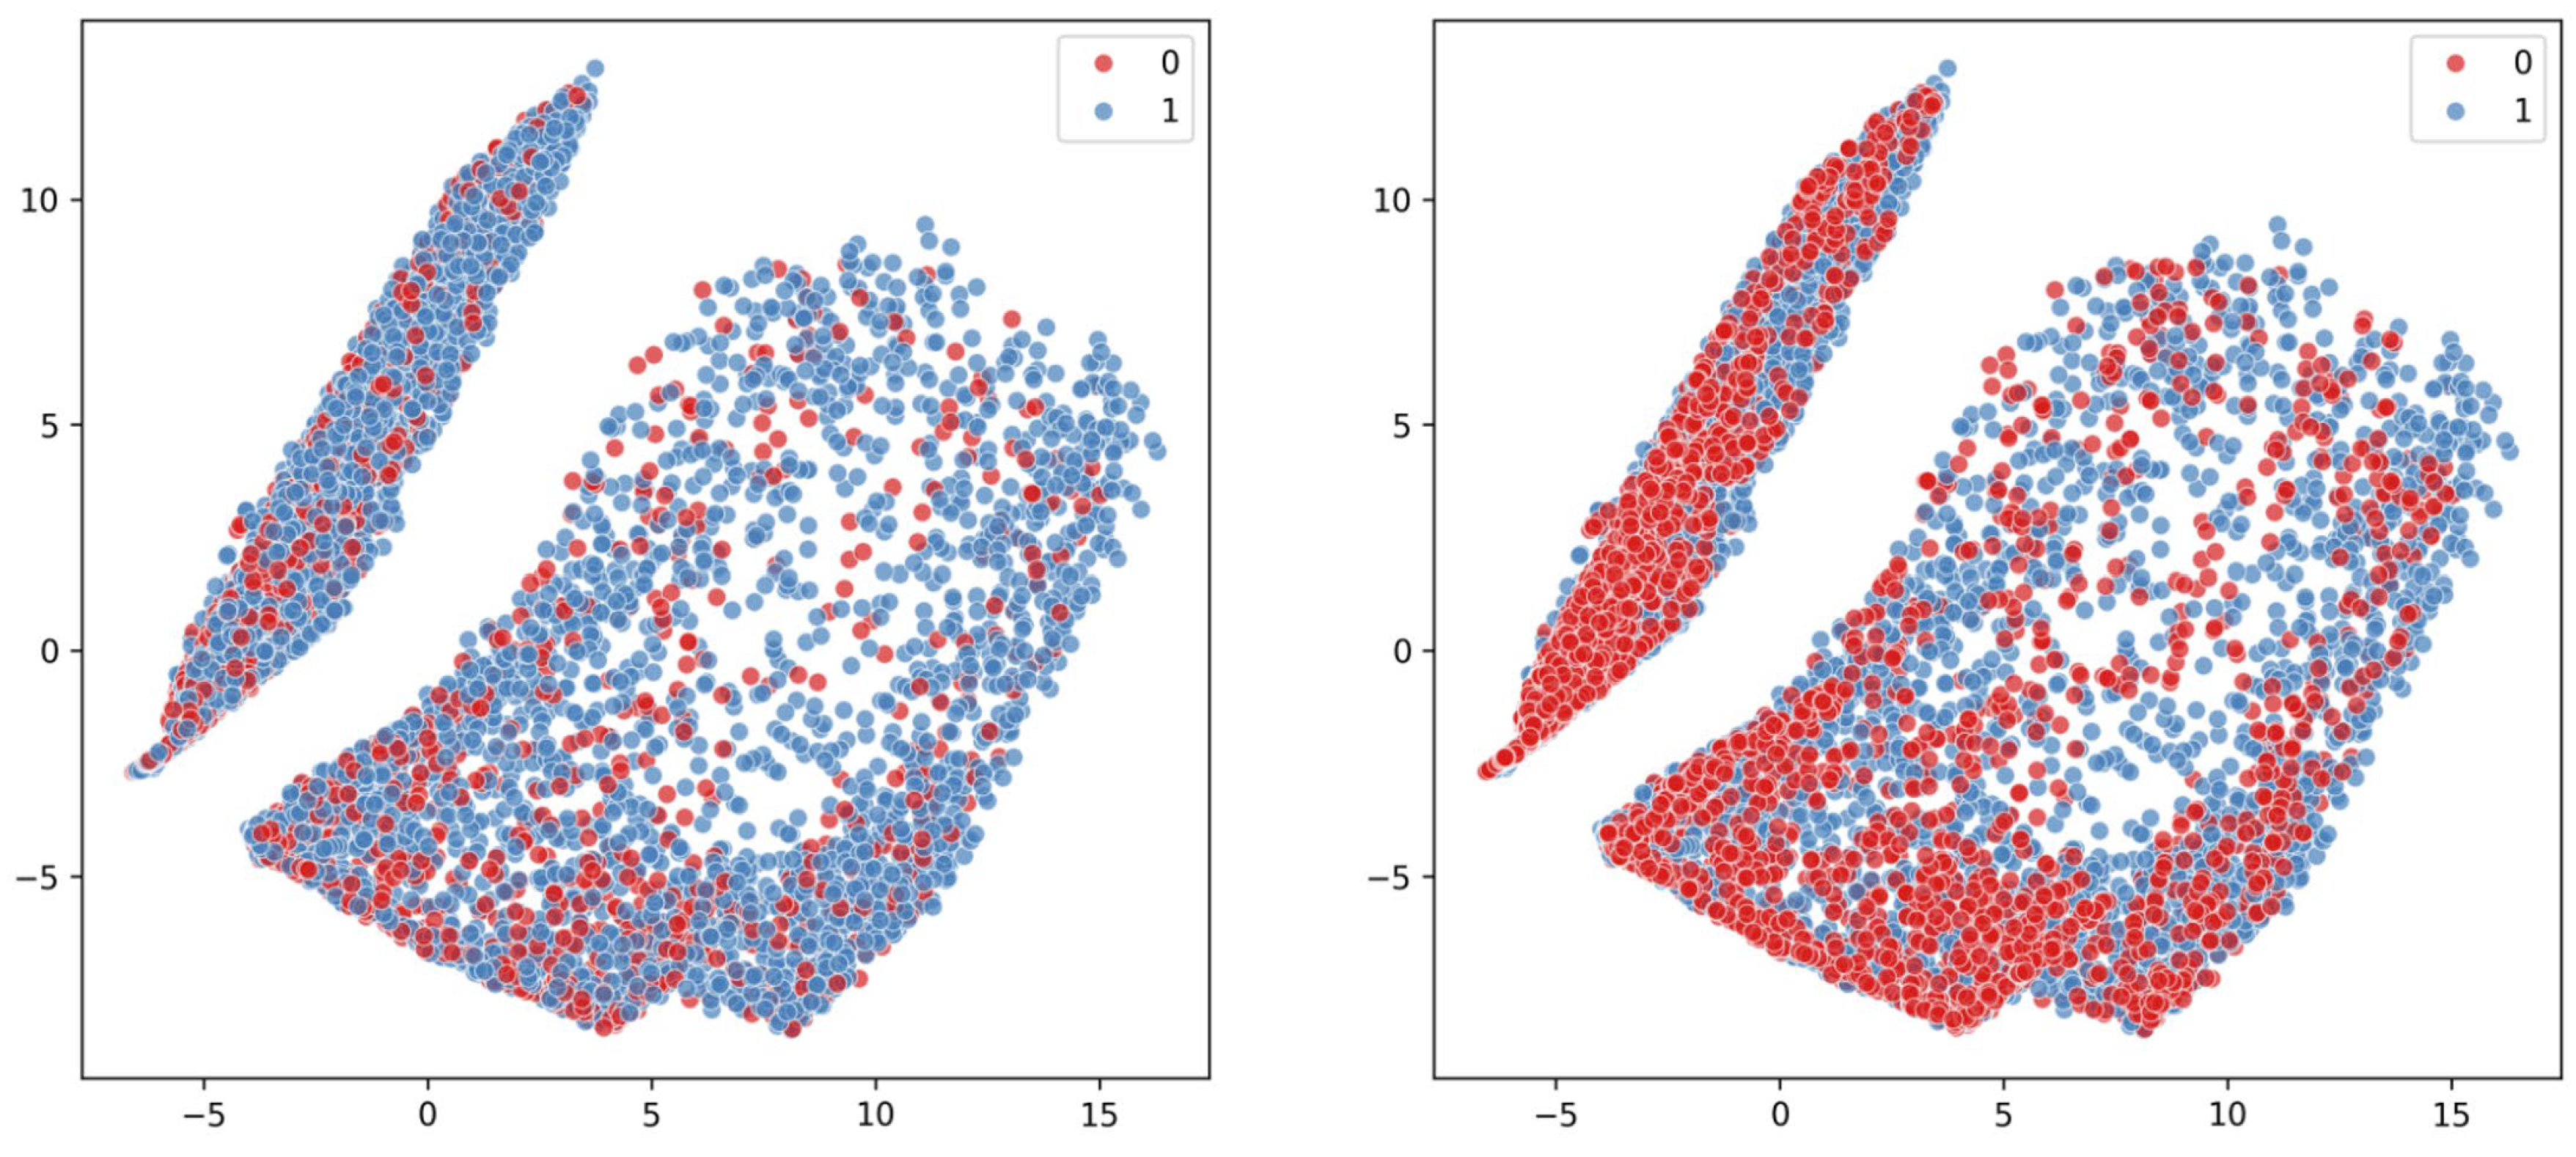
Figure 2 displays the proportion of total behavioral events. We observe that the view behavior accounts for 89.1%, while the purchase behavior accounts for only 5.9%. This indicates that, among users with purchase experience, an average of approximately 15 view activities results in one purchase action, revealing a significant imbalance in the data distribution. To handle this issue, we perform SMOTE upsampling to balance the positive (i.e., purchase, denoted by 0) and negative samples (i.e., not purchase, denoted by 1) ratio (see Figure 3). The dataset is divided into training and validation sets at a ratio of 8:2, and a 5-fold cross-validation strategy is employed to ensure the robustness and reliability of the prediction results. We ensure that both training and validation sets maintain the original data distribution. A class distribution of each split fold is presented in Table S2. It should be noted that the SMOTE upsampling is only applied to the training set to avoid the data leakage risk. The SMOTE upsampling is disabled over the validation set to maintain the original data distribution. In addition, all features directly linked to purchase outcomes are removed. We also avoid splitting the data records of the same user into both training and validation sets to prevent data leakage and enable fair evaluation. This is achieved by filtering the user’s unique identification number.
Figure 2.
Pie chart of user behavior distribution.
Figure 3.
Comparison of the feature spaces of positive and negative samples. Left: before SMOTE; Right: after SMOTE. Note: we randomly selected 10,000 samples to display.
2.2. Overview of This Study
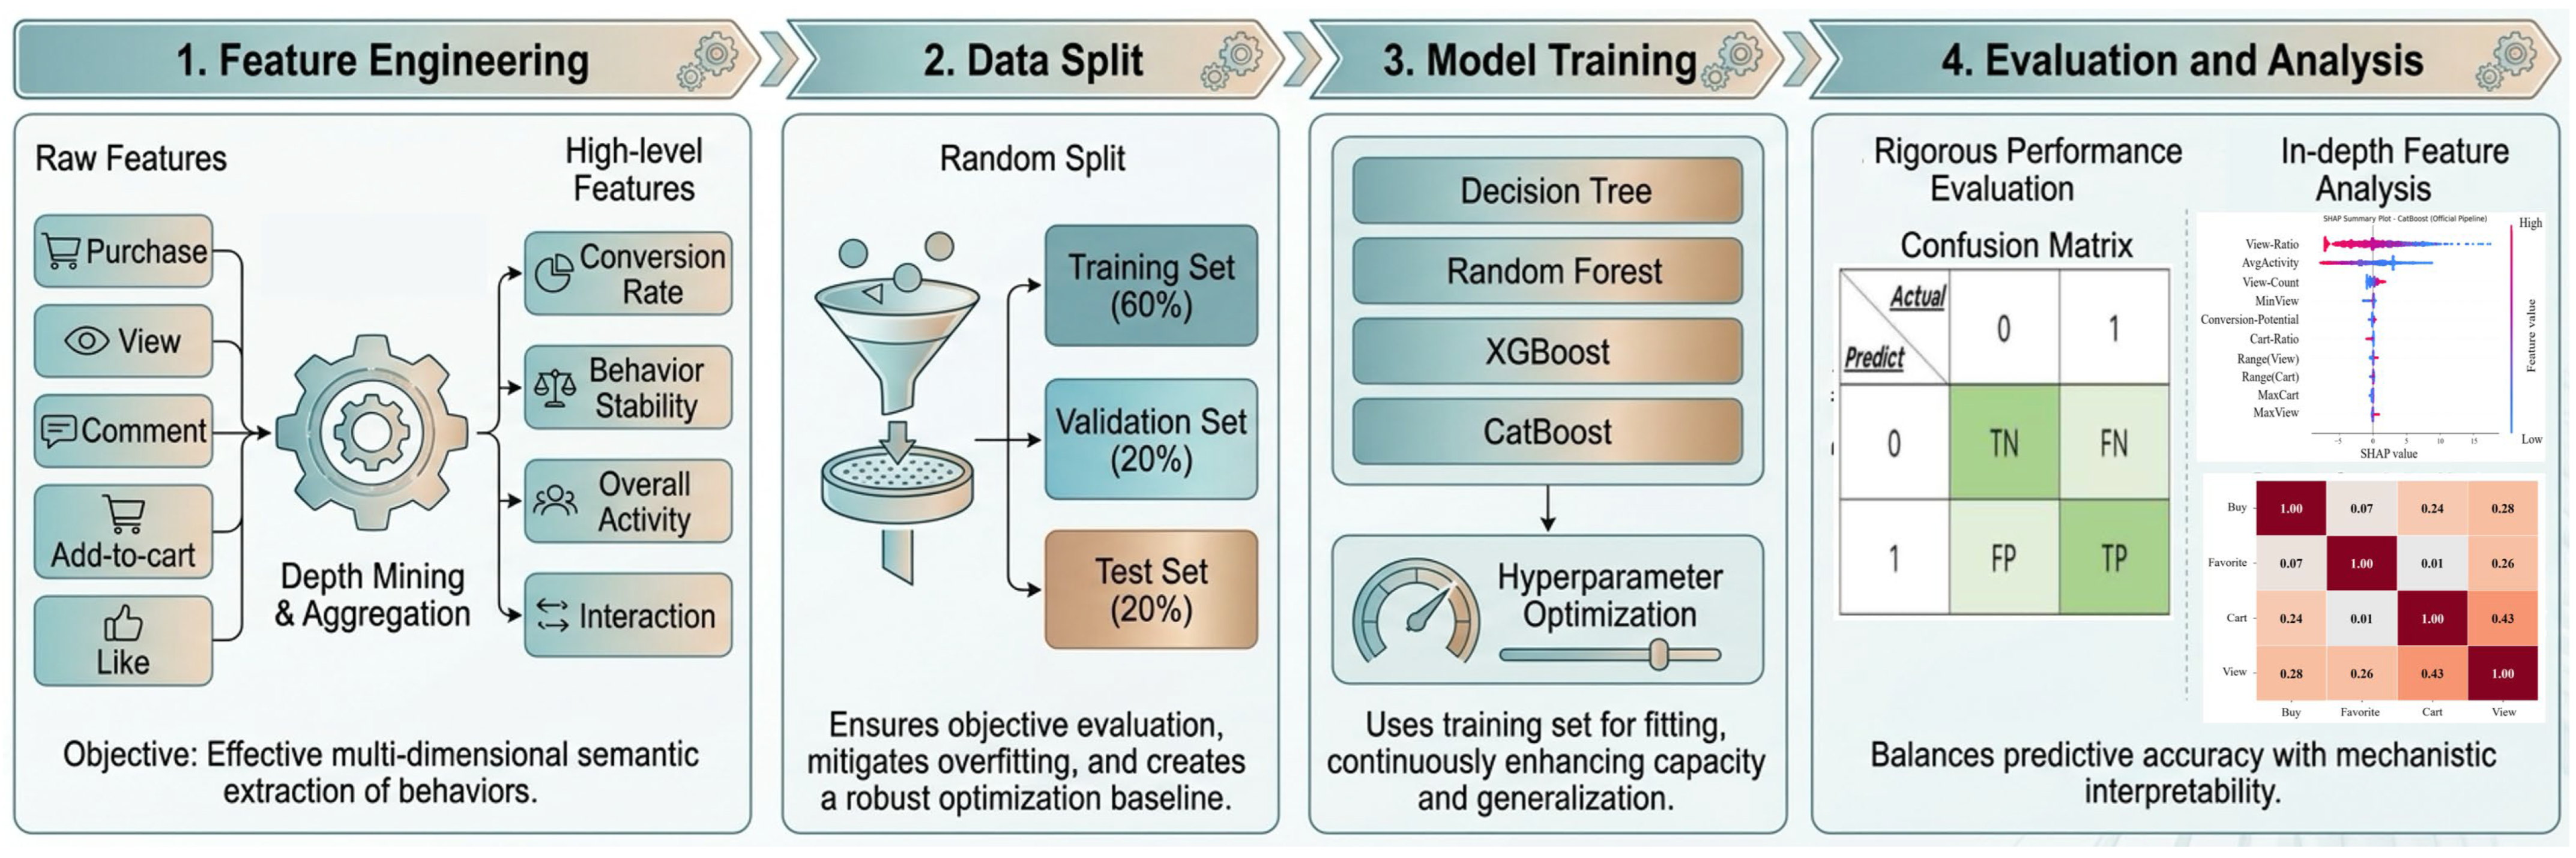
This study develops a predictive analysis framework that integrates multidimensional user behavioral features and advanced machine learning algorithms based on a real-world user behavior dataset from JD.com (see Figure 4). First, by incorporating the e-commerce conversion funnel model, we extract key features from multiple dimensions, including basic characteristics, behavioral conversion, behavioral stability, overall activity, and user interaction patterns. These features provide a comprehensive characterization of users’ browsing, clicking, favoriting, cart-adding, and purchasing behaviors. Then, to evaluate different machine learning approaches for user purchase behavior prediction, we compare four representative machine learning algorithms, including Decision Tree (DT), Random Forest (RF), Extreme Gradient Boosting (XGBoost), and Categorical Boosting (CatBoost), under a consistent data partitioning strategy and evaluation framework. Last, to enhance model transparency and interpretability, we employ the SHAP (SHapley Additive exPlanations) method to analyze the contribution of different features. By quantifying the impact of individual features on model predictions, we identify the key factors influencing user purchase decisions and further uncover the underlying relationships between behavioral characteristics and purchase intentions.
Figure 4.
An overview of the predictive analysis framework.
2.3. Multidimensional Feature Engineering
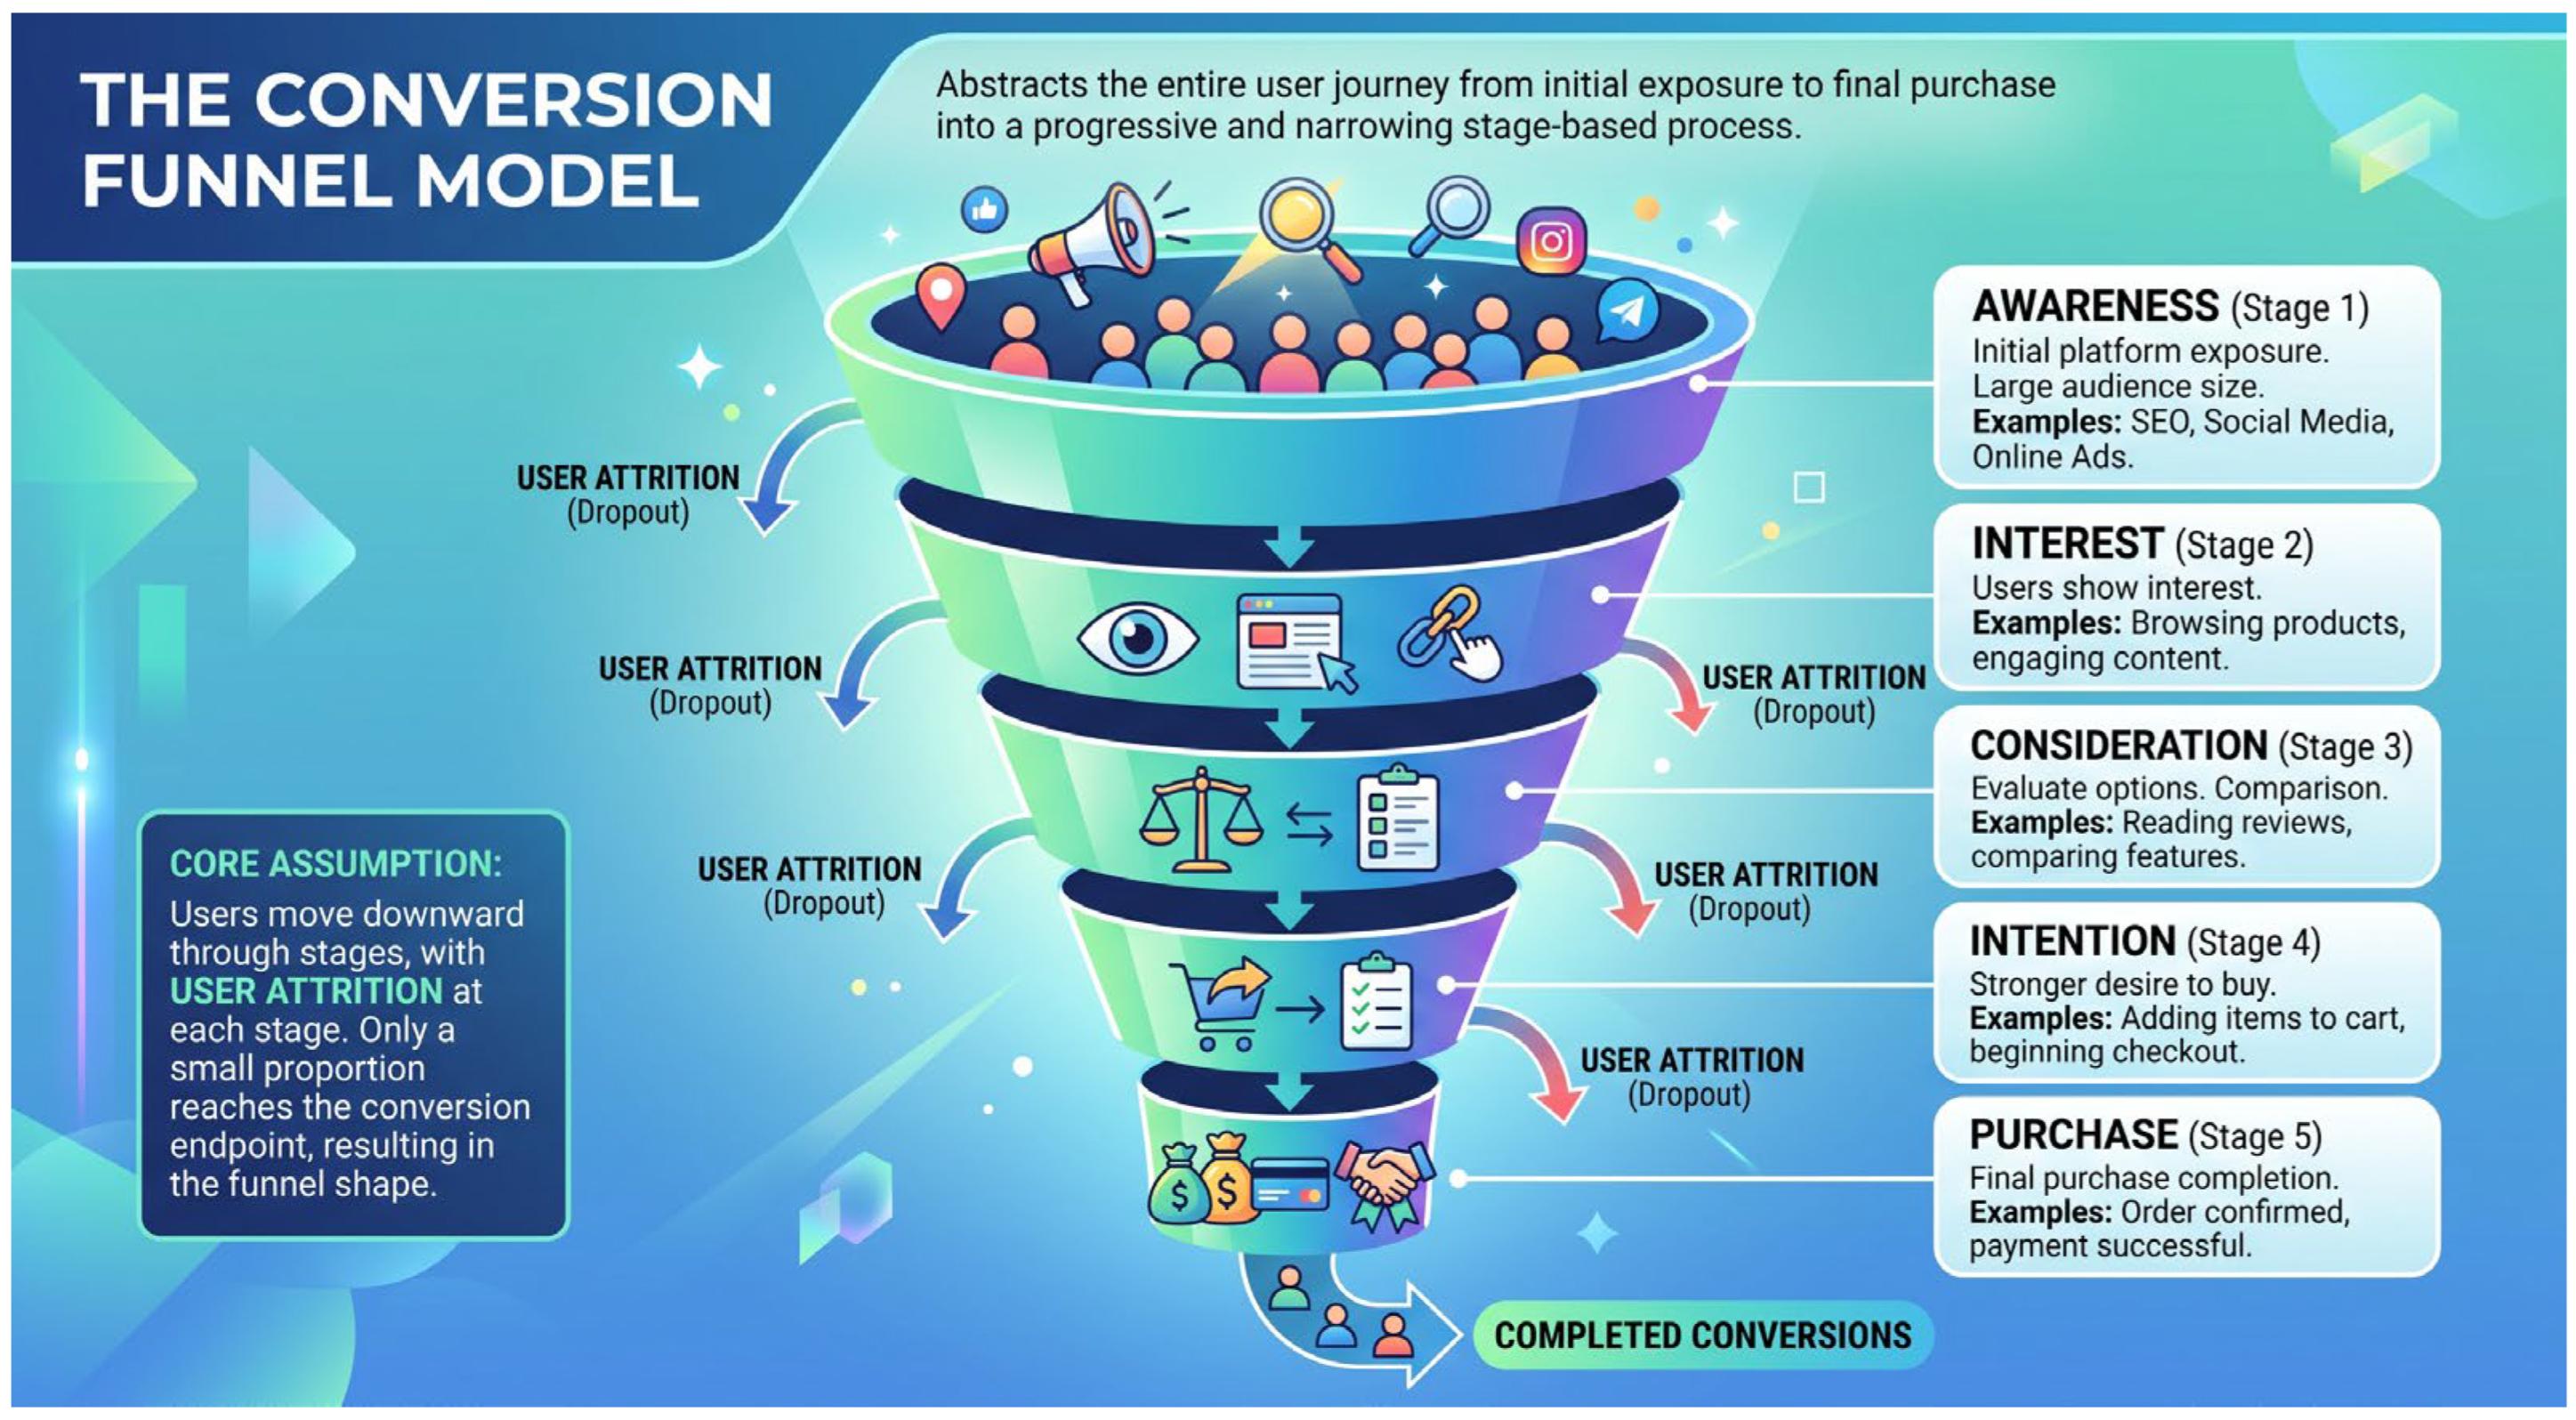
The conversion funnel model is derived from the marketing funnel theory. As shown in Figure 5, it abstracts the entire user journey from initial exposure to final purchase completion into a progressive and narrowing stage-based process [13]. Its structure consists of awareness, interest, consideration, intention, and purchase stages, with each stage corresponding to different user psychological states and behavioral intentions. The core assumption of this model is that users move downward through the funnel, while user attrition occurs at each stage. Ultimately, only a small proportion of users reach the conversion endpoint, resulting in a funnel-shaped structure following a wide top and narrow bottom.
Figure 5.
An overview of the predictive analysis framework.
The funnel model provides a structured framework for behavioral feature extraction. First, it discretizes the continuous purchase decision-making process into sequential stages, enabling stage-specific definitions of feature engineering labels. Second, the differences in conversion rates between stages constitute critical behavioral features, reflecting the distribution of users’ decision-making barriers. Furthermore, the model incorporates an information filtering and intention convergence mechanism, which is consistent with consumer decision-making theory.
Based on this conversion funnel model, we further construct conversion, behavioral stability, overall activity, and interaction features, in addition to basic features, such as the number of page views, the number of favorite products, the quantity of items added to the shopping cart, and the number of purchases. The core value of the funnel model lies in its ability to integrate these categories of behavioral features into a unified theoretical framework from stage progression to decision convergence [40]. Consequently, these features are no longer isolated statistical indicators, but establish an interpretable user decision-making profiling system with intrinsic logical relationships.
2.3.1. Conversion Feature
The funnel model decomposes the purchase journey into sequential stages, where the ratio of users between two adjacent stages represents the conversion rate of that stage. The magnitude of inter-stage conversion rates directly reflects the level of users’ decision-making resistance at specific stages, thereby endowing conversion features with psychological implications.
We establish the following conversion features in Table 1. For example, a low AvgPurchase-to-AvgCart rate may indicate price sensitivity or insufficient user trust, indicating that the user treats the shopping cart as a memo or is waiting for a price drop, ultimately leading to high decision-making friction.
Table 1.
Conversion feature definition and extraction.
The conversion features are used to describe the historical performance and inherent attributes of users and products [41]. Their essence lies in conversion rates across different dimensions, serving as a direct quantitative representation of the funnel model.
2.3.2. Behavioral Stability Feature
The behavioral stability features are designed to measure the predictability and regularity of user intentions, reflecting the degree of fluctuation in user behaviors over time. The hierarchical structure of the funnel model provides a reference framework for evaluating stability, particularly by examining whether users’ duration of stay and repeated behavioral frequencies at each stage remain consistent. The progressive logic of the funnel implies that stable users should exhibit a coherent transition from upper-level stages to lower-level stages, rather than frequent behavioral reversals or jumps (e.g., repeatedly adding items to the cart and then canceling them). Therefore, behavioral consistency across different stages constitutes the essence of stability features [42].
We calculate the behavioral fluctuation and intensity to obtain the behavioral stability features, shown in Table 2. A decline in behavioral stability often precedes user drop-off from the funnel. When users’ behavioral patterns at a specific stage shift toward disorder, it may indicate potential churn.
Table 2.
Behavioral stability feature definition and extraction.
2.3.3. Overall Activity Feature
The overall activity features aim to describe users’ macro-level activity intensity and lifecycle status on e-commerce platforms. However, these features are essentially cross-stage aggregated indicators and lack explicit stage-specific semantics. The funnel model further decomposes overall activity into distributions across different stages. Highly active users may either remain at the upper levels of the funnel (e.g., browsing without purchasing) or have already progressed to the lower levels (e.g., targeted repurchase). By identifying users’ positions within the funnel, the model distinguishes the qualitative differences in activity features and avoids the misinterpretation that higher activity necessarily indicates higher value. When users’ overall activity declines over time, the funnel model can determine the specific stage where the decline occurs, whether it is caused by reduced attractiveness at the awareness stage or increased friction at the conversion stage, thereby providing an attribution pathway for understanding the dynamic evolution of activity features [43].
The overall user engagement is quantified in Table 3. Specifically, the Cart-Ratio directly reflects whether user behavior on the platform is goal-oriented or viewing-oriented. If a high Cart-Ratio value is observed, it indicates that a large proportion of the user’s interactions on the platform result in the high-intent action of adding products to the cart. This represents high traffic quality, in which users have clear shopping goals (e.g., direct repurchasing or adding to cart after precise searches), showing massive conversion potential. Otherwise, the majority of activities are viewing product pages or favoriting. This likely means users are in a window-shopping state, engaging in extensive price comparisons, exploration, and hesitation.
Table 3.
Overall activity feature definition and extraction.
2.3.4. Interaction Feature
The theoretical foundation of interaction features originates from the micro-level evolution of consumer intentions and the sunk cost effect in consumer behavior theory. The amount of browsing time and add-to-cart activities invested by users in a specific product represents the decision-making effort devoted to that product. The greater the investment of such cognitive and behavioral resources at the micro level, the higher the probability that it will eventually be converted into a purchase decision [44]. Different funnel stages correspond to distinct typical interaction patterns. The awareness stage is primarily characterized by search activities and recommendation clicks, while the consideration stage is dominated by product comparison, filtering, and detailed information browsing. The intention stage is mainly reflected through add-to-cart and product favoriting behaviors. The funnel model provides a stage-based labeling system for interaction features, enabling similar interaction behaviors to be interpreted with differentiated meanings across different stages.
Among the defined features in Table 4, View-Cart-Interaction is an intensity indicator. If a user browses a product multiple times and adds it to the cart multiple times, the product value will be very large. This usually indicates a very strong purchase intention. Meanwhile, to avoid numerical explosion and preserve interaction effects, we use the log function to compress the numerical range. In terms of the Favorite-Cart-Balance feature, it measures the consistency in quantity between add-to-cart and add-to-favorites behaviors. A small value of this feature may indicate that user behavior is clearly biased towards one side (i.e., either adding items to cart but not buying, or adding items to favorites but not adding them to cart). Meanwhile, the Behavior-Consistency feature measures whether users’ behavior at different stages of the decision-making funnel is logically consistent. A high value of this feature is preferable, because it represents that the user has stable behavioral patterns, clear intentions, and concentrated preferences. It would be more suitable for precision marketing and personalized recommendations.
Table 4.
Interaction feature definition and extraction.
2.4. Machine Learning Model Establishment
In predicting e-commerce purchases, user behavior is full of complex non-linear relationships and conditional dependencies. In this study, we compare and evaluate four representative machine learning algorithms, including Decision Tree (DT), Random Forest (RF), XGBoost, and CatBoost. The last three algorithms are built upon the ensemble learning framework. Among these four algorithms, DT can automatically achieve high-order feature crossing by recursively partitioning the feature space. RF introduces Bagging and random feature subspaces to reduce model variance and enhance noise robustness. To address the feature sparsity in user logs, XGBoost utilizes second-order Taylor expansion and sparsity-aware split finding to process missing values, drastically raising the ceiling for prediction accuracy. Last, CatBoost adopts ordered target encoding, instead of one-hot encoding, to prevent target leakage. Combined with its tree structure, CatBoost can transform high-cardinality categorical variables. Therefore, these four machine learning algorithms are selected in this study for comparison. In addition, for determining the optimal hyperparameter configuration for each machine learning algorithm, we employ OPTUNA (version 4.9.0), an open-source hyperparameter optimization framework, to automate hyperparameter search. We first specify the search space of hyperparameters (e.g., iterations, learning rate, depth, l2_leaf_reg, random_strength, etc.). Then, we define the evaluation metric (AUC in this study). Next, we execute the optimize() function in OPTUNA and use the default Tree-structured Parzen Estimator (TPESampler with seed = 42) to search the optimal hyperparameter configurations.
2.4.1. Decision Tree
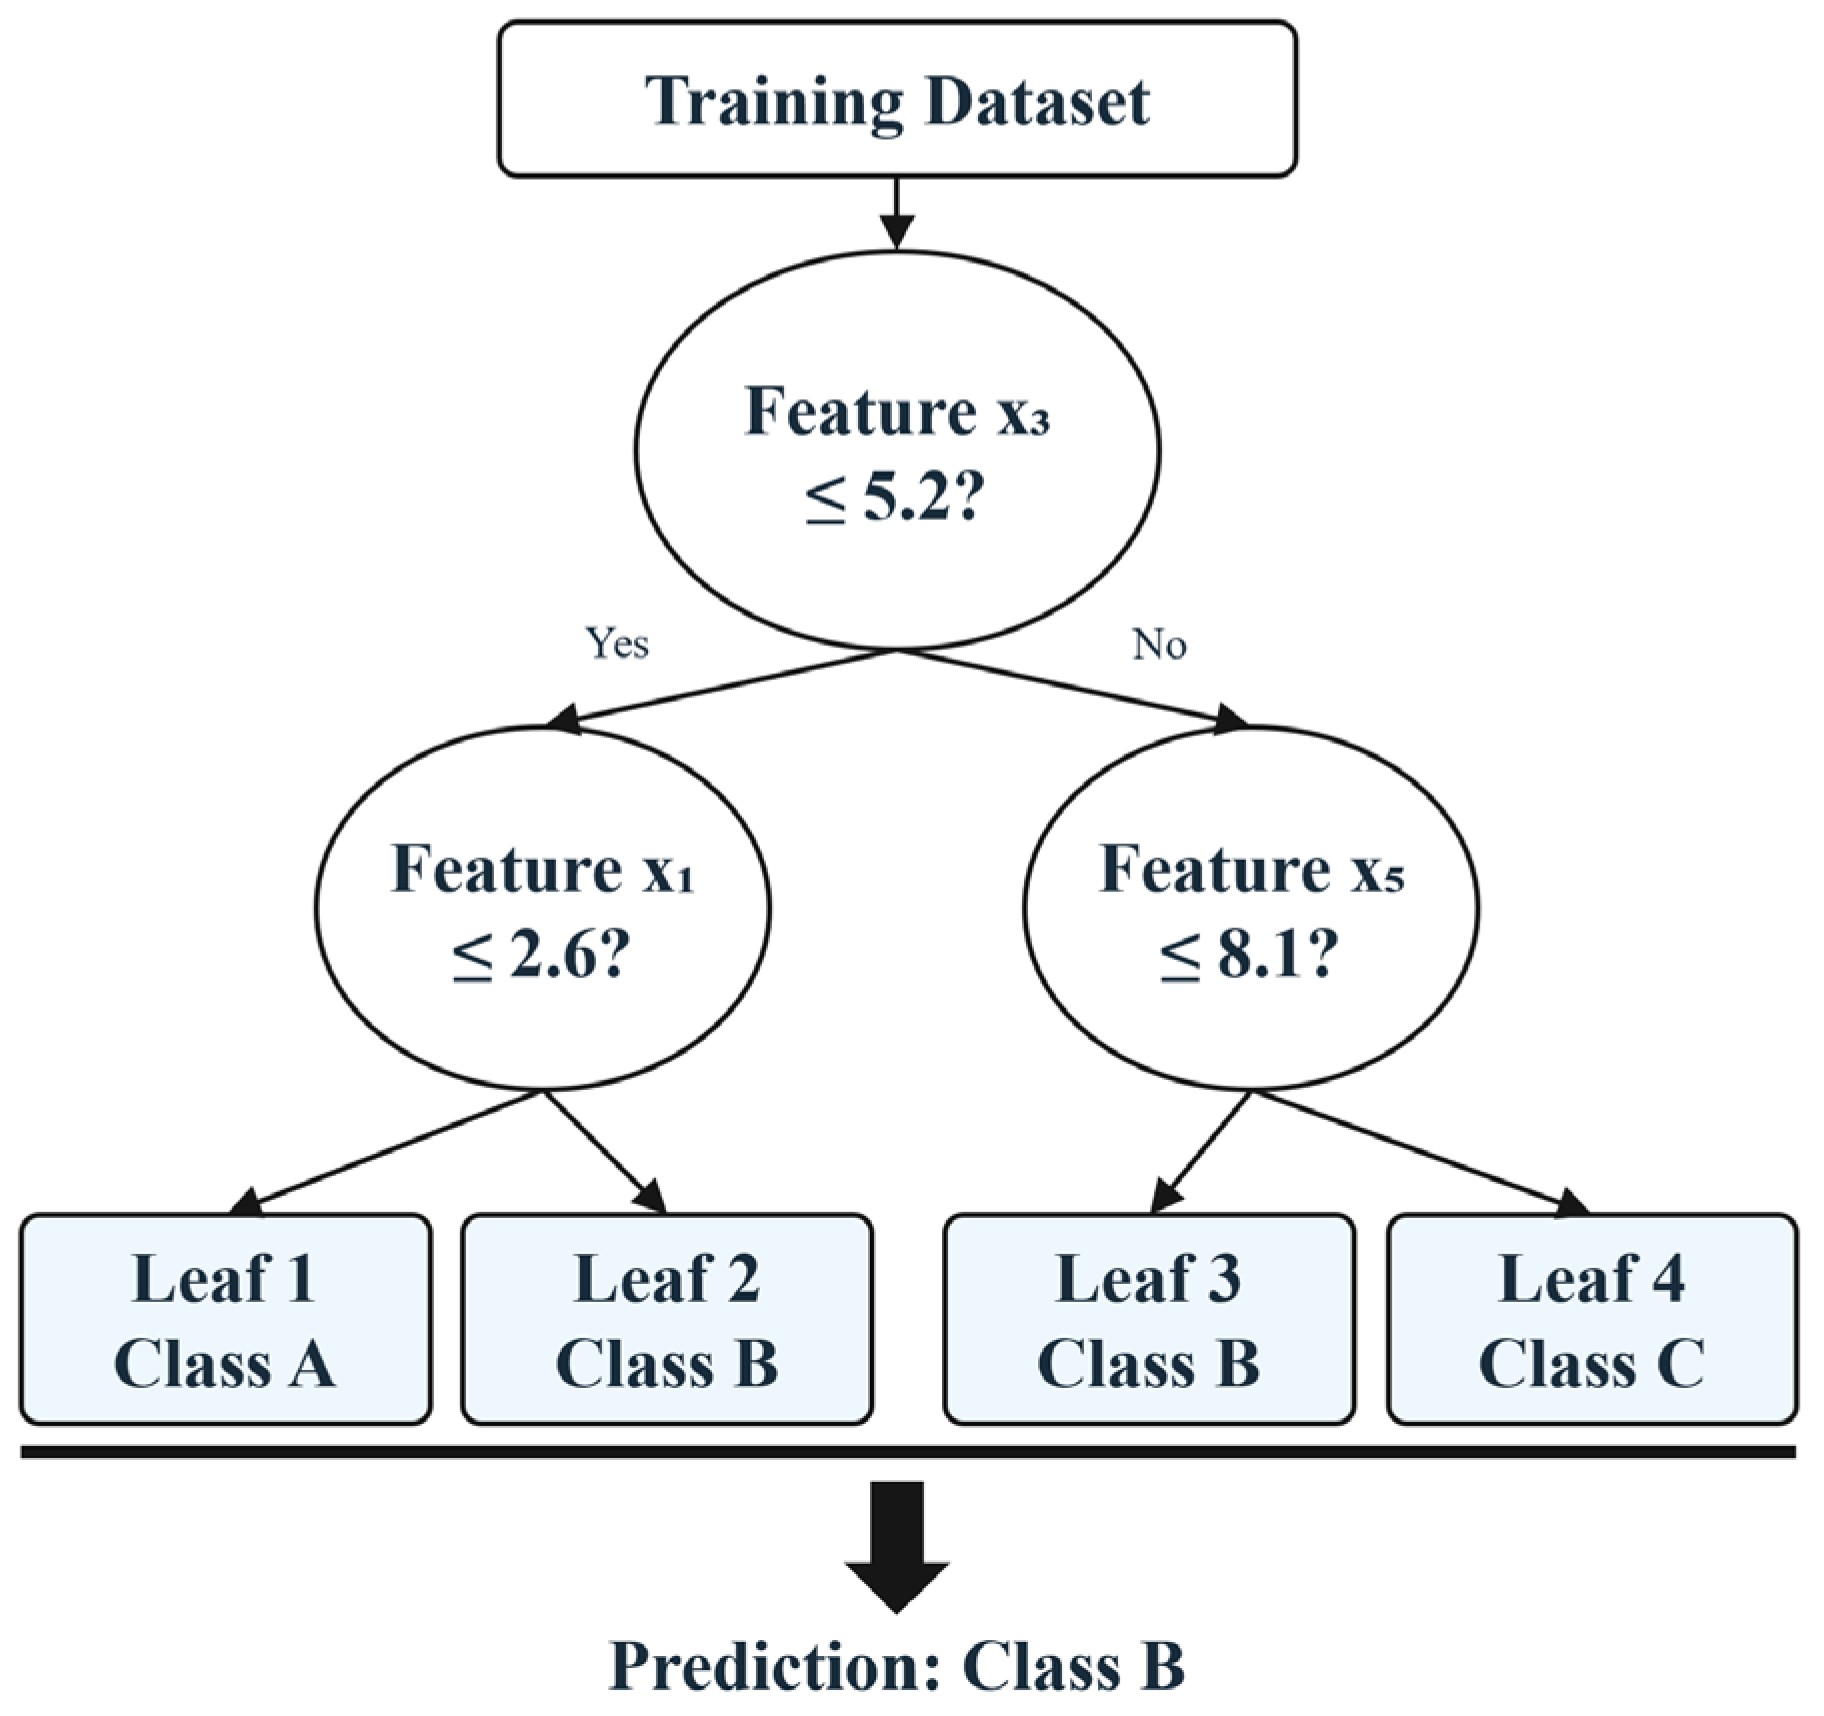
DT works like a sequence of questions. It begins at a root node, tests one feature, and sends the observation to a different branch according to the answer [45]. Later nodes ask additional questions until the observation reaches a leaf. Given a node containing a sample set S, DT first examines eligible features and candidate thresholds. Each candidate divides S into a left subset and a right subset. The preferred split is the one that produces the greatest reduction in impurity. A schematic diagram of DT is shown in Figure 6.
Figure 6.
The schematic diagram of DT.
For predicting the user purchase behavior, we adopt a common impurity measure, the Gini index. Maximizing the reduction in the Gini index leads to a large gain, thereby enabling a numerical criterion for comparing different feature tests. The formula of the Gini index follows Equation (1), while the gain value can be obtained via Equation (2).
where S denotes the sample set in the current node, K denotes the total number of classes, and pk denotes the proportion of observations in S that belongs to class k. SL and SR denote the left and right child sets, respectively. N, NL, and NR denote the numbers of observations in the parent, left child, and right child, respectively. The two child impurities are weighted by their sample shares.
During training, DT places all observations in the root, lists feasible feature-threshold pairs, calculates the Gain for each pair, and selects the largest value. It assigns observations to the two child nodes and repeats the calculation recursively. In this study, we set the maximum tree depth at 6.
2.4.2. Random Forest
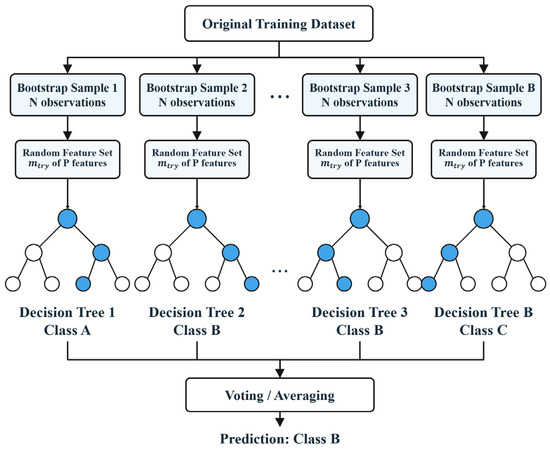
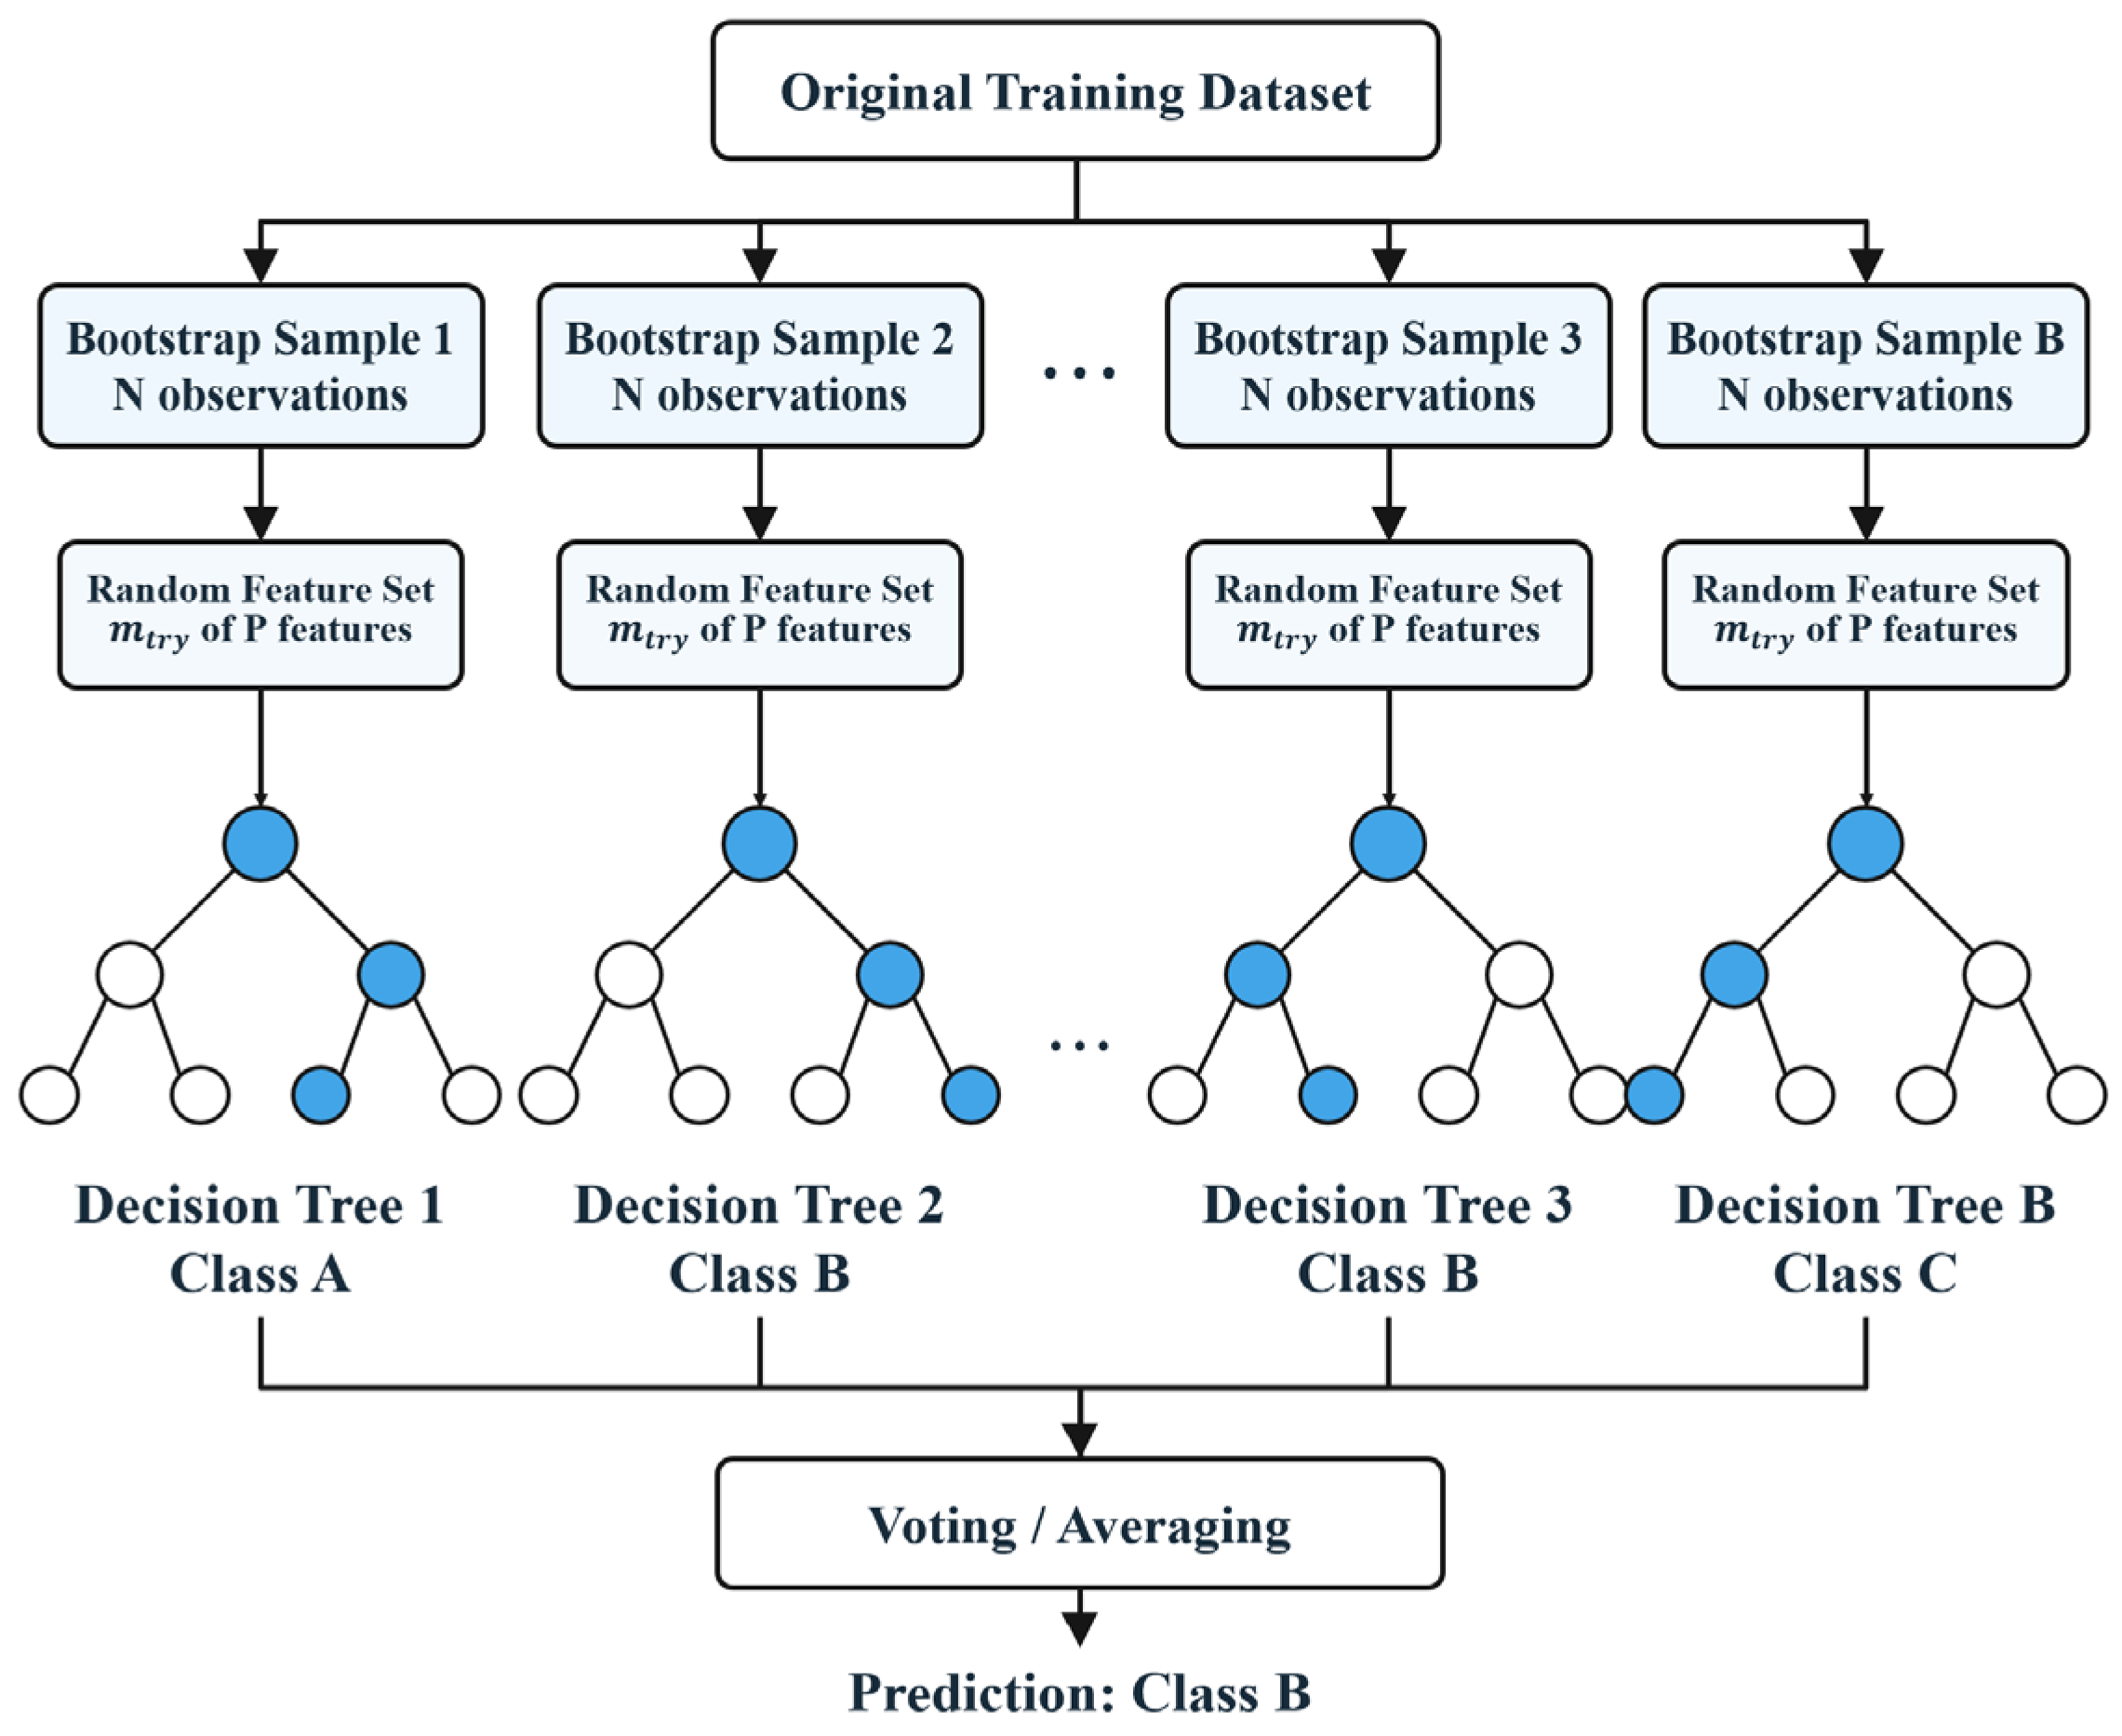
RF is a bagging ensemble whose base learners are decision trees. Each tree receives a slightly different training sample and is allowed to inspect a different random subset of features at each split. The trees consequently learn different rules and make different errors. Their outputs are finally combined by voting or averaging, which makes the overall prediction more stable than the output of one tree [46]. The schematic diagram of RF is shown in Figure 7.
Figure 7.
The schematic diagram of RF.
Suppose the original training set contains N observations and P features. To train tree b, RF performs Bootstrap sampling. It draws N observations from the original data with replacement and forms a new training set Db. Meanwhile, at every node, RF randomly selects mtry features from the full set of P features and searches for the best split only among those candidates. Here, mtry is the number of features allowed to compete at one node and is smaller than P. In this study, we still use the Gini index to compare the candidate splits. The winning split is applied, and the tree continues growing until its stopping conditions are met. At prediction time, each tree processes the same new observation and produces its own output. A class vote is applied and the forest returns the class receiving the largest number of votes. RF follows Equation (3) to generate the prediction result . In our study, the maximum number of trees is set to 200, while the maximum depth of a tree is set to 10.
where x denotes the observation to be predicted, B denotes the total number of trees, Tb(x) denotes the prediction from tree b.
2.4.3. XGBoost
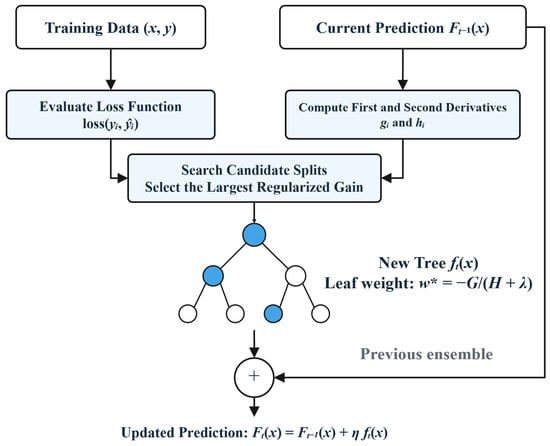
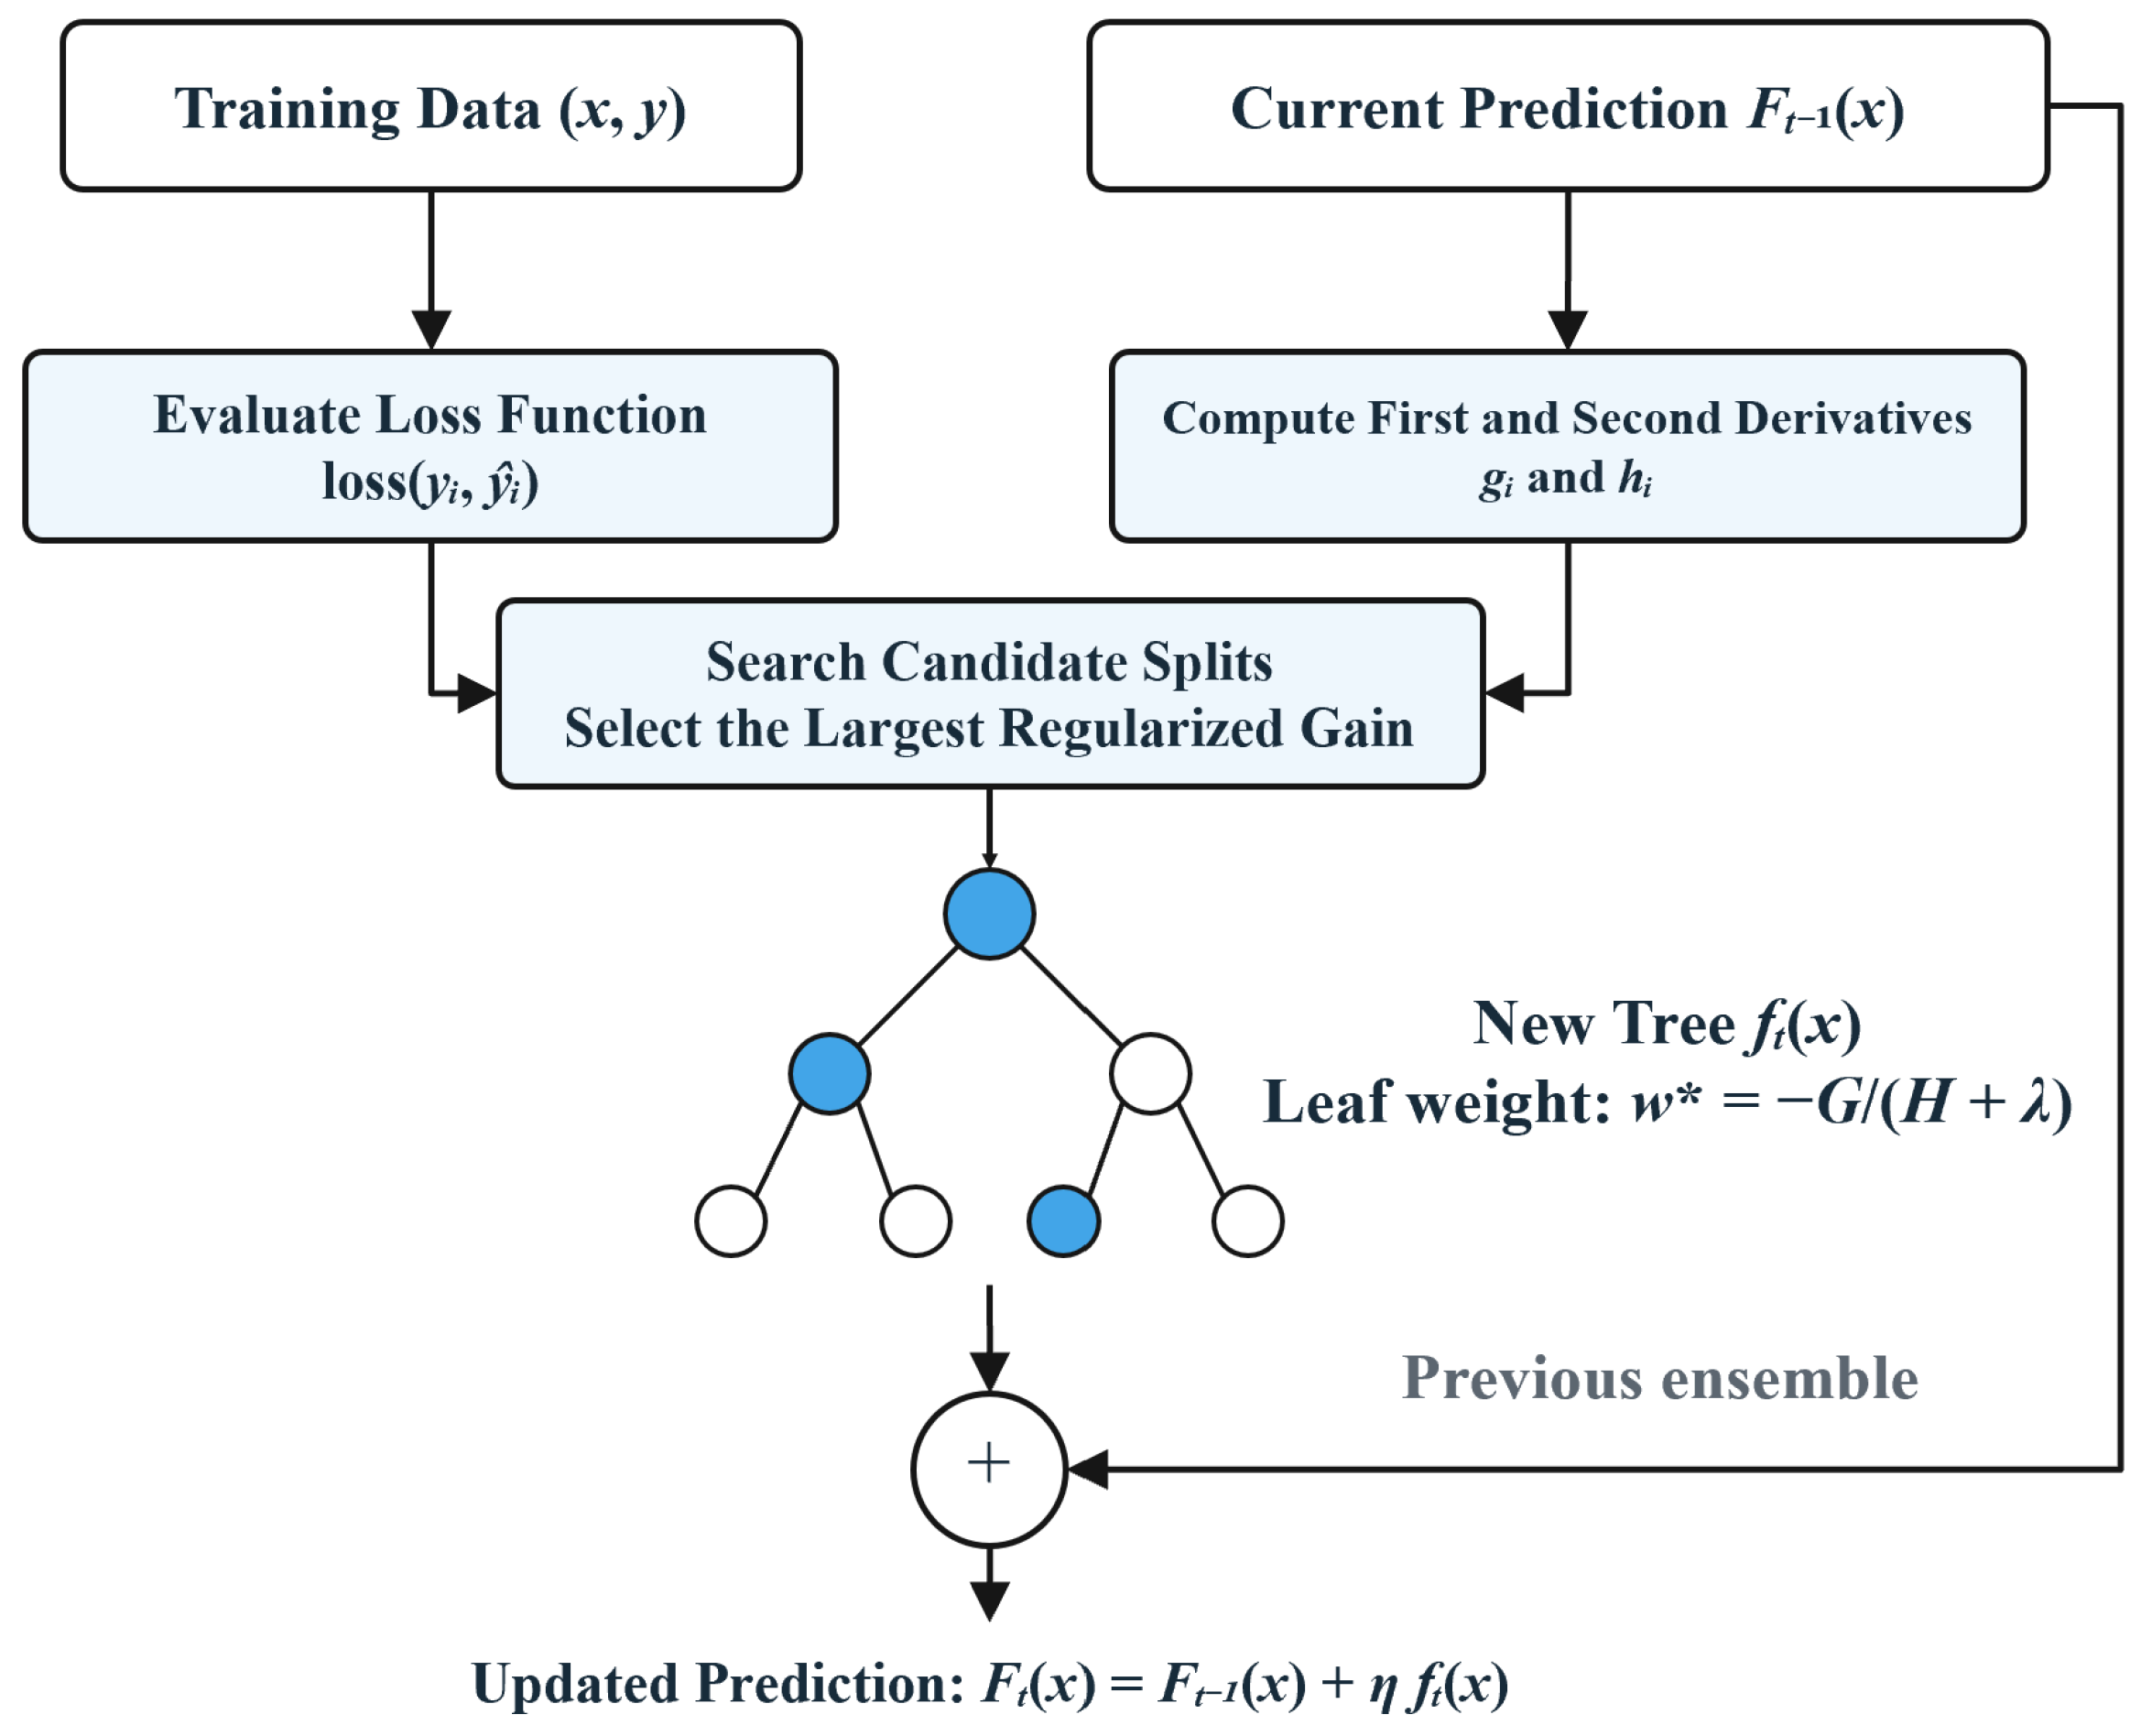
XGBoost builds trees one after another rather than training them independently. The first tree produces an initial correction, and every later tree focuses on the loss that the existing ensemble has not yet removed. The final prediction is the sum of the initial score and the learning-rate-scaled outputs of the successive trees [47]. The schematic diagram of XGBoost is displayed in Figure 8.
Figure 8.
The schematic diagram of XGBoost. Note: w* denotes the leaf weight of ft.
At boosting round t, XGBoost adds a new tree ft to the current prediction Ft−1. The learning rate η scales the contribution of the new tree, so the update can be written in Equation (4).
where xi denotes a training observation i, Ft−1(xi) denotes the prediction before round t, and Ft(xi) denotes the updated prediction.
Ft(xi) = Ft−1(xi) + η ft(xi)
The tree is selected by minimizing a regularized objective. The first derivative identifies the direction in which the prediction should move, while the second derivative scales that movement according to local curvature. Summing these quantities within a candidate node makes it possible to calculate an optimized node score. Regularization then reduces the attractiveness of splits that create weak leaves or extreme leaf outputs. Consequently, a candidate must improve the approximated loss enough to compensate for the additional structural cost before it is accepted. The optimization objective of XGBoost, along with the regularization, can be defined by Equation (5).
Here, n denotes the number of observations; yi and denote the actual and predicted targets, respectively. loss denotes the chosen loss function. T denotes the number of leaves in the new tree. wj denotes the output score of leaf j. γ denotes the cost of adding a leaf. λ denotes the L2 regularization coefficient applied to leaf scores.
In our study, the learning rate of XGBoost is set to 0.05. The maximum number of trees is set to 300, while the maximum depth of a tree is set to 6. We set the sampling rate at 0.8.
2.4.4. CatBoost
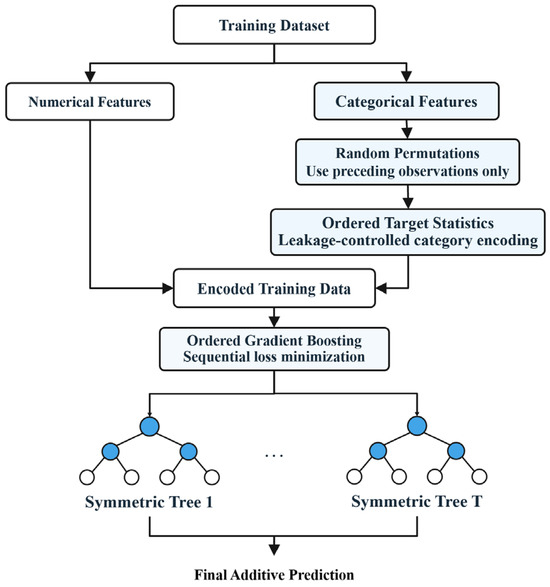
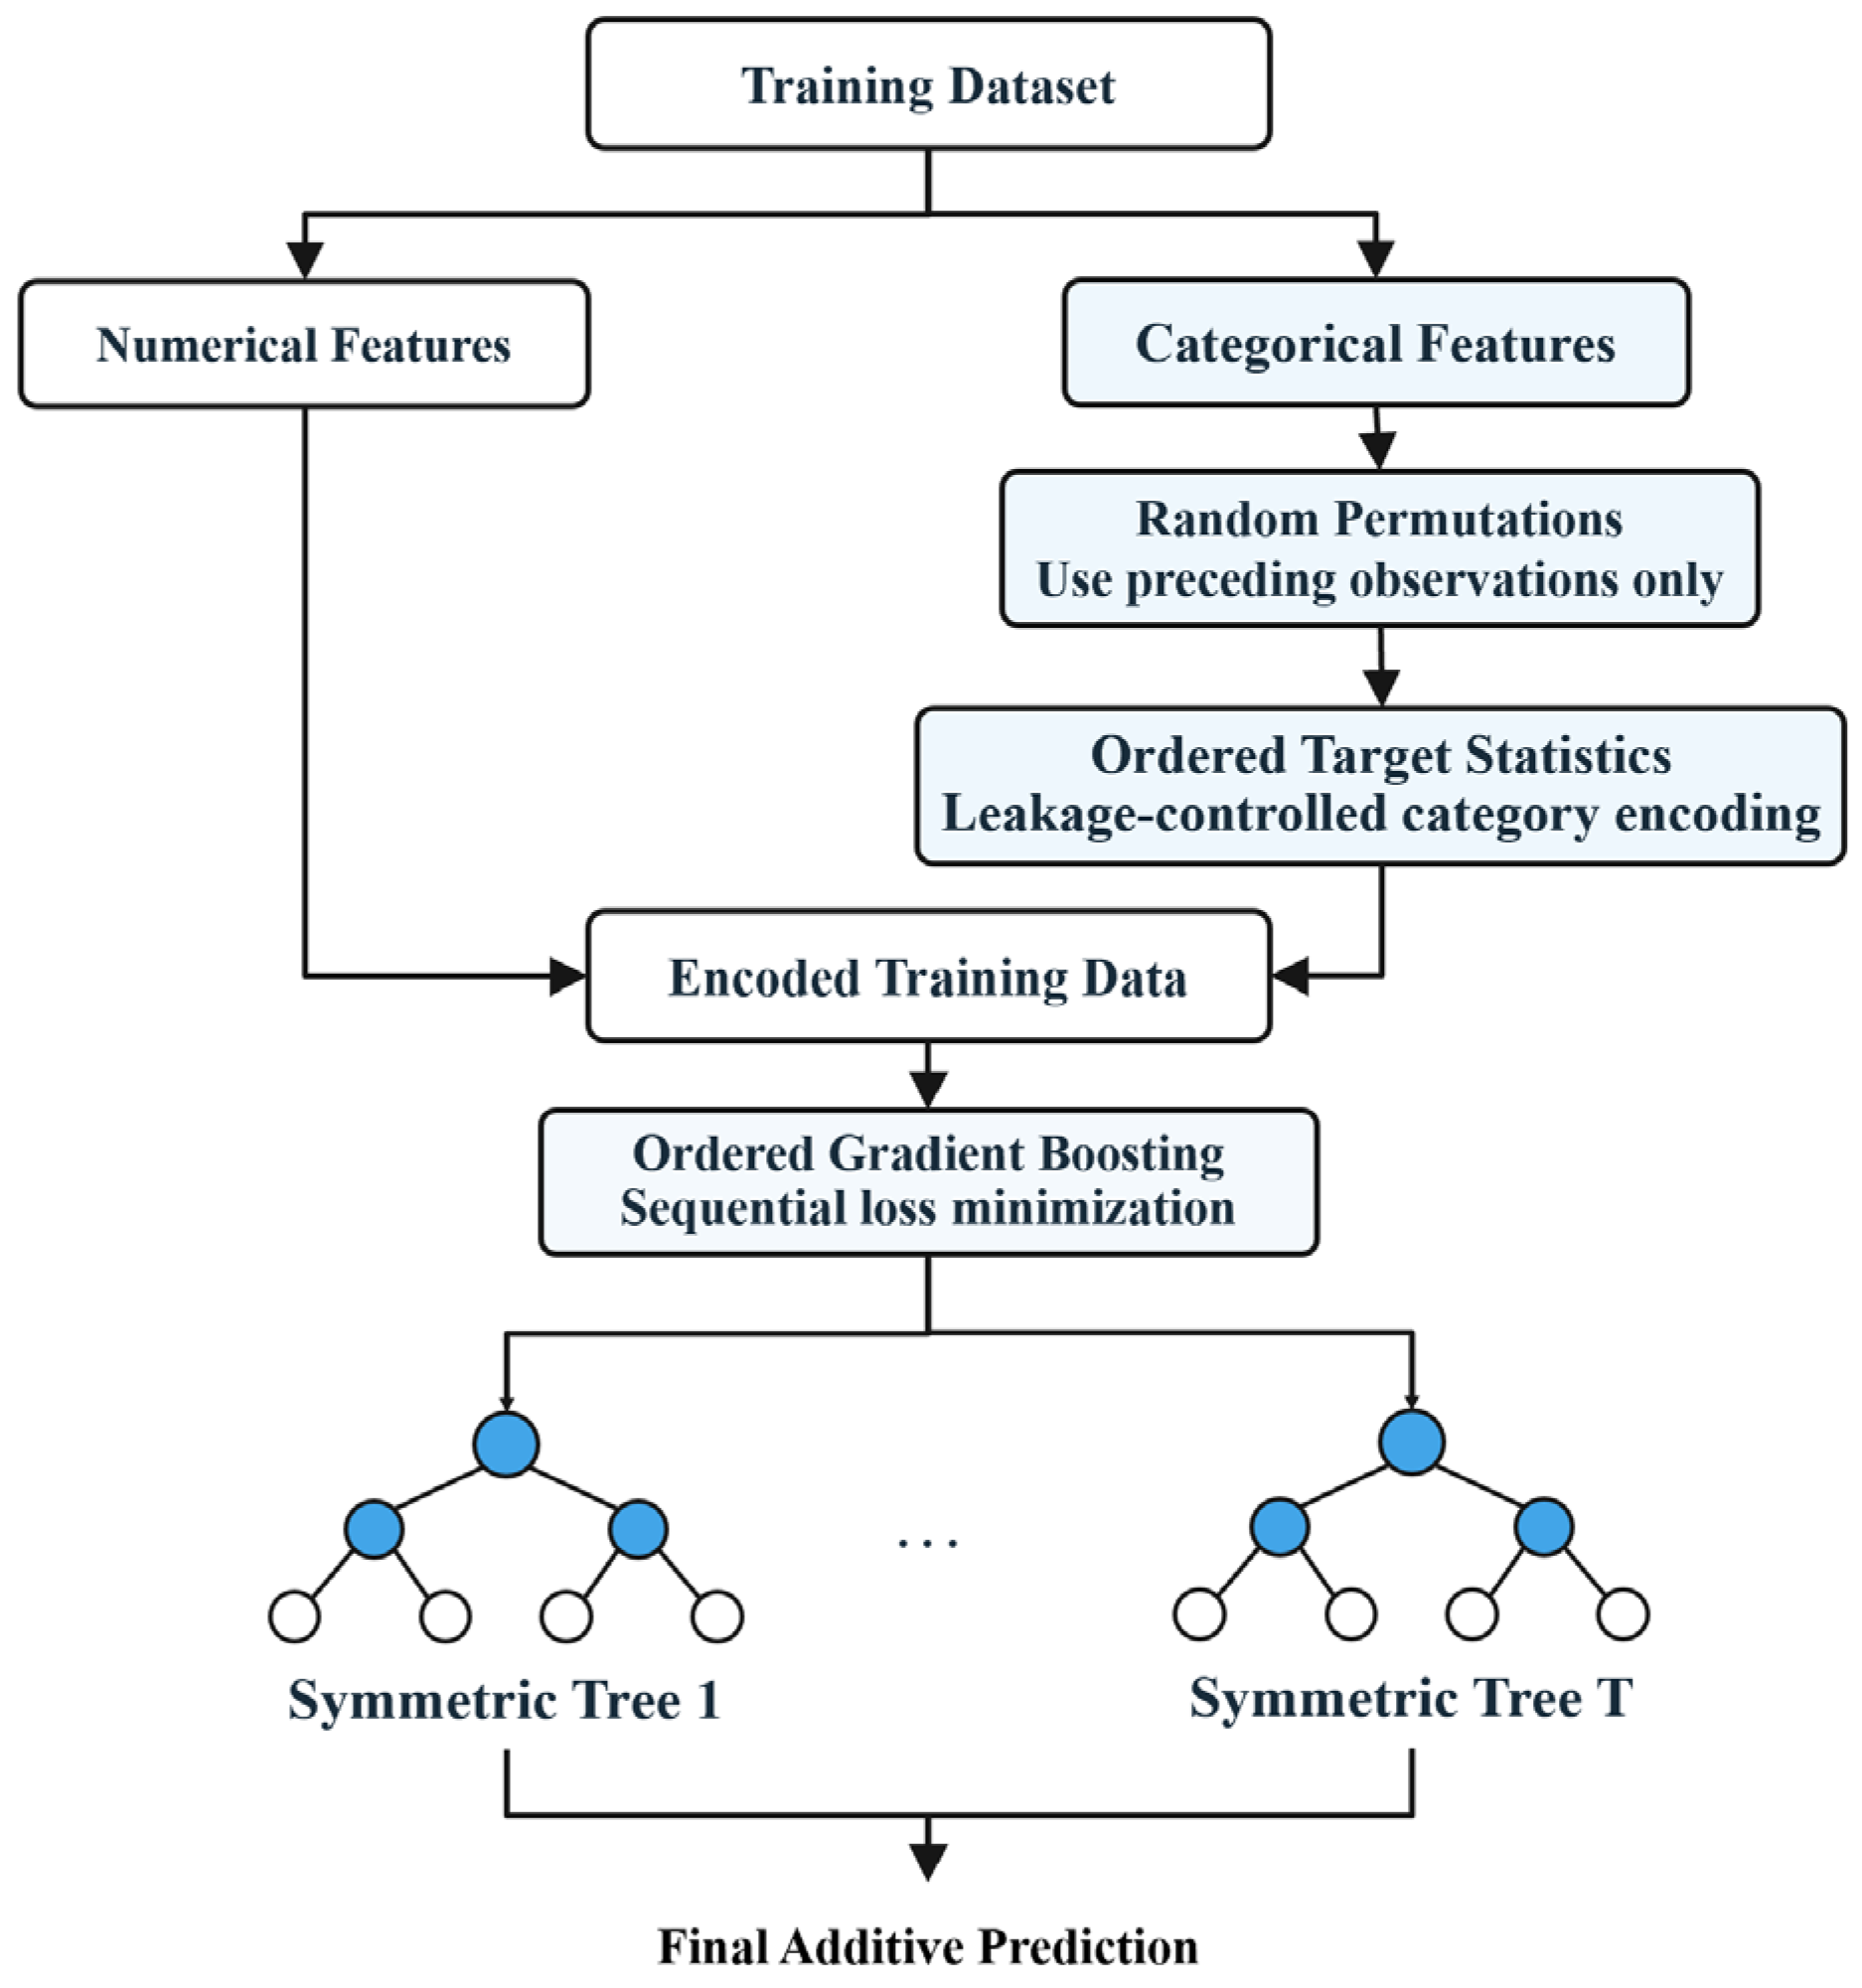
CatBoost works directly with categorical variables by converting categories into target-based numerical statistics. The encoded data are then learned by a sequence of highly regular symmetric trees. CatBoost uses Oblivious Decision Trees (ODT) as base learners and automatically performs feature combinations [48]. The schematic diagram of CatBoost is shown in Figure 9.
Figure 9.
The schematic diagram of CatBoost.
During training, CatBoost dynamically calculates the statistics of class features based on the data permutation, transforming them into numerical features. When constructing each tree, all nodes at the same level are split using the same features and thresholds. To calculate residuals and train new trees, CatBoost does not use all samples to calculate gradients, but instead generates multiple random data permutations. Combining the historical category total with the global prior makes the initial estimates more conservative. In brief, CatBoost follows Equation (6) to update the observation of the current tree.
Here, TSi denotes the encoded value for observation i. σ gives a random observation order. xik denotes the value of the categorical feature k for observation i. yj denotes the target of an earlier observation j. I(·) denotes an indicator equal to one when the two categorical values match and zero otherwise. The scalar p is a global prior target value and a controls the strength of prior smoothing.
In our study, the learning rate of CatBoost is set to 0.05. The maximum number of trees is set to 300, while the maximum depth of a tree is set to 6.
2.5. SHAP Analysis
SHAP is based on the Shapley value from cooperative game theory. The input features are treated as players, and the model output is treated as the value created by their cooperation. A feature’s contribution cannot be measured from only one arbitrary feature order, because the apparent effect of a feature may depend on which other features are already present [49]. SHAP therefore averages its marginal contribution across all possible feature coalitions and ordering positions.
SHAP analysis follows the steps below. First, a background dataset is selected to define the baseline and the values used when some features are treated as unavailable. Second, SHAP constructs feature coalitions S. For each coalition, it evaluates v(S), adds the target feature j, evaluates v(S ∪ {j}), and records the marginal difference. Third, every marginal contribution is multiplied by its Shapley weight and the weighted terms are summed to produce ϕj, as defined in Equation (7).
Here, φj denotes the SHAP value of feature j. F denotes the full feature set. M denotes the number of features. S denotes any subset that does not contain j and |S| denotes the number of features in that subset. The value function v(S) is the expected model output when the features in S are known. The difference v(S ∪ j) − v(S) is the marginal contribution obtained by adding feature j. The factorial term is the Shapley weight assigned to that coalition size.
The procedure is repeated for all features. Exact enumeration requires an exponential number of coalitions as M grows. In our study, for Decision Tree, Random Forest, XGBoost, and CatBoost models, we adopt TreeSHAP, which exploits tree paths, branch-cover probabilities, and dynamic programming to obtain the same contribution logic far more efficiently than direct enumeration. The final explanation may be read locally through signed φj values, while the average absolute SHAP value across many observations summarizes a feature’s overall influence.
2.6. Evaluation Indicators
The performance of all machine learning algorithms is assessed using several commonly adopted evaluation indicators, including Accuracy, Precision, Recall, F1-score, and Area under Curve (AUC), which are derived from the confusion metrics [50,51]. These metrics jointly reflect the classification performance, robustness, and generalization ability of these algorithms.
3. Results
3.1. Classification Performance Comparison
We present the classification performance comparison results in Table 5 under the 5-fold cross-validation setting. It is noticed that the boosting-based machine learning algorithms demonstrate significant advantages. The XGBoost and CatBoost algorithms achieve comparable performance on the AUC metric, both exceeding 0.99, which indicates strong predictive capabilities. By comparison, CatBoost holds a marginal advantage, with its accuracy, precision, recall, and F1-score slightly outperforming those of XGBoost. This superiority may stem from the unique design of CatBoost. First, its built-in ordered boosting strategy effectively processes categorical features, thereby producing unbiased gradient estimates. Second, its symmetric tree structure acts as a regularizer, more effectively preventing overfitting to noise when handling high-order interaction features. In contrast, the DT and RF algorithms yield relatively poorer performance. Furthermore, the experimental results indicate that integrating basic features, conversion features, behavioral stability features, overall activity features, and interaction features substantially improves the predictive performance of all evaluated machine learning algorithms. This finding also substantiates the necessity of incorporating prior knowledge and relevant e-commerce theories.
Table 5.
Performance comparison of machine learning algorithms on the test set with different inputs.
To validate the generalization of the proposed multidimensional feature paradigm and the prediction performance of the best-performing machine learning algorithm (i.e., CatBoost), we further perform an additional test over the User Behavior Data from Taobao for Recommendation dataset, released by Alibaba in 2017. The experimental result is reported in Table S3.
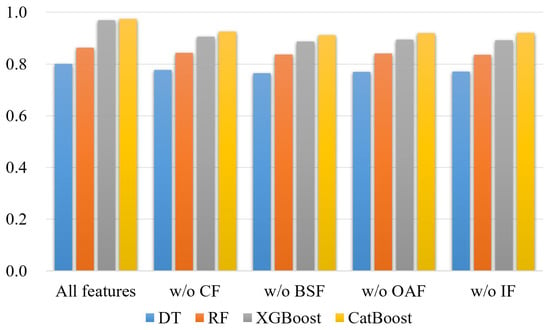
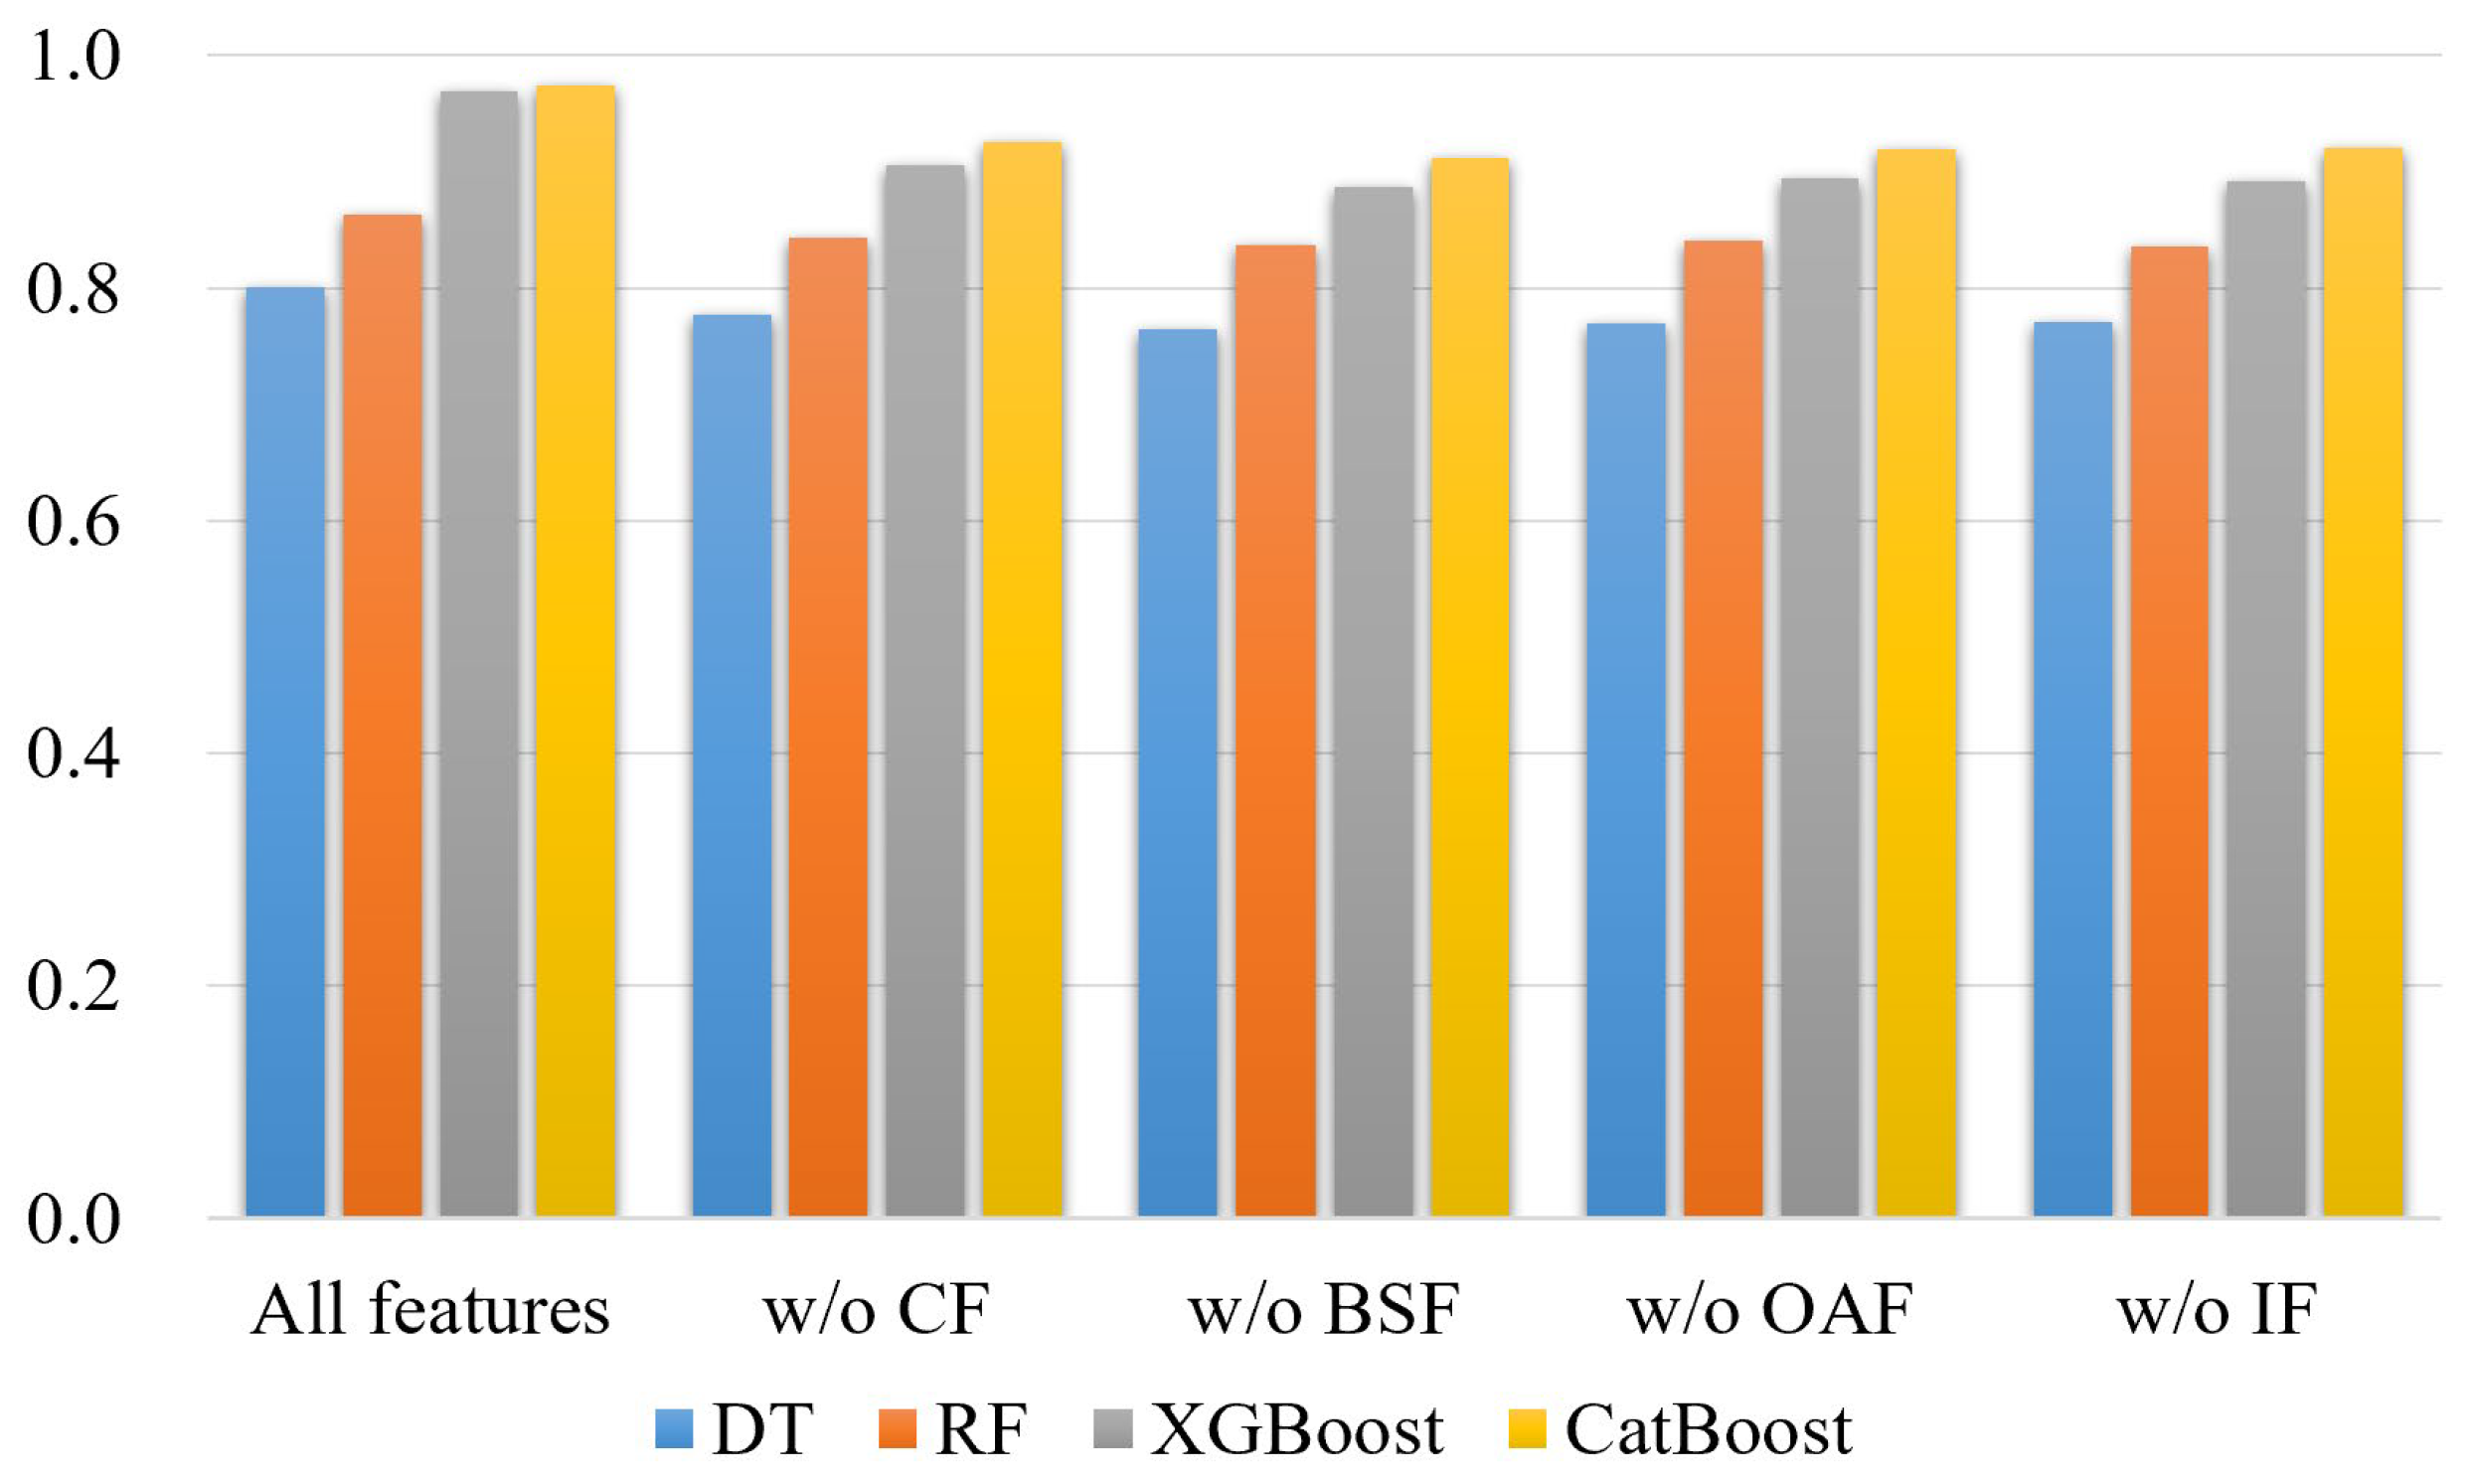
We then perform an ablation experiment over multidimensional features, and the result is displayed in Figure 10. This experiment evaluates the impact of multidimensional features on the user purchase prediction task across four models. Integrating all features yields the highest predictive performance for all algorithms. Removing any single feature set would decrease predictive accuracy for all four models. This confirms that each feature dimension contributes a unique, valuable signal to the classification task. Still, CatBoost consistently achieves the highest accuracy across all test conditions, peaking at 0.9737 when utilizing all features. XGBoost follows closely behind CatBoost in all scenarios. Among all, we observe that behavioral stability is the most critical individual predictor for user purchases. For instance, CatBoost falls from 0.9737 to 0.9116 when dropping the behavioral stability feature.
Figure 10.
Ablation experiment result of multidimensional features. Note: The y-axis represents the evaluation indicator of accuracy. w/o denotes without integrating this feature. CF—conversion feature, BSF—behavioral stability feature, OAF—overall activity feature, and IF—interaction feature.
3.2. Probability Visualization
CatBoost is identified as the best-performing algorithm for predicting the user purchase behavior in Section 3.1. Therefore, we further employ Kernel Density Estimation (KDE) to visualize the probability distribution of predictions. KDE is a non-parametric method used to estimate the probability density function of a random variable [52]. Unlike histograms, which rely on data binning, KDE generates a continuous and smooth density curve. KDE assumes that each known sample point contributes a certain probability to its surrounding space. Given n independent and identically distributed sample points x1, x2, …, xn, the estimated probability density function of KDE at any given point x is formulated by Equation (8).
where K(·) denotes the kernel function. h denotes the bandwidth, a parameter that controls the degree of smoothness.
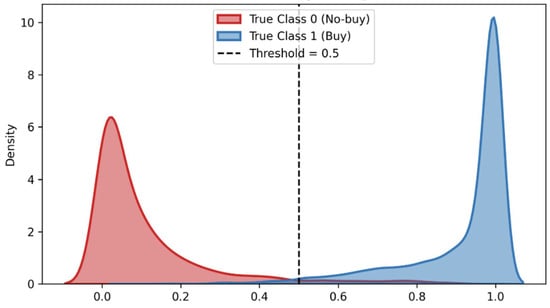
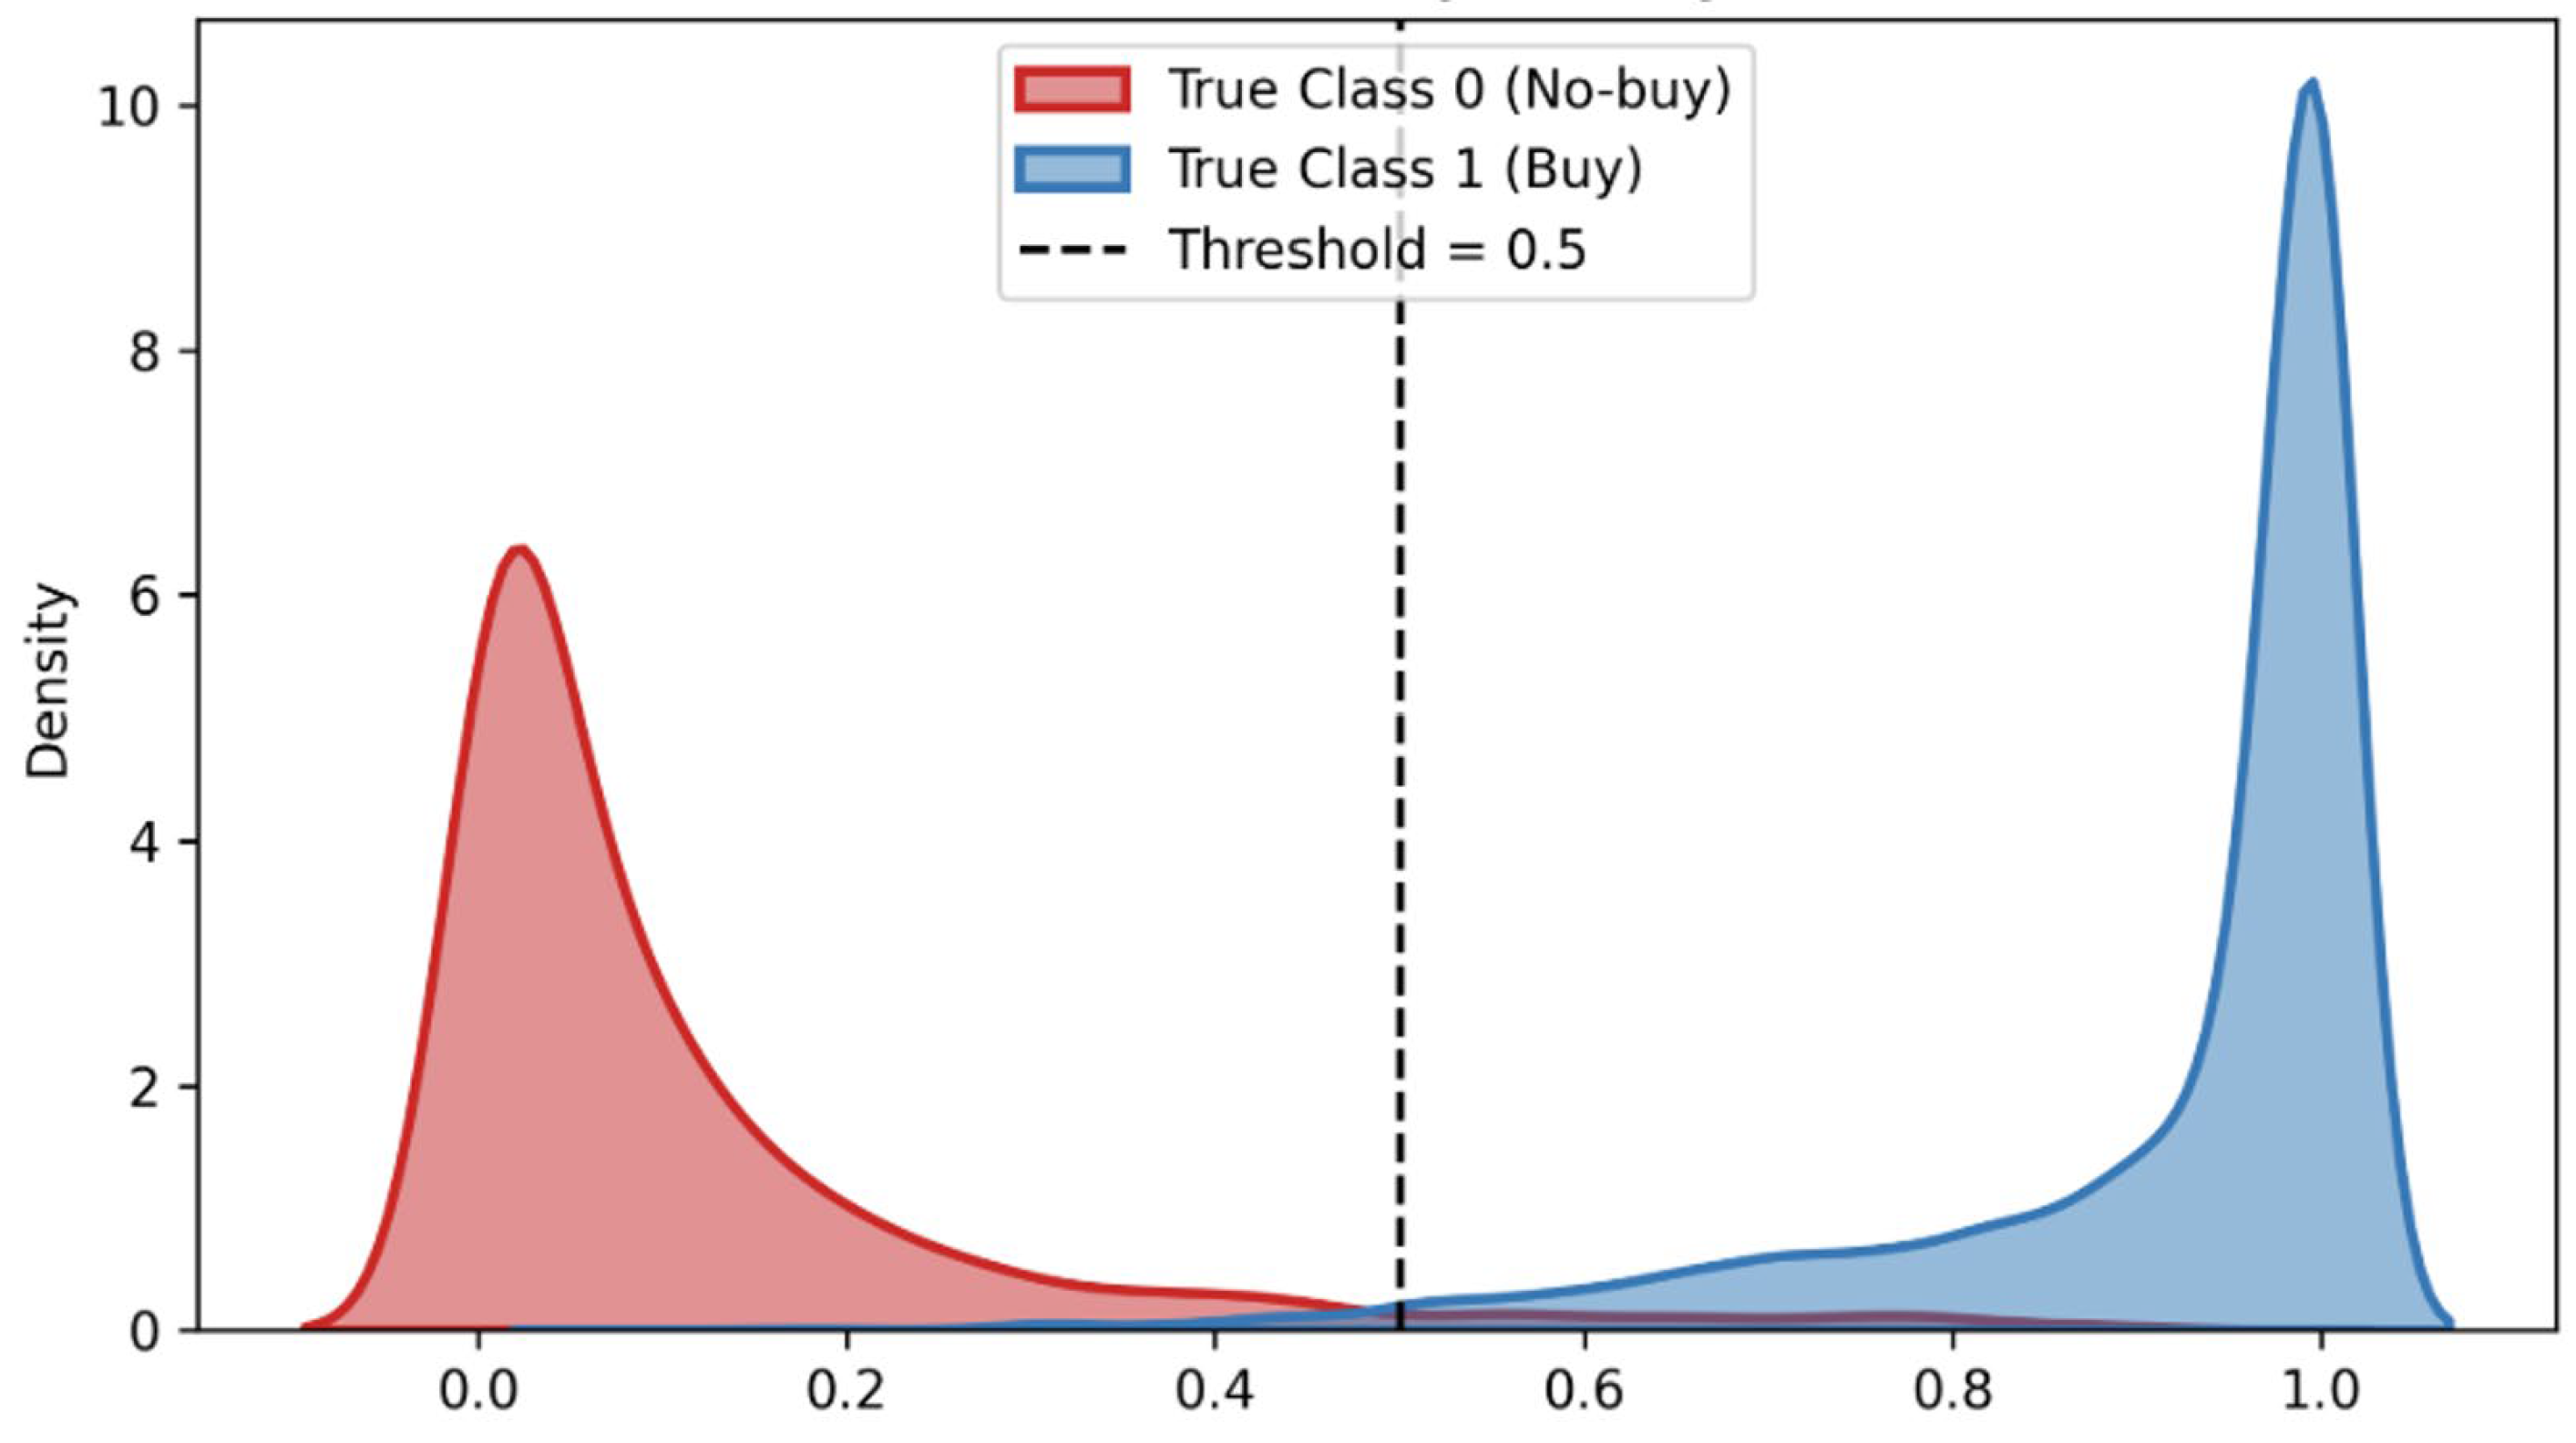
The KDE visualization of the binary classification result is presented in Figure 11. The results indicate that the probability distributions for the purchase and not-purchase categories exhibit a distinctly bimodal separation. The predicted probabilities for non-purchased samples are concentrated around 0, while those for purchased samples are clustered near 1, with minimal overlap between the two distributions at the 0.5 decision threshold. This demonstrates that CatBoost yields high-confidence predictions for most samples, reflecting strong discriminative power and classification stability.
Figure 11.
Predicted probability density by KDE.
3.3. Feature Correlation Analysis
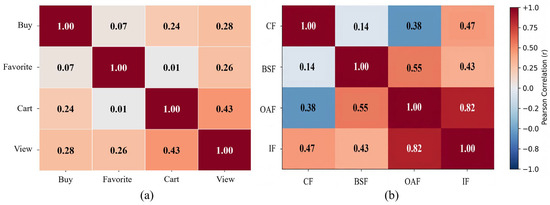
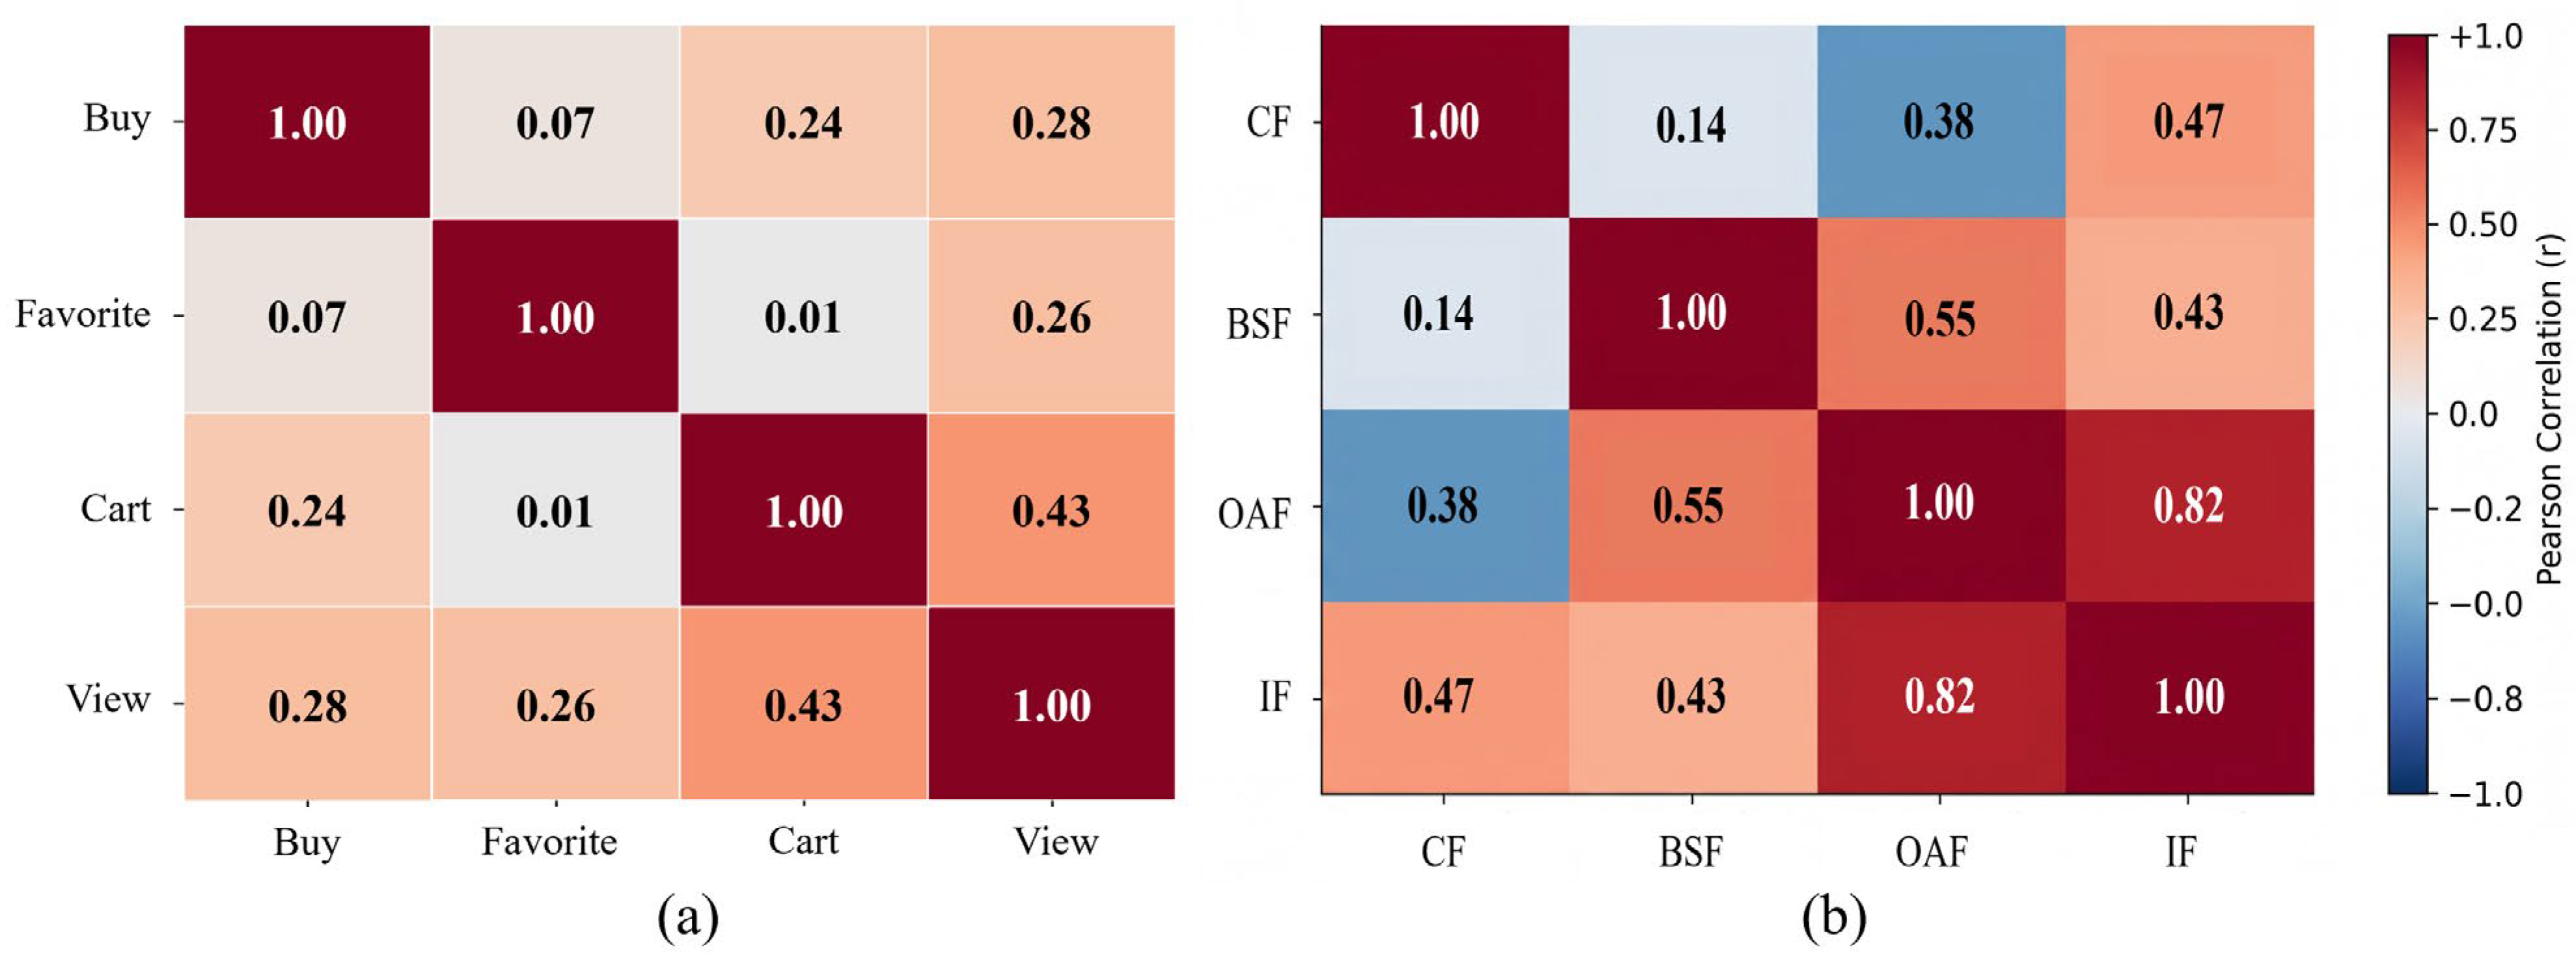
We adopt the Pearson correlation coefficient to measure the covariance of multidimensional features. In Figure 12a, the correlation heatmap of basic features intuitively reflects the attrition characteristics and intent differences across various stages of the e-commerce user conversion funnel. Although all basic features, apart from the Favorite and Cart pair, are positively correlated, the degree of correlation varies significantly. View and Cart exhibit a moderate positive correlation, reaching 0.43, the highest in the matrix. It demonstrates that extensive product comparisons before decision-making make View the most direct traffic foundation for cart additions. However, View and Buy (r = 0.28), as well as Cart and Buy (r = 0.24), show weak positive correlations, confirming the typical phenomena of window shopping and shopping cart abandonment. Although viewing and adding products to the cart are prerequisites for a final purchase, there is massive attrition when intentional behaviors translate into actual orders due to factors like cross-platform price comparisons and decision hesitation. Furthermore, Favorite exhibits obvious detachment, showing almost no correlation with Buy or Cart. In actual user habits, favoriting is more often used as a long-term wishlist, reflecting distant potential needs and clearly deviating from the immediate transactional conversion path of View-Cart-Buy.
Figure 12.
The correlation analysis among (a) basic features and (b) high-level features.
In Figure 12b, the correlation heatmap of high-level features reveals the underlying driving relationships between e-commerce users’ behavioral depth, visit patterns, and ultimate conversion. While all features exhibit positive correlations, significant gradations exist along the intent transmission chain. Notably, the overall activity feature is highly coupled with the interaction feature, reaching 0.82. This indicates that a massive traffic base directly spawns a large volume of deep interactions, such as Cart and Favorite. Meanwhile, the behavioral stability feature shows a moderate positive correlation with the overall activity feature (r = 0.55), suggesting that retained users with regular visiting habits are the core source of stable foundational traffic for the platform. Regarding conversion drivers, the interaction feature has the highest correlation with the conversion feature among all variables, confirming that intensive interactive behavior is the most critical leading indicator of purchasing products. In contrast, the overall activity feature has a limited pull on conversion, where the mere accumulation of activity cannot be proportionally translated into actual sales. Notably, the behavioral stability feature is largely disconnected from conversion intent, revealing that loyal users with stable visiting patterns are not necessarily high-frequency buyers. Their individual purchasing decisions are driven more by immediate interaction depth, rather than long-term visiting habits.
3.4. Feature Contribution Analysis
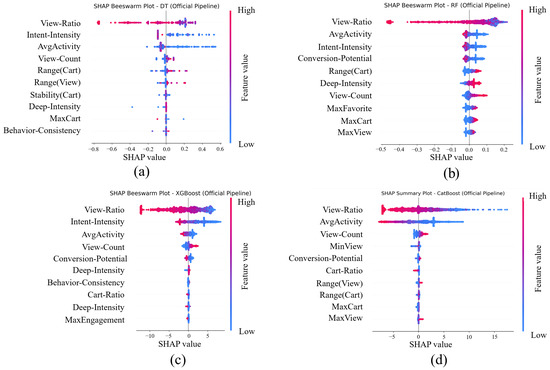
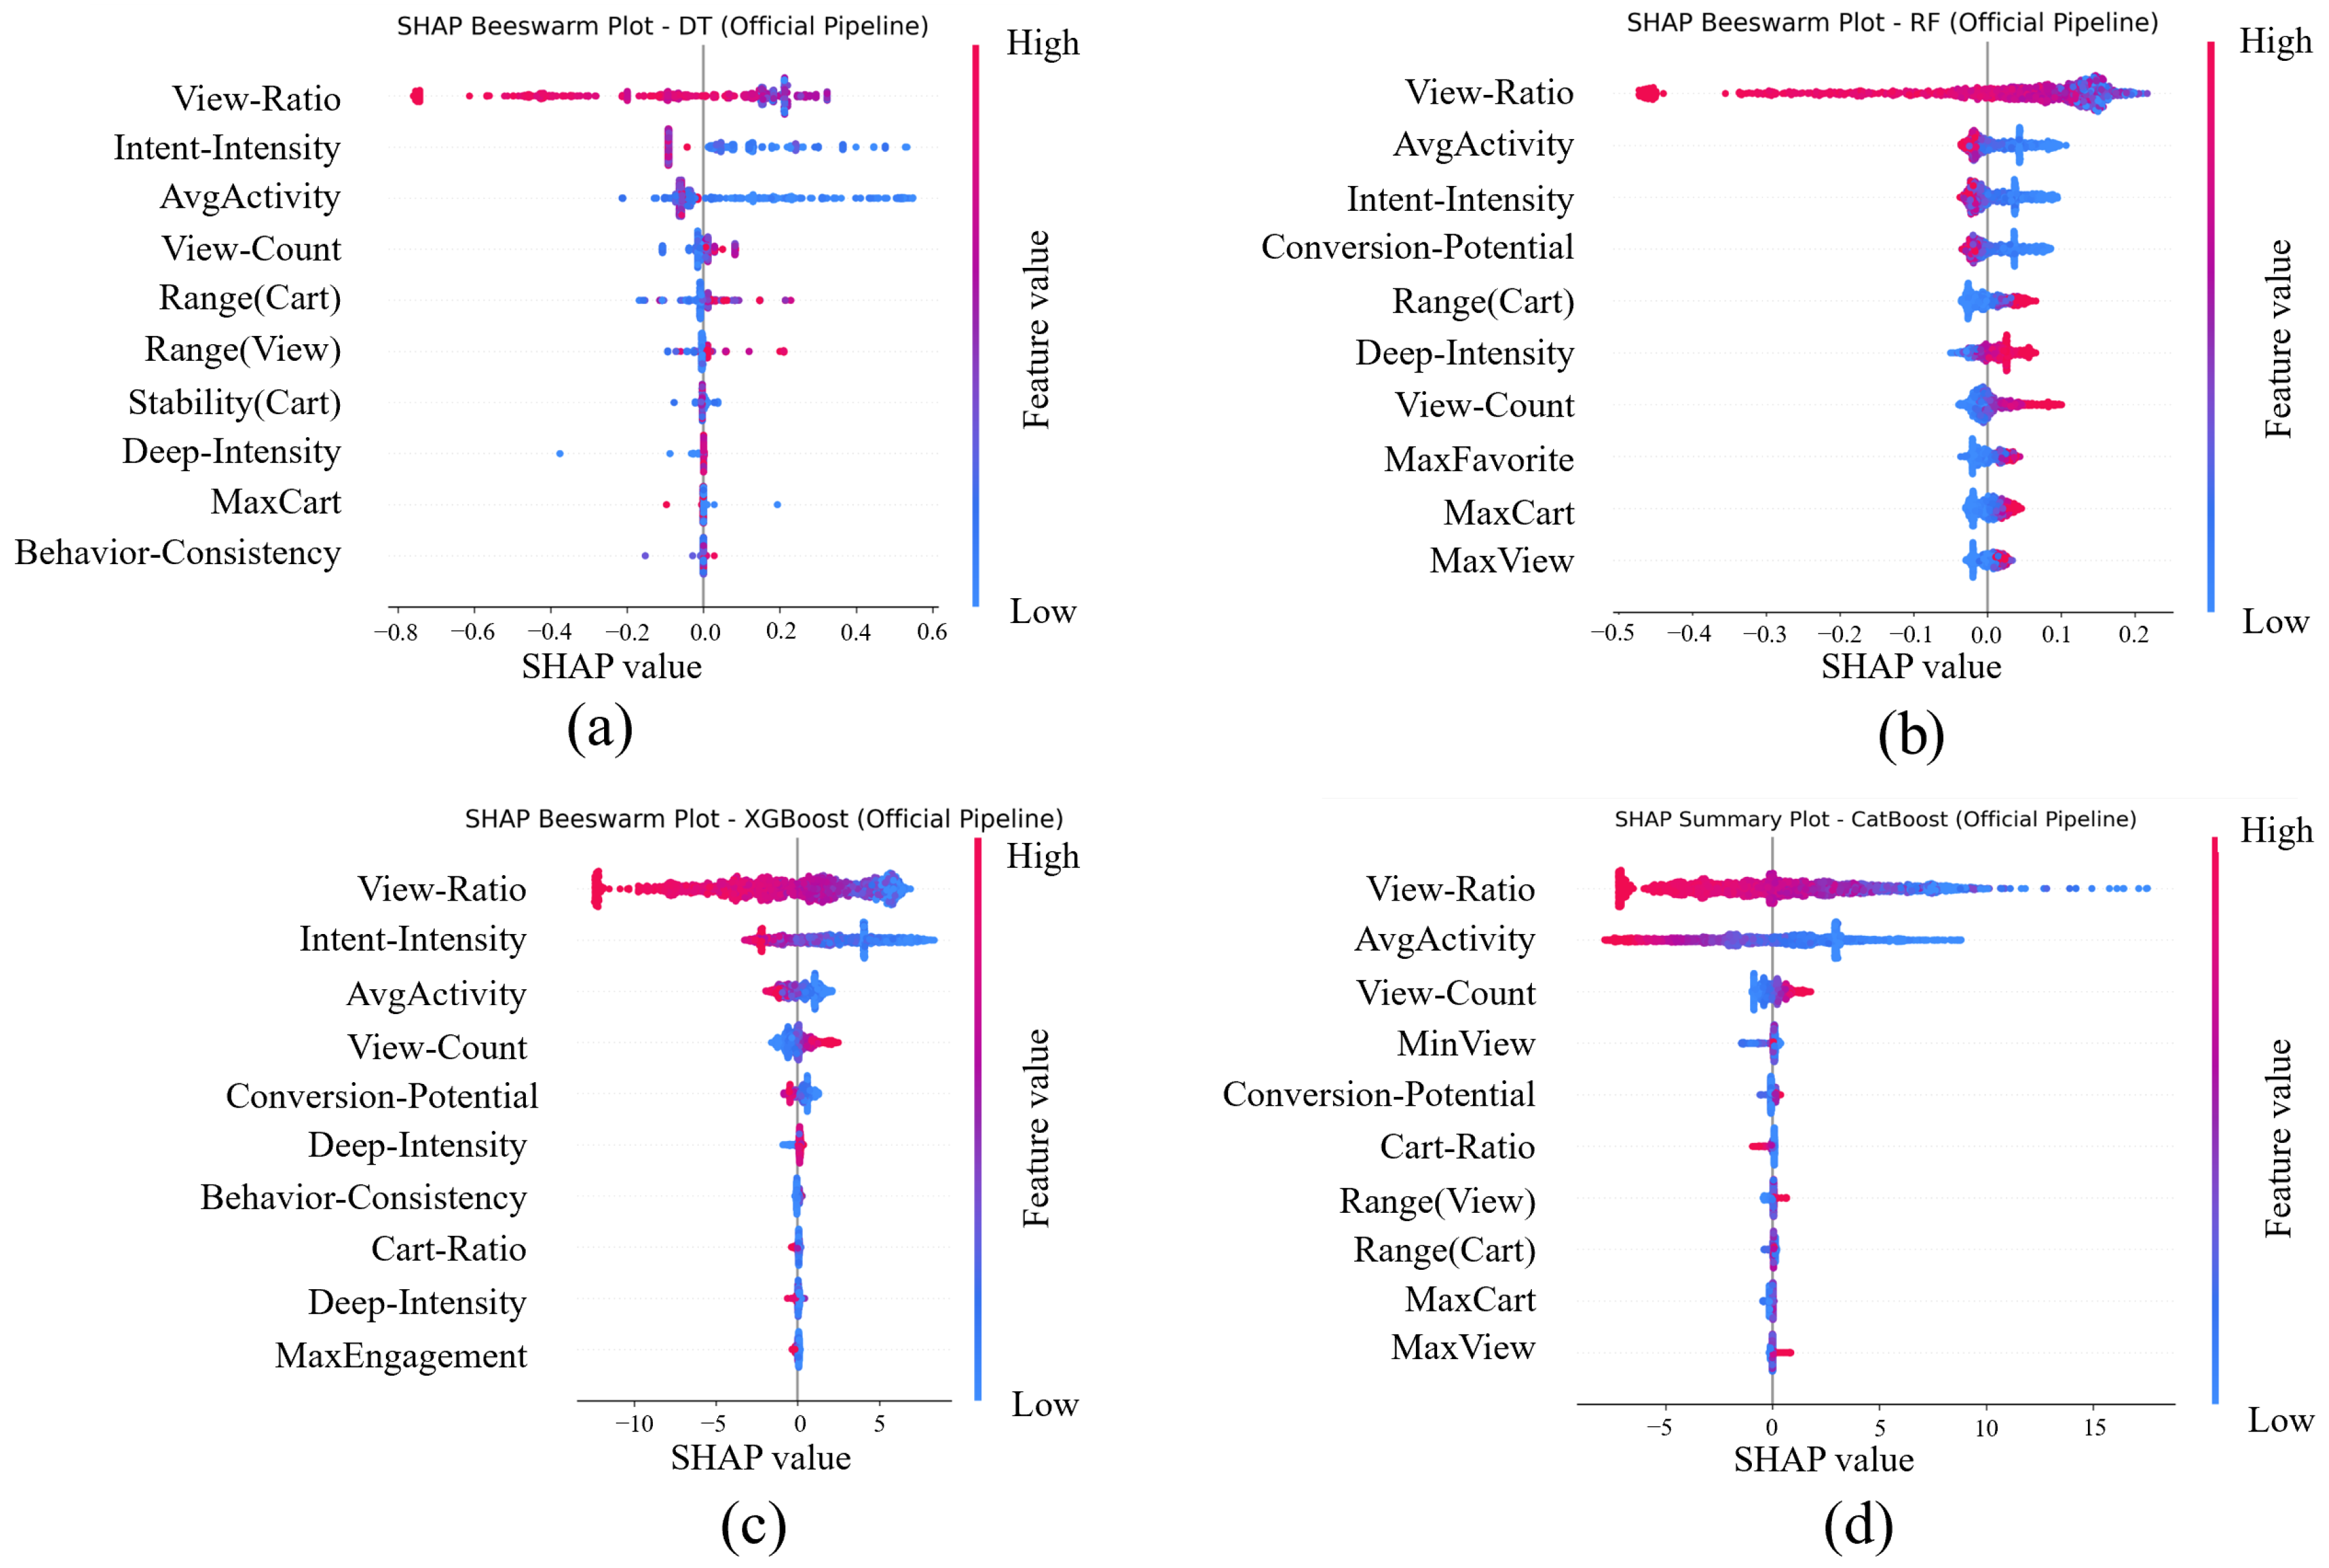
To evaluate the feature importance, we employ the SHAP analysis approach across DT, RF, CatBoost, and XGBoost algorithms. The results are represented in Figure 13. Among them, certain basic features have demonstrated a high degree of global consensus, serving as universal benchmarks to judge user purchase intent. Notably, View-Ratio consistently ranks at the top of feature importance. Its extremely wide SHAP value span indicates the dominance of user viewing behavior. Meanwhile, AvgActivity and View-Count also rank highly across all four models. This demonstrates that regardless of the non-linear fitting capabilities of the algorithmic architectures, the absolute traffic base and user activity frequency always serve as the most solid underlying support for predicting purchase conversion rates.
Figure 13.
The analysis result of contributing multidimensional features via SHAP value. (a) DT, (b) RF, (c) XGBoost, and (d) CatBoost.
Behavioral Stability features provide a significant contribution to capturing deep intent, greatly elevating the upper predictive limit of the models. Deep intent features, represented by Intent-Intensity and Deep-Intensity, exhibit a strong predictive driving force in high-performing ensemble algorithms. Particularly in the CatBoost model, which has the highest prediction accuracy, the high feature values of Intent-Intensity correspond to significant positive SHAP values, confirming that the explosiveness and depth of interactions are crucial leading indicators driving final payments. Furthermore, features representing temporal behavioral patterns, such as Range(Cart), Range(View), and Stability(Cart), consistently occupy important positions across all models. These features break through the limitations of absolute quantitative statistics. By capturing the dispersion and aggregation of user visits and interactions along the timeline, they effectively help the models accurately distinguish between potential buyers making regular return visits and occasional window shoppers.
Despite the consensus on core features, there is significant heterogeneity among different algorithms in their dependence on features. As the model with the highest prediction accuracy, CatBoost is extremely sensitive to View-Ratio, AvgActivity, and View-Count. Meanwhile, we notice that one of the high-order composite features, Conversion-Potential, appears in its Top-10 contributing feature list, which translates subtle differences in behavioral stability features into highly accurate probability predictions. In contrast, DT, which has the lowest accuracy, appears rather coarse in its feature utilization. Its SHAP values are scattered around the zero point, and it over-relies on extreme value features (e.g., MaxCart), failing to smoothly and comprehensively utilize dynamic stability features. Among the other ensemble models, CatBoost exhibits an extreme dependency on head features, where an excessive weight on leading indicators causes a cliff-like drop in the contributions of subsequent features. Conversely, RF leverages the stability of its Bagging architecture to absorb various features most evenly, allowing high-order features to achieve a fuller weight expression within its model.
4. Discussion
4.1. Integration of the Conversion Funnel Model
The experimental results of this study demonstrate the significant enhancement in predictive accuracy for user purchase behavior achieved by integrating e-commerce theories and the conversion funnel model. Traditional predictive methods are often confined to single statistical indicators, neglecting the underlying business logic of user behaviors. By introducing the conversion funnel model, this study abstracts the user’s decision-making process into a progressive and narrowing stage-based process from initial exposure to final purchase. Referring to the experimental results in Section 3.1, after integrating high-level features (e.g., conversion features, behavioral stability features, overall activity features, and interaction features), the predictive performance of all evaluated machine learning algorithms is substantially improved. Particularly in the multidimensional feature ablation experiment, integrating all features enabled CatBoost to reach an optimal predictive accuracy of 0.9737, whereas removing any single-dimensional feature set resulted in a decrease in predictive accuracy. This further validates the necessity of incorporating prior knowledge and e-commerce theories in constructing the feature framework. The conversion funnel model not only provides a structured framework for feature engineering, but also effectively captures the attrition characteristics and intent differences in users across varying stages, thereby offering a higher-quality data foundation for machine learning models.
4.2. Effects of Multidimensional Features
This study reveals the necessity and effectiveness of multidimensional features through correlation analysis and SHAP value attribution. According to the correlation analysis in Section 3.3, View and Cart among the basic features exhibit the highest positive correlation (r = 0.43), while their correlations with Buy are relatively weak, confirming the typical phenomena of window shopping and shopping cart abandonment in e-commerce. At the high-level feature tier, the interaction feature has the highest correlation with the conversion feature, proving that intensive interaction is the most critical leading indicator of purchase intent. Conversely, the behavioral stability feature is largely disconnected from conversion intent, revealing the business insight that loyal users with stable visiting patterns are not necessarily high-frequency buyers. Furthermore, the SHAP feature contribution analysis in Section 3.4 demonstrates that although basic features such as View-Ratio, AvgActivity, and View-Count hold dominant positions across the models, behavioral stability features (e.g., Intent-Intensity, Range, and Stability) provide a strong contribution to capturing users’ deep intent. These multidimensional features break through the limitations of quantitative statistics, effectively helping the models accurately distinguish between potential buyers making regular return visits and occasional window shoppers, thereby highlighting the effectiveness of scientific feature engineering in handling complex, non-linear e-commerce data.
4.3. Limitation and Future Work
Although this study has achieved promising results in predicting user purchase behavior, there are still certain limitations based on the current experimental design and methodology that need to be addressed in future work. First, regarding the data source, this study adopts a real-world user behavior dataset from JD.com. Although this dataset contains approximately 37 million behavioral logs, it originates from a single platform. Future research could consider incorporating cross-platform or longer-term longitudinal data to verify the generalization ability of this multidimensional feature framework across different e-commerce ecosystems [53]. Second, there exists an imbalance in the distribution of positive and negative samples within the raw dataset, where purchase behavior accounts for only 5.9% of the total behaviors, while viewing behavior reaches as high as 89.1%. While this study relied on the SMOTE upsampling method to balance the ratio of positive and negative samples, future efforts could explore more advanced dynamic resampling techniques or cost-sensitive learning strategies to tackle extreme imbalanced distributions in real-world e-commerce scenarios [54]. Third, this study primarily evaluated four traditional tree-based machine learning algorithms. Future work could consider integrating the theory-driven features based on the funnel model proposed in this study into more complex deep learning frameworks (e.g., Long-short term memory and Transformer) [55,56], aiming to achieve greater performance breakthroughs in mining the sequential dependencies and time-series characteristics of massive user behaviors. Last, we acknowledge that the dataset used in this study was released by JD.com in 2018. The research outcome of this study might be unable to fully reflect the current behavior patterns due to changes in modern information technology like mobile shopping, recommendation systems, payment methods, etc. We would further validate the proposed multidimensional feature paradigm and the extracted contributing features over newly released datasets. Meanwhile, another limitation of using this JD.com dataset may lead to incapability of predicting real-time purchase behaviors. Because this dataset only records the activity count during a day, without an exact time when each activity is taken. So, for predicting the purchase behavior at Datet, we can only assume that we have all the activity data (apart from the Purchase count) in hand. However, we believe our multidimensional feature paradigm and machine learning algorithms can still work with data incoming at Datet. Because we already include the historical data and learned patterns from them. Also, with real-time data incoming, we would just update the count values for each activity, as well as the multidimensional feature values. All these features remain the same dimensionality and are treated as input to machine learning models. Future work would also focus on this real-time purchase behavior prediction if real-time activity counts are available.
5. Conclusions
This paper is dedicated to solving the challenge of accurately predicting purchase behavior from massive user data in e-commerce scenarios, proposing a predictive analysis framework that integrates business theoretical paradigms with interpretable machine learning. Distinct from traditional methods that rely on simple statistics of raw data, this study deeply incorporates the e-commerce conversion funnel model and innovatively constructs a multidimensional feature engineering system encompassing basic, conversion, behavioral stability, overall activity, and interaction features. Extensive comparative experiments conducted on a real-world JD.com user behavior dataset demonstrate that the proposed multidimensional feature system can significantly enhance the predictive performance of various machine learning algorithms. Among them, CatBoost achieves the best classification performance after integrating all features, reaching an accuracy of 0.9737 and an AUC value of 0.9953. Furthermore, feature ablation experiments confirm that high-level features contribute a unique and indispensable signal to the classification task. Additionally, to address the black-box issue of ensemble models, this study introduces the SHAP analysis approach to conduct in-depth feature attribution analysis. The analytical results not only clarify the global dominance of baseline traffic indicators, such as View-Ratio and AvgActivity, but also reveal the critical leading roles of behavioral stability and deep interaction features, such as Intent-Intensity, in driving final order payments. In summary, this study provides a theory-driven and feature engineering paradigm for predicting e-commerce user purchase behavior, and offers transparent decision-making support to formulate precision marketing strategies.
Supplementary Materials
The following supporting information can be downloaded at: https://www.mdpi.com/article/10.3390/jtaer21100352/s1, Table S1: The example records of a single user; Table S2: Class distribution of each fold; Table S3: The generalization experimental result of CatBoost over the User Behavior Data from Taobao for Recommendation dataset.
Author Contributions
Conceptualization, W.R. and Z.Z.; methodology, Z.Z.; software, Z.Z.; validation, W.R. and Z.Z.; formal analysis, Z.Z.; investigation, W.R.; resources, W.R.; data curation, W.R. and Z.Z.; writing—original draft preparation, W.R. and Z.Z.; writing—review and editing, W.R. and Z.Z.; visualization, Z.Z.; supervision, Z.Z.; project administration, Z.Z.; funding acquisition, W.R. All authors have read and agreed to the published version of the manuscript.
Funding
This research is supported by the Jiangsu Vocational and Technical Education Association Research Project (Grant No. XHZDB2025002), Leading Talent Funding Program of Jiangsu Vocational Institute of Commerce (Grant No. 1042141233057), and Jiangsu Vocational Education Teaching Reform Research Project (Grant No. ZDZC230).
Institutional Review Board Statement
Not applicable.
Informed Consent Statement
Not applicable.
Data Availability Statement
The original contributions presented in this study are included in the article/Supplementary Materials. Further inquiries can be directed to the corresponding author.
Conflicts of Interest
The authors declare no conflicts of interest.
References
- Luo, T.; Li, R. Evaluating Environmental, Social, and Governance Strategies in E-Commerce: A Conceptual Framework on Alibaba Group’s Practices and Implications for Corporate Social Responsibility. J. Econ. Surv. 2026, 40, 1483–1497. [Google Scholar] [CrossRef] [Scilit]
- Paun, C.; Ivascu, C.; Olteteanu, A.; Dantis, D. The Main Drivers of E-Commerce Adoption: A Global Panel Data Analysis. J. Theor. Appl. Electron. Commer. Res. 2024, 19, 2198–2217. [Google Scholar] [CrossRef] [Scilit]
- Retail sales. National Bureau of Statistics of China. December 2025. Available online: https://www.stats.gov.cn/sj/zxfbhjd/202601/t20260119_1962323.html (accessed on 1 July 2026).
- Rajpoot, C.S.; Tiwari, V.; Vishwakarma, S.K. Emerging Trends of Recommender System for E-Commerce: A Comprehensive Review. Discov. Comput. 2026, 29, 63. [Google Scholar] [CrossRef] [Scilit]
- Da’u, A.; Salim, N. Recommendation System Based on Deep Learning Methods: A Systematic Review and New Directions. Artif. Intell. Rev. 2020, 53, 2709–2748. [Google Scholar] [CrossRef] [Scilit]
- Lazaroiu, G.; Negurita, O.; Grecu, I.; Grecu, G.; Mitran, P.C. Consumers’ Decision-Making Process on Social Commerce Platforms: Online Trust, Perceived Risk, and Purchase Intentions. Front. Psychol. 2020, 11, 890. [Google Scholar] [CrossRef] [Scilit] [PubMed]
- Singh, K.; Basu, R. Online Consumer Shopping Behaviour: A Review and Research Agenda. Int. J. Consum. Stud. 2023, 47, 815–851. [Google Scholar] [CrossRef] [Scilit]
- Zhou, S.; Hudin, N.S. Advancing E-Commerce User Purchase Prediction: Integration of Time-Series Attention with Event-Based Timestamp Encoding and Graph Neural Network-Enhanced User Profiling. PLoS ONE 2024, 19, e0299087. [Google Scholar] [CrossRef] [Scilit] [PubMed]
- Liu, C.; Sun, K.; Liu, L. The Formation and Transformation Mechanisms of Deep Consumer Engagement and Purchase Behavior in E-Commerce Live Streaming. Sustainability 2023, 15, 5754. [Google Scholar] [CrossRef] [Scilit]
- Wang, R.; Xu, S.; Li, S.; Pang, Q. Research on Influence Mechanism of Consumer Satisfaction Evaluation Behavior Based on Grounded Theory in Social E-Commerce. Systems 2024, 12, 572. [Google Scholar] [CrossRef] [Scilit]
- Grandon, E.E.; Nasco, S.A.; Mykytyn, P.P. Comparing Theories to Explain E-Commerce Adoption. J. Bus. Res. 2011, 64, 292–298. [Google Scholar] [CrossRef] [Scilit]
- Nguyen, T.T.; Truong, H.T.T.; Le-Anh, T. Online Purchase Intention Under the Integration of Theory of Planned Behavior and Technology Acceptance Model. SAGE Open 2023, 13, 21582440231218814. [Google Scholar] [CrossRef] [Scilit]
- Waszkowski, R. Aurea EDEN: A 3D Visualization Approach for E-Commerce Customer Journey Analytics. J. Theor. Appl. Electron. Commer. Res. 2025, 20, 279. [Google Scholar] [CrossRef] [Scilit]
- Goldstein, A.; Oestreicher-Singer, G.; Barzilay, O.; Yahav, I. Are We There Yet? Analyzing Progress in the Conversion Funnel Using the Diversity of Searched Products. MIS Q. 2022, 46, 2015–2054. [Google Scholar] [CrossRef] [Scilit]
- Gao, H.; Liu, H.; Lin, W.; Chen, C. Graph-Theoretic Approach to Detecting Real-Time Intents within Purchase Conversion Funnel Using Clickstream Data. Kybernetes 2023, 52, 5139–5163. [Google Scholar] [CrossRef] [Scilit]
- Lago, N.C.; Marcon, A.; Ribeiro, J.L.D.; de Medeiros, J.F.; Brião, V.B.; Antoni, V.L. Determinant Attributes and the Compensatory Judgement Rules Applied by Young Consumers to Purchase Environmentally Sustainable Food Products. Sustain. Prod. Consum. 2020, 23, 256–273. [Google Scholar] [CrossRef] [Scilit]
- Sun, P.; Hossain, M.S.; Law, K.A. Eco-Conscious Preferences, Emotional Attributes, and Polarity in Sentiment Analysis of Organic Food App Reviews: A Feature Engineering and Deep Learning Approach. J. Consum. Behav. 2025, 24, 2578–2596. [Google Scholar] [CrossRef] [Scilit]
- Borrohou, S.; Fissoune, R.; Badir, H. The Role of Data Transformation in Modern Analytics: A Comprehensive Survey. J. Comput. Lang. 2025, 84, 101329. [Google Scholar] [CrossRef] [Scilit]
- Suo, L.; Xia, L.; Chung, Y.; Kim, E. Layered Feature Engineering for E-Commerce Purchase Prediction: A Hierarchical Evaluation on Taobao User Behavior Datasets. CMC-Comput. Mater. Contin. 2026, 87, 78. [Google Scholar] [CrossRef] [Scilit]
- Alamsyah, R.; Wahyuni, S. Using Random Forest and Support Vector Machine Algorithms to Predict Online Shopper Purchase Intention from E-Commerce Session Data. Int. J. Appl. Inf. Manag. 2024, 4, 84–96. [Google Scholar] [CrossRef] [Scilit]
- Bucklin, R.E.; Sismeiro, C. A Model of Web Site Browsing Behavior Estimated on Clickstream Data. J. Mark. Res. 2003, 40, 249–267. [Google Scholar] [CrossRef] [Scilit]
- Moe, W.W.; Fader, P.S. Dynamic Conversion Behavior at E-Commerce Sites. Manag. Sci. 2004, 50, 326–335. [Google Scholar] [CrossRef] [Scilit]
- Hu, Q.; Tan, L.; Yuan, Q.; Zuo, Z.; Li, Y. Diverse Behavior Path Graphs for Multi-Behavior Recommendation. CMC-Comput. Mater. Contin. 2026, 87, 22. [Google Scholar] [CrossRef] [Scilit]
- Lu, X.; Wang, J.; Hsu, K.C. Personalized Fashion Recommendation Fusing Multi-Behavior and Multi-Modal Features. CMC-Comput. Mater. Contin. 2026, 88, 078574. [Google Scholar] [CrossRef] [Scilit]
- Kostopoulos, G.; Stefani, A.; Vasiliadis, V.; Kotsiantis, S. Deep Learning for E-Commerce: Recent Developments in Prediction, Personalization and Decision Intelligence. Appl. Sci.-Basel 2026, 16, 2263. [Google Scholar] [CrossRef] [Scilit]
- Dong, Y.; Jiang, W. Brand Purchase Prediction Based on Time-Evolving User Behaviors in E-Commerce. Concurr. Comput.-Pract. Exp. 2018, 31, e4882. [Google Scholar] [CrossRef] [Scilit]
- Tokuc, A.A.; Dag, T. Predicting User Purchases From Clickstream Data: A Comparative Analysis of Clickstream Data Representations and Machine Learning Models. IEEE Access 2025, 13, 43796–43817. [Google Scholar] [CrossRef] [Scilit]
- Gkikas, D.C.; Theodoridis, P.K. Predicting Online Shopping Behavior: Using Machine Learning and Google Analytics to Classify User Engagement. Appl. Sci. 2024, 14, 11403. [Google Scholar] [CrossRef] [Scilit]
- Wang, W.; Xiong, W.; Wang, J.; Tao, L.; Li, S.; Yi, Y.; Zou, X.; Li, C. A User Purchase Behavior Prediction Method Based on XGBoost. Electronics 2023, 12, 2047. [Google Scholar] [CrossRef] [Scilit]
- Gabryel, M.; Kocic, M.; Gabryel, A.; Kisiel-Dorohonicki, M.; Patora-Wysocka, Z. Predicting Future E-Commerce Purchases from Multi-Visit Sequences and Behavioural Micro-Interactions. J. Artif. Intell. Soft Comput. Res. 2026, 16, 412–433. [Google Scholar] [CrossRef] [Scilit]
- Lee, J.; Jung, O.; Lee, Y.; Kim, O.; Park, C. A Comparison and Interpretation of Machine Learning Algorithm for the Prediction of Online Purchase Conversion. J. Theor. Appl. Electron. Commer. Res. 2021, 16, 1472–1491. [Google Scholar] [CrossRef] [Scilit]
- Chen, S.; Wang, X.; Zhang, H.; Wang, J.-Q. Customer Purchase Prediction from the Perspective of Imbalanced Data: A Machine Learning Framework Based on Factorization Machine. Expert Syst. Appl. 2021, 173, 114756. [Google Scholar] [CrossRef] [Scilit]
- Manikandan, R.S.; Kumar, S.S.; Amalraj, J.J. Leveraging Advanced Machine Learning with Feature Selection Approach for Robust Customer Segmentation with Purchase Behavior Prediction. Int. J. Inf. Technol. 2026. [Google Scholar] [CrossRef] [Scilit]
- Lee, M.; Choi, I.; Kim, W.C. Predicting Mobile Payment Behavior Through Explainable Machine Learning and Application Usage Analysis. J. Theor. Appl. Electron. Commer. Res. 2025, 20, 117. [Google Scholar] [CrossRef] [Scilit]
- Cetin, S.; Zaimoglu, E.A. Explainable Turkish E-Commerce Review Classification Using a Multi-Transformer Fusion Framework and SHAP Analysis. J. Theor. Appl. Electron. Commer. Res. 2026, 21, 59. [Google Scholar] [CrossRef] [Scilit]
- Hassan, D.O.; Hassan, B.A. A Comprehensive Systematic Review of Machine Learning in the Retail Industry: Classifications, Limitations, Opportunities, and Challenges. Neural Comput. Appl. 2024, 37, 2035–2070. [Google Scholar] [CrossRef] [Scilit]
- Liu, C.J.; Huang, T.S.; Ho, P.T.; Huang, J.C.; Hsieh, C.T. Machine Learning-based E-Commerce Platform Repurchase Customer Prediction Model. PLoS ONE 2020, 19, e0315518. [Google Scholar] [CrossRef] [Scilit] [PubMed]
- Chen, Y.; Liu, H.; Wen, Z.; Lin, W. How Explainable Machine Learning Enhances Intelligence in Explaining Consumer Purchase Behavior: A Random Forest Model with Anchoring Effects. Systems 2023, 11, 312. [Google Scholar] [CrossRef] [Scilit]
- JD User Behavior Prediction Dataset. Model Whale. Available online: https://www.heywhale.com/mw/dataset/681955da6c18e6172d02f7c3/file (accessed on 15 March 2026).
- Li, H.S.; Kannan, P.K. Attributing Conversions in a Multichannel Online Marketing Environment: An Empirical Model and a Field Experiment. J. Mark. Res. 2014, 51, 40–56. [Google Scholar] [CrossRef] [Scilit]
- Wei, S.H.; Yang, Z.; Zhang, J.; Zeng, Y.; Li, Q.; Xiao, Y. Click-Through Conversion Rate Prediction Model of Book E-Commerce Platform Based on Feature Combination and Representation. Expert Syst. Appl. 2024, 238, 122276. [Google Scholar] [CrossRef] [Scilit]
- Li, L.; Jiang, Y.Y. Data-Driven Neural Network Dynamics for Customer Behavior Modeling and Personalized E-Commerce Marketing. AIMS Math. 2026, 11, 3221–3242. [Google Scholar] [CrossRef] [Scilit]
- Lawry, C.A. Futurizing Luxury: An Activity-Centric Model of Phygital Luxury Experiences. J. Fash. Mark. Manag. 2023, 27, 397–417. [Google Scholar] [CrossRef] [Scilit]
- Ni, Y.B.; Wu, Y.Q.; Li, J.Y.; Zeng, A.; Yu, H.; Li, X. Dynamic Masking-Based Feature Interaction Modeling for E-Commerce Click-Through Rate Prediction. Eng. Appl. Artif. Intell. 2025, 157, 111184. [Google Scholar] [CrossRef] [Scilit]
- Zheng, Y.L. Decision Tree Algorithm for Precision Marketing via Network Channel. Comput. Syst. Sci. Eng. 2020, 35, 293–298. [Google Scholar] [CrossRef] [Scilit]
- Huang, J.C.; Yang, T.C.; Chen, Y.T.; Shu, M.H.; Wu, T.J. Precise E-Commerce Information Push Model Based on User Feature and Improved Stacking. Int. J. Comput. Intell. Syst. 2026, 19, 139. [Google Scholar] [CrossRef] [Scilit]
- Song, P.Y.; Liu, Y.T. An XGBoost Algorithm for Predicting Purchasing Behaviour on E-Commerce Platforms. Teh. Vjesink-Tech. Gaz. 2020, 37, 1467–1471. [Google Scholar] [CrossRef] [Scilit]
- Ni, L.; Huang, Z.L.; Fu, N. A Stacking-Based Fusion Framework for Dynamic Demand Forecasting in E-Commerce. Mathematics 2025, 13, 3436. [Google Scholar] [CrossRef] [Scilit]
- Meng, Y.; Yang, N.H.; Qian, Z.L.; Zhang, G. What Makes an Online Review More Helpful: An Interpretation Framework Using XGBoost and SHAP Values. J. Theor. Appl. Electron. Commer. Res. 2021, 16, 466–490. [Google Scholar] [CrossRef] [Scilit]
- Zaghloul, M.; Barakat, S.; Rezk, A. Predicting E-Commerce Customer Satisfaction: Traditional Machine Learning vs. Deep Learning Approaches. J. Retail. Consum. Serv. 2024, 79, 103865. [Google Scholar] [CrossRef] [Scilit]
- Zhang, X.; Guo, F.S.; Chen, T.; Pan, L.; Beliakov, G.; Wu, J. A Brief Survey of Machine Learning and Deep Learning Techniques for E-Commerce Research. J. Theor. Appl. Electron. Commer. Res. 2023, 18, 2188–2216. [Google Scholar] [CrossRef] [Scilit]
- Li, J.R.; Liu, J.T. Comprehensive Measures, Regional Differences, and Dynamic Evolution of e-Commerce Level in China Based on the E-Commerce Data of 31 Provinces From 2013 to 2021. Discret. Dyn. Nat. Soc. 2025, 2025, 2791558. [Google Scholar] [CrossRef] [Scilit]
- Long, Y.C. Enhanced SVM-based Model for Predicting Cyberspace Vulnerabilities: Analyzing the Role of User Group Dynamics and Capital Influx. PLoS ONE 2025, 20, e0327476. [Google Scholar] [CrossRef] [Scilit] [PubMed]
- Zhang, X.; Cheng, X.; Xiao, Y.Y.; Zheng, W. Advancing Multibehavior Recommendation with Dual-Mode Augmented Contrastive Learning. IEEE Trans. Comput. Soc. Syst. 2025, 12, 3116–3130. [Google Scholar] [CrossRef] [Scilit]
- Li, T.T.; Wu, Y.L.; Liu, Y.Q.; Li, J. Deep Learning-Based Analysis of E-Commerce Enterprises: User Behavior and Consumption Prediction. J. Organ. End User Comput. 2025, 37, 379722. [Google Scholar] [CrossRef] [Scilit]
- Ni, W.; Chen, Q.Q. CrossNet: A Hybrid Neural Network Model for Cross-Domain E-Commerce Shopping Behavior Prediction. J. Circuits Syst. Comput. 2025, 35, 2550361. [Google Scholar] [CrossRef] [Scilit]

Disclaimer/Publisher’s Note: The statements, opinions and data contained in all publications are solely those of the individual author(s) and contributor(s) and not of MDPI and/or the editor(s). MDPI and/or the editor(s) disclaim responsibility for any injury to people or property resulting from any ideas, methods, instructions or products referred to in the content. |
© 2026 by the authors. Licensee MDPI, Basel, Switzerland. This article is an open access article distributed under the terms and conditions of the Creative Commons Attribution (CC BY) license.