


Abstract
Against the backdrop of green and sustainable development, green innovation has become a central issue of concern for both society and academia. Based on regional innovation system and network theories, this study conceptualizes the urban knowledge base as a network structure rather than a simple collection of isolated knowledge elements. Using green patent licensing data, a multi-layer network is constructed, and the Exponential Random Graph Model (ERGM) is employed to examine the impact of urban knowledge network structures on city-level innovation diffusion. The study finds that in the green ICT field, cities’ deep embedding in knowledge networks weakens their ability to absorb external innovations, while broad embedding facilitates the introduction of external innovations. In the green transportation field, deep embedding in knowledge networks enhances the absorption of external innovations, whereas broad embedding has no significant effect. In both fields, knowledge combination potential and knowledge uniqueness promote the outward diffusion of local innovations but weaken the inflow of external innovations. This study not only offers theoretical insights into innovation diffusion at the city level but also provides guidance for policymakers in developing targeted urban sustainable development strategies.
1. Introduction
In the context of global sustainable development, the diffusion of green innovation has emerged as a pivotal force, promoting environmental progress and economic transformation [1]. It is regarded as key to addressing pressing challenges such as climate change, resource depletion, and pollution mitigation [2]. Given that cities are centers of human activity, they usually consume large amounts of resources and have significant environmental impacts. Therefore, it is crucial to understand the mechanisms of diffusion of green innovations among cities.
The systemic perspective suggests that cities, due to their different functions, are interdependent and connected [3], forming a complex system [4,5]. This view provides a theoretical foundation for understanding the diffusion of green innovation at the city level. Cities, as platforms for innovation, provide important knowledge resources for business innovation [6,7]. As business innovation activities become more complex, the range of disciplines involved grows, covering more related fields and requiring higher specialization in knowledge and technology. When local resources cannot meet innovation needs, innovation actors engage in interactions across cities [8,9]. Through collaboration, technology transfer, and other approaches, innovation actors absorb external resources to reduce technological lock-in or dependency problems [10]. According to regional innovation systems theory, this cross-city diffusion creates a network where cities are nodes and innovation interactions are links, arranged in layers [11]. A city’s position in the innovation network determines its ability to access external innovation resources and participate in innovation activities [12,13].
In current research on regional innovation diffusion, geographical proximity has long been seen as an important condition for promoting knowledge exchange and cooperation between cities [14,15]. However, with advances in communication technology and lower interaction costs, non-geographical factors have gained more attention [13,16]. Studies have shown that carbon market policies [17], green digital finance [18], and economic development gaps [19] can drive the spread of green innovation across cities. In this context, the urban knowledge base is increasingly viewed as a key factor shaping innovation diffusion. It determines a city’s ability to acquire and absorb external knowledge, and it influences how innovation paths take shape. Existing studies provide evidence from different levels [20] found that technology transfer networks can significantly improve a city’s innovation capacity [21] showed that the interaction between internal knowledge diversity and external network structures helps spread innovation outcomes [22] revealed that both micro-level knowledge resources and the broader regional environment jointly affect the transfer of green technologies. Regarding the mechanisms, some scholars argue that technological proximity promotes effective knowledge diffusion [23,24]. Others find that knowledge spillovers are not limited to similar fields but may also cross different technological areas [25]. This difference suggests that technological proximity alone cannot fully explain how innovation spreads. Recent studies further suggest that knowledge diversity creates opportunities for cross-field combinations and integration in urban innovation diffusion [22,26,27,28]. Although the role of urban knowledge bases has been studied, most research still treats them as separate stocks of knowledge. This view helps measure the overall size and intensity of urban knowledge, but its limits are clear. Innovation is, in essence, a complex process of knowledge combination. New technologies or products often come from the interaction and integration of knowledge from different fields [29,30]. Focusing only on knowledge stocks cannot explain the links among knowledge elements or their impact on innovation paths. This results in an incomplete understanding of innovation diffusion and makes it hard to capture its micro-foundations.
To address this issue, a new perspective proposed by Brennecke and Rank [31] is adopted. In their study of corporate knowledge bases, Brennecke and Rank [31] conceptualized a company’s knowledge base as a network of knowledge elements and their connections, rather than a simple collection. In summary, patent licensing in green ICT and green transportation between cities is used to measure the direction and frequency of green innovation diffusion. An innovation diffusion network is then constructed. The knowledge elements and their combinations in patents are identified using IPC classification codes, and a knowledge network is built. Based on the affiliations among cities, patents, and knowledge elements, a multi-layer network of innovation diffusion and knowledge elements is constructed. The ERGM model is then applied to analyze how the structure of cities’ knowledge element combination networks affects innovation diffusion.
This paper mainly focuses on the following core question: How do urban knowledge networks influence the diffusion of green innovation between cities? To answer this core question in greater depth, two sub-questions are further proposed: (1) What are the characteristics of the knowledge network structure of cities? (2) How do these characteristics affect the diffusion of green innovation between cities?
The main contributions of this paper are as follows. First, the traditional “knowledge stock” perspective is extended by conceptualizing the urban knowledge base as a network of knowledge elements and their connections. This provides a new analytical framework for understanding green innovation diffusion. Second, a multi-layer network of urban innovation diffusion and knowledge elements is constructed, effectively capturing the structural complexity of green innovation diffusion. Third, the role of knowledge elements in green innovation diffusion is examined, providing strong empirical support for regional green innovation policy development and the optimization of technology diffusion pathways.
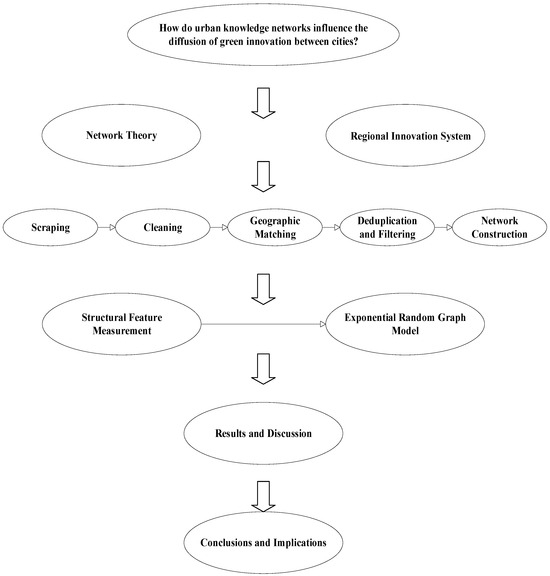
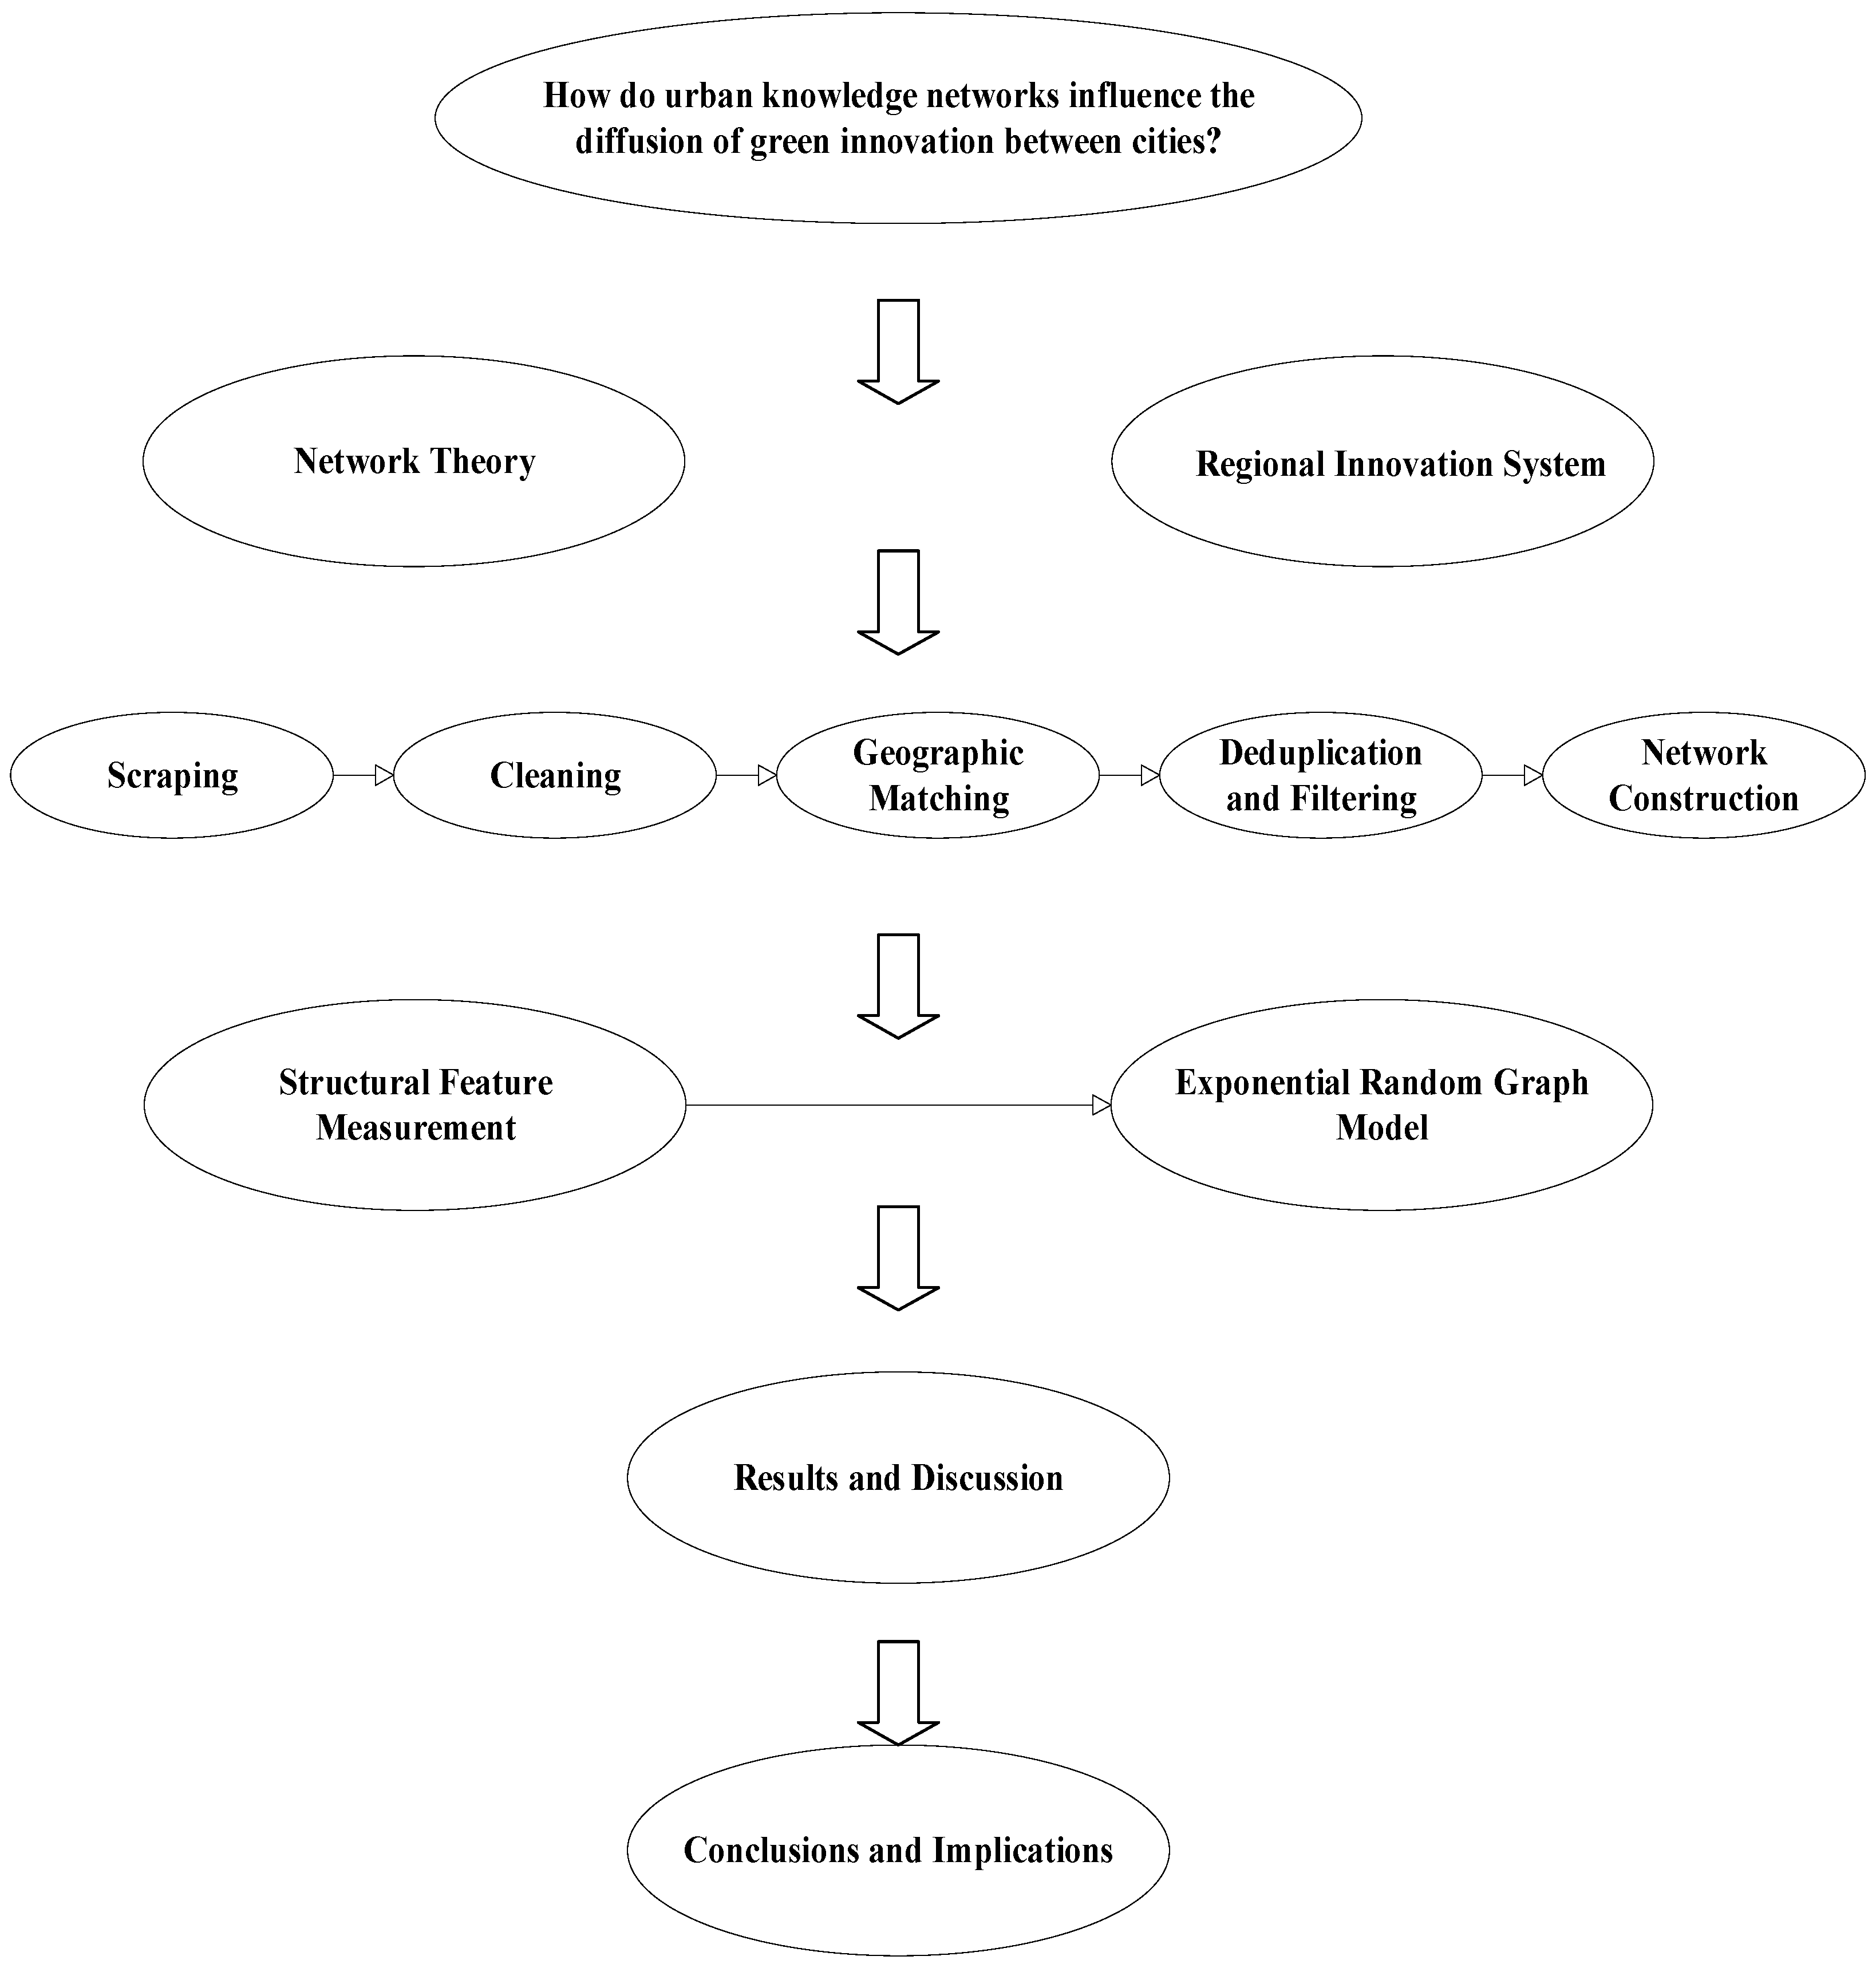
The structure of the paper is as follows. Section 2 presents the research methodology, including the data sources, variable construction, and network analysis methods. Section 3 presents the empirical results, focusing on the characteristics of green knowledge networks and their impact on green innovation diffusion. Section 4 summarizes the research conclusions, offering policy recommendations and directions for future research. Figure 1 is the technology roadmap of this study.
Figure 1.
Technology roadmap.
2. Methods and Data
2.1. Data Collection and Cleaning
To assess innovation diffusion among cities, patent license data were used. Patent licenses typically involve mature technologies that have undergone research and market validation. They carry measurable economic value, which can better reflect the economic impact of innovation [32]. Patents in green ICT and green transportation were selected for this study.
The patent licensing data in this study were obtained from the Himmpat database. Patent licensing records from 1 January 2001, to 31 December 2021, in green information and communication technology (ICT) and green transportation were selected. First, raw data were filtered using the national economic classification codes Y02D and Y02T, retaining only those aligned with the research topic. Strict data cleaning was conducted to ensure accuracy and relevance. The specific steps were as follows. (1) Exclusion of individual patent entities: Because this study focuses on diffusion between cities, patents involving individuals as licensors or licensees were removed. Such records do not represent technological flows at the city level. (2) Collection and matching of geographic information: An automated crawler program was developed to collect the geographic locations of licensors and licensees from authoritative enterprise information platforms such as Qichacha. The registered or primary operational addresses of the companies were identified to ensure geographic accuracy. (3) Cross-city patent selection: Patent licensing records where both the licensor and the licensee were in the same city were excluded. Only licenses involving different cities were retained to capture the spatial span of technological flows.
In the end, we obtained 266 green ICT patent licensing data points and 482 green transportation patent licensing data points.
2.2. Multi-Layer Network Construction
A novel network analysis tool was used, namely the interdependent multi-layer network. This network structure was first proposed by [33] to describe complex systems consisting of two or more network layers with distinct properties. Unlike traditional single-layer networks, interdependent multi-layer networks overcome the constraint of node homogeneity. Nodes in different layers can have distinct properties and form links across layers. In this study, a multi-layer network was established to capture urban innovation diffusion, the combination of knowledge elements, and the affiliation between urban areas and knowledge elements. The steps are as follows.
2.2.1. Innovation Diffusion Network
A licensed patent indicates that the invention has practical market potential and economic value. Patent licensing reflects an agreement on the patent’s economic value between the licensor and licensee [34]. Therefore, patent licensing marks the transition from the technical origin to market utilization and can serve as an indicator of regional innovation diffusion.
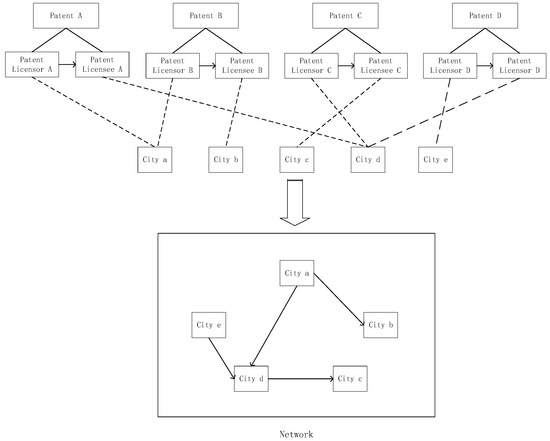
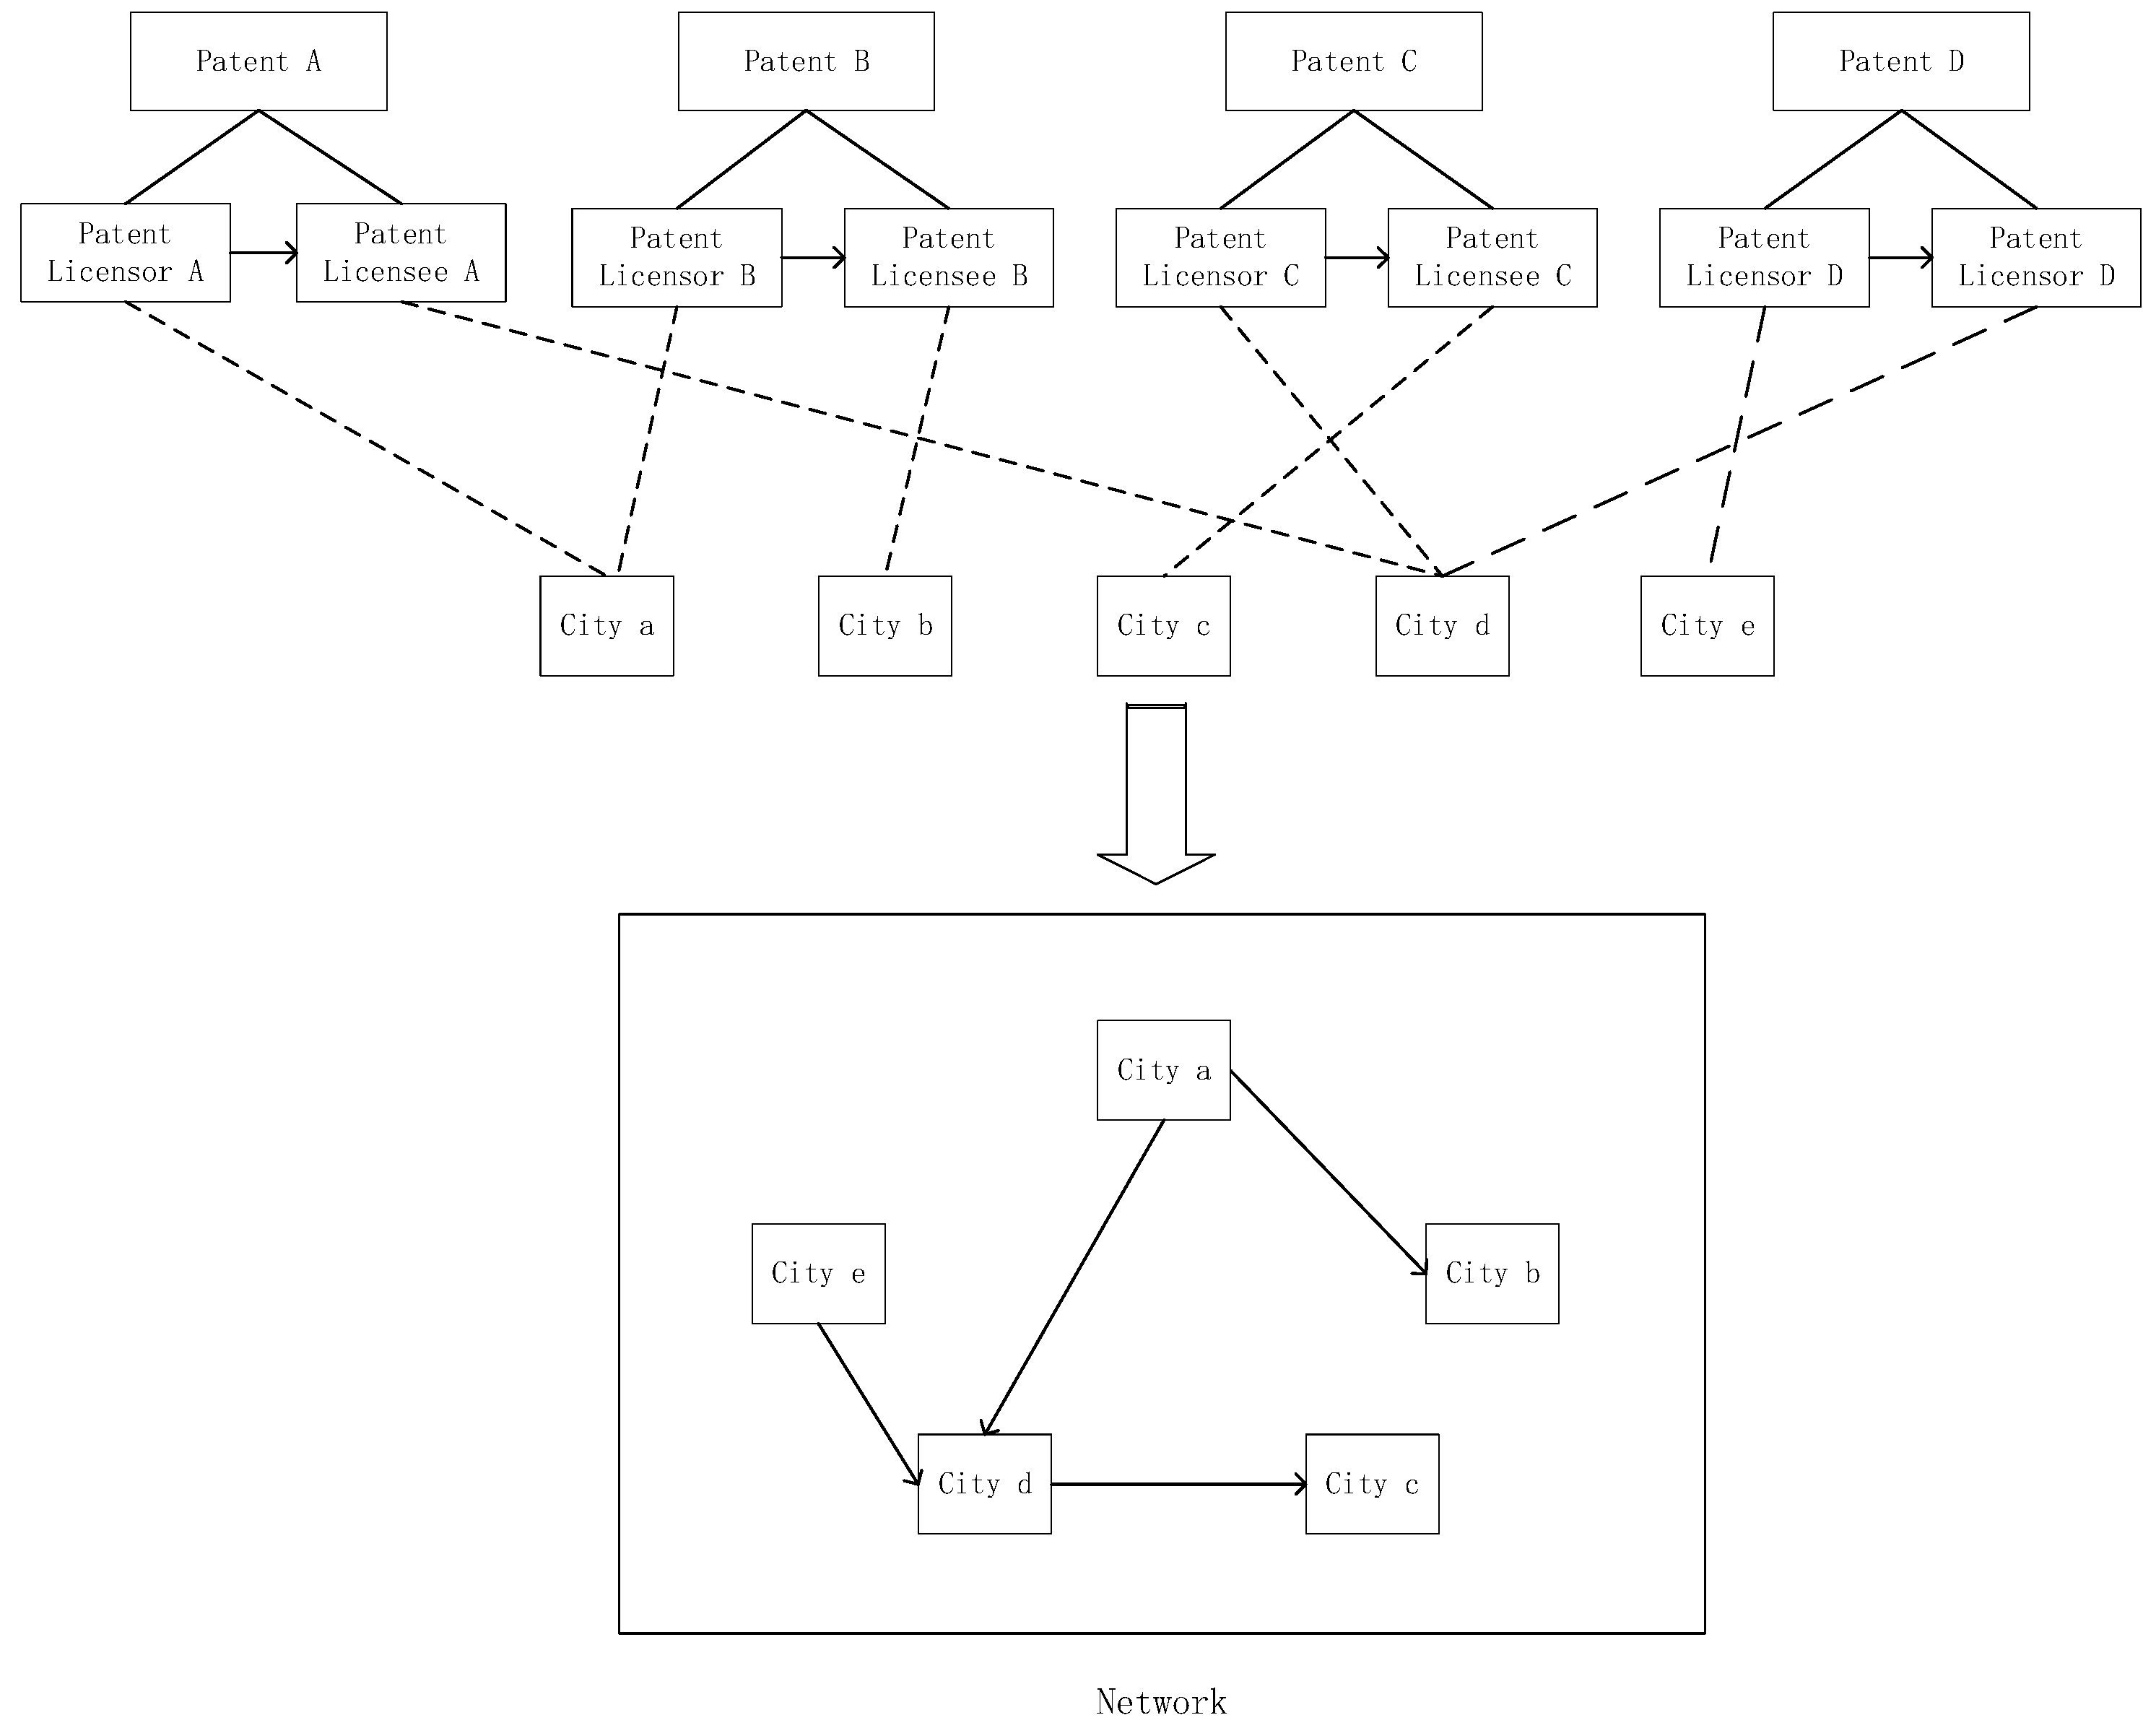
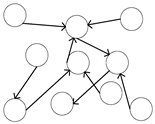
As shown in Figure 2, the cities of the licensor and licensee are identified for each patent. When the licensor and licensee are located in different regions, a city-level link is formed. The cities of the licensor and licensee serve as nodes. Patent licensing relationships are represented by edges, and the number of licenses is represented by weights. A directionally weighted network, the innovation diffusion network, is therefore constructed.
Figure 2.
Innovation diffusion network construction.
2.2.2. Knowledge Network
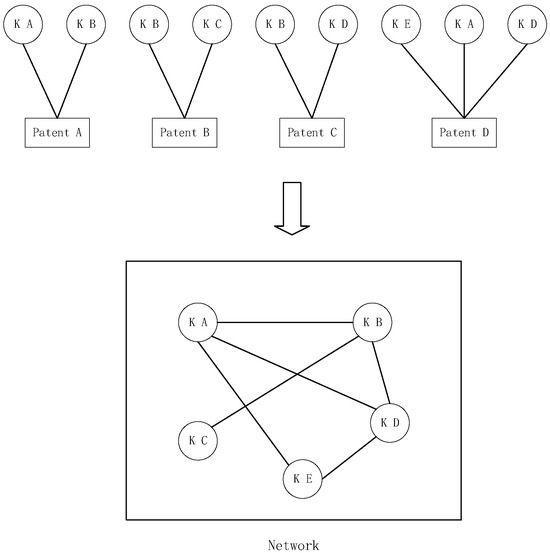
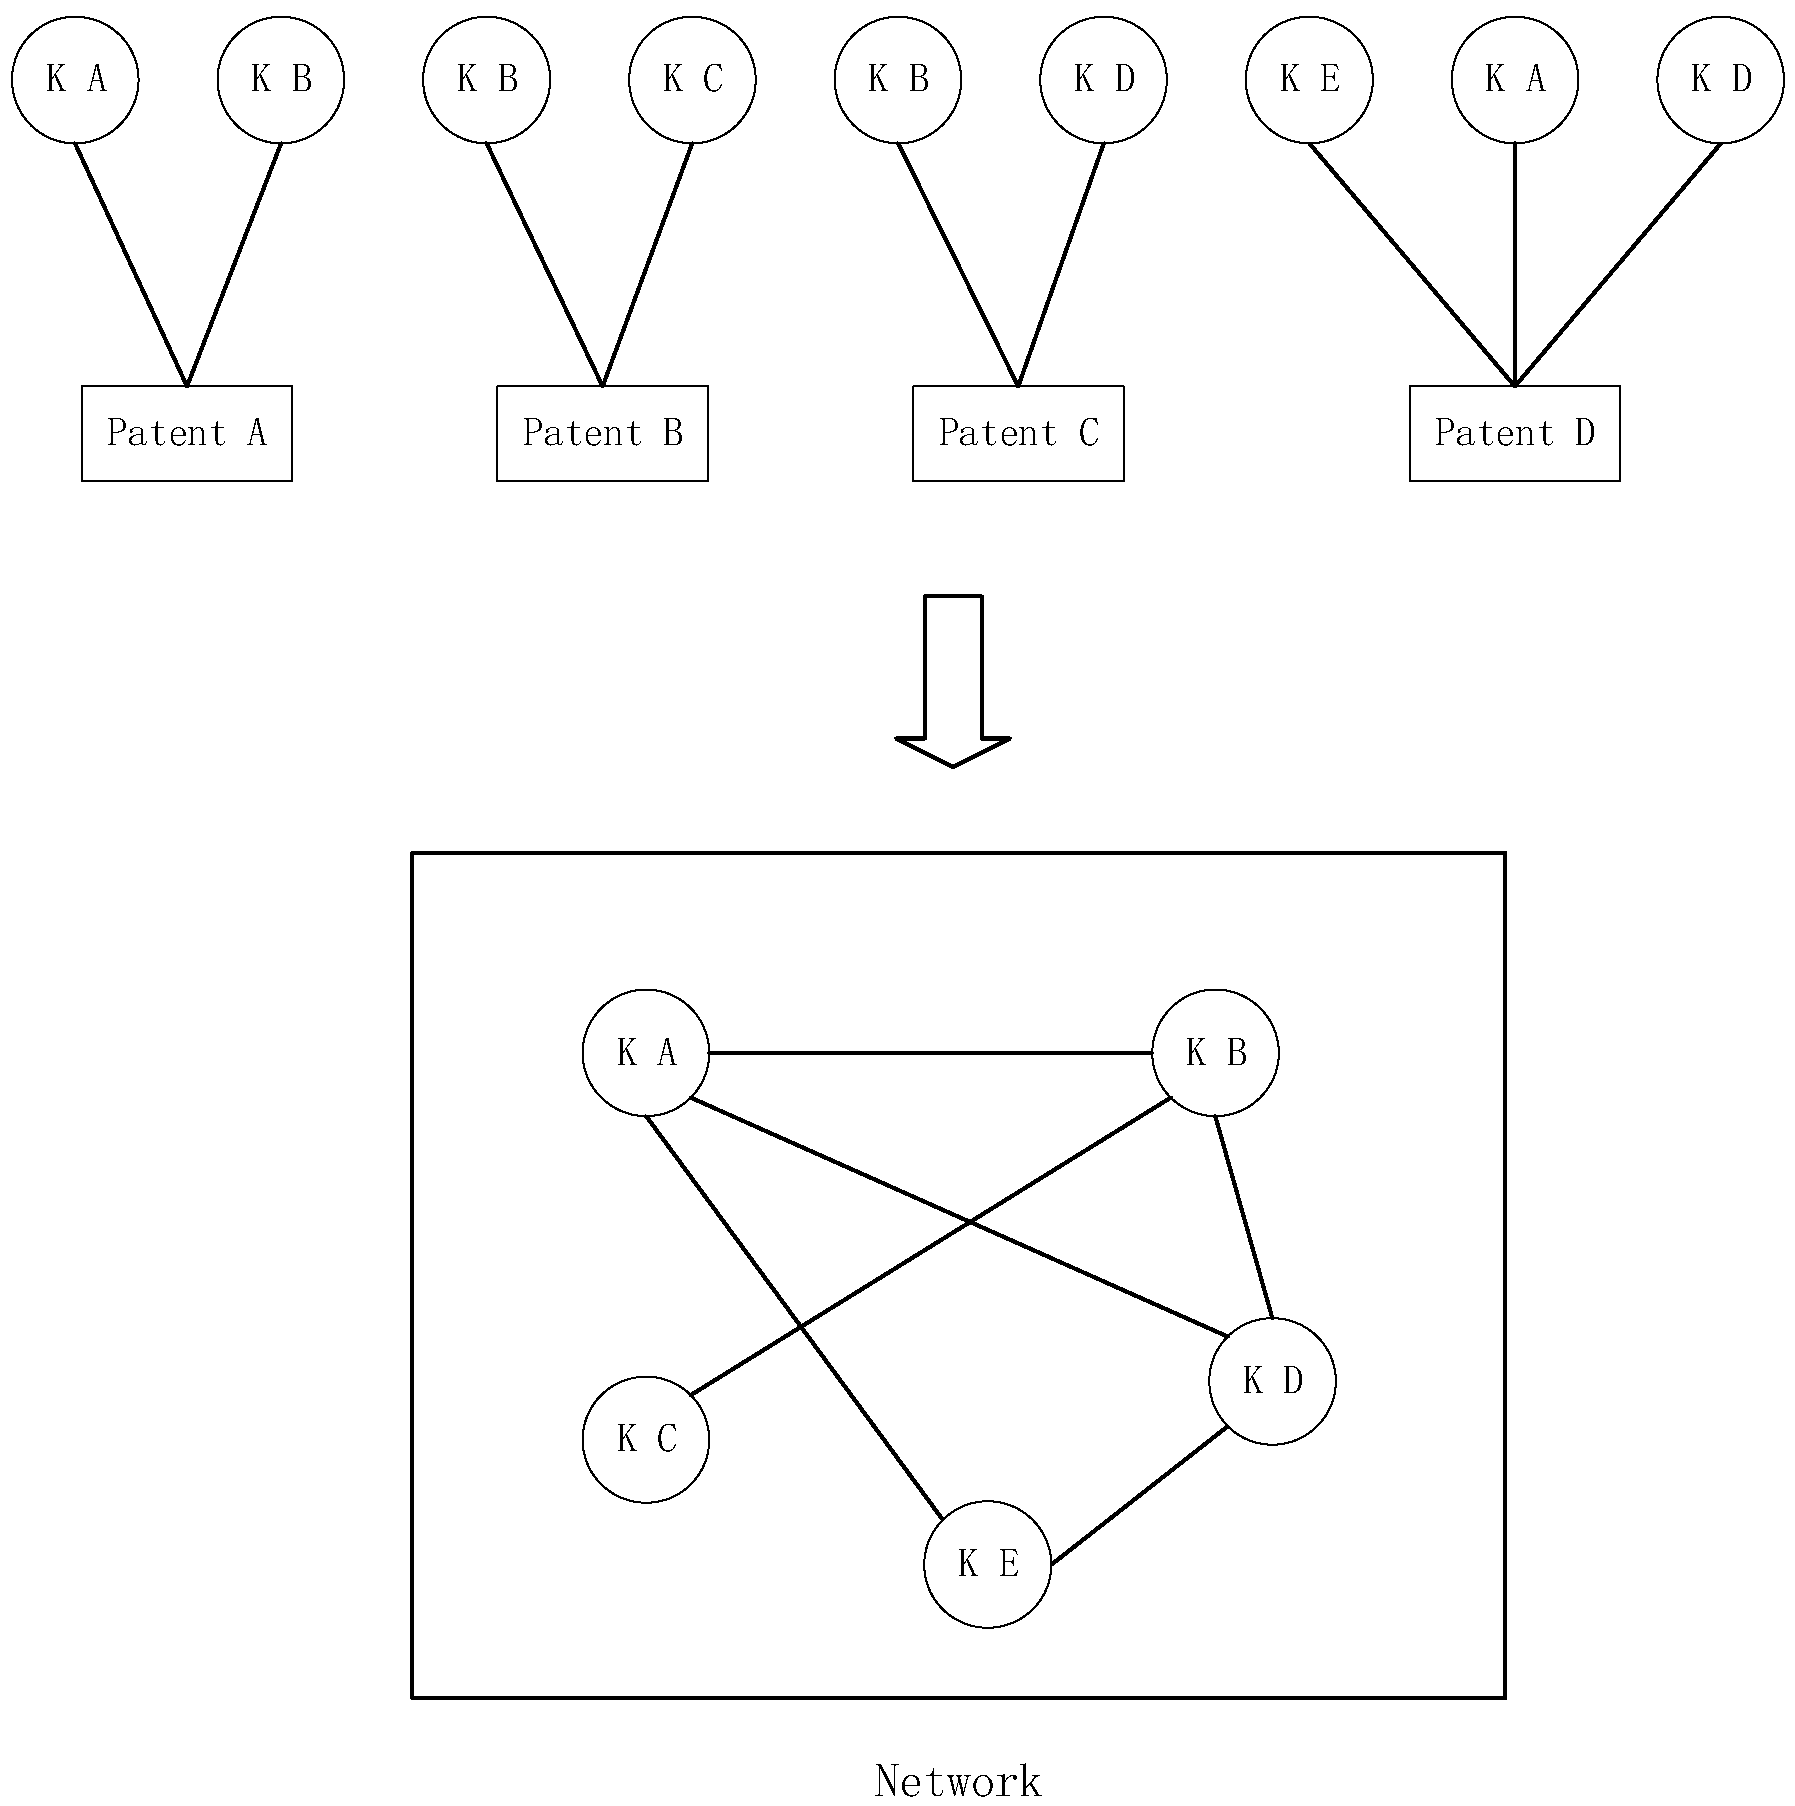
Knowledge has two dimensions: explicit and implicit [35]. Patents encode explicit knowledge [36,37,38]. The International Patent Classification (IPC) is an important indicator of explicit knowledge in patents. Most patents have one or more IPC numbers, which can be used to identify the knowledge elements involved. Patents also record how inventors combine these elements during knowledge creation and invention. We construct a knowledge network using IPCs’ co-occurrence. The nodes represent knowledge elements (IPCs), and the edges represent the relationships between them. Specifically, if two IPCs appear in the same patent, they form a link. The weight represents the number of times the two IPCs co-occur.
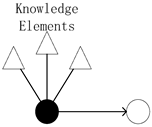
As shown in Figure 3, Patent A involves knowledge elements A and B, which are displayed as a connection between knowledge elements A and B. The two knowledge elements A and B co-occurred once in all patents, and thus the weight is 1.
Figure 3.
Knowledge network construction.
2.2.3. Multi-Layer Network
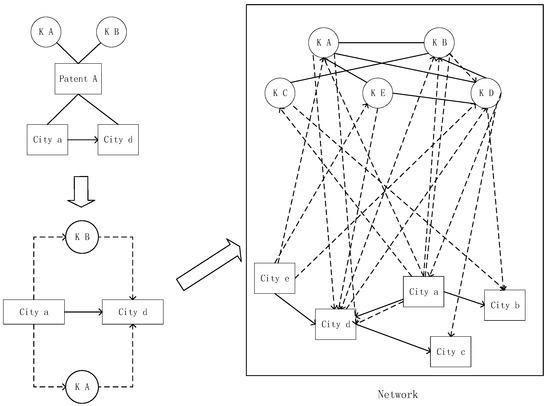
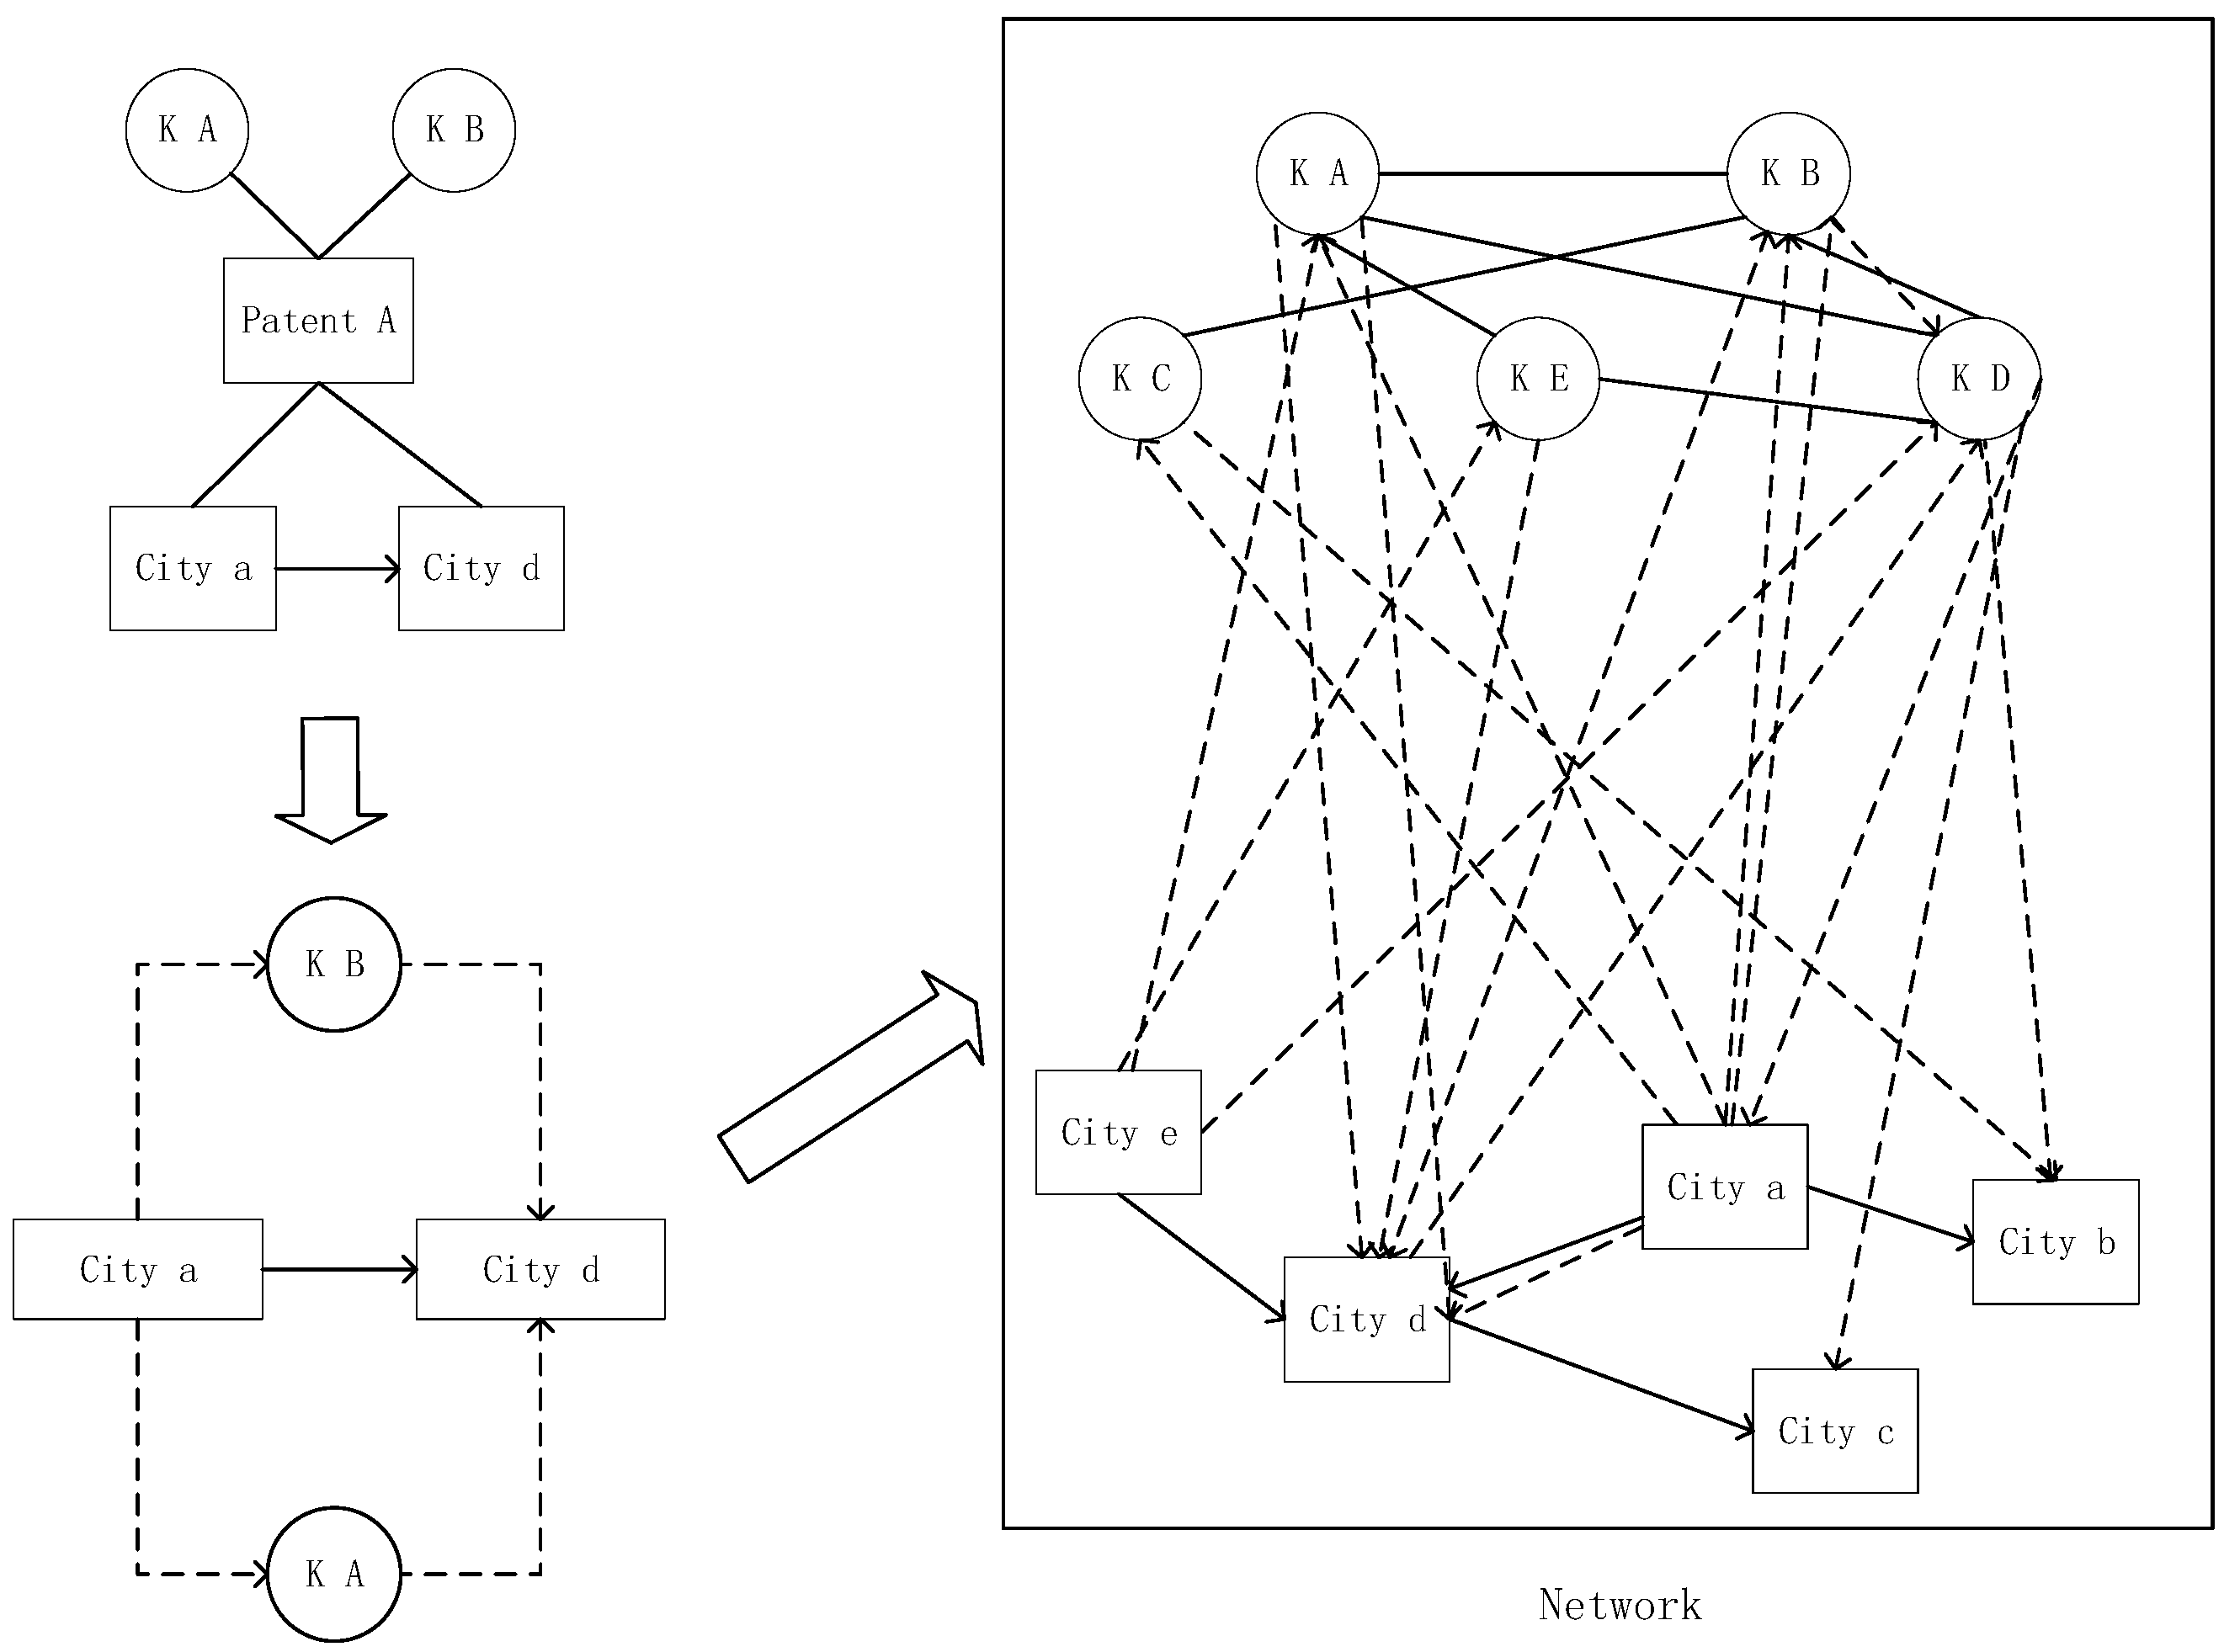
On the basis of the analysis above, we link the innovation diffusion network to the knowledge network. As shown in Figure 4, the upper network represents the knowledge network. Its nodes represent knowledge elements, and its edges reflect historical combinatorial relationships. The lower network represents the innovation diffusion network. Its nodes represent cities, and its edges represent the relationships and directions of patent licensing. The two networks are interconnected through the flow of knowledge. For example, when Patent A from City A is licensed to City D, it involves knowledge elements A and B. Thus, city a connects to knowledge elements A and B, and these elements connect to City D.
Figure 4.
Multi-layer network construction.
2.3. Multi-Layer Network Analysis
We first measure the innovation diffusion network within the multi-layer structure to assess the diffusion of innovations in a given domain. At the same time, we identify the roles of cities in the innovation diffusion network. Next, we conduct an in-depth analysis of the embedding characteristics of cities in the knowledge network. Finally, to verify the relationship between the embedding characteristics of cities in the knowledge network and innovation diffusion, we test it using the Exponential Random Graph Model (ERGM).
2.3.1. Indicators for Network Characterization
Average degree is the average number of edges connected to each node in the network. Typically, a higher average degree indicates denser connections between nodes in the network. In the following equation, denotes the total number of all edges in the network, and denotes the total number of nodes in the network.
Average weighted degree is the average number of weighted edges connected to each node in the network. It reflects the average strength of association or degree of interaction between nodes in the network. In the following equation, denotes the weight of the edges from node to node .
Network diameter is the maximum value of the distance between any two nodes in a network. The network diameter can be used to describe the longest path length for information transfer in the network and the overall propagation efficiency in the network. In the following equation, denotes the shortest path length from node to node .
Network density is the ratio of the number of edges actually present in the network to the upper limit of the number of edges that can be accommodated. Network density can be used to characterize the closeness of connections in a network, i.e., the strength of connections between nodes in the network. The mathematical expression is as follows.
The average path length is the mean shortest distance between any two nodes in a network. It reflects the efficiency of information transfer and the typical distance between nodes. The mathematical expression is shown below, where V denotes the number of unreachable node pairs.
The higher the network connectivity, the greater the accessibility between regions. The formula for calculating the degree of connectivity is as follows.
The higher the network efficiency, the more rapidly and directly information or resources are transferred in the diffusion of innovation. The network efficiency can be expressed as follows, where represents the number of redundant connections in the network, and is the maximum possible number of redundant connections in the network.
The higher the network hierarchy, the more the innovation diffusion network exhibits strong modularity characteristics. The network hierarchy can be expressed as follows, where represents the number of pairs of symmetrically reachable points in the network, and is the maximum number of pairs of reachable points in the network.
The out-degree of a node indicates the number of edges that originate from that node. In directed networks, out-degree reflects the ability of a node to send information or influence to other nodes. The mathematical expression for out-degree can be expressed as follows, where is the weight of an edge from node to node .
The in-degree of a node indicates the number of edges pointing to that node. In a directed network, the in-degree reflects the ability of a node to receive information and obtain resources. The mathematical expression for in-degree is as follows, where is the weight of the edges from node to node .
Betweenness centrality indicates a node’s ability to act as a mediator, i.e., how often the node is located on the shortest path between pairs of other nodes. The higher the betweenness centrality of a node, the more important its role as a “bridge” for the flow of information, resources, or control in the network. The mathematical expression for betweenness centrality is as follows.
The breadth of urban embedding in the knowledge network can be expressed as the number of knowledge elements to which the city is connected, as shown in the following formula. denotes the breadth of the city’s embeddedness in the knowledge network, and indicates whether there is a connection between city and knowledge element (if there is a connection, ; otherwise, ).
The depth of urban embedding in the knowledge network can be defined as the product of the number of urban-connected knowledge elements and their weights, considering not only the number of connections but also the strength of these connections, as illustrated in the following formula. denotes the depth of the city’s embedding in the knowledge network, where represents the weight of the edge connecting city to knowledge element .
The knowledge uniqueness of a city is a concept that reflects the uniqueness of a city’s connected knowledge elements within its knowledge network. It is first necessary to calculate the uniqueness of each knowledge element, i.e., the reciprocal of the number of cities to which a knowledge element is connected. The mean value of the uniqueness of the knowledge possessed by a city is then taken to be the city’s knowledge uniqueness.
where indicates whether the city and the knowledge element are related. If so, then is 1; otherwise, it is 0. Moreover, denotes the amount of knowledge held by city .
The knowledge combination potential of a city refers to the position of the various knowledge elements that the city possesses within the knowledge network. Knowledge elements with high combination potential have been frequently combined with other knowledge elements in the past. The knowledge combination potential of a city is equal to the sum of the degree centrality of all the knowledge elements it licenses out, as expressed in the following mathematical expression, where represents the degree centrality of knowledge element .
2.3.2. Modeling the Formation Mechanisms of the Network
Because the variables are network data with interdependent nodes, conventional econometric models often fail to address endogeneity effectively [39]. This limitation may lead to biased estimates or limited explanatory power. The Exponential Random Graph Model (ERGM) addresses such endogeneity by incorporating node interdependence and the overall network structure [40]. ERGM is a random graph model based on the exponential distribution, designed to represent networks with specified structural and statistical properties [40]. In this study, ERGM is employed to examine how cities’ embeddedness in knowledge networks influences innovation diffusion. The generalized form of the ERGM is expressed as follows.
where is a normalizing constant for the distribution. reflects a range of variables that may influence how relationships in the network are formed, including factors such as the breadth and depth of the city’s embedded knowledge network and the uniqueness of the city’s knowledge elements. In network formation, besides the influence of external factors on the network structure, endogenous structures also affect the formation and evolution of the network. Therefore, when studying urban innovation diffusion networks, endogenous structural variables are incorporated to better understand the mechanisms governing innovation diffusion among cities. Table 1 presents the variables, network elements, and descriptive network parameters used in the study.
Table 1.
Variables, network elements, and descriptive parameters.
3. Results and Discussion
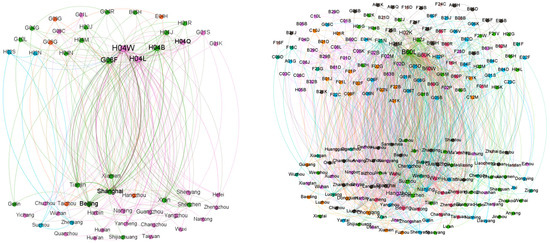
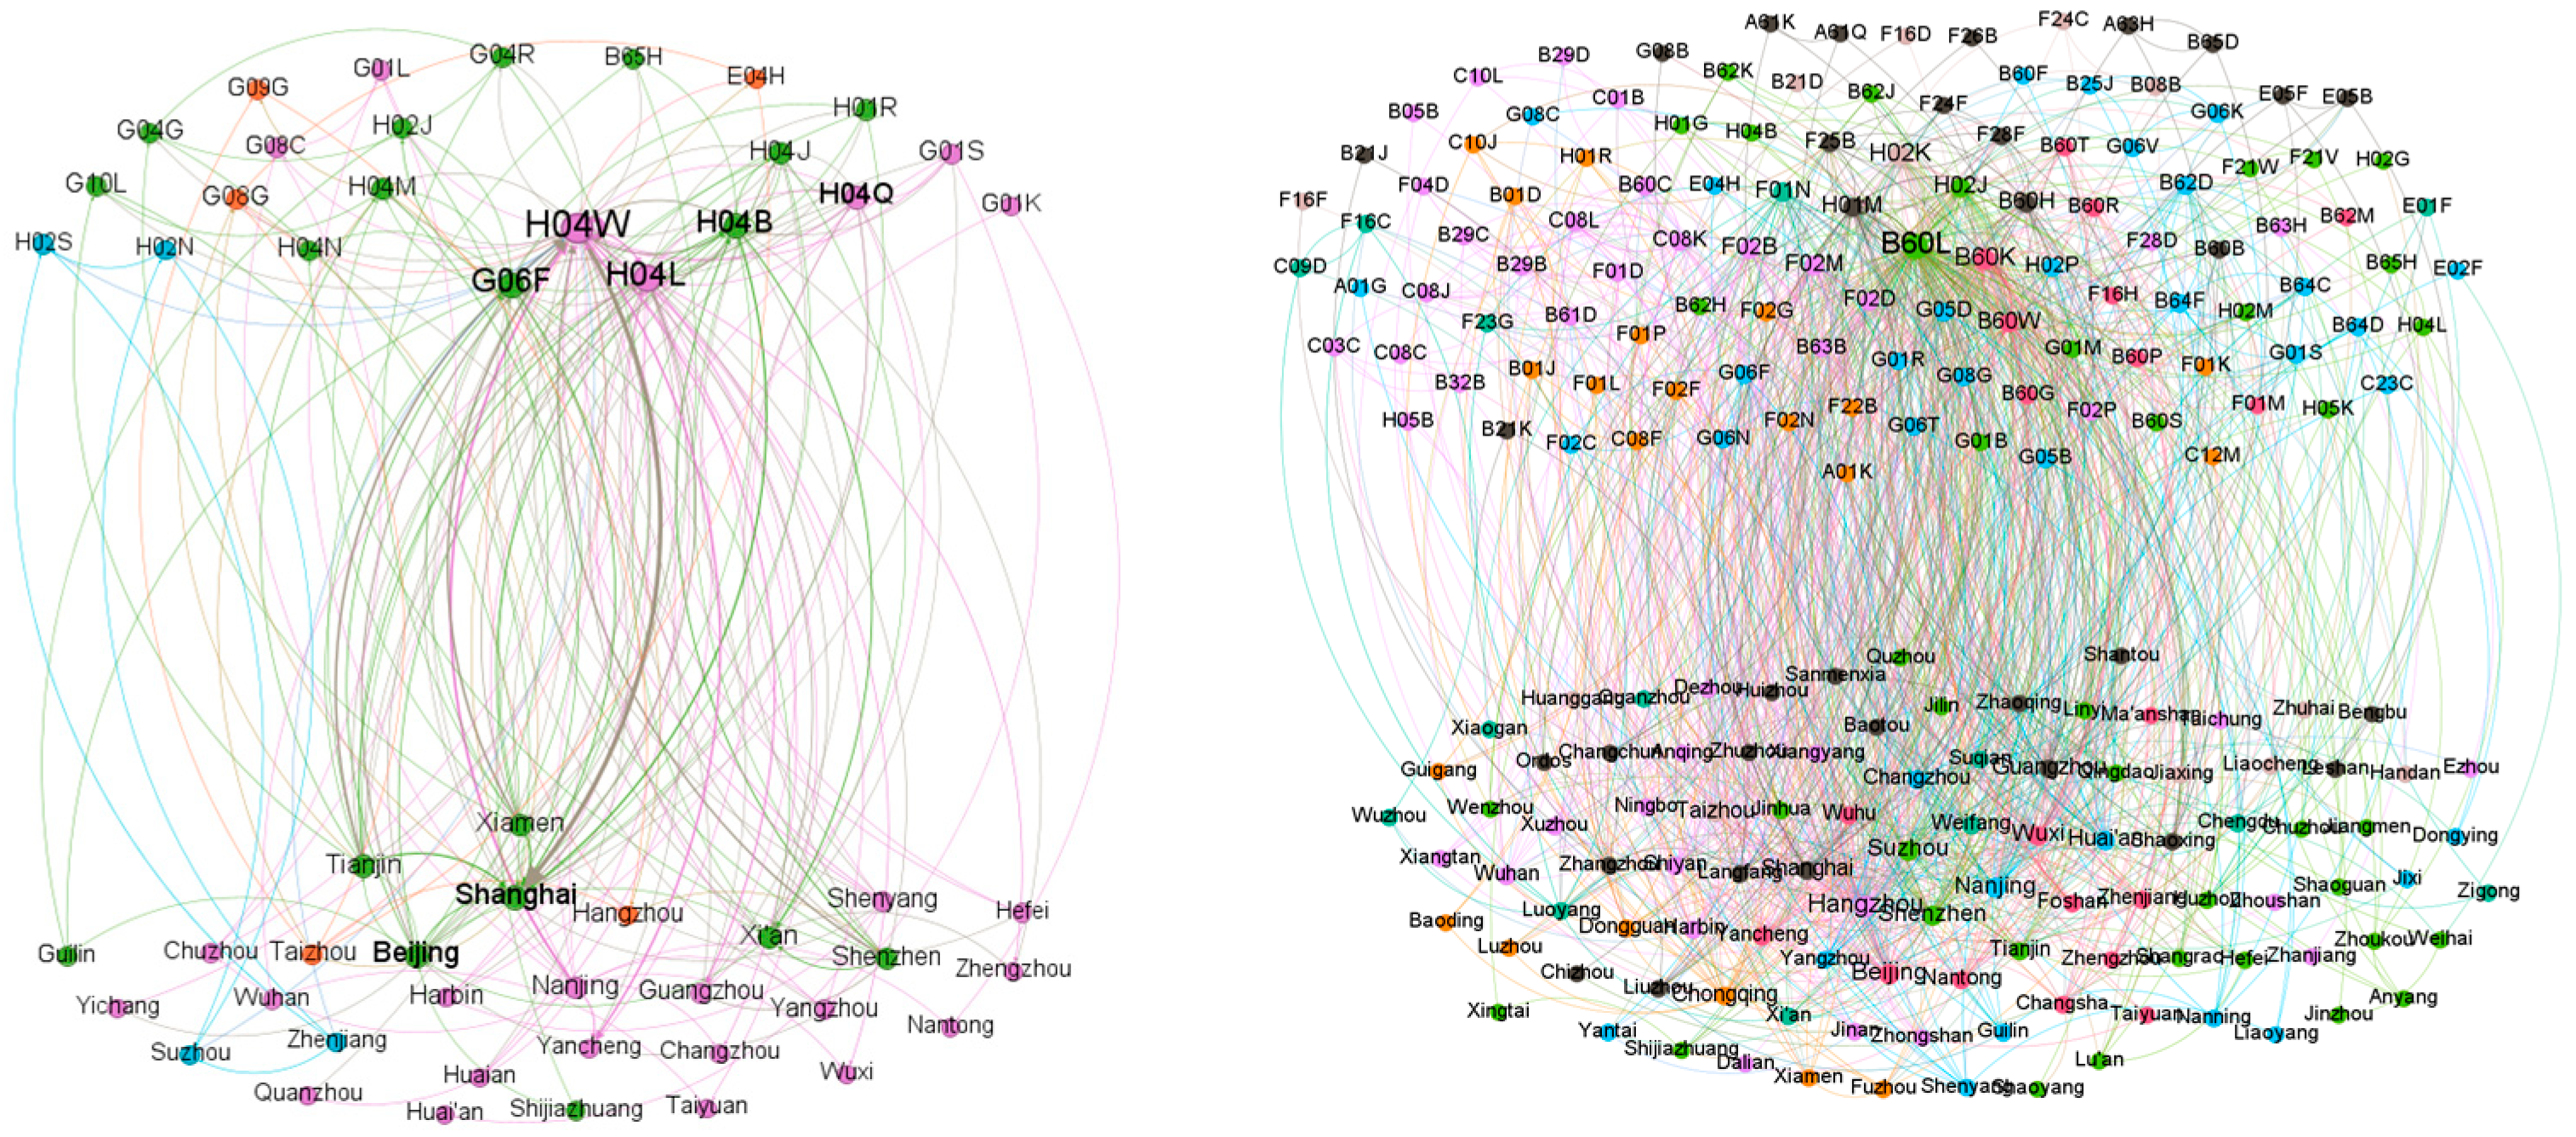
We constructed multi-layer networks based on the methodology presented in the previous sections using the collected patent data, and Figure 5 shows the green ICT multi-layer network and the green transportation multi-layer network.
Figure 5.
Green ICT multi-layer network and green transportation multi-layer network.
3.1. Results of Multi-Layer Network Analysis
3.1.1. Empirical Results on Network Characteristics
Table 2 shows that the green ICT innovation diffusion network has an average degree of 1.034, indicating a relatively low number of connections per node, with each node connected to approximately one other node. The network’s average weighted degree is 8.379, suggesting that the strength of connections between nodes is relatively high. The network diameter is 8, meaning that the shortest path between the two most distant nodes spans eight steps. The network density is 0.037, indicating that node connectivity within the network is relatively sparse.
Table 2.
Overall network characteristics of innovation diffusion networks.
The network’s average clustering coefficient is 0.022, indicating that nodes rarely form closed triangular structures, reflecting low connectivity among neighboring nodes. The average path length is 3.303, suggesting that nodes are, on average, 3.303 steps apart. The network connectivity is 0.7438, indicating that most nodes are connected, resulting in a relatively cohesive network. The network efficiency is 0.9928, reflecting a high efficiency of information transmission. The network hierarchy is 0.8306, indicating a certain hierarchical structure, where some nodes occupy central positions and others are located peripherally. Overall, the green ICT innovation diffusion network exhibits moderate connectivity and hierarchy, but node-to-node connectivity is sparse and clustering is low. The green transportation innovation diffusion network has an average degree of 2.178, higher than that of the green ICT network, indicating more connections per node on average. The network’s average weighted degree is 4.762, lower than that of the green ICT network, suggesting weaker connection weights. The network diameter is 10, exceeding that of the green ICT network, indicating that the longest shortest path spans 10 steps.
The network density is 0.022, lower than that of the green ICT network, indicating relatively sparse node connections. The average clustering coefficient is 0.054, higher than that of the green ICT network, indicating more closed triangular structures among the nodes. The average path length is 3.623, exceeding that of the green ICT network, suggesting that the nodes are, on average, 3.623 steps apart. The network connectivity is 0.8858, higher than that of the green ICT network, indicating that most nodes are connected and the network is highly cohesive. The network efficiency is 0.9751, slightly lower than that of the green ICT network, indicating marginally reduced information propagation efficiency. The network hierarchy is 0.8457, higher than that of the green ICT network, indicating a pronounced hierarchical structure, with some nodes occupying central positions and others in peripheral positions.
Overall, the green transportation innovation diffusion network is denser and more hierarchical, while the green ICT innovation diffusion network is more advantageous in terms of information transfer efficiency and connection weight.
Table 3 shows that Beijing and Shanghai have much higher out-degrees than in-degrees in green ICT, whereas Yancheng and Nanjing have much higher in-degrees than out-degrees. This reflects the distinct roles of these cities in the network. Beijing and Shanghai function as innovation sources, whereas Yancheng and Nanjing act as receivers. Notably, Shanghai exhibits relatively high betweenness centrality, highlighting its key role as a mediator in the network.
Table 3.
Characteristics of green ICT innovation diffusion network cities.
Table 4 shows that in green transportation, Beijing, Hangzhou, Suzhou, Wuxi, and Shanghai have higher out-degrees, making them the initiators or diffusers of innovations. Nanjing, Wuhan, Wuxi, Suzhou, and Hangzhou, having higher in-degrees, are likely recipients or applicators of innovations. Hangzhou, Nanjing, Suzhou, and Wuxi exhibit higher betweenness centrality, indicating that they serve as key intermediary hubs by connecting multiple cities in the network.
Table 4.
Characteristics of green transportation innovation diffusion network cities.
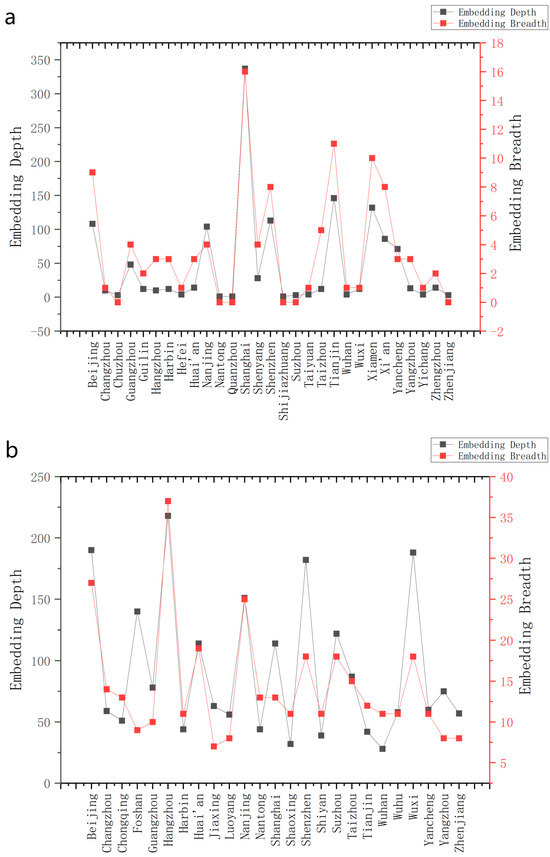
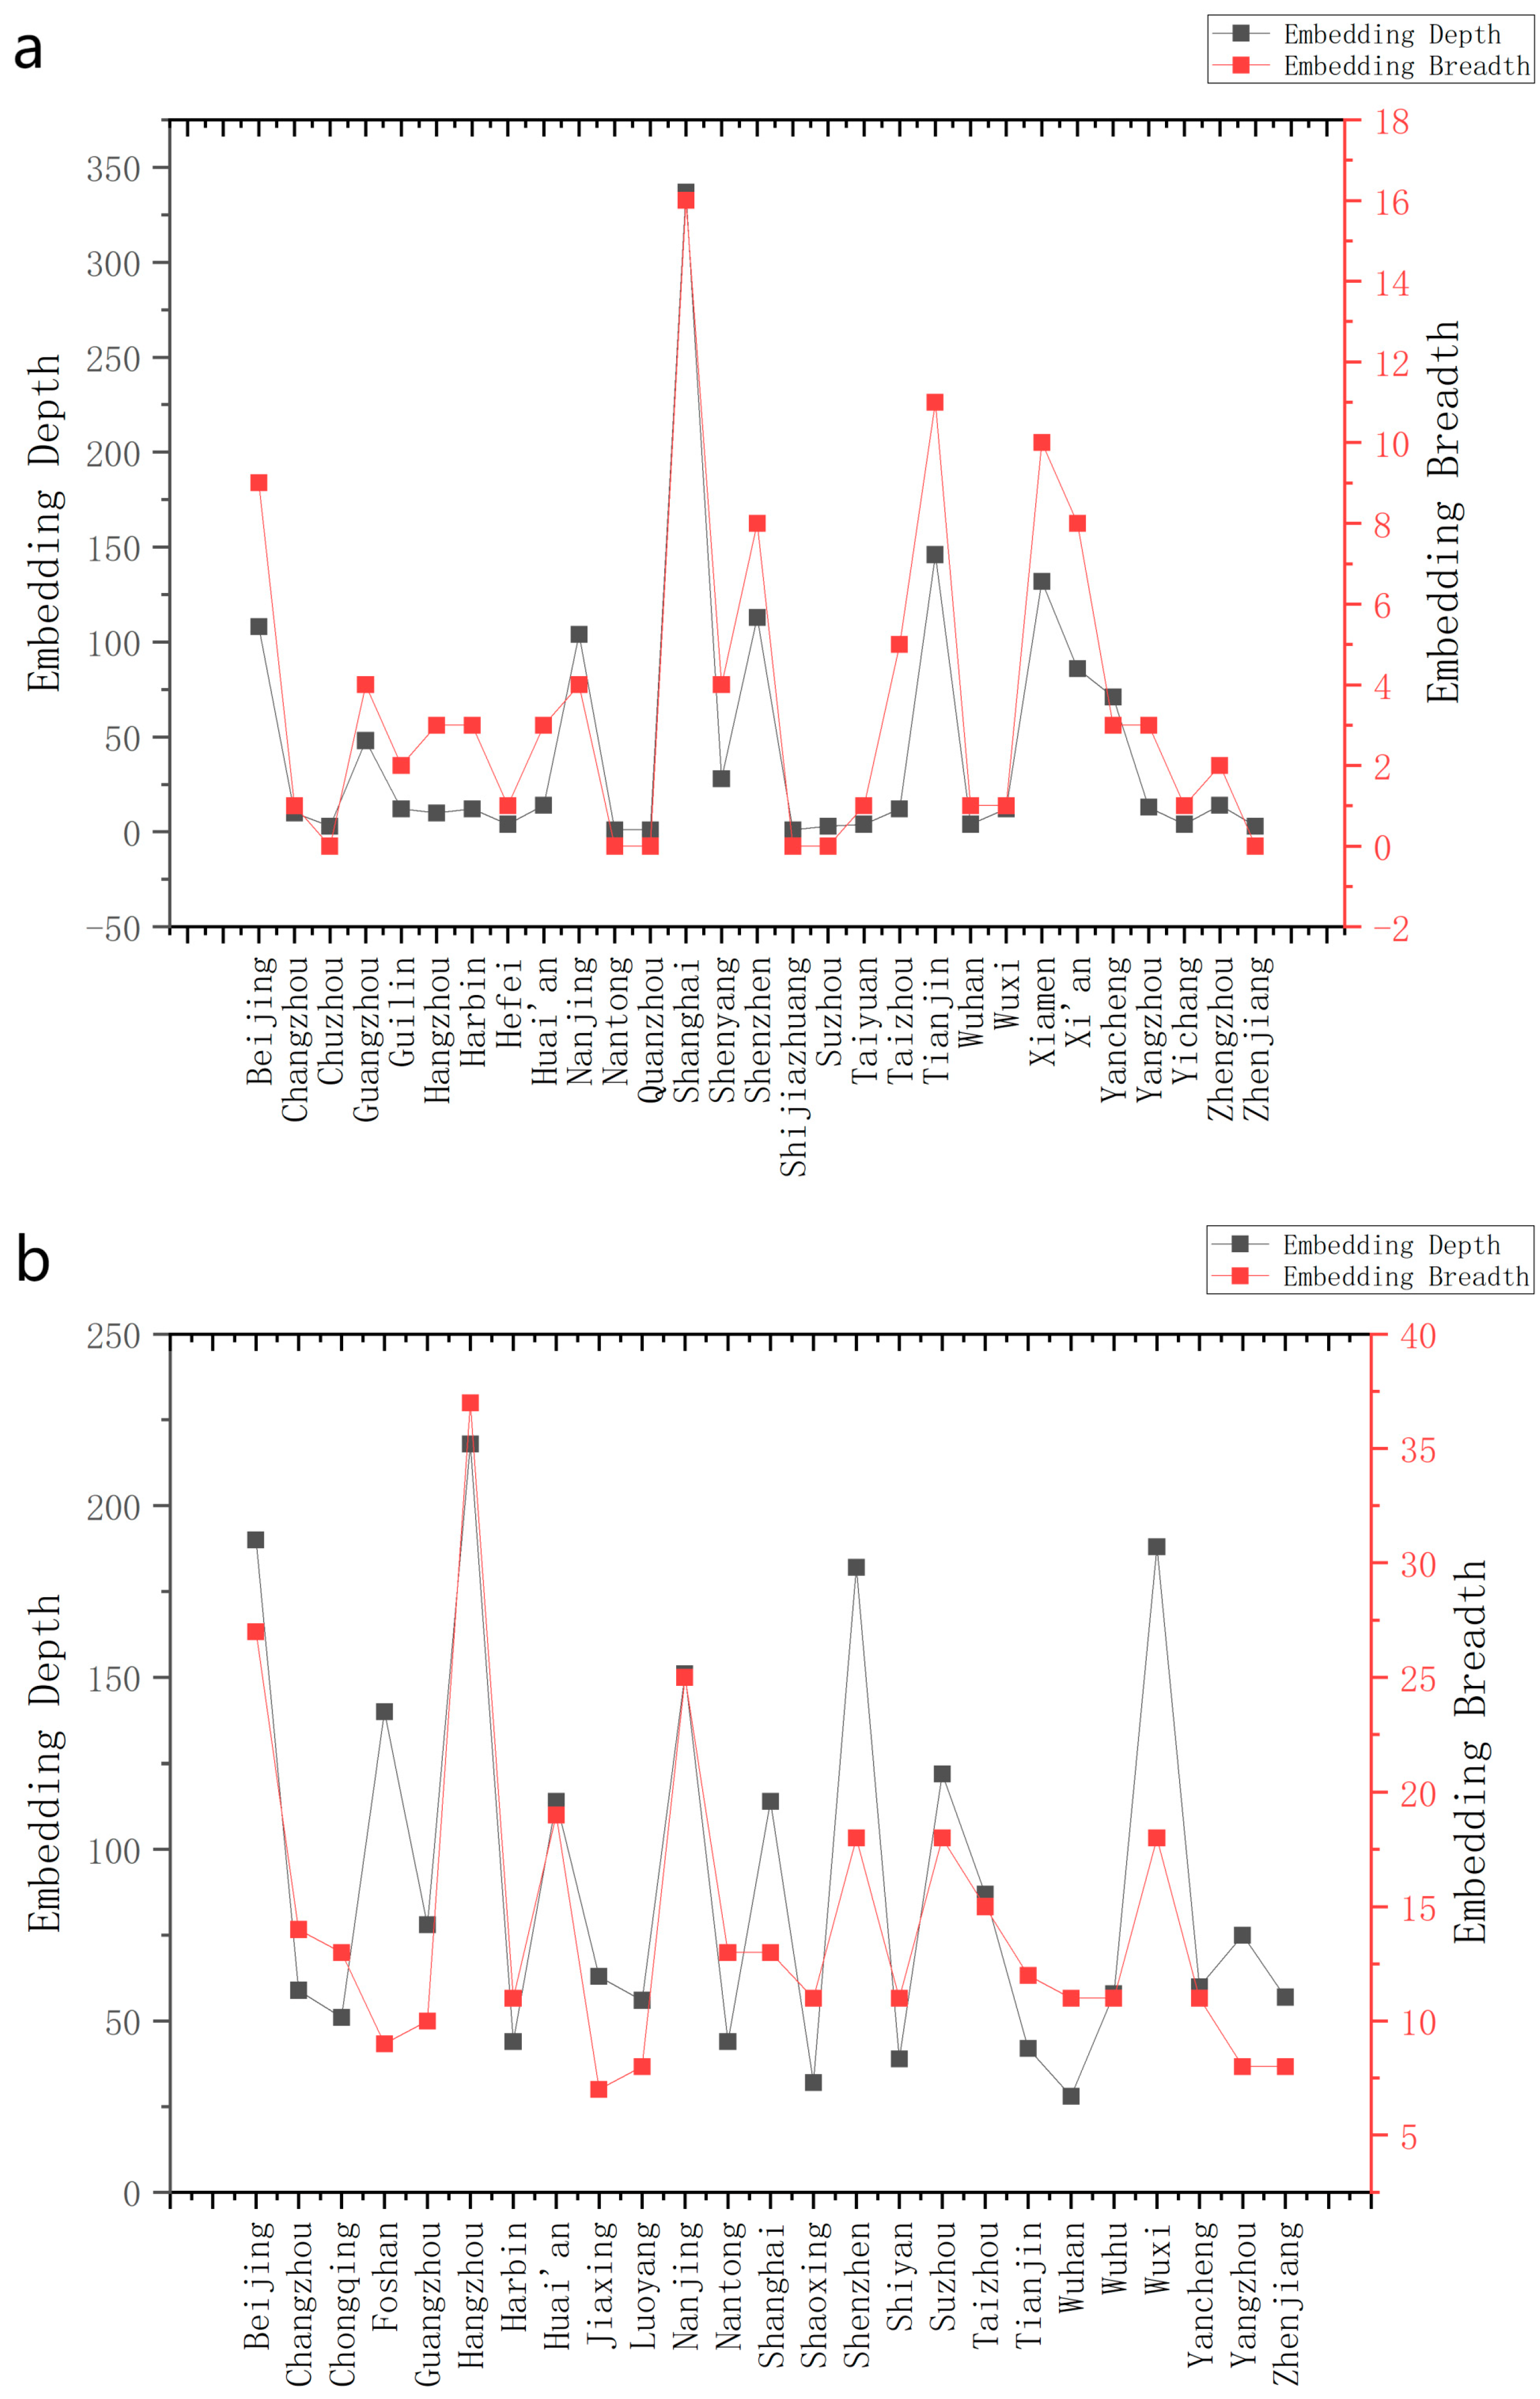
Figure 6 illustrates the breadth and depth of city-embedded knowledge networks, where Figure 6a represents the green ICT sector and Figure 6b represents the green transportation sector. In Figure 6a, within the green ICT sector, Beijing, Shanghai, Shenzhen, Xi’an, and Tianjin rank highly for breadth of embedding. This indicates that these cities connect more knowledge elements within the network and exhibit higher activity in knowledge output and acquisition. Shanghai ranks highest for embedding depth, followed by Beijing, Shenzhen, and Tianjin. This indicates that although Beijing leads in the number of connected knowledge elements, Shanghai’s connections are comparatively deeper. This reflects Shanghai’s advanced expertise in the green ICT domain.
Figure 6.
Breadth and depth of city-embedded knowledge networks: (a) green ICT sector; (b) green transportation sector.
From Figure 6b, in the field of green transportation, Beijing, Shanghai, Shenzhen, Hangzhou, and Wuxi rank highly in terms of embedded depth, indicating that these cities have deeper knowledge accumulation. Shanghai, Beijing, Shenzhen, Hangzhou, and Suzhou rank highly in terms of embedded breadth, indicating that the knowledge in these cities is more extensive.
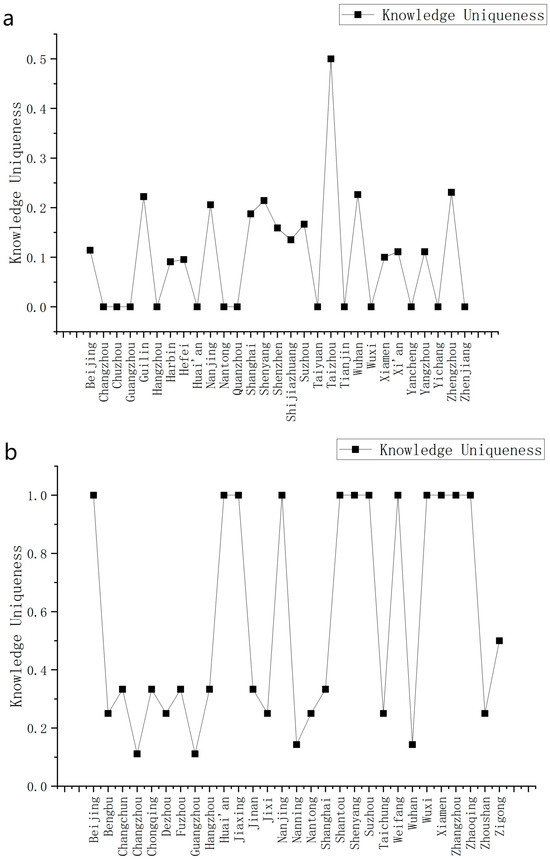
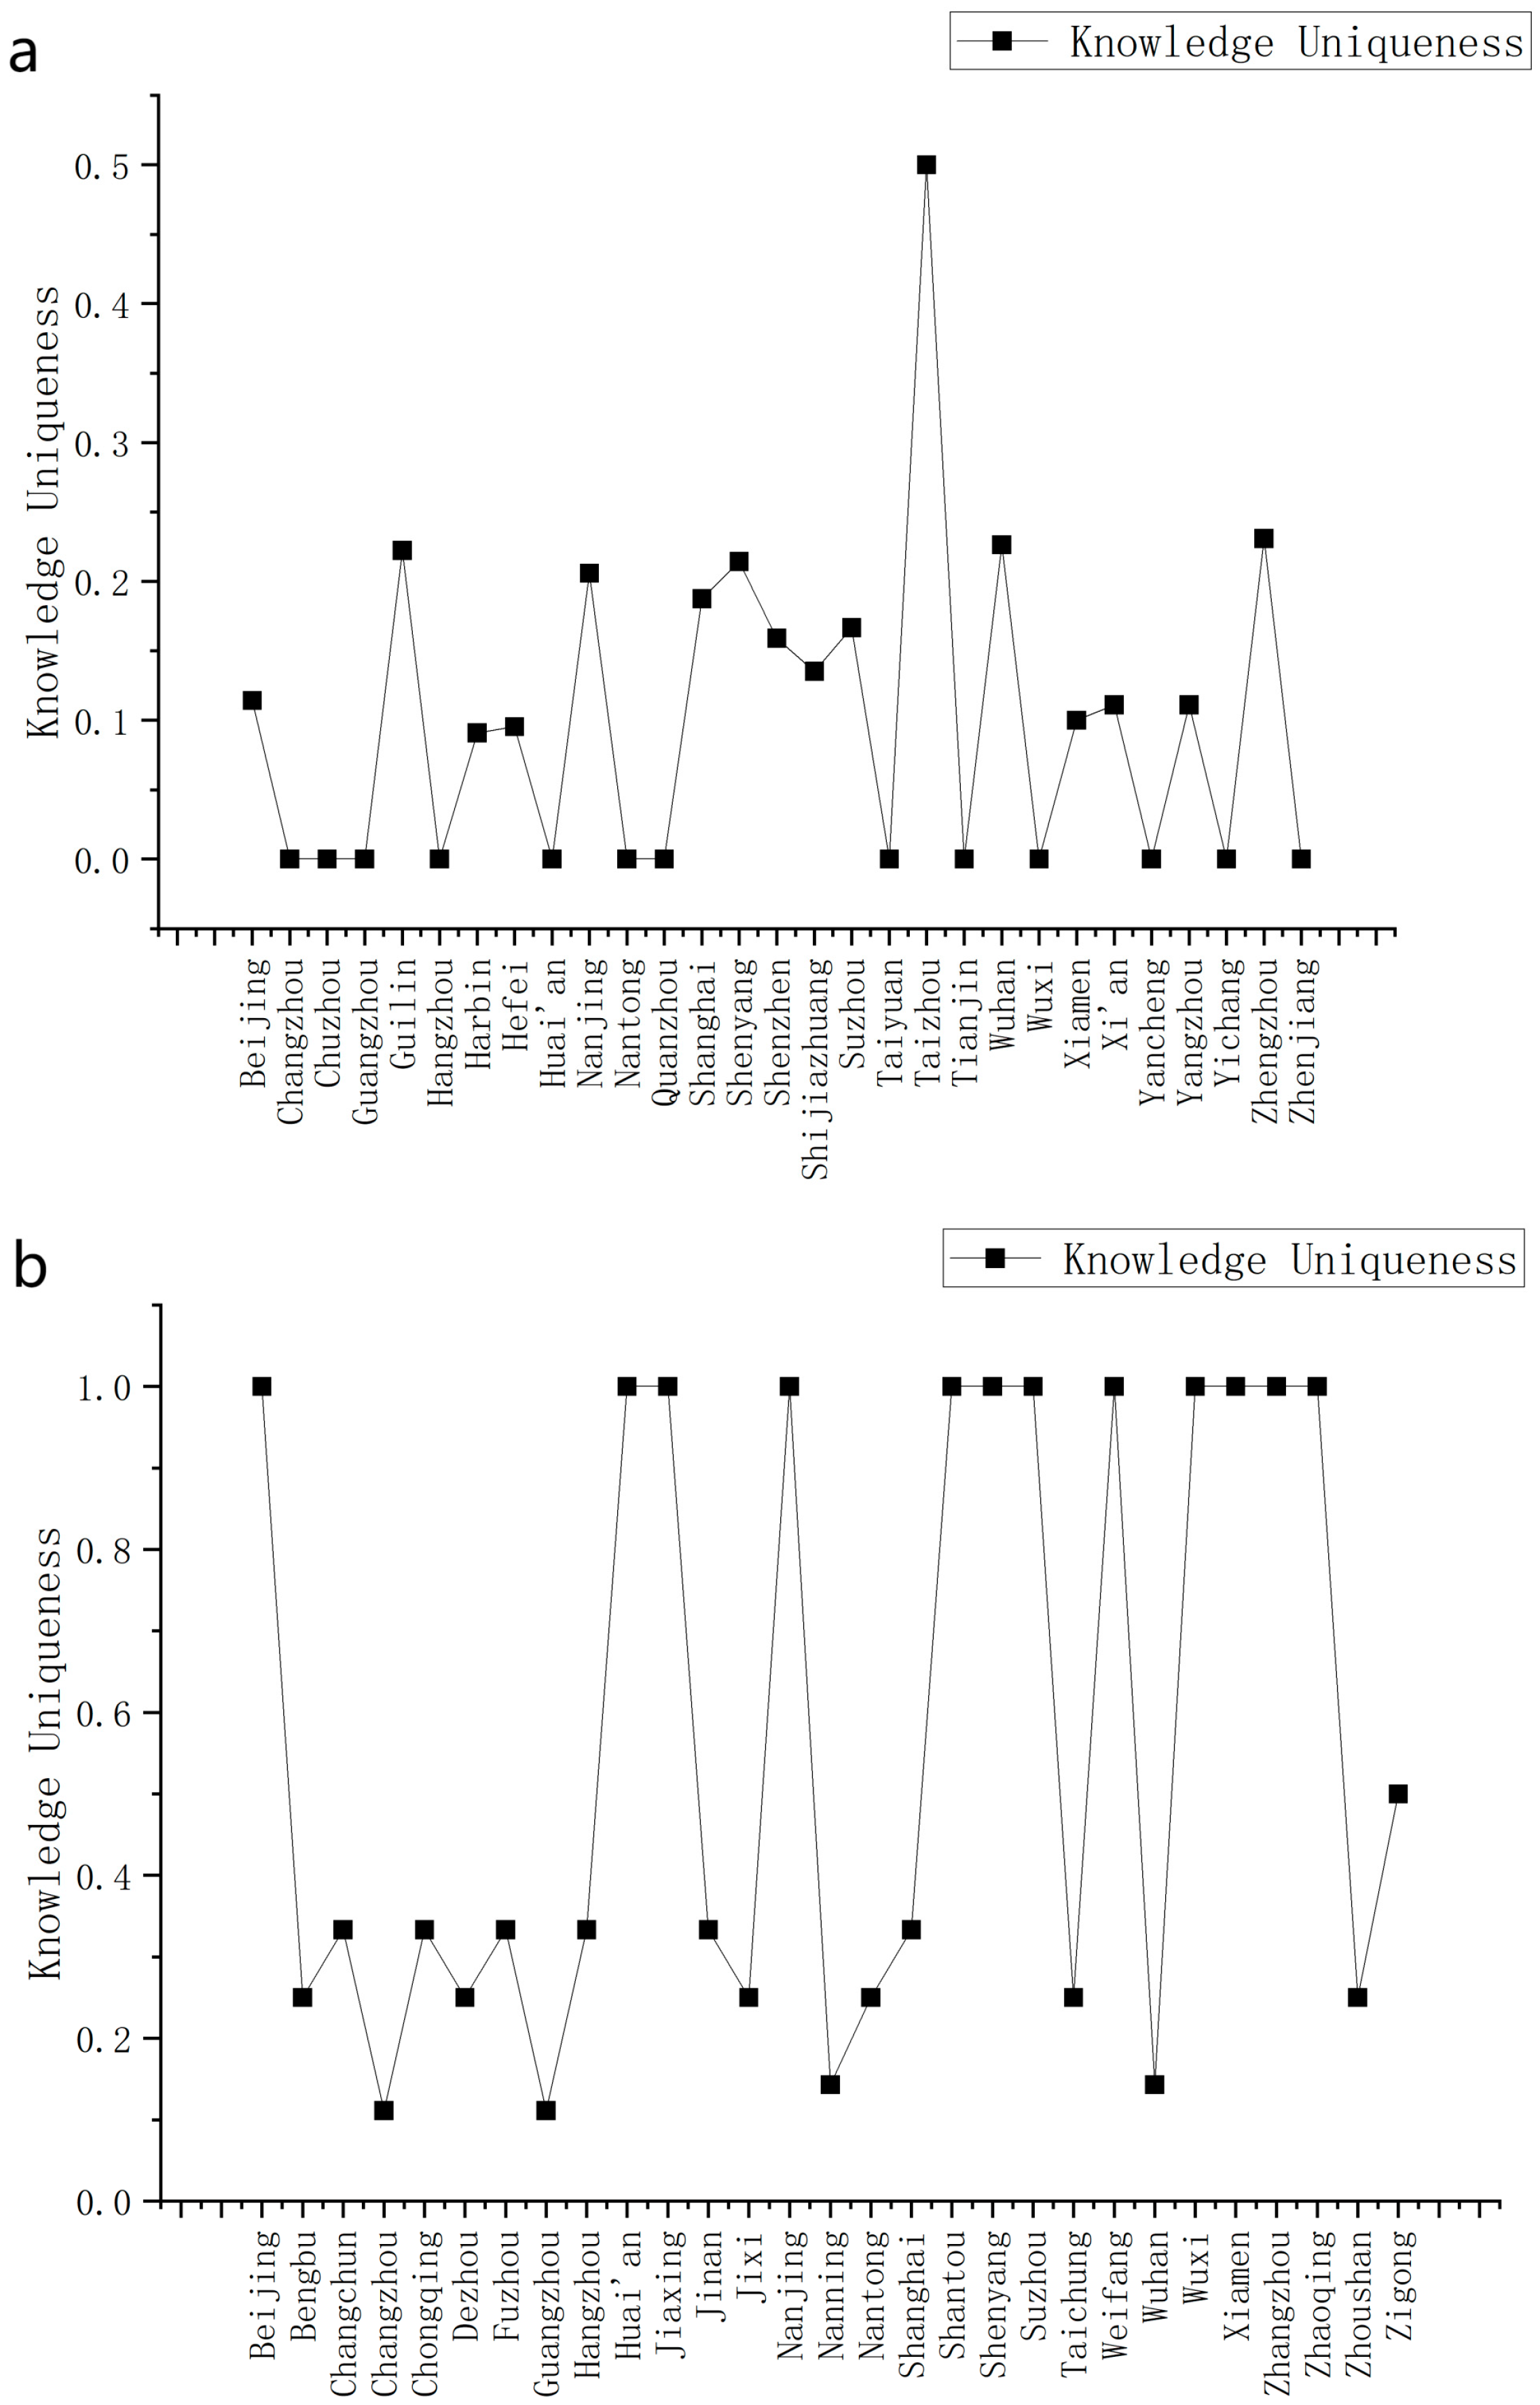
Figure 7 illustrates urban knowledge uniqueness, where Figure 7a depicts the green ICT sector and Figure 7b depicts the green transportation sector. In Figure 7, within the green ICT sector, Taiyuan exhibits the highest knowledge uniqueness, reaching 0.5, indicating that it possesses the most distinctive knowledge and technology in this field. Cities including Guilin, Nanjing, Shenyang, Wuhan, and Zhengzhou also show relatively high knowledge uniqueness, suggesting they possess certain distinctive advantages in the green ICT sector. In the green transportation sector, Beijing, Changchun, Chongqing, Fuzhou, Hangzhou, Nanjing, Shenyang, Suzhou, Taiyuan, Taizhou, Wuhan, Wuxi, Xiamen, Zhengzhou, Zhongshan, Zhoukou, Zhuhai, and Ziguang all exhibit high knowledge uniqueness. The data indicate that not all economically developed cities possess high knowledge uniqueness. This suggests that economically developed cities tend to pursue balanced development across multiple fields, rather than concentrating solely on knowledge and technology in specific areas.
Figure 7.
Urban knowledge uniqueness: (a) green ICT sector; (b) green transportation sector.
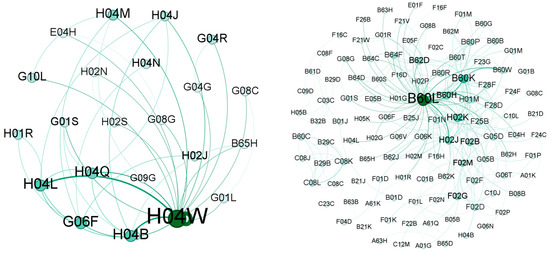
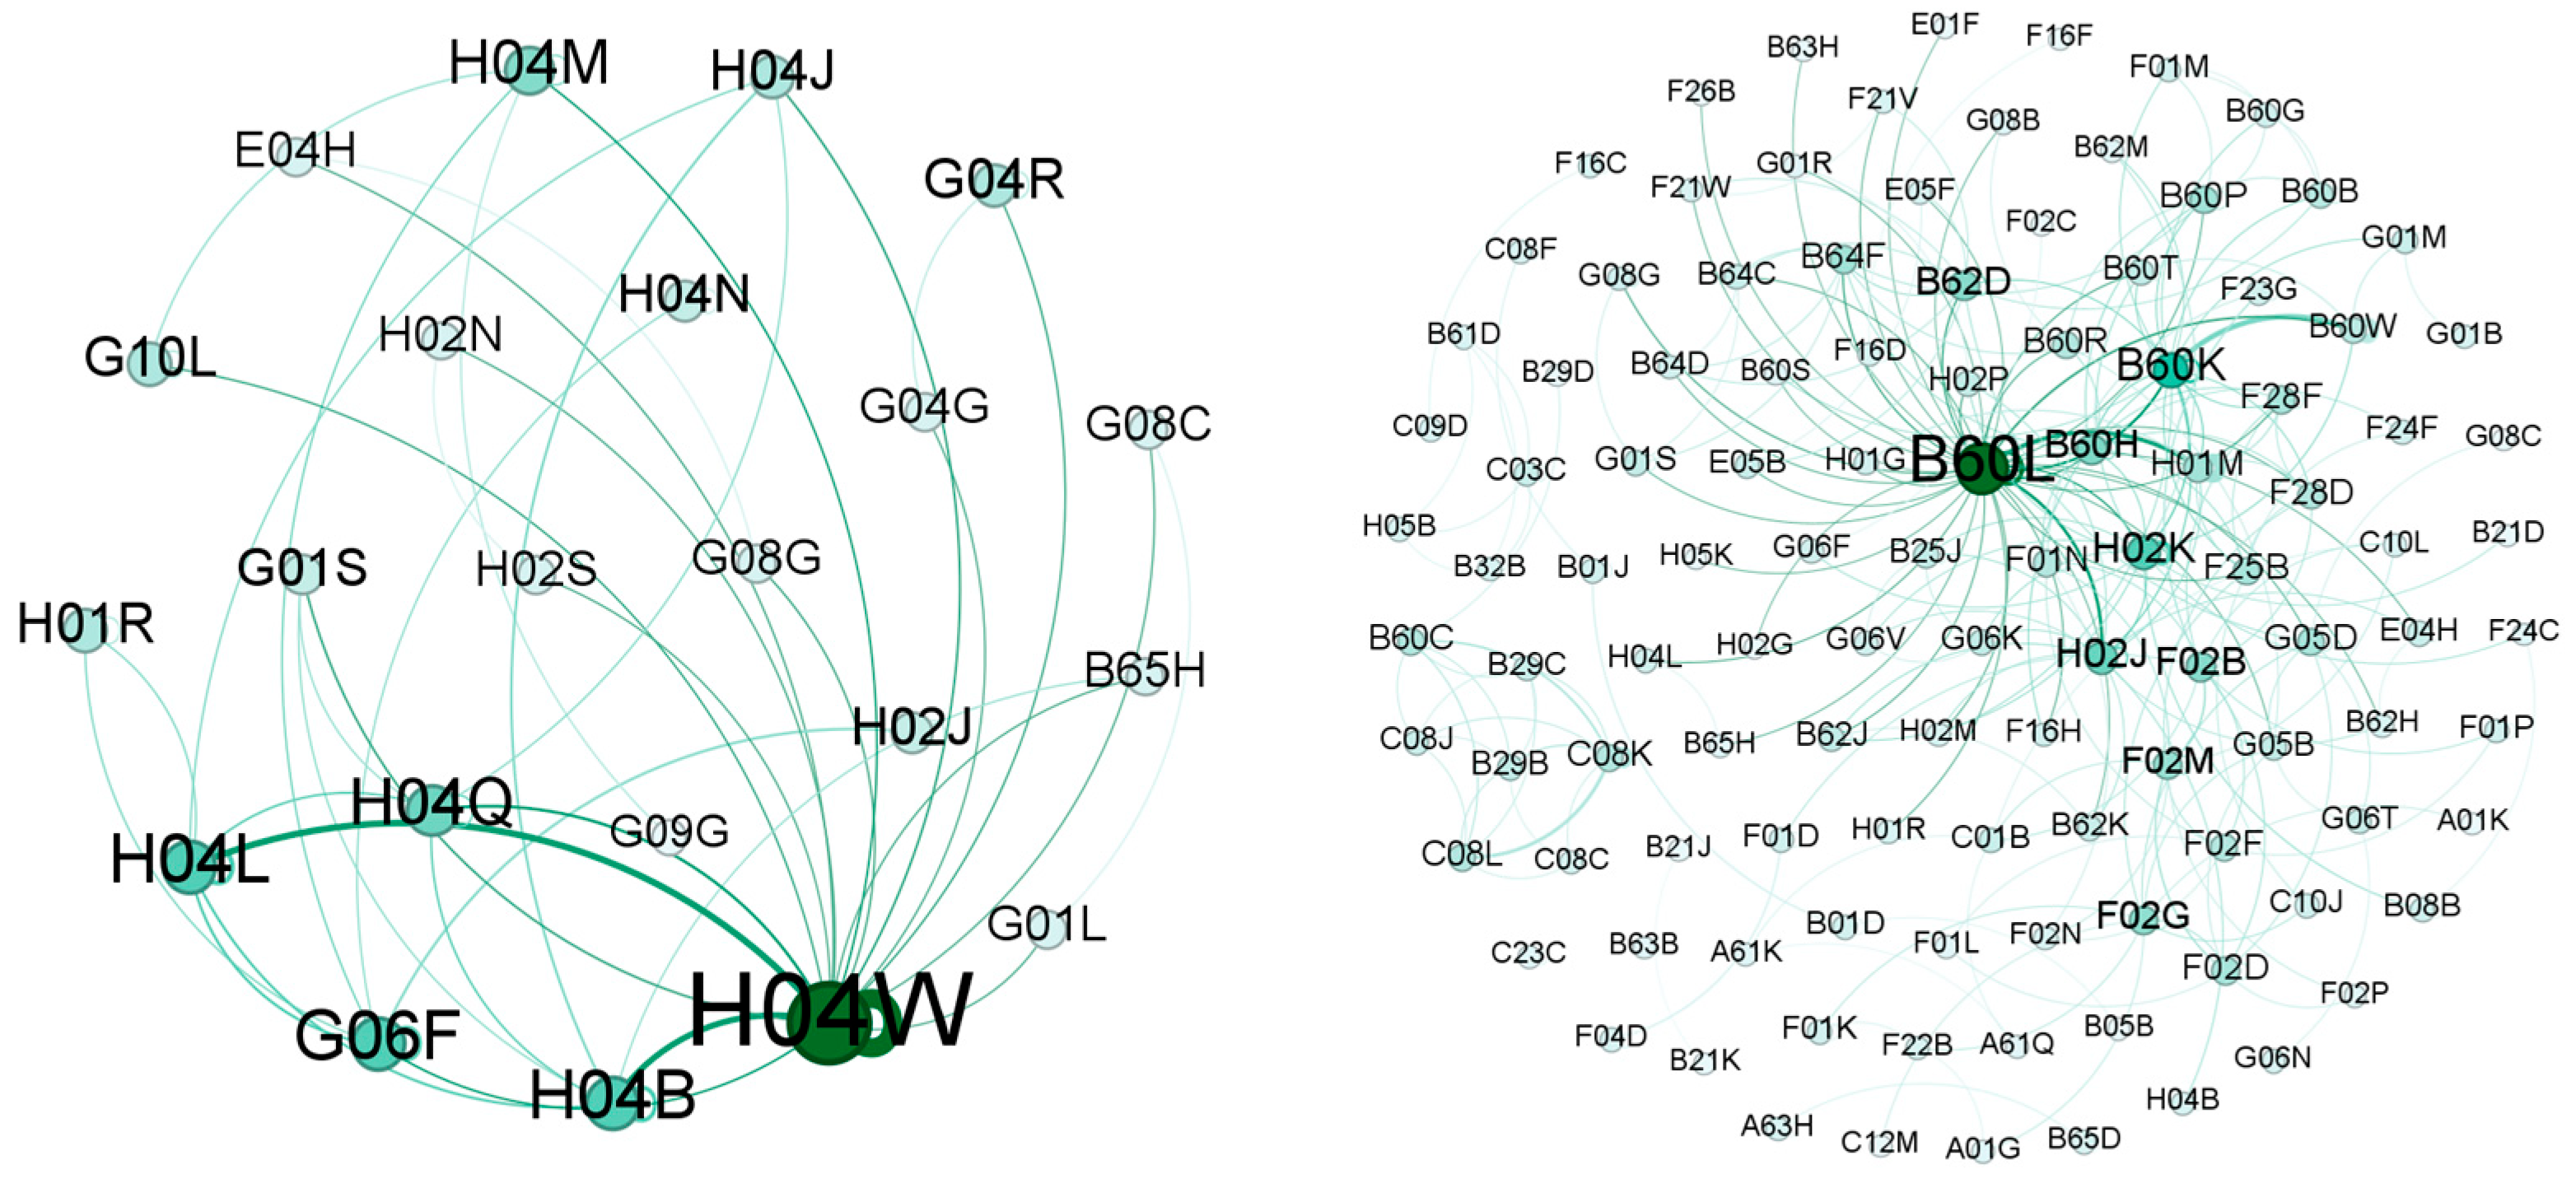
Figure 8 shows the green ICT knowledge network and the green transportation knowledge network. In the figure, nodes represent knowledge elements, which are characterized by International Patent Classification (IPC) codes. Due to the differences in the technological content involved in green ICT and green transportation, there are significant differences in the number and types of knowledge elements, resulting in notable differences in the scale and structural form of their knowledge networks. The knowledge elements in the green transportation field primarily focus on transportation-related technologies, while green ICT covers a broader range of information and communication technologies.
Figure 8.
Green ICT knowledge network and green transportation knowledge network.
In invention activities, inventors typically examine existing knowledge from a functional perspective, viewing it as a reusable and universal tool, which facilitates innovative breakthroughs in cross-disciplinary knowledge combinations [41]. This mindset leads to the recombination of knowledge elements in new ways, forming innovative solutions with practical applications, consequently shaping the knowledge network.
By calculating the degree centrality of each knowledge element in the knowledge combination network (see Figure 8), we can identify key knowledge elements that are frequently combined and occupy central positions in the network in both fields. In the green ICT field, the knowledge elements with higher degree centrality include H04W (208), H04L (124), and H04B (107). Among them, H04W involves the management and functional optimization of wireless communication networks, such as energy-saving communication protocols and network switching mechanisms, which is one of the core technologies for improving energy efficiency in green ICT; H04L covers data transmission protocols and network security, supporting efficient and secure system operations in green communication; and H04B focuses on signal transmission mechanisms, including modulation, transmission, and reception, which play a fundamental role in enhancing the energy efficiency of wireless systems. These knowledge elements are widely combined in multiple patents in the green ICT field, indicating their crucial supporting position and potential for cross-disciplinary integration in the development of green communication technologies.
In the green transportation field, the knowledge elements with higher degree centrality mainly include B60L (525), B60K (276), and B60W (233). B60L involves the electric drive systems and energy management mechanisms for electric or hybrid vehicles, serving as the technological foundation for achieving decarbonization in green transportation; B60K pertains to the layout and control systems of powertrains, reflecting the focus on the efficient configuration of power systems in green transportation; and B60W is associated with collaborative control systems for vehicles, such as autonomous driving and energy-saving driving assistance, highlighting the critical role of intelligent control technologies in green transportation innovation. These knowledge elements are repeatedly combined in several inventions, indicating their high degree of integration and technological influence in the green transportation field.
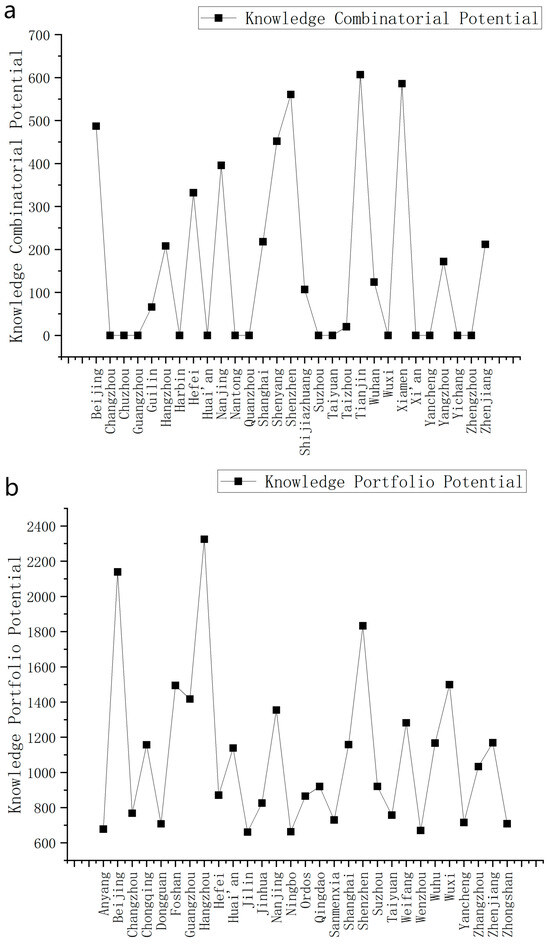
Further calculations were conducted to determine the sum of degree centrality for each city’s knowledge elements, assessing the potential of city–knowledge combinations. Figure 9 illustrates the knowledge combination potential of cities, where Figure 9a represents the green ICT sector and Figure 9b represents the green transportation sector. In the field of green ICT, cities such as Tianjin, Shenzhen, and Xiamen possess widely applied and highly integrated knowledge elements. In the field of green transportation, cities such as Beijing, Shenzhen, Hangzhou, Guangzhou, Suzhou, and Nanjing possess widely applied and highly integrated knowledge elements. This indicates the strong capability of these cities in integrating green technologies.
Figure 9.
Knowledge combination potential of cities: (a) green ICT sector; (b) green transportation sector.
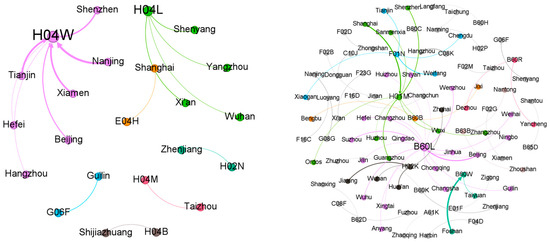
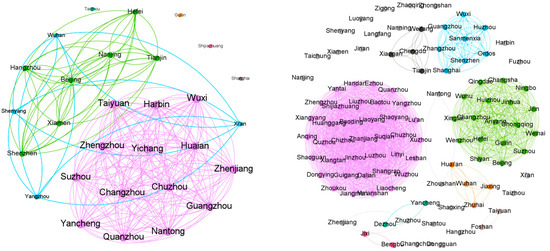
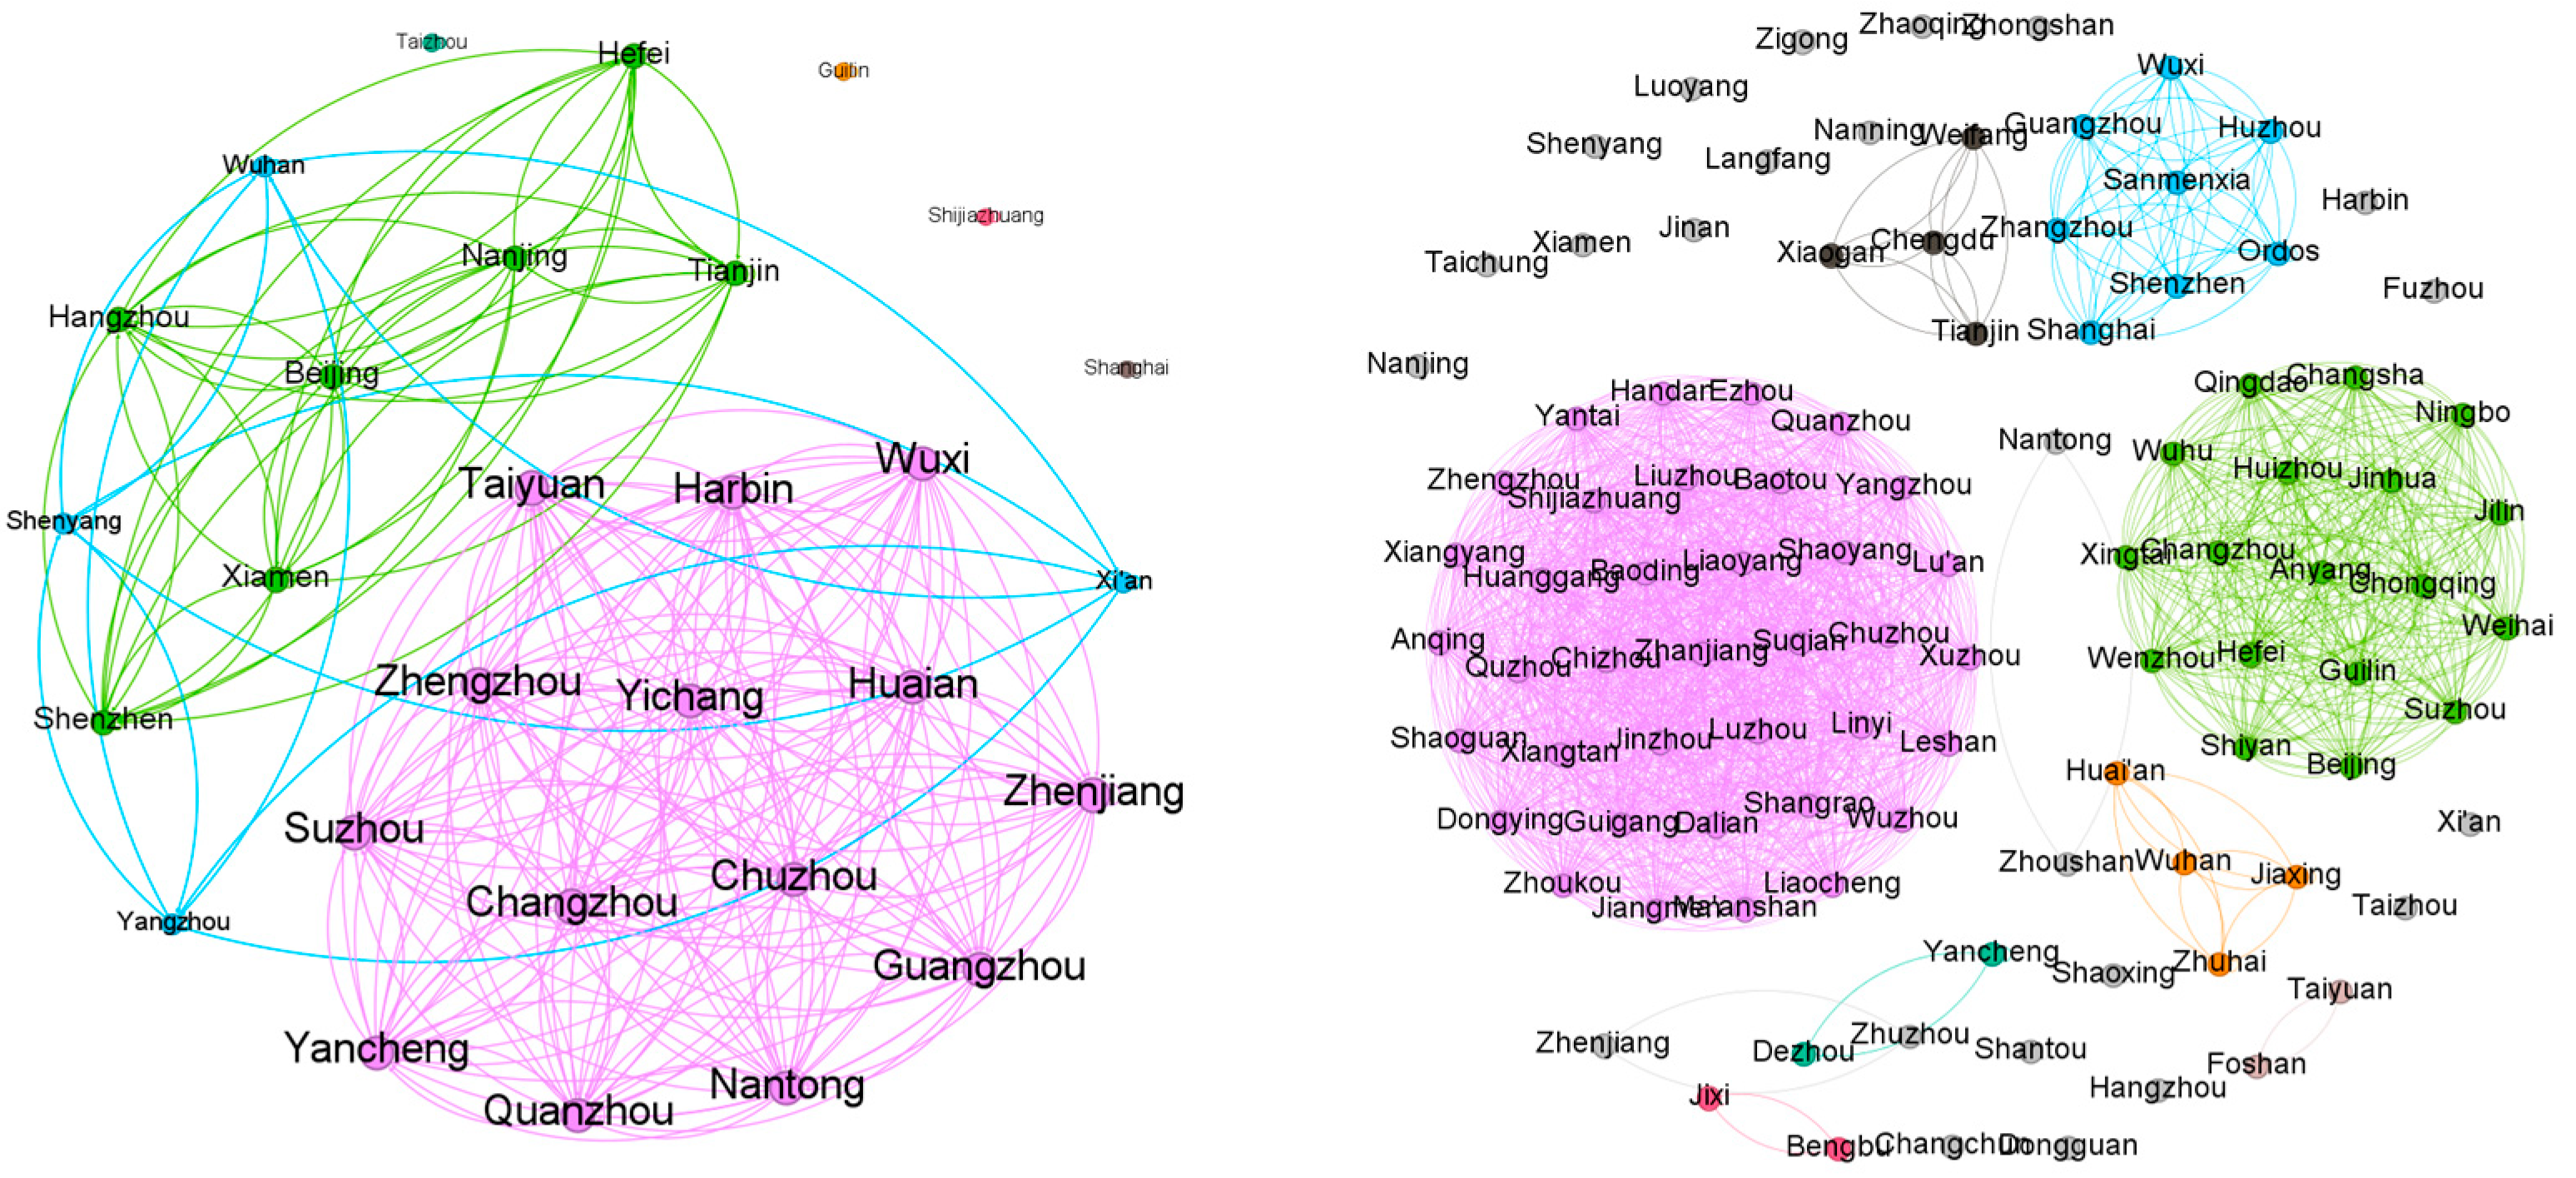
We counted the frequency of IPCs in patents licensed by each city and used the most frequent IPC to indicate the most advantageous knowledge element of the city. Figure 10 provides a visual representation of the most advantageous knowledge elements of different cities.
Figure 10.
Urban advantage knowledge in green ICT and green transportation.
In the field of green ICT, cities such as Beijing, Hangzhou, Hefei, Nanjing, Shenzhen, Tianjin, and Xiamen exhibit an advantage in H04W. This indicates that these cities possess strong research and development capabilities in communication technology and related industrial bases. Wuhan, Xi’an, and Yangzhou, among others, demonstrate advantages in H04L. This signifies that these cities have strong research capabilities in data communication, cybersecurity, and encryption technology. Taizhou exhibits advantages in H04M, reflecting the city’s specific expertise in communication equipment and technologies. Shijiazhuang possesses an advantage in H04B, reflecting the city’s technological accumulation in high-frequency communication, cable transmission, and other transmission technologies. Guilin possesses an advantage in G06F, indicating the city’s strong research and development capabilities in computer science and information technology. Jiangsu demonstrates an advantage in H02N, implying that the city has specific expertise in energy generation technology, especially static electricity and non-traditional energy generation technologies.
In the field of green transportation, cities such as Beijing, Changsha, Hefei, Ningbo, and Qingdao demonstrate advantages in the power transmission systems of electric vehicles and their components (B60L). In terms of battery technology (H01M), cities such as Guangzhou, Huzhou, Erdos, Sanmenxia, Shanghai, Shenzhen, Wuxi, and Zhoushan demonstrate significant technological accumulation. Moreover, vehicle control systems (B60W) are strengths in cities such as Fujian and Taiyuan. In terms of vehicle tire technology (B60B), cities such as Bengbu and Jixian exhibit specific professional advantages. Notably, Beijing, Changsha, Dongguan, Foshan, Guangzhou, Hangzhou, Hefei, and Shenzhen demonstrate strengths in battery technology (H01M).
Figure 11 illustrates the knowledge distance between cities in the fields of green ICT and green transportation. When evaluating the knowledge distance between cities, we employ a measurement standard based on the similarity of advantageous knowledge elements. Specifically, we consider two cities to be similar knowledge-wise when they both possess identical advantageous knowledge elements. Through this approach, we observe that, as illustrated in Figure 11, there are some cities that form knowledge communities due to their shared advantageous knowledge elements across all researched fields. For instance, in the field of green ICT, cities such as Beijing, Hangzhou, Hefei, Nanjing, Shenzhen, Tianjin, and Xiamen, due to their possession of similar or identical advantageous knowledge elements in this field, form a distinct knowledge community.
Figure 11.
Cities’ knowledge distance in green ICT and green transportation.
3.1.2. Empirical Analysis of Network Formation Mechanisms
The ERGM model was implemented in R and estimated in this study using Maximum Pseudo-Likelihood Estimation (MPLE). Table 5 presents the coefficients, standard errors, and significance levels of the model estimation.
Table 5.
ERGM results.
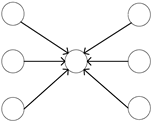
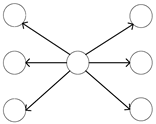
In the green ICT field, the Edge coefficient is negative and significant (α = −13.6488, p < 0.001), indicating that the diffusion network of green ICT innovation is particularly loose. The Gwideg coefficient is significantly positive (α = 8.0569, p < 0.001), suggesting that the network tends to spontaneously form in-star structures. This result supports the view that central cities can attract and integrate innovations from other cities. Similarly, the Gwodeg coefficient is also significantly positive (α = 3.3155, p < 0.05), showing that the network tends to form out-star structures, where innovations diffuse from central cities to peripheral cities.
In innovation diffusion networks, the spontaneous formation of out-star structures can be explained by the leading market theory. Certain cities can innovate first due to their unique advantages. When other cities observe the leading market’s success, they are more likely to adopt these innovations for their own development. This process results in an out-star structure radiating outward [42,43,44]. Conversely, the in-star structure refers to innovations diffusing from multiple peripheral cities to a central city. Central cities typically possess greater financial, human, technological, and informational resources. This resource abundance enables them to attract and integrate innovations from other cities [45]. Consequently, networks tend to spontaneously form in-star structures. The “Matthew effect,” in which innovation resources concentrate in national innovation centers in China, is pronounced [9,46,47]. Cities with higher urban hierarchies are more capable of attracting innovation factors and resources, thereby promoting the spatial spillover of innovations.
The coefficient of embedded knowledge network breadth (sending effect) is negative (α = −0.1475, p > 0.1). The high p-value indicates that the breadth of a city’s embedding in the knowledge network does not significantly affect the outward diffusion of green ICT innovations. In other words, extensive connections in sending cities do not directly enhance the outward diffusion of innovations. By contrast, the coefficient of embedded knowledge network breadth (receiving effect) is positive and statistically significant (α = 1.5944, p < 0.001). This indicates that the breadth of a city’s embedding in the knowledge network has a substantial positive effect on its ability to acquire green ICT innovations. The diversity of urban knowledge increases the likelihood that new information connects with existing knowledge frameworks. This facilitates the rapid identification and capture of marketable technologies under uncertainty, thereby enhancing cities’ capacity to receive external innovations [48].
The coefficient of embedded knowledge network depth (sending effect) is not significant (α = 0.0076, p > 0.1). In contrast, the coefficient of embedded knowledge network depth (receiving effect) is significantly negative (α = −0.0406, p < 0.001). This suggests that excessive specialization may result in technological lock-in, thereby inhibiting the reception of external innovations. Deep embedding in a knowledge network indicates a high degree of specialization in a specific technological domain. Such specialization may induce innovation inertia, causing cities to become overly dependent on existing technologies and potentially overlook new knowledge and innovations. This can lead to stagnation and technological lock-in, thereby hindering the reception of innovations from other cities [49,50].
The coefficient of knowledge uniqueness (sending effect) is significantly positive (α = 7.4639, p < 0.05), indicating that cities possessing unique knowledge are more likely to diffuse innovations outward. Unique knowledge provides distinct perspectives and solutions, which makes innovations from these cities more attractive to other cities. In contrast, the coefficient of knowledge uniqueness (receiving effect) is significantly negative (α = −22.9388, p < 0.001), suggesting that cities with highly unique knowledge are less likely to absorb external innovations. This may be due to the fact that the uniqueness of a city’s knowledge structure demands greater effort to integrate external innovations [51].
The knowledge combination potential (sending effect) coefficient is significantly positive (α = 0.0088, p < 0.01), indicating that the greater the potential for knowledge element composition in a city, the more flexible it is in integrating compositions, making it easier for other cities to undertake knowledge integration. Therefore, there is a higher probability of successfully spreading innovations to other cities. The knowledge combination potential (receiving effect) coefficient is significantly negative (α = −0.0174, p < 0.001), meaning that the greater the potential for knowledge element composition in a city, the lower the likelihood of receiving innovations from other cities. This may be because cities with extensive knowledge combination potential already possess a relatively comprehensive knowledge system, making it more likely that they will filter out innovations that are incompatible with their current knowledge system, thus reducing their ability to accept external innovations.
The knowledge distance network coefficient is not significant (α = −0.0679, p > 0.1), indicating that knowledge distance does not significantly affect a city’s tendency to receive innovations. This suggests that cities are not strongly biased toward either heterogeneous or homogeneous local knowledge systems, meaning they are open to receiving knowledge resources regardless of whether they are similar or dissimilar to their existing knowledge systems.
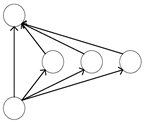
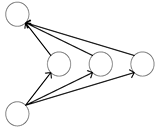
In the green transportation innovation diffusion network, the Edge coefficient is significantly negative (α = −5.7369, p < 0.001), indicating that the overall network structure is looser, and the innovation diffusion links between cities are weak. The Gwideg coefficient is significantly positive (α = 0.7641, p < 0.01), indicating that networks tend to spontaneously form in-star structures. The Gwodeg coefficient is not significant (α = 0.1437, p > 0.1), suggesting that out-star structures are not prominent. The Gwdsp coefficient is not significant (α = −0.0423, p > 0.1), indicating that networks tend to form closed triangular structures spontaneously. Closed triangular structures are usually based on mutual trust and close cooperation between cities. This trusting relationship reduces transaction costs, facilitates knowledge sharing and collaboration, and makes it easier for innovations to be adopted and diffused within the group [34,52,53].
Unlike the green ICT field, the embedded knowledge network depth (receiving effect) coefficient is significantly positive (α = 0.0218, p < 0.001) in the green transportation field. One possible reason is that the green ICT field often involves rapid technological updates and iterations, with new technologies and applications emerging constantly. In such an environment, a city deeply embedded in the existing knowledge network may become overly reliant on existing technologies, making it difficult to quickly adopt new innovations. In contrast, knowledge updates in the green transportation field may occur at a slower pace, with greater stability and maturity in both technologies and solutions. Therefore, deeper embedding in the knowledge network facilitates better reception of external innovations.
Additionally, in the green transportation field, the embedded knowledge network breadth (receiving effect) coefficient is also not significant (α = 0.0423, p > 0.1). This may be because ICT technologies are often highly modular and standardized, meaning that different components or systems can be developed and integrated relatively independently. Diverse knowledge elements can provide various perspectives for module design and system integration, making it easier to integrate external innovations. In the green transportation field, however, whether technologies can be integrated must be tested and verified in practice, rather than just based on the diversity of the city’s own knowledge.
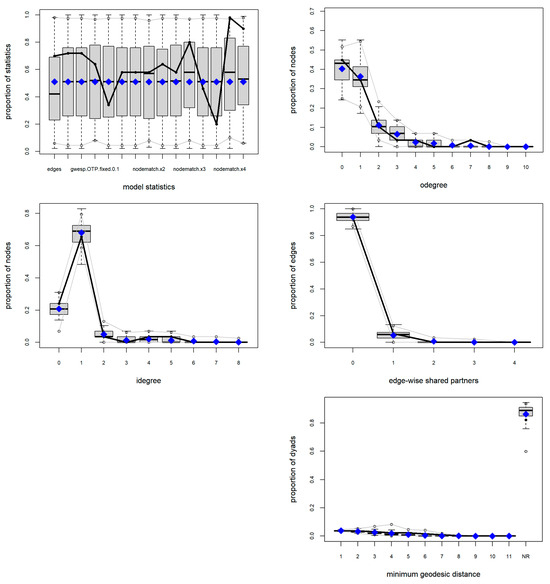
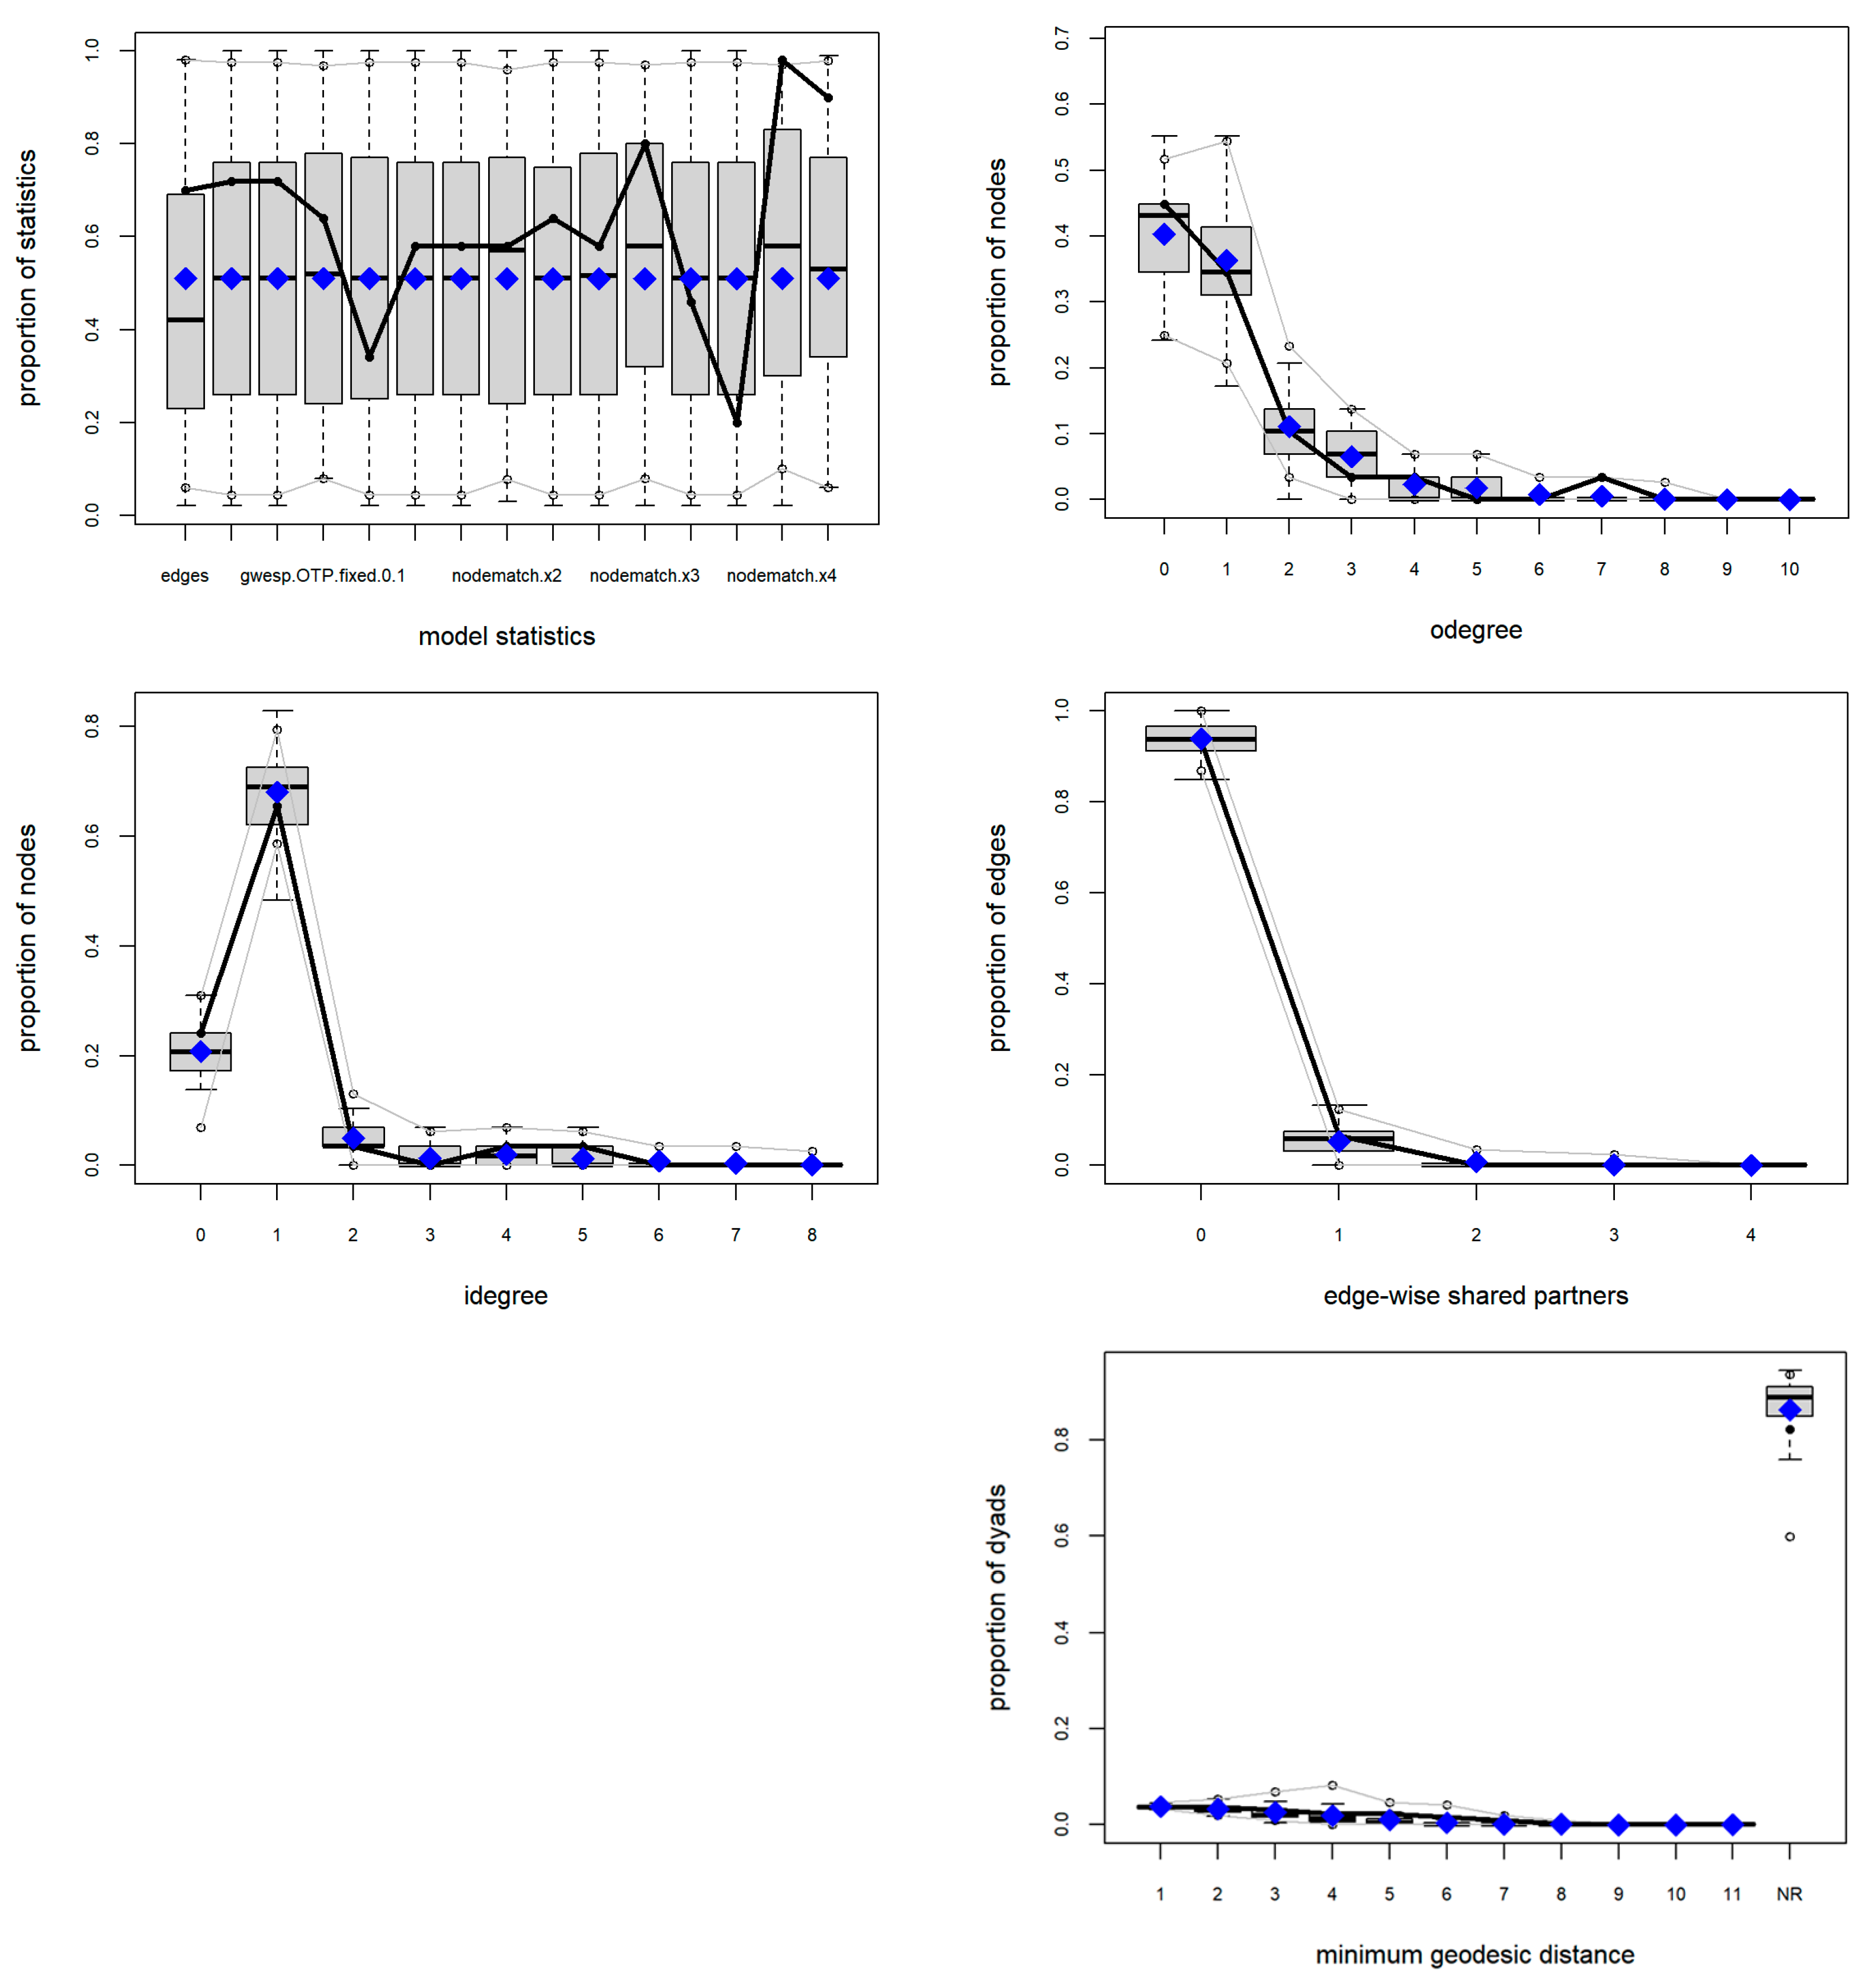
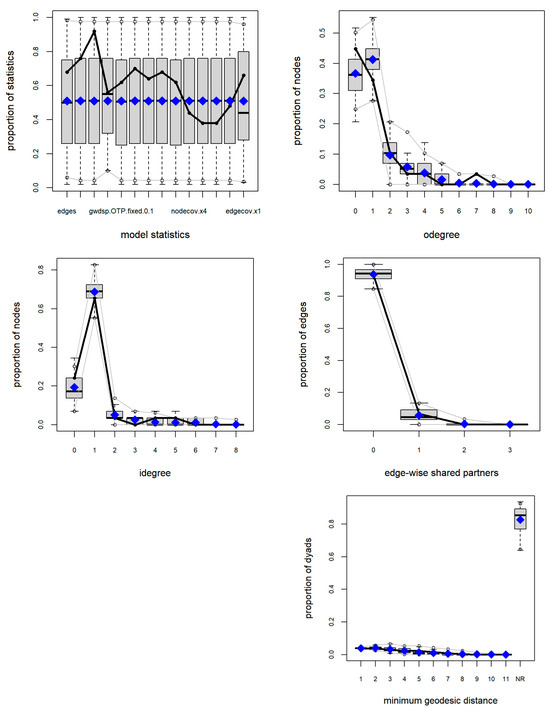
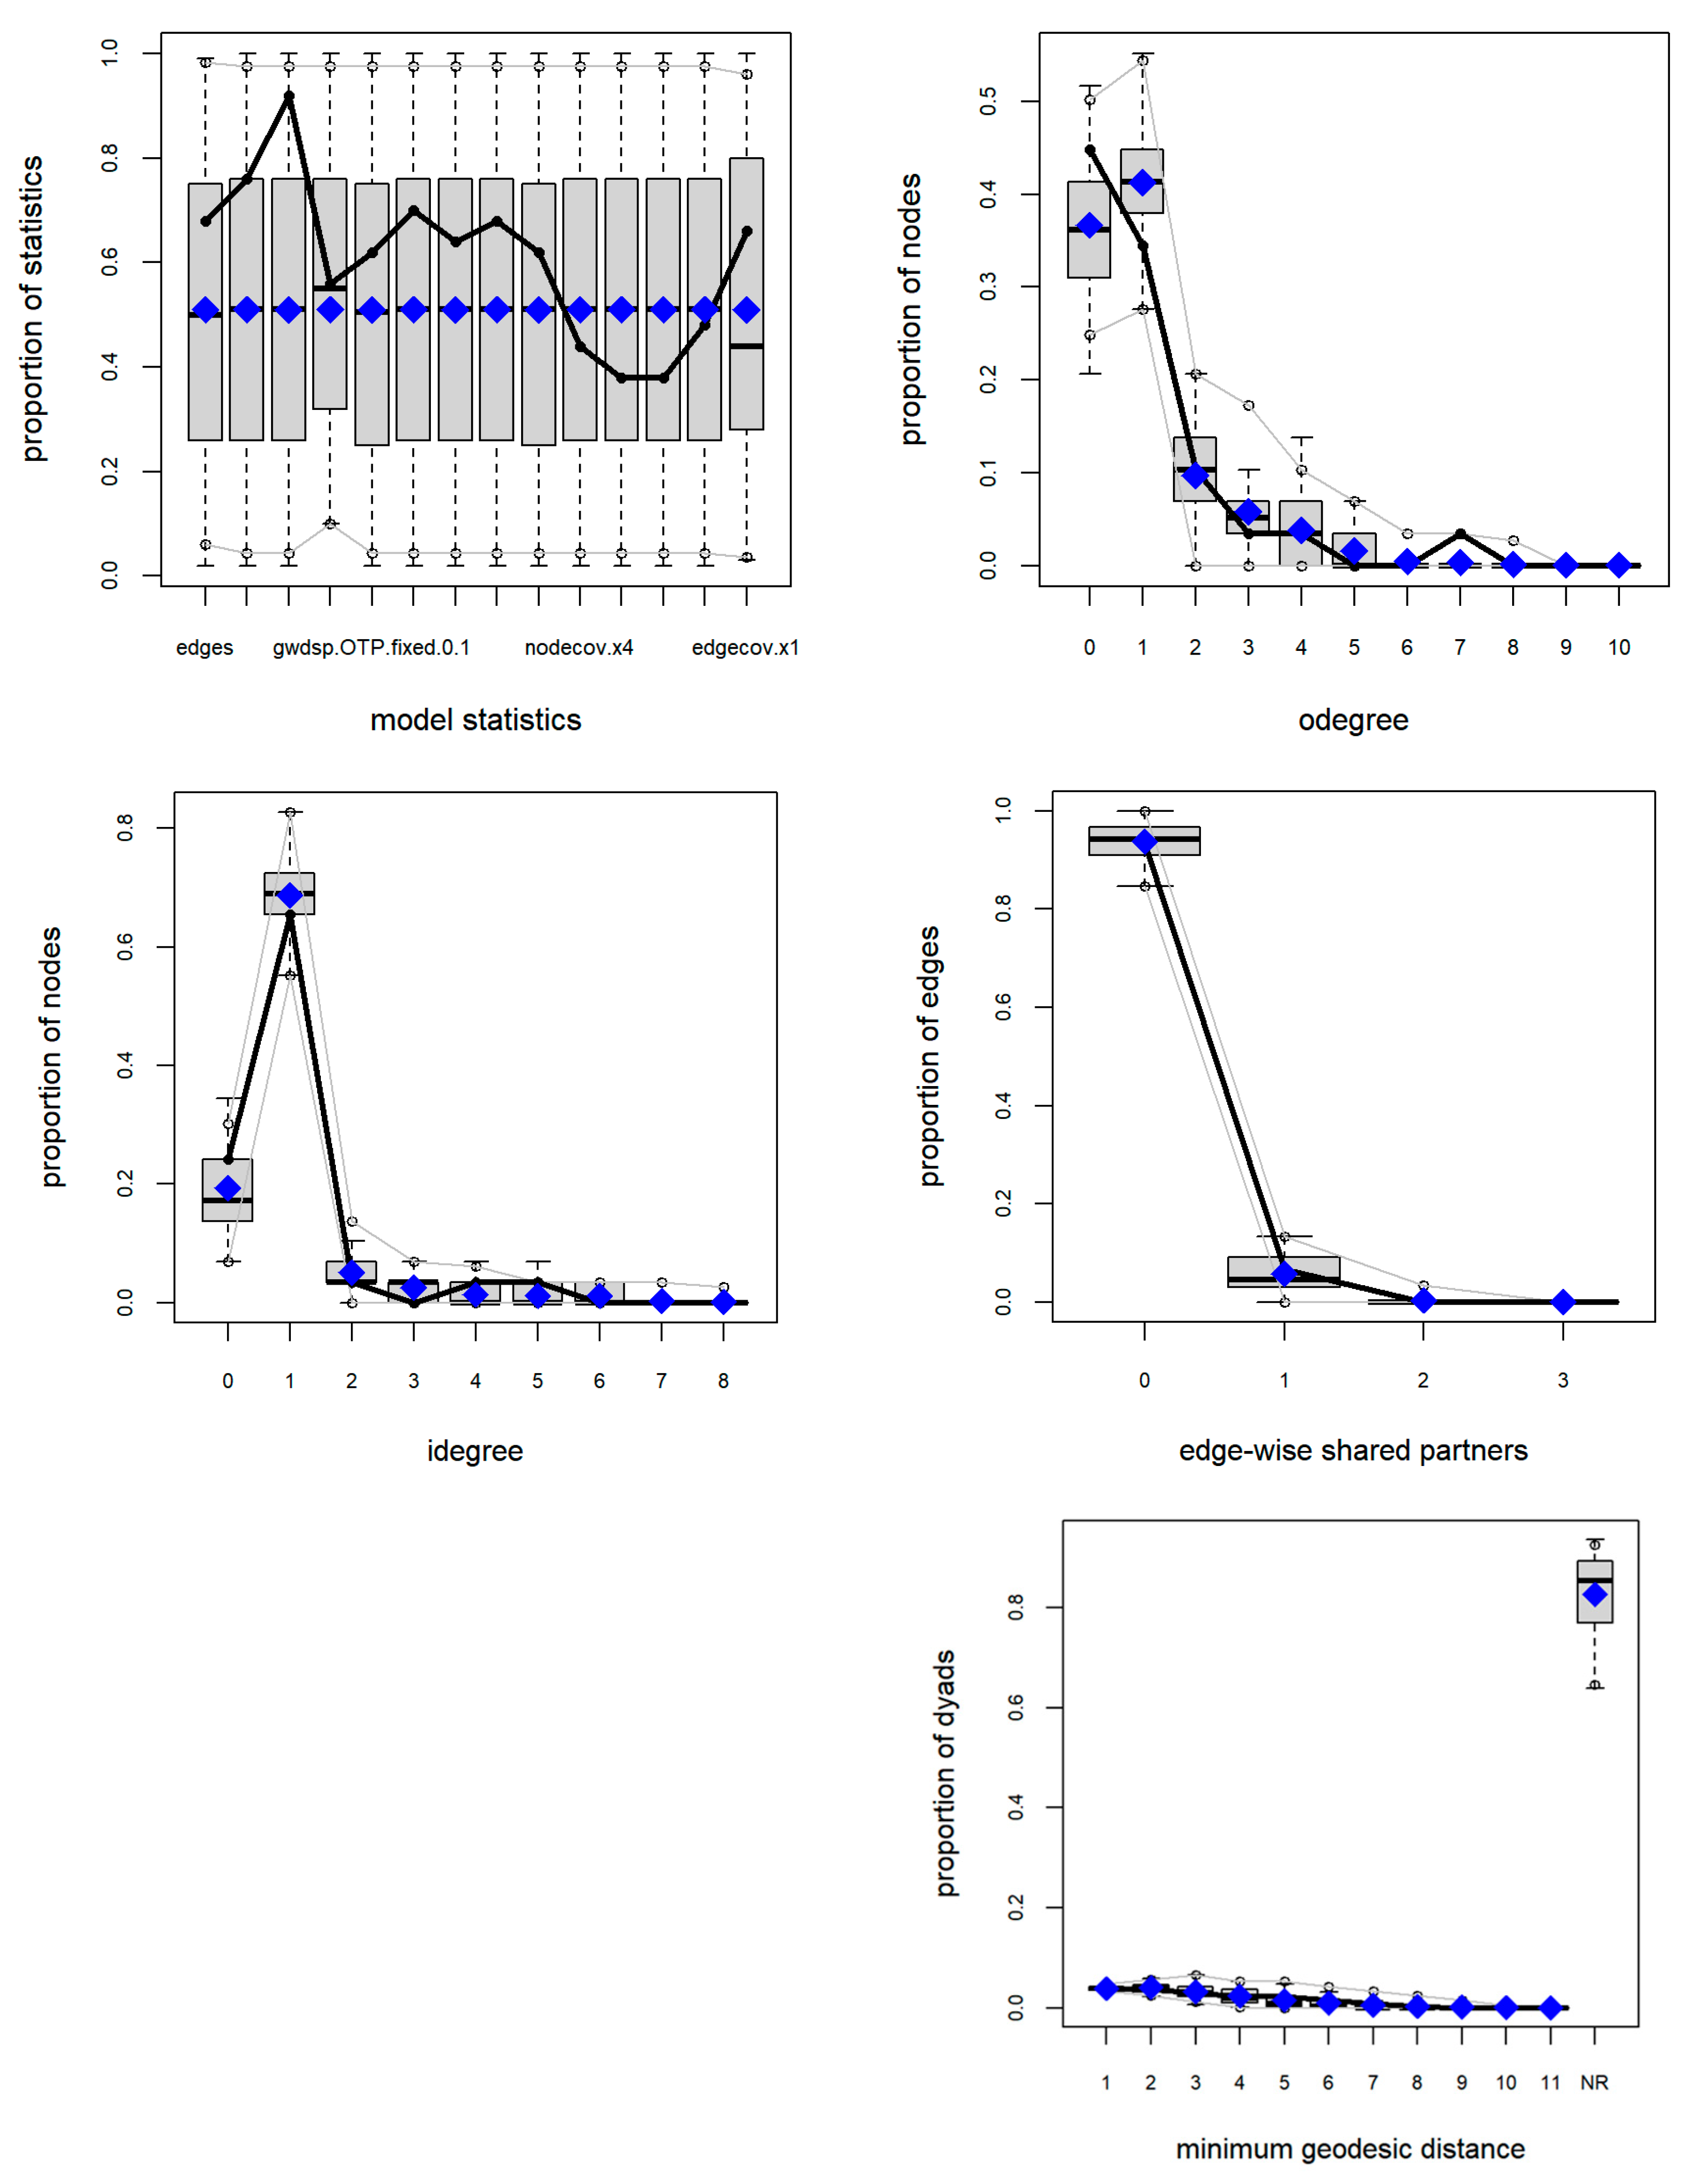
After estimating the coefficients, the model’s fit must be evaluated. A stochastic graph distribution is then simulated based on the estimated coefficients [54]. The goodness-of-fit (GOF) test evaluates the ERGM model’s fit. This test uses randomization procedures to compare the observed data and assess the model’s ability to replicate the network structure. It serves as an essential tool to validate the model’s accuracy and stability. Typically, multiple randomization operations are performed using the estimated coefficients to generate random network samples. The goodness of fit is determined by comparing statistical measures of the simulated networks with the observed data. Close alignment between randomized network structures and observed data indicates that the model fits the real-world data well. Significant discrepancies would require model adjustments to improve the network’s interpretation.
This study compares network structures using the following indicators: edgewise shared partners, geodesic distances, and degree centrality. GOF tests are conducted for both models, and the results are visualized using box plots. Figure 12 and Figure 13 present the results in five subplots. In each subplot, the thick black line represents the observed network, while the shaded box shows the distribution of statistics of randomized networks generated using the estimated model coefficients. The closer the black line is to the box plot’s median, the better the model fits the data. As shown in Figure 12 and Figure 13, the GOF test results indicate a satisfactory fit for both models.
Figure 12.
Green ICT innovation diffusion network’s ERGM goodness of fit.
Figure 13.
Green Transportation innovation diffusion network’s ERGM goodness of fit.
3.2. Discussion
Research indicates that knowledge networks are crucial for innovation diffusion at the urban level. In green ICT, the breadth of a city’s embedded knowledge network significantly facilitates the adoption of external innovations, indicating that diverse and extensive knowledge connections accelerate integration. Conversely, the depth of a city’s embedded knowledge network negatively affects innovation adoption, suggesting that excessive specialization and technological lock-in can hinder acceptance. In green transportation, the depth of a city’s embedded knowledge network positively influences innovation absorption, indicating that in a stable technological environment, deeper knowledge accumulation enhances cities’ capacity to adopt innovations. However, the breadth of embedded knowledge networks does not significantly affect innovation absorption. Across both domains, knowledge uniqueness and combination potential are critical. Knowledge uniqueness tends to facilitate outward innovation diffusion while limiting a city’s capacity to absorb external innovations. Similarly, stronger knowledge combination potential enables easier diffusion of innovations to other cities. However, the comprehensive nature of a city’s existing knowledge system reduces its capacity to absorb external innovations. Finally, knowledge distance does not significantly influence a city’s propensity to adopt innovations. Cities’ acceptance of external innovations is not determined by the similarity or heterogeneity of their local knowledge systems.
Compared with existing studies, this research provides a novel perspective on green innovation diffusion using multi-layer network analysis and ERGM. The study conceptualizes the urban knowledge base as a network structure rather than a mere collection of knowledge elements. Unlike the traditional knowledge stock perspective, this network view reveals complex interactions and couplings among knowledge elements, enabling a more precise description of knowledge combination mechanisms in inventions and creations, and identifying which elements played key roles in past innovations. Importantly, these knowledge structures provide a framework for understanding innovation diffusion across cities. Consequently, this research extends the role of knowledge networks in green technological innovation diffusion and enriches regional innovation system theories. By viewing the urban knowledge base as a network structure, policymakers can better understand and design cross-city and cross-regional technological cooperation mechanisms. This perspective helps policymakers identify the key knowledge elements that cities possess and fosters technological complementarity and cooperation among cities, thereby accelerating the diffusion of green innovation.
4. Conclusions
4.1. Conclusions
This study proposes a new analytical framework to understand the interplay between urban knowledge networks and inter-city innovation diffusion. By conceptualizing city knowledge bases as structured networks of interacting knowledge elements, rather than static collections, we reveal how knowledge structures influence innovation flows between cities. We provide empirical evidence showing that the position of cities within the knowledge network influences their ability to diffuse and absorb innovations—though in different ways across the green ICT and green transportation sectors. In the field of green ICT, the deep embedding of cities in knowledge networks weakens their ability to absorb external innovation, while broader embedding facilitates the introduction of external innovation. In contrast, in the field of green transportation, deep embedding of cities in knowledge networks benefits the absorption of external innovation, while broad embedding has no significant effect on this process. In both fields, the potential of knowledge combinations and the uniqueness of knowledge promote the outward diffusion of innovation from the city, but they weaken the city’s ability to absorb external innovations.
4.2. Recommendations
Although this study uses Chinese cities as a sample, the analytical framework has strong universality and can be applied to other economies, especially developing countries, emerging economies, and regions undergoing post-industrial restructuring. These economies often face structural challenges in their green transformation process, such as uneven resource allocation, disparities in urban knowledge bases, and differences in innovation capabilities. By identifying the mechanisms through which urban knowledge networks influence innovation diffusion, policymakers in such contexts can design targeted interventions to enhance the efficiency of regional green innovation diffusion.
(1) To achieve coordinated development of green innovation, it is essential to integrate innovation resources and achieve complementary advantages. For rapidly urbanizing developing economies in Asia, Africa, and Latin America—where innovation capacity is often concentrated in a few metropolitan hubs—government departments should accelerate the innovation of mechanisms and systems, actively promoting a “multi-center” urban model. Leading cities, similar to Shanghai and Beijing in China, can act as regional anchors, driving the development of surrounding cities. Integrating innovation resources from different regions, breaking down development barriers between cities, and facilitating the exchange of information, knowledge, technology, and talent will allow each city to leverage its unique innovation strengths.
(2) Cities should also keep pace with the market demand for green technology development, fully explore and expand their own knowledge resources, accelerate the flow of knowledge elements, enhance research output, and promote the conversion of scientific and technological achievements. For economies with strong local industrial bases but weak cross-regional linkages, such as certain Eastern European or Southeast Asian countries, implementing a diversified evaluation mechanism for research outcomes can stimulate innovation among talent and maintain the vitality of the knowledge resource pool. Meanwhile, introducing targeted talent attraction policies and offering domestic and international professional training can help build specialized and high-quality talent teams, establish high-level research platforms, and attract diverse knowledge resources.
(3) Finally, in the field of green ICT, cities should establish a rapid response mechanism to adapt to the fast-changing technological environment and market demands. This is especially relevant for economies with high ICT penetration but uneven green technology adoption, where dynamic monitoring of market trends and timely adjustment of technology strategies can ensure adaptability. In the field of green transportation, cities—particularly those in regions investing heavily in sustainable mobility—should encourage empirical research and pilot projects, using small-scale testing to verify the effectiveness of new technologies before large-scale promotion.
4.3. Limitations and Future Prospects
Although this study has made considerable efforts to reveal the role of urban knowledge networks in green innovation diffusion, some aspects still merit further exploration.
First, the analysis is based solely on green patent licensing data, which reflects formal and codified knowledge flows but does not capture tacit knowledge exchange or other informal collaboration channels. Future research could integrate diverse data sources—such as co-publications, joint R&D projects, or social network data—and draw on social capital theory to examine how tacit knowledge shapes innovation diffusion between cities, both within China and across different economic contexts.
Second, the study is conducted at the city level and does not account for the heterogeneity of innovation actors within each city, such as universities, research institutes, large enterprises, and start-ups. This may limit the ability to explain how internal dynamics influence external innovation linkages. Future studies could adopt a multi-scale analytical approach that links macro-level urban network structures with meso- and micro-level actor interactions, offering deeper insights into how institutional environments, actor strategies, and collaboration patterns jointly shape the diffusion of green innovation.
Author Contributions
Conceptualization, X.S.; methodology, F.S. and C.D.; software, X.S.; validation, F.S. and C.D.; formal analysis, X.S.; investigation, F.S.; resources, C.D.; writing—original draft preparation, X.S.; writing—review and editing, F.S. and C.D. All authors have read and agreed to the published version of the manuscript.
Funding
This research was funded by the National Social Science Fund of China (Grant No. 24BGL049).
Institutional Review Board Statement
Not applicable.
Data Availability Statement
The data of this study are available from the corresponding author upon reasonable request.
Conflicts of Interest
The authors declare no conflicts of interest.
References
- Zhang, R.J.; Tai, H.W.; Cao, Z.X.; Wei, C.C.; Cheng, K.T. Green innovation ecosystem evolution: Diffusion of positive green innovation game strategies on complex networks. J. Innov. Knowl. 2024, 9, 100500. [Google Scholar] [CrossRef]
- Hötte, K. How to accelerate green technology diffusion? Directed technological change in the presence of coevolving absorptive capacity. Energy Econ. 2020, 85, 104565. [Google Scholar] [CrossRef]
- Costales, E. Identifying sources of innovation: Building a conceptual framework of the Smart City through a social innovation perspective. Cities 2022, 120, 103459. [Google Scholar] [CrossRef]
- Simmie, J. Innovation and urban regions as national and international nodes for the transfer and sharing of knowledge. Reg. Stud. 2003, 37, 607–620. [Google Scholar] [CrossRef]
- Han, J.H. Open innovation in a smart city context: The case of Sejong smart city initiative. Eur. J. Innov. Manag. 2025, 28, 1740–1762. [Google Scholar] [CrossRef]
- López-Ruiz, V.-R.; Alfaro-Navarro, J.-L.; Nevado-Peña, D. Knowledge-city index construction: An intellectual capital perspective. Expert Syst. Appl. 2014, 41, 5560–5572. [Google Scholar] [CrossRef]
- Wang, K.P.; Dong, Y. The co-evolution of internal knowledge characteristics of cities and external technology transfer: Based on a cross-level network perspective. J. Technol. Transf. 2025. [Google Scholar] [CrossRef]
- Brusoni, S.; Prencipe, A.; Pavitt, K. Knowledge specialization, organizational coupling, and the boundaries of the firm: Why do firms know more than they make? Adm. Sci. Q. 2001, 46, 597–621. [Google Scholar] [CrossRef]
- Feng, Z.J.; Cai, H.C.; Chen, Z.N.; Zhou, W. Influence of an interurban innovation network on the innovation capacity of China: A multiplex network perspective. Technol. Forecast. Soc. Change 2022, 180, 121651. [Google Scholar] [CrossRef]
- De Noni, I.; Ganzaroli, A.; Orsi, L. The impact of intra-and inter-regional knowledge collaboration and technological variety on the knowledge productivity of European regions. Technol. Forecast. Soc. Change 2017, 117, 108–118. [Google Scholar] [CrossRef]
- Capone, F.; Lazzeretti, L.; Innocenti, N. Innovation and diversity: The role of knowledge networks in the inventive capacity of cities. Small Bus. Econ. 2021, 56, 773–788. [Google Scholar] [CrossRef]
- Yao, L.; Li, J.; Li, J. Urban innovation and intercity patent collaboration: A network analysis of China’s national innovation system. Technol. Forecast. Soc. Change 2020, 160, 120185. [Google Scholar] [CrossRef]
- Yang, Y.; Ma, G. How can HSR promote inter-city collaborative innovation across regional borders? Cities 2023, 138, 104367. [Google Scholar] [CrossRef]
- Clark, A. The Theory of Adsorption and Catalysis; Academic: Cambridge, MA, USA, 2018. [Google Scholar]
- Qi, G.Z.; Wang, Z.B.; Jiao, X.M.; Wang, C.X. The spatio-temporal characteristics of intercity green technology innovation transfer and its air pollution reduction effect in China. Ecol. Indic. 2025, 178, 113934. [Google Scholar] [CrossRef]
- Keller, W.; Yeaple, S.R. The gravity of knowledge. Am. Econ. Rev. 2013, 103, 1414–1444. [Google Scholar] [CrossRef]
- Liu, B.; Gan, L.; Huang, K.; Hu, S.Y. The impact of low-carbon city pilot policy on corporate green innovation: Evidence from China. Financ. Res. Lett. 2023, 58, 104055. [Google Scholar] [CrossRef]
- Tan, X.J.; Cheng, S.; Liu, Y.S. Green digital finance and technology diffusion. Humanit. Soc. Sci. Commun. 2024, 11, 389. [Google Scholar] [CrossRef]
- Chen, Z.; Xing, R.K. Digital economy, green innovation and high-quality economic development. Int. Rev. Econ. Financ. 2025, 99, 104029. [Google Scholar] [CrossRef]
- Fan, F.; Wen, Z.L.; Shao, X.Y.; Zhang, H.; Yang, B.H. Do Technology Transfer Networks Impact Urban Innovation Capacity? Evidence From Chinese Cities. Int. Reg. Sci. Rev. 2025, 48, 306–333. [Google Scholar] [CrossRef]
- Zhao, Y.; Qi, N.N.; Li, L.Y.; Li, Z.; Han, X.; Xuan, L. How do knowledge diversity and ego-network structures affect firms’ sustainable innovation: Evidence from alliance innovation networks of China’s new energy industries. J. Knowl. Manag. 2023, 27, 178–196. [Google Scholar] [CrossRef]
- Shi, X.Y.; Sui, F.X.; Huang, X.X. Green technology transfer for firms in a multi-layer network perspective: The dual impact of knowledge resources and regional environment. Environ. Technol. Innov. 2025, 39, 104291. [Google Scholar] [CrossRef]
- Guan, J.C.; Yan, Y. Technological proximity and recombinative innovation in the alternative energy field. Res. Policy 2016, 45, 1460–1473. [Google Scholar] [CrossRef]
- Liu, Y.; Shao, X.; Tang, M.; Lan, H. Spatio-temporal evolution of green innovation network and its multidimensional proximity analysis: Empirical evidence from China. J. Clean. Prod. 2021, 283, 124649. [Google Scholar] [CrossRef]
- Kirchherr, J.; Urban, F. Technology transfer and cooperation for low carbon energy technology: Analysing 30 years of scholarship and proposing a research agenda. Energy Policy 2018, 119, 600–609. [Google Scholar] [CrossRef]
- Garcia-Vega, M. Does technological diversification promote innovation?: An empirical analysis for European firms. Res. Policy 2006, 35, 230–246. [Google Scholar] [CrossRef]
- Quintana-García, C.; Benavides-Velasco, C.A. Innovative competence, exploration and exploitation: The influence of technological diversification. Res. Policy 2008, 37, 492–507. [Google Scholar] [CrossRef]
- Nesta, L.; Saviotti, P.P. Coherence of the Knowledge Base and the Firm’s Innovative Performance: Evidence from the U.S. Pharmaceutical Industry. J. Ind. Econ. 2005, 53, 123–142. [Google Scholar] [CrossRef]
- Bianchi, C.; Galaso, P.; Palomeque, S. Knowledge complexity and brokerage in inter-city networks. J. Technol. Transf. 2023, 48, 1773–1799. [Google Scholar] [CrossRef]
- Carnabuci, G.; Bruggeman, J. Knowledge Specialization, Knowledge Brokerage and the Uneven Growth of Technology Domains. Soc. Forces 2009, 88, 607–641. [Google Scholar] [CrossRef]
- Brennecke, J.; Rank, O. The firm’s knowledge network and the transfer of advice among corporate inventors—A multilevel network study. Res. Policy 2017, 46, 768–783. [Google Scholar] [CrossRef]
- Nelson, A.J. Measuring knowledge spillovers: What patents, licenses and publications reveal about innovation diffusion. Res. Policy 2009, 38, 994–1005. [Google Scholar] [CrossRef]
- Buldyrev, S.V.; Parshani, R.; Paul, G.; Stanley, H.E.; Havlin, S.J.N. Catastrophic cascade of failures in interdependent networks. Nature 2010, 464, 1025–1028. [Google Scholar] [CrossRef]
- Losacker, S. ‘License to green’: Regional patent licensing networks and green technology diffusion in China. Technol. Forecast. Soc. Change 2022, 175, 121336. [Google Scholar] [CrossRef]
- Nonaka, I. A dynamic theory of organizational knowledge creation. Organ. Sci. 1994, 5, 14–37. [Google Scholar] [CrossRef]
- Jaffe, A.B.; Trajtenberg, M.; Henderson, R. Geographic localization of knowledge spillovers as evidenced by patent citations. Q. J. Econ. 1993, 108, 577–598. [Google Scholar] [CrossRef]
- Sharma, P.; Tripathi, R. Patent citation: A technique for measuring the knowledge flow of information and innovation. World Pat. Inf. 2017, 51, 31–42. [Google Scholar] [CrossRef]
- Malhotra, A.; Zhang, H.; Beuse, M.; Schmidt, T. How do new use environments influence a technology’s knowledge trajectory? A patent citation network analysis of lithium-ion battery technology. Res. Policy 2021, 50, 104318. [Google Scholar] [CrossRef]
- Wu, G.; Feng, L.; Peres, M.; Dan, J. Do self-organization and relational embeddedness influence free trade agreements network formation? Evidence from an exponential random graph model. J. Int. Trade Econ. Dev. 2020, 29, 995–1017. [Google Scholar] [CrossRef]
- Hunter, D.R.; Handcock, M.S.; Butts, C.T.; Goodreau, S.M.; Morris, M. ergm: A package to fit, simulate and diagnose exponential-family models for networks. J. Stat. Softw. 2008, 24, nihpa54860. [Google Scholar] [CrossRef] [PubMed]
- Arthur, W.B. The structure of invention. Res. Policy 2007, 36, 274–287. [Google Scholar] [CrossRef]
- Beise, M. Lead markets: Country-specific drivers of the global diffusion of innovations. Res. Policy 2004, 33, 997–1018. [Google Scholar] [CrossRef]
- Beise, M.; Rennings, K. Lead markets and regulation: A framework for analyzing the international diffusion of environmental innovations. Ecol. Econ. 2005, 52, 5–17. [Google Scholar] [CrossRef]
- Losacker, S.; Liefner, I. Regional lead markets for environmental innovation. Environ. Innov. Soc. Transit. 2020, 37, 120–139. [Google Scholar] [CrossRef]
- Fan, F.; Dai, S.; Zhang, K.; Ke, H. Innovation agglomeration and urban hierarchy: Evidence from Chinese cities. Appl. Econ. 2021, 53, 6300–6318. [Google Scholar] [CrossRef]
- Li, D.; Wei, Y.D.; Wang, T. Spatial and temporal evolution of urban innovation network in China. Habitat Int. 2015, 49, 484–496. [Google Scholar] [CrossRef]
- Han, R.; Cao, H.; Liu, Z. Studying the urban hierarchical pattern and spatial structure of China using a synthesized gravity model. Sci. China Earth Sci. 2018, 61, 1818–1831. [Google Scholar] [CrossRef]
- Cohen, W.M.; Levinthal, D.A. Absorptive capacity: A new perspective on learning and innovation. Adm. Sci. Q. 1990, 35, 128–152. [Google Scholar] [CrossRef]
- Saloner, G. Economic issues in computer interface standardization. Econ. Innov. New Technol. 1990, 1, 135–156. [Google Scholar] [CrossRef]
- Bjørnåvold, A.; Van Passel, S. The lock-in effect and the greening of automotive cooling systems in the European Union. J. Environ. Manag. 2017, 203, 1199–1207. [Google Scholar] [CrossRef]
- Wang, S.; Bai, X. Compatibility in cross-city innovation transfer: Importance of existing local experiments. Environ. Innov. Soc. Transit. 2022, 45, 52–71. [Google Scholar] [CrossRef]
- Li, Y.; Cao, X.; Wang, M. Can the cumulative effect of technological resources promote green technology collaborative innovation in resource-based regions? J. Clean. Prod. 2024, 461, 142589. [Google Scholar] [CrossRef]
- Ma, D.; Li, Y.; Zhu, K.; Huang, H.; Cai, Z. Who innovates with whom and why? A comparative analysis of the global research networks supporting climate change mitigation. Energy Res. Soc. Sci. 2022, 88, 102523. [Google Scholar] [CrossRef]
- Dong, G.; Zhang, J.; Tian, L.; Chen, Y.; Zhang, M.; Nan, Z. Structural Properties Evolution and Influencing Factors of Global Virtual Water Scarcity Risk Transfer Network. Energies 2023, 16, 1436. [Google Scholar] [CrossRef]


Disclaimer/Publisher’s Note: The statements, opinions and data contained in all publications are solely those of the individual author(s) and contributor(s) and not of MDPI and/or the editor(s). MDPI and/or the editor(s) disclaim responsibility for any injury to people or property resulting from any ideas, methods, instructions or products referred to in the content. |
© 2025 by the authors. Licensee MDPI, Basel, Switzerland. This article is an open access article distributed under the terms and conditions of the Creative Commons Attribution (CC BY) license (https://creativecommons.org/licenses/by/4.0/).