


Highlights
What are the main findings?
- Warm nights (TN90p) rise ~20 days per decade and warm days (TX90p) ~12 days per decade across Haiti; TXmean +0.17 °C/dec, TNmean +0.22 °C/dec.
- Near-surface vapor pressure increased by +0.15 hPa per decade over 76% of the territory, and the detrended interannual variability explains most of the excess night warming (partial correlation with TN90p: r = 0.80).
What are the implications of the main findings?
- The water-vapor greenhouse effect is a key driver of the faster warming of nights than days in the Caribbean, a mechanism previously untested for the region.
- Warmer, more humid nights raise cooling demand and heat-stress risk, providing a country-wide baseline for energy and public health adaptation in Haiti and other Caribbean small islands.
Abstract
Extreme weather events have increasingly disrupted Haiti’s socio-economic development. This study assesses long-term trends in mean and extreme temperature, precipitation, and near-surface humidity indices across Haiti for 1981–2020, using ERA5-Land temperature and humidity fields together with Multi-Source Weighted-Ensemble Precipitation (MSWEP), both at 0.1° resolution. Trends were quantified with the Theil–Sen estimator and tested with Mann–Kendall (MK) after Trend-Free Pre-Whitening (TFPW). Warm days (TX90p, percentage of days when daily maximum temperature exceeds the 90th percentile of the reference period) and warm nights (TN90p, percentage of days when daily minimum temperature exceeds the 90th percentile) increase nationwide by about 12 and 20 additional days per decade, while mean maximum and minimum temperatures warm by 0.17 °C and 0.22 °C per decade, respectively. Nocturnal warming is accompanied by a significant rise in near-surface water vapor pressure (+0.15 hPa per decade), whose detrended interannual variability correlates strongly with TN90p (r = 0.59), identifying the water-vapor greenhouse effect as a key driver of the faster warming of nights than days. Precipitation shows no significant national trend, except for very wet days (R90p, percentage of days with precipitation above the 90th percentile of wet days, +2.18% per decade) and a decline in rainy days (RR1, number of days with precipitation ≥ 1 mm, –4 days per decade). These results provide the first country-wide baseline of temperature and precipitation extremes for climate-risk assessment in Haiti.
1. Introduction
Insular and Caribbean countries have been identified as among the most vulnerable to climate extremes [1]. This vulnerability results from extreme climate sensitivity driven by several factors [2], including their small size and complex topography, which restrict economic development; their heavy reliance on climate-sensitive sectors (energy, agriculture, and tourism); an overwhelming dependence on rainfall for water; and limited risk forecasting capabilities compounded by high public debt. While it was predicted that certain extreme phenomena would become more frequent, widespread, and intense during the 21st century [3], recent assessments confirm that these trends are now clearly observable globally [4]. These changes are documented by the rising temperatures recorded at meteorological stations worldwide [5,6] and in regional contexts such as the Caribbean [7]. The severity and frequency of extreme temperature and precipitation events have significant socio-economic impacts in these states [8]. The risks associated with extreme weather and our ability to assess and manage them affect the sustainability of economic developments and living conditions [9]. In the Caribbean, Haiti is frequently affected by natural disasters, extreme temperatures, and precipitation events that devastate water resources, agriculture, infrastructure, health, and biodiversity. Given its location, morphology, and weak response to these threats, Haiti requires in-depth knowledge of the spacetime evolution of extreme temperatures and precipitation. Within this regional context, Haiti stands out as the least documented country: political instability, the collapse of the observation network after the 2010 earthquake, and the fragmentation of institutional archives have left the country almost invisible in the growing body of Caribbean climate research [1].
Surface air temperature and precipitation are key indicators of climate variability and change. To standardize their assessment, the Expert Team on Climate Change Detection and Indices (ETCCDI) defined 27 indices describing mean and extreme conditions [9,10], which are described by [5,6,10,11,12], and which have also been widely used in previous reports of the Intergovernmental Panel on Climate Change (IPCC). To our knowledge, no country-wide assessment of ETCCDIs has been published for Haiti; existing regional Caribbean studies either aggregate Haiti with neighboring islands or rely on the few sparse historical stations available, leaving the national spatial pattern undocumented.
This study addresses that gap by producing the first country-wide diagnostic of temperature, precipitation and near-surface humidity trends over Haiti for the period 1981–2020, using ERA5-Land and MSWEP V2 gridded datasets at 0.1° resolution. Beyond the standard ETCCDI diagnostic, we explicitly test whether near-surface water vapor drives the observed asymmetry between nighttime and daytime warming, a mechanism invoked at the global scale [13,14] but not yet quantified for the Caribbean at the country scale. Specifically, the study pursues the following objectives:
- To quantify interannual and decadal trends of mean and extreme temperature, precipitation, and near-surface humidity indices (RH, vapor pressure e) across Haiti over 1981–2020 and assess their statistical significance under serial autocorrelation.
- To map the spatial distribution of these trends and identify regional disparities in temperature, precipitation, and humidity extremes at both national and city scales.
- To disentangle the physical mechanism driving the observed asymmetry between nighttime and daytime warming by quantifying the relationship between near-surface water-vapor variability and the frequency of warm nights (TN90p), thereby providing a scientific basis for climate adaptation and resilience strategies at the national and regional levels.
The remainder of the paper is organized as follows: Section 2 describes the study area, the datasets, and methodology; Section 3 presents the trends and their spatial patterns. Section 4 discusses the humidity-driven mechanism and compares our results with the regional literature. Finally, Section 5 summarizes the main findings and outlines implications for adaptation planning.
2. Materials and Methods
2.1. Study Area
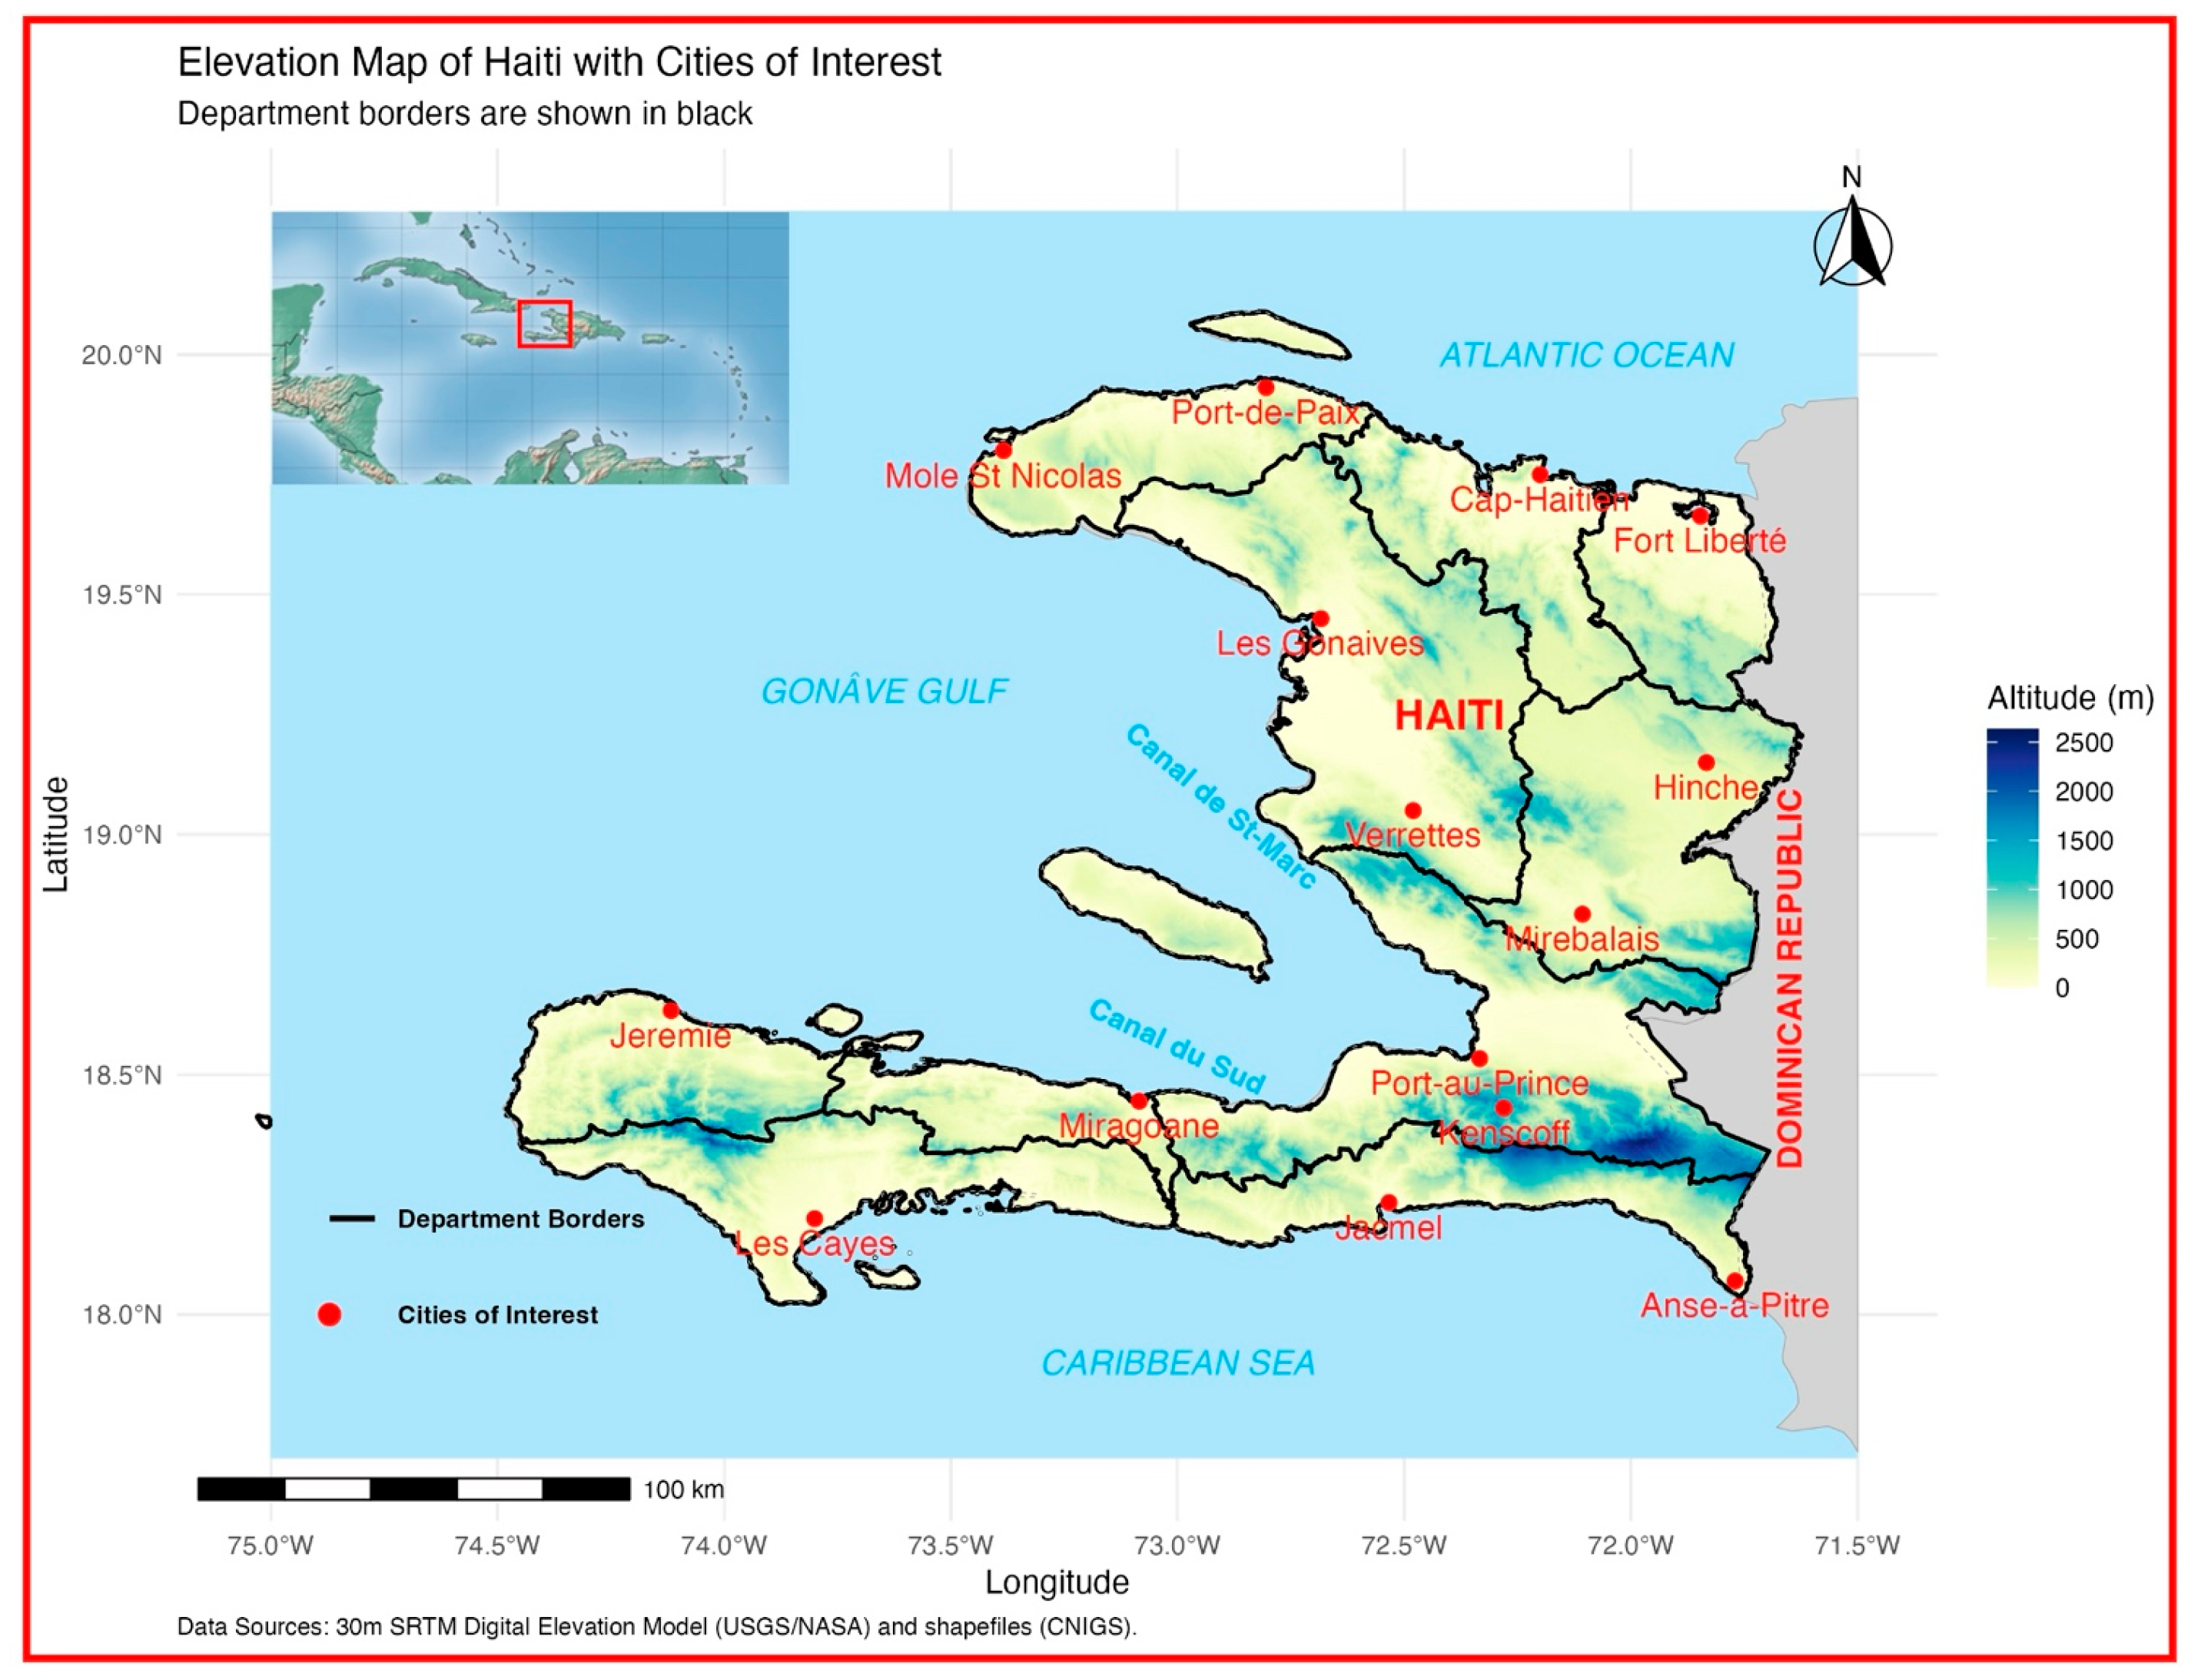
This study focuses on Haiti, one of the two republics of the island of Hispaniola (one of the main islands of the Caribbean), which is located between 18° N and 20°06′ N latitude and 71°41′ W and 74°29′ W longitude. Hispaniola is an island of volcanic formation with a carbonate cover. Haiti occupies the western part of the island, with an area of 27,750 km2, while the Dominican Republic occupies the other part, with an area of 48,577 km2. The sea borders Haiti on three sides, with the Caribbean Sea to the south and west and the Atlantic Ocean to the north (see Figure 1).
Figure 1.
Map of Haiti with cities of interest, department borders, and its geographical location in the Caribbean. This map highlights Haiti’s topography using an elevation color scale, with department borders outlined in black. The country shares the island of Hispaniola with the Dominican Republic, which appears as a gray area. The inset in the upper-left corner provides a broader view of Haiti’s location within the Caribbean, with a red rectangle marking its position. Major cities and key geographical features like the Gonâve Gulf and the Caribbean Sea are labeled for reference. Haiti’s privileged geographical location in the Caribbean is situated in the North Atlantic Basin.
Haiti’s topography is dominated by mountains covering two-thirds of the country. This rugged terrain favors the formation of torrential rivers. Haiti has a highly developed coastline, and the major urban centers, except for Hinche in the Central Plateau, are coastal cities, thus exposing a large portion of its population to high hydro-meteorological risks. Due to its geographical location in the Caribbean basin, the country is vulnerable to the threat of tropical cyclones.
Haiti’s climate is typical of the Caribbean region, characterized as tropical with dry winters and a bimodal seasonal rainfall pattern. According to [15], the rainfall regime in the Caribbean, including the Greater Antilles, is divided into four seasons: the winter dry season (WDS) from mid-November to April, the early rainy season (ERS) from late April to June, the mid-summer drought (MSD) from June to August, and the late rainy season (LRS) from late August to November. Haiti shows significant variability in precipitation across its departments, influenced by topography and exposure to prevailing winds. Annual average rainfall ranges from 1164 mm in Miragoâne (Nippes) to 1317 mm in Port-de-Paix (North-West). Some months are notably wet, such as November in Port-de-Paix (219 mm) and May in Jacmel (197 mm), while the dry season features minimal rainfall, with only 30 mm recorded in December in Miragoâne and 34 mm in December in Jacmel [16]. Average annual temperatures in Haiti generally remain within a narrow range across the country, varying between 26.0 °C in Port-de-Paix (Northwest) and 26.6 °C in Jacmel (Southeast). The lowest temperatures are typically recorded in January, with minimum values around 24.0 °C in Port-de-Paix and 24.8 °C in Jacmel, while maximum temperatures reach 28.1 °C in August in Port-de-Paix and 27.8 °C in Jacmel. However, these values represent averages for specific urban locations and do not fully capture the strong spatial variability of temperature across Haiti. The country’s complex topography induces significant local contrasts: across the national climate station network, monthly mean minimum temperatures fall to 8.9 °C at Seguin (1680 m), whereas monthly mean maximum temperatures reach 33.7 °C at the Gonaïves and Mirebalais stations, compared with a national mean of 29.1 °C [17,18].
As part of this study, we selected a set of cities for closer analysis to investigate local climatic behavior more precisely. These urban areas correspond to departmental capitals, represent major population basins, and are spatially distributed to capture the diversity of Haiti’s climatic regimes as identified in the previous literature. We can better evaluate the exposure and vulnerability of population centers and characterize spatial contrasts in climate variability thanks to this regional focus (see Table 1). The fourteen cities selected for local trend analysis meet four criteria: (i) administrative coverage—one to two cities per department (all ten represented); (ii) climatic representativeness—spanning the three zones defined by [1]: the semi-arid northwestern coast (Môle-Saint-Nicolas, Port-de-Paix), the humid mountainous interior (Hinche, Mirebalais, Verrettes) and the humid southern coast (Les Cayes, Jérémie, Jacmel, Anse-à-Pitres); (iii) socio-economic weight—the most populated centres where climate risks (heat stress, water, energy) have the highest impact; and (iv) data availability—locations with historical station records [1,19].
Table 1.
List of the selected cities, including their geographical coordinates and elevations. The official coordinates (WGS84) and the actual elevations were extracted from the 30 m SRTM Digital Elevation Model (DEM) provided by the USGS/NASA.
2.2. Data Used
In the Caribbean region, the availability of continuous daily time series with metadata is a challenge [20], as well as the ability to convert and maintain climate data in digital form [7]. Haiti is a typical example: the only climate database in Haiti is available for a historical period [1], but it is not for the study period. As a result, the data used in this study are not observed in situ data but reanalysis or satellite data.
The mean, minimum, and maximum temperature data (Tmean, TNmean, TXmean) used in this study are derived from the ERA5-Land dataset, as documented by [21]. ERA5-Land is produced by the European Centre for Medium-Range Weather Forecasts (ECMWF) and offers a comprehensive and consistent reconstruction of atmospheric variables. The temperature data used for our index calculations have a spatial resolution of 0.1° and were aggregated from their native hourly resolution to a daily scale. For the precipitation indices, we utilized the Multi-Source Weighted-Ensemble Precipitation (MSWEP) version 2.8 dataset, described by [22]. MSWEP, developed by the GloH2O team at the University of Utrecht in the Netherlands, optimally merges data from rain gauges, satellites, and reanalyses to provide high-resolution precipitation estimates at a spatial resolution of 0.1° (~11 km) and a temporal resolution of 3 h.
The selection of reanalysis and satellite-based datasets used in this study results from a rigorous comparative evaluation of gridded product performance across the Greater and Lesser Antilles region. Although ground-based observation archives exist for Haiti, their fragmented and discontinuous nature, particularly for the period 1981–2020, necessitated the use of continuous satellite and reanalysis products. A prior validation study conducted by [23] and summarized in [1] compared five gridded rainfall datasets (MSWEP, CHIRPS, ERA5, PERSIANN-CDR, and GPM-IMERG) against available reference rain gauge data. The evaluation employed several statistical performance indicators, including the Pearson Correlation Coefficient, Root Mean Square Error (RMSE), and Bias. The results demonstrated that:
- The MSWEP V2 dataset performed best in capturing the overall rainfall regime of the Greater Antilles, achieving the highest scores across most statistical tests.
- The ERA5 product showed superior skill in reproducing dry and wet day frequency and was considered highly reliable for temperature-related variables.
Consequently, we use MSWEP V2 for all precipitation-related indices, ensuring the most accurate representation of rainfall variability, and ERA5 for temperature data, which has been widely validated as a robust reanalysis product within the scientific community. Several recent evaluations show that reanalysis datasets such as ERA5 and MSWEP effectively reproduce regional climatic characteristics despite the low density of stations in the Caribbean, although biases persist in topographically complex areas [24,25]. This combination provides the strongest possible data foundation for analyzing long-term climate trends over our study period.
2.3. Methodology
We utilized the Climate Data Operators (CDO) software (version 2.4.4) [26] to assess changes in extreme weather events and to calculate a subset of 12 standardized climate indices. These 12 indices were selected because they are relevant to the Caribbean and adjacent regions [7] (see Table 2 for a full description). Among these indices, six pertain to precipitation and six to temperature, providing a comprehensive analysis of both climatic parameters.
Table 2.
Temperature and precipitation indices.
The indices were calculated from daily rainfall data as well as minimum and maximum temperature datasets. CDO was chosen for its effectiveness in processing and handling large amounts of climate data [26]. The indices were computed on an annual basis for each grid cell covering Haiti. For percentile-based indices (WSDI, TX90p, and TN90p), a climatological reference period of 1981–2010 was used [27]. The mean temperature (Tmean) reflects the average temperature, combining both daily maximum and minimum values, while the mean maximum temperature (TXmean) focuses on the average of daily highs, and the mean minimum temperature (TNmean) emphasizes the average of daily lows. The analysis of extreme temperature events from 1981 to 2020 focuses on three key indices that reveal important trends in the context of climate change. The WSDI measures the annual count of days with at least 6 consecutive days when TX exceeds the 90th percentile. The TX90p tracks the proportion of days where maximum temperatures exceed the 90th percentile, while the TN90p captures the proportion of nights with minimum temperatures above the 90th percentile. Together, these indices provide a comprehensive view of the intensification and frequency of extreme temperature events, shedding light on the warming trends and their potential impacts on ecosystems and human activities.
The trends in average rainfall event indices from 1981 to 2020 provide valuable insights into precipitation patterns in Haiti. The total annual precipitation (PRCPTOT) represents the sum of all rainfall events, while the RR1 reflects the frequency of days with at least 1 mm of precipitation. The Simple Daily Intensity Index (SDII), on the other hand, measures the average intensity of rainfall during wet days.
The R90p index represents the percentage of days with extreme precipitation, defined as rainfall totals exceeding the 90th percentile of the reference period. This index quantifies changes in the frequency and intensity of the heaviest rainfall events. The Consecutive Wet Days (CWD) index measures the longest annual period of consecutive days with precipitation equal to or greater than a given threshold (typically 1 mm). It serves as an indicator of the duration of wet spells and is crucial for assessing flood risks and the stability of water supply for agriculture. Conversely, the Consecutive Dry Days (CDD) index measures the longest annual period of consecutive days with insignificant precipitation (typically less than 1 mm). This index is a key indicator of meteorological drought, essential for evaluating risks of water scarcity and potential impacts on agricultural sustainability.
Once the indices were calculated, we employed the R programming language for statistical analyses and visualization. For each grid cell and each city, annual time series were extracted for the period 1981–2020. In addition to the 14 selected cities (see Table 1), we computed a national reference series for Haiti by averaging all grid cells included within the national boundary (spatial mask). This produced 15 distinct time series per index. For each of the 14 cities of interest (Table 1), the annual index time series was extracted using nearest-neighbor selection on the 0.1° grid. For coastal cities whose geographic coordinates fall on ocean cells, the nearest terrestrial land cell with a valid ETCCDI value was used, computed as the pixel minimizing the great-circle distance to the city centroid within the land mask (Haiti national shapefile). The complete city-level annual time series for each index are provided in Appendix A (Figure A1, Figure A2, Figure A3, Figure A4, Figure A5, Figure A6, Figure A7, Figure A8, Figure A9, Figure A10, Figure A11 and Figure A12) and Appendix B (Figure A13 and Figure A14), and the city-to-pixel distances are listed in Appendix C (Table A1). Additional tables and gridded datasets are available in the Supplementary Materials (Tables S1–S3 and Datasets S1–S3).
To quantify long-term changes, we applied the Theil–Sen trend estimator [28], a non-parametric method recommended for climate and hydroclimatic trend analysis due to its robustness to outliers and non-Gaussian distributions. The Sen slope was calculated for each location and then multiplied by 10 to express the trend in units per decade. This approach allows for coverage of a range of values from minimums to maximums, thus offering a robust representation of the region’s climatology.
Before applying the Mann–Kendall test, we addressed the influence of autocorrelation, which can distort the test statistic by inflating the variance of S and potentially leading to false trend detection [29]. To overcome this issue, we applied the Trend-Free Prewhitening (TFPW) technique [30], which removes lag-1 autocorrelation without altering the underlying trend. The TFPW method consists of (i) estimating the Theil–Sen slope, (ii) detrending the series, (iii) computing the lag-1 autocorrelation on the detrended residuals, (iv) prewhitening the series using the autocorrelation coefficient, and (v) reintroducing the trend. This prewhitened series is then used for performing the Mann–Kendall test.
The non-parametric Mann–Kendall test was employed to identify the presence of monotonic trends in the TFPW-adjusted series [31,32]. This test is widely recommended, particularly by the World Meteorological Organization [33,34], for detecting the presence or absence of a monotonic trend in a time series, without requiring any assumptions about the data distribution [35]. It is especially suitable when the series does not exhibit significant autocorrelation [35].
The test is based on the computation of the S statistic, which represents the sum of the signs of all differences between data point pairs in the series. Given a time series x1, x2, …, xn, the S statistic is defined as follows [29]:
where the sign function is defined by:
When the number of observations n ≥ 8, the S statistic is approximately normally distributed with a mean of zero and a variance given by:
where ti represents the number of tied values (i.e., identical values) of extent i in the series.
The standardized statistic ZMK is then calculated as:
This statistic follows the standard normal distribution with a mean of 0 and a variance of 1. It is used to test the null hypothesis H0, which states that no trend exists in the series. If the absolute value of ZMK exceeds the critical value Zα/2 (e.g., 1.96 for a 5% significance level), the null hypothesis is rejected, indicating a statistically significant trend [36].
The sign of ZMK indicates the direction of the trend: a positive value suggests an increasing trend, whereas a negative value indicates a decreasing trend.
Additionally, a linear regression analysis was performed over the 1981–2020 period to estimate the temporal slope of the series. The statistical significance of this slope was assessed using the Mann–Kendall rank test. A trend is considered significant if the p-value associated with the regression slope is less than 0.05; otherwise, it is considered non-significant.
The results were visualized by calculating the average temporal evolution of the indices within Haiti during the study period 1981–2020. Time series were created to take a closer look at certain cities in Haiti to better understand the evolution of the indices at the city level (see Figure 1).
To investigate the role of atmospheric humidity in the observed warming, we additionally used monthly means of 2 m temperature and 2 m dew point temperature from the ERA5-Land reanalysis [21], available at a spatial resolution of 0.1° for the period 1981–2020 through the Copernicus Climate Data Store. Near-surface water vapor pressure (e) and relative humidity (RH) were derived from these two variables using the improved Magnus approximation of the saturation vapor pressure [37] and annual means were computed for each grid cell. The annual humidity series was then processed exactly like the other indices: trend magnitudes were quantified with the Theil–Sen estimator (expressed per decade), and their statistical significance was assessed with the Mann–Kendall test after Trend-Free Prewhitening (p < 0.05). To control for the inflated false-discovery rate that arises from applying the Mann–Kendall test to N ≈ 1900 individual grid cells with strong spatial autocorrelation, we further apply the [38] procedure at α_FDR = 0.10, as recommended for gridded climate trend maps by Wilks (2016) [39].
3. Results
3.1. Trends of Mean and Extreme Annual Temperature Events
3.1.1. Trends in Mean Temperature Indices (1981–2020)
The trends in mean temperature indices from 1981 to 2020 reveal significant insights into the overall warming patterns in Haiti. All three indices consistently show statistically significant upward trends over the study period, indicating a general increase in temperature across the country.
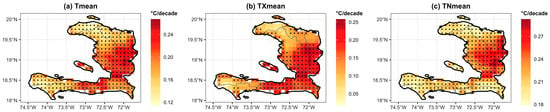
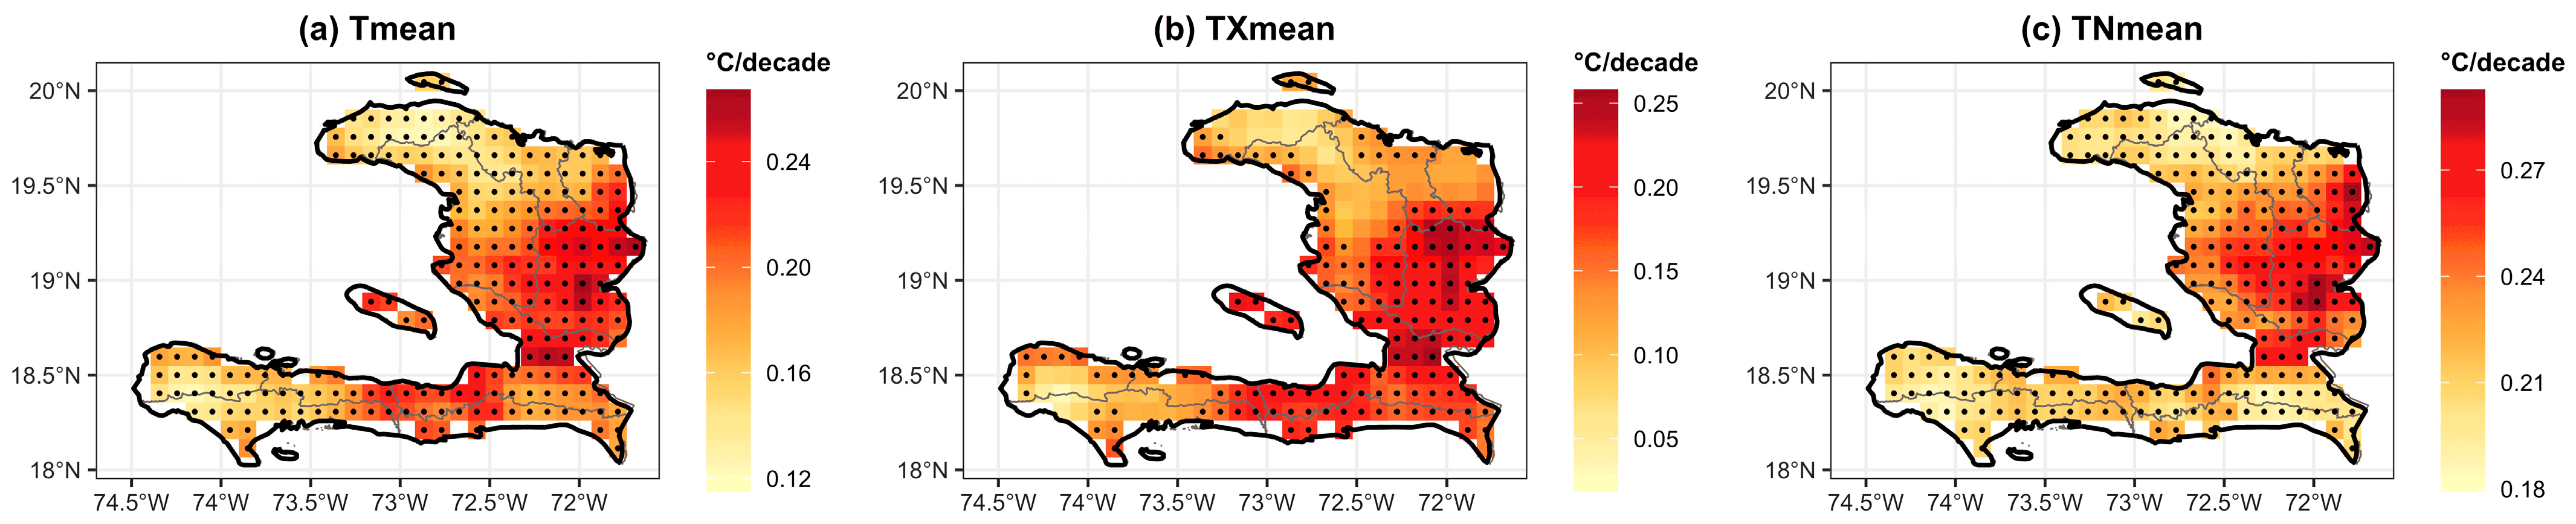
The results show that global warming has led to a significant increase in both average minimum and maximum temperatures across Haiti between 1981 and 2020; see Figure 2. Similarly, the graph depicting the trends in Tmean highlights a marked rise in specific areas of Haiti. The highest values of this increase are primarily concentrated in regions located in the central and eastern parts of the country, as shown in Figure 2a. These variations reflect significant changes in Tmean, potentially indicating a localized global warming trend.
Figure 2.
Trends per decade in mean temperature indices (Tmean, TXmean, TNmean) over Haiti for 1981–2020, based on ERA5-Land. Warm colors indicate positive trends. Black dots indicate grid cells passing both the local MK-TFPW test (p < 0.05) and the field-wide [38] False Discovery Rate correction (α_FDR = 0.10; [39]).
In Hinche, the results indicate a pronounced increase of +0.23 °C per decade, with a p-value < 0.001. In Les Cayes, the Tmean is increasing at a slightly slower rate, with a trend of +0.16 °C per decade, though this trend remains significant. Overall, the Tmean across Haiti shows a significant trend of +0.20 °C per decade.
In the region of Anse-à-Pitres Figure A1 shows an upward trend in annual average temperature, with an estimated increase of +0.19 °C per decade. This trend is statistically significant. Similarly, a comparable increase is observed in Cap-Haitien, with a trend of +0.17 °C per decade, which is also statistically significant; see Table 3.
Looking at Figure 2b,c, the areas where this trend is most pronounced correspond to those already identified for Tmean, suggesting a uniformity in the climatic changes affecting maximum temperatures.
A closer examination of specific cities such as Mole St. Nicolas, Mirebalais, Cap-Haitien, Les Gonaives, Hinche, Port-au-Prince, Jacmel, Jérémie, Les Cayes, Miragoâne, and Verrettes reveals that the TXmean shows a statistically significant increasing trend. For instance, Hinche exhibits a trend of +0.23 °C per decade, compared to the north, where Cap-Haitien shows a trend of +0.14 °C per decade, and the south, where Les Cayes records a trend of +0.14 °C per decade; see Table 3.
For TNmean, an increase is noticeable. However, this rise appears more concentrated in the northern and southeastern parts of the country. TNmean is rising significantly in all the cities studied. In Cayes, an increase of +0.21 °C per decade is recorded, close to that of Jacmel (+0.21 °C, p-value < 0.001). Port-au-Prince shows a rise of +0.23 °C per decade, while Hinche records the strongest trend with +0.28 °C per decade. These results highlight a significant increase in nighttime temperatures across the country, with particularly warm nights observed in Hinche and in the cities around it, like Mirebalais and Verrettes, with the respective trend increases of 0.25 and 0.26 °C per decade; see Table 3.
3.1.2. Trends in the Index of Extreme Temperature Events (1981–2020)
The WSDI shows an increase in the duration of heatwaves in certain parts of Haiti, particularly in the south-central regions; see Figure 3a. The duration of heatwaves has increased significantly in several cities. In Les Cayes, a rise of about 3 days per decade is observed, while in Miragoâne the trend is even stronger, reaching 4 days per decade. Comparable increases are recorded in Jacmel (6), Mole St. Nicolas (2), and Hinche (3) days per decade, all statistically significant. These results indicate a notable intensification of extreme heat periods, especially in Miragoâne, Les Cayes, and Jacmel; see Table 3.
Figure 3.
Trends per decade in extreme temperature indices (WSDI, TX90p, TN90p) over Haiti for 1981–2020, based on ERA5-Land. Warm colors indicate positive trends. Black dots indicate grid cells passing both the local MK-TFPW test (p < 0.05) and the field-wide [38] False Discovery Rate correction (α_FDR = 0.10; [39]).
The TX90p index shows significant increases in the southeastern, central, and southern regions of the country, reflecting a growing frequency of very hot days and indicating an increased risk of temperature-related extremes, particularly heat stress events; see Figure 3b. The percentage of days with extreme maximum temperatures is rising across most cities. The trend reaches +4.82% (18 days) per decade in Jacmel and +5.37% (20 days) per decade in Miragoâne. Cap-Haitien and Jérémie also show marked increases of +4.39% (16 days) and +5.57% (20 days), respectively, all significant. This reflects a growing frequency of exceptionally hot days; see Table 3.
The TN90p index, in Figure 3c, corresponding to the percentage of exceptionally warm nights, follows a similar trend to TX90p, with notable increases in the southeastern and south-central areas Miragoane records the strongest trend at +8.02% (29 days) per decade, followed by Mole St. Nicolas (+7.31%, 27 days) and Les Gonaives (+7.04%, 26 days). Les Cayes and Jacmel show respective increases of +6.98% (25 days) and +6.56% (24 days) per decade; see Table 3. These trends highlight a significant warming of extreme nighttime temperatures.
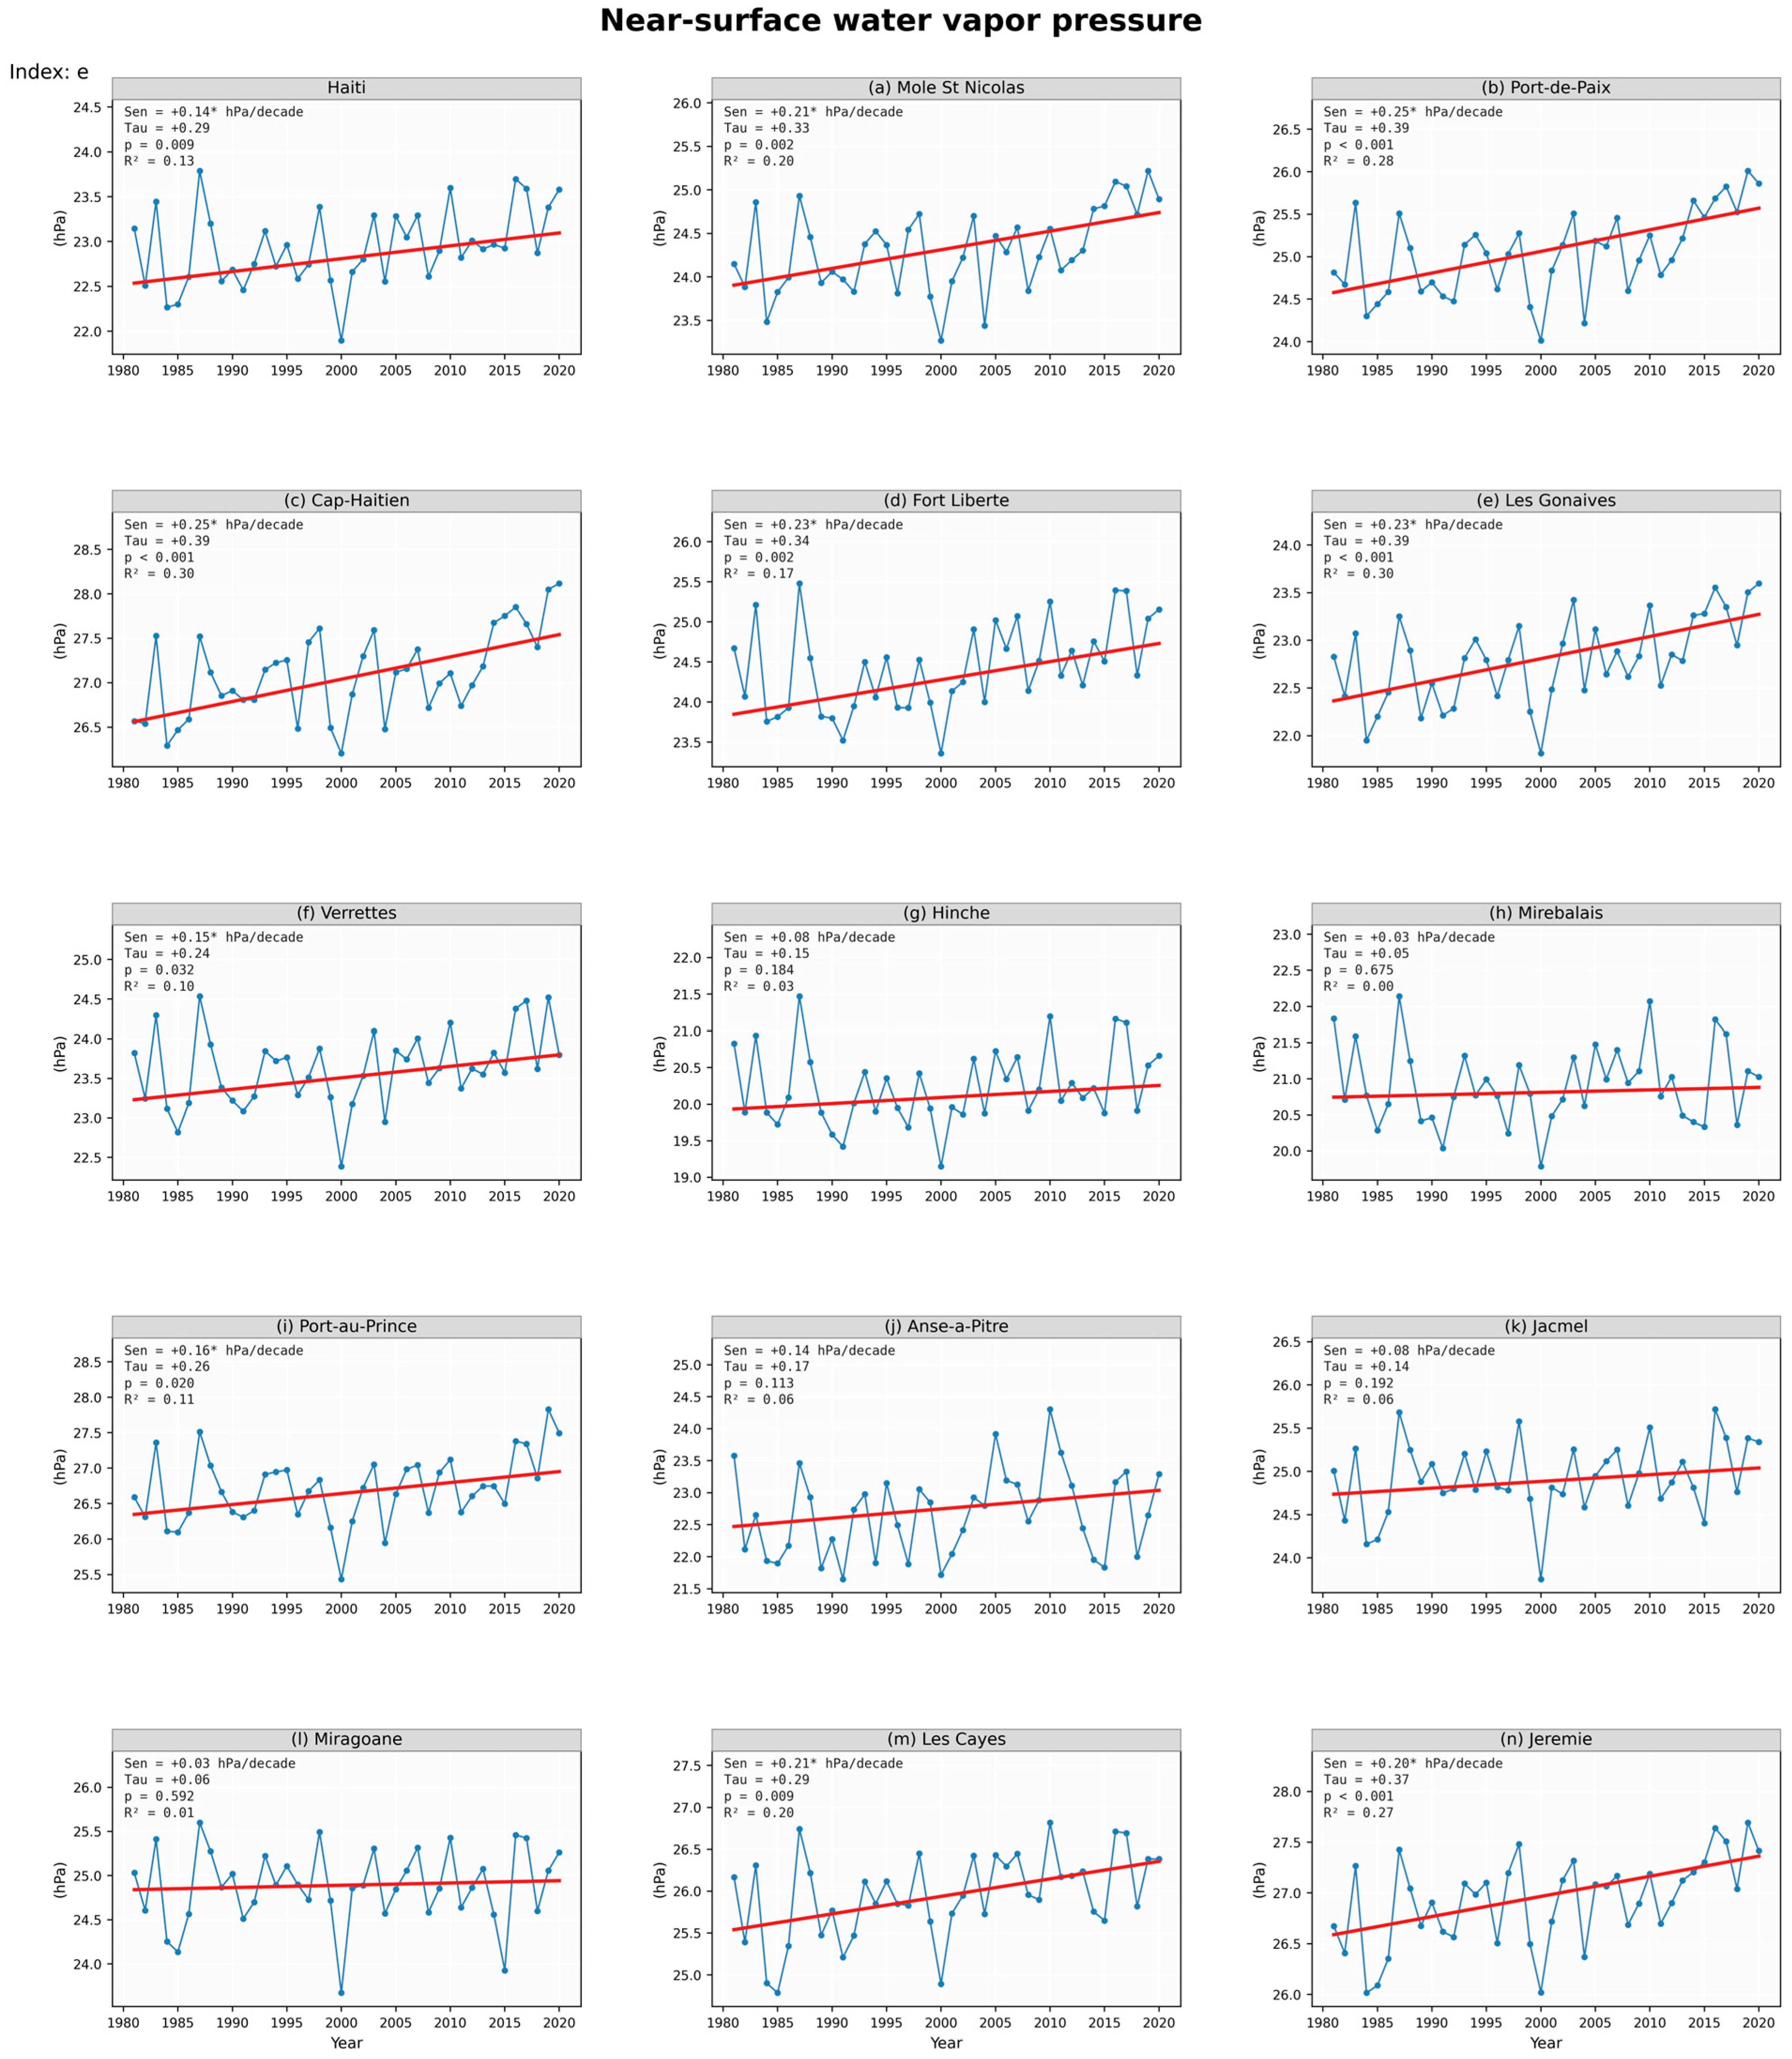
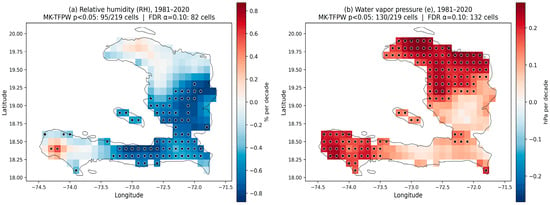
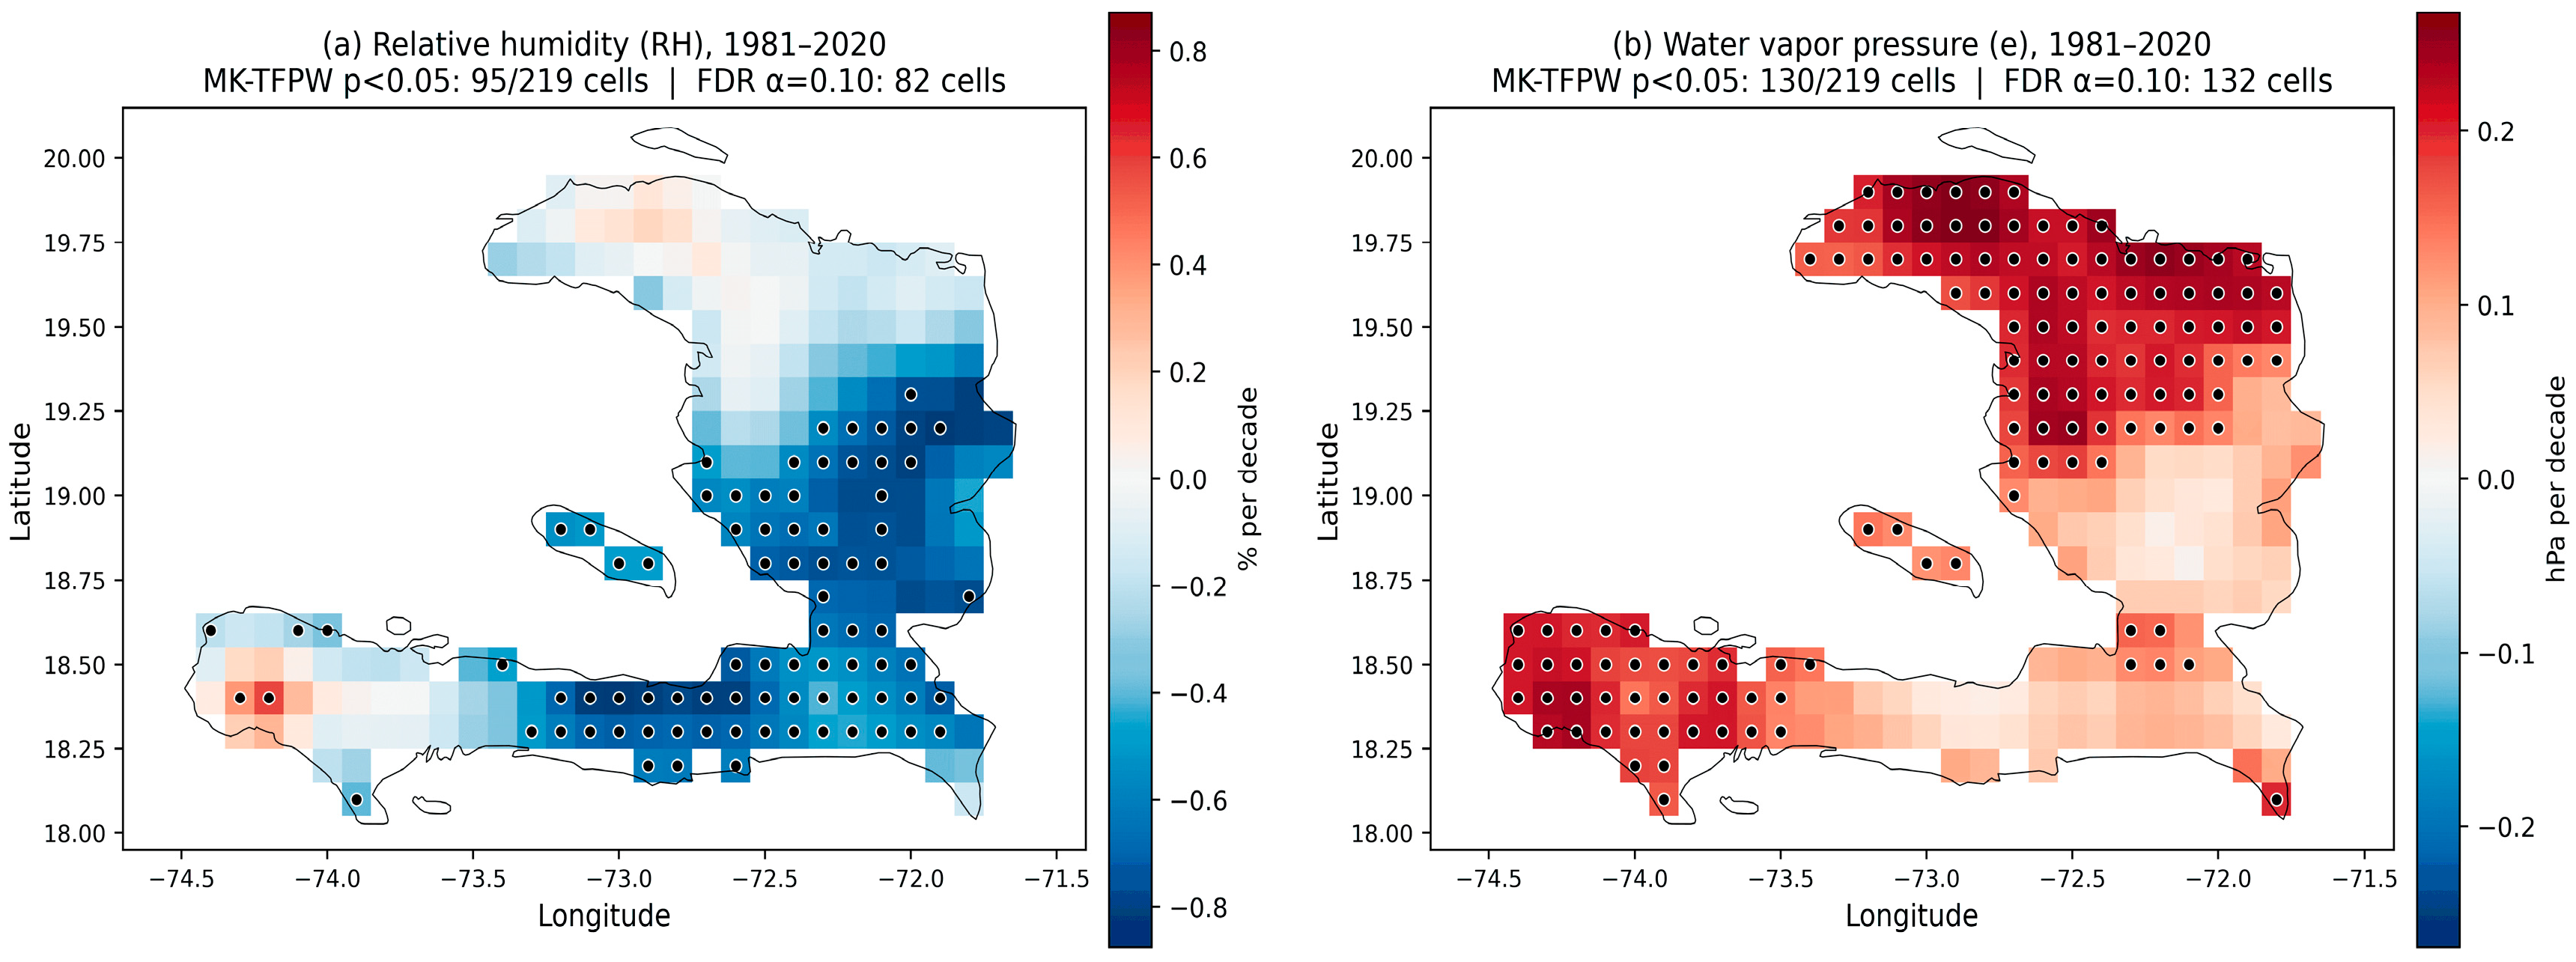
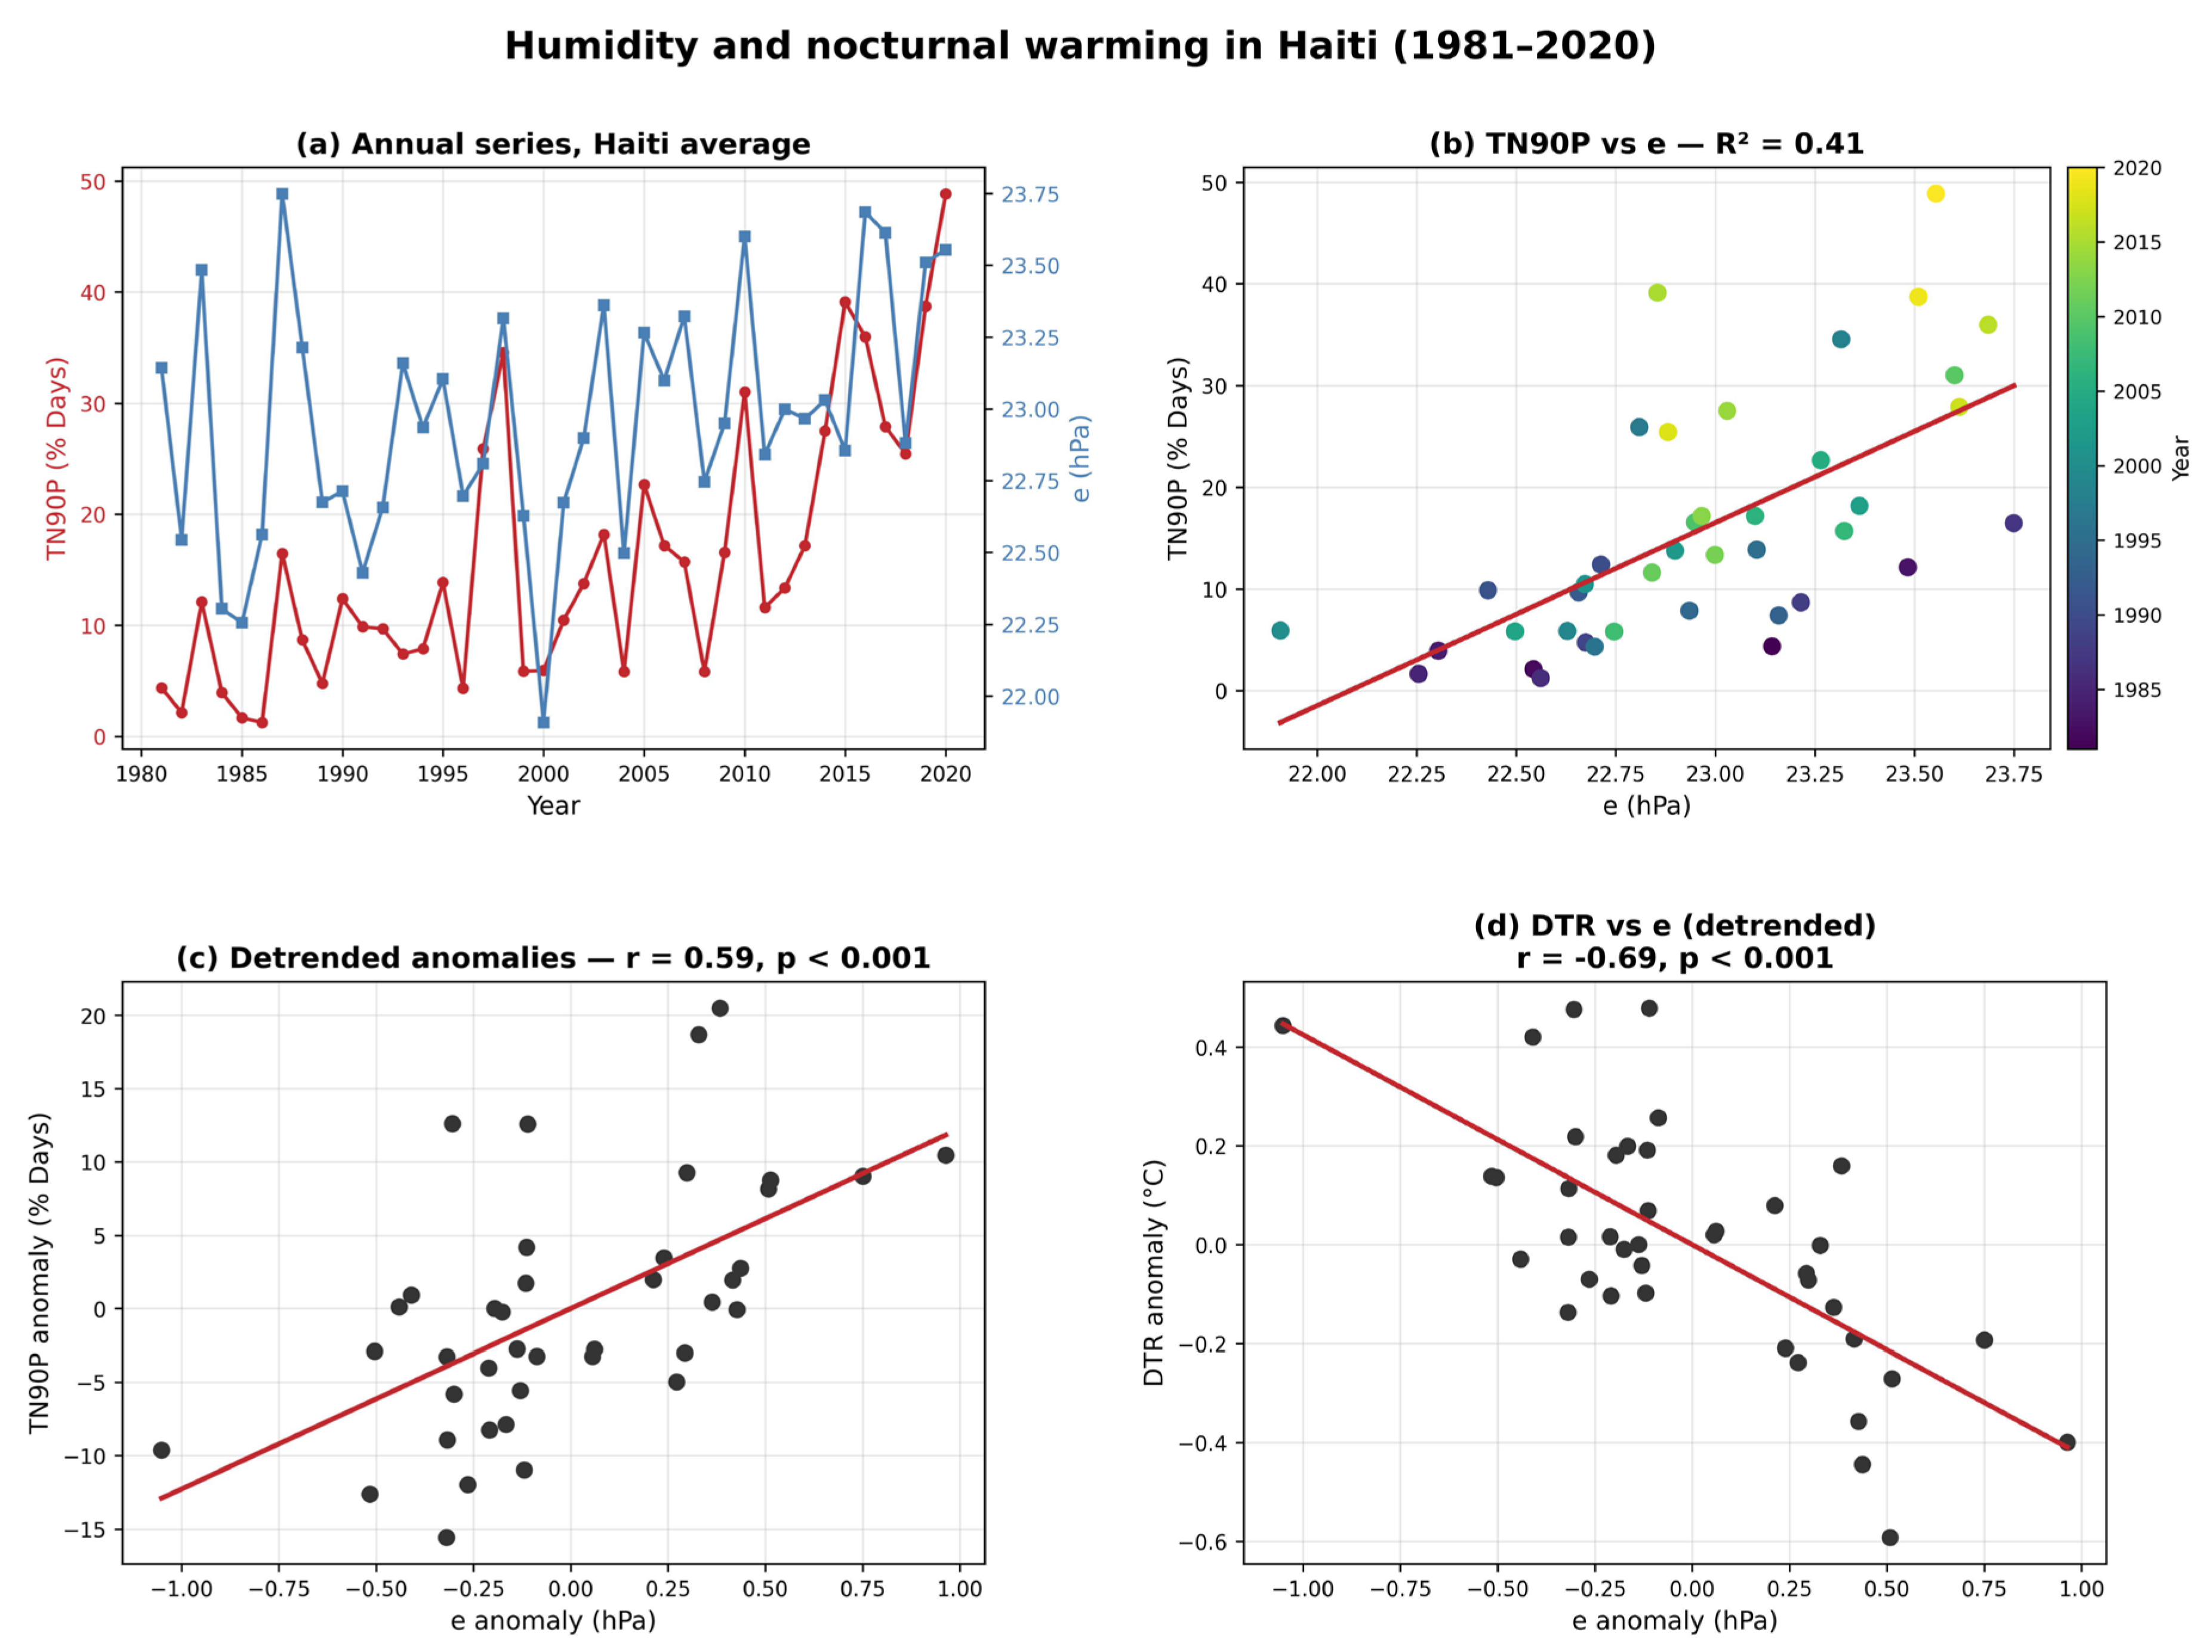
The humidity analysis reveals two complementary signals; see Figure 4. Their temporal co-variation with nocturnal warming is examined in Figure 5. Near-surface water vapor pressure increased almost everywhere over Haiti between 1981 and 2020 (+0.15 hPa per decade for the national average), with grid-cell trends ranging from +0.05 to +0.27 hPa per decade and statistically significant trends (p < 0.05) over about 76% of the territory. The strongest moistening is found along the northern coast and the Grand’Anse peninsula, with city-scale trends of +0.25 hPa per decade at Port-de-Paix and Cap-Haïtien. In contrast, relative humidity remained stable or declined, with significant decreases in interior and southern cities such as Miragoâne (−0.82% per decade), Mirebalais (−0.75% per decade), Jacmel (−0.60% per decade), and Port-au-Prince (−0.51% per decade). This combination of increasing absolute moisture and decreasing relative humidity indicates that land is warming outpaced by the moisture supply, a pattern consistent with regional assessments [40].
Figure 4.
Trends in annual mean relative humidity (RH, (a), % per decade) and water vapor pressure (e, (b), hPa per decade) over Haiti for 1981–2020 (ERA5-Land; Sen’s slope, Mann–Kendall TFPW). Relative humidity declines over the interior lowlands while absolute moisture increases almost everywhere, most strongly along the northern coast and the Grand’Anse peninsula. Black dots indicate grid cells with statistically significant trends (p < 0.05, Mann–Kendall TFPW) and the field-wide [38] False Discovery Rate correction (α_FDR = 0.10; [39]).
Figure 5.
Surface humidity and nocturnal warming in Haiti (1981–2020): (a) annual national series of TN90p and vapor pressure e; (b) TN90p versus e; (c) detrended anomalies of TN90p versus e (r = 0.59, p < 0.001); (d) detrended anomalies of the diurnal temperature range versus e (r = −0.69, p < 0.001).
3.2. Trends of Average and Extreme Annual and Seasonal Precipitation Events
3.2.1. Trends in Average Rainfall Event Indices (1981–2020)
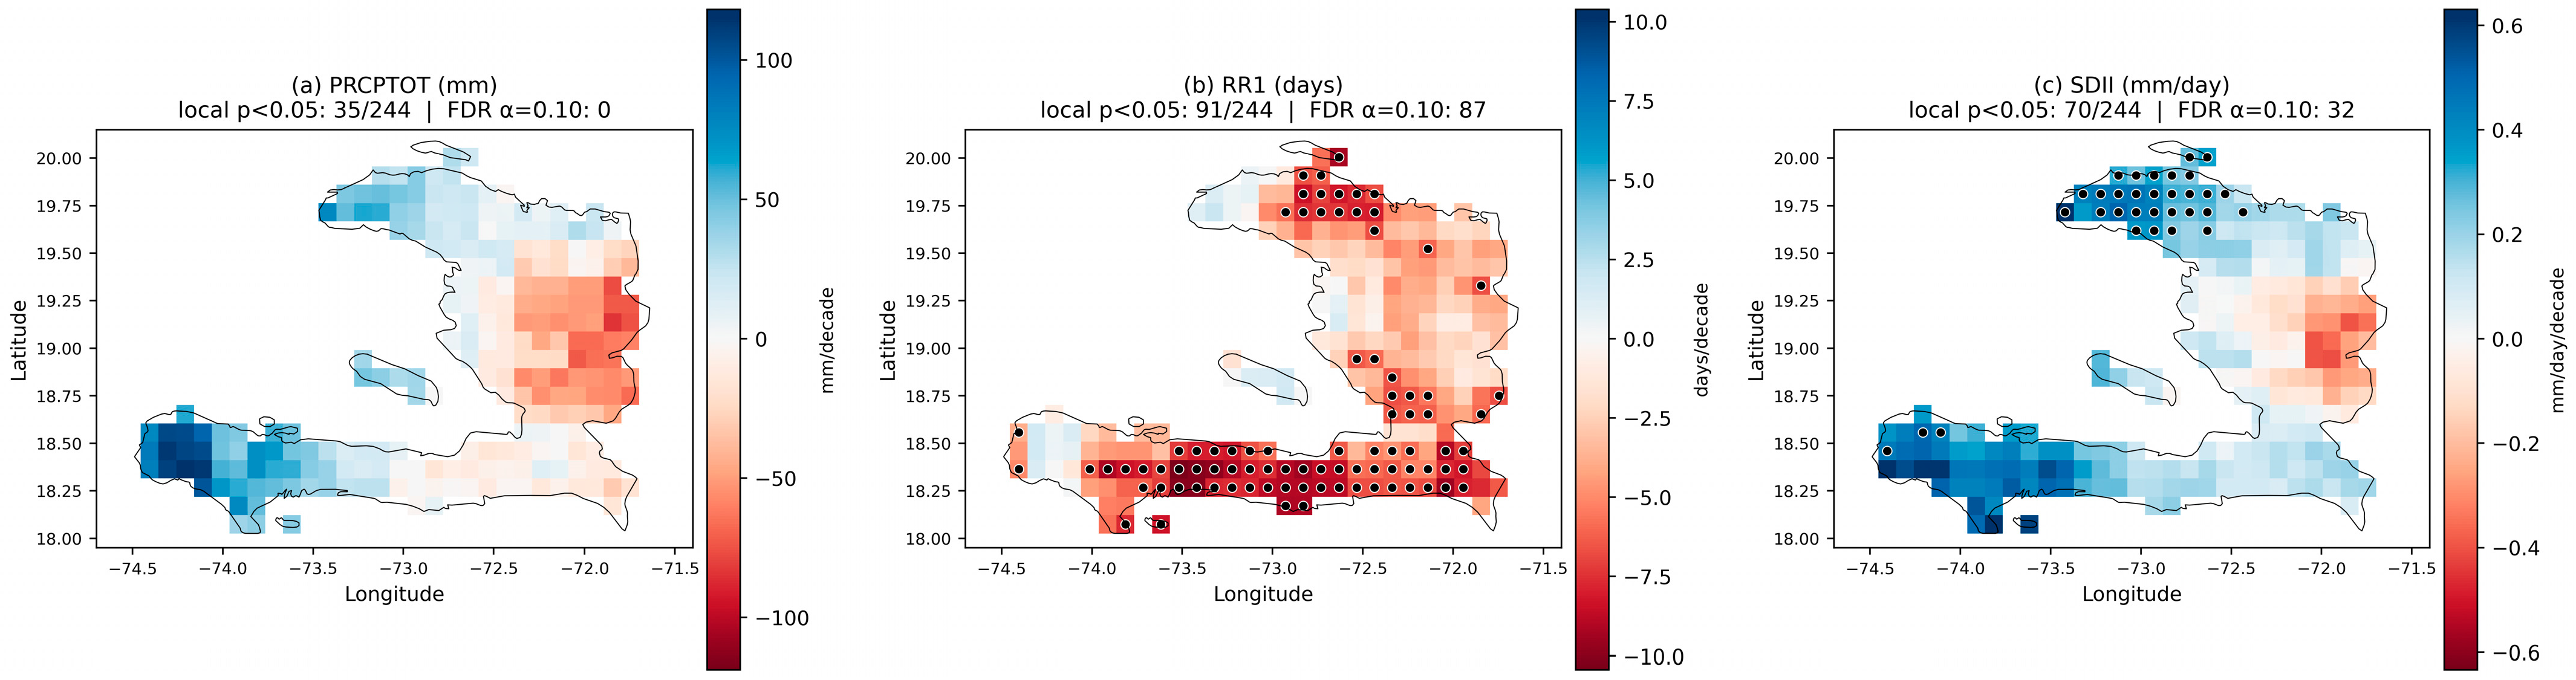
Figure 6a illustrates the trends per decade for PRCPTOT. The central part of the country exhibits declining trends, while the southeastern region of Haiti shows no clear or consistent trend. In contrast, other areas display positive trends. However, for all periods considered, these trends are not statistically significant, except for Hinche and Môle St. Nicolas. The PRCPTOT index reveals a decrease in the central regions of the country that is locally significant (p < 0.05, MK-TFPW), although no grid cell passes the field-wide False Discovery Rate correction [38], α_FDR = 0.10; [39]. These trends should therefore be interpreted as suggestive rather than field-significant, while some southern areas show slight increases. Among the cities studied, trends in total annual precipitation vary. However, one place shows increasing and highly significant trends, such as Mole St. Nicolas (46.31 mm/decade). In Hinche, a decrease of 84.58 mm per decade is observed, and indicates statistical significance. These trends reveal a regional variability in precipitation patterns, with notable declines in certain areas like Hinche; see Table 3.
Figure 6.
Trends per decade in mean precipitation indices (PRCPTOT, RR1, SDII) over Haiti for 1981–2020, based on MSWEP V2. Red = negative trend (drying), blue = positive trend (wetting). Black dots indicate grid cells passing both the local MK-TFPW test (p < 0.05) and the field-wide [38] False Discovery Rate correction (α_FDR = 0.10; [39]).
Figure 6b shows decade-by-decade trends in the RR1. The RR1 index indicates a nationwide decline, particularly in the south. The trends in the RR1 vary across the cities. In Cayes, a decrease of about 6 days per decade is observed, whereas Jacmel shows a decrease of about 7 days per decade. Mirebalais experiences a decrease of about 4 days per decade, and this is statistically significant. In Miragoâne, it is observed with a decrease of 6 days per decade. These variations reflect regional disparities in the frequency of rainy days, with Port-de-Paix showing one of the more pronounced reductions (7 days per decade), which may indicate a shift towards drier seasons in that region; see Table 3.
The SDII shows an increase in some regions, particularly in the northwest and southwest; see Figure 6c. The SDII shows a slight increase in most cities. In Mole St. Nicolas, the trend shows an increase of +0.43 mm/day per decade, while Jérémie experiences a smaller increase of +0.35 mm/day per decade and Port-de-Paix an increase of +0.25 mm/day per decade. Hinche displays a decrease of −0.40 mm/day per decade. All four trends are statistically significant (p < 0.05, MK-TFPW). These results suggest a potential intensification of extreme rainfall events; see Table 3.
3.2.2. Trends in the Index of Extreme Rainfall Events (1981–2020)
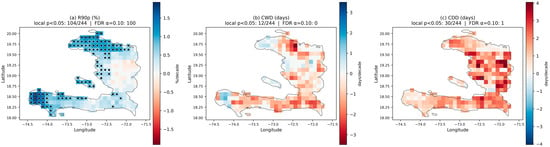
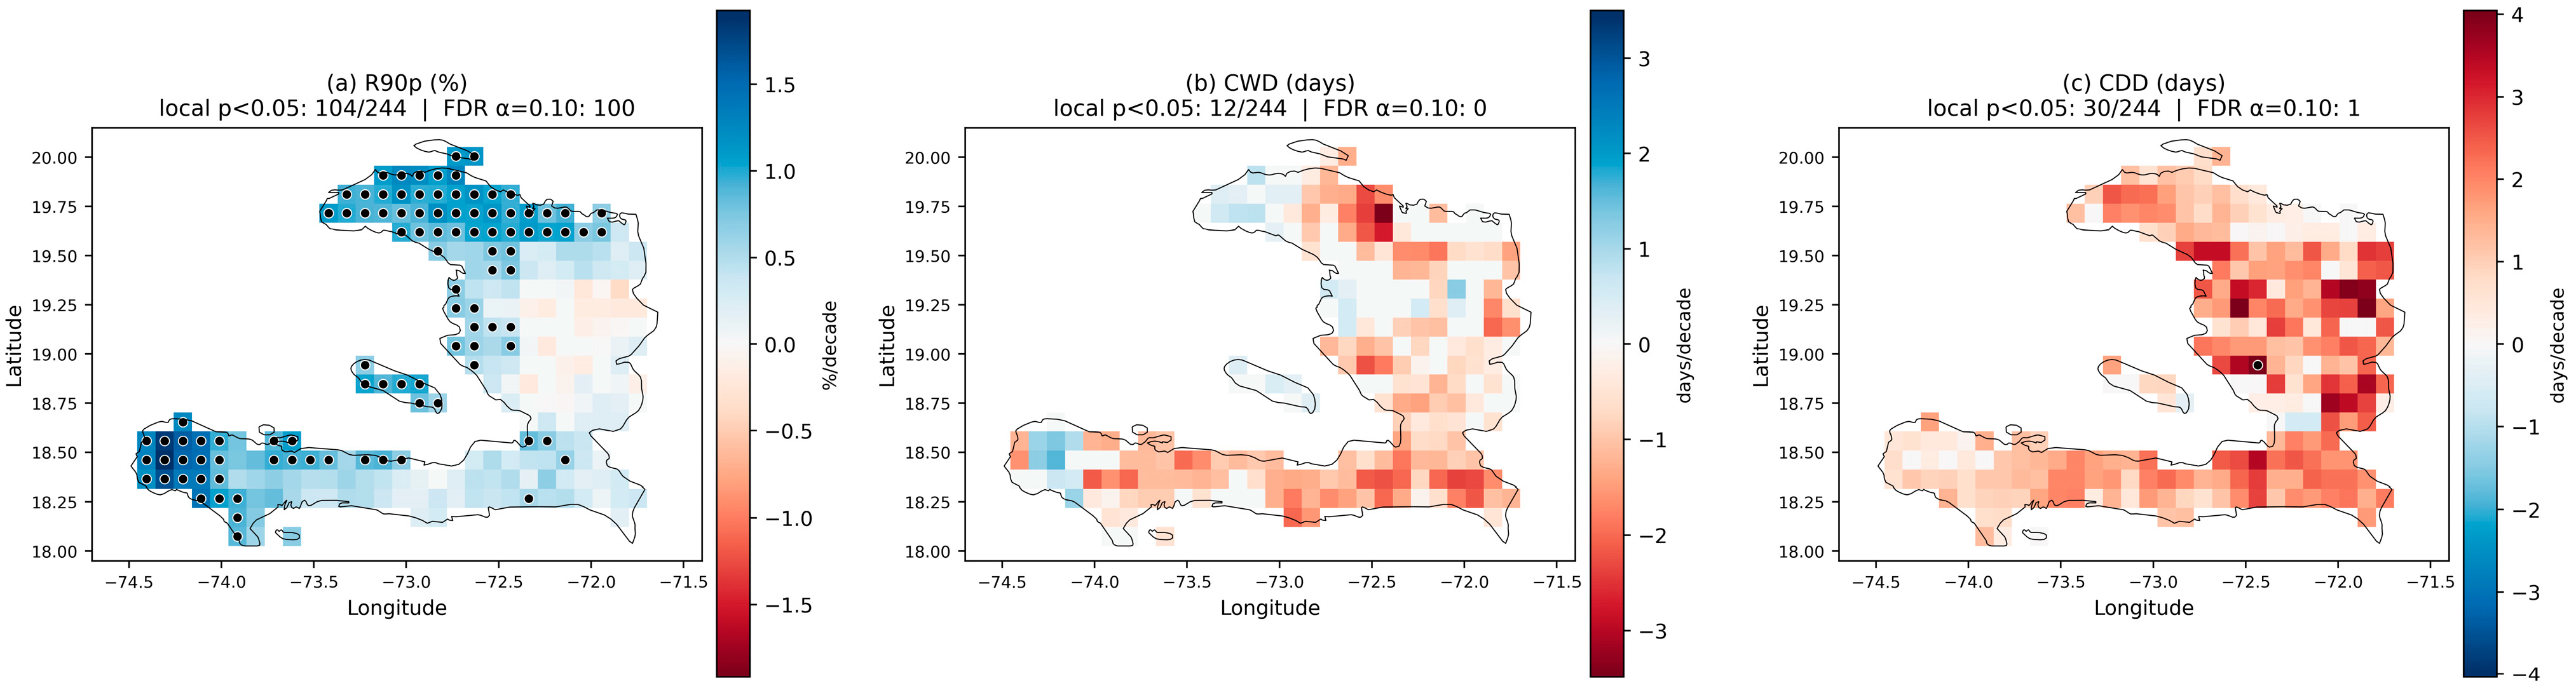
The results presented in Figure 7a indicate that R90p trends are increasing across most regions of Haiti, except for the central plateau, where the trend remains close to zero. The spatial pattern reveals slight but widespread increases in extreme rainfall values, particularly in the northern and southern sectors of the country, suggesting a heterogeneous intensification of heavy precipitation events. At the local scale, several urban areas show statistically significant positive trends. In Môle Saint-Nicolas, R90p increases by +4.96% per decade, while Cap-Haïtien displays a smaller but still significant increase of +2.07% per decade; see Table 3.
Figure 7.
Trends per decade in extreme precipitation indices (R90p, CWD, CDD) over Haiti for 1981–2020, based on MSWEP V2. Red = drying (positive CDD or R90p decrease), blue = wetting. Black dots indicate grid cells passing both the local MK-TFPW test (p < 0.05) and the field-wide [38] False Discovery Rate correction (α_FDR = 0.10; [39]).
Figure 7b illustrates the decade-by-decade trends in CWD in Haiti for the year. The results indicate a generalized decline in consecutive wet days, except for the two westernmost areas and the island of Gonâve, which display upward trends. The CWD index reveals a reduction, particularly in the southeastern regions. Across the studied cities, only Hinche exhibits a locally significant reduction (approximately 2 days per decade, p = 0.02, MK-TFPW), but this signal does not survive the field-wide FDR correction, and no grid cell reaches field significance. In contrast, Port-au-Prince, Jacmel, and the remaining cities show reductions in CWD, but none of these trends reach statistical significance. This suggests that, despite some fluctuations, the duration of wet periods remains generally stable across most urban areas, with only minor regional variations.
Finally, the results in Figure 7c show an increase in the CDD across almost the entire country, but this signal is neither locally significant (only 30 of 244 grid cells reach p < 0.05) nor field-significant after FDR correction (only 1 grid cell survives; α_FDR = 0.10 [39]). This index highlights an extension of dry periods, particularly marked in the south and certain places in the country, further increasing the risk of prolonged droughts. In the studied cities, Jérémie and Miragoâne record an increase of about +2 days per decade, while Anse-à-Pitre shows a more pronounced rise of 4 days per decade, reflecting the greater vulnerability of this region to prolonged dry spells. Port-au-Prince, Cap-Haitien, Hinche, and the other cities show an increase, but not a significant one; see Table 3.
Table 3.
Long-term climatic trends (1981–2020) across Haiti and major urban centers. The table reports Sen’s slope estimates (units per decade) for twelve ETCCDI climate indices, computed for the national spatial mean (Haiti) and 14 representative cities. Trend magnitudes were derived using the Theil–Sen robust estimator, while statistical significance was determined using the autocorrelation-corrected Mann–Kendall test based on the Trend-Free Prewhitening (TFPW) procedure. An asterisk (*) denotes statistical significance at the 5% level. Blue values = significant increase; red values = significant decrease. The field-wide [38] False Discovery Rate correction (α_FDR = 0.10; [39] is applied only to the gridded maps of Figure 2, Figure 3 and Figure 6, not to the point/spatial-mean series reported here. Positive slopes indicate increasing trends over 1981–2020; negative slopes, decreasing trends.
4. Discussion
Maximum annual average temperatures have increased significantly, with a trend of about 0.17 °C per decade in the country and local trends that can vary between 0.06 °C and 0.25 °C per decade. In comparison, minimum annual mean temperatures also showed increases of 0.22 °C/decade annually and local tendencies ranging between 0.18 °C and 0.28 °C each decade. These results followed a significant warming trajectory, consistent with the results observed in the Caribbean region [41], which found trends of 0.06 °C and 0.34 °C per decade for TXmean and TNmean for Barbados and Trinidad and Tobago, ref. [9] has found trends of the order of 0.33 °C and 0.46 °C per decade, respectively, and the regional average TXmean across the Caribbean has a trend of 0.19 °C/decade and TNmean more pronounced at 0.28 °C/decade during the same period, according to [7]. The regional average shows an increase of 4.24 and 7.33 percent (approximately 15 and 27 days) in the frequency of hot days (TX90P) and hot nights (TN90P), respectively, per decade, whereas the frequency of cool days (TX10P) was reduced by only 1.80 and 2.55 percent for each decade [7]. Our results also indicate a predominance of night warming over day warming, with warm day and night trends of 3.24% and 5.55% (about 12 and 20 days) per decade, respectively. There is also a positive correlation between hot days and nights, as in studies on global temperature change [42]. Our results are consistent with observed global and regional warming patterns, as highlighted by previous studies [9]; see Table 4. The warming trends identified in Haiti are in line with regional analyses that highlight an increase in extreme thermal indices in the Caribbean [40,43].
Table 4.
Summary of results observed in Haiti and certain regions of the Caribbean.
The 0.1° (~11 km) native resolution of ERA5-Land and MSWEP is coarser than the horizontal scale of Haiti’s mountainous relief (Massif de la Selle, Massif de la Hotte and Chaîne des Matheux, all peaking above 2000 m within 20–30 km horizontal distance). At this resolution, one grid cell often mixes summit and valley conditions, producing a systematic warm bias at high altitudes (typically 1–2 °C; see [23] for the Caribbean) and a smoothing of orographic rainfall gradients. Validation against the Haitian station network of the SIMBI database [1] (24 catchments) shows that ERA5-Land captures the annual cycle and interannual variability well (r > 0.85 for monthly T; r > 0.70 for monthly p) but underestimates extreme daily rainfall by 20–35% on the windward slopes. The trends reported here should therefore be interpreted at the regional (departmental) scale rather than at individual grid cells, and city-level results near steep topography (Hinche, Mirebalais) carry higher uncertainty than coastal cities.
This city-level analysis provides a first spatially explicit baseline of exposure to changing temperature and humidity extremes for the ten Haitian departments, on which future dedicated vulnerability studies can build. Because warmer, more humid nights raise the demand for cooling and the risk of night-time heat stress [14], and because the largest TN90p trends are located in Nippes (Miragoane +8.0%/dec.), the North-West (Môle-Saint-Nicolas +7.3%/dec.), the Artibonite (Gonaïves +7.0%/dec.) and the South (Les Cayes +7.0%/dec.)—departments where access to electricity is among the most limited in Haiti—the trends reported here identify these regions as priority areas for future studies on climate-related energy and health vulnerability. Formal exposure/vulnerability assessments, which require detailed demographic and infrastructure data beyond the scope of this study, are the subject of a follow-up article.
The predominance of nocturnal over diurnal warming can be physically explained by the concurrent moistening of the near-surface atmosphere; see Figure 5. Water vapor is the main greenhouse absorber controlling downwelling longwave radiation at night: an increase in atmospheric moisture reduces nocturnal surface cooling and narrows the diurnal temperature range [13,14]. Over Haiti, after removing the long-term trends, the interannual variability of the annual mean vapor pressure remains strongly correlated with TN90p (r = 0.59, p < 0.001) and TNmean (r = 0.68, p < 0.001) and anticorrelated with the diurnal temperature range (r = −0.69, p < 0.001), whereas no relationship is found with TX90p (r = 0.07, not significant). When the influence of daytime warming is controlled for, the partial correlation between TN90p and vapor pressure reaches r = 0.80 (p < 0.001). These results identify the water-vapor greenhouse effect as a key driver of the faster warming of nights than days in Haiti. The observed moistening is consistent with the sustained warming of the surrounding Caribbean Sea, which enhances evaporation and the transfer of heat and moisture to the atmosphere [44], while the concurrent decline of relative humidity has also been documented at the regional scale [40].
Results over the study period reveal no field-significant trend in PRCPTOT after [38] False Discovery Rate correction (α_FDR = 0.10 [39]), either at the national scale or across the country as a whole; only a few isolated grid cells (mainly in the central plateau) show a locally significant decrease at p < 0.05 (MK-TFPW). Similarly, no significant increase in SDII was observed. The spatial variability of PRCPTOT observed across Haiti does not exhibit a coherent or systematic regional signal. This result is consistent with previous studies, which highlight the dominance of strong natural variability in precipitation over interannual to decadal timescales in the Caribbean region [7,45,46].
Our results indicate a rising tendency and intensification of drought episodes in Haiti. Although this trend is not statistically significant at the national scale, the spatial analysis reveals more pronounced and statistically significant signals in specific areas, particularly in the South-East and the Northern regions of the country. This evolution is broadly consistent with the findings of [7,20], who reported an increase in CDD across the Caribbean region.
It is essential to recognize the limitations of our study, particularly regarding precipitation, which is derived from reanalysis and merged products that are fundamentally model-based rather than direct observations. In regions such as Haiti, where the density of long-term in situ rain gauge observations is limited, precipitation estimates rely heavily on numerical models and satellite retrievals, introducing additional uncertainties.
Another important limitation arises from the highly complex and mountainous topography of Haiti, which remains difficult to represent accurately using gridded datasets. Products such as ERA5-Land and MSWEP, with a spatial resolution of about 11 km, inevitably smooth sharp spatial gradients in rainfall and temperature. This smoothing may lead to an underestimation of precipitation on windward slopes, especially in the Massif de la Selle and the Massif de la Hotte, and an overestimation in rain-shadow regions such as the Cul-de-Sac plain or the Gonaïves area. These potential biases are consistent with recent findings showing strong spatial heterogeneity in rainfall across Haiti [1]. Nevertheless, validation studies [1,23] indicate that MSWEP remains among the most reliable datasets for regional-scale rainfall analyses in the absence of a dense and continuous network of meteorological stations. This reinforces the relevance of the datasets used in this study while underscoring the need to strengthen Haiti’s observational capacity to improve future climate assessments. In summary, reanalysis datasets provide an essential foundation for climate trend analysis in Haiti, but their use must be accompanied by a critical understanding of their limitations, particularly the smoothing of orographic rainfall patterns and the sensitivity of accuracy to observational density consistent with the conclusions of [24,25].
5. Conclusions
This study aims to detect and quantify potentially significant linear trends in Haiti’s climate over the period 1981–2020, with a particular focus on annual variations in mean and extreme temperature and precipitation indices. Climate indices were computed using CDO, and long-term tendencies were assessed using the non-parametric Mann–Kendall test. To ensure reliability in the presence of serial autocorrelation, frequent in hydroclimatic time series, trend estimation was improved by applying Sen’s slope estimator for magnitude assessment and a Trend-Free Pre-Whitening (TFPW) approach to reduce the influence of persistence in the data.
In the absence of dense, continuous, and homogeneous in situ observations, this work relies on ERA5 reanalysis for temperature and MSWEP V2 for precipitation, both selected for their high spatial resolution and demonstrated skill in the Caribbean region. Annual values were extracted for each index, and decadal-scale tendencies were also explored to capture the temporal structure of climatic change and evaluate potential accelerations or regime shifts throughout the 40-year analysis window. The results of this study provide important insights into the progression of moderate and extreme weather events in Haiti over the past four decades.
Overall, all temperature indices (mean, maximum, and minimum) show significant increases, accompanied by more frequent warm spells and higher occurrences of extreme temperatures. These robust and spatially coherent warming trends indicate that temperature-related indices in Haiti have clearly emerged from the background of natural climate variability, reflecting a dominant anthropogenic forcing rather than internal climate variability alone. This interpretation is consistent with the IPCC Sixth Assessment Report, which shows that observed temperature increases and heat extremes have emerged from natural variability at both global and regional scales since the mid-20th century [4]. These changes are consistent with global warming trends and highlight the need for climate adaptation measures in Haiti. In particular, the predominance of nocturnal warming is physically consistent with the observed increase in near-surface water vapor (+0.15 hPa per decade), which strengthens the nighttime greenhouse effect and narrows the diurnal temperature range.
While total rainfall does not show significant long-term trends, the reduction in wet days and consecutive wet periods, combined with an increase in extreme rainfall events (R90p) and consecutive dry days, underscores the growing pressure on key sectors such as agriculture, water supply, and public health. The absence of statistically significant trends in total precipitation is consistent with the strong role of natural variability in rainfall, as highlighted by [4] AR6, even in a warming climate. Appropriate adaptation and risk management strategies must be developed to strengthen local communities’ resilience.
It is worth noting that nights have warmed faster than days: minimum temperatures and warm nights (TN90p, Figure A5) rise more steeply than their daytime equivalents. Such a narrowing of the diurnal temperature range is commonly reported under global warming and is usually attributed to higher atmospheric humidity, greater cloud cover, and the enhanced downward longwave flux associated with greenhouse gases [5]; around Port-au-Prince, urban growth may amplify it locally. The drying signal, in contrast, is regional rather than national, with consecutive dry days increasing mainly in the South-East and the North. This pattern is consistent with the strong influence of tropical sea-surface temperatures and ENSO on rainfall over the Greater Antilles [47]. The temperature signal, therefore, appears robust and likely to persist, whereas the rainfall signal remains tied to large-scale modes whose future evolution is more uncertain.
These changes have practical consequences for two sectors critical to Haiti. On the demand side, more frequent hot days, hotter nights, and longer warm spells (Figure A6) increase the need for ventilation, refrigeration, and air conditioning, adding to the load on an electricity system that already fails to meet demand for much of the day; in a humid tropical setting, heat-stress indices such as the wet-bulb globe temperature describe this discomfort and the cooling demand it generates better than air temperature alone [40]. On the supply side, fewer rainy days and longer dry spells lower river discharge and reservoir storage, and with them, the electricity that can be produced at plants such as Péligre, on the Artibonite, a basin that Haiti shares with the Dominican Republic; the parallel increase in very wet days (R90p) adds a risk of flooding and sedimentation for the same infrastructure. The climate that drives cooling demand upward is therefore the same climate that is eroding the hydropower able to meet it, an interaction that sets the baseline for the work on Haiti’s hydro-energy resilience.
Finally, this study opens important avenues for future research, including the projection of extreme temperature and precipitation events and more detailed trend analyses at the departmental scale. Assessing the evolution of climate change in Haiti at the seasonal scale is also essential, as seasonal analyses can reveal shifts in rainfall regimes and temperature extremes that are not always apparent in annual averages. As climate data continue to evolve, future work could also explore the links between climatic trends and critical societal dimensions such as migration, food security, and natural resource management.
Supplementary Materials
The following supporting information can be downloaded at https://www.mdpi.com/article/10.3390/cli14100208/s1. Table S1: Haiti-averaged annual series of TN90p, TNmean, RH, e, dew point (1981–2020) [CSV]. Table S2: Sen slope, Kendall Tau, p-value (MK-TFPW) and R2 for the 14 cities × 12 ETCCDIs [CSV]. Table S3: Compact per-city summary of trends per decade with significance markers [CSV]. Dataset S1: hurs_1981–2020.nc—annual mean relative humidity on the ERA5-Land 0.1° grid over Hispaniola (NetCDF-4, CF-1.6). Dataset S2: vape_1981–2020.nc—annual mean vapor pressure on the same grid (NetCDF-4, CF-1.6). Dataset S3: Gridded_trends_GeoTIFF/—24 GeoTIFF files (per-decade Sen slope and MK-TFPW p-value for each of the 12 ETCCDIs, EPSG:4326, 0.1° resolution). Full documentation (variable definitions, grid specification, provenance) is provided in README.txt within the archive.
Author Contributions
Conceptualization, A.P., C.D. and A.D.; methodology, A.P., C.D., R.B. and B.P.; software, A.P.; validation, A.P., R.B., C.D. and B.P.; formal analysis, A.P.; investigation, A.P.; resources, D.B. and K.G.; data curation, A.P. and C.D.; writing—original draft preparation, A.P.; writing—review and editing, A.P. and C.D.; visualization, A.P., É.V. and K.G.; supervision, B.S., A.D., B.P. and D.B.; project administration, D.B.; funding acquisition, D.B.; All authors have read and agreed to the published version of the manuscript.
Funding
This research was conducted within the CLIMEXHA project (Prevention of Extreme Climate Events in Haiti for Sustainable Development), supported by the Research and Development Fund of the Banque de la République d’Haïti, grant number FRD-5F4A75A7DF988. The article processing charge (APC) was funded by the Laboratoire Mixte International CARIBACT (Axis 3), coordinated by the Institut de Recherche pour le Développement (IRD).
Data Availability Statement
The datasets used in this study are publicly available online. The mean, minimum, and maximum temperature data (Tmean, TNmean, TXmean) are derived from the ERA5-Land reanalysis dataset produced by the European Centre for Medium-Range Weather Forecasts (ECMWF). They are accessible through the Copernicus Climate Change Service (C3S) Climate Data Store at: https://cds.climate.copernicus.eu/datasets/reanalysis-era5-land?tab=overview (accessed on 10 August 2026) (see [21]). The precipitation data used to compute the indices come from the Multi-Source Weighted-Ensemble Precipitation dataset (MSWEP), version 2.8, developed by the GloH2O team at Utrecht University, and are freely available at: http://www.gloh2o.org/mswep/ (accessed on 10 August 2026) [22]. These datasets can be downloaded directly from the respective platforms, subject to their individual data-use terms and conditions http://www.gloh2o.org/mswep/.
Acknowledgments
This study was carried out within the framework of the CLIMEXHA project (Preventing Climate Extreme Events in Haiti for Sustainable Development), coordinated by the International Mixed Laboratory (LMI) CARIBACT of the Institut de Recherche pour le Développement (IRD), France. The project is co-sponsored by the Geosciences Research Unit (URGéo) of the Faculty of Sciences at the State University of Haiti, the Géoazur Laboratory at Université Côte d’Azur (France), and the ESPACE-DEV laboratory (IRD) at the University of Montpellier (France). The authors gratefully acknowledge the European Centre for Medium-Range Weather Forecasts (ECMWF) for producing and openly distributing the ERA5-Land reanalysis, as well as the GloH2O team at Utrecht University (The Netherlands) for developing MSWEP (Multi-Source Weighted-Ensemble Precipitation), a merged product that combines rain-gauge, satellite, and reanalysis data to obtain accurate precipitation estimates worldwide.
Conflicts of Interest
The authors declare no conflicts of interest.
Abbreviations
The following abbreviations are used in this manuscript:
| CDD | Consecutive Dry Days |
| CDS | Copernicus Climate Data Store |
| CWD | Consecutive Wet Days |
| DTR | Diurnal Temperature Range |
| ERA5 | Fifth generation ECMWF atmospheric reanalysis |
| ETCCDI | Expert Team on Climate Change Detection and Indices |
| IPCC | Intergovernmental Panel on Climate Change |
| MK | Mann–Kendall |
| MSWEP | Multi-Source Weighted-Ensemble Precipitation |
| PRCPTOT | Total precipitation on wet days |
| R90p | Very wet days (precipitation above the 90th percentile) |
| RH | Relative Humidity |
| RR1 | Number of days with precipitation ≥ 1 mm |
| SDII | Simple Daily Intensity Index |
| SIDS | Small Island Developing States |
| TFPW | Trend-Free Pre-Whitening |
| TN90p | Warm nights (Tmin above the 90th percentile) |
| TNmean | Mean daily minimum temperature |
| TX90p | Warm days (Tmax above the 90th percentile) |
| TXmean | Mean daily maximum temperature |
| WSDI | Warm Spell Duration Index |
Appendix A. City-Level Annual Time Series
This appendix provides, for each of the twelve ETCCDIs, the annual time series over the period 1981–2020 for Haïti (national mean) and for each of the 14 studied cities. In each panel, the blue line with circular markers shows the observed annual values and the red line shows the Theil–Sen linear fit. The Sen slope per decade, Kendall tau, p-value from the Mann–Kendall Trend-Free Prewhitening test, and R2 of the linear regression are reported in each panel. An asterisk (*) after the Sen slope denotes statistical significance at p < 0.05.
Figure A1.
Annual mean temperature (Tmean)—annual time series for Haiti and the 14 cities of interest (1981–2020). In each panel, the blue line with circular markers shows the observed annual values and the red line shows the Theil–Sen linear fit. Statistics in each panel: Sen slope per decade (* = significant at p < 0.05, MK-TFPW), Kendall tau, p-value, R2.
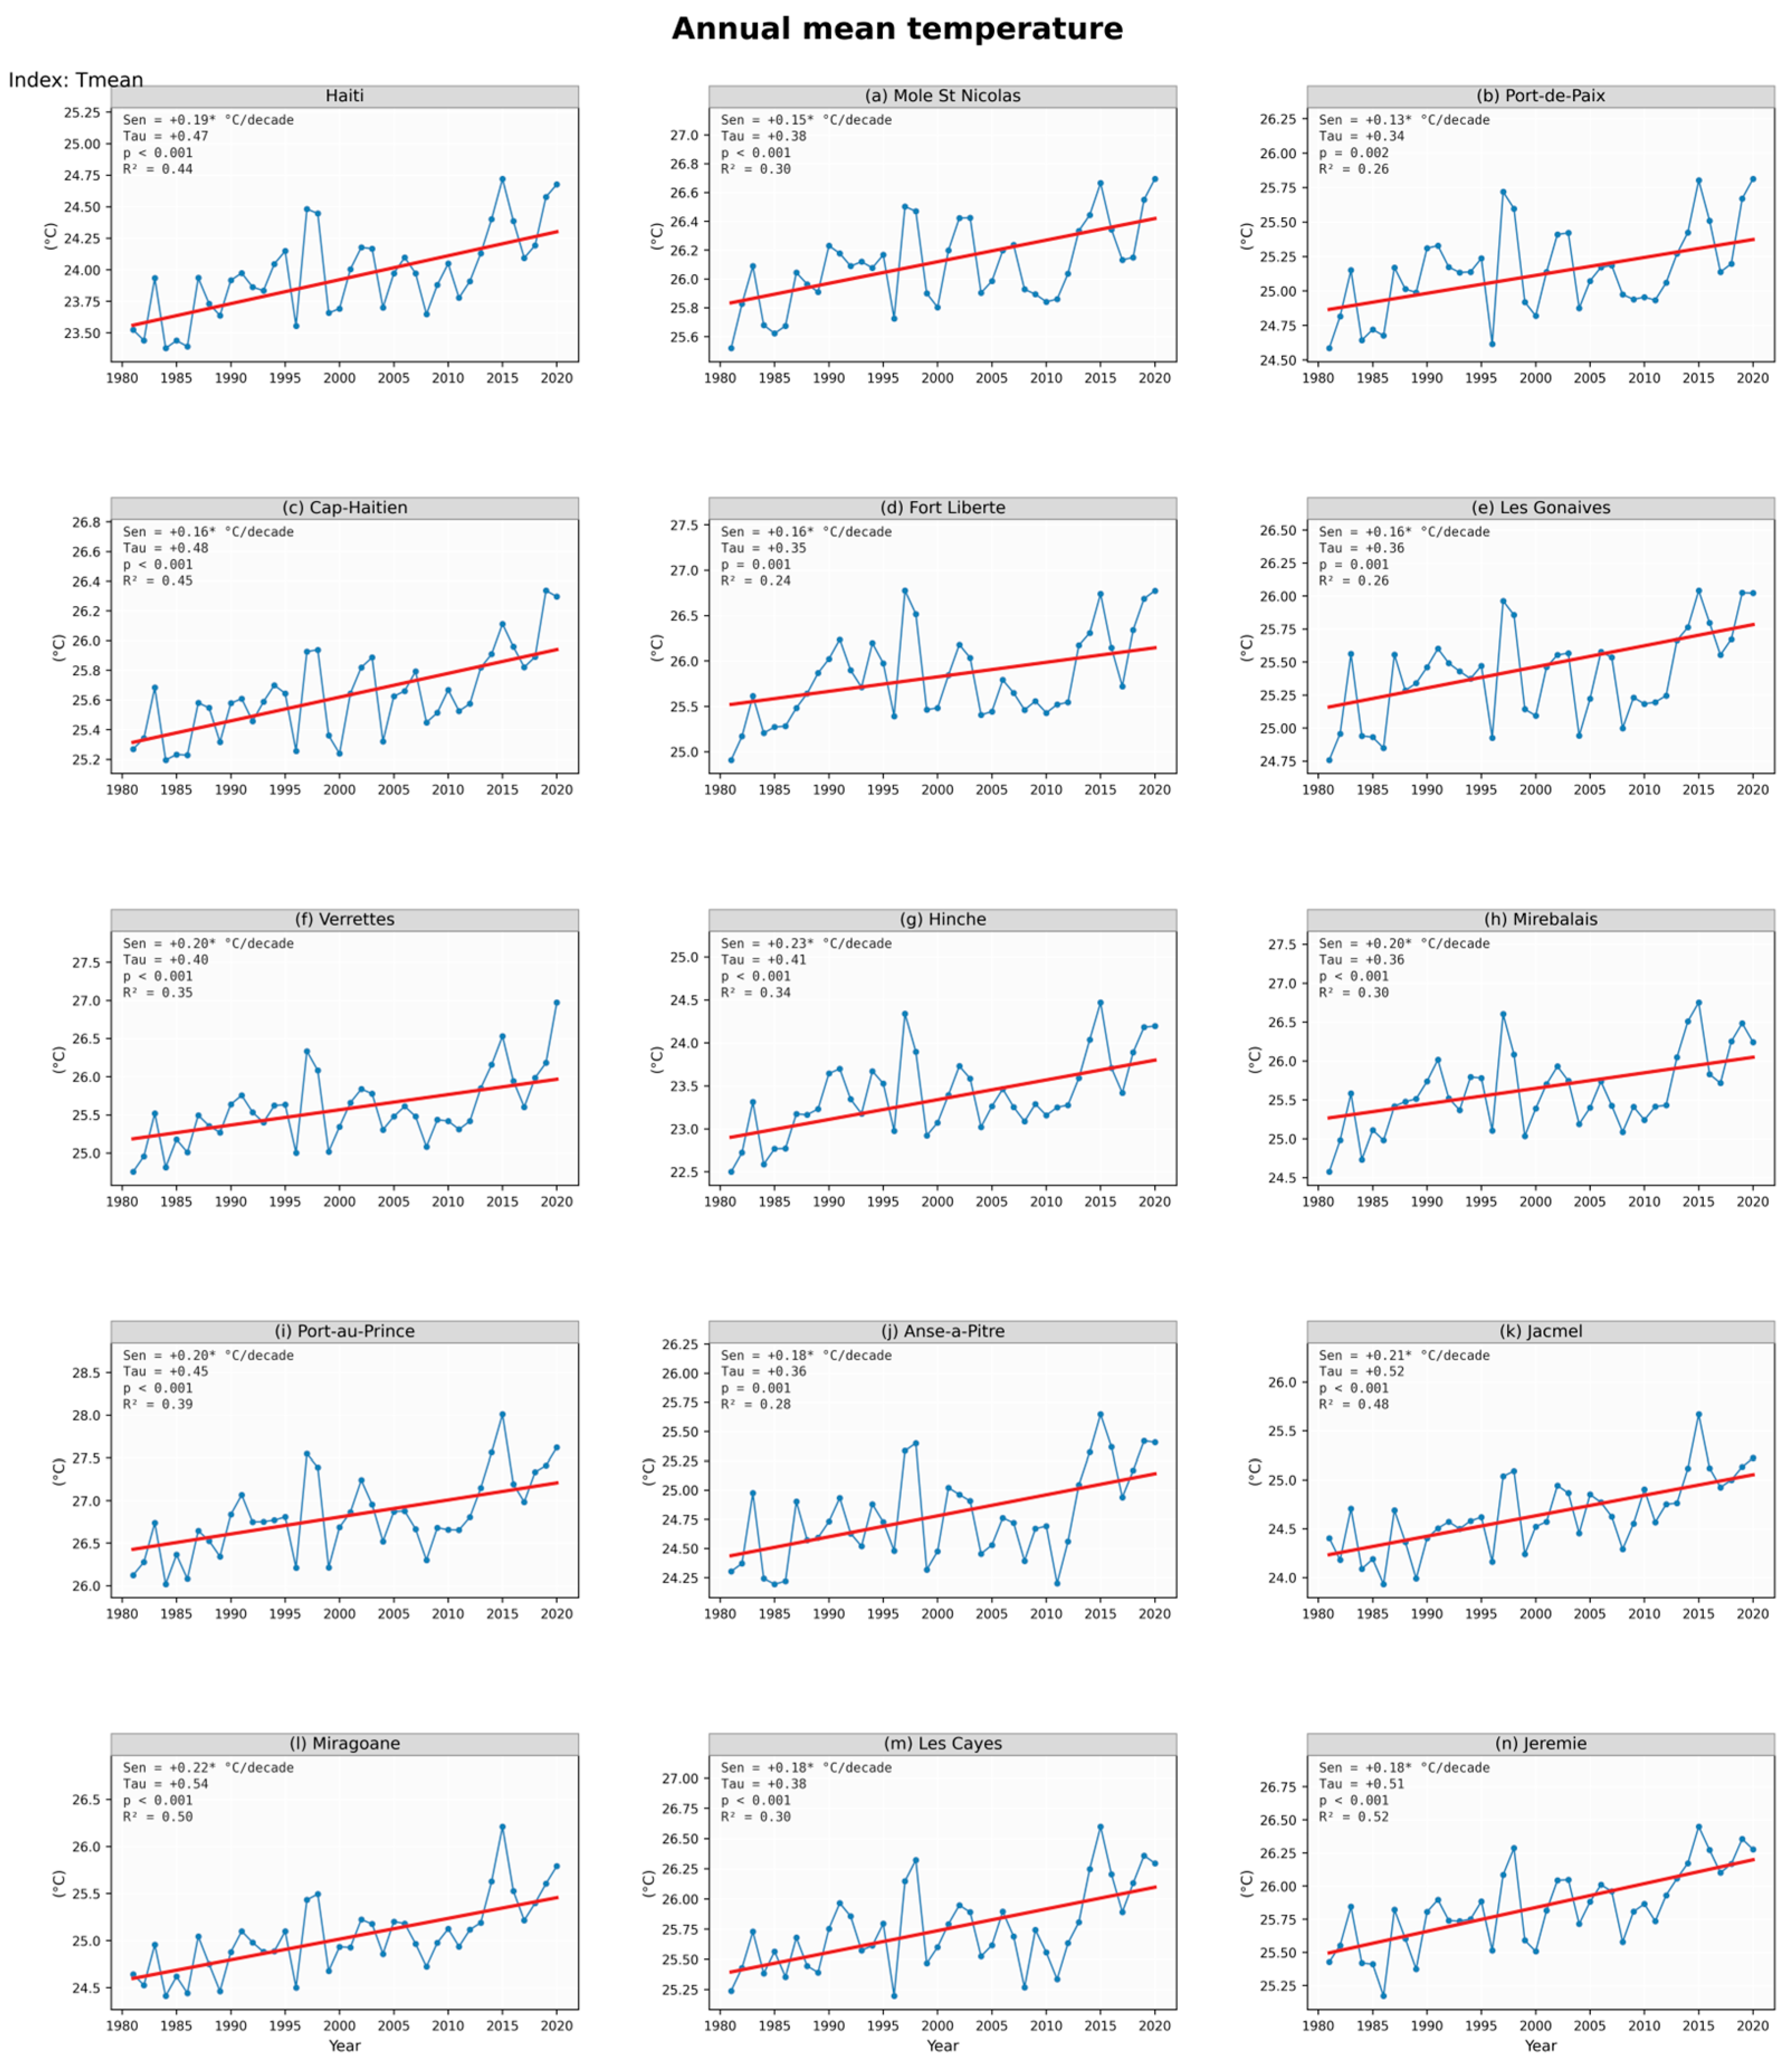
Figure A2.
Annual mean daily maximum temperature (TXmean)—annual time series for Haiti and the 14 cities of interest (1981–2020). In each panel, the blue line with circular markers shows the observed annual values and the red line shows the Theil–Sen linear fit. Statistics in each panel: Sen slope per decade (* = significant at p < 0.05, MK-TFPW), Kendall tau, p-value, R2.
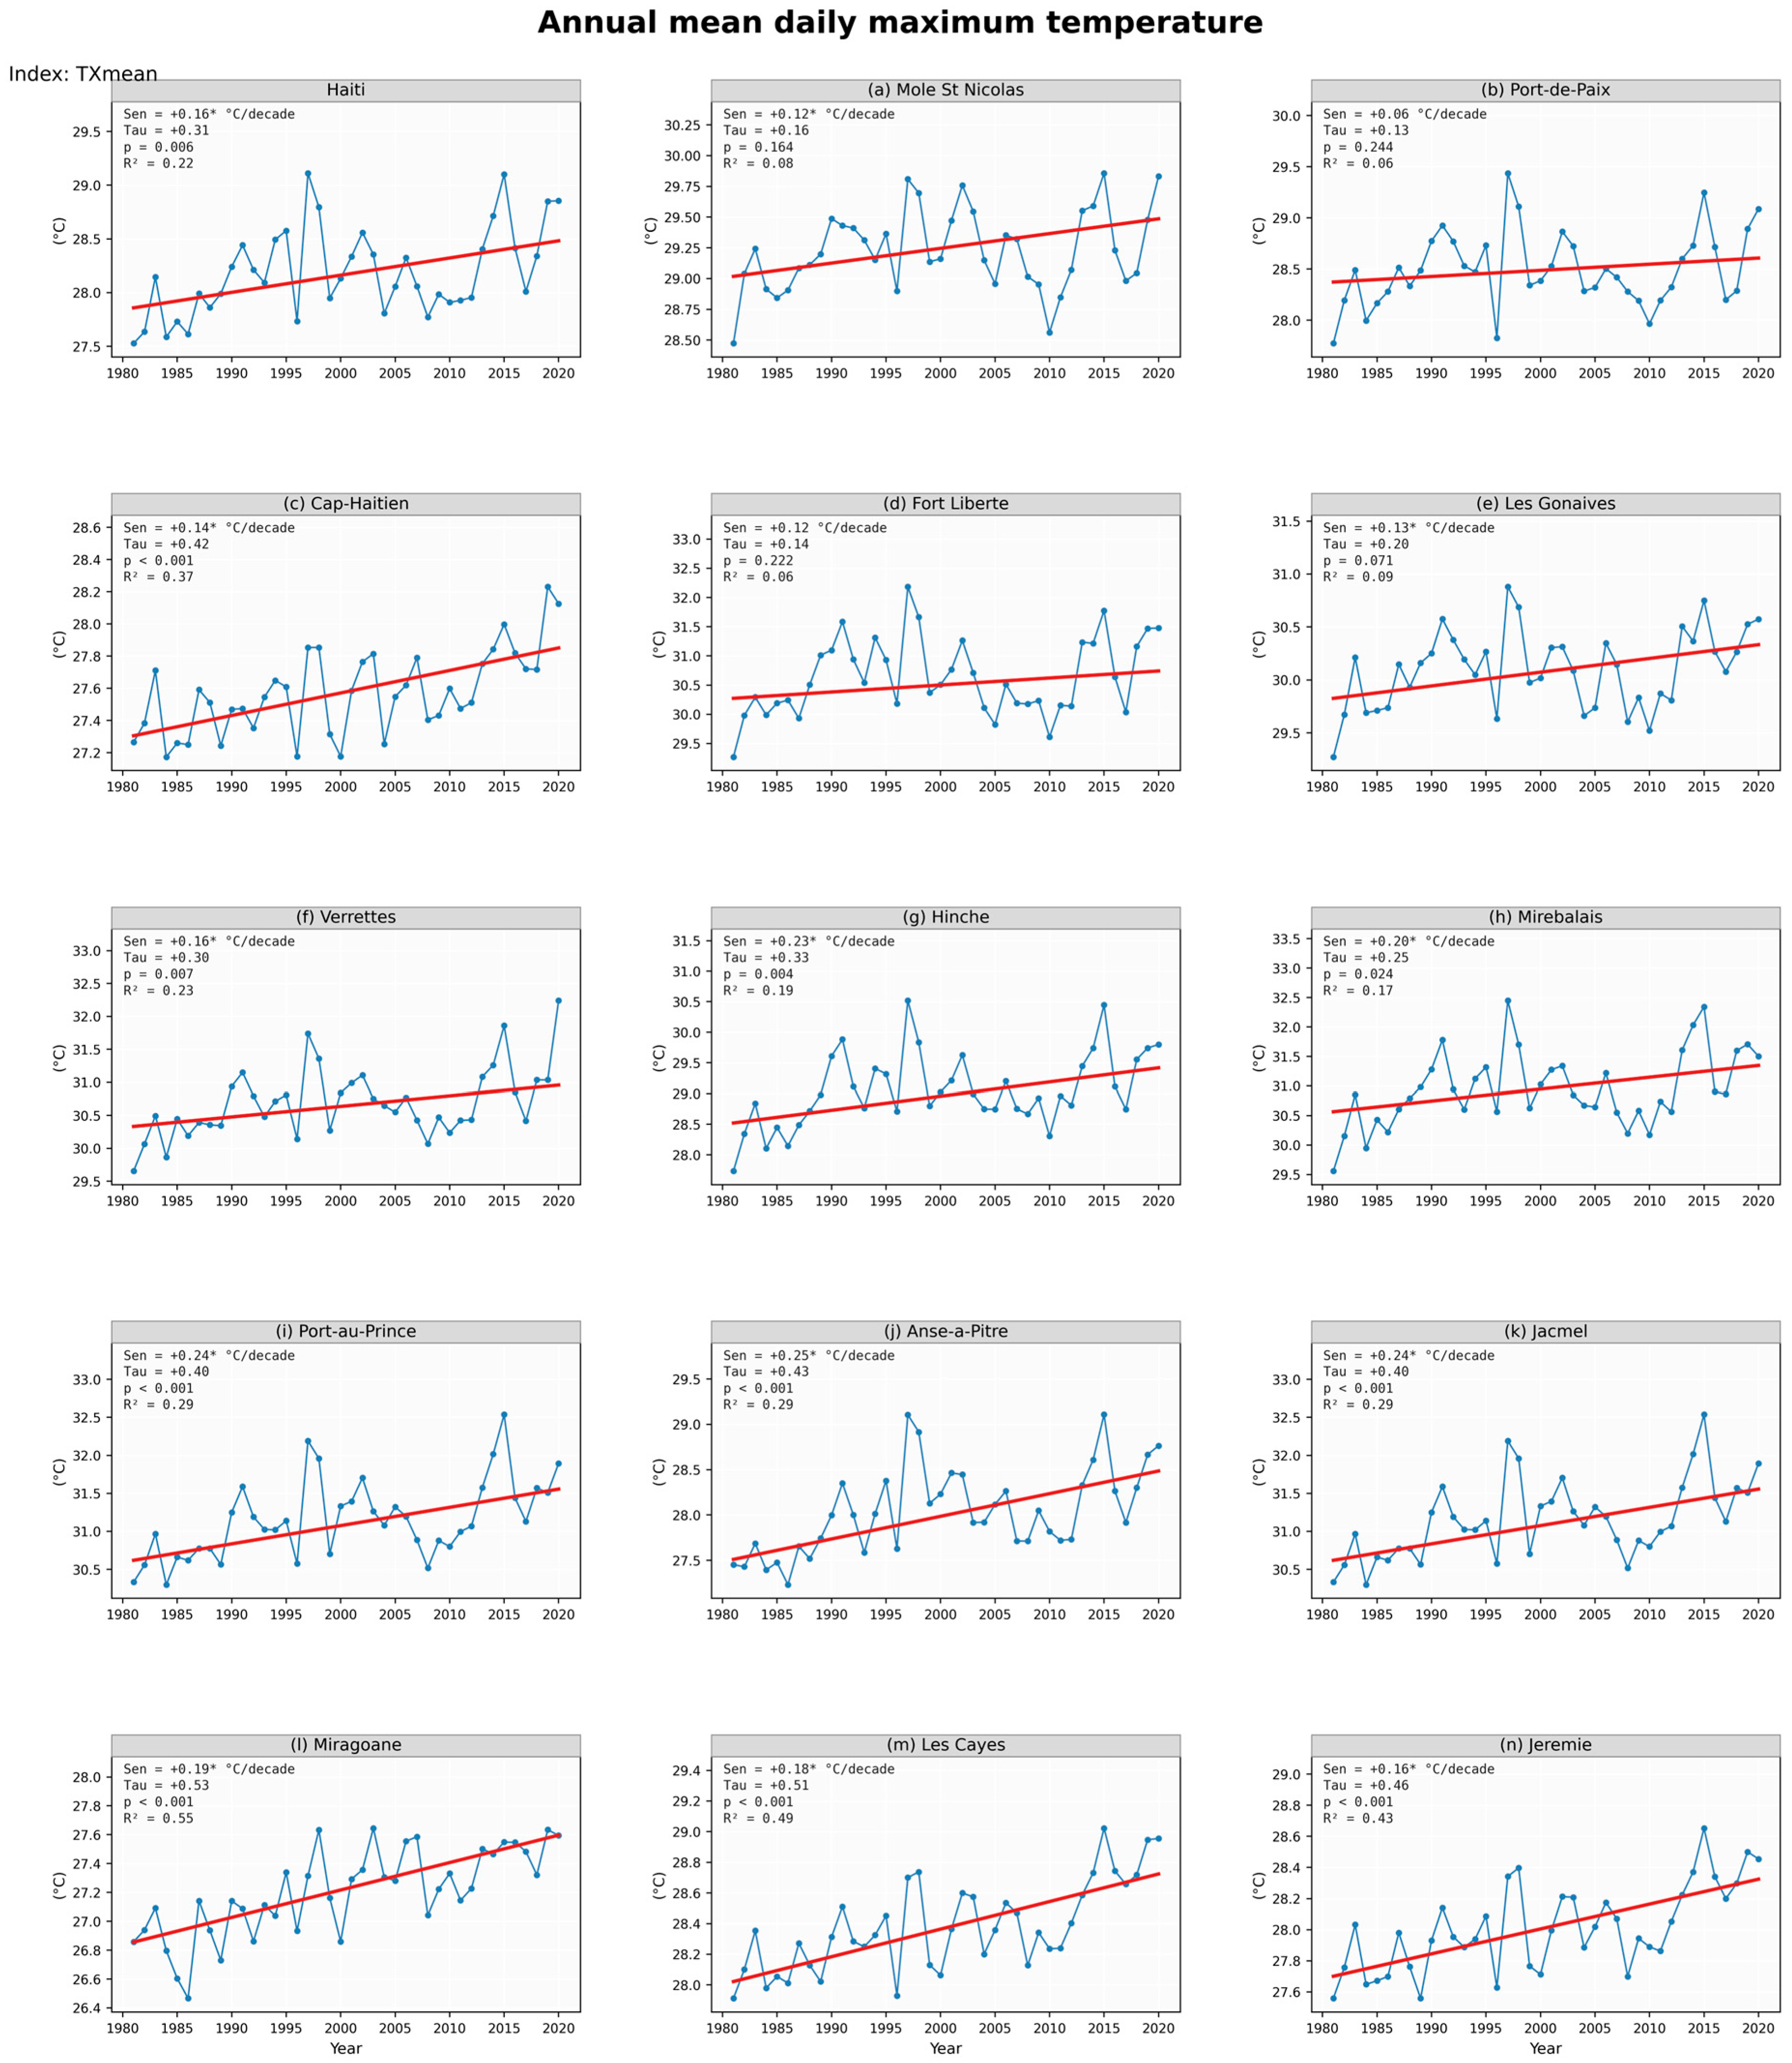
Figure A3.
Annual mean daily minimum temperature (TNmean)—annual time series for Haiti and the 14 cities of interest (1981–2020). In each panel, the blue line with circular markers shows the observed annual values and the red line shows the Theil–Sen linear fit. Statistics in each panel: Sen slope per decade (* = significant at p < 0.05, MK-TFPW), Kendall tau, p-value, R2.
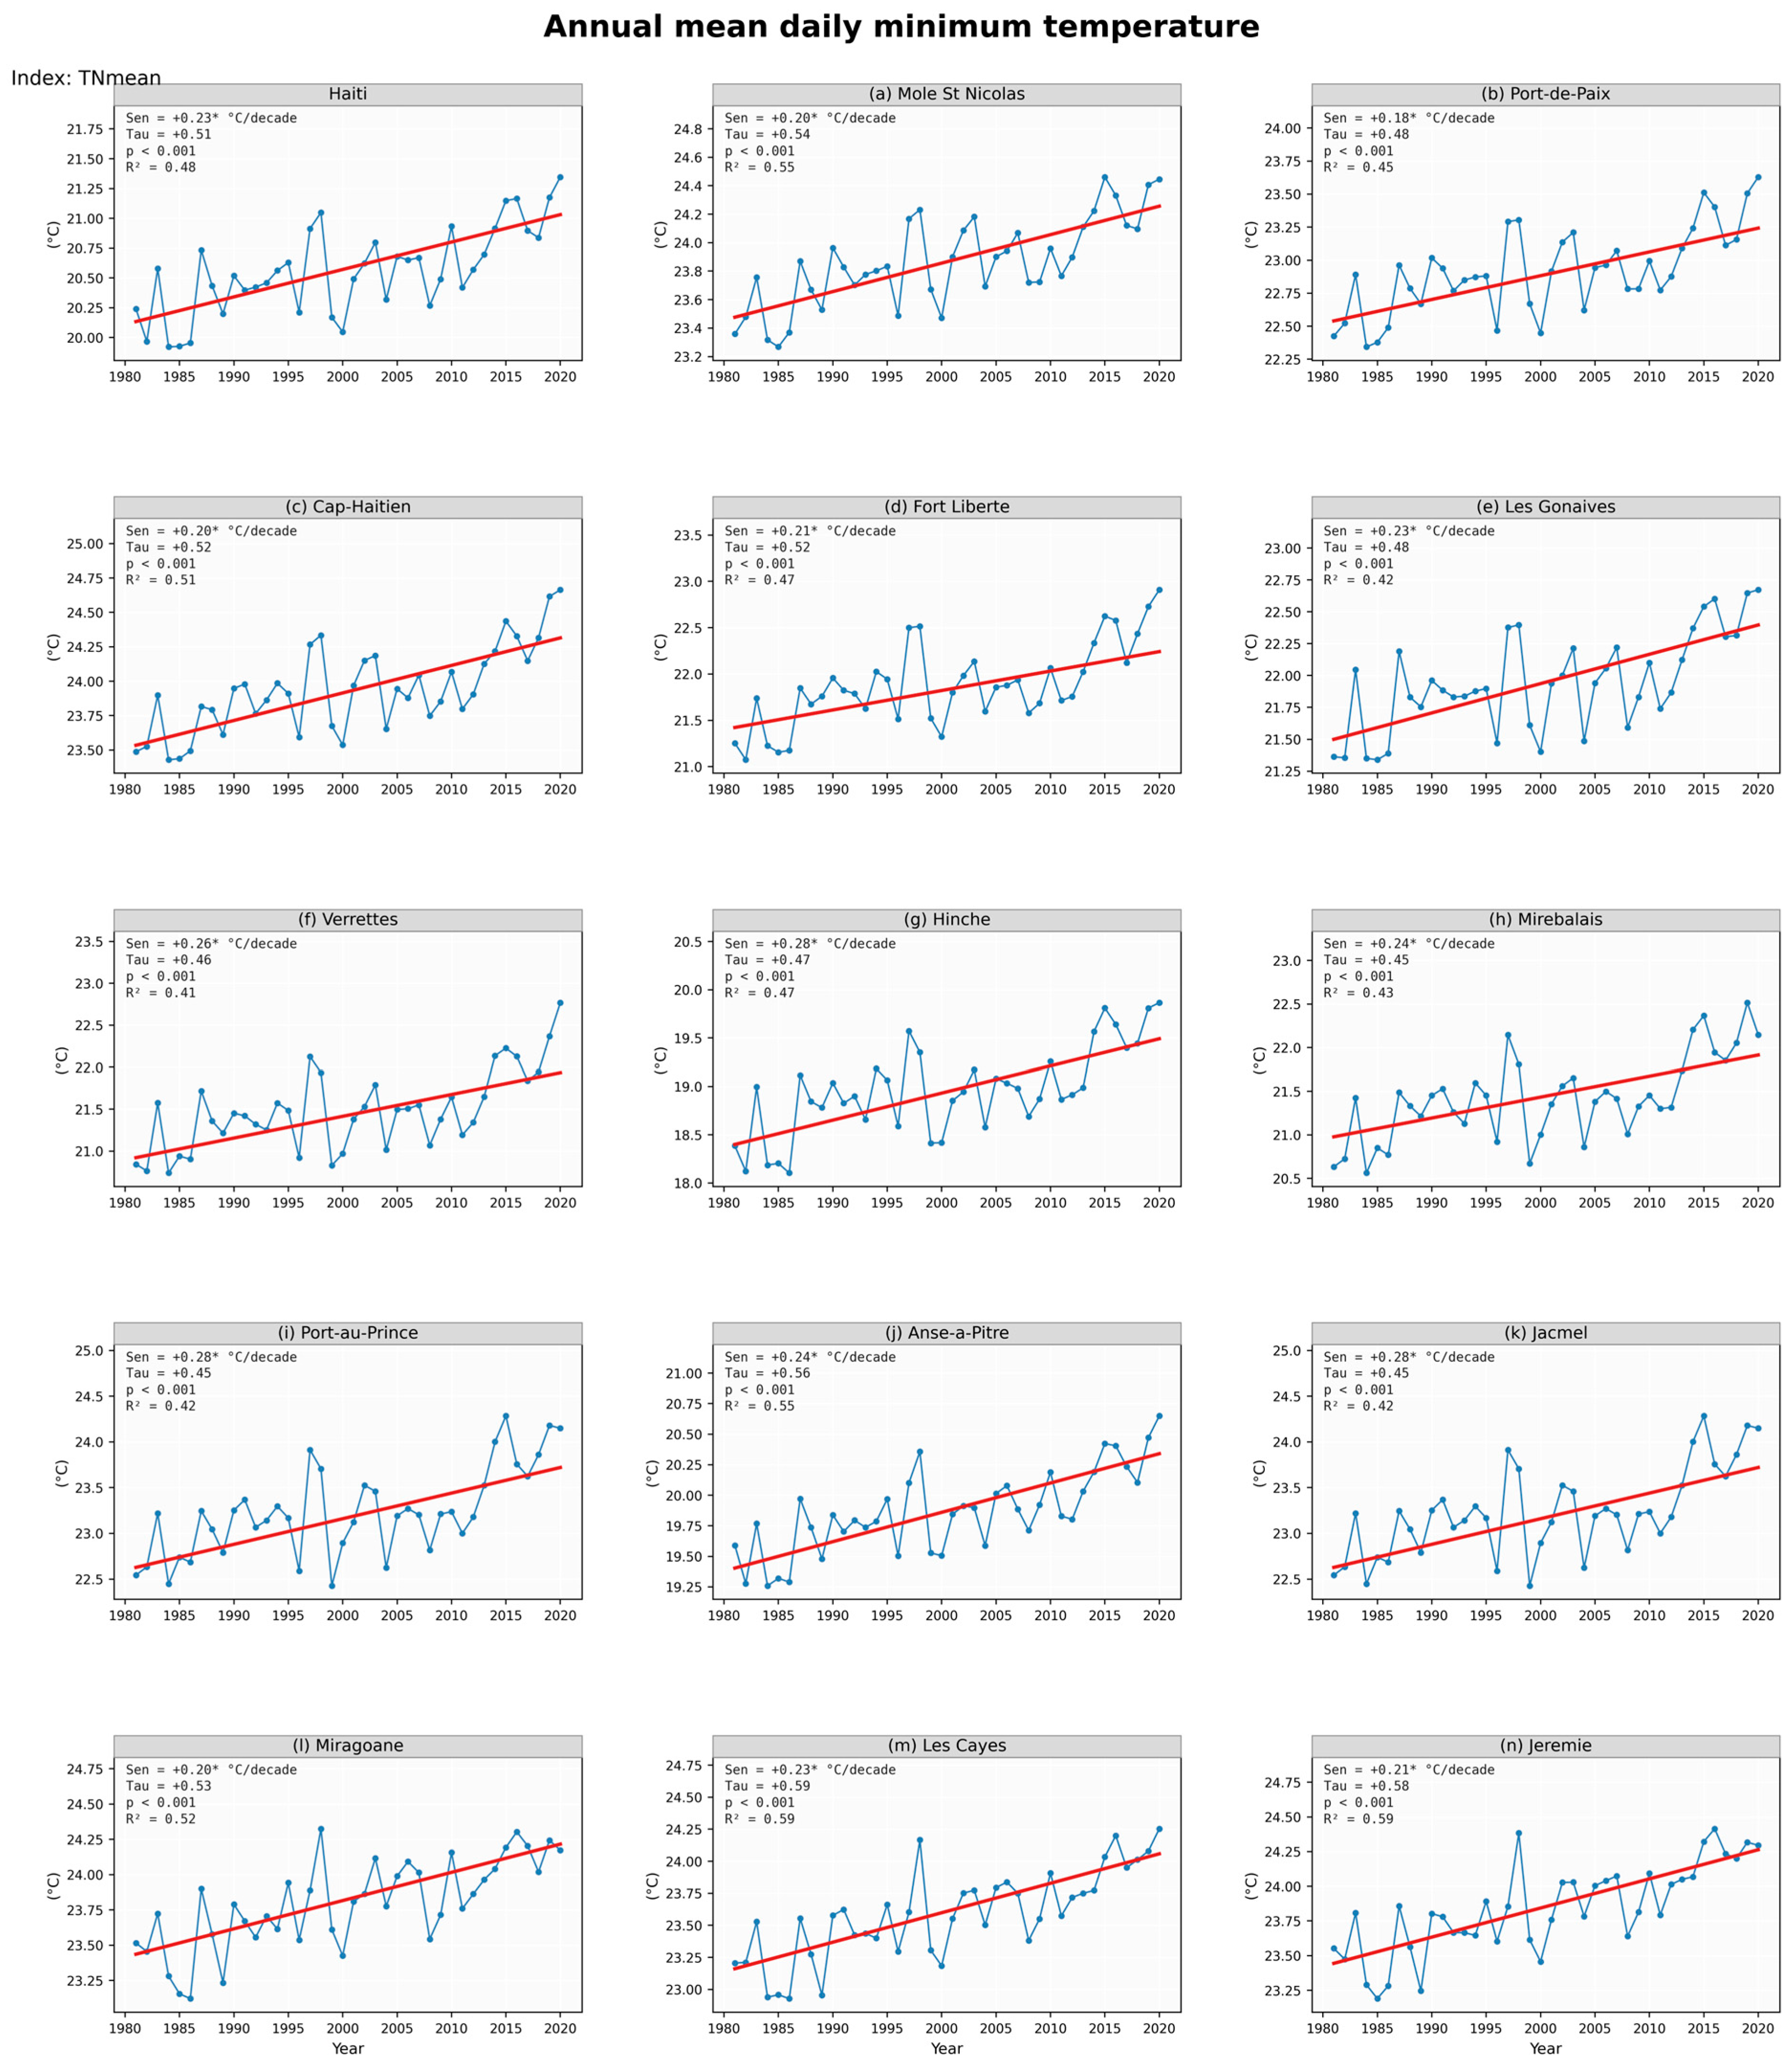
Figure A4.
Warm days (TX90p)—annual time series for Haiti and the 14 cities of interest (1981–2020). In each panel, the blue line with circular markers shows the observed annual values and the red line shows the Theil–Sen linear fit. Statistics in each panel: Sen slope per decade (* = significant at p < 0.05, MK-TFPW), Kendall tau, p-value, R2.
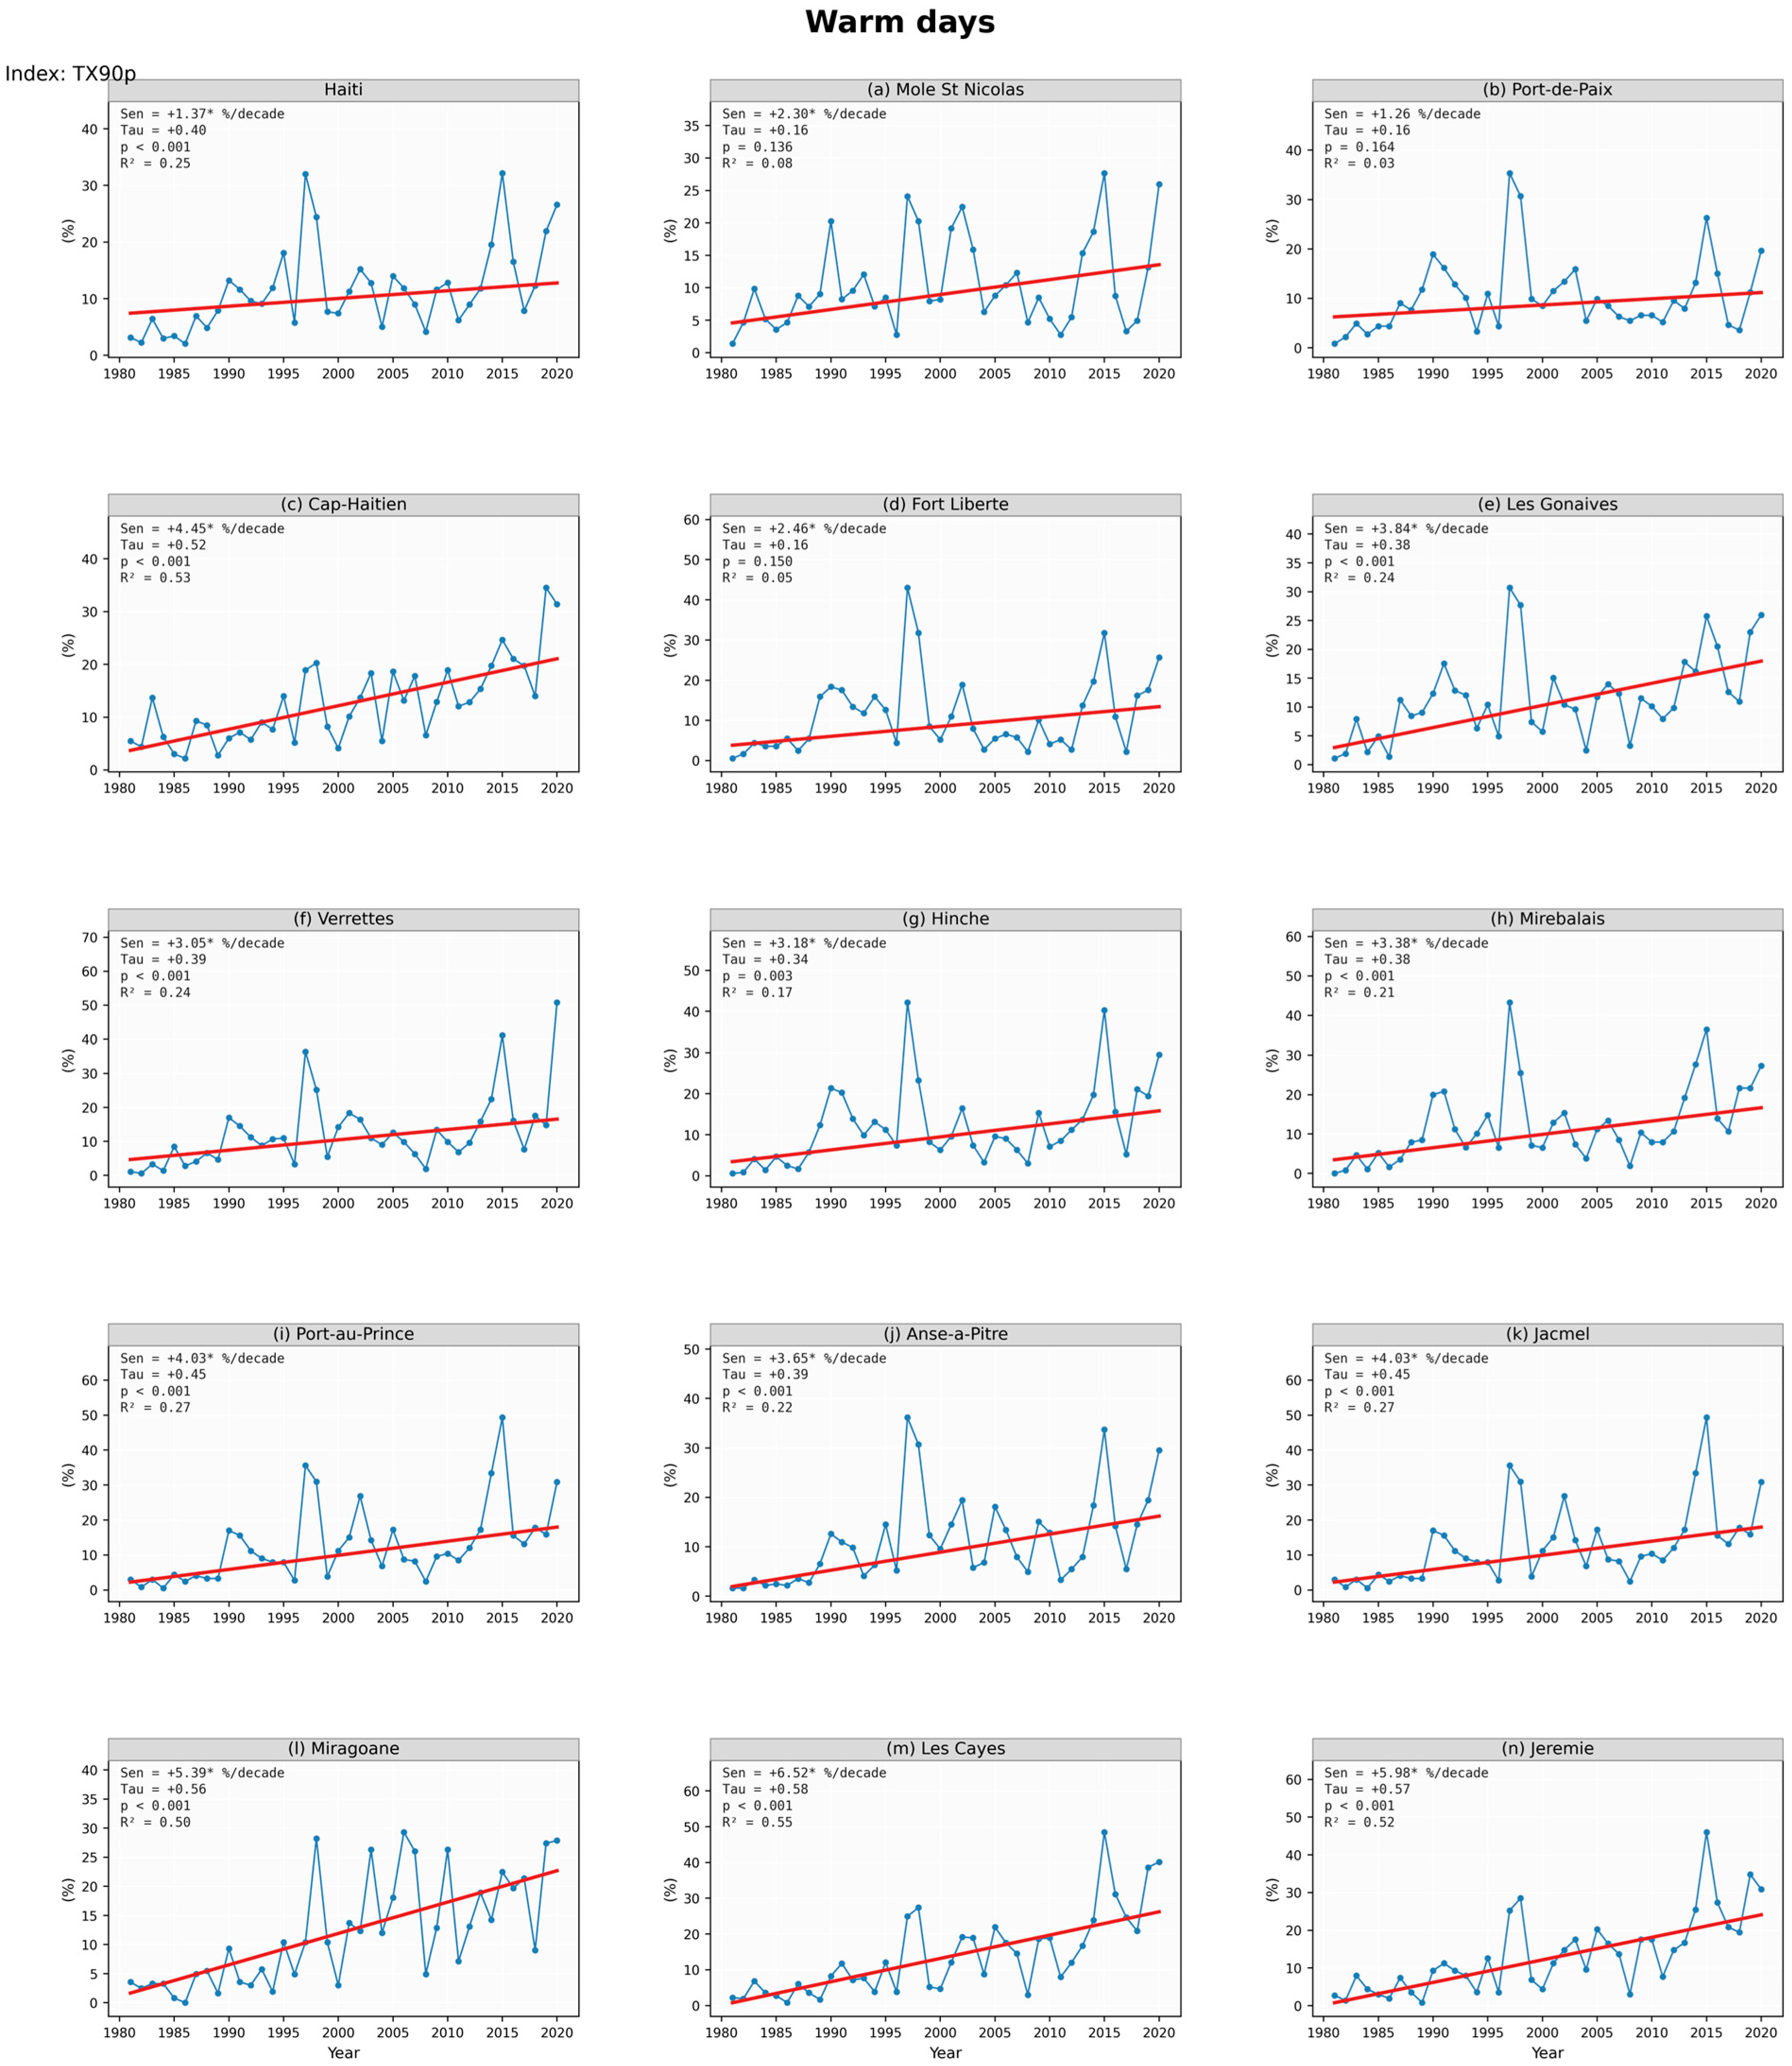
Figure A5.
Warm nights (TN90p)—annual time series for Haiti and the 14 cities of interest (1981–2020). In each panel, the blue line with circular markers shows the observed annual values and the red line shows the Theil–Sen linear fit. Statistics in each panel: Sen slope per decade (* = significant at p < 0.05, MK-TFPW), Kendall tau, p-value, R2.
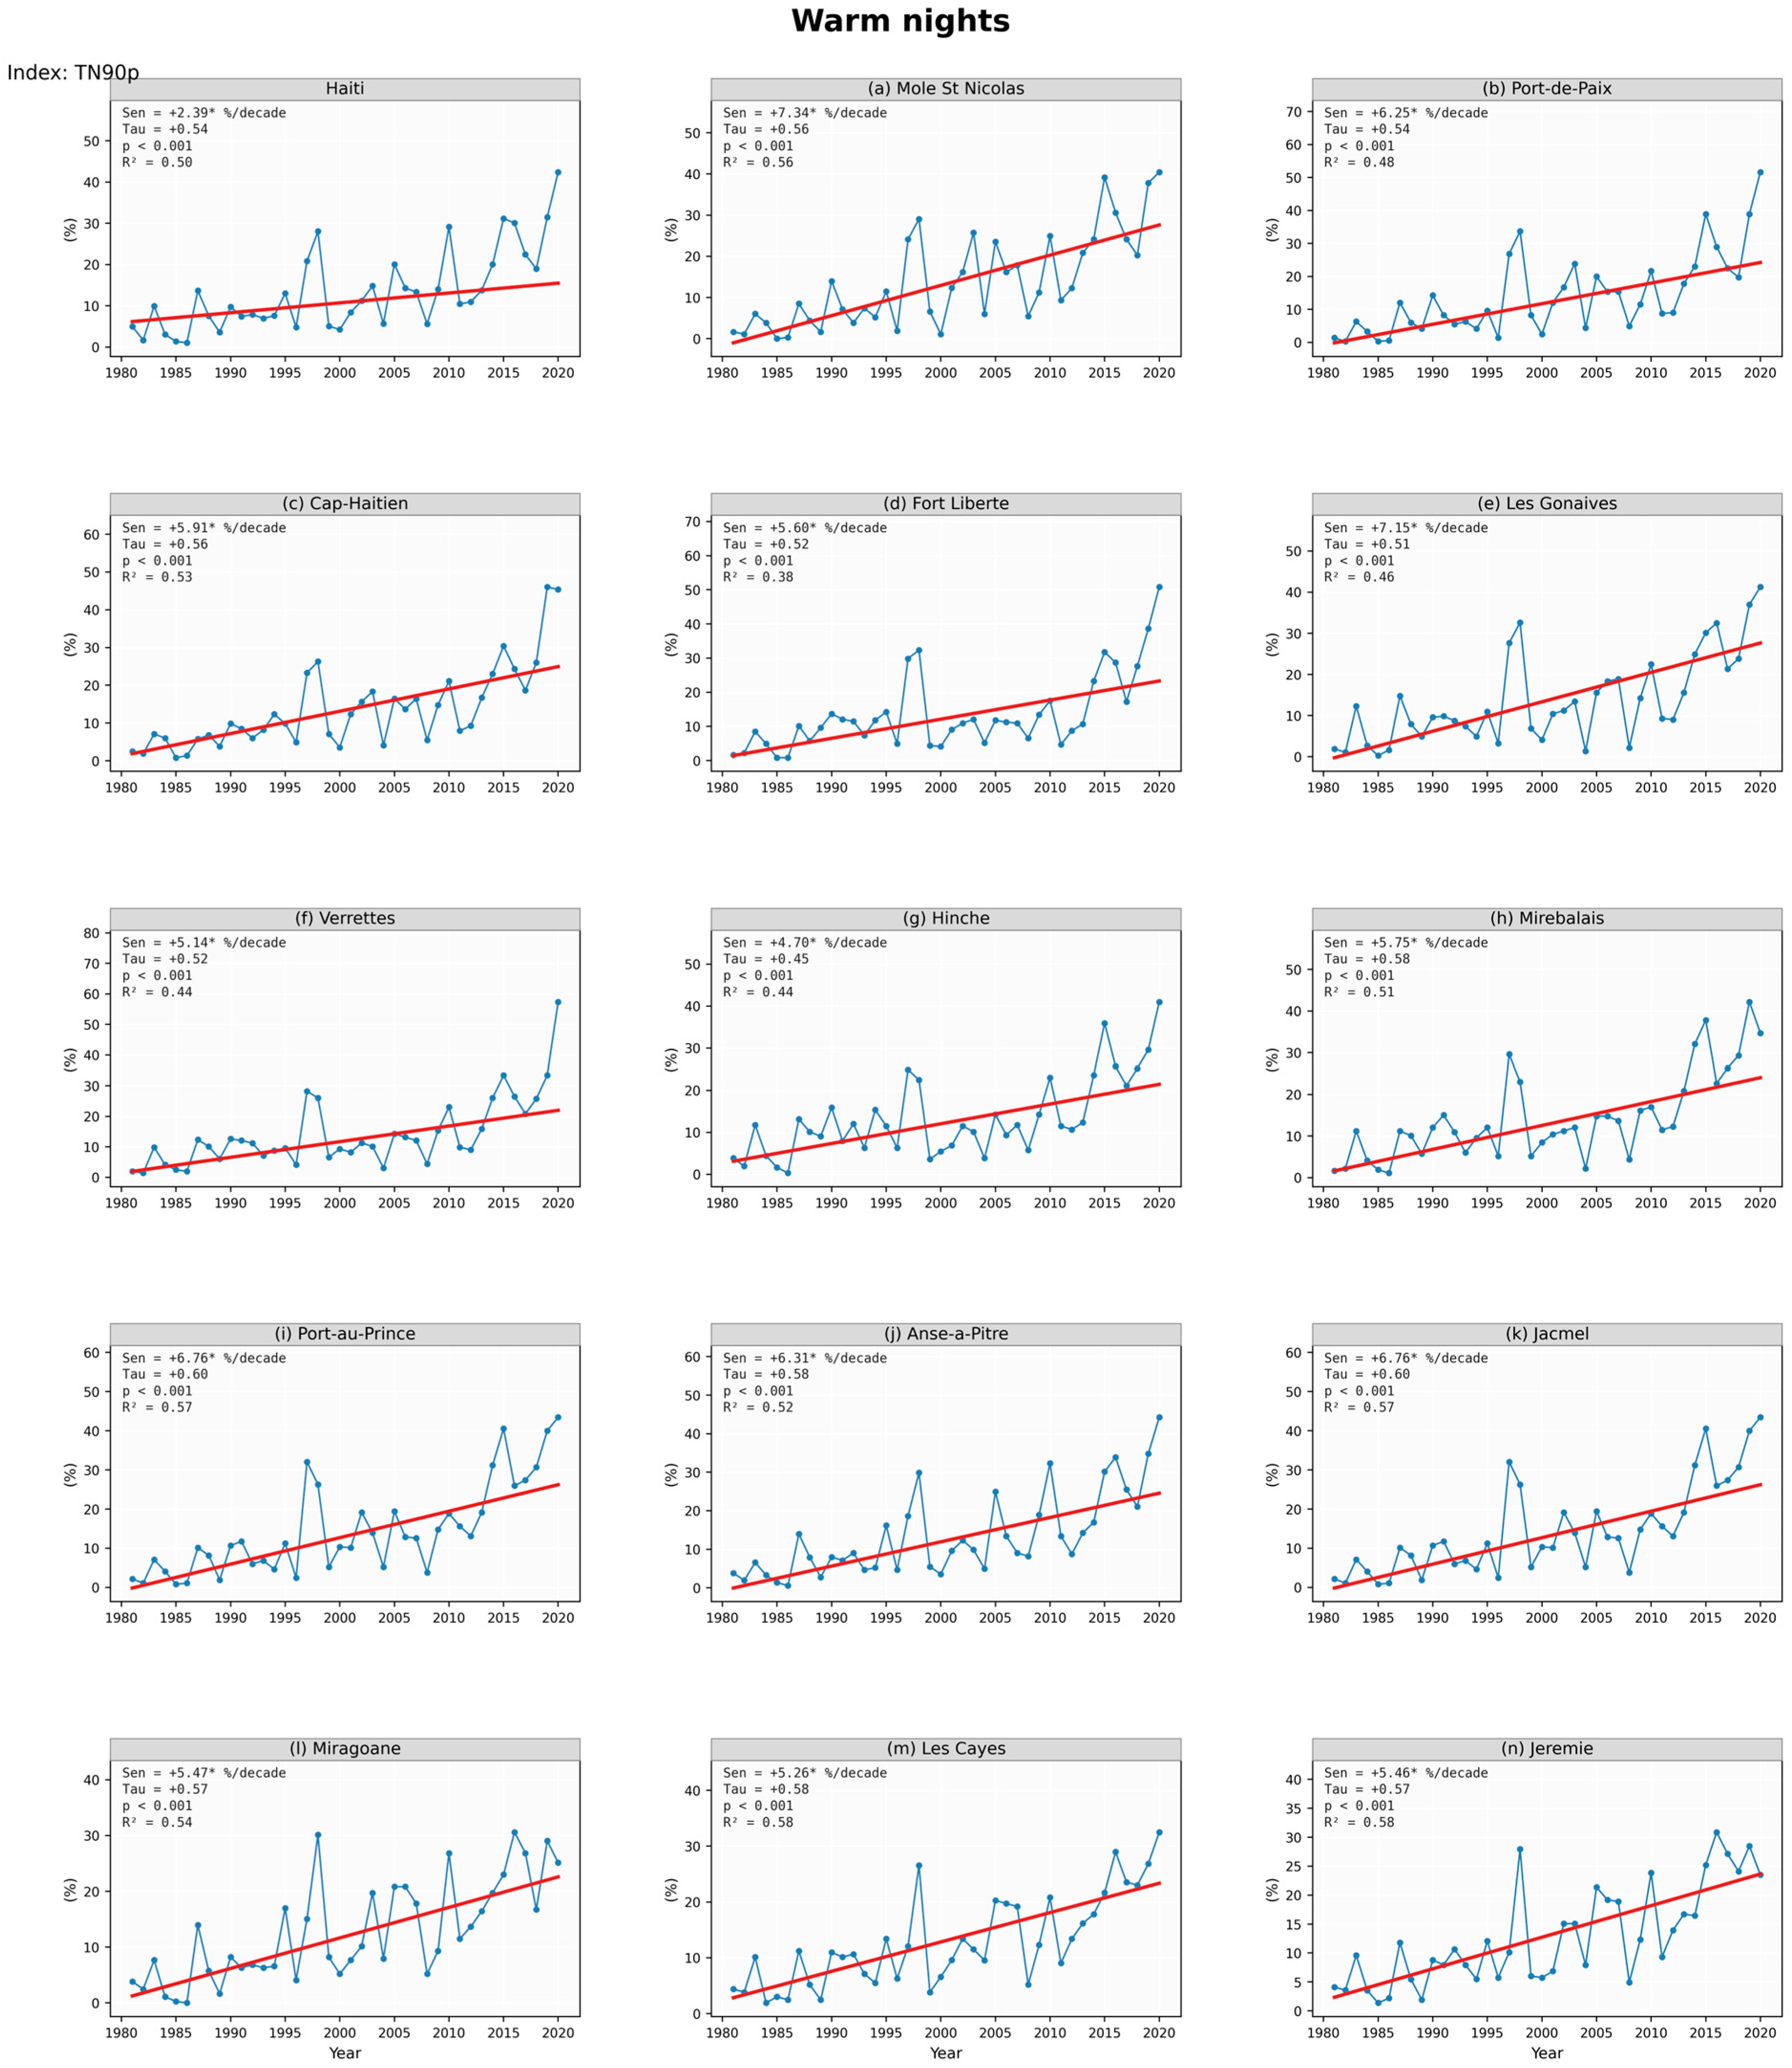
Figure A6.
Warm spell duration index (WSDI)—annual time series for Haiti and the 14 cities of interest (1981–2020). In each panel, the blue line with circular markers shows the observed annual values and the red line shows the Theil–Sen linear fit. Statistics in each panel: Sen slope per decade (* = significant at p < 0.05, MK-TFPW), Kendall tau, p-value, R2.
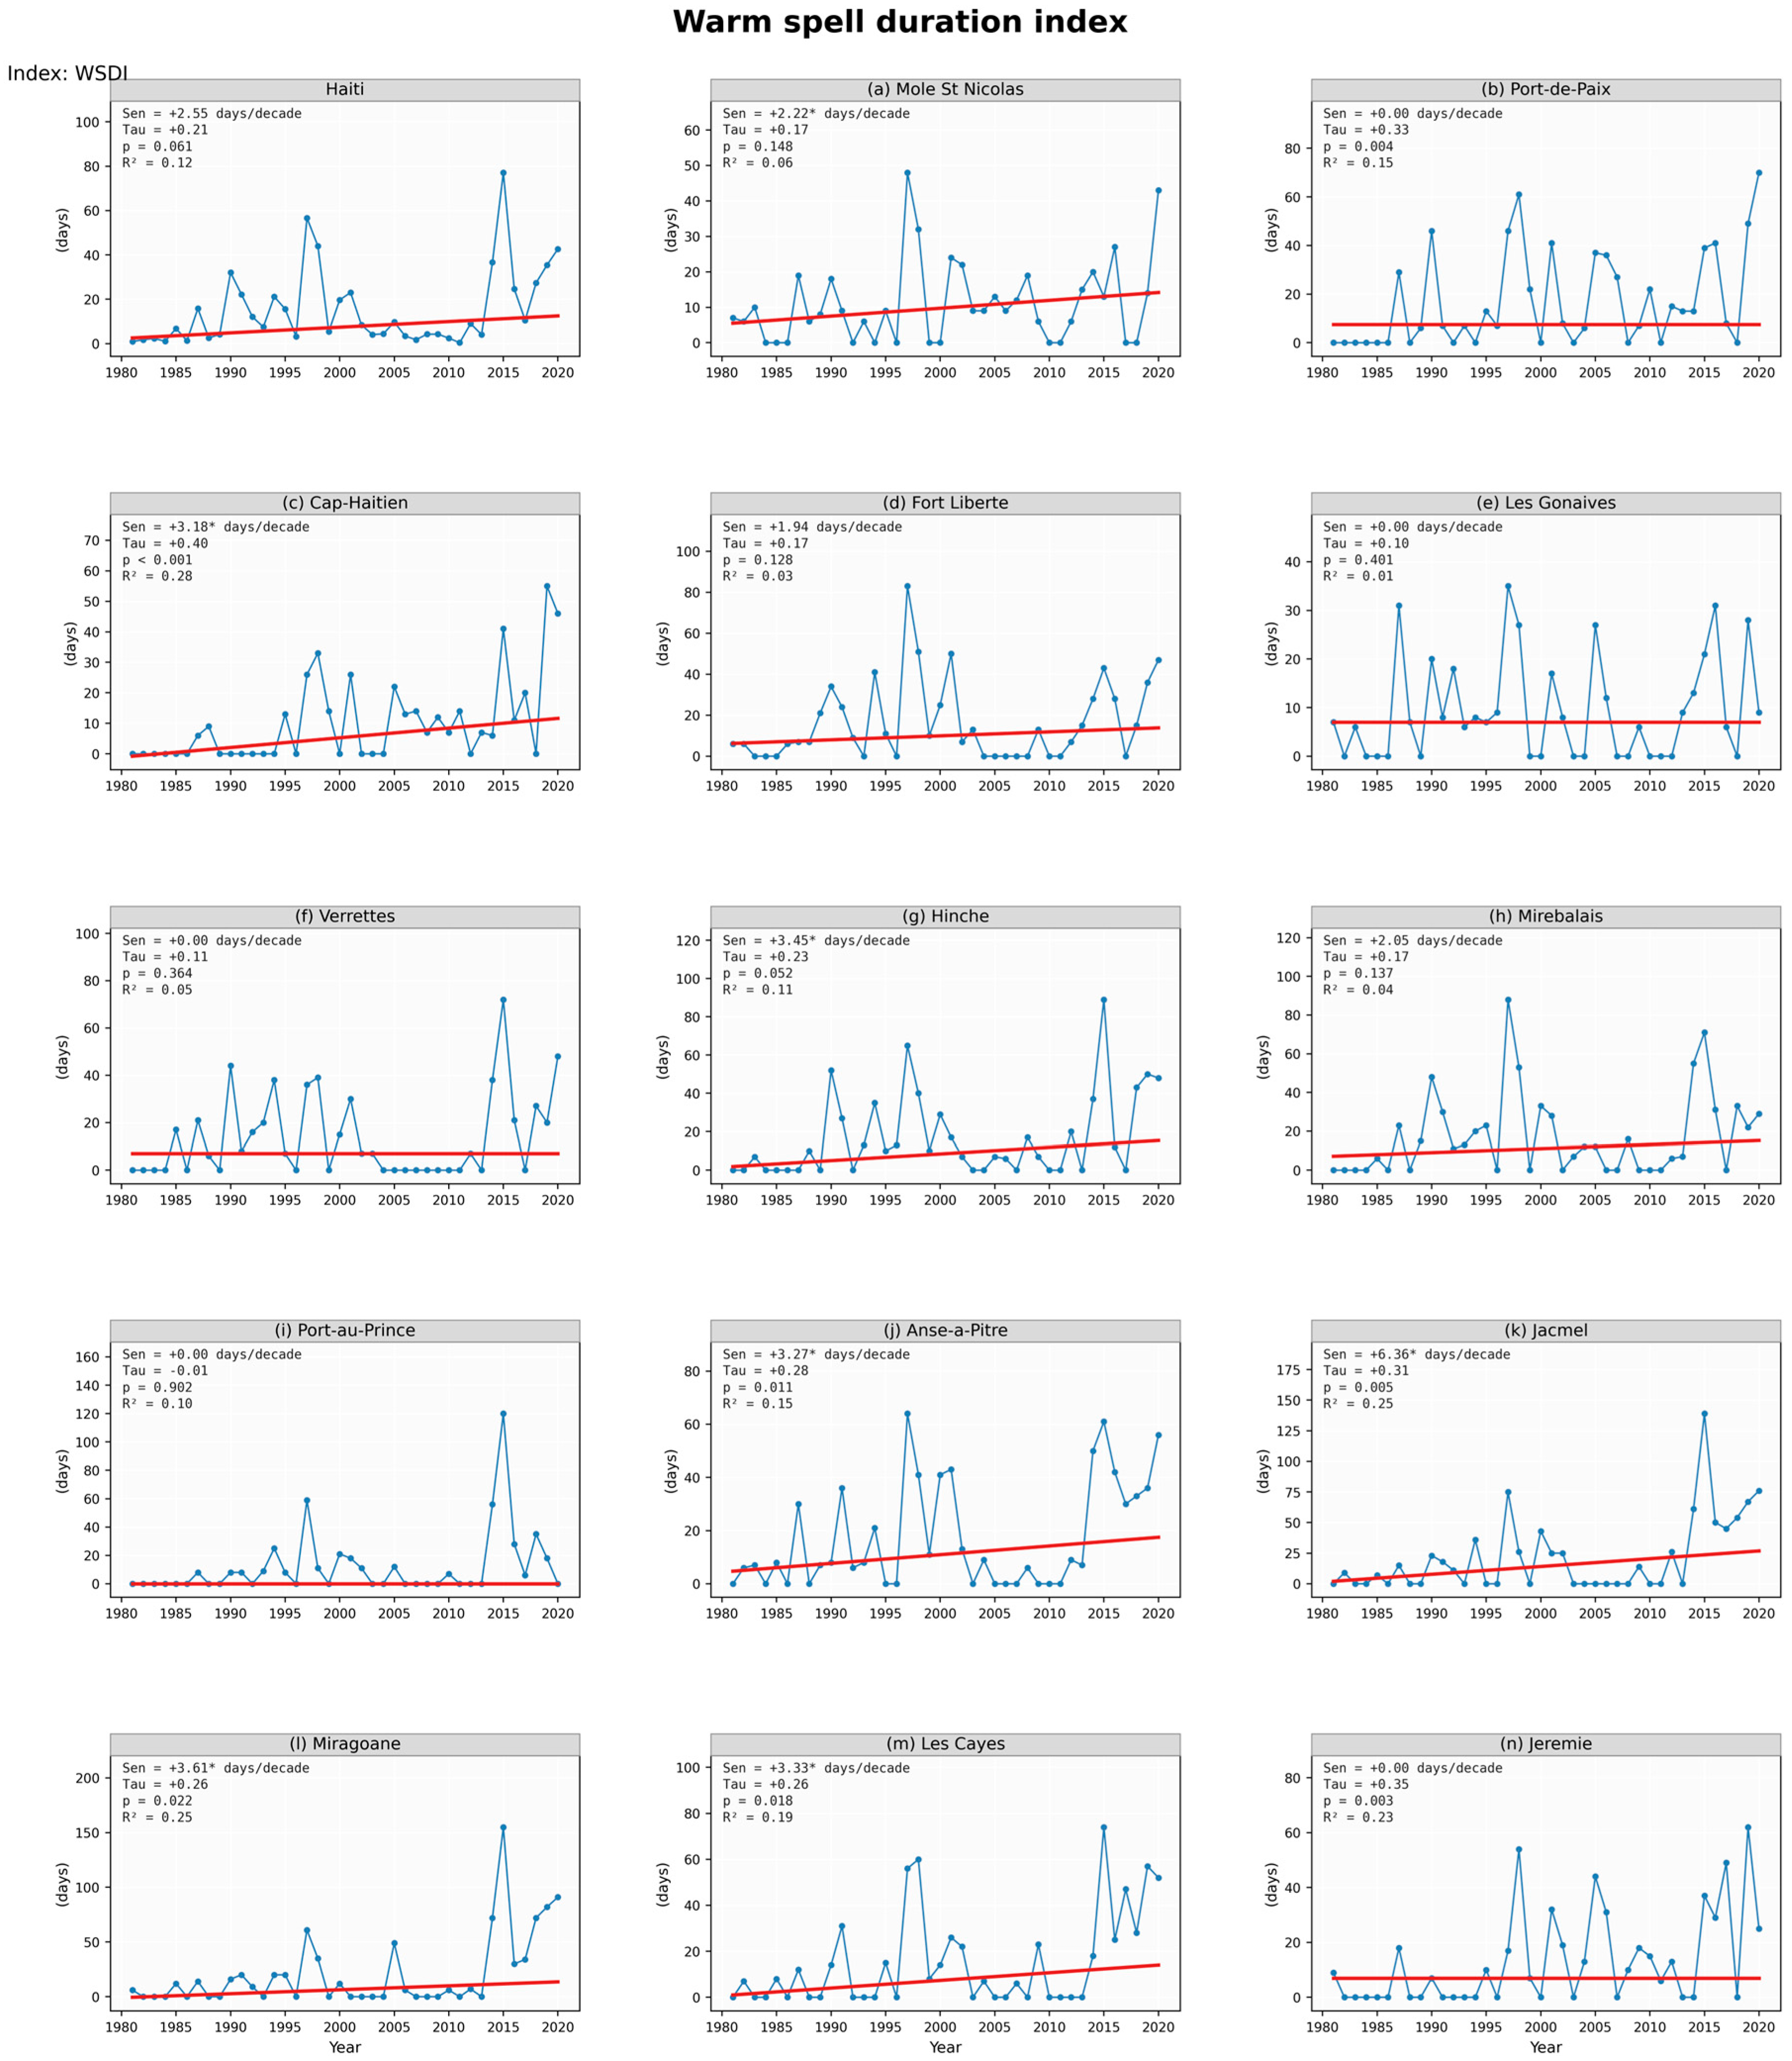
Figure A7.
Total annual precipitation (PRCPTOT)—annual time series for Haiti and the 14 cities of interest (1981–2020). In each panel, the blue line with circular markers shows the observed annual values and the red line shows the Theil–Sen linear fit. Statistics in each panel: Sen slope per decade (* = significant at p < 0.05, MK-TFPW), Kendall tau, p-value, R2.
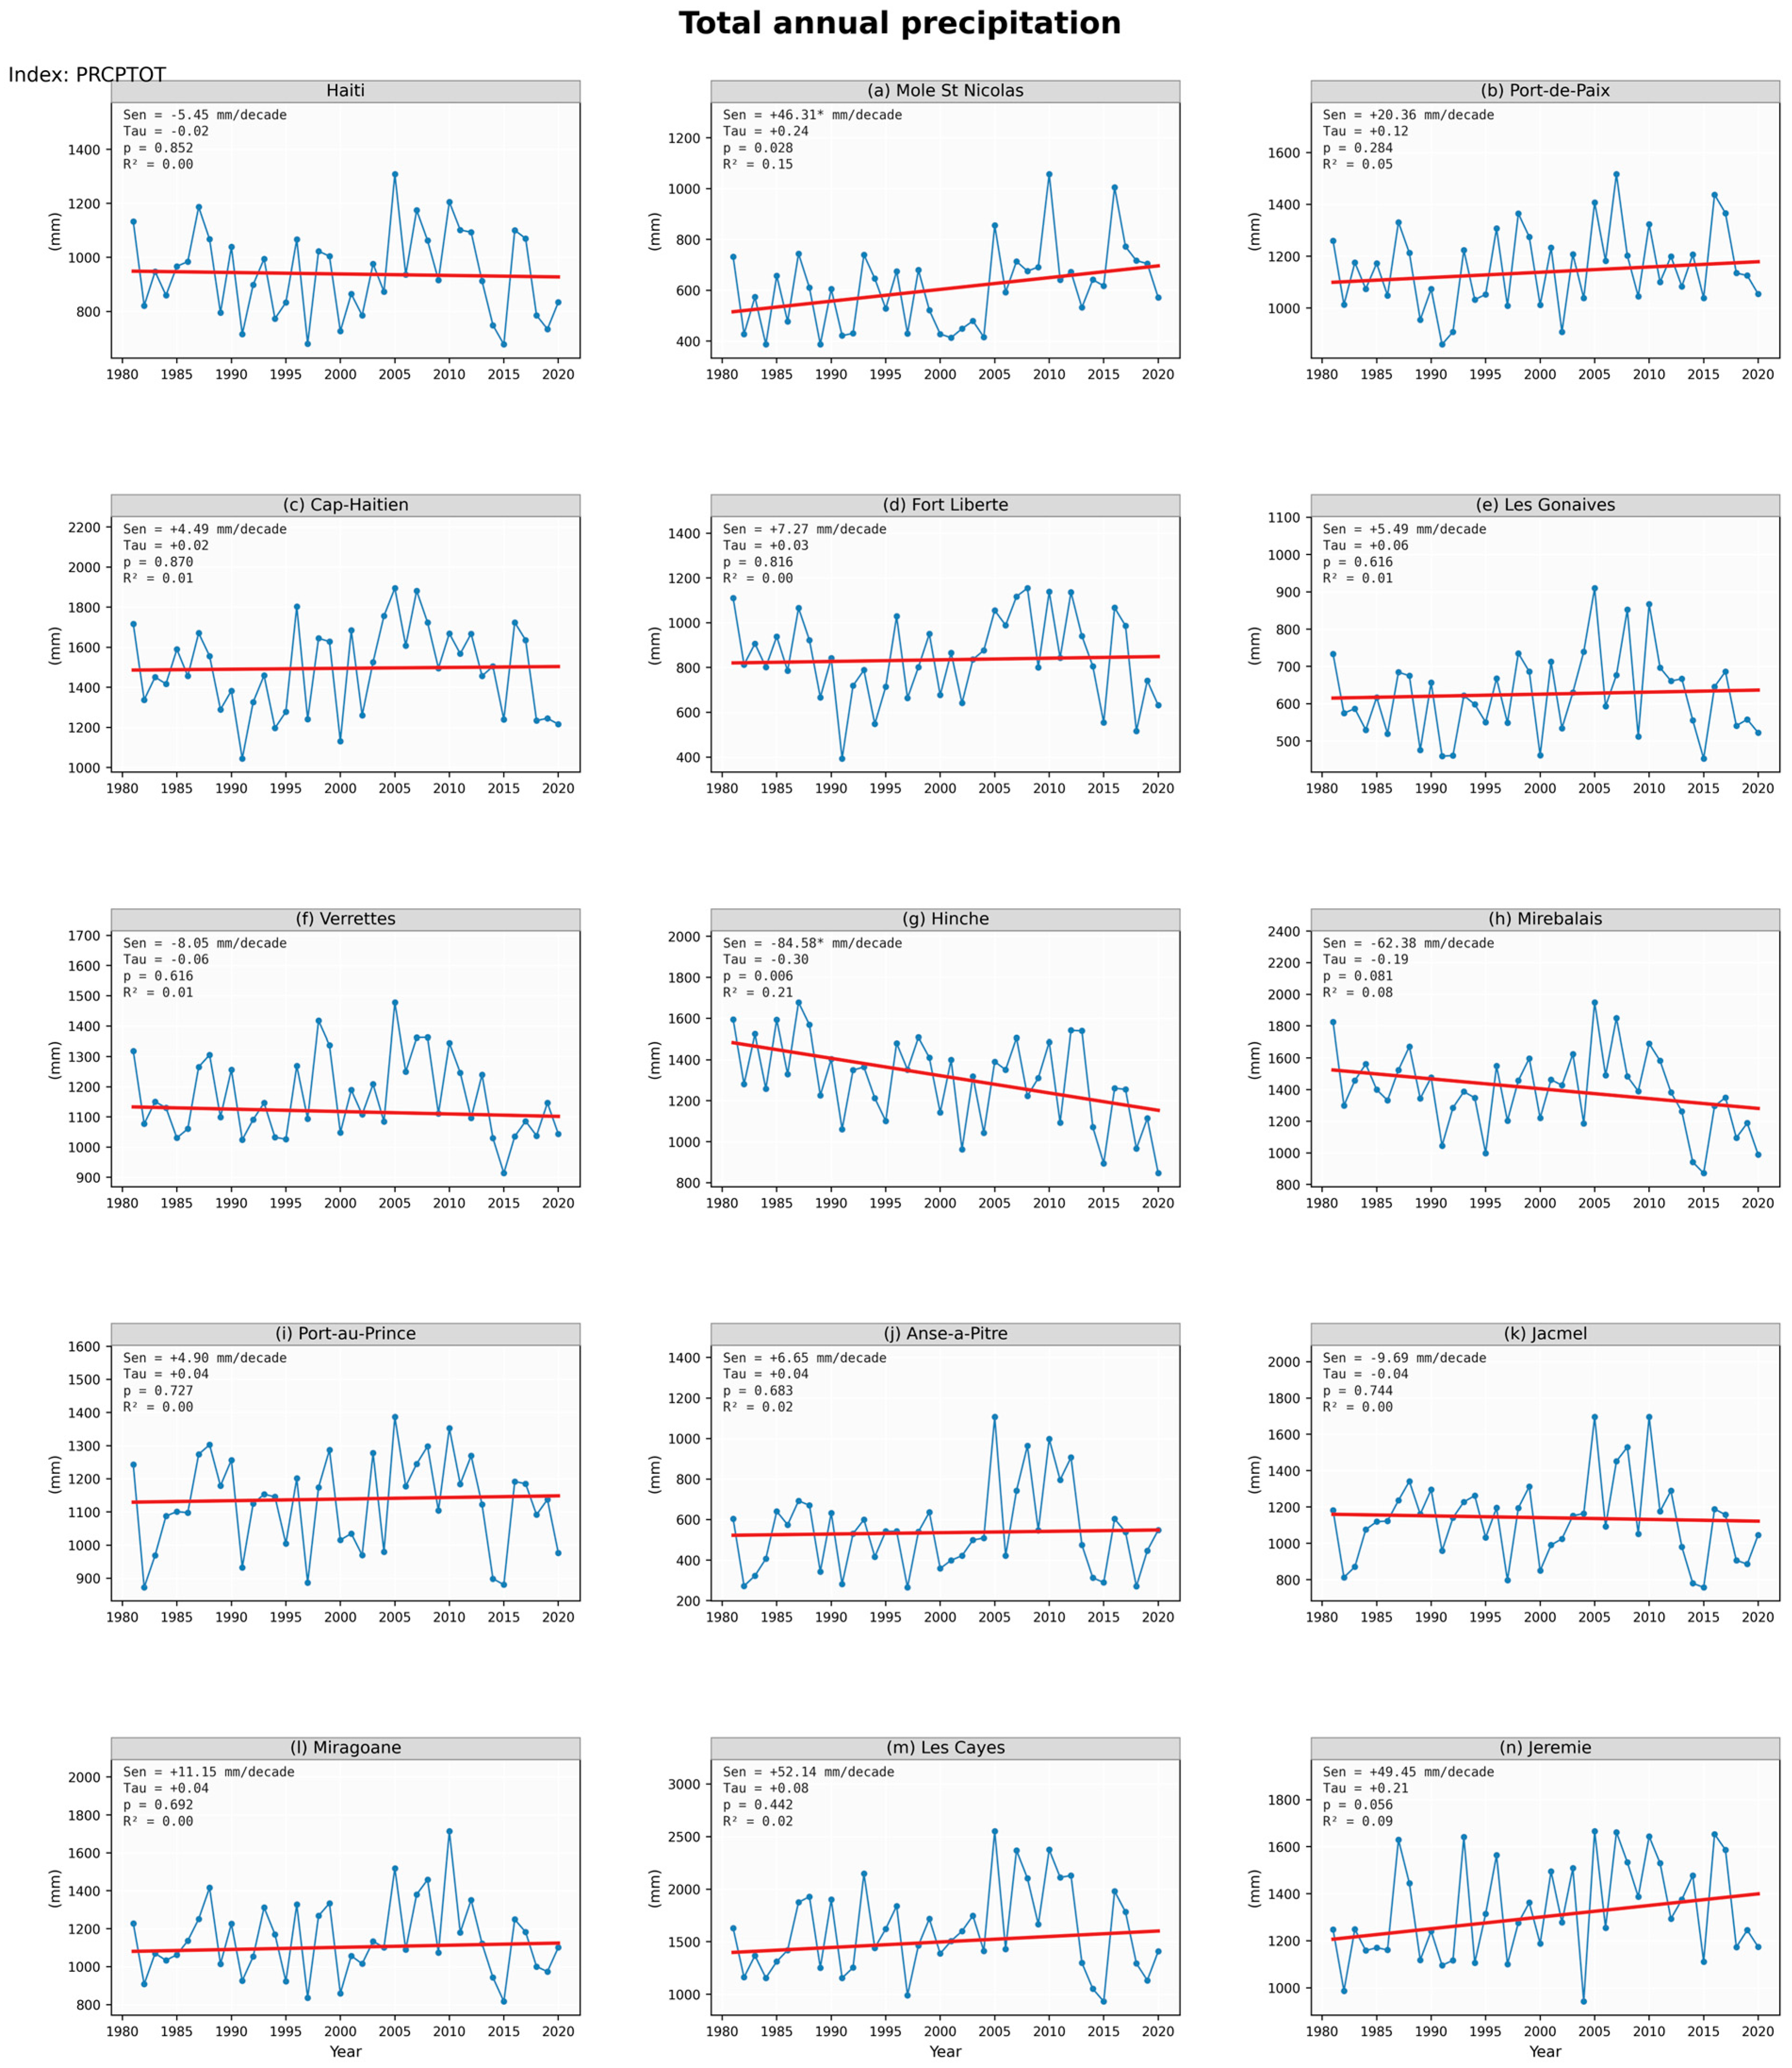
Figure A8.
Number of wet days (RR1)—annual time series for Haiti and the 14 cities of interest (1981–2020). In each panel, the blue line with circular markers shows the observed annual values and the red line shows the Theil–Sen linear fit. Statistics in each panel: Sen slope per decade (* = significant at p < 0.05, MK-TFPW), Kendall tau, p-value, R2.
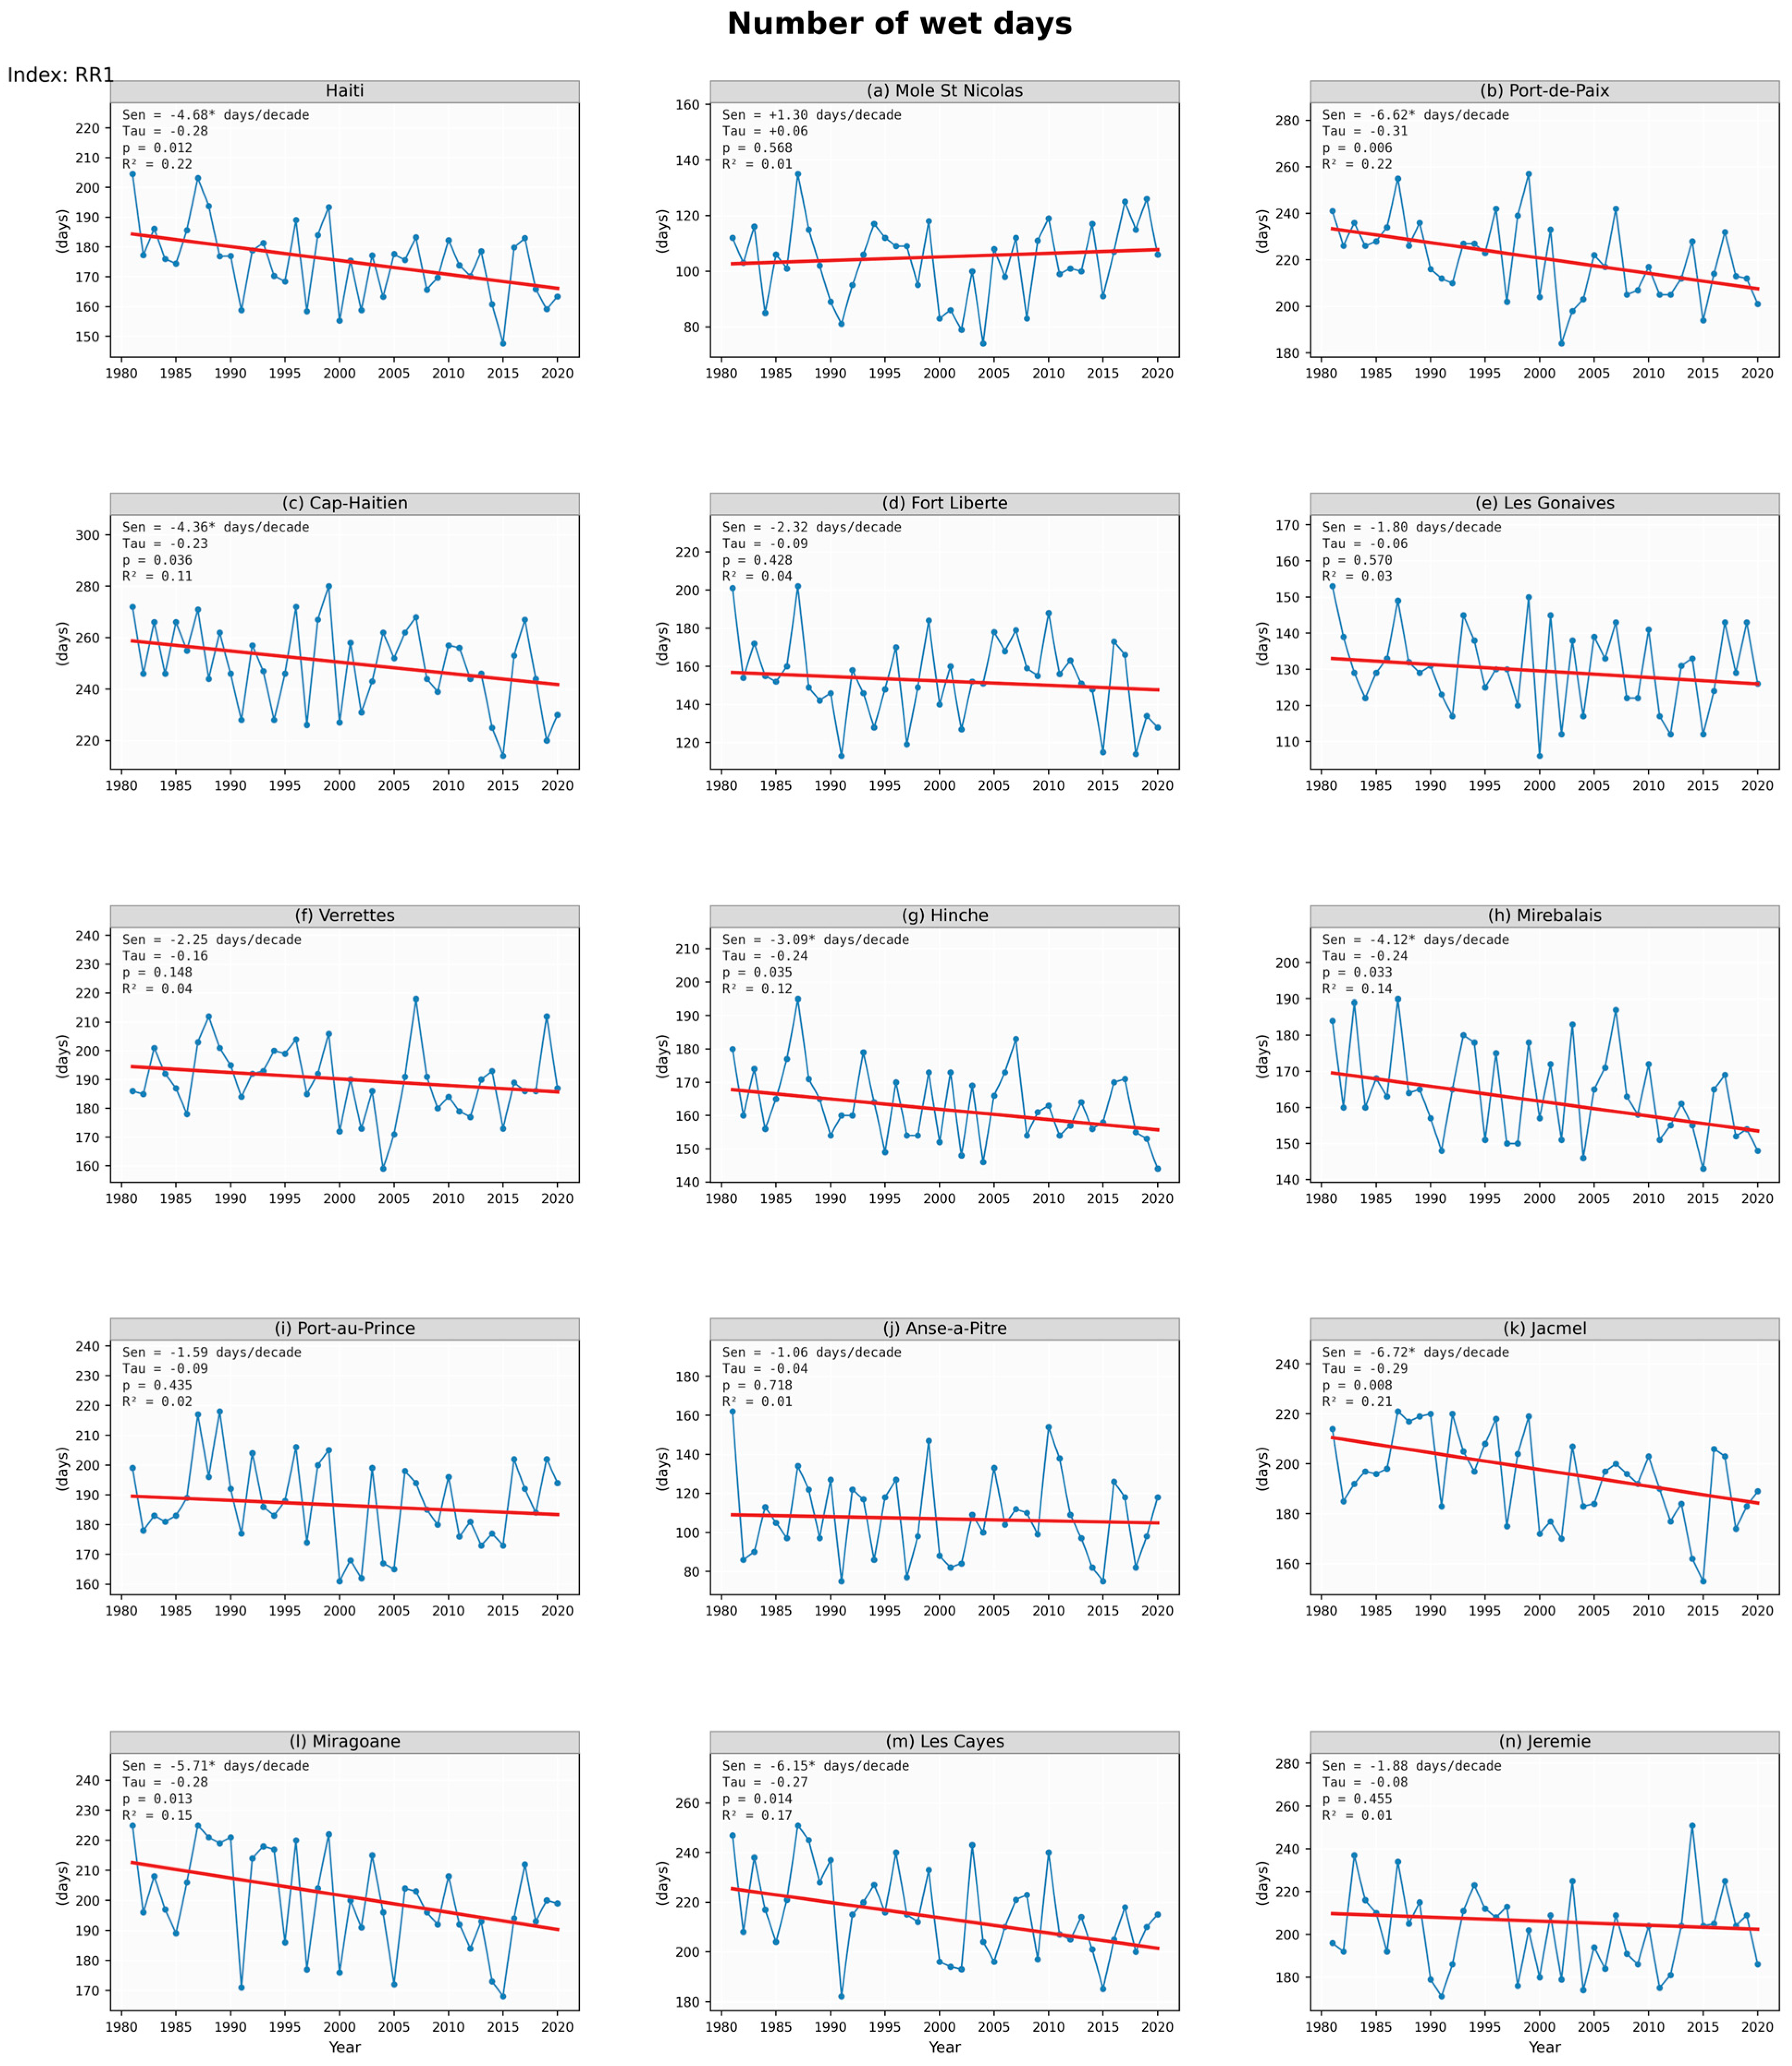
Figure A9.
Simple daily intensity index (SDII)—annual time series for Haiti and the 14 cities of interest (1981–2020). In each panel, the blue line with circular markers shows the observed annual values and the red line shows the Theil–Sen linear fit. Statistics in each panel: Sen slope per decade (* = significant at p < 0.05, MK-TFPW), Kendall tau, p-value, R2.
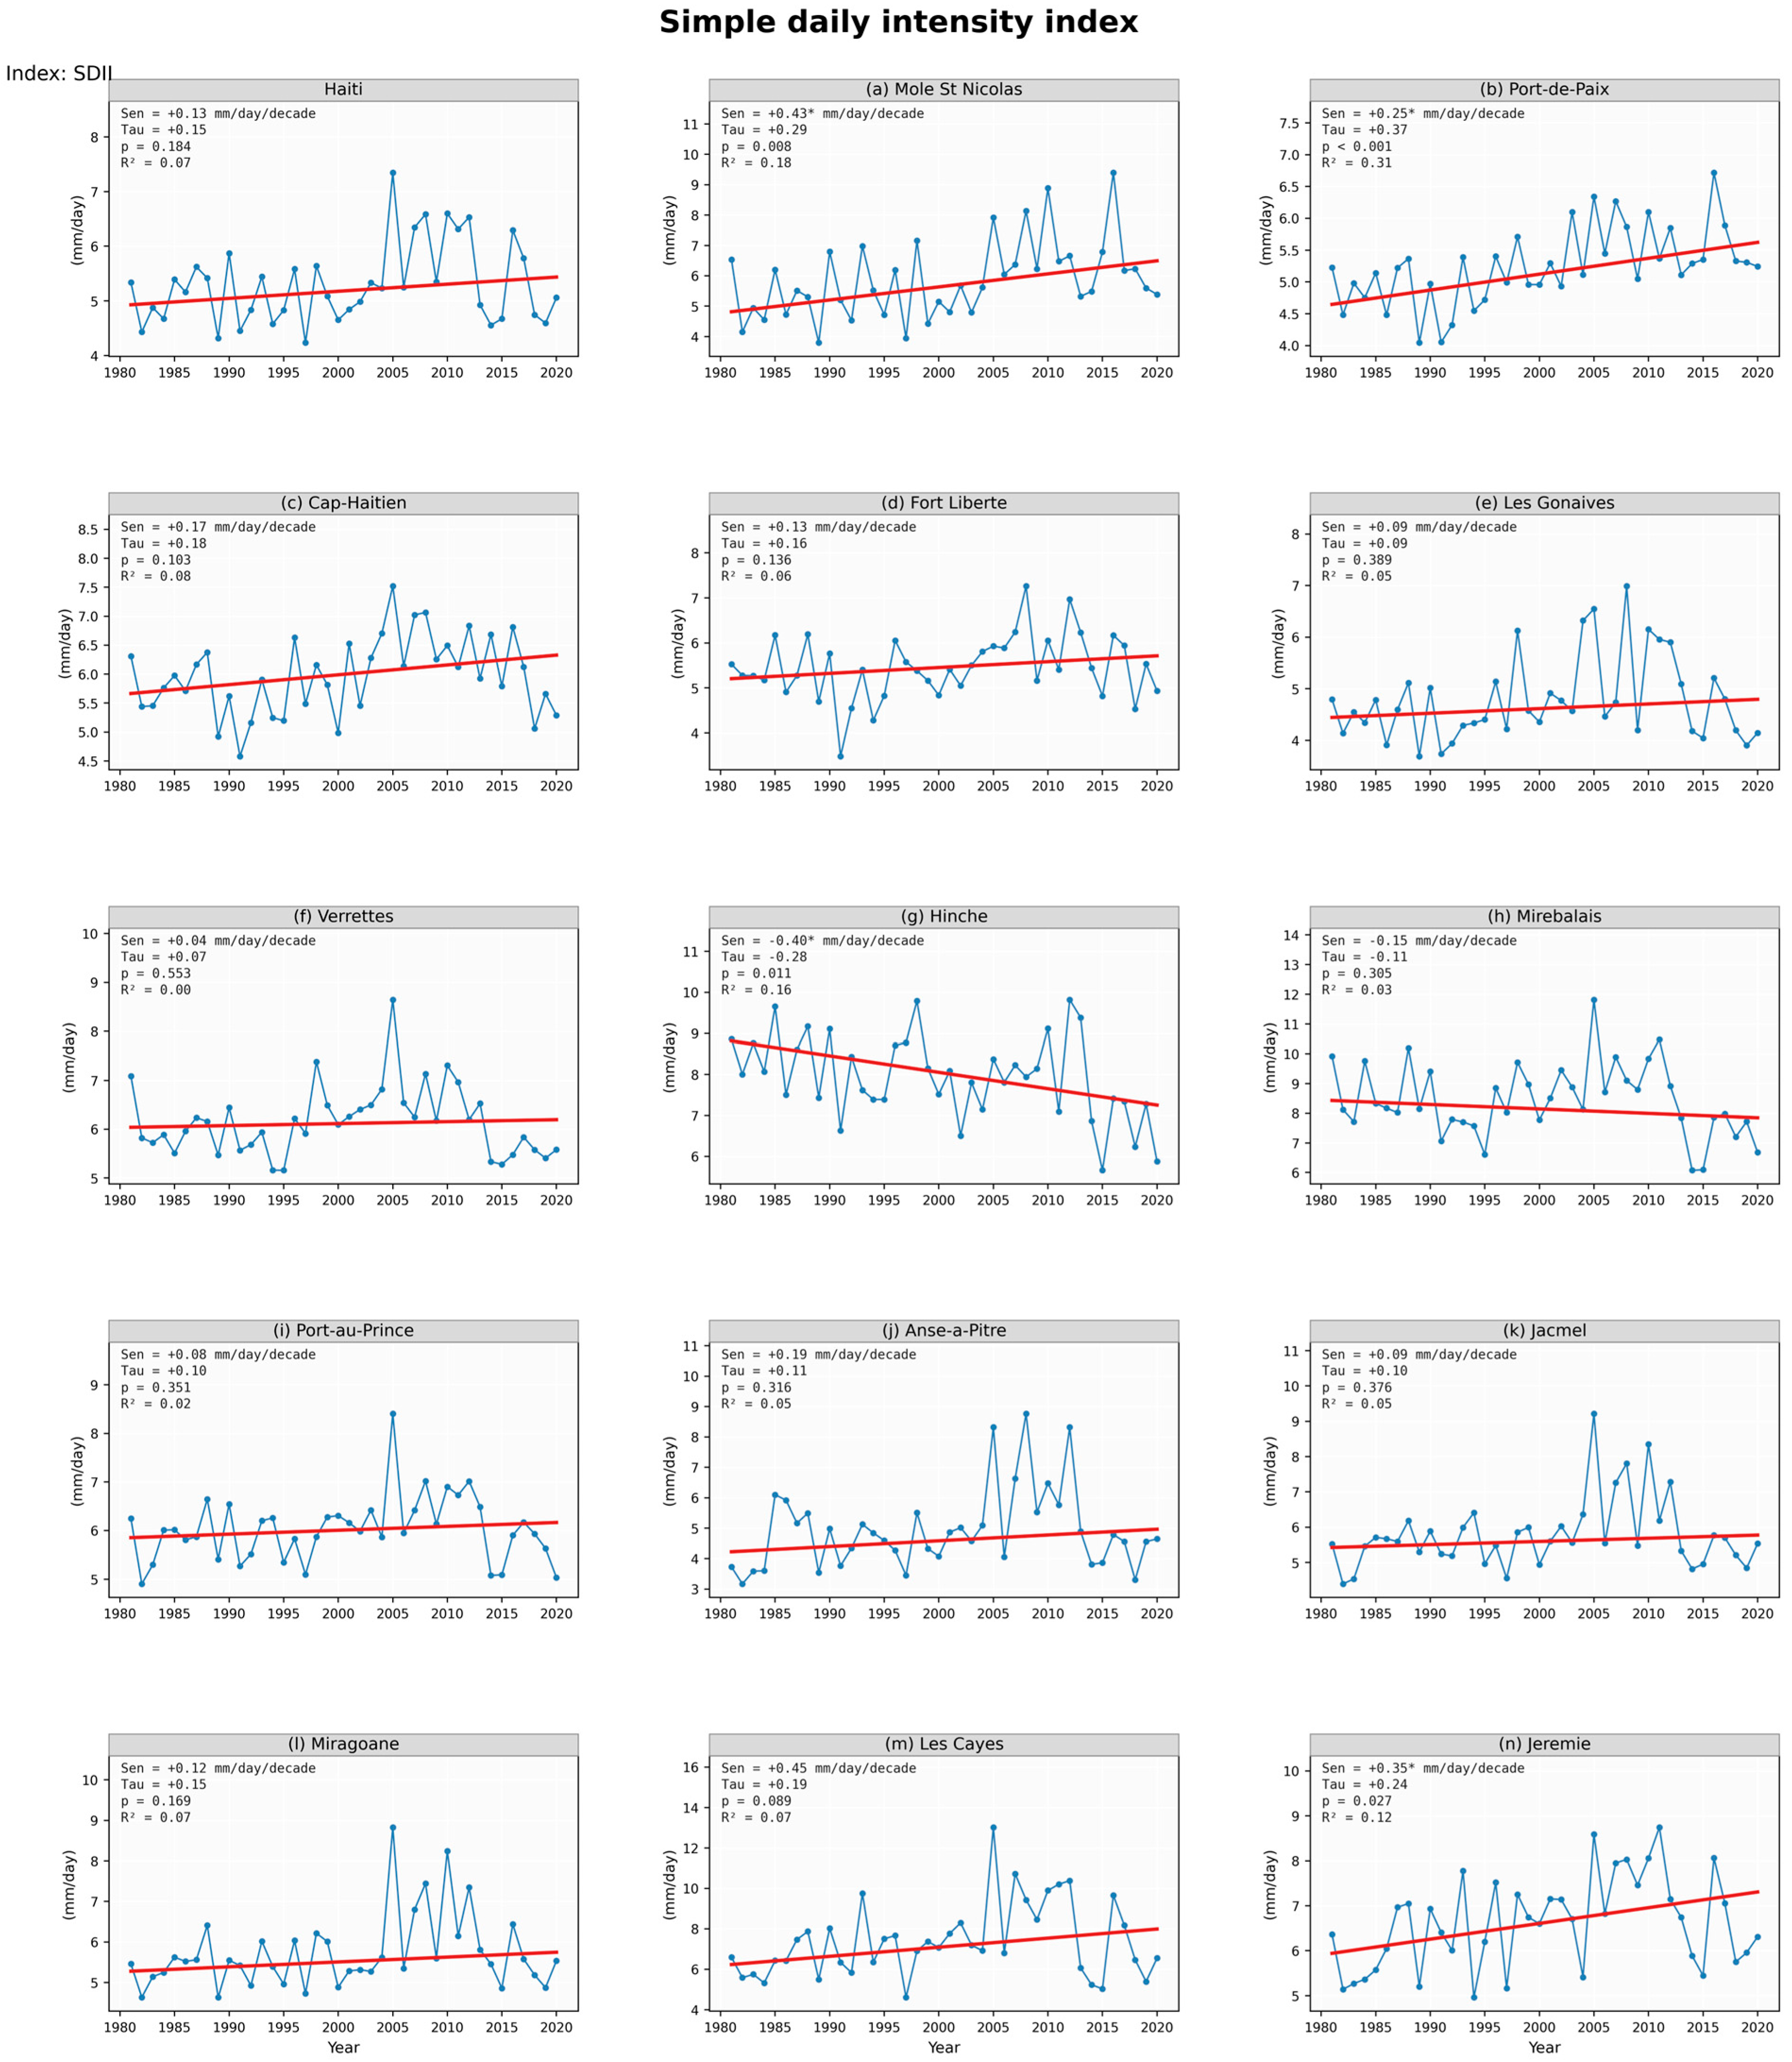
Figure A10.
Very wet days (R90p)—annual time series for Haiti and the 14 cities of interest (1981–2020). In each panel, the blue line with circular markers shows the observed annual values and the red line shows the Theil–Sen linear fit. Statistics in each panel: Sen slope per decade (* = significant at p < 0.05, MK-TFPW), Kendall tau, p-value, R2.
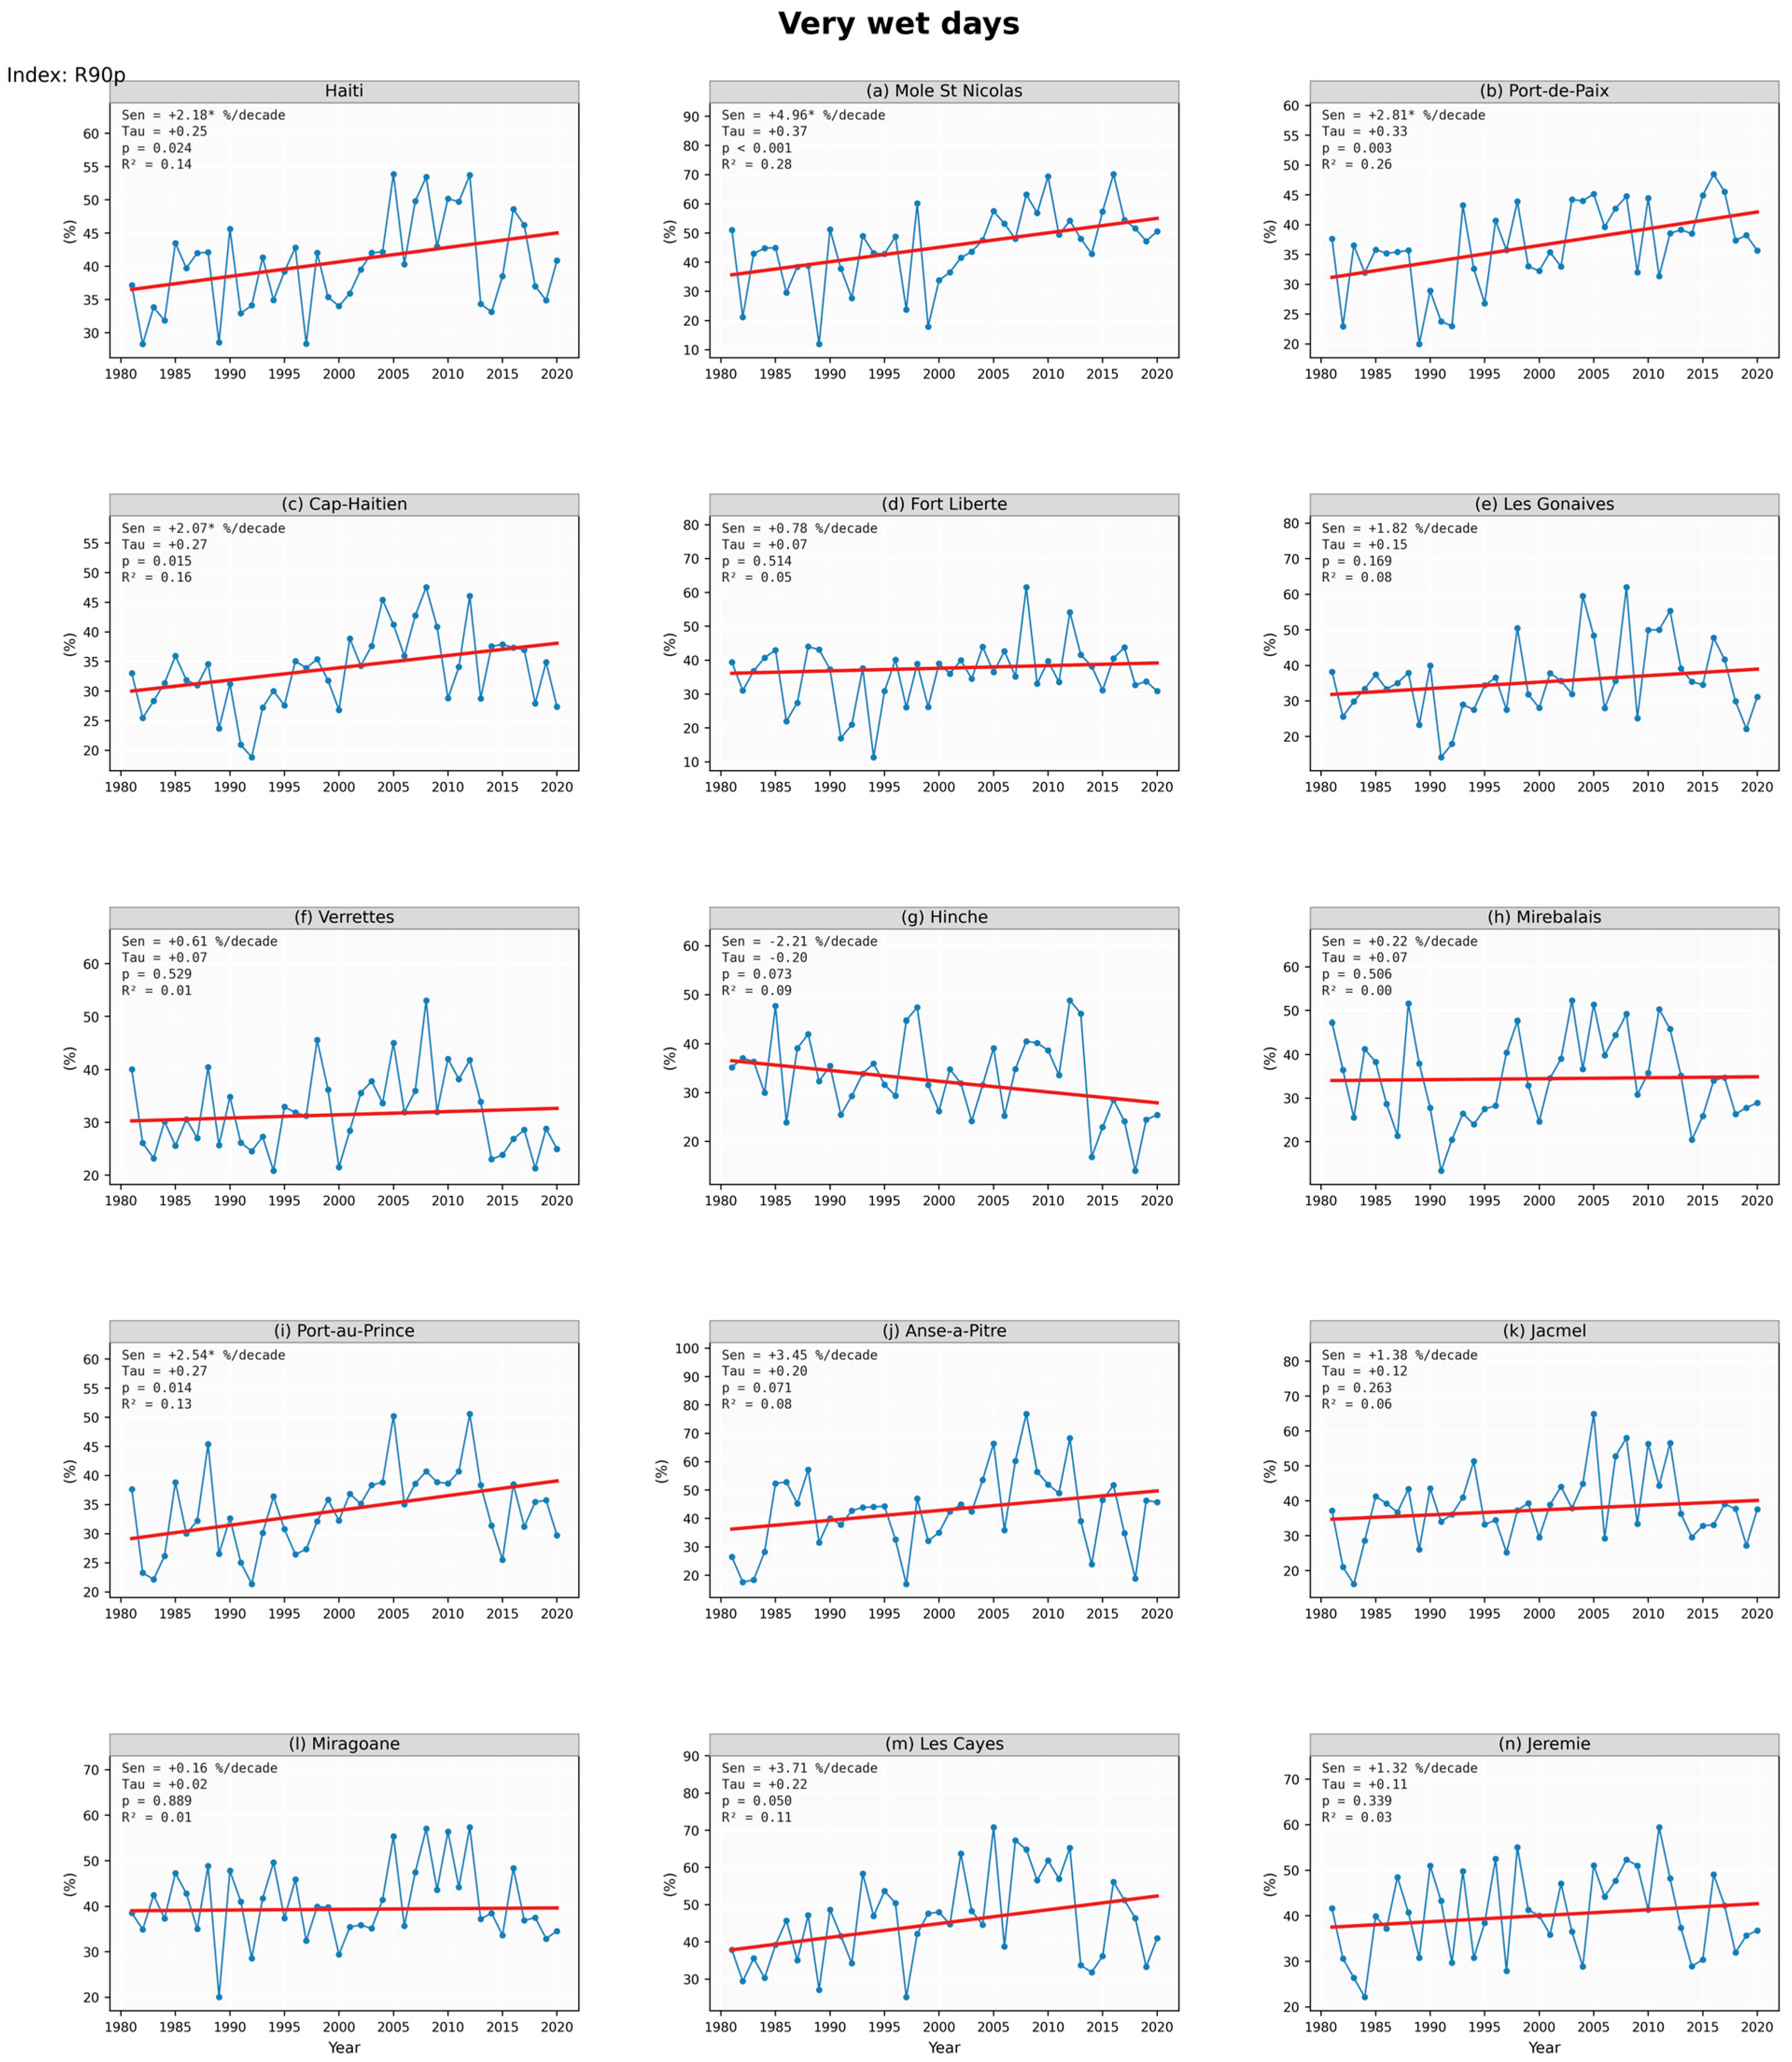
Figure A11.
Maximum consecutive wet days (CWD)—annual time series for Haiti and the 14 cities of interest (1981–2020). In each panel, the blue line with circular markers shows the observed annual values and the red line shows the Theil–Sen linear fit. Statistics in each panel: Sen slope per decade (* = significant at p < 0.05, MK-TFPW), Kendall tau, p-value, R2.
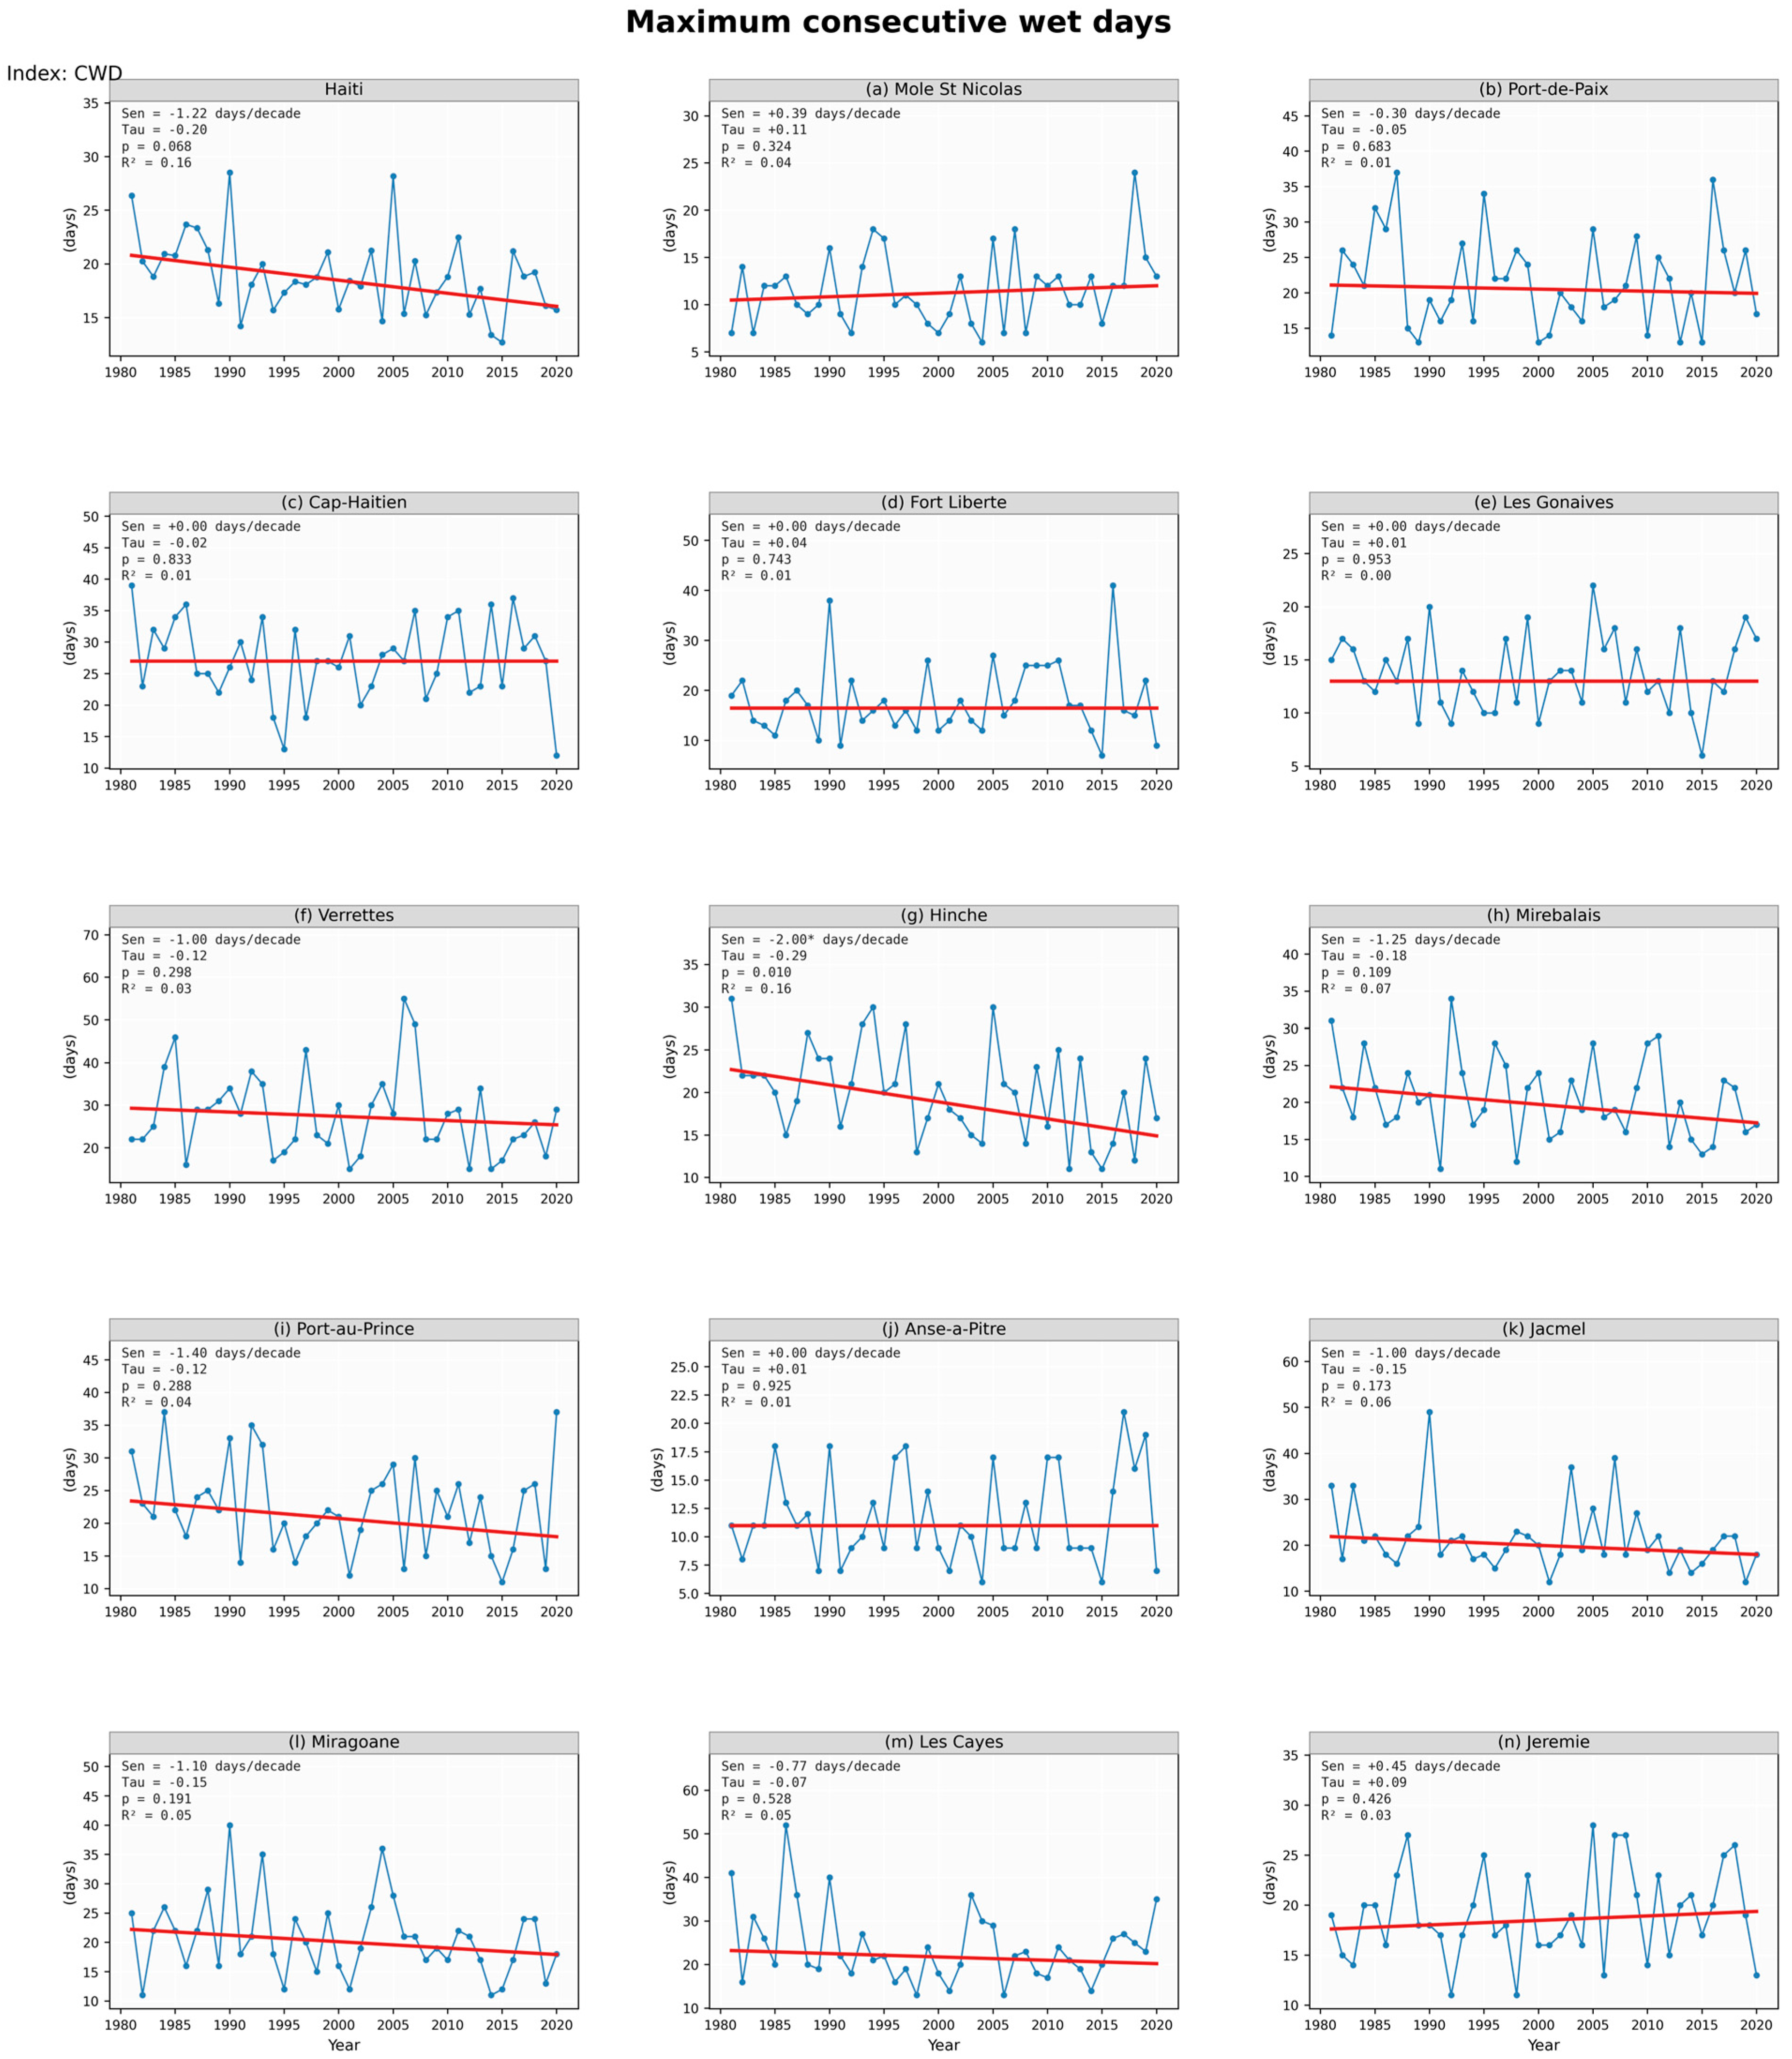
Figure A12.
Maximum consecutive dry days (CDD)—annual time series for Haiti and the 14 cities of interest (1981–2020). In each panel, the blue line with circular markers shows the observed annual values and the red line shows the Theil–Sen linear fit. Statistics in each panel: Sen slope per decade (* = significant at p < 0.05, MK-TFPW), Kendall tau, p-value, R2.
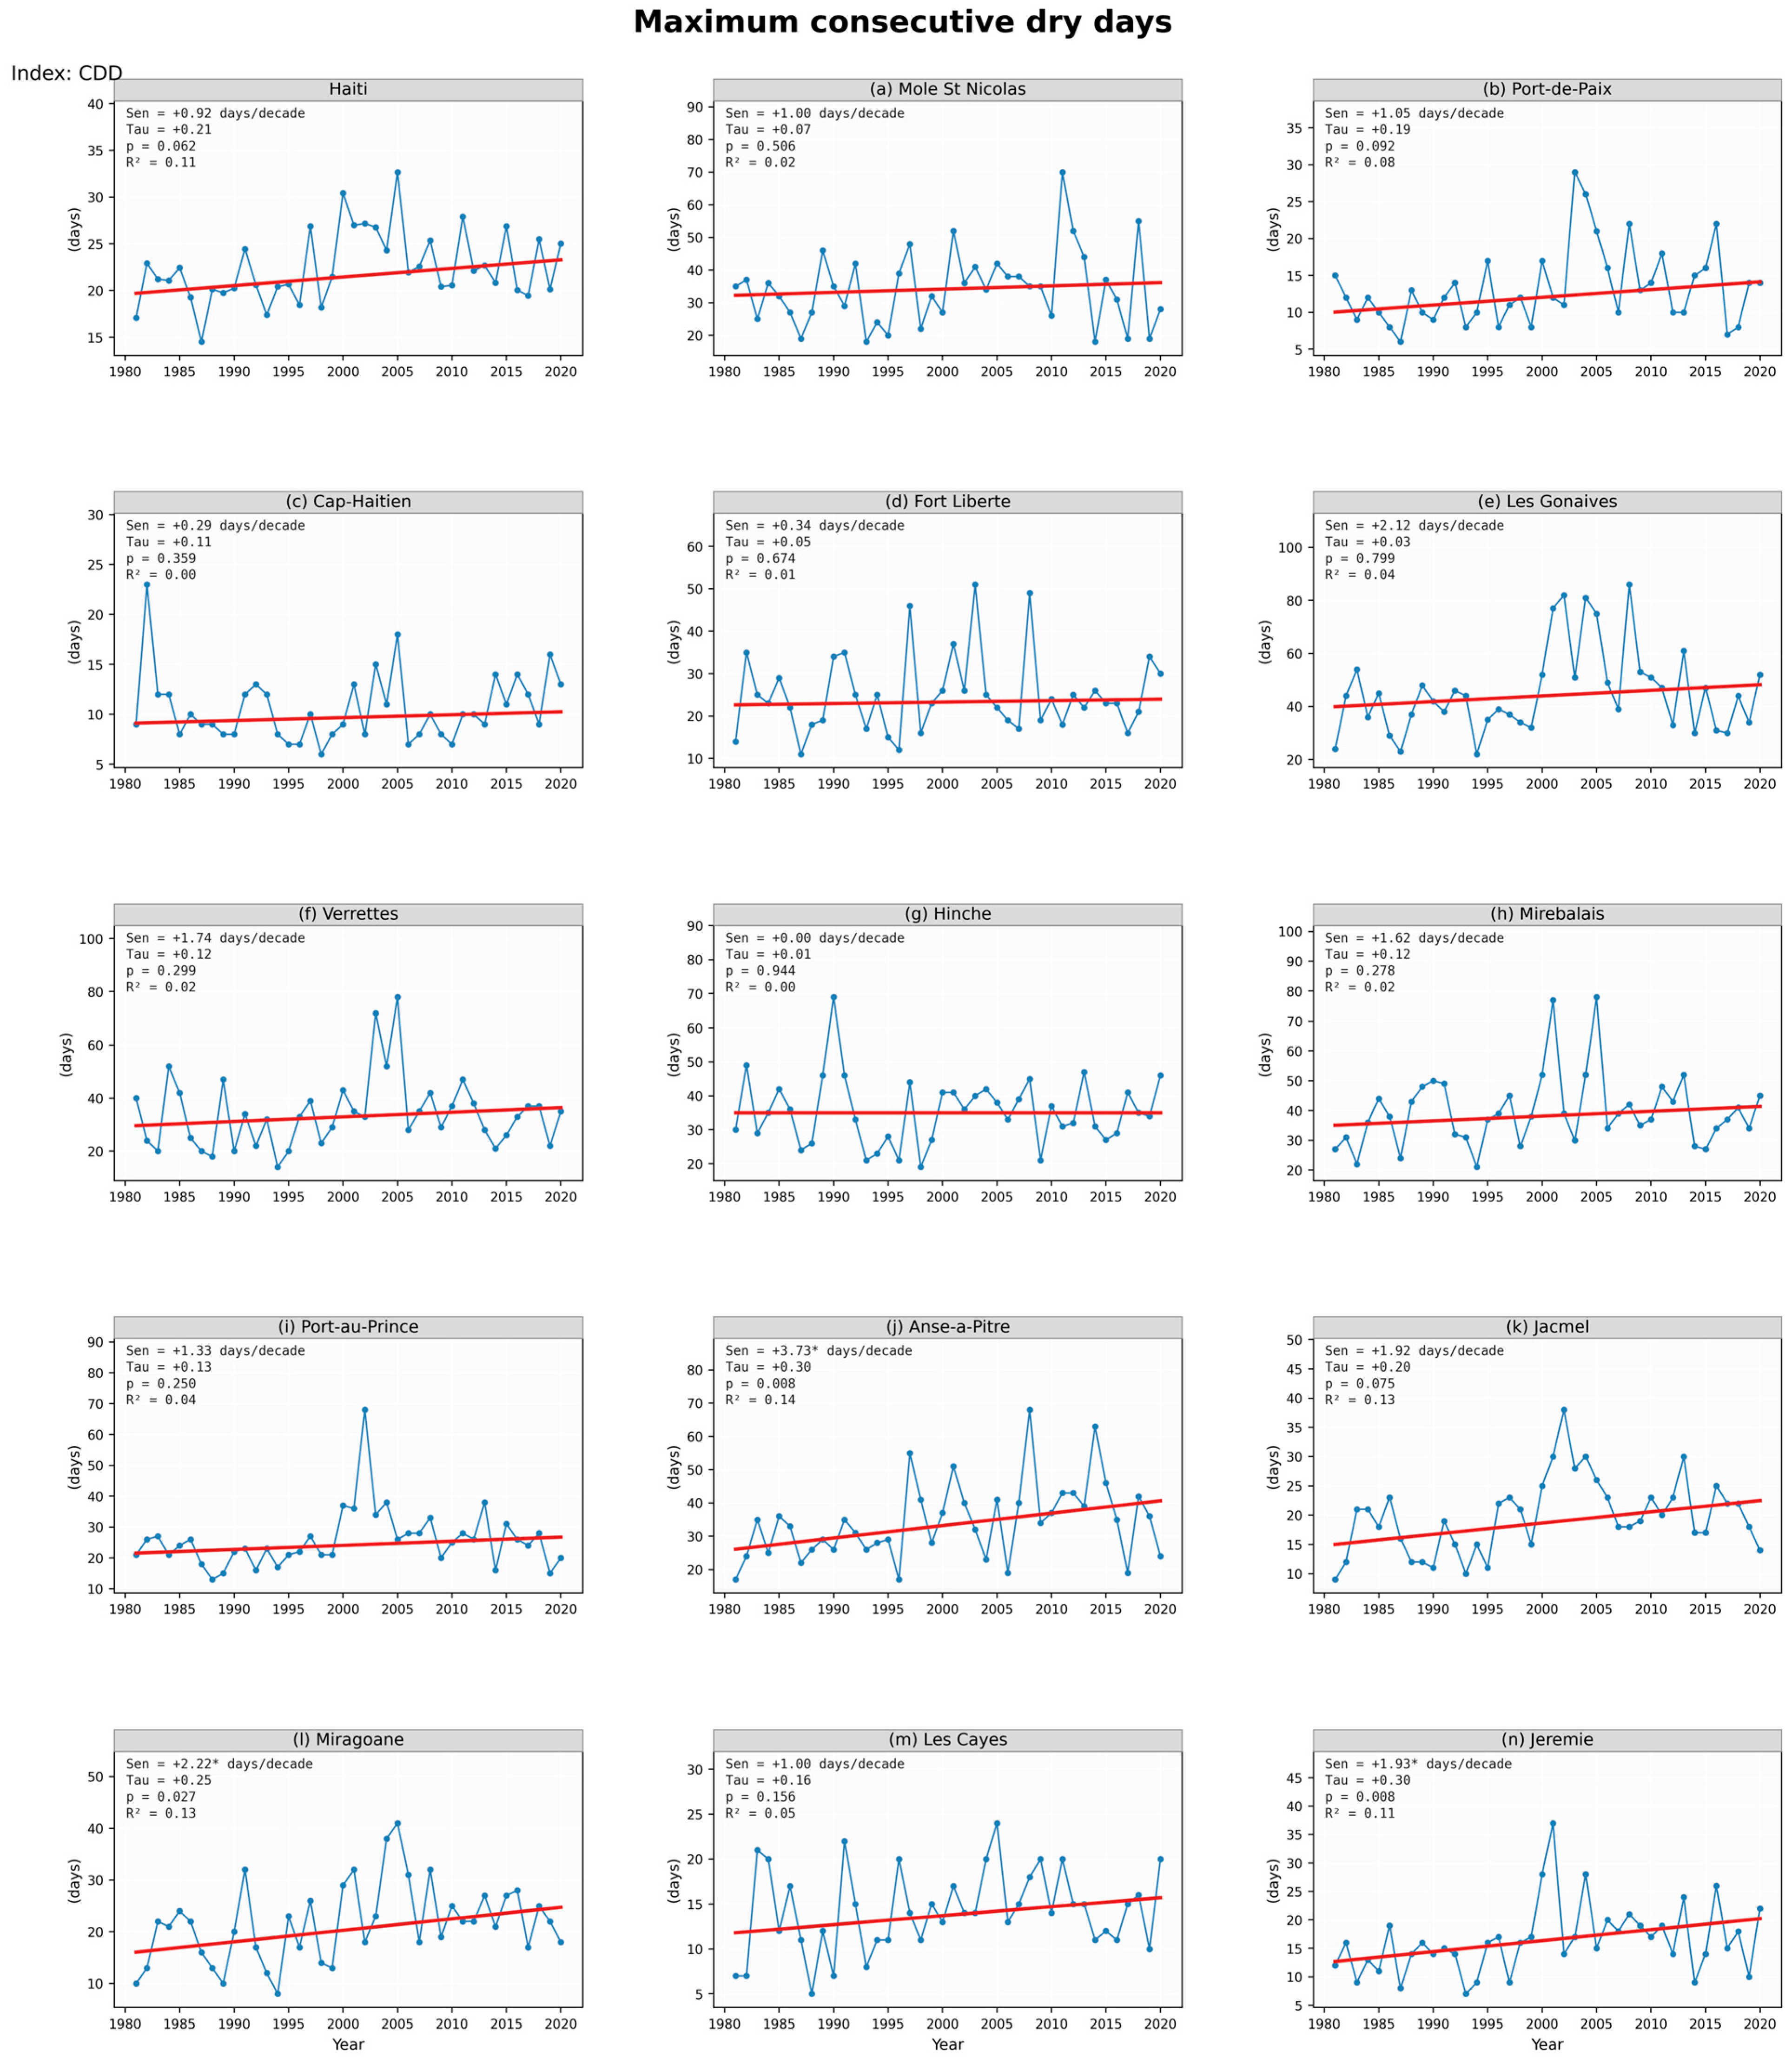
Appendix B. Complementary Humidity Time Series
This appendix provides the city-level annual time series of the two near-surface humidity indicators derived from ERA5-Land (2 m temperature and 2 m dew point, 1981–2020, 0.1° resolution) using the improved Magnus approximation of the saturation vapor pressure [37]. For each panel, Sen’s slope (per decade), the Kendall correlation coefficient (Tau), the associated p-value from the Mann–Kendall test with Trend-Free Pre-Whitening (TFPW), and the coefficient of determination of the linear fit (R2) are reported.
Figure A13.
Annual mean near-surface relative humidity (RH, %) for Haiti and the fourteen cities of interest (1981–2020). The blue line shows the observed annual values, the red line the Sen’s slope fit, and each panel reports the Sen slope per decade, Kendall Tau, p-value of the Mann–Kendall TFPW test, and R2 of the linear regression.
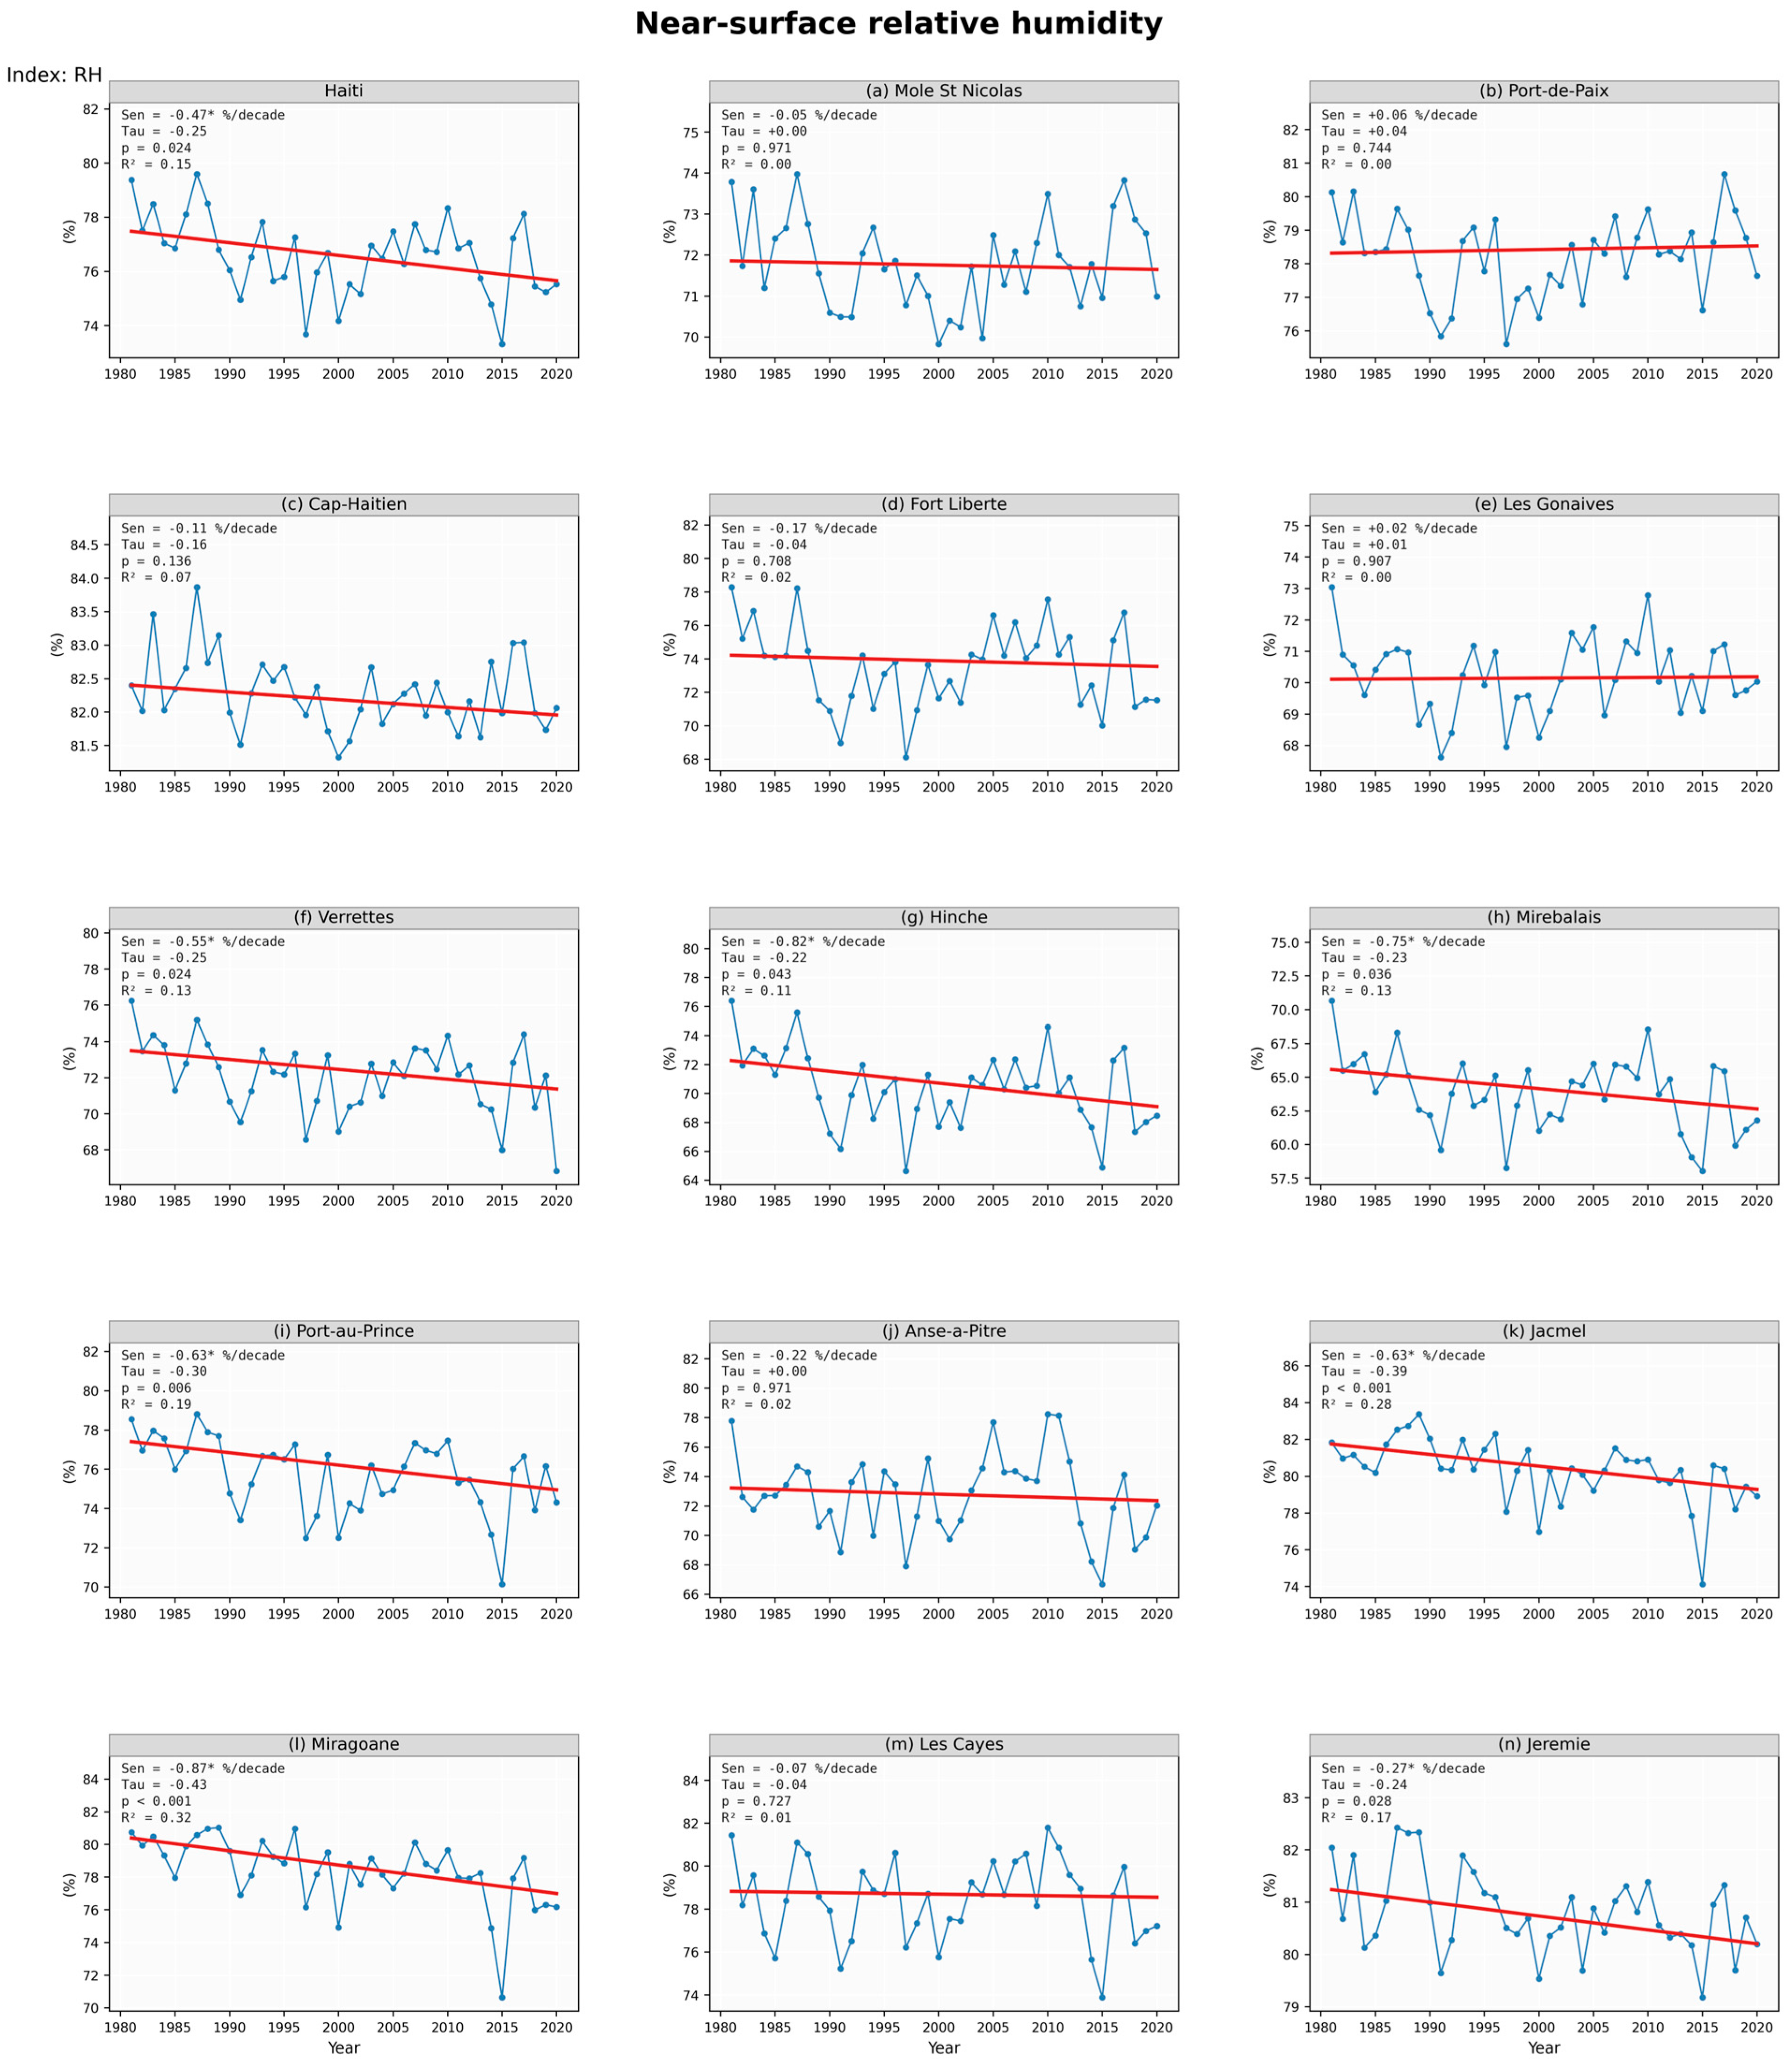
Figure A14.
Annual mean near-surface vapor pressure (e, hPa) for Haiti and the fourteen cities of interest (1981–2020). Same conventions as Figure A13.
Appendix C. Distance Between Each City Centroid and the Nearest Terrestrial Land Cell of the ERA5-Land/MSWEP 0.1° Grid Used for Extraction
Table A1.
Italic city names: coastal cities whose exact centroid falls on an ocean cell; the nearest terrestrial land cell (great-circle minimum, restricted to grid cells with non-constant time series) is used for extraction (national land mask).
References
- Bathelemy, R.; Brigode, P.; Andréassian, V.; Perrin, C.; Moron, V.; Gaucherel, C.; Tric, E.; Boisson, D. Simbi: Historical hydro-meteorological time series and signatures for 24 catchments in Haiti. Earth Syst. Sci. Data 2024, 16, 2073–2098. [Google Scholar] [CrossRef] [Scilit]
- Lewsey, C.; Cid, G.; Kruse, E. Assessing climate change impacts on coastal infrastructure in the Eastern Caribbean. Mar. Policy 2004, 28, 393–409. [Google Scholar] [CrossRef] [Scilit]
- IPCC. Climate Change 2007: Synthesis Report. Contribution of Working Groups I, II and III to the Fourth Assessment Report of the Intergovernmental Panel on Climate Change; IPCC: Geneva, Switzerland, 2007. [Google Scholar]
- IPCC. Climate Change 2021—The Physical Science Basis: Working Group I Contribution to the Sixth Assessment Report of the Intergovernmental Panel on Climate Change; Cambridge University Press: Cambridge, UK; New York, NY, USA, 2021. [Google Scholar]
- Alexander, L.V.; Zhang, X.; Peterson, T.C.; Caesar, J.; Gleason, B.; Klein Tank, A.M.G.; Haylock, M.; Collins, D.; Trewin, B.; Rahimzadeh, F.; et al. Global observed changes in daily climate extremes of temperature and precipitation. J. Geophys. Res. Atmos. 2006, 111, D05109. [Google Scholar] [CrossRef] [Scilit]
- Donat, M.G.; Alexander, L.V.; Yang, H.; Durre, I.; Vose, R.; Dunn, R.J.H.; Willett, K.M. Updated analyses of temperature and precipitation extreme indices since the beginning of the twentieth century: The HadEX2 dataset. J. Geophys. Res. Atmos. 2013, 118, 2098–2118. [Google Scholar] [CrossRef] [Scilit]
- Stephenson, T.S.; Vincent, L.A.; Allen, T.; Van Meerbeeck, C.J.; McLean, N.; Peterson, T.C.; Taylor, M.A.; Aaron-Morrison, A.P.; Auguste, T.; Bernard, D.; et al. Changes in extreme temperature and precipitation in the Caribbean region, 1961–2010. Int. J. Climatol. 2014, 34, 2957–2971. [Google Scholar] [CrossRef] [Scilit]
- Dookie, N.; Chadee, X.T.; Clarke, R.M. Trends in extreme temperature and precipitation indices for the Caribbean small islands: Trinidad and Tobago. Theor. Appl. Climatol. 2019, 136, 31–44. [Google Scholar] [CrossRef] [Scilit]
- Beharry, S.L.; Clarke, R.M.; Kumarsingh, K. Variations in extreme temperature and precipitation for a Caribbean island: Trinidad. Theor. Appl. Climatol. 2015, 122, 783–797. [Google Scholar] [CrossRef] [Scilit]
- Zhang, X.; Alexander, L.; Hegerl, G.C.; Jones, P.; Tank, A.K.; Peterson, T.C.; Trewin, B.; Zwiers, F.W. Indices for monitoring changes in extremes based on daily temperature and precipitation data. WIREs Clim. Change 2011, 2, 851–870. [Google Scholar] [CrossRef] [Scilit]
- Frich, P.; Alexander, L.; Della-Marta, P.; Gleason, B.; Haylock, M.; Klein Tank, A.; Peterson, T. Observed coherent changes in climatic extremes during the second half of the twentieth century. Clim. Res. 2002, 19, 193–212. [Google Scholar] [CrossRef] [Scilit]
- Sillmann, J.; Kharin, V.; Zhang, X.; Zwiers, F.; Bronaugh, D. Climate extremes indices in the CMIP5 multimodel ensemble: Part 1. Model evaluation in the present climate. J. Geophys. Res. Atmos. 2013, 118, 1716–1733. [Google Scholar] [CrossRef] [Scilit]
- Dai, A.; Trenberth, K.E.; Karl, T.R. Effects of Clouds, Soil Moisture, Precipitation, and Water Vapor on Diurnal Temperature Range. J. Clim. 1999, 12, 2451–2473. [Google Scholar] [CrossRef] [Scilit]
- Muse, N.; McNoldy, B.D.; Clement, A.; Mach, K.J. Nighttime land surface temperature and thermal discomfort in a seasonally muggy climate. Clim. Change 2025, 178, 176. [Google Scholar] [CrossRef] [Scilit]
- Taylor, M.; Alfaro Martínez, E.J. Climate of Central America and the Caribbean, Climate of. In Encyclopedia of World Climatology; Springer: Dordrecht, The Netherlands, 2005. [Google Scholar] [CrossRef] [Scilit]
- MTPTC. Unité Hydrométéorologique d’Haïti—Observations et Données Climatologiques. Available online: https://www.meteo-haiti.gouv.ht/ (accessed on 16 July 2026).
- MDE (Ministere de l’Environnement de la Republique d’Haiti). Deuxieme Communication Nationale sur les Changements Climatiques. Available online: https://unfccc.int/resource/docs/natc/htinc2.pdf (accessed on 15 July 2026).
- MDE (Ministere de l’Environnement de la Republique d’Haiti). Contribution Prevue Determinee au Niveau National (CPDN) d’Haiti. Available online: https://unfccc.int/sites/default/files/NDC/2022-06/CPDN_Republique%20d'Haiti.pdf (accessed on 15 July 2026).
- Moron, V.; Frelat, R.; Jean-Jeune, K.; Gaucherel, C. Interannual and intra-annual variability of rainfall in Haiti (1905–2005). Clim. Dyn. 2015, 45, 915–932. [Google Scholar] [CrossRef] [Scilit]
- Peterson, T.C.; Taylor, M.A.; Demeritte, R.; Duncombe, D.L.; Burton, S.; Thompson, F.; Porter, A.; Mercedes, M.; Villegas, E.; Semexant Fils, R.; et al. Recent changes in climate extremes in the Caribbean region. J. Geophys. Res. Atmos. 2002, 107, 4601. [Google Scholar] [CrossRef] [Scilit]
- Muñoz Sabater, J. ERA5-Land Hourly Data from 1950 to Present; Copernicus Climate Change Service (C3S): Reading, UK, 2019. [Google Scholar] [CrossRef]
- Beck, H.E.; Pan, M.; Roy, T.; Weedon, G.P.; Pappenberger, F.; Van Dijk, A.I.; Huffman, G.J.; Adler, R.F.; Wood, E.F. Daily evaluation of 26 precipitation datasets using Stage-IV gauge-radar data for the CONUS. Hydrol. Earth Syst. Sci. 2019, 23, 207–224. [Google Scholar] [CrossRef] [Scilit]
- Bathelemy, R.; Brigode, P.; Boisson, D.; Tric, E. Rainfall in the Greater and Lesser Antilles: Performance of five gridded datasets on a daily timescale. J. Hydrol. Reg. Stud. 2022, 43, 101203. [Google Scholar] [CrossRef] [Scilit]
- Centella-Artola, A.; Bezanilla-Morlot, A.; Taylor, M.A.; Herrera, D.A.; Martinez-Castro, D.; Gouirand, I.; Sierra-Lorenzo, M.; Vichot-Llano, A.; Stephenson, T.; Fonseca, C.; et al. Evaluation of Sixteen Gridded Precipitation Datasets over the Caribbean Region Using Gauge Observations. Atmosphere 2020, 11, 1334. [Google Scholar] [CrossRef] [Scilit]
- Vega-Durán, J.; Escalante-Castro, B.; Canales, F.A.; Acuña, G.J.; Kaźmierczak, B. Evaluation of Areal Monthly Average Precipitation Estimates from MERRA2 and ERA5 Reanalysis in a Colombian Caribbean Basin. Atmosphere 2021, 12, 1430. [Google Scholar] [CrossRef] [Scilit]
- Beyene, T.K.; Jain, M.K.; Yadav, B.K.; Agarwal, A. Multiscale investigation of precipitation extremes over Ethiopia and teleconnections to large-scale climate anomalies. Stoch. Environ. Res. Risk Assess. 2022, 36, 1503–1519. [Google Scholar] [CrossRef] [Scilit]
- Zhang, X.; Hegerl, G.; Zwiers, F.W.; Kenyon, J. Avoiding Inhomogeneity in Percentile-Based Indices of Temperature Extremes. J. Clim. 2005, 18, 1641–1651. [Google Scholar] [CrossRef] [Scilit]
- Sen, P.K. Estimates of the Regression Coefficient Based on Kendall’s Tau. J. Am. Stat. Assoc. 1968, 63, 1379–1389. [Google Scholar] [CrossRef]
- Yue, S.; Wang, C.Y. Regional streamflow trend detection with consideration of both temporal and spatial correlation. Int. J. Climatol. 2002, 22, 933–946. [Google Scholar] [CrossRef] [Scilit]
- Yue, S.; Pilon, P. A comparison of the power of the t test, Mann-Kendall and bootstrap tests for trend detection. Hydrol. Sci. J. 2004, 49, 21–37. [Google Scholar] [CrossRef] [Scilit]
- Mann, H.B. Nonparametric tests against trend. Econometrica 1945, 13, 245–259. [Google Scholar] [CrossRef] [Scilit]
- Kendall, M.G. Rank Correlation Methods, 4th ed.; Charles Griffin: London, UK, 1975. [Google Scholar]
- Sirois, A. A Brief and Biased Overview of Time Series Analysis or How to Find That Evasive Trend; Unpublished Internal Report; Atmospheric Environment Service, Environment Canada: Downsview, ON, Canada, 1998.
- Mitchell, J.M., Jr.; Dzerdzeevskii, B.; Flohn, H.; Hofmeyr, W.L.; Lamb, H.H.; Rao, K.N.; Wallén. Climatic Change: Report of a Working Group of the Commission for Climatology; WMO Technical Note No. 79, WMO-No. 195, TP-100; World Meteorological Organization: Geneva, Switzerland, 1966; Available online: https://library.wmo.int/viewer/58659/download?file=WMO-195.pdf&type=pdf&navigator=1 (accessed on 15 July 2026).
- Hallouz, F.; Meddi, M.; Mahe, G.; Karahacane, H.; Ali Rahmani, S. Tendance des précipitations et évolution des écoulements dans un cadre de changement climatique: Bassin versant de l’oued Mina en Algérie. J. Water Sci. 2019, 32, 83–114. [Google Scholar] [CrossRef] [Scilit]
- Motiee, H.; McBean, E. An assessment of long-term trends in hydrologic components and implications for water levels in Lake Superior. Hydrol. Res. 2009, 40, 564–579. [Google Scholar] [CrossRef] [Scilit]
- Alduchov, O.A.; Eskridge, R.E. Improved Magnus Form Approximation of Saturation Vapor Pressure. J. Appl. Meteorol. Climatol. 1996, 35, 601–609. [Google Scholar] [CrossRef] [Scilit]
- Benjamini, Y.; Hochberg, Y. Controlling the False Discovery Rate: A Practical and Powerful Approach to Multiple Testing. J. R. Stat. Soc. Ser. B Methodol. 1995, 57, 289–300. [Google Scholar] [CrossRef] [Scilit]
- Wilks, D.S. “The Stippling Shows Statistically Significant Grid Points”: How Research Results are Routinely Overstated and Overinterpreted, and What to Do about It. Bull. Am. Meteorol. Soc. 2016, 97, 2263–2273. [Google Scholar] [CrossRef] [Scilit]
- Di Napoli, C.; Allen, T.; Méndez-Lázaro, P.A.; Pappenberger, F. Heat stress in the Caribbean: Climatology, drivers, and trends of human biometeorology indices. Int. J. Climatol. 2023, 43, 405–425. [Google Scholar] [CrossRef] [Scilit] [PubMed]
- Mohan, S.; Clarke, R.M.; Chadee, X.T. Variations in extreme temperature and precipitation for a Caribbean island: Barbados (1969–2017). Theor. Appl. Climatol. 2020, 140, 1277–1290. [Google Scholar] [CrossRef] [Scilit]
- Filahi, S.; Tanarhte, M.; Mouhir, L.; El Morhit, M.; Tramblay, Y. Trends in indices of daily temperature and precipitations extremes in Morocco. Theor. Appl. Climatol. 2016, 124, 959–972. [Google Scholar] [CrossRef] [Scilit]
- Jury, M.R. Inter-annual rainfall variability in the eastern Antilles and coupling with the regional and intra-seasonal circulation. Theor. Appl. Climatol. 2016, 126, 727–737. [Google Scholar] [CrossRef] [Scilit]
- Oppong, F.B.; Gonzalez, S.; Hibbert, K.; Méndez-Lázaro, P.A.; González-Cruz, J.E. Climatology and Large-Scale Drivers of Extreme Heatwaves in the Caribbean: From 1971 to 2025. Geophys. Res. Lett. 2025, 52, e2025GL117649. [Google Scholar] [CrossRef] [Scilit]
- Jones, P.D.; Harpham, C.; Harris, I.; Goodess, C.M.; Burton, A.; Centella-Artola, A.; Taylor, M.A.; Bezanilla-Morlot, A.; Campbell, J.D.; Stephenson, T.S.; et al. Long-term trends in precipitation and temperature across the Caribbean. Int. J. Climatol. 2016, 36, 3314–3333. [Google Scholar] [CrossRef] [Scilit]
- Beharry, S.L.; Clarke, R.M.; Kumarsingh, K. Precipitation trends using in-situ and gridded datasets. Theor. Appl. Climatol. 2014, 115, 599–607. [Google Scholar] [CrossRef] [Scilit]
- Destouches, C.; Diedhiou, A.; Anquetin, S.; Hingray, B.; Pierre, A.; Boisson, D.; Joseph, A. Changes in extreme precipitation patterns over the Greater Antilles and teleconnection with large-scale sea surface temperature. Earth Syst. Dyn. 2025, 16, 497–512. [Google Scholar] [CrossRef] [Scilit]



Disclaimer/Publisher’s Note: The statements, opinions and data contained in all publications are solely those of the individual author(s) and contributor(s) and not of MDPI and/or the editor(s). MDPI and/or the editor(s) disclaim responsibility for any injury to people or property resulting from any ideas, methods, instructions or products referred to in the content. |
© 2026 by the authors. Licensee MDPI, Basel, Switzerland. This article is an open access article distributed under the terms and conditions of the Creative Commons Attribution (CC BY) license.