


Abstract
This study investigated indoor environmental air quality (IEAQ) across university workspaces at a higher education institution in Sharjah, United Arab Emirates (UAE), assessing environmental conditions that may influence occupant health, the surrounding environment, and sustainability. Physical parameters (temperature, relative humidity, noise, and illuminance), chemical parameters (indoor gases and particulate matter), and biological contaminants (airborne bacteria and fungi) were measured in semi-occupied indoor environments with a total of 68 random samples collected and analyzed. Perceived heat discomfort and environmental variability were assessed using the Thom Discomfort Index (TDI), Humidex Index, ANOVA, Kruskal–Wallis, Mann–Whitney U, and one-sample t-tests. Average measurements of relative humidity, temperature, noise, and illuminance were 60.7%, 21.6 °C, 57.5 dB, and 440 lux, respectively. Average concentrations of PM2.5, PM10, CO, and CO2 were 1223 ppm, 104 ppm, 1 ppm, and 623 ppm, respectively. Microbial contamination was generally insignificant across most investigated workspaces. While most measured parameters remained within recommended threshold limit values (TLVs), elevated levels of noise, illuminance, and particulate matter were observed in selected workspaces. These findings demonstrate that university indoor environments generally maintain acceptable air quality conditions; however, targeted interventions, including improved HVAC maintenance and indoor pollutant management, are required to enhance sustainable university indoor environments and optimize occupant comfort.
1. Introduction
Indoor environmental air quality (IEAQ) is a prominent global concern due to its impact on human health, the environment, and sustainability. According to the United States Environmental Protection Agency (US EPA), an occupant spends on average 90% of their time in an indoor environment, potentially exposing them to several types of indoor pollutants [1]. University environments encompass diverse workspaces in which a substantial number of university occupants may frequently be exposed to physical, chemical, and biological indoor parameters, especially with the educational and infrastructure advancements of higher education facilities. Assessments of physical parameters include measurements of perceived heat discomfort, noise, and luminous intensity. On the other hand, chemical parameters incorporate the evaluation of indoor gases and particulate matter (PM). Meanwhile, the biological parameter assessment evaluates airborne microbial activity. Previous research studies evaluated the IEAQ parameters in particular university workspaces, including offices, classrooms, cafeterias, laboratories, or libraries [1,2,3,4,5,6,7,8,9,10,11,12,13,14,15,16,17,18,19,20,21,22,23,24,25,26,27,28,29,30,31,32,33,34,35]. Offices in universities can be one of two main types: academic and non-academic. Academic offices are mainly for the teaching staff, while non-academic ones are for the administration staff. A mixed office study conducted in the United Arab Emirates (UAE) by Kim et al. [1] examined the concentrations of CO2, total volatile organic compounds (TVOC), humidity, light comfort, and noise in academic and non-academic offices. The results were then compared with threshold limit values (TLVs) from WELL Building Standards. Moreover, researchers have incorporated a questionnaire to study the relationship between pollutants and occupants’ health and satisfaction with their work conditions. The results showed that all tested parameters were below corresponding TLVs; however, 63% of occupants indicated thermal discomfort in their offices.
Physical and chemical indoor parameters were evaluated in a research study conducted in multiple classrooms of a Turkish university [2]. Parameters including CO2, ambient temperature, relative humidity, and PM were assessed in winter. It was found that the classroom’s heating system in winter created poor relative humidity and adversely altered the indoor ambient temperature. Moreover, CO2 was found to be exceeding the American Society of Heating, Refrigerating, and Air-Conditioning Engineers (ASHRAE) standards in winter, as most doors and windows remained closed. PM inside classrooms was high due to the heavy traffic and emissions surrounding the campus [2]. Temperature, PM, relative humidity, CO2, and CO were monitored for a week at a university cafeteria in Spain [3]. The average values obtained for the mentioned parameters were within the ranges specified by international organizations. Nevertheless, CO2 and PM revealed a strong fluctuation depending on activities and occupancy rates [3].
Laboratories are often closed rooms characterized by crowded environments that include large machines, electronic equipment, and chemicals that can host multiple potential pollutants [4]. A research study in the University of Castilla-La Mancha in Spain evaluated IEAQ pollutants to investigate whether naturally ventilated laboratories (passively ventilated through windows) would provide good IEAQ values [5]. Indoor parameters were measured in chemistry, biology, and computer science laboratories and included the assessment of ambient temperature, relative humidity, CO2, CO, O3, TVOC, PM, and fungal and bacterial presence. Recorded outcomes showed no significant differences in parameters’ concentrations in different laboratories, and all parameters except TVOC were below the standard limits of the Spanish Normative for indoor environments [5]. Nevertheless, it was found that CO2 concentrations were correlated with the size of the laboratory, as smaller laboratories had higher CO2 levels. CO levels were higher where Bunsen burners were in use. Researchers elaborated that O3 existed in laboratories due to its infiltration from the outside environment. TVOC was noticeably high on some days due to the use of chemical reagents. Ultrafine PMs were observed in chemistry laboratories, while other laboratories had relatively higher concentrations of larger PM. Bacteria and fungi were found mostly in biology and ecology laboratories due to the materials used during practical lectures [5]. Additionally, a study in Bangkok examined the presence of bio-aerosols (mainly culturable bacteria and fungi) in multiple laboratories [6]. Outcomes showed minimal detection of bio-aerosols, which were influenced by the number of staff and water leakage, which increased the humidity levels and fungal growth [6]. Di et al. [7] had noted a relationship between the quantity of individuals present and the concentrations of airborne microorganisms within the building. Additionally, the indoor air quality assessment revealed a prevalence of Gram-positive bacteria, primarily from the genera Staphylococcus, Bacillus, and Actinomyces, within the surveyed buildings. Conversely, fungi comprised less than 20% of the total microorganism count, with heightened detection rates occurring predominantly between April and June. Notably, the most frequently identified fungal genera during this period were Aspergillus and Cladosporium.
On average, university students usually spend two to four times longer in libraries than in classrooms [8]. A study conducted at an Indian university by Sahu and Gurjar [9] aimed to examine IEAQ in a university library with multiple levels. It was found that CO2, PM, TVOC, ambient temperature, and relative humidity varied between different floors. For instance, PM was higher on the first floor, while CO2 and TVOC were more concentrated at the ground level. The research results showed that the concentrations of the above parameters were higher in the morning hours [9].
IEAQ in university settings remains insufficiently characterized despite growing technologies and research linking factors between IEAQ parameters and adverse health outcomes. Existing studies often focus only on selected university workspaces and parameters, limiting the ability to develop comprehensive and effective mitigation measures. Moreover, compared to global studies, as shown in Table 1, there have been limited studies on IEAQ in university facilities in the UAE. Therefore, the principal objective of this research was to evaluate the IEAQ parameters in diverse university workspaces, including offices, classrooms, laboratories, libraries, and cafeterias, situated within a university in Sharjah, United Arab Emirates. The principal novelty of this work stems from its evaluation of an extensive set of physical, chemical, and biological IEAQ parameters across multiple university workspace types. Unlike previous studies that have often focused on a limited number of parameters or specific workspaces, this research establishes a baseline dataset for future local and international studies and explores the associations between indoor environmental stressors and workspace characteristics that may affect occupants’ well-being and performance. The key objectives of this study are to (i) quantify the levels of selected physical, chemical, and biological parameters across different indoor spaces, (ii) compare measured findings with established standards and guidelines, and (iii) identify critical factors contributing to poor indoor conditions. By doing so, the study aims to provide practical insights that can help enhance indoor environmental conditions and promote healthier, more productive learning environments.
Table 1.
Compilation of IEAQ parameters and findings from similar global studies reported in the literature.
2. Materials and Methods
2.1. Study Location and Timeline
The university campus is located in Sharjah, UAE, and encompasses a diverse array of colleges and environments as well as various key facilities across the campus, including multiple types of classrooms, administrative and non-administrative offices, laboratories, libraries, and cafeterias. IEAQ samples were collected throughout October 2023 in various semi-occupied air-conditioned workspaces within this university. During October, Sharjah’s ambient temperature ranged between 33 and 38 °C.
2.2. Study Design
The current cross-sectional study evaluated and quantified various IEAQ hazards, including physical, chemical, and biological parameters. Each type of pollutant was assessed using designated analytical instruments following proper calibration procedures to ensure precision, accuracy, and standardization, thereby bolstering the reliability of recorded results (Figure 1).
Figure 1.
Indoor air quality assessment tools.
Prior to data collection, all instruments were calibrated according to manufacturer’s guidelines to ensure accuracy and reliability. Zero calibration was performed where applicable (e.g., gas monitors), and instruments were allowed to stabilize before data collection. Factory calibration certificates were verified, and routine calibration checks were conducted before each sampling session. The accuracy of the instruments was within the manufacturer-specified error margins: ±0.5 °C for temperature, ±3% for relative humidity, ±1.5 dB for sound level meters (Class 2), ±5% for particulate matter counters, and ±(2–5%) for gas sensors, depending on the analyte [20,21]. The International Organization for Standardization (ISO) 7726 guidelines for measurement methods were followed to ensure accuracy and consistency across all sampling locations [21].
The sampling sites incorporated 17 buildings and amenities across four campuses; each building was given a code (Table 2). A total of 68 sampling locations (with two replicates per location) were selected using stratified random sampling, followed by simple random sampling to designate areas within specific buildings for measuring indoor parameters. This extensive spatial coverage captures substantial variability in building characteristics and thereby provides a broad representation of indoor environmental conditions within the university settings.
Table 2.
Building codes and workspaces under study.
A 10 min sampling duration was used to measure IEAQ parameters. Previous research studies indicate that monitoring intervals between 5 and 15 min can be sufficient to assess indoor indicators in non-industrial settings [22]. Some indoor indicative parameters (such as indoor gases and particulate matter) can be assessed by direct measurement equipment, providing a reliable evaluation through relatively short sampling durations [36,37]. Consequently, the selected 10 min duration was considered appropriate for balancing data reliability, representativeness, and field practicality in relatively stable indoor environments.
2.3. IEAQ Parameters
After measuring the following physical, chemical, and biological parameters, IEAQ parameters were compared to the TLV obtained from national and international standardizations. Table 3 summarizes the TLV of each IEAQ parameter. Finally, recommendations were set in line with National Institute for Occupational Safety and Health (NIOSH) and UAE recommendations for control. Regarding CO, there were no federal regulations establishing limits for carbon monoxide exposure in indoor environments outside of industrial workspaces.
Thermal comfort in an indoor environment can be determined through measurements of wet and dry bulb temperatures as well as relative humidity. The dry bulb temperature (°C), also known as air temperature, is the indoor temperature measured with a dry thermometer [38]. Meanwhile, wet bulb temperature represents the temperature measured by a wetted thermometer, indicating the cooling capacity and effect produced by evaporation [39]. The relative humidity is the ratio (usually expressed as a percentage) of the water vapor pressure of air to its saturation vapor pressure [40]. Indoor noise is the exposure to sounds that are extraneous and harmful to occupants’ health and welfare [41]. Moreover, illuminance stands as a pivotal attribute of light concerning human perception. It quantifies the luminous flux per square meter, typically denoted in lux, over a specific area [42]. Indoor gases include carbon monoxide (CO), carbon dioxide (CO2), hydrogen sulfide (H2S), ozone (O3), and volatile organic compounds (VOCs) [43]. Indoor PM refers to the microscopic solid and liquid particles that are suspended in the indoor air. PM could be in multiple sizes; however, the two sizes of most concern in indoor environments are PM2.5 and PM10. PM2.5 comprises fine inhalable particles that are equal to or less than 2.5 micrometers in diameter, such as combustion particles, organic compounds, and metals. Meanwhile, PM10 are inhalable particles with a diameter that is equal to or less than 10 micrometers, such as dust, pollen, and mold [44]. Finally, the detection of airborne microorganisms (bioaerosols), such as bacteria, viruses, and fungi, is part of the indoor biological pollution assessment [45].
Table 3.
TLVs for IEAQ parameters.
2.3.1. Physical Parameters: Temperature and Humidity
Perceived heat discomfort, comprising dry-bulb and wet-bulb temperatures as well as humidity, is a crucial indication of the occupants’ health and well-being. These thermal comfort parameters were measured for ten minutes using a portable area heat stress monitor (hs-32) by Metrosonics Inc., Rochester, NY, USA, in line with the ISO 7726 standard for thermal environment instrumentation [54]. Furthermore, to assess and evaluate the perceived heat discomfort of occupants, both the Thom Discomfort Index (TDI) and the Humidex Index were employed. Both indicators were selected given the available measurement tools and datasets. TDI is a physiological thermal comfort indicator that combines dry-bulb and wet-bulb temperature (Equation (1)) [55] as follows:
where Tw (°C) is the wet-bulb temperature and Ta (°C) is the dry-bulb temperature. The results were subsequently classified and compared with Thom’s classification scale (Table 4).
TDI = 0.5(TW) + 0.5(Ta)
Table 4.
Thom Discomfort Index classification and description [55].
Humidex Index was also utilized to further assess perceived heat discomfort. It combines dry-bulb temperature (air temperature) and humidity to describe and analyze the effect of heat on occupants (Equations (2) and (3)) [55].
where Ta (°C) is the dry-bulb temperature, and e (hPa) is the water vapor pressure computed using relative humidity. The obtained values were interpreted by the Humidex classification scale (Table 5).
Table 5.
Humidex classification and description [55].
2.3.2. Physical Parameter: Noise
To measure the noise level in all university workspaces, the ambient noise level (dB) could represent the acoustic level and could be evaluated using an integrating averaging sound level meter (CR:264A, Class 2 with 1:1 octave band filters) from Cirrus Research plc, Hunmanby, North Yorkshire, UK, which ran for ten minutes.
2.3.3. Physical Parameter: Illuminance
A lux meter (Testo 545) Testo SE & Co. KGaA, Lenzkirch, Germany, was utilized for direct measurement of the illuminance (lux) in university workspaces.
2.3.4. Chemical Parameters: Indoor Gases
The gaseous IEAQ parameters of most concern in university workspaces are CO2, CO, and H2S. An autonomous gas-sensing instrument is used to precisely measure the concentration of each gas. The Aeroqual Series 500 Portable Air Quality Monitor Aeroqual Ltd., Auckland, New Zealand, [56] is a portable indoor air quality monitor that allows for the testing of up to 30 contaminants utilizing a unique sensor head arrangement. The running time for each gas is three minutes, with the final gas concentration displayed on the screen in ppm.
2.3.5. Chemical Parameters: Particulate Matters
Video Particle Counter VPC300 Extech Instruments (FLIR Commercial Systems Inc.), Nashua, NH, USA, was used to measure the indoor PM in multiple university workspaces. This device has 6 channels of particle sizes, including 0.3 µm, 0.5 µm, 1.0 µm, 2.5 µm, 5.0 µm, and 10 µm. Readings were obtained after allowing the device to run for ten minutes.
2.3.6. Biological Parameters: Bacteria and Fungi
An active air sampling technique based on standard impaction principles for bio-aerosol assessment was used for microbiological air sampling. Airborne microorganisms were collected using a Microflow Alfa 60-90/C sampler Aquaria S.r.l., Milan, Italy, at a calibrated flow rate of 120 L/min for 8 min and 20 s onto sterile 90 mm Petri dishes containing potato dextrose agar (PDA) for fungal cultivation and nutrient agar (NA) for bacterial growth [57]. Before counting colonies, Petri dishes were incubated under carefully monitored laboratory conditions for 24 to 48 h after sample collection. The ISO 14698-1 standard for bio-contamination control and the NIOSH bio-aerosol sampling guidelines, which acknowledge active impaction methods as dependable techniques for quantitative assessment of airborne microorganisms [58,59,60,61,62], as well as other established microbial air monitoring protocols recommended for indoor environmental investigations, were followed in the sampling and cultivation procedures.
2.4. Statistical Analysis
Data were tabulated in Microsoft Excel and analyzed in PSPP version 2.0 (GNU Project). Descriptive statistics (mean, standard deviation, median, interquartile range, minimum, and maximum) were computed for each parameter, stratified by setting. The Shapiro–Wilk test and Levene’s test were used to evaluate within-group normality and homogeneity of variance, respectively. Parameters meeting both assumptions for the perceived heat discomfort indices (dry-bulb, wet-bulb temperatures), relative humidity, illuminance, and noise were compared across settings using one-way analysis of variance (ANOVA), followed by Tukey’s Honestly Significant Difference (HSD) post-hoc test where the omnibus F was significant. Parameters with skewed or zero-inflated distributions (all particulate-matter size channels, carbon dioxide, carbon monoxide, fungal counts, and bacterial counts) were analyzed using the non-parametric Kruskal–Wallis H test, followed by pairwise Mann–Whitney U tests with a Bonferroni-corrected threshold of α = 0.005 (0.05/10 pairs).
Effect sizes were reported as eta-squared (η2) for ANOVA, epsilon-squared (ε2) for Kruskal–Wallis, and r = |Z|/√N for Mann–Whitney comparisons, interpreted using conventional thresholds (small ≥ 0.01; medium ≥ 0.06; large ≥ 0.14 for η2 and ε2). One-sample t-tests evaluated whether each setting’s mean differed from the corresponding TLV listed in Table [40]; for parameters with setting-specific TLVs (illuminance and noise), each setting was tested against its own reference value. Hydrogen sulfide was excluded from inferential analysis because 57 of 60 readings fell below the detection limit and is reported descriptively only. Two-tailed statistical significance was set at α = 0.05.
3. Results
3.1. Physical Parameters: RH and Dry-Bulb Temperature
The highest indoor RH was recorded in laboratories, followed by offices, classrooms, libraries, and cafeterias. The indoor humidity of classrooms ranged between 48.9% and 69% with an average of 60% ± 4%. The offices’ humidity was slightly higher than that of the classrooms, ranging between 48% and 77% with an average of 61.4 ± 5%. Moreover, the libraries’ humidity was found to be between 52.2% and 67% with an average of 59% ± 3%. The humidity in the university’s cafeterias ranged between 51.1% and 72%, with an average of 56.3% ± 15%. Lastly, the laboratories’ humidity was between 51% and 78% with an average of 64.7% ± 6%, which was the highest humidity obtained from all university workspaces. Classrooms with the highest humidity were attained in the College of Graduate Studies (B6) and the College of Islamic, Law, and Social Studies (B1), while the lowest humidity was measured in the College of Health Sciences and Pharmacy (B9). However, the highest RH in offices was measured in the College of Islamic Law and Social Studies (B1) as well as the College of Sciences (B4), while the lowest was in the College of Fine Arts (B8). The men’s library (B14) and cafeteria (B16) had higher RH values compared to those of the women. Sciences and engineering laboratories (B17S and B16E) had the highest RH, while the lowest was obtained in the pharmacy laboratories (B17P). In view of the unavailability of RH standards and specifications in Sharjah, Dubai standards were used instead. According to the Dubai government, the RH should be around 50% ± 5%. Additionally, ASHRAE standards specified that RH values could range from 30% to 60%. Most of the RH values obtained in this research were within the acceptable range, with some workspaces (offices and laboratories) having a slightly higher RH than the stated TLVs of the Dubai government and ASHRAE standards.
It is recommended by the Dubai government to have dry-bulb temperatures around 24 °C in indoor environments. In this study, most offices’ temperatures ranged between 20 °C and 25 °C with an average of 22.4 ± 1 °C. Meanwhile, the classrooms’ temperature ranged from 19 °C to 26 °C with an average of 22.2 ± 1 °C. Libraries, cafeterias, and laboratories’ dry-bulb temperatures ranged between 21.3 and 23.8 °C, 20.9 and 22.3 °C, and 19 and 22.7 °C, with an average of 22.6 ± 1 °C, 21.7 ± 0.5 °C, and 21 ± 1.3 °C, respectively, as shown in Figure 2. Generally, offices and classrooms had higher dry-bulb temperatures compared to other workspaces. The College of Graduate Studies (B6) had the highest classroom dry-bulb temperature, while the lowest temperatures were observed in the College of Medicine and Dentistry (B10 and B11). In offices, the College of Fine Arts (B8) as well as the College of Business Studies (B2) had high temperatures, while the College of Dentistry (B11) and the College of Health Sciences and Pharmacy (B9) had the lowest temperatures. Even though the women’s library’s (B13) dry-bulb temperature was higher than the men’s (B14), the temperatures in both the men and women’s cafeterias (B15 and B16) were quite similar. Generally, the engineering and pharmacy laboratories (B17E and B17P) had a higher temperature, while health sciences (B17HS) had the lowest (Appendix A, Figure A1). Comparing the results with the TLV set by the Dubai government, all workspaces except for the offices had a safe dry-bulb temperature. Those of the offices were slightly higher than the standards of the Dubai government, yet were within the acceptable range of ASHRAE standards, which was between 20 and 27 °C, and some temperature outliers reported in the offices and laboratories were slightly lower than the ASHRAE standards.
Figure 2.
Temperature values recorded across various university workspaces in the university under study.
TDI and Humidex Indicators
TDI values across the surveyed indoor workspaces ranged between 16.525 °C and 22.475 °C. Classrooms and offices generally exhibited moderate TDI values (18–20 °C), indicating a thermally comfortable indoor environment. Nevertheless, several outliers observed in both classrooms and offices showed slightly higher TDI values equal to or exceeding 21 °C, indicating marginally warmer indoor workspaces, where less than 50% of the population feels thermal discomfort (Figure 3). To further assess the perceived thermal sensation in the surveyed workspaces, the Humidex Index was also calculated. Humidex values ranged from approximately 20.39 to 30.15 °C, indicating little to no thermal discomfort (Figure 4).
Figure 3.
TDI results.
Figure 4.
Humidex Index results.
3.2. Physical Parameters: Noise
Indoor noise data were measured in semi-occupied workspaces within the university under study. Classroom noise ranged from 49 dB to 65 dB, averaging 56.2 ± 5 dB, while offices showed similar values, ranging from 53 dB to 63 dB and averaging 57 ± 4 dB. The libraries had consistent values of 57 dB and 58 dB, averaging 57.7 ± 4 dB. The cafeterias exhibited the highest noise levels, ranging from 60 dB to 72 dB, averaging 64.6 ± 6 dB. Noise levels in laboratory buildings ranged from 54 dB to 64 dB, averaging 57.9 ± 4 dB (Figure 5). Notably, the highest level of classroom noise was found in the College of Fine Arts (B8), while the lowest was in the College of Communication (B3). The highest level of office noise was in the College of Engineering (B5), with the lowest at the College of Communication (B3). There was no significant variation between the men’s and women’s libraries (B13 and B14). The women’s cafeterias (B15) showed higher noise values than the men’s (B16). The sciences and pharmacy laboratories (B17S and B17P) recorded the lowest noise at 54 dB, while the engineering laboratories (B17E) had the highest at 64 dB (Appendix A, Figure A2). Most noise levels slightly exceeded the recommended TLVs, according to [63]. This could be due to machinery noise (printers, computers, or the air conditioning system), low insulation, noise from nearby classes, and construction work around the university. Both the men’s and women’s cafeterias exceeded the TLV of 45 to 55 dB, possibly due to the open-kitchen design and the unrestricted verbal interactions among students and university staff.
Figure 5.
Average noise levels across the university under study.
3.3. Physical Parameters: Illuminance
Lighting significantly affects student moods, which in turn influences their overall performance [64]. Varying light levels can also have distinct effects on students’ behaviors. Across the selected university workspaces, light measurements showed significant variations. Light measured in classrooms exhibited higher differences, ranging between 62 and 675 lux with an average of 440 ± 174 lux. The indoor light values obtained in offices ranged from 239 to 815 lux with an average of 484 lux. The libraries’ values were from 127 to 414 lux, averaging 234 ± 116 lux. In the cafeterias, the values ranged from 363 to 700 lux with an average of 531 ± 139 lux, which was the highest average light value obtained across all investigated university workspaces. Finally, the laboratory buildings ranged from 139 lux to 650 lux with an average of 366 ± 175 lux (Appendix A, Figure A3). The highest indoor light value among the classrooms was obtained from the College of Health Sciences and Pharmacy (B9), while the lowest was found in the College of Communication (B3). Moreover, the highest indoor light measured in office workspaces was found to be in the College of Dentistry (B11), while the lowest was in the College of Medicine’s administration building (B12). The men’s library and cafeteria (B14 and B16) scored higher indoor light values compared to the women’s library and cafeteria (B13 and B15). The sciences and the pharmacy laboratories (B17S and B17P) scored the lowest light value of 144 lux, whereas the engineering laboratory (B17E) had the highest light level of 650 lux.
3.4. Chemical Parameters: Indoor Gases
In this study, CO was measured in different workspaces within an academic institution. As illustrated in Appendix A (Figure A4), the average concentrations of CO were as follows: 0.75 ppm ± 1.12 for classrooms, 1.33 ppm ± 2.23 for offices, 1 ppm ± 0.82 for libraries, and 1 ppm ± 1.41 for cafeterias, with an overall range between 0 and 11 ppm. These averages were all below the EPA-recommended limit (9 ppm) for CO in indoor environments. However, the average concentration in offices was higher than in other workspaces, primarily due to a single measurement of 11 ppm in the College of Fine Arts (B8), which was considered above the TLV, and an outlier compared to the rest of the single office measurements. This could be attributed to the unique design and furnishings of this office, including the abundance of recyclable materials used as furniture by the employee contributing to this distinctive environment.
CO2 concentrations varied across different workspaces as illustrated in Appendix A, Figure A4. The results showed significant variation, ranging from 487 to 918 ppm, with the following averages: classrooms had an average of 626 ppm, offices had an average of 666 ppm, libraries had an average of 552 ppm, cafeterias had an average of 508 ppm, and laboratories had an average of 595 ppm (Figure 6). All average measurements are below the TLV (800 ppm) set by ASHRAE. However, classrooms exhibited the highest variation compared to other workspaces, including a few peak measurements that exceeded the TLV, such as 827 ppm in the College of Sciences and 980 ppm in the College of Health Sciences and Pharmacy. This suggested inadequate ventilation and maintenance, particularly in classrooms with fixed, non-ventilating windows, when the measurements were taken.
Figure 6.
Average CO2 concentrations across the university under study.
H2S levels remained virtually undetectable across all surveyed areas, with only three exceptions in which a reading of 0.1 ppm was observed. Notably, these instances occurred within classrooms, two of which were situated in a relatively new building: B6 (College of Graduate Studies). The third was detected in a classroom located in B8 (College of Fine Arts and Design). It is important to highlight that all recorded concentrations were well below the TLV of 0.33 ppm.
3.5. Chemical Parameters: Particulate Matter
In all university workspaces evaluated in this study, the concentrations of PM2.5 were always more than PM10. Offices had the highest PM2.5 and PM10 concentrations compared to other workspaces with an average of 1390 ± 589 ppm and 140 ± 82 ppm, respectively. The average PM2.5 and PM10 concentrations in classrooms were 1092 ± 460 ppm and 88.3 ± 50 ppm, respectively. Libraries, cafeterias, and laboratories’ PM2.5 and PM10 average concentrations were 160 ± 49 ppm and 62 ± 4 ppm, 1330 ± 765 ppm and 87.5 ± 48 ppm, and 1079 ± 323 ppm and 63 ± 27 ppm, respectively (Figure 7). The classrooms in the College of Medicine (B10) had the highest concentrations of PM2.5 and PM10, while the College of Health Sciences (B9) and Business Studies (B2) had the lowest. However, the offices in the College of Fine Arts (B8) and Health Sciences (B9) had elevated concentrations of both sizes while the College of Medicine (B10) and Graduate Studies (B6) had the lowest. Compared to the men’s library (B14), the women’s library (B13) had a higher concentration of PM2.5, while the men’s had a higher concentration of PM10. Furthermore, the women’s cafeteria (B15) revealed a higher concentration of both particle sizes compared to the men’s cafeteria (B16). The engineering and pharmacy laboratories (B17E and B17P) exhibited a higher concentration of PM2.5 and PM10, while the sciences laboratories (B17S) showed minimal concentrations of both particle types (Appendix A, Figure A5).
Figure 7.
Average particulate matter concentrations across the university under study.
3.6. Biological Parameters: Bacteria and Fungi
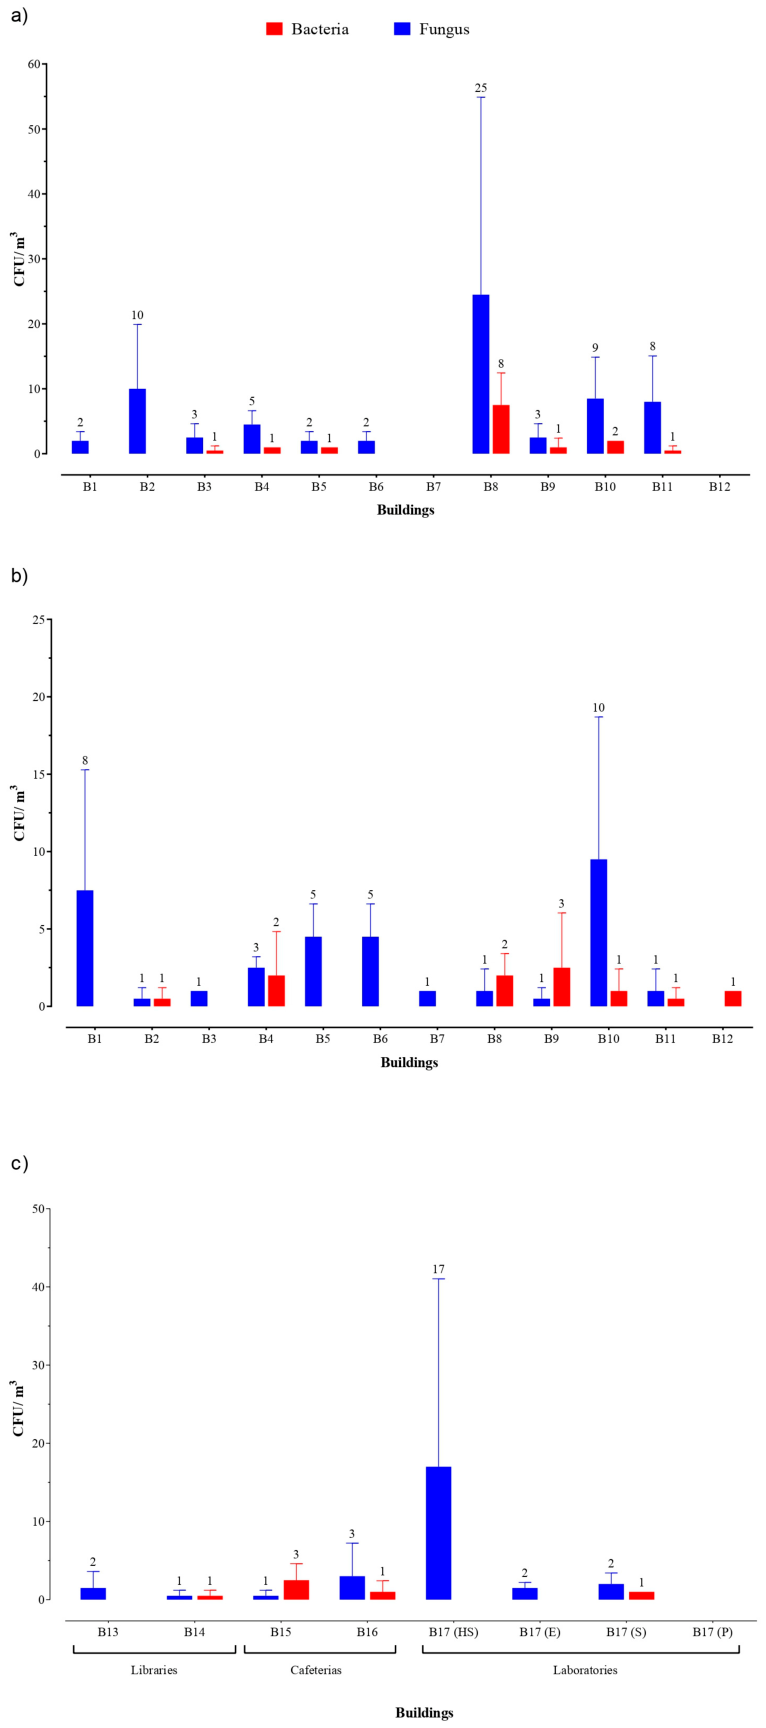
According to the data presented in Appendix A (Figure A6), bacterial and fungal counts were measured across all university workspaces. Fluctuations in both bacterial and fungal counts were evident in almost all classrooms. Specifically, classrooms in the College of Business Studies (B2), the College of Medicine (B10), and the College of Dentistry (B11) showed the highest mean fungal counts compared to other classrooms in the university, with concentrations of 10 CFU/m3, 8 CFU/m3, and 8 CFU/m3, respectively. Fluctuations in bacterial and fungal counts were observed in university offices, with fungal counts averaging higher than bacterial counts. This disparity could be attributed to inadequate ventilation systems and the diverse range of activities conducted in these spaces. Specifically, in the College of Islamic, Law, and Social Studies (B1) and the College of Medicine (B10), the highest fungal counts were recorded at 8 CFU/m3 and 10 CFU/m3, respectively. Microbial activity was minimal in both men’s and women’s libraries (B13 and B14) compared to offices and classrooms. However, cafeterias (B15 and B16) showed significant microbial counts. In contrast, no bacterial or fungal presence was found in the health sciences and pharmacy laboratories (B17HS and B17P), while mean fungal concentrations were detected to be the highest in the sciences laboratories (B17S) because of the diverse experiments carried out and equipment used in these labs.
3.7. Statistical Analysis Results
Between-Setting Comparison of IEAQ Parameters
Among the seventeen inferentially analyzed parameters, five differed significantly across the five workspace settings: illuminance, noise, PM10, CO2, and fungal counts (Table 6). Heat stress indices, relative humidity, the smaller particulate-matter channels (0.3–5.0 µm), PM2.5, CO, and bacterial counts showed no significant between-setting variation. H2S remained below the detection limit in 57 of 60 samples, with only three classroom readings reaching 0.1 ppm, well below the 0.33 ppm TLV, and is therefore reported descriptively.
Table 6.
Omnibus statistical tests of IEAQ parameters across the five workspace settings.
4. Discussion
4.1. Physical Parameters
4.1.1. Relative Humidity and Dry-Bulb Temperatures
The RH results in the literature on various university workspaces and educational facilities generally ranged between 9 and 89%, as shown in Table 1. Classrooms had various ranges in different studies, such as 27.4–50.9% [10], 19–35% [11], 59–73% [12], 47.8–86% [16], 45.78% [18], and 40.4% [13]. Meanwhile, office humidity ranges were 53% [1], 17.7–24.3% [19], 56.8–65% [20], 36.4–74.3% [21], 18.7–52.8% [22], 51.2% [23], and 9–44% [24]. Libraries and cafeterias have not been widely studied. The humidity in libraries was generally 12.4–31.5% [33] and 41–58% [34], while in cafeterias, it was 34.8–61.5% [35] and 31.2–36.1% [3]. And finally, the ranges in laboratories were 35.3–44.8% [5], 21.8–41.2% [25], 72.7–74.7% [26], 20–45% [27], 49.1–63.9% [31], and 48–68% [32]. Compared to the humidity levels of the current study, many of the workspaces studied in previous research were not found to comply with the national and international standards. For example, the relative humidity in several studies was higher than the national and international standards compared to the humidity levels in the current study [12,20,26].
According to the literature, the dry-bulb temperature in different universities and educational workspaces ranged between 8.5 and 35.9 °C (Table 1). Studies evaluating classrooms included various ranges of temperatures such as 22.3–35.9 °C [10], 20–25 °C [11], 23.6–29.7 °C [12], 24.5 °C [13], 22–24 °C [14], 8.5–20.5 °C [16], 18.9–21.9 °C [17], and 24.52 °C [18]. On the other hand, offices temperature ranges were 21.5 °C [1], 24.7–25.9 °C [19], 22.4–24.6 °C [20], 27.2–35 °C [21], 23.8–26.6 °C [22], 28.2 °C [23], and 15.9–27.9 °C [24]. Like humidity, the temperature of libraries and cafeterias has not been widely evaluated. Nonetheless, a few studies have shown that the ranges of temperature in libraries were 15.4–21.4 °C [33] and 15–26 °C [34], while in cafeterias, the ranges were 19.3–34.2 °C [35] and 19.2–20 °C [3]. Lastly, laboratory temperature ranges were 23–25 °C [5], 22–24 °C [25], 32.2–32.5 °C [26], 23.7–25.1 °C [27], 19.5–22.5 °C [31], and 18–26 °C [32]. The results obtained from this current study were found to be very similar to the literature with a limited number of outliers.
There was a notable variability of thermal conditions across the evaluated workspaces; for instance, classrooms maintained moderate TDI and Humidex values, indicating consistent comfort levels, whereas offices exhibited a wider range of variation. This can be explained and linked to the functional use, environmental controls, heat equipment gains, window exposure, and localized ventilation. Moreover, some workspaces demonstrated high TDI and Humidex values, such as class 3 and 11 as well as office 3, 5, and 15. These higher values are likely due to the elevated dry-bulb temperature and humidity, which could be perceived as thermal discomfort over prolonged occupancy and may require advanced environmental assessment. Conversely, spaces such as cafeterias, select offices, and laboratories displayed low TDI and Humidex values, reflecting cooler indoor conditions due to higher ventilation, reduced occupancy, or lower internal heat loads. Overall, most environments remain within acceptable perceived heat discomfort ranges, but intermittent mild discomfort may occur in warmer zones during prolonged occupancy, highlighting the essence of integrated temperature and humidity management.
Findings from the current study for both perceived heat discomfort indices indicated that the ventilation and AC system were efficient in maintaining comfortable temperature and RH values in most workspaces. Laboratories had a significantly lower temperature compared to other workspaces mainly due to the nature of activity and the necessity of maintaining a cool ambient temperature to avoid damaging laboratory machines and chemicals.
4.1.2. Noise
Despite the WHO recommending a maximum noise limit of 55 dB for universities, studies suggest that noisy learning environments in educational workspaces are increasingly common [65]. Most of the previous studies had similar or higher noise levels compared to this research. For instance, the indoor noise levels at the University of Babylon’s environmental engineering department building ranged from 60 to 100 dB [66], while a Turkish university recorded an average noise level of 62.7 dB [67]. Similarly, a study conducted at a Brazilian university campus found indoor and outdoor noise levels between 44 and 70 dB [68]. As a range of acceptable levels of noise, the studies adopted local regulations, which are 45 and 35 dB(A), respectively. In addition to the Turkish study [67], Brazilian studies [69,70] also found that their studied workspaces did not meet the limits required for an adequate acoustic environment. In university workspaces, noise can originate from various sources and depends on several factors like classroom and office size, background noise levels, and activities carried out during studio sessions, which were all potential factors contributing to indoor noise levels [71].
4.1.3. Illuminance
According to [46], the indoor light values in indoor university workspaces must be 250 lux for classrooms, 500 lux for offices, 500 lux for university libraries, 150 lux for cafeterias, and finally, 500 lux for laboratories. The overall light values obtained in classrooms mostly exceeded the TLV, with an average of 440 lux. Most of the light values in offices ranged within the TLV, with some exceptions that were higher than the TLV. None of the measurements exceeded the TLV in libraries. The women and men’s cafeterias both reported values higher than the TLV; therefore, the average light level in cafeterias exceeded the TLV. Most laboratory measurements were below the TLV, 500 lux, except for one measurement in the College of Engineering, which exceeded it. Given the unique nature of each university workspace, the lighting requirements can vary significantly. Only a few studies examined light and were conducted on a small number of workspaces. For instance, light levels of a study in the UAE assessing classrooms ranged between 400 and 800 lux [13], while another study evaluated light in offices and reported it to be between 100 and 700 lux [22]. Finally, a study of light levels in a laboratory in Turkey found levels varying between 156 and 415 lux [25]. Depending on factors such as the amount of natural light available and the specific demands of students, a variety of lighting options should be tailored to match the activities taking place in each workspace. Additionally, all light bulbs and circuits must be maintained and frequently measured to ensure compliance with national and international standards.
4.2. Chemical Parameters
4.2.1. Indoor Gases
Previous research with a similar scope monitored indoor CO levels and reported them to be as low as 0–1.1 ppm [3] and 0.136 ppm [18], or as high as 17.9–27.3 ppm [29]. Compared to the results in this study, it was concluded that there was a significant variation between this study’s findings and those of previous research; some findings were lower [18], while some were substantially higher [29]. Table 7 compares the findings of this study with previous research as well as with the TLV. Generally, cafeterias and laboratories of this study and previous ones were within a significantly similar range for CO2 levels. Nevertheless, there was a slight variation in the concentration of CO2 of classrooms and offices in this study compared to the literature. Libraries’ CO2 concentrations exhibited the most extensive difference, as the results of this study were lower than those of the previous research. This variance could be attributed to several factors potentially influencing CO2 presence, such as conducting measurements while the area is occupied (which was the case in previous research work), the architectural design of the building (which may allow outdoor CO2 to infiltrate indoor spaces), off-gassing from building materials (particularly common in newer constructions), and inadequate or defective ventilation systems. Emissions of CO2 could also be generated from certain cleaning products, especially those containing bleach or ammonia.
Table 7.
Comparison between CO2 concentrations recorded in this study and similar global studies.
4.2.2. Particulate Matter
According to ISO14644-1:2019, indoor particulate matter is considered hazardous when exceeding 1363 ppm and 171 ppm for PM2.5 and PM10, respectively. Most classrooms, libraries, cafeterias, and laboratories were within the given threshold. Nevertheless, some classrooms in the College of Communication, College of Sciences, College of Health Sciences, and College of Medicine exceeded the threshold limit for PM2.5 and PM10. Moreover, 50% of the offices (dispersed in multiple colleges) showed elevated concentrations of PM2.5 and thus needed adequate mitigation measures.
Even though most locations exhibited low PM of both sizes, the main factors that influenced the presence of elevated PM in some workspaces were due to poor ventilation and filter maintenance, poor housekeeping, the presence of printers and other machines that generated PM, and the nature of the work there. For instance, the College of Fine Arts classrooms and offices as well as the engineering and pharmacy laboratories had more PM compared to other workplaces and colleges due to the nature of the work there as well as the machinery and materials, procedures, or chemicals utilized.
4.3. Biological Parameters: Bacteria and Fungi
Gram-positive bacteria, notably from the Staphylococcus, Bacillus, and Actinomyces genera, were the most frequently identified microorganisms. Fungi, constituting less than 20% of the total microorganism count, were primarily represented by Aspergillus, Cladosporium, and Mucor genera [7]. This may be attributed to inadequate ventilation systems and various student activities contributing to higher fungal concentrations in these classrooms. Nevertheless, both bacterial and fungal counts in all workspaces were found to be negligible or significantly lower than the TLV of <500 CFU/m3. The fungal counts in this study were also substantially lower than previous reported studies. For instance, Stryjakowska-Sekulska et al. [28] obtained between 120 and 2300 CFU/m3 and between 130 and 1100 CFU/m3 bacterial and fungal colonies in a laboratory, respectively. Meanwhile, Hayleeyesus and Manaye [30] found 367–2595 CFU/m3 and 524–1992 CFU/m3 bacteria and fungi in a laboratory workspace. Lastly, 20–180CFU/m3 and 20–510 CFU/m3 bacterial and fungal colonies were obtained by Hassan et al. [34] in a library in Pakistan.
Previous studies underscored the dynamic microbial ecology present in indoor environments, highlighting the importance of ongoing monitoring and management strategies to maintain optimal air quality standards [7]. These studies suggest that the prevalence of typical microflora originating from human skin, water, and soil, alongside a sufficient presence of fungal colonies, likely results from effective indoor/outdoor air exchange and appropriate relative humidity levels. Furthermore, there was a positive correlation observed between the microbial counts and the number of occupants in the room [33,64,72].
4.4. Statistical Analysis Discussion
4.4.1. Physical Parameters
Illuminance differed significantly across settings (F(4, 55) = 2.95, p = 0.028, η2 = 0.18), ranging from a mean of 234 lux in libraries to 531 lux in cafeterias, although Tukey’s HSD did not isolate a single significantly different pair after correction. Noise levels showed a stronger pattern (F(4, 55) = 4.57, p = 0.003, η2 = 0.25): cafeterias (64.6 dB) were significantly louder than classrooms (56.3 dB), offices (57.1 dB), and laboratories (57.9 dB), reflecting the character of those spaces, which are social and have a high occupancy (Table 4). None of the heat-stress indices or relative humidity differed significantly between settings (all p > 0.28), consistent with uniform HVAC conditioning across the building stock.
4.4.2. Chemical Parameters
Carbon dioxide concentrations differed significantly across settings (H [41] = 13.95, p = 0.007, ε2 = 0.24), with offices (median: 680 ppm) showing significantly higher levels than both cafeterias (505 ppm; U = 4, p = 0.004, r = 0.55) and libraries (513 ppm; U = 6, p = 0.006, r = 0.52). The first pair survived after Bonferroni correction was applied; the second approached the corrected threshold. The elevated office CO2 indicates that ventilation rates may not adequately match the sustained metabolic load typical of multi-occupant office environments. PM10 also varied significantly between settings (H[41] = 12.19, p = 0.016, ε2 = 0.21), with offices (median: 114) exceeding laboratories (57; U = 32, p = 0.005, r = 0.49, Bonferroni-confirmed), classrooms, and libraries. The finer particulate channels including PM2.5 and CO did not differ significantly between settings, although office PM2.5 showed the highest descriptive mean (1389 particles).
4.4.3. Biological Parameters
Fungal counts differed significantly across settings (H[41] = 10.19, p = 0.037, ε2 = 0.17), with classrooms consistently showing the highest loads (median: 3.0 CFU) compared to offices, libraries, and laboratories (Table 8). None of these pairwise comparisons survived after Bonferroni correction, suggesting a pattern that warrants further investigation in larger samples; possible drivers include higher student traffic, periodic carpet exposure, and intermittent occupancy. Bacterial counts did not differ between settings (H[41] = 5.64, p = 0.227), with all settings showing low burdens (medians of 0–1.5 CFU).
Table 8.
Significant pairwise post-hoc comparisons.
4.5. Comparisons Against Threshold Limit Values
One-sample t-tests against the regulatory thresholds in Table 3 revealed three distinct patterns of non-compliance (Table 9). Noise exceeded its recommended upper bound in every setting (all p < 0.045), with offices showing the largest absolute exceedance (+17 dB above the 40 dB office TLV). Relative humidity exceeded the 50% TLV in four of five settings (classrooms, offices, libraries, and laboratories; all p ≤ 0.011); the cafeteria means (56.4%) remained descriptively above the threshold but did not reach statistical significance owing to the high level of within-setting variance and the small sample size (n = 4).
Table 9.
One-sample t-test comparison of measured concentrations against threshold limit values.
Illuminance exceedances varied by setting: classrooms (440 lux) and cafeterias (531 lux) exceeded their respective TLVs (250 and 150 lux; p < 0.001 and p = 0.014), while libraries fell significantly below the 500 lux recommendation (234 lux, p = 0.024). Office and laboratory illuminance values met their TLVs. Particulate matter showed a partial-compliance pattern in offices: PM2.5 means did not significantly exceed the ISO 14644-1 threshold of 1363 particles (offices p = 0.831, cafeterias p = 0.946), yet 46% of office samples and 50% of cafeteria samples individually exceeded it. PM10 in offices approached but did not significantly surpass the 171-particle threshold (140 particles, p = 0.078, with 29% individual exceedances). CO2, CO, fungal counts, and bacterial counts remained significantly below their respective TLVs in every setting (all p < 0.001), confirming that the principal IEAQ concerns at the campus are physical (noise, illuminance) and humidity-related rather than chemical or microbiological.
4.6. Statistical Limitations
The library and cafeteria groups comprised only four sampling locations each, which restricts the statistical power for any comparison involving these settings; several borderline findings with medium-to-large effect sizes (r = 0.35–0.52) did not survive after Bonferroni correction and may have reached robust significance in larger samples. The RH exhibited heterogeneous variances across settings (Levene’s p = 0.001) driven by the cafeteria spread; the parametric and non-parametric conclusions were nonetheless concordant.
4.7. Indoor Air Quality and Sustainable Development Goals
The evaluation of IEAQ parameters in this study extended beyond an assessment of comfort, providing critical insights into the achievement of Sustainable Development Goals (SDGs). On average, all assessed parameters remained below the corresponding TLVs. This indicated clear relevance and alignment with SDG 3 (Good Health and Well-being), SDG 4 (Quality Education), and SDG 11 (Sustainable Cities and Communities), highlighting the importance of IEAQ in supporting health, learning outcomes, and sustainable infrastructure.
SDG 3 aims to ensure healthy living conditions for and promote the well-being of everyone at all ages, which encompasses both disease prevention and the promotion of safe environments. Indoor air quality is a crucial indicator of health, especially in university facilities, where students and staff spend prolonged periods teaching and learning. Maintaining physical, chemical, and biological parameters below TLVs can reduce perceived heat discomfort, improve respiratory health, enhance cognitive performance, and minimize fatigue. Collectively, all the evaluated parameters contributed to achieving SDG 3.
Ensuring equal educational quality and opportunities for everyone are the key determinants of SDG 4. Physical, chemical, and biological IEAQ conditions play a critical role in institutional facilities, as such conditions can adversely impact the learning experience. Poor IEAQ conditions can reduce instructors and students’ ability to concentrate, slow information processing, and increase mental fatigue. On the other hand, keeping optimal levels of IEAQ parameters enhances alertness, memory retention, problem solving, and overall mental efficiency, which supports the achievement of SDG 4.
SDG 11 seeks to develop safe, resilient, and sustainable cities and communities. The achievement of this goal extends beyond urban planning, as it also encompasses the management of indoor environments in all building types. In the context of university and institutional facilities, this goal emphasizes the significance of managing indoor workspaces, which ensures comfort, safety, and responsible environmental stewardship. The effective management of these parameters demonstrates efficient resource utilization and sustainable building practices by the reduction of energy waste and optimization of ventilation and lighting systems.
Overall, the proper management and control of IEAQ parameters proves the institution’s commitment to promoting occupant welfare, fostering academic performance, and reinforcing sustainable practices and resilient university workspaces, in accordance with SDG 3, 4, and 11.
5. Conclusions and Recommendations
This study was focused on IEAQ parameters in multiple university workspaces in Sharjah, UAE. Most of the pollutants’ averages were below the recommended TLVs, with some outliers exceeding the stated TLV workspaces and locations. Thus, there were minimal adverse impacts on the occupants’ health and well-being. The findings showed that the investigated university generally maintained acceptable IEAQ compared with international standards and recent studies. Thermal conditions and carbon dioxide levels demonstrated satisfactory ventilation and occupant comfort, while bacterial and fungal concentrations reflected healthy microbiological air quality. However, elevated noise levels, slightly high relative humidity in some areas, lighting deficiencies in certain spaces, and localized particulate matter concentrations suggest the need for further improvements in indoor environmental management.
It is recommended to mitigate, reduce, or isolate the utilization of unnecessary hazardous work and machinery that could influence the prevalence of multiple IEAQ parameters. Moreover, regular housekeeping is crucial to ensure the cleanliness of the workplace. Ventilation efficiency and maintenance stand as a pivotal element in attaining satisfactory IEAQ and fostering a pleasant, healthy environment indoors. It facilitates the circulation of fresh outdoor air, effectively reducing or dispersing indoor contaminants of chemical and biological origin. The ventilation setup can be established based on occupancy rate, the exchange rate between indoor and outdoor spaces, building infrastructure, and workplace size [73]. Construction work outside the university buildings was found to be contributing to the indoor IEAQ parameters. It is suggested to implement audits and install sufficient effective insulation to prevent the transfer of outdoor noise, PM, CO, and CO2 to the indoor environment. In order to optimize the illuminance in indoor workplaces, control switches are recommended that freely adjust light intensity as needed, as well as the utilization of natural light as much as possible.
The main limitation in this research was the lack of a unified source for national TLVs; nevertheless, recorded results in the current study were assessed in comparison to a mixture of well-established national and international TLVs and guidelines. Moreover, the scope of the study was constrained by the availability of specialized instrumentation required for detailed HVAC system characterization, which could have provided additional insights and further supported the interpretation of the measured parameters.
Future studies could be extended to emphasize the overall national IEAQ and occupants’ satisfaction across various indoor workspaces (including educational institutions, corporate offices, and similar workplaces) in UAE. It is also important for future studies to assess multiple university facilities or utilize data from published national studies to enable broader comparative and statistical analyses. Additionally, future studies may employ the predicted mean vote (PMV) and predicted percentage of dissatisfied (PPD) models, which integrate environmental and personal factors, to provide a more comprehensive assessment of occupants’ thermal comfort. This could establish a robust national standard, shaping an improved IEAQ in numerous indoor workspaces.
Author Contributions
Conceptualization, S.A.D., R.E., M.A.M. and L.S.; methodology, S.A.D., R.E., M.A.M. and L.S.; validation, L.S. and K.A.; formal analysis, S.A.D., R.E. and M.A.M.; data curation, S.A.D., R.E. and M.A.M.; writing—original draft preparation, S.A.D., R.E. and M.A.M.; writing—review and editing, S.A.D., R.E., M.A.M., L.S., N.J. and K.A.; visualization, S.A.D., R.E., M.A.M. and K.A.; supervision, L.S., N.J. and K.A. All authors have read and agreed to the published version of the manuscript.
Funding
This research received no external funding.
Institutional Review Board Statement
Not applicable.
Informed Consent Statement
Not applicable.
Data Availability Statement
The original contributions presented in this study are included in the article. Further inquiries can be directed to the corresponding author.
Acknowledgments
The authors would like to thank the ReachSci programme organizers, a dedicated group of students from the University of Cambridge, for their continuous guidance and support throughout this research.
Conflicts of Interest
The authors declare no conflicts of interest.
Abbreviations
The following abbreviations are used in this manuscript:
| ANOVA | Analysis of Variance |
| ASHRAE | American Society of Heating, Refrigerating, and Air-Conditioning Engineers |
| CFU/m3 | Colony-Forming Units per Cubic Meter |
| CO | Carbon Monoxide |
| CO2 | Carbon Dioxide |
| dB | Decibel |
| H2S | Hydrogen Sulfide |
| HMDX | Humidex Index |
| HSD | Tukey’s Honestly Significant Difference |
| IEAQ | Indoor Environmental Air Quality |
| ISO | International Organization for Standardization |
| K-W | Kruskal–Wallis test |
| lux | Lumens per square meter (unit of illuminance) |
| NA | Nutrient Agar |
| NAAQS | National Ambient Air Quality Standard |
| NIOSH | National Institute for Occupational Safety and Health |
| O3 | Ozone |
| PDA | Potato Dextrose Agar |
| PM | Particulate Matter |
| PM10 | Particulate Matter ≤ 10 micrometers in diameter |
| PM2.5 | Particulate Matter ≤ 2.5 micrometers in diameter |
| PMV | Predicted Mean Vote |
| PPD | Predicted Percentage of Dissatisfied |
| ppm | Parts Per Million |
| RH | Relative Humidity |
| SD | Standard Deviation |
| SDG | Sustainable Development Goal |
| TDI | Thom Discomfort Index |
| TLV | Threshold Limit Value |
| TVOC | Total Volatile Organic Compounds |
| UAE | United Arab Emirates |
| US EPA | United States Environmental Protection Agency |
| VOC | Volatile Organic Compounds |
| WBGT | Wet-Bulb Globe Temperature |
| WHO | World Health Organization |
Appendix A
Figure A1.
Figure A1 shows dry-bulb temperature data, in degrees Celsius, measured at two distinct locations in each university building, denoted as B(x). (a) represents the data collected in classrooms. (b) represents the data collected in offices. (c) represents the data collected in libraries, cafeterias, and laboratories.
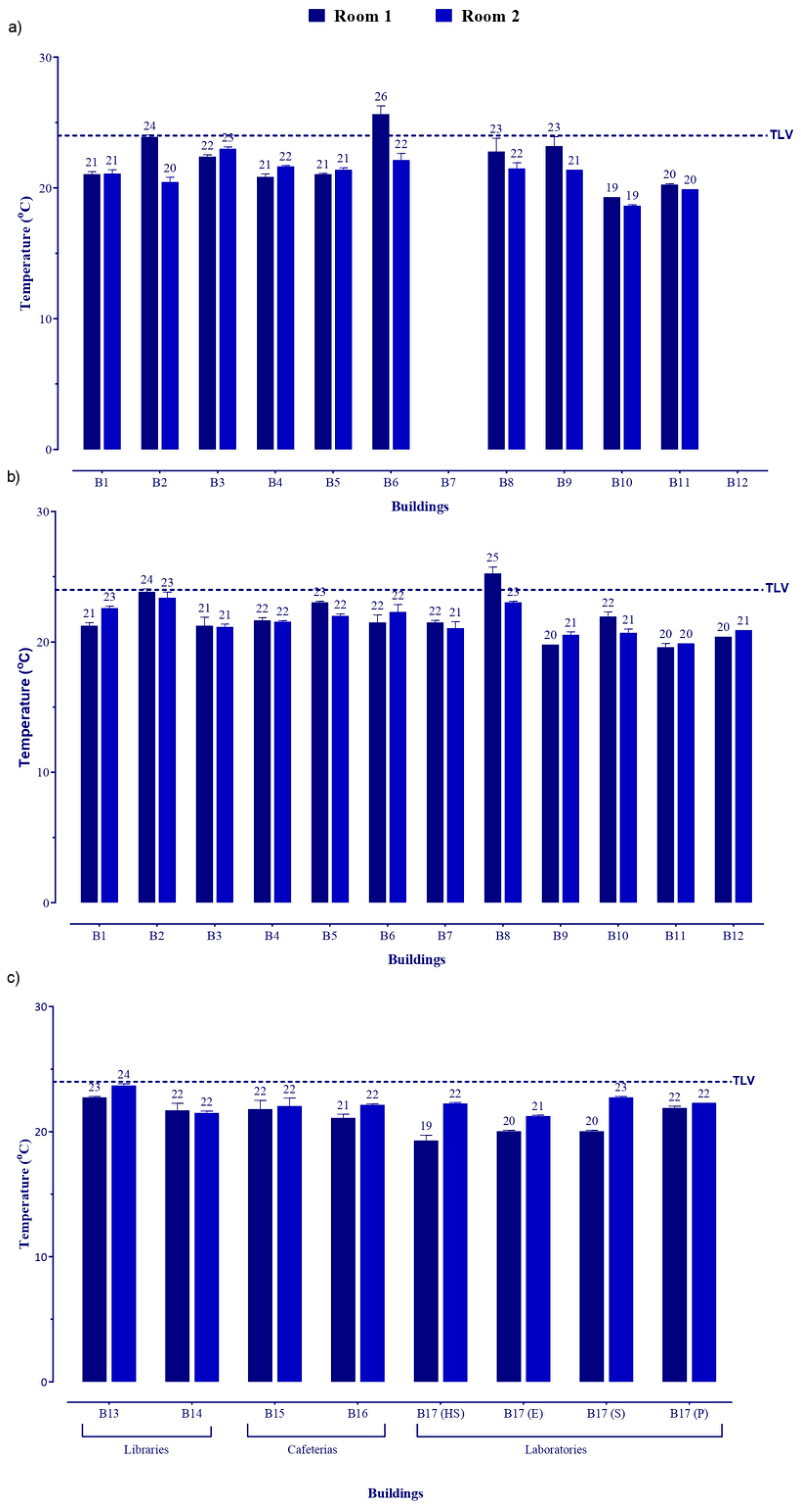
Figure A2.
Figure A2 shows the noise levels, in decibel (dB), recorded at two distinct locations in each university building, denoted as B(x). (a) represents the data collected in classrooms. (b) represents the data collected in offices. (c) represents the data collected in libraries, cafeterias, and laboratories.
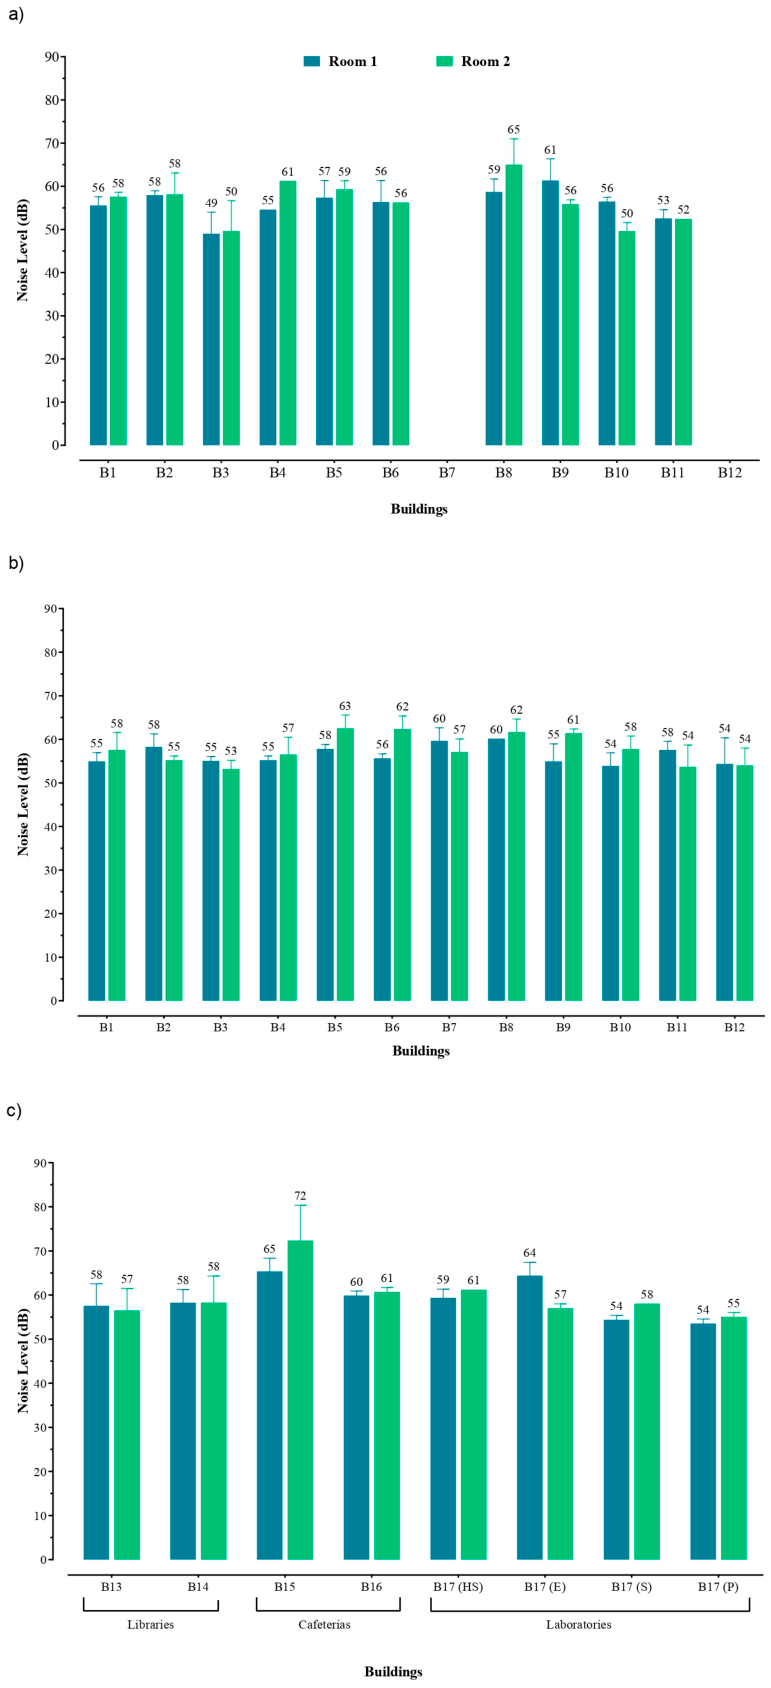
Figure A3.
Figure A3 shows the light intensity measured, in lux, at two distinct locations in each university building, denoted by B(x). (a) represents the data collected in classrooms. (b) represents the data collected in offices. (c) represents the data collected in libraries, cafeterias, and laboratories.
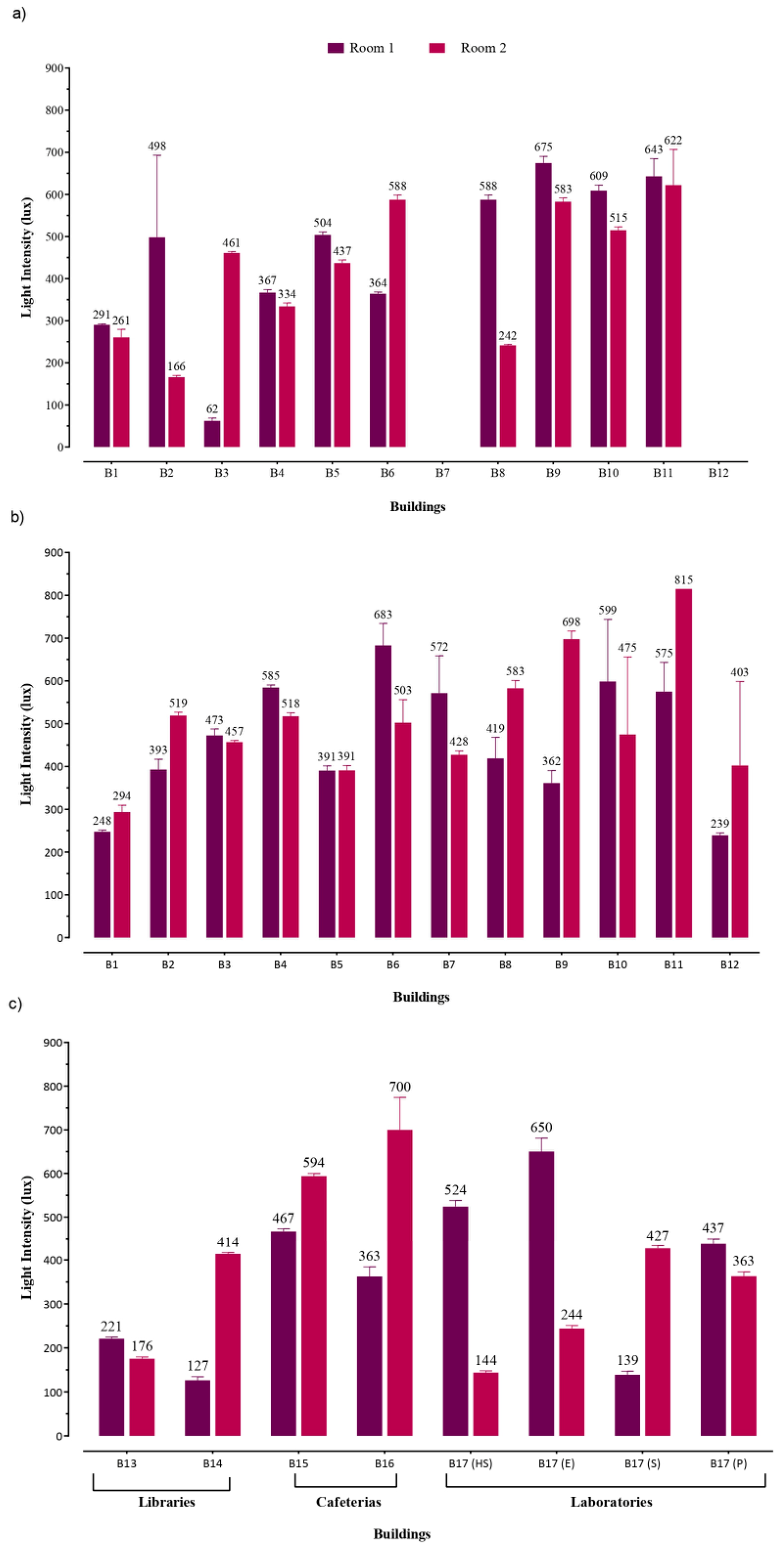
Figure A4.
Figure A4 shows the concentration of carbon dioxide (CO2) and carbon monoxide (CO) gases, in parts per million (ppm), in each university building, denoted as B(x). (a,d) represent the data collected in classrooms. (b,e) represent the data collected in offices. (c,f) represent the data collected in libraries, cafeterias, and laboratories.
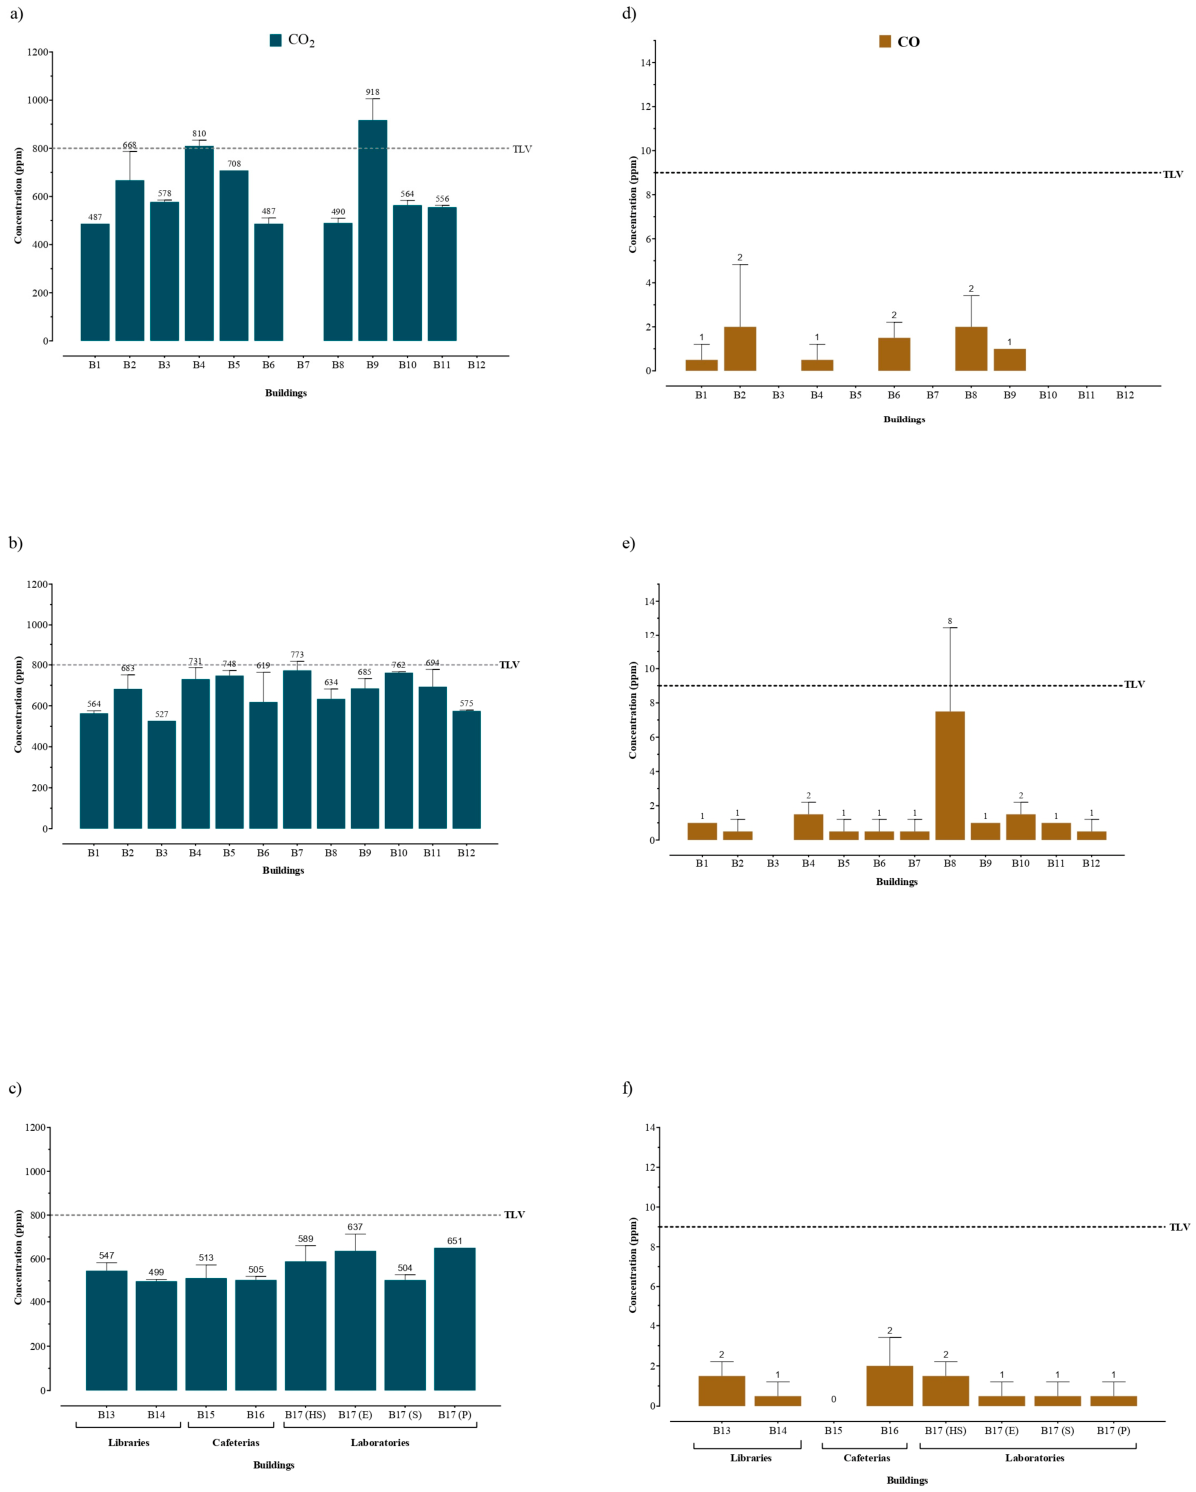
Figure A5.
Figure A5 shows the concentrations of particulate matter (PM2.5 & PM10), in parts per million (ppm), in each university building, denoted as B(x). (a) represents the data collected in classrooms. (b) represents the data collected in offices. (c) represents the data collected in libraries, cafeterias, and laboratories.
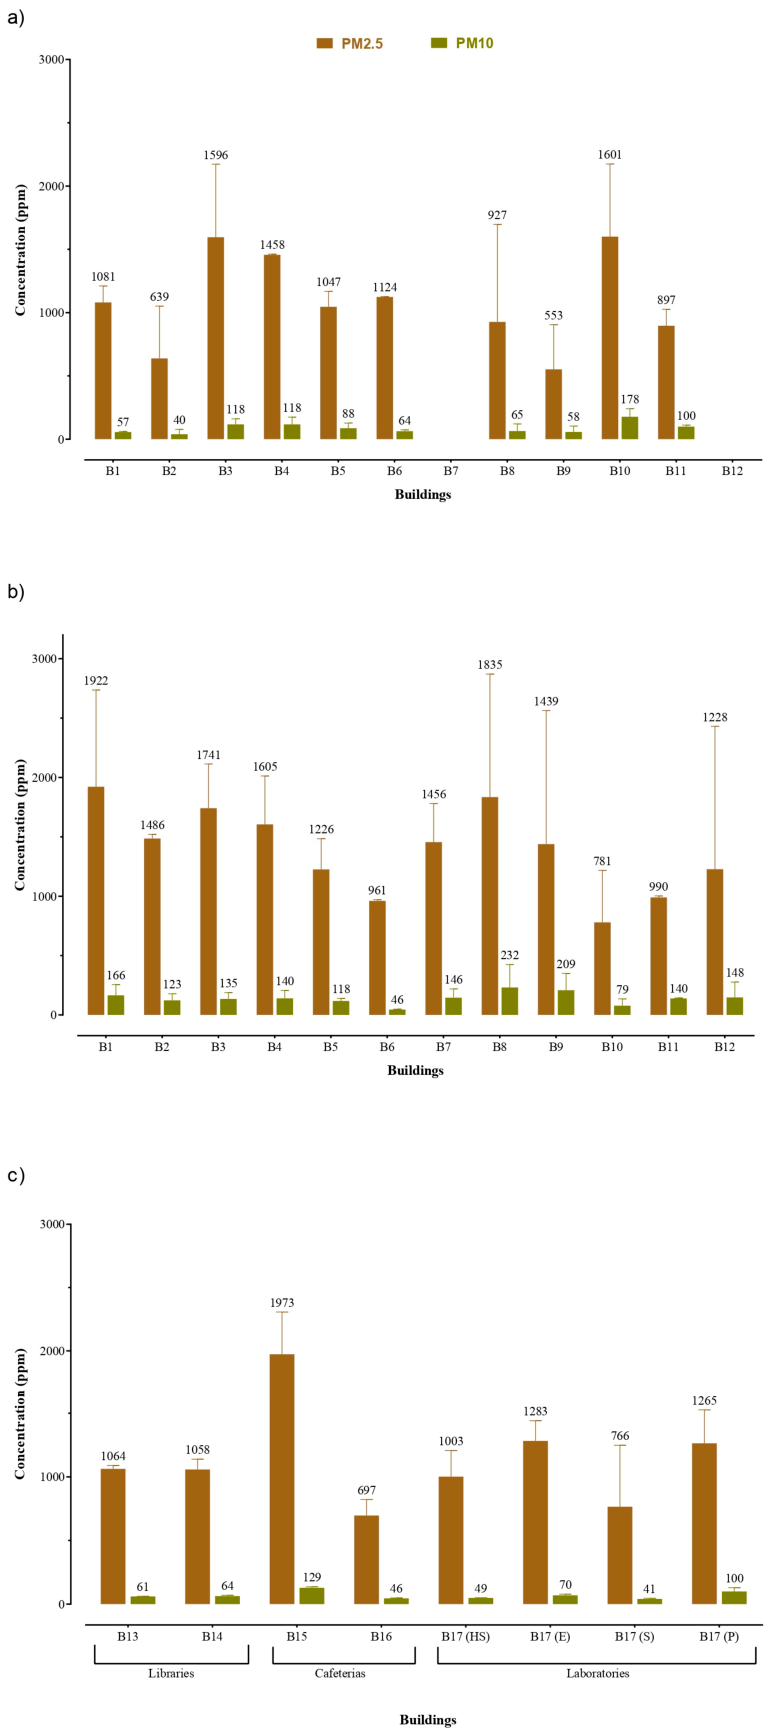
Figure A6.
Figure A6 shows the bacterial and fungal counts, in colony-forming unit (CFU) per cubic meter in each university building, denoted as B(x). (a) represents the data collected in classrooms. (b) represents the data collected in offices. (c) represents the data collected in libraries, cafeterias, and laboratories.
References
- Kim, Y.K.; Abdou, Y.; Abdou, A.; Altan, H. Indoor Environmental Quality Assessment and Occupant Satisfaction: A Post-Occupancy Evaluation of a UAE University Office Building. Buildings 2022, 12, 986. [Google Scholar] [CrossRef] [Scilit]
- Argunhan, Z.; Avci, A.S. Statistical Evaluation of Indoor Air Quality Parameters in Classrooms of a University. Adv. Meteorol. 2018, 2018, 5208067. [Google Scholar] [CrossRef] [Scilit]
- Alves, C.A.; Vicente, E.D.; Evtyugina, M.; Vicente, A.M.; Nunes, T.; Lucarelli, F.; Calzolai, G.; Nava, S.; Calvo, A.I.; Alegre, C.d.B.; et al. Indoor and outdoor air quality: A university cafeteria as a case study. Atmos. Pollut. Res. 2020, 11, 531–544. [Google Scholar] [CrossRef] [Scilit]
- Ramos, I.M.; Rodríguez-Sánchez, S.; Seseña, S.; Palop, M.L.; Poveda, J.M. Assessment of safety characteristics, postbiotic potential, and technological stress response of Leuconostoc strains from different origins for their use in the production of functional dairy foods. LWT 2022, 165, 113722. [Google Scholar] [CrossRef] [Scilit]
- Ugranli, T.; Toprak, M.; Gursoy, G.; Cimrin, A.H.; Sofuoglu, S.C. Indoor Environmental Quality in Chemistry and Chemical Engineering Laboratories at Izmir Institute of Technology. Atmos. Pollut. Res. 2015, 6, 147–153. [Google Scholar] [CrossRef] [Scilit]
- Kallawicha, K.; Chao, H.J.; Kotchasatan, N. Bioaerosol levels and the indoor air quality of laboratories in Bangkok metropolis. Aerobiologia 2019, 35, 1–14. [Google Scholar] [CrossRef] [Scilit]
- Di Giulio, M.; Grande, R.; Di Campli, E.; Di Bartolomeo, S.; Cellini, L. Indoor Air Quality in University Environments. Environ. Monit. Assess. 2010, 170, 509–517. [Google Scholar] [CrossRef] [Scilit] [PubMed]
- Li, H.; Qin, Y.; Feng, G. The analysis of PM2.5 Outdoor Fine Particulate Matter Impact on Air Quality in the University Libraries Reading Room in Winter of North China. Procedia Eng. 2017, 205, 3346–3352. [Google Scholar] [CrossRef] [Scilit]
- Sahu, V.; Gurjar, B.R. Spatio-temporal variations of indoor air quality in a university library. Int. J. Environ. Health Res. 2021, 31, 475–490. [Google Scholar] [CrossRef] [Scilit] [PubMed]
- Asif, A.; Zeeshan, M.; Jahanzaib, M. Indoor temperature, relative humidity and CO2 levels assessment in academic buildings with different heating, ventilation and air-conditioning systems. Build. Environ. 2018, 133, 83–90. [Google Scholar] [CrossRef] [Scilit]
- Norbäck, D.; Nordström, K. Sick building syndrome in relation to air exchange rate, CO2, room temperature and relative air humidity in university computer classrooms: An experimental study. Int. Arch. Occup. Environ. Health 2008, 82, 21–30. [Google Scholar] [CrossRef] [Scilit] [PubMed]
- Buonocore, C.; De Vecchi, R.; Scalco, V.; Lamberts, R. Thermal preference and comfort assessment in air-conditioned and naturally-ventilated university classrooms under hot and humid conditions in Brazil. Energy Build. 2020, 211, 109783. [Google Scholar] [CrossRef] [Scilit]
- Fadeyi, M.O.; Alkhaja, K.; Sulayem, M.B.; Abu-Hijleh, B. Evaluation of Indoor Environmental Quality Conditions in Elementary Schools’ Classrooms in the United Arab Emirates. Front. Archit. Res. 2014, 3, 166–177. [Google Scholar] [CrossRef] [Scilit]
- Gemenetzis, P.; Moussas, P.; Arditsoglou, A.; Samara, C. Mass concentration and elemental composition of indoor PM2.5 and PM10 in University rooms in Thessaloniki, northern Greece. Atmos. Environ. 2006, 40, 3195–3206. [Google Scholar] [CrossRef] [Scilit]
- Gaidajis, G.; Angelakoglou, K. Indoor air quality in university classrooms and relative environment in terms of mass concentrations of particulate matter. J. Environ. Sci. Health Part A 2009, 44, 1227–1232. [Google Scholar] [CrossRef] [Scilit] [PubMed]
- Alves, C.; Nunes, T.; Silva, J.; Duarte, M. Comfort Parameters and Particulate Matter (PM10 and PM2.5) in School Classrooms and Outdoor Air. Aerosol Air Qual. Res. 2013, 13, 1521–1535. [Google Scholar] [CrossRef] [Scilit]
- Alshitawi, M.; Awbi, H.; Mahyuddin, N. Particulate Matter Mass Concentration (PM 10) under Different Ventilation Methods in Classrooms. Int. J. Vent. 2009, 8, 93–108. [Google Scholar] [CrossRef] [Scilit]
- Bikaki, M.A.; Dounias, G.; Farantos, G.; Cavoura, O.; Damikouka, I.; Evrenoglou, L. Indoor Air Quality in Selected School Buildings in the Central Sector of Athens at the Attica’s Region and Potential Health Risks. Eur. Sci. J. ESJ 2025, 21, 633–645. [Google Scholar] [CrossRef] [Scilit]
- Yaman, G.Ö.; Varolgüneş, F.K.; Çulun, P. Investigation of Thermal Comfort in University Offices: The Case of the Bingöl University. Civ. Eng. Archit. 2021, 9, 2441–2451. [Google Scholar] [CrossRef] [Scilit]
- Md Taib, N.S.; Shaikh Salim, S.A.Z.; Hagishima, A.; Khalid, W.; Yakub, F.; Kamaruddin, N.I. Pilot Study on Occupants’ Thermal Sensation at Different Ambient Temperature in Postgraduate Office with Cooling Mode in University Campus. J. Adv. Res. Fluid Mech. Therm. Sci. 2020, 78, 1–11. [Google Scholar] [CrossRef] [Scilit]
- Adebayo, O.J.; Abosede, O.O.; Sunday, F.B.; Ayooluwa, A.A.; Adetayo, A.J.; Ademola, S.J.; Alaba, A.F. Indoor air quality level of total volatile organic compounds (TVOCs) in a university offices. Int. J. Civ. Eng. Technol. 2018, 9, 2872–2882. [Google Scholar]
- Li, Z.; Zhang, Q.; Fan, F.; Shen, S. A comprehensive comfort assessment method for indoor environmental quality in university open-plan offices in severe cold regions. Build. Environ. 2021, 197, 107845. [Google Scholar] [CrossRef] [Scilit]
- Indraganti, M.; Ooka, R.; Rijal, H.B. Thermal comfort in offices in summer: Findings from a field study under the ‘setsuden’ conditions in Tokyo, Japan. Build. Environ. 2013, 61, 114–132. [Google Scholar] [CrossRef] [Scilit]
- Fan, G.; Xie, J.; Liu, J. Indoor Air Quality in a Naturally Ventilated Research Student Office in Chinese Universities during Heating Period. Procedia Eng. 2017, 205, 1272–1278. [Google Scholar] [CrossRef] [Scilit]
- Onat, B.; Yaşar, G.; Uzun, B.; Ayvaz, C.; Alver Şahin, Ü. Indoor environmental quality in the university laboratories. Pamukkale Univ. J. Eng. Sci. 2023, 29, 642–649. [Google Scholar] [CrossRef] [Scilit]
- Asmi, A.; Putra, J.C.P.; Abdul Rahman, I. A study of indoor air quality in university laboratory buildings. Int. J. Eng. Sci. Technol. (IJEST) 2012, 4, 4187–4193. [Google Scholar]
- Saad, Z.M.; Rasdi, I.; Abidin, D.E.Z. Indoor Air Quality and Prevalence of Sick Building Syndrome among University Laboratory Workers. Int. J. Sci. Basic Appl. Res. 2016, 30, 179–195. [Google Scholar]
- Stryjakowska-Sekulska, M.; Piotraszewska-Pajak, A.; Szyszka, A.; Nowicki, M.; Filipiak, M. Microbiological qualtiy of indoor air in university rooms. Pol. J. Environ. Stud. 2007, 16, 623–632. [Google Scholar]
- Reuben, U.; Ismail, A.F.; Ahmad, A.L.; Maina, H.M.; Daud, A. Indoor air quality and sick building syndrome among nigerian laboratory university workers. J. Phys. Sci. 2019, 30, 179–195. [Google Scholar] [CrossRef] [Scilit]
- Hayleeyesus, S.F.; Manaye, A.M. Microbiological Quality of Indoor Air in University Libraries. Asian Pac. J. Trop. Biomed. 2014, 4, S312–S317. [Google Scholar] [CrossRef] [Scilit] [PubMed]
- Yau, Y.H.; Chew, B.T.; Saifullah, A.Z.A. Studies on the indoor air quality of Pharmaceutical Laboratories in Malaysia. Int. J. Sustain. Built Environ. 2012, 1, 110–124. [Google Scholar] [CrossRef] [Scilit]
- Zainordin, N.S.; Azlan, N.; Arsaad, N.; Mauliadi, A.; Sharif, A.F.M.; Rosli, N.C.E. Comparative Analysis of Airborne Particulates and Indoor Physical Parameters between Dry and Wet Laboratories at the Faculty of Forestry and Environment, Universiti Putra Malaysia. IOP Conf. Ser. Earth Environ. Sci. 2022, 1102, 012061. [Google Scholar] [CrossRef] [Scilit]
- Wu, Y.; Lu, Y.; Chou, D.-C. Indoor air quality investigation of a university library based on field measurement and questionnaire survey. Int. J. Low-Carbon Technol. 2018, 13, 148–160. [Google Scholar] [CrossRef] [Scilit]
- Hassan, A.; Zeeshan, M.; Bhatti, M.F. Indoor and outdoor microbiological air quality in naturally and mechanically ventilated university libraries. Atmos. Pollut. Res. 2021, 12, 101136. [Google Scholar] [CrossRef] [Scilit]
- Dede, G.; Dede, C. Determination of Indoor Air Quality in University Student Canteens. Sak. Univ. J. Sci. 2021, 25, 1322–1331. [Google Scholar] [CrossRef] [Scilit]
- Dorizas, P.V.; Assimakopoulos, M.-N.; Santamouris, M. A Holistic Approach for the Assessment of the Indoor Environmental Quality, Student Productivity, and Energy Consumption in Primary Schools. Environ. Monit. Assess. 2015, 187, 259. [Google Scholar] [CrossRef] [Scilit] [PubMed]
- IAQM. Indoor Air Quality Guidance: Assessment, Monitoring, Mitigation and Modelling; Institute of Air Quality Management: London, UK, 2021. [Google Scholar]
- Bahadori, A.; Zahedi, G.; Zendehboudi, S.; Hooman, K. Simple predictive tool to estimate relative humidity using wet bulb depression and dry bulb temperature. Appl. Therm. Eng. 2013, 50, 511–515. [Google Scholar] [CrossRef] [Scilit]
- Stull, R. Wet-Bulb Temperature from Relative Humidity and Air Temperature. J. Appl. Meteorol. Climatol. 2011, 50, 2267–2269. [Google Scholar] [CrossRef] [Scilit]
- Chan, K.H.; Peiris, J.S.M.; Lam, S.Y.; Poon, L.L.M.; Yuen, K.Y.; Seto, W.H. The Effects of Temperature and Relative Humidity on the Viability of the SARS Coronavirus. Adv. Virol. 2011, 2011, 734690. [Google Scholar] [CrossRef] [Scilit] [PubMed]
- Thattai, D.; Sudarsan, J.S.; Sathyanathan, R.; Ramasamy, V. Analysis of noise pollution level in a University campus in South India. IOP Conf. Ser. Earth Environ. Sci. 2017, 80, 012053. [Google Scholar] [CrossRef] [Scilit]
- Hajibabaei, M.; Kord, S.; Rasooli, E. Comparison of Different Methods of Measuring Illuminance in the Indoor of Office and Educational Buildings. Jundishapur J. Health Sci. 2014, 6, e21720. [Google Scholar] [CrossRef] [Scilit]
- Jia, L.-R.; Han, J.; Chen, X.; Li, Q.-Y.; Lee, C.-C.; Fung, Y.-H. Interaction between Thermal Comfort, Indoor Air Quality and Ventilation Energy Consumption of Educational Buildings: A Comprehensive Review. Buildings 2021, 11, 591. [Google Scholar] [CrossRef] [Scilit]
- US EPA. Particulate Matter (PM) Basics. Available online: https://www.epa.gov/pm-pollution/particulate-matter-pm-basics (accessed on 24 November 2025).
- Ghanizadeh, F.; Godini, H. A review of the chemical and biological pollutants in indoor air in hospitals and assessing their effects on the health of patients, staff and visitors. Rev. Environ. Health 2018, 33, 231–245. [Google Scholar] [CrossRef] [Scilit] [PubMed]
- SFS-EN 12464-1:2011; The Indoor Lighting Standard. ENSTO: Porvoo, Finland, 2011.
- Rockwool. Combat Noise in Industrial Pipe Work: Reduce Noise Levels in Industrial Environments; Rockwool: Hedehusene, Denmark, 2018. [Google Scholar]
- Dubai Government. Health and Safety Department Technical Guidelines: Management of Heat Stress at Work; Dubai Municipality: Dubai, United Arab Emirates, 2019.
- US EPA. NAAQS Table. Available online: https://www.epa.gov/criteria-air-pollutants/naaqs-table (accessed on 27 February 2025).
- Persily, A.; Bahnfleth, W.P.; Kipen, H.; Leung, L. ASHRAE Position Document on Indoor Carbon Dioxide; ASHRAE: Atlanta, GA, USA, 2025. [Google Scholar]
- US EPA. EPA Emergency Response Air Monitoring Guidance Tables; U.S. Environmental Protection Agency: Washington, DC, USA, 2009.
- ISO 14644-3; Cleanrooms and Associated Controlled Environments. ISO (International Organization for Standardization): Geneva, Switzerland, 2019. Available online: https://www.iso.org/obp/ui/#iso:std:iso:14644:-3:ed-2:v2:en (accessed on 13 December 2025).
- Dehghani, M.; Sorooshian, A.; Nazmara, S.; Baghani, A.N.; Delikhoon, M. Concentration and Type of Bioaerosols before and after Conventional Disinfection and Sterilization Procedures inside Hospital Operating Rooms. Ecotoxicol. Environ. Saf. 2018, 164, 277–282. [Google Scholar] [CrossRef] [Scilit] [PubMed]
- ISO 7726:1998; Ergonomics of the Thermal Environment—Instruments for Measuring Physical Quantities. ISO (International Organization for Standardization): Geneva, Switzerland, 1998. Available online: https://standards.iteh.ai/catalog/standards/sist/99f92eea-d1b3-48b4-8a3c-8e5a5112718a/iso-7726-1998 (accessed on 21 May 2025).
- Psiloglou, B.E.; Gkinis, N.; Giannakopoulos, C. High-Resolution Temporal Variation of Thermal Discomfort Indices in the Eastern Mediterranean City of Athens, Greece, Since the Beginning of the 20th Century (1901–2024). Climate 2025, 13, 210. [Google Scholar] [CrossRef] [Scilit]
- Aeroqual. Series 500 Handheld Air Quality Monitor. Available online: https://www.aeroqual.com/products/series-500-handheld-air-quality-monitor (accessed on 13 January 2025).
- Vonci, N.; De Marco, M.F.; Grasso, A.; Spataro, G.; Cevenini, G.; Messina, G. Association between Air Changes and Airborne Microbial Contamination in Operating Rooms. J. Infect. Public Health 2019, 12, 827–830. [Google Scholar] [CrossRef] [Scilit] [PubMed]
- ISO 14698-1:2003; Cleanrooms and Associated Controlled Environments—Biocontamination Control—Part 1: General Principles and Methods. ISO (International Organization for Standardization): Geneva, Switzerland, 2003. Available online: https://www.iso.org/standard/25015.html (accessed on 6 May 2025).
- NIOSH. Bioaerosol Sampling. In NIOSH Manual of Analytical Methods (NMAM), 4th ed.; National Institute for Occupational Safety and Health: Cincinnati, OH, USA, 1994. Available online: https://www.cdc.gov/niosh/nmam/pdf/chapter-ba.pdf (accessed on 25 April 2025).
- Andersen, A.A. New Sampler for the Collection, Sizing, and Enumeration of Viable Airborne Particles. J. Bacteriol. 1958, 76, 471–484. [Google Scholar] [CrossRef] [Scilit] [PubMed]
- IEST. ISO Biocontamination Standards. Available online: https://www.iest.org/Standards-RPs/ISO-Standards/ISO-14698 (accessed on 13 March 2025).
- Lindsley, W.G.; Green, B.; Blachere, F.; Martin, S.; Law, B.; Jensen, P.; Schafer, M. Sampling and Characterization of Bioaerosols. In NIOSH Manual of Analytical Methods; NIOSH: Cincinnati, OH, USA, 2017; pp. 4–7. [Google Scholar]
- World Health Organization. Night Noise Guidelines for Europe; WHO Regional Office for Europe: Copenhagen, Denmark, 2010; Available online: https://www.who.int/publications/i/item/9789289053563 (accessed on 7 October 2025).
- Jo, W.-K.; Seo, Y.-J. Indoor and outdoor bioaerosol levels at recreation facilities, elementary schools, and homes. Chemosphere 2005, 61, 1570–1579. [Google Scholar] [CrossRef] [Scilit] [PubMed]
- Kristiansen, J.; Persson, R.; Lund, S.P.; Shibuya, H.; Nielsen, P.M. Effects of Classroom Acoustics and Self-Reported Noise Exposure on Teachers’ Well-Being. Environ. Behav. 2013, 45, 283–300. [Google Scholar] [CrossRef] [Scilit]
- Al-Isawi, R.; Idan, I.J.; Hassan, A.A. Investigation of Noise Pollution in an Educational Building—Case Study of Babylon University in Iraq. IOP Conf. Ser. Earth Environ. Sci. 2022, 961, 012068. [Google Scholar] [CrossRef] [Scilit]
- Özer, S.; Zengin, M.; Yılmaz, H. Determination of the Noise Pollution on University (Education) Campuses: A Case Study of Ataturk University. Ekoloji 2014, 23, 49–54. [Google Scholar] [CrossRef] [Scilit]
- de Souza, T.B.; Alberto, K.C.; Barbosa, S.A. Evaluation of noise pollution related to human perception in a university campus in Brazil. Appl. Acoust. 2020, 157, 107023. [Google Scholar] [CrossRef] [Scilit]
- Zannin, P.H.T.; Engel, M.S.; Fiedler, P.E.K.; Bunn, F. Characterization of environmental noise based on noise measurements, noise mapping and interviews: A case study at a university campus in Brazil. Cities 2013, 31, 317–327. [Google Scholar] [CrossRef] [Scilit]
- Magioli, F.B.; Cesar, J.; Torres, B. Influência das Transformações Urbanas no Conforto Acústico: Estudo-Piloto da Cidade Universitária da UFRJ. urbe. Rev. Bras. Gestão Urbana 2018, 10, 400–413. [Google Scholar] [CrossRef] [Scilit]
- El-Sharkawy, M.; Noweir, M.H. Indoor air quality levels in a University Hospital in the Eastern Province of Saudi Arabia. J. Fam. Community Med. 2014, 21, 39. [Google Scholar] [CrossRef] [Scilit] [PubMed]
- Qudiesat, K.; Abu-Elteen, K.; Elkarmi, A.; Hamad, M.; Abussaud, M. Assessment of airborne pathogens in healthcare workspaces. Afr. J. Microbiol. Res. 2009, 3, 66–76. Available online: https://www.researchgate.net/publication/255571569 (accessed on 14 February 2025).
- Susana, S.; Rodríguez, A.M.; Palop, M.L. Indoor Air Quality Analysis in Naturally Ventilated University Training Laboratories: A Health Risk Assessment. Air Qual. Atmos. Health 2022, 15, 1817–1837. [Google Scholar] [CrossRef] [Scilit]
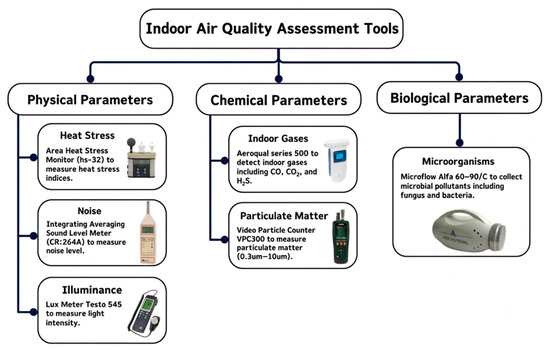
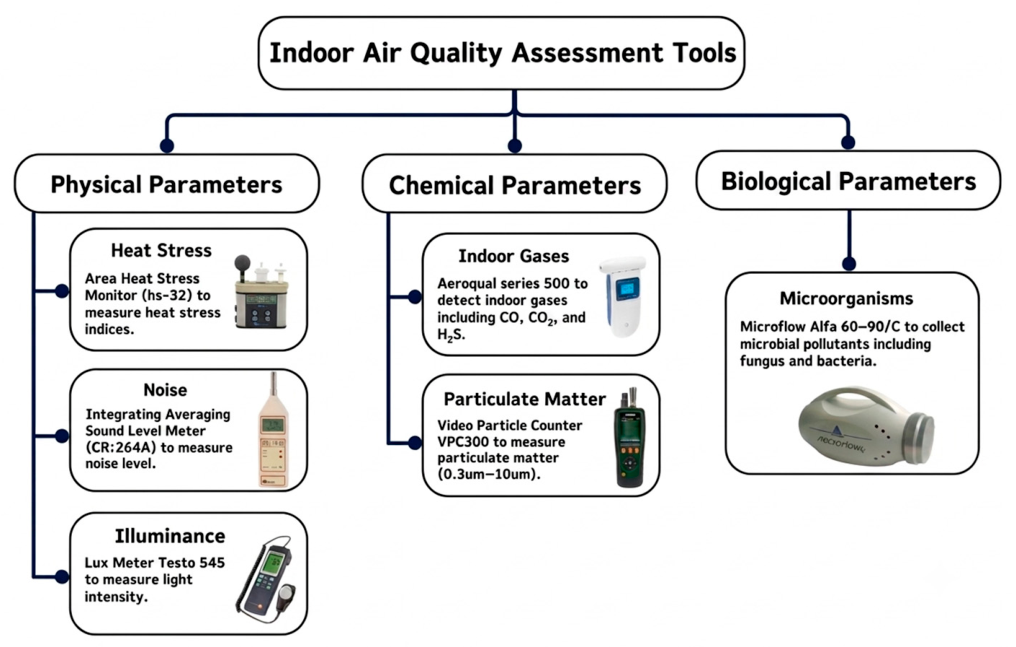
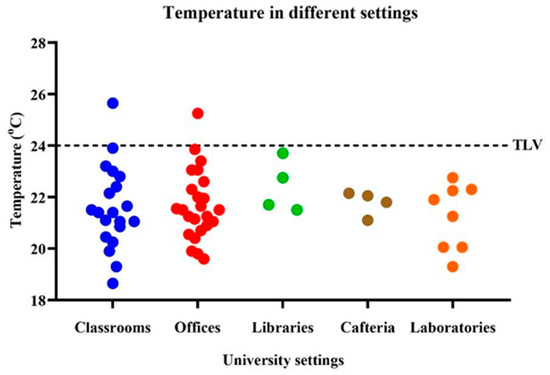
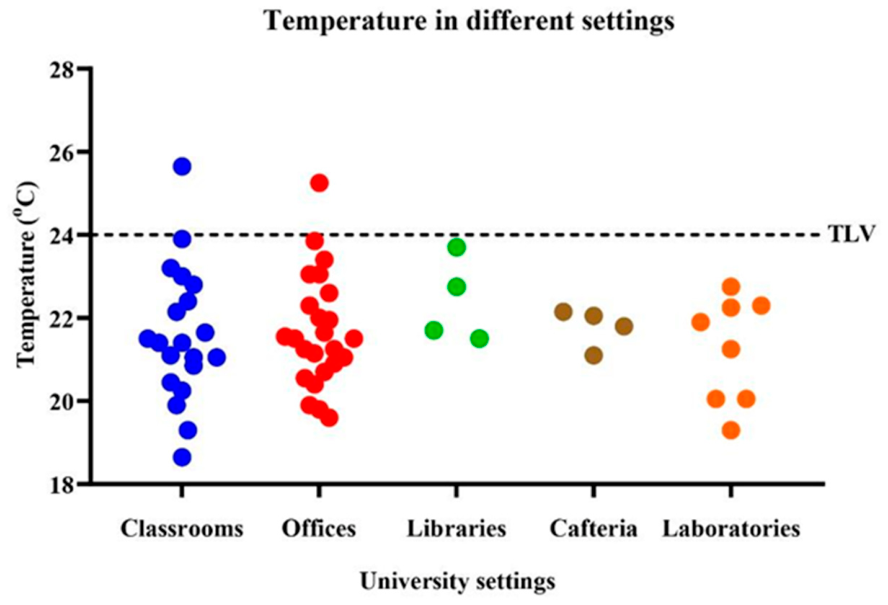
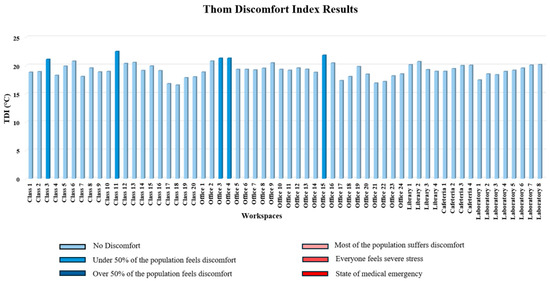
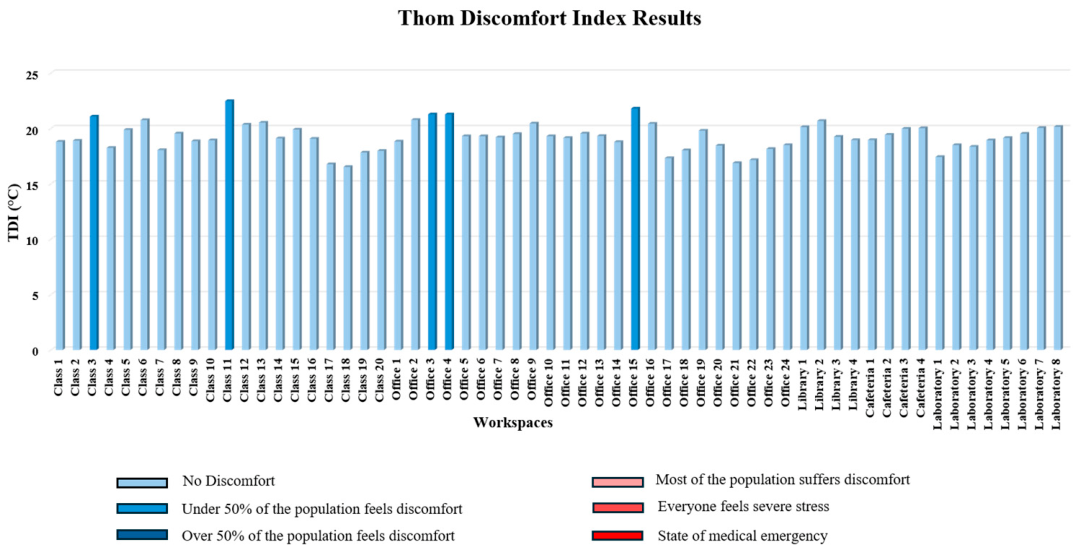
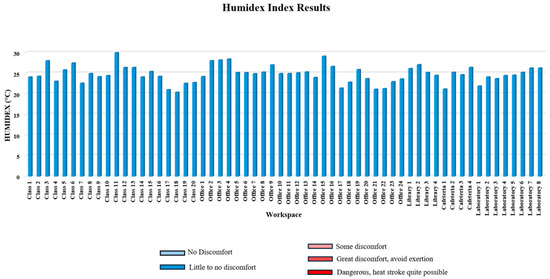
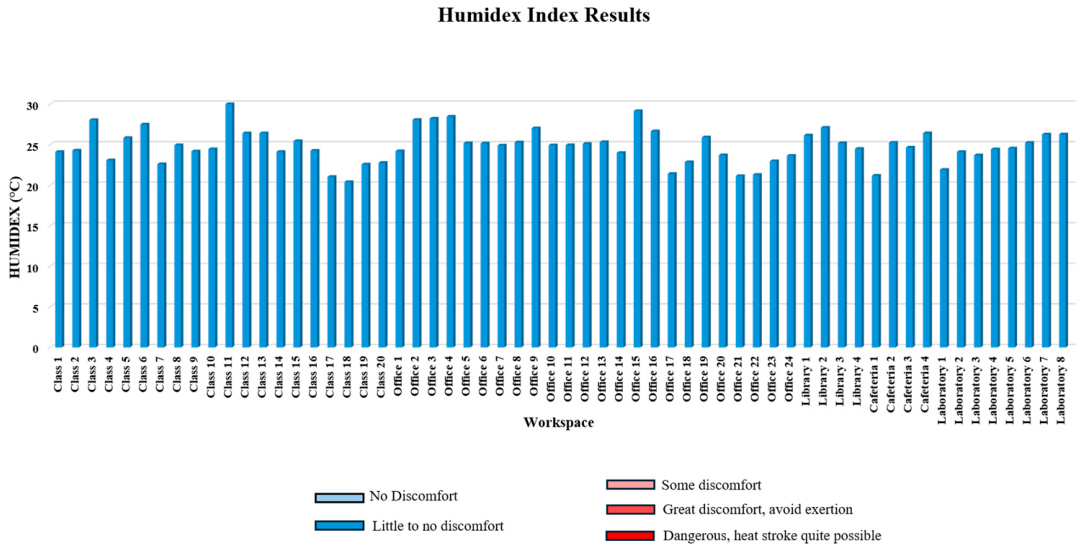
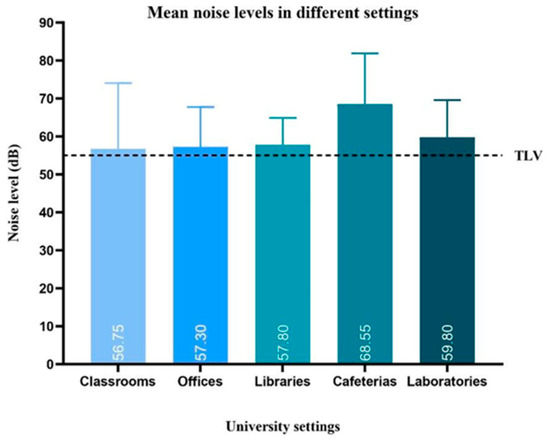
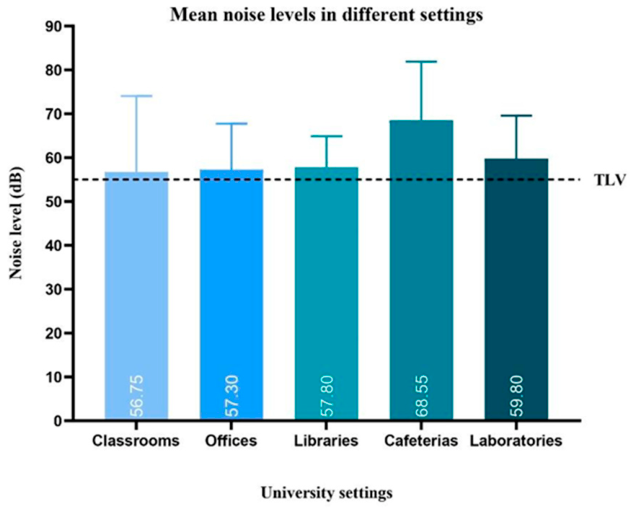
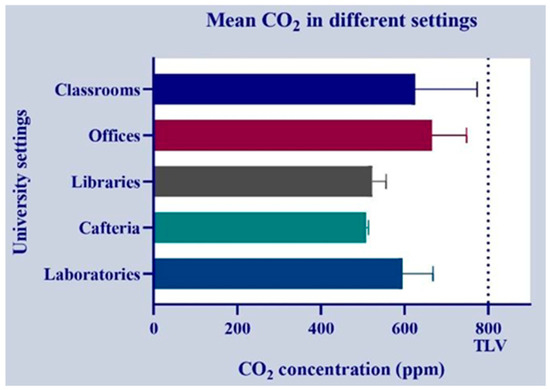
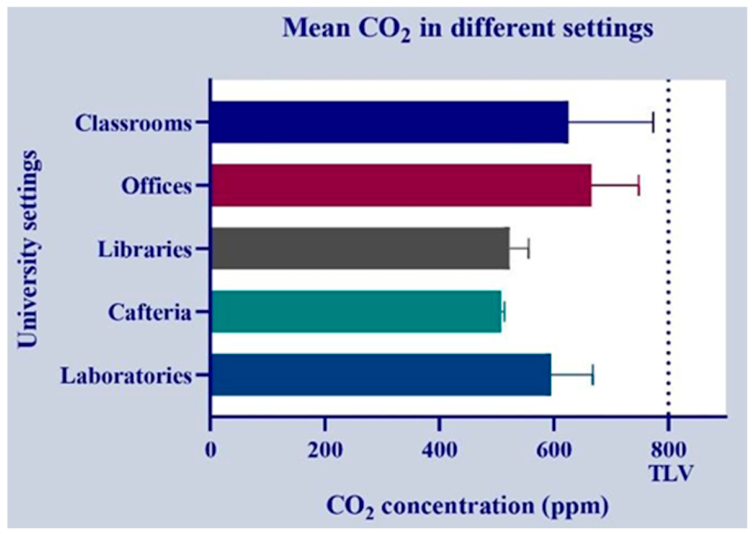
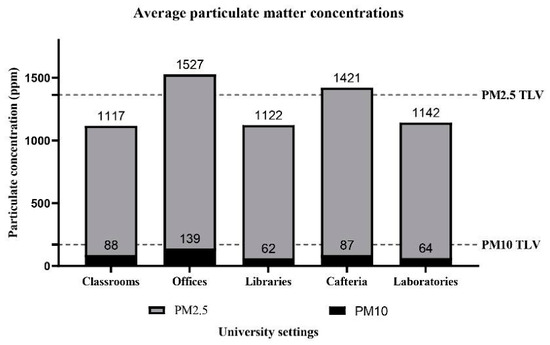
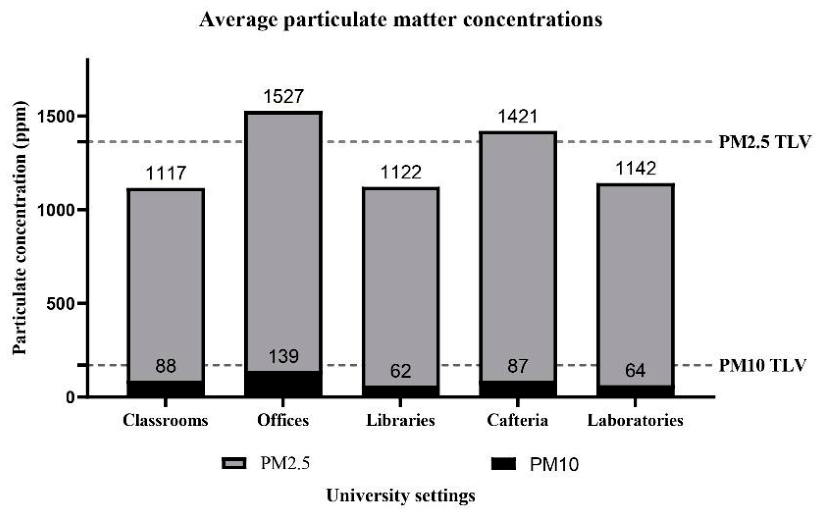

Disclaimer/Publisher’s Note: The statements, opinions and data contained in all publications are solely those of the individual author(s) and contributor(s) and not of MDPI and/or the editor(s). MDPI and/or the editor(s) disclaim responsibility for any injury to people or property resulting from any ideas, methods, instructions or products referred to in the content. |
© 2026 by the authors. Licensee MDPI, Basel, Switzerland. This article is an open access article distributed under the terms and conditions of the Creative Commons Attribution (CC BY) license.