1. Introduction
Against the backdrop of global climate warming, the frequency and intensity of extreme heat events have been increasing continuously, posing serious threats to urban public health, energy security, and natural ecosystems [
1,
2]. A growing body of recent studies has demonstrated that the hazard risk of high temperatures depends not only on the magnitude of temperature rise but also on the modulating effect of humidity, since the thermodynamic state of near-surface air is jointly determined by temperature and moisture content, and different temperature-humidity combinations can yield markedly different atmospheric stability, energy balance, and surface–atmosphere interaction patterns [
3,
4]. Consequently, traditional heatwave identification approaches based solely on dry-bulb temperature are no longer sufficient for refined risk assessment, and the integration of humidity into heatwave classification systems has become a critical research priority in climate science.
In response to this challenge, extensive research has been conducted on the classification of compound heat events and humid heat stress. In terms of methodology, classification schemes based on dry-bulb and wet-bulb temperatures have been widely applied to analyze the evolution of compound heat events in major urban agglomerations worldwide [
5]. Results indicate that the synergistic effect of heat and humidity has significantly increased human heat exposure risk in southern Europe and the eastern United States [
6,
7]. At the regional scale of East Asia, classification practices based on the same indicator system have further validated the effectiveness of this approach in identifying the spatiotemporal characteristics of different types of dry and humid heatwaves [
8]. In West Africa, the frequency of compound heatwaves has been found to increase at a much higher rate than that of pure dry heatwaves. Moreover, the dominant driving factors exhibit marked seasonal differences [
9,
10]. Regarding the selection of humidity indicators, the effects of different moisture metrics—such as wet-bulb temperature and dew-point temperature—on heatwave classification outcomes have been systematically compared at the East Asian regional scale. The results show that wet-bulb temperature is more advantageous in reflecting actual physiological thermal responses [
11]. Furthermore, assessments from the perspectives of human physiological tolerance limits and labor productivity indicate that humid heat events exhibit nonlinear and irreversible hazardous characteristics [
12,
13]. Collectively, these studies have advanced the understanding of heatwaves from a “temperature-only” perspective toward a “temperature-humidity synergy” framework, thereby laying a methodological foundation for subsequent refined classification research.
Concurrently, the modulating effect of urbanization on regional extreme high temperatures has also drawn extensive attention. The expansion of urban impervious surfaces replaces natural vegetation, thereby weakening surface evapotranspirative cooling capacity and enhancing heat storage. This process gives rise to a pronounced urban heat island effect [
14]. Further research indicates that urbanization not only influences temperature but also substantially modifies the near-surface atmospheric moisture environment [
15]. This dual influence stems from fundamental alterations in surface hydrological pathways following the replacement of natural land cover with impervious materials [
16]. Evidence from multi-city comparative analyses has led to the concept of the “urban dry island effect”. Specifically, urbanization reduces surface evaporation and increases runoff, resulting in lower specific humidity in urban areas compared to surrounding rural areas. This drying trend may inhibit the concurrent occurrence of high temperature and high humidity [
17,
18]. In summary, the effect of urbanization on high temperatures is not merely a unidimensional “warming” process. Rather, it exerts differentiated modulating influences on various types of extreme high-temperature events through both “thermal” and “hydrological” pathways [
19].
Notably, most of the aforementioned studies have identified compound events by independently judging whether dry-bulb and wet-bulb temperatures exceed their respective thresholds [
11,
20,
21]. This non-mutually exclusive identification approach implies that when a single heatwave episode simultaneously satisfies both conditions, it is counted repeatedly into both “dry heat” and “humid heat” categories. From the perspective of attribution analysis, such sample overlap introduces potential uncertainties in assessing the contributions of external forcing factors such as urbanization. This is because the observed changes may reflect the combined responses of both temperature and humidity fields, rather than the independent signal of a specific event type. This issue represents a long-standing methodological challenge in the identification and attribution of compound extreme events [
22,
23]. Although recent studies have begun to examine the contribution of urbanization to compound heat events in China [
24,
25,
26], a clear understanding of whether and how urbanization selectively influences pure dry, pure humid, and compound heatwaves remains lacking, as long as the overlap problem has not been resolved within the classification framework.
Zhejiang Province is located along the eastern coast of China and serves as a core component of the Yangtze River Delta urban agglomeration. It has undergone rapid urbanization over the past several decades. Meanwhile, influenced by the East Asian monsoon, this region experiences both dry–hot conditions driven by continental air masses and humid–hot processes associated with ample moisture transported by the southeast monsoon during summer. These characteristics make it an ideal area for investigating the differentiated impacts of urbanization on various types of high-temperature events [
27]. However, existing studies focusing on this region have either followed conventional approaches that use a single dry-bulb temperature threshold to identify heatwaves while neglecting the humid-heat attribute [
28], or have incorporated wet-bulb temperature into heatwave identification without adopting a mutually exclusive classification framework to eliminate event overlaps [
29]. Consequently, the contributions of “dry heat” and “humid heat” remain confounded, and the mechanisms through which urbanization influences different types of heat events in this region remain unclear.
Therefore, this study proposes a mutually exclusive classification framework based on dry-bulb and wet-bulb temperatures. It strictly divides extreme high-temperature events into three non-overlapping categories: dry extreme high-temperature events, humid extreme high-temperature events, and compound extreme high-temperature events. On this basis, we utilize meteorological station data from Zhejiang Province during 1980–2019 and satellite-derived impervious surface data. We analyze the spatiotemporal evolution characteristics of the three types of heatwaves. We also evaluate the differentiated impacts of urbanization on them. This study aims to answer two scientific questions: (1) What are the evolutionary trends and spatial patterns of the three mutually exclusive high-temperature events? (2) How does the urbanization process, characterized by the proportion of impervious surfaces, modulate different types of high-temperature events? The findings are expected to provide scientific evidence for type-specific high-temperature risk warning and adaptive urban planning in coastal cities.
2. Data and Methods
2.1. Study Area and Meteorological Data
Zhejiang Province is located on the southeast coast of China. Its geographical coordinates range from 118° to 123° E and from 27° to 31° N. The total land area is approximately 105,500 km2. The terrain is complex. The southwestern part is dominated by mountains and hills, the central part consists of basins, and the northeastern part is a plain area. The coastline is winding, with numerous islands scattered along the coast. The region has a subtropical monsoon climate, characterized by four distinct seasons and abundant precipitation. In the summer, under the combined influence of the Western Pacific Subtropical High and the East Asian monsoon, persistent high-temperature and high-humidity weather occurs frequently. Moreover, Zhejiang Province has a relatively high level of urbanization, with pronounced spatial disparities in regional development. Therefore, it is a typical region for studying multi-type extreme high-temperature events and their responses to urbanization.
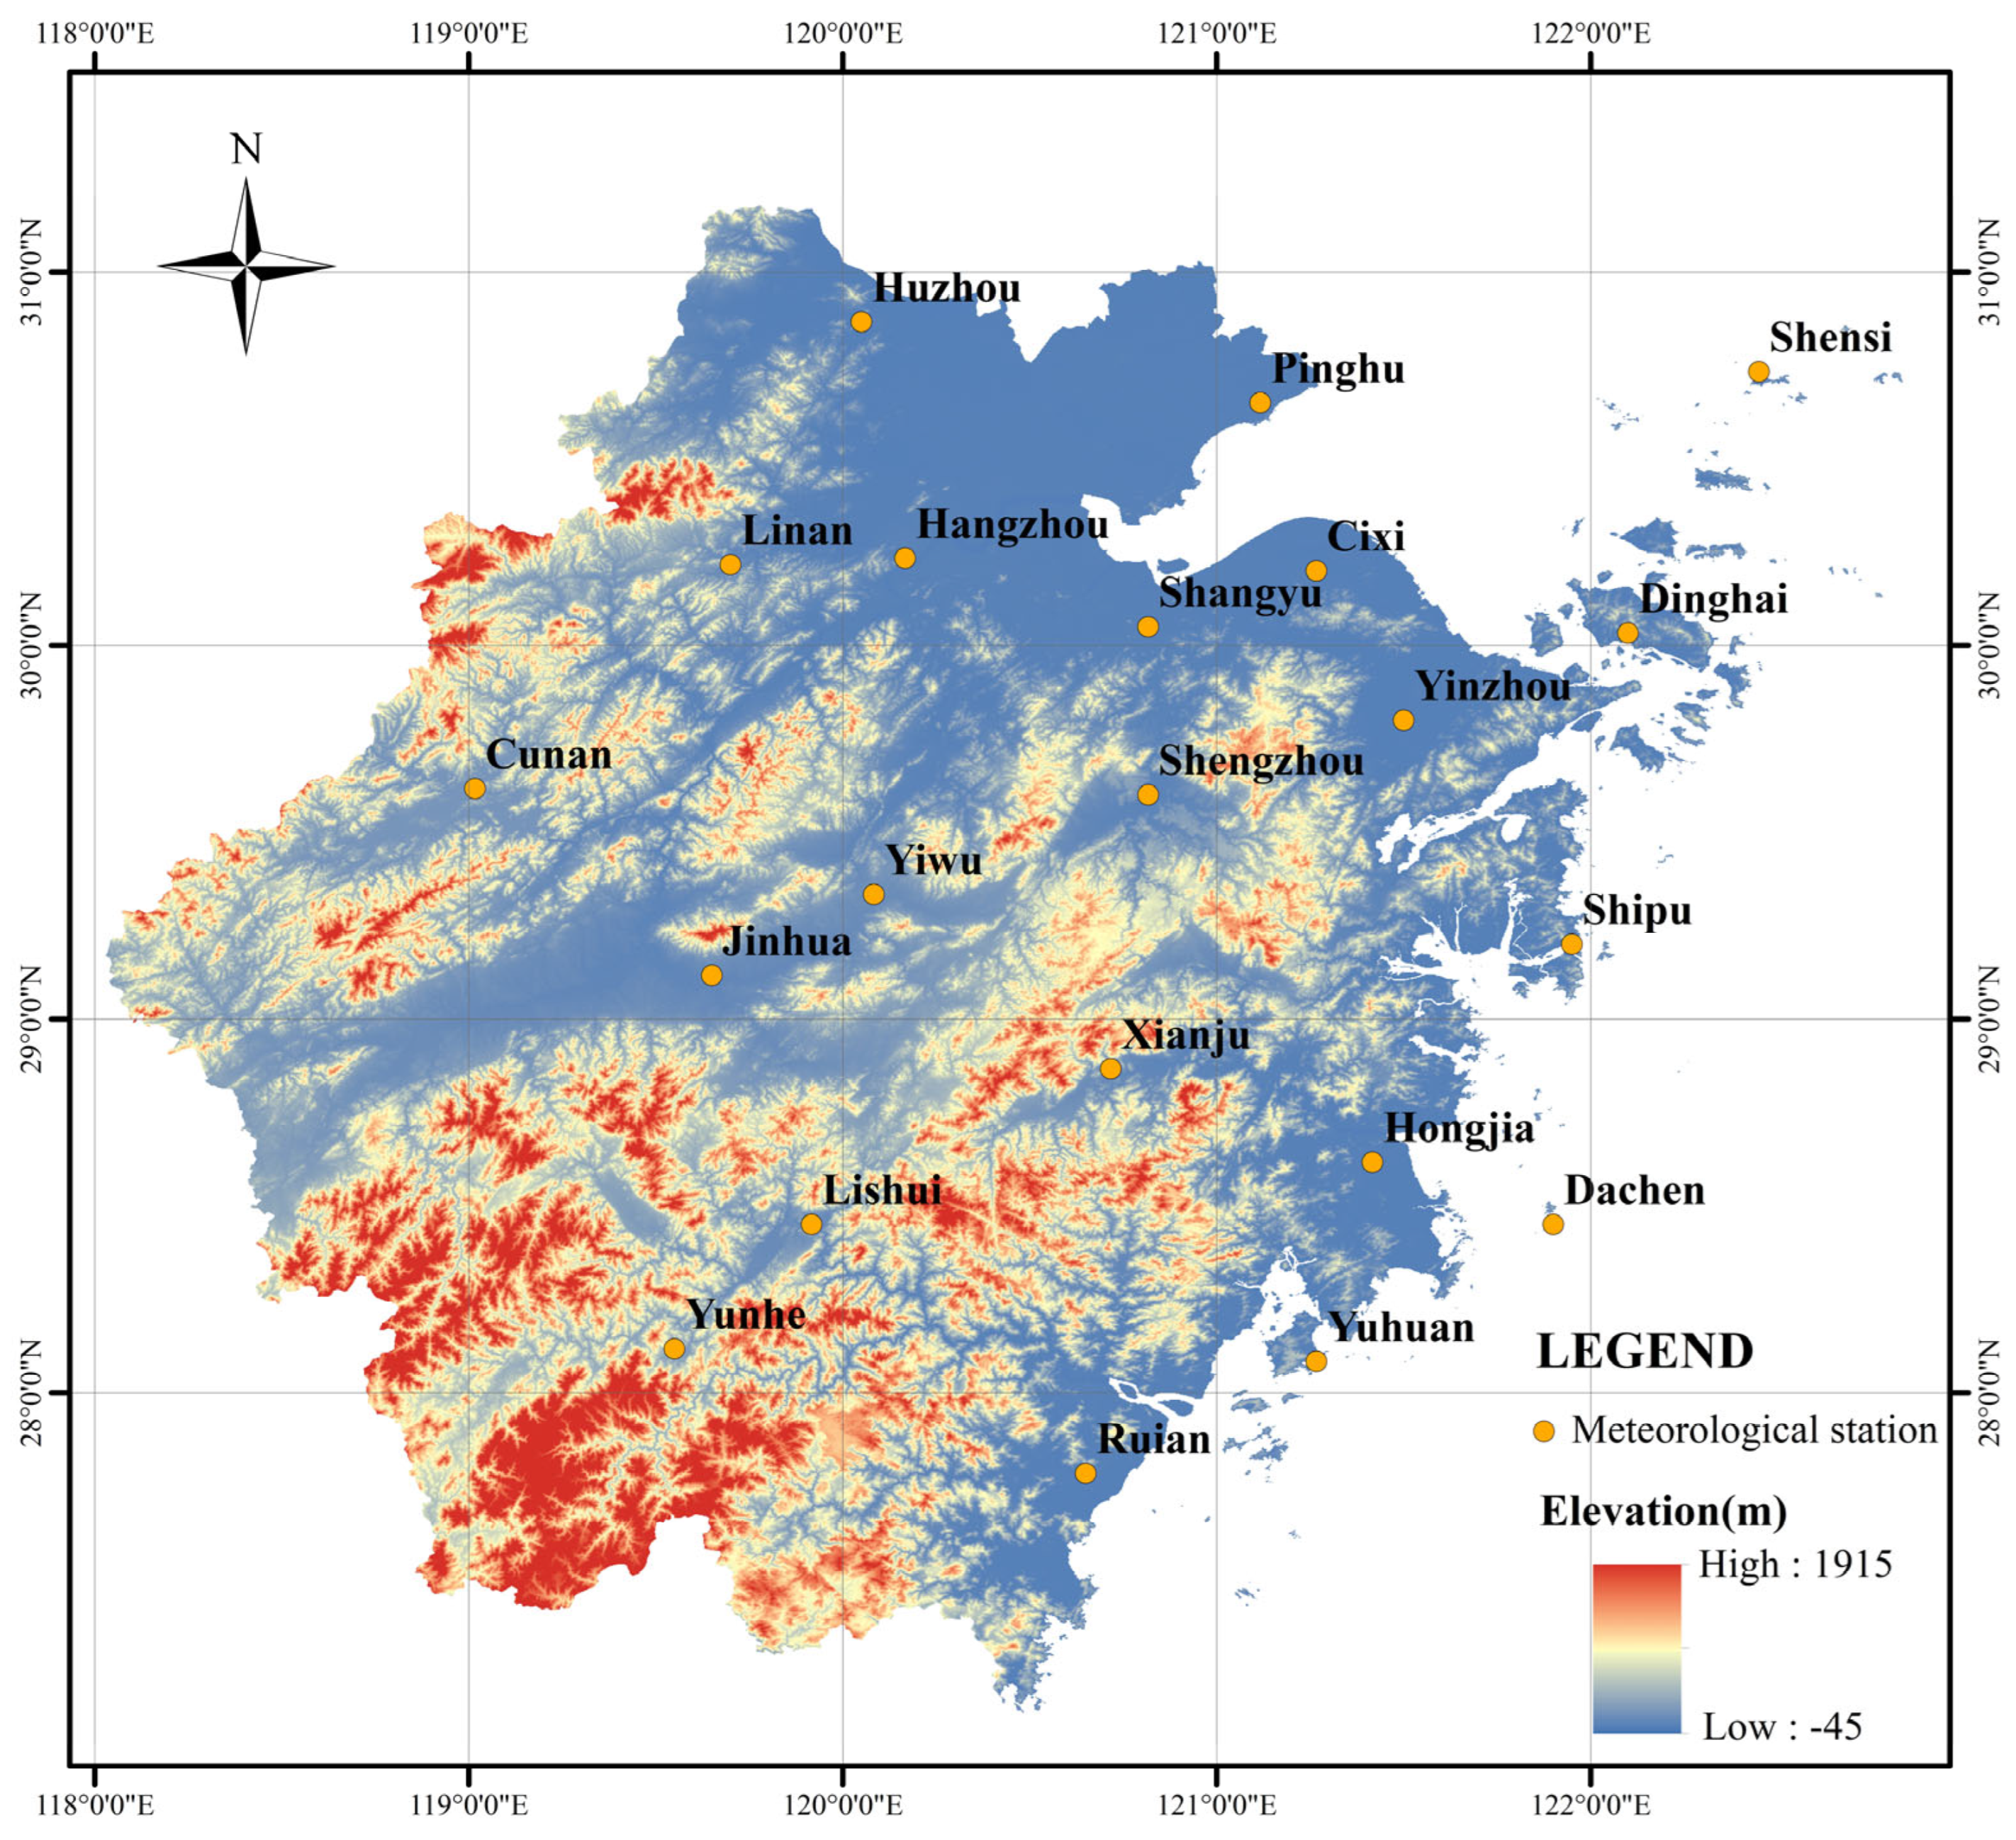
This study uses observational data from 21 meteorological stations across Zhejiang Province (
Figure 1). These stations cover diverse landform types, including plains, basins, coastal zones, and mountainous areas, ensuring good spatial representativeness. Since extreme high-temperature events mainly occur during the warm season, we extracted daily observations for the period from 1 May to 30 September of each year.
Table 1 summarizes all datasets used in this study, including data sources, temporal coverage, spatial resolution, core variables, and specific applications. All meteorological records were subjected to standard quality control procedures to remove missing values and abnormal outliers prior to analysis.
2.2. Calculation of Wet-Bulb Temperature
Wet-bulb temperature (
) is a core meteorological parameter characterizing the humid-heat state of the atmosphere. Unlike dry-bulb temperature, which reflects only sensible heat,
integrates the thermodynamic effects of both temperature and humidity through the evaporative cooling potential of the air mass. This makes
a physically coherent variable for distinguishing whether an extreme heat event is primarily temperature-driven, humidity-driven, or both. In contrast to empirical heat stress indices that require additional parameterization for specific applications [
30],
is directly derivable from routine meteorological observations and offers a transparent, standardized physical basis for event classification. From a human biometeorological perspective,
also relates to the evaporative cooling capacity available under given environmental conditions [
31,
32]. However, in this study, we employ
strictly as a classification variable within a mutually exclusive framework, rather than as a direct health impact metric. We therefore adopt
as the most physically transparent variable for separating temperature-driven and humidity-driven heat extremes.
Based on the standardized psychrometric equation, this study uses daily observations of maximum dry-bulb temperature (
, °C), relative humidity (
, %), and station air pressure (
P, hPa) to iteratively calculate the wet-bulb temperature series for each station [
33].
The wet-bulb temperature is calculated according to the classical psychrometric equation:
where
is the dry-bulb temperature (°C);
e is the actual water vapor pressure (hPa);
is the saturation water vapor pressure corresponding to the wet-bulb temperature (hPa);
is the psychrometric coefficient, which takes a value of 6.62 × 10
−4 °C
−1 under ventilated observation conditions;
is the observed station air pressure (hPa).
The actual water vapor pressure is derived from the
and the saturation water vapor pressure corresponding to the dry-bulb temperature:
The saturation water vapor pressure is calculated using the universal Tetens empirical formula:
where
is the corresponding dry-bulb temperature, and the result is given in hPa. Since the above set of equations is implicit, the exact value of
cannot be solved directly. In this study, a numerical iterative algorithm is employed to perform batch calculations, ensuring the accuracy of the long-time-series wet-bulb temperature data.
2.3. Definition and Identification of Extreme High-Temperature Events
2.3.1. Threshold Determination and Event Classification
To avoid the interference of interannual climate fluctuations on threshold determination, this study selects the period 1980–1995 as the climate base period. This 15-year window predates the most rapid phase of urban expansion in Zhejiang, minimizing the potential contamination of threshold estimation by urbanization-induced warming. Based on the daily dry-bulb temperature and wet-bulb temperature data during the warm season (May–September), the 90th percentile of the two-temperature series is calculated station-by-station. These values are used as the station-specific dry-type extreme high-temperature threshold () and wet-type extreme high-temperature threshold (). A station-independent threshold rule is adopted, without applying a uniform regional threshold, to ensure the accuracy of event identification at each station.
Using the station-specific temperature thresholds and considering the combination of dry- and wet-bulb temperatures, three mutually exclusive criteria for extreme high-temperature days are established to prevent overlapping between different event types. The classification rules are as follows:
Dry-type extreme high-temperature day: and ;
Humid-type extreme high-temperature day: and ;
Compound-type extreme high-temperature day: and .
Based on the above, an extreme high-temperature event is defined as a consecutive sequence of at least three days of the same type. Specifically, three or more consecutive dry-type days constitute a dry-type extreme high-temperature event (DHW); three or more consecutive humid-type days constitute a humid-type extreme high-temperature event (HHW); three or more consecutive compound-type days constitute a compound-type extreme high-temperature event (CHW). When different types of extreme high-temperature days occur alternately, each type is identified as separate events and not merged. This ensures that the three event types are completely mutually exclusive with no overlap.
2.3.2. Event Indicators
This study selects three core characteristic indicators—frequency, duration, and intensity—to comprehensively characterize the occurrence patterns and stress levels of multi-type extreme high-temperature events. For each indicator, both average (per event or per station) and cumulative (regional total) forms are calculated to capture both the typical characteristics of individual events and the overall heat stress load at the regional scale. Cumulative indicators integrate the duration of high temperatures and the magnitude of temperature exceedance. They exhibit significant dose–response relationships with human heat-related health risks, agricultural heat stress, and urban energy supply-demand pressure. Therefore, they can more objectively and comprehensively reflect the comprehensive impact of regional extreme high temperatures.
(1) Frequency
The average frequency (
) represents the mean annual number of events per station across the region in year y:
where
n is the total number of study stations, which is 21 in this study; and
is the number of extreme high-temperature events of a given type at station
s in year
y. The cumulative frequency (
) is the sum of all events occurring at all stations in year
y:
(2) Duration
The average duration (
) is the mean length (days) of a single event across all events in year
y:
where
is the duration (days) of the i-th extreme high-temperature event at station
s in year
y. The cumulative duration (
) is the total number of event-days across the region in year
y:
(3) Intensity
Intensity quantifies the exceedance magnitude of an event above its threshold. For a single DHW or HHW event, the intensity is calculated as:
where
is the daily dry-bulb (for DHW) or wet-bulb (for HHW) temperature on day
k of the event, and
is the corresponding threshold.
For CHW events, which combine both thermal and moisture stress, the intensity is defined as the sum of accumulated exceedances of both dry-bulb and wet-bulb temperatures:
Based on individual event intensities, the average intensity (
) and cumulative intensity (
) are computed as:
2.4. Urbanization Intensity Indicators
To characterize the urbanization intensity around each meteorological station, this study adopts two complementary indicators: impervious surface ratio (UI) and population density (PD). UI directly reflects the physical alteration of the land surface due to built-up expansion, while PD captures the intensity of human activities and socioeconomic agglomeration. The combination of these two indicators enables a more robust assessment of urbanization effects on extreme high-temperature events and allows us to distinguish between “surface physical change” and “human activity aggregation” as two potential pathways of urban influence.
The UI is derived from the CNLUCC dataset (
Table 1). To match the local representativeness scale of meteorological observations, a circular buffer zone with a radius of 3 km is established around the latitude and longitude of each station. This radius falls within the typical representative range of near-surface climate for meteorological stations (2–5 km) and is compatible with the 1 km resolution of the raster data. Using the Zonal Statistics tool in ArcGIS 10.2 (Esri, Redlands, CA, USA), the percentage of impervious surface pixels to the total number of pixels within the buffer zone is calculated for each station and each time period, yielding the annual UI (%) for each station.
In addition to UI, gridded population density data from the same platform (
Table 1) are used as a complementary urbanization indicator. For each station, the average population density (persons per km
2) within the same 3 km buffer zone is extracted for each time period.
For both UI and PD, the multi-temporal values for each station are averaged over the period 1990–2020 to derive a single representative value per station. These average values are then used to rank the 21 stations and classify them into high-, medium-, and low-urbanization groups (seven stations per group) for subsequent comparative analyses. Both indicators are also employed as continuous variables in correlation analyses with extreme high-temperature event characteristics, allowing us to test the robustness of urbanization effects across different metrics.
2.5. Calculation of Vapor Pressure Deficit and Specific Humidity
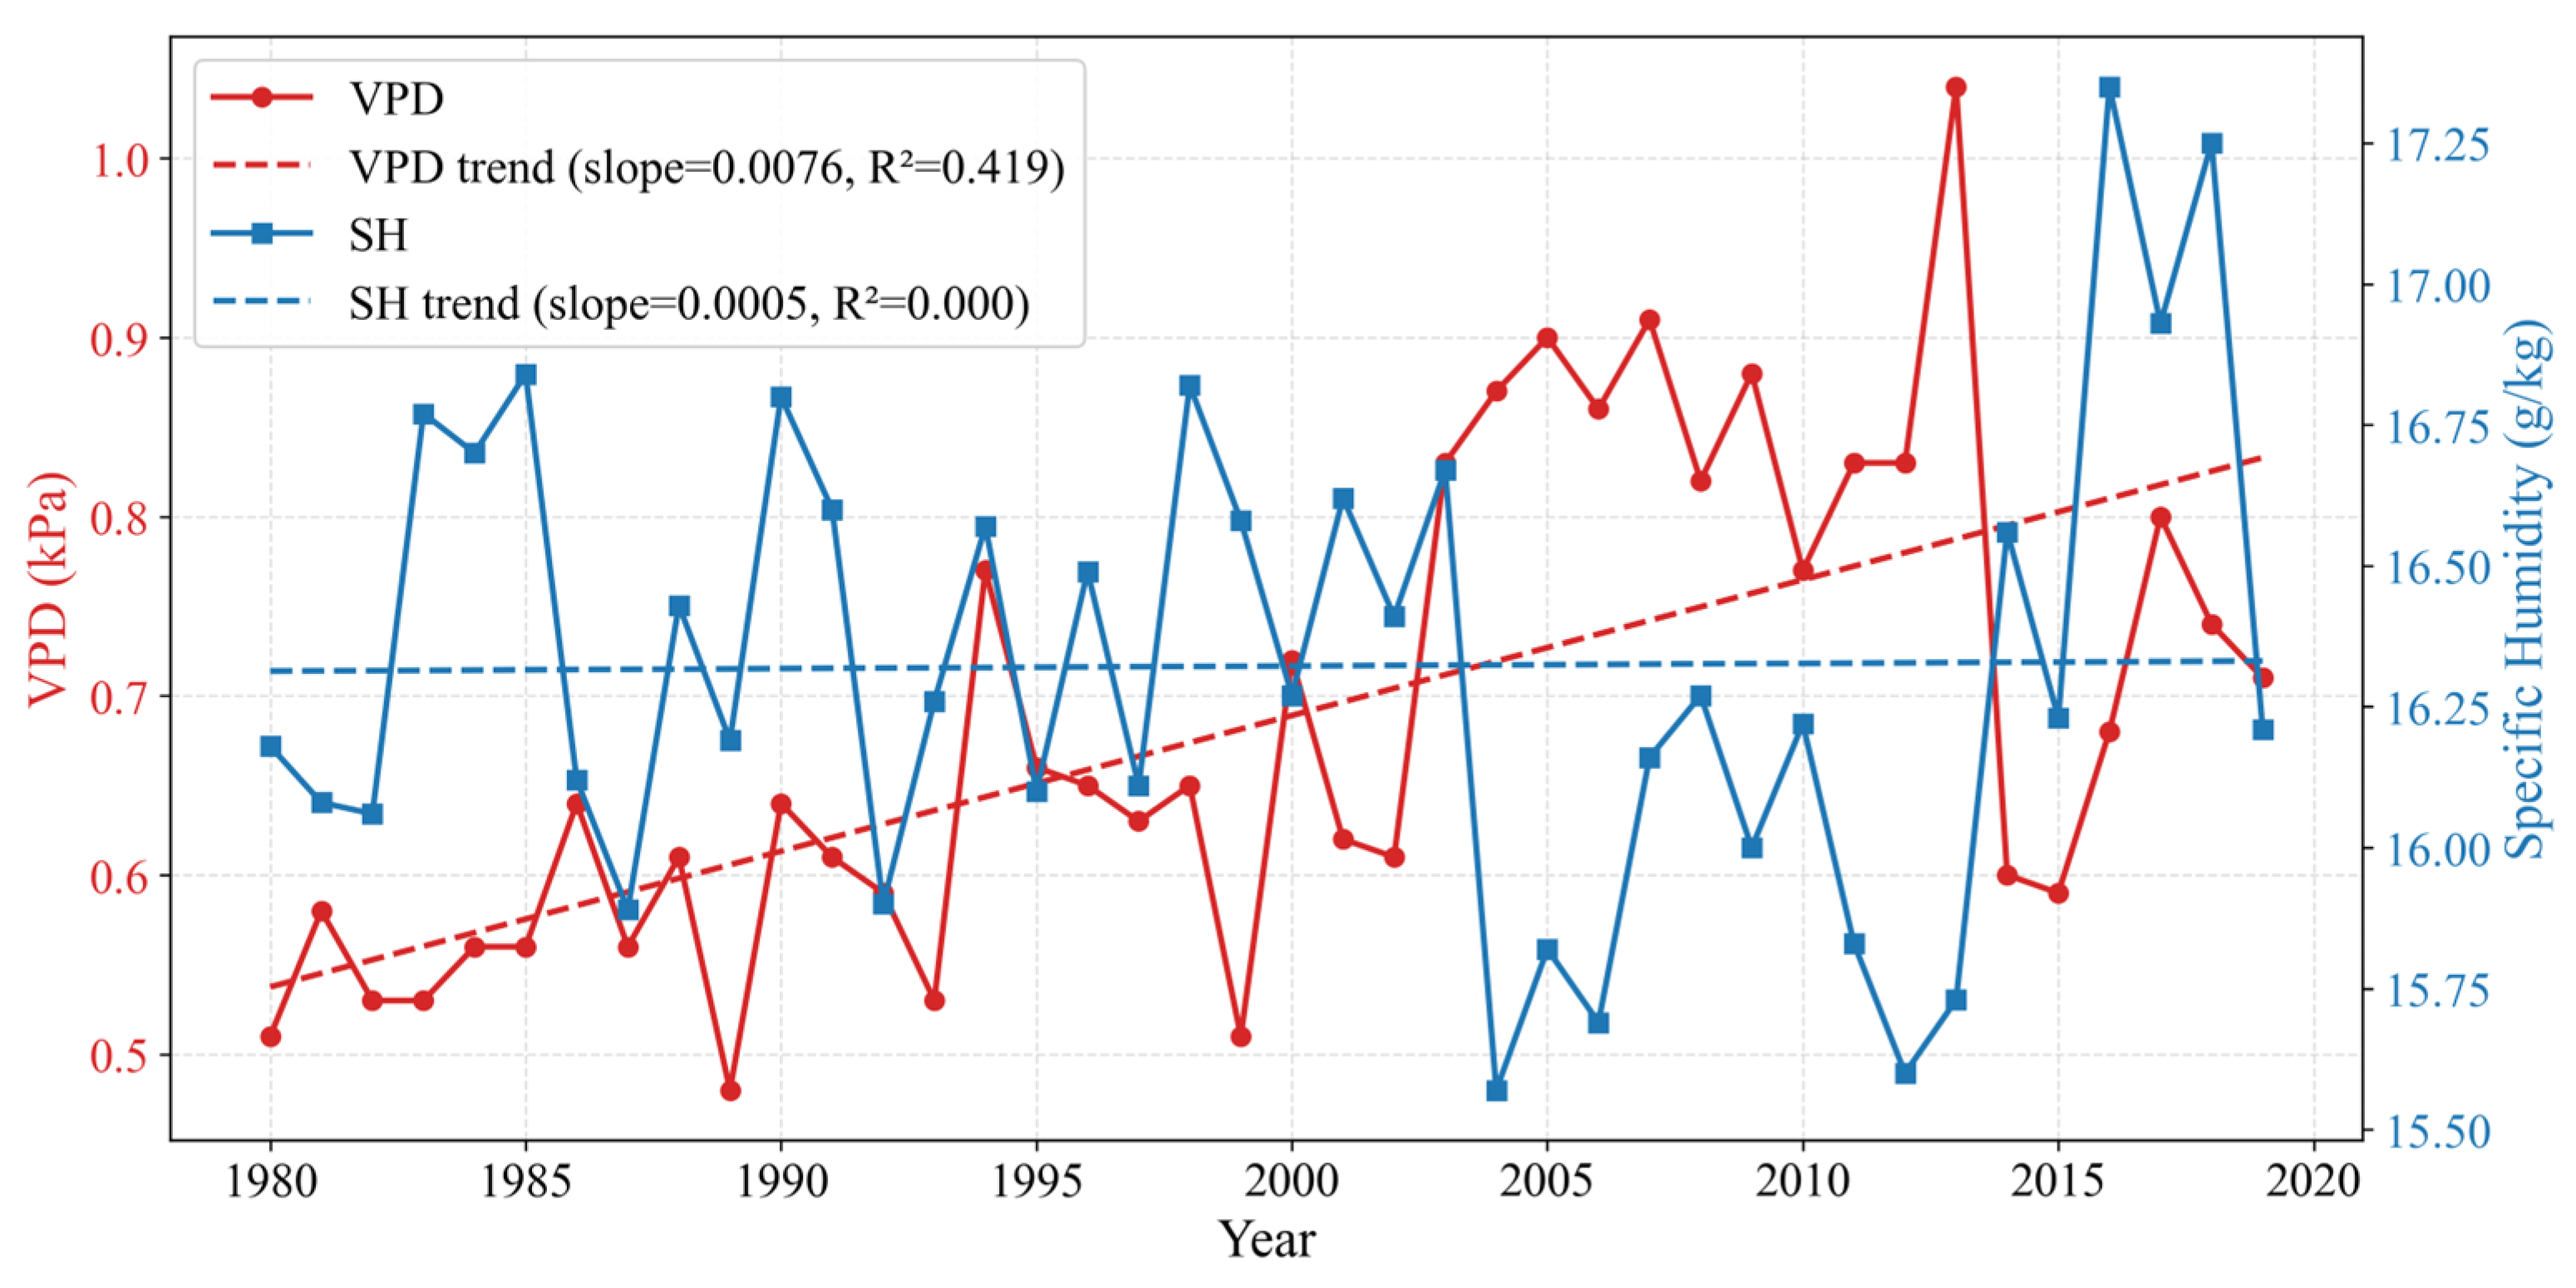
To provide auxiliary evidence for interpreting the atmospheric moisture background in the discussion, we calculated the daily Vapor Pressure Deficit (VPD) and Specific Humidity (SH) from routine meteorological observations at each station.
The saturation vapor pressure (
, kPa) was first derived from the daily mean air temperature (
, °C) using the standard Magnus formula [
34]:
The actual vapor pressure (
, kPa) was computed by incorporating the relative humidity (
RH, %):
The
VPD, which represents the drying power of the air, was calculated as the difference between the saturation and actual vapor pressures:
To quantify the absolute water vapor content in the air,
SH (g·kg
−1) was calculated using the station atmospheric pressure (
P, hPa):
where
= 0.622 represents the ratio of the gas constant of dry air to that of water vapor.
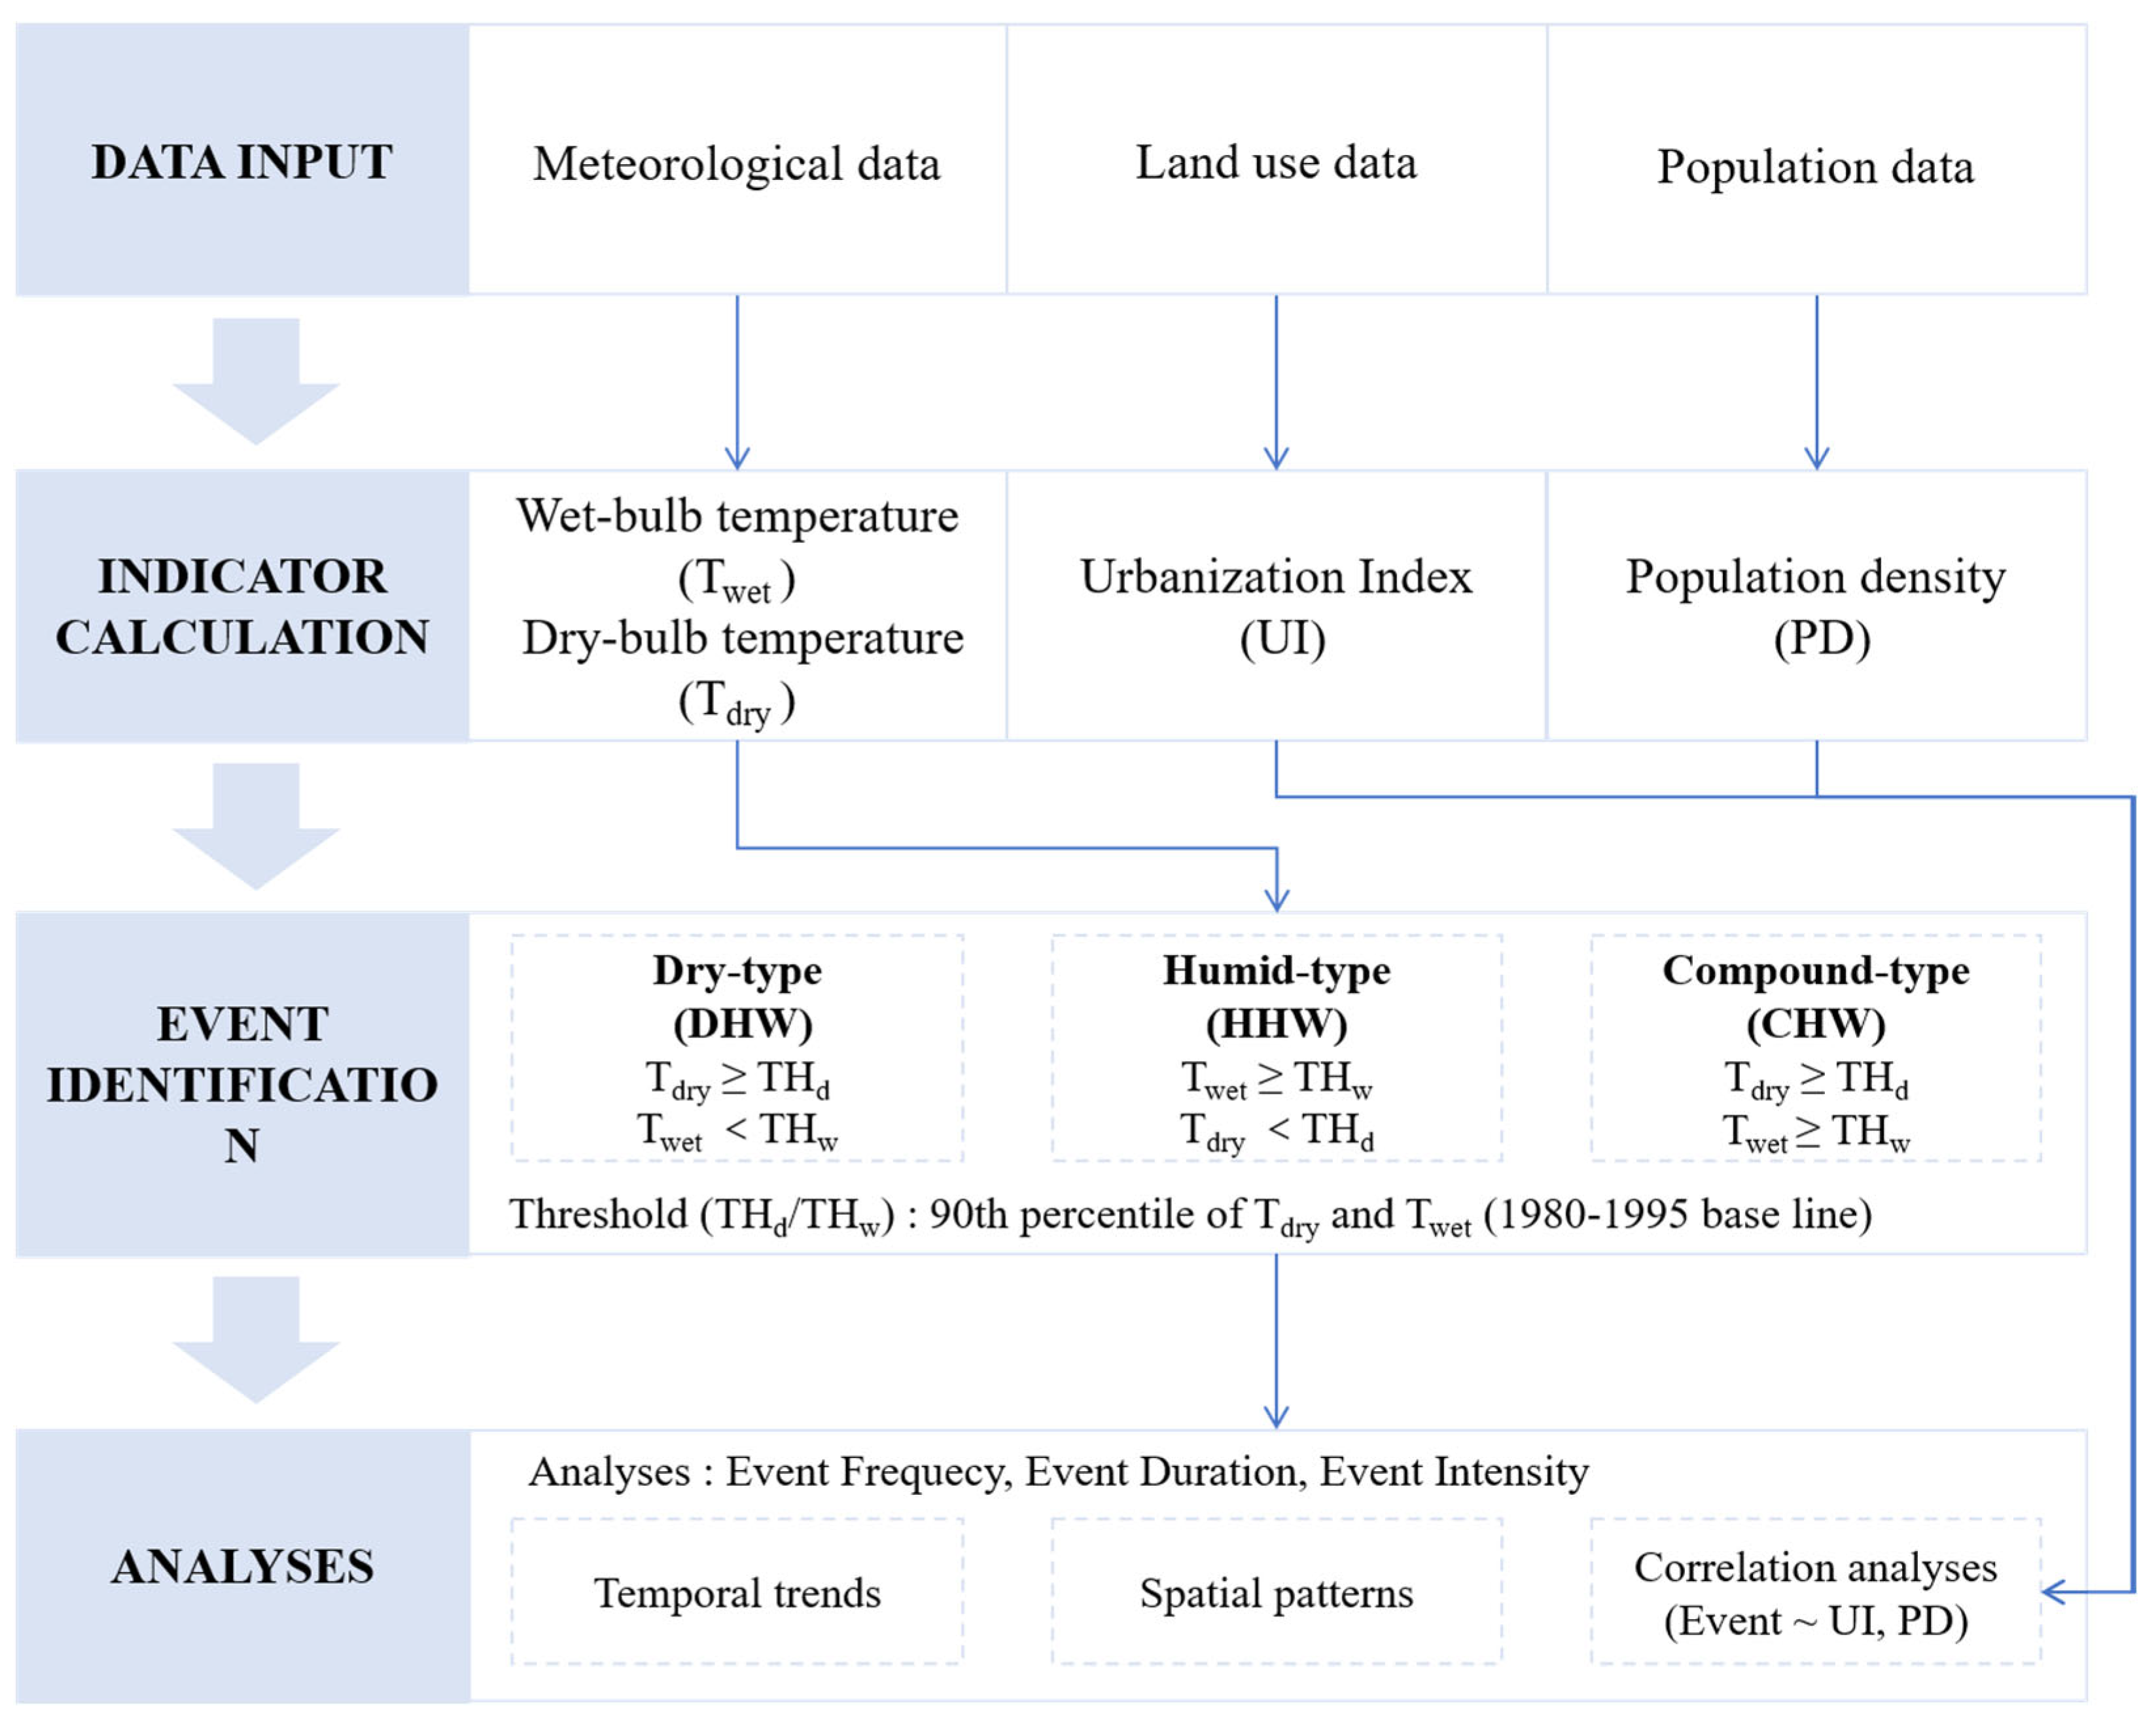
The overall methodological workflow, including data processing, wet-bulb temperature calculation, event identification, indicator derivation, and urbanization-response analyses, is summarized in
Figure 2.
3. Results
3.1. Temporal Evolution Trends of Extreme High-Temperature Events
From 1980 to 2019, the three types of extreme high-temperature events in Zhejiang Province exhibited significantly differentiated interannual evolution characteristics in terms of frequency, duration, and intensity. The results of the Mann–Kendall trend test were highly consistent with the long-term time series patterns (
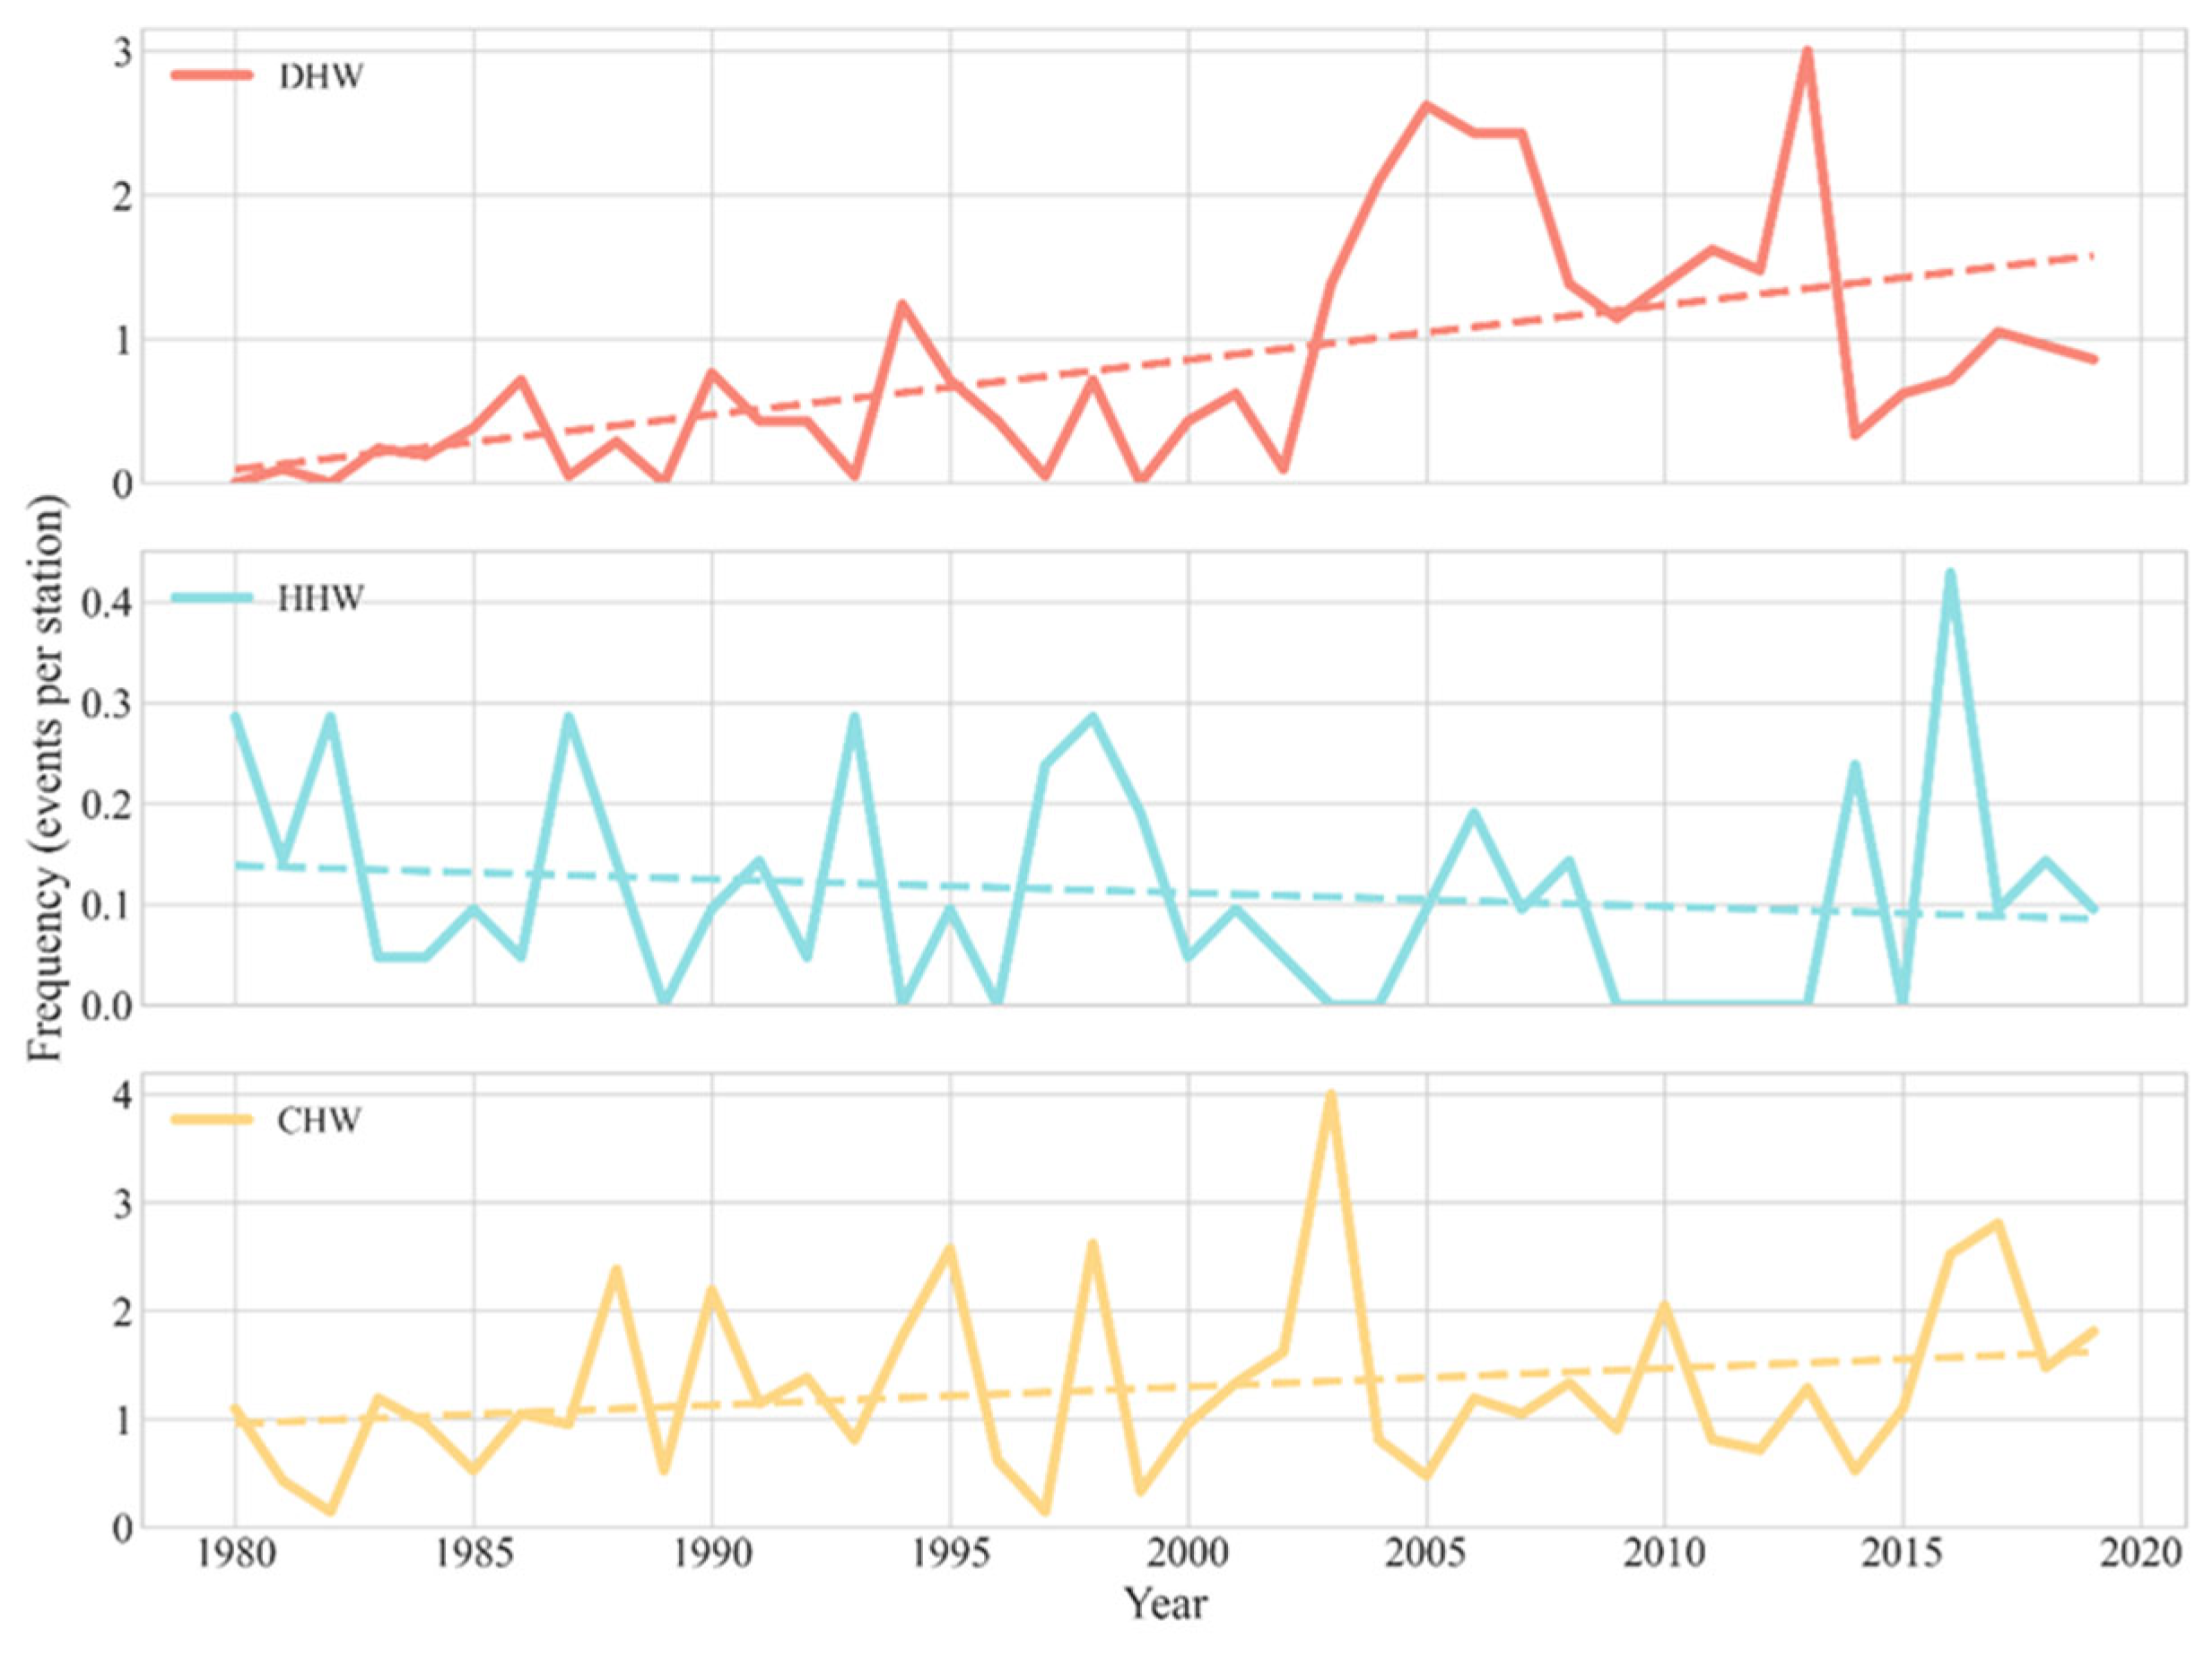
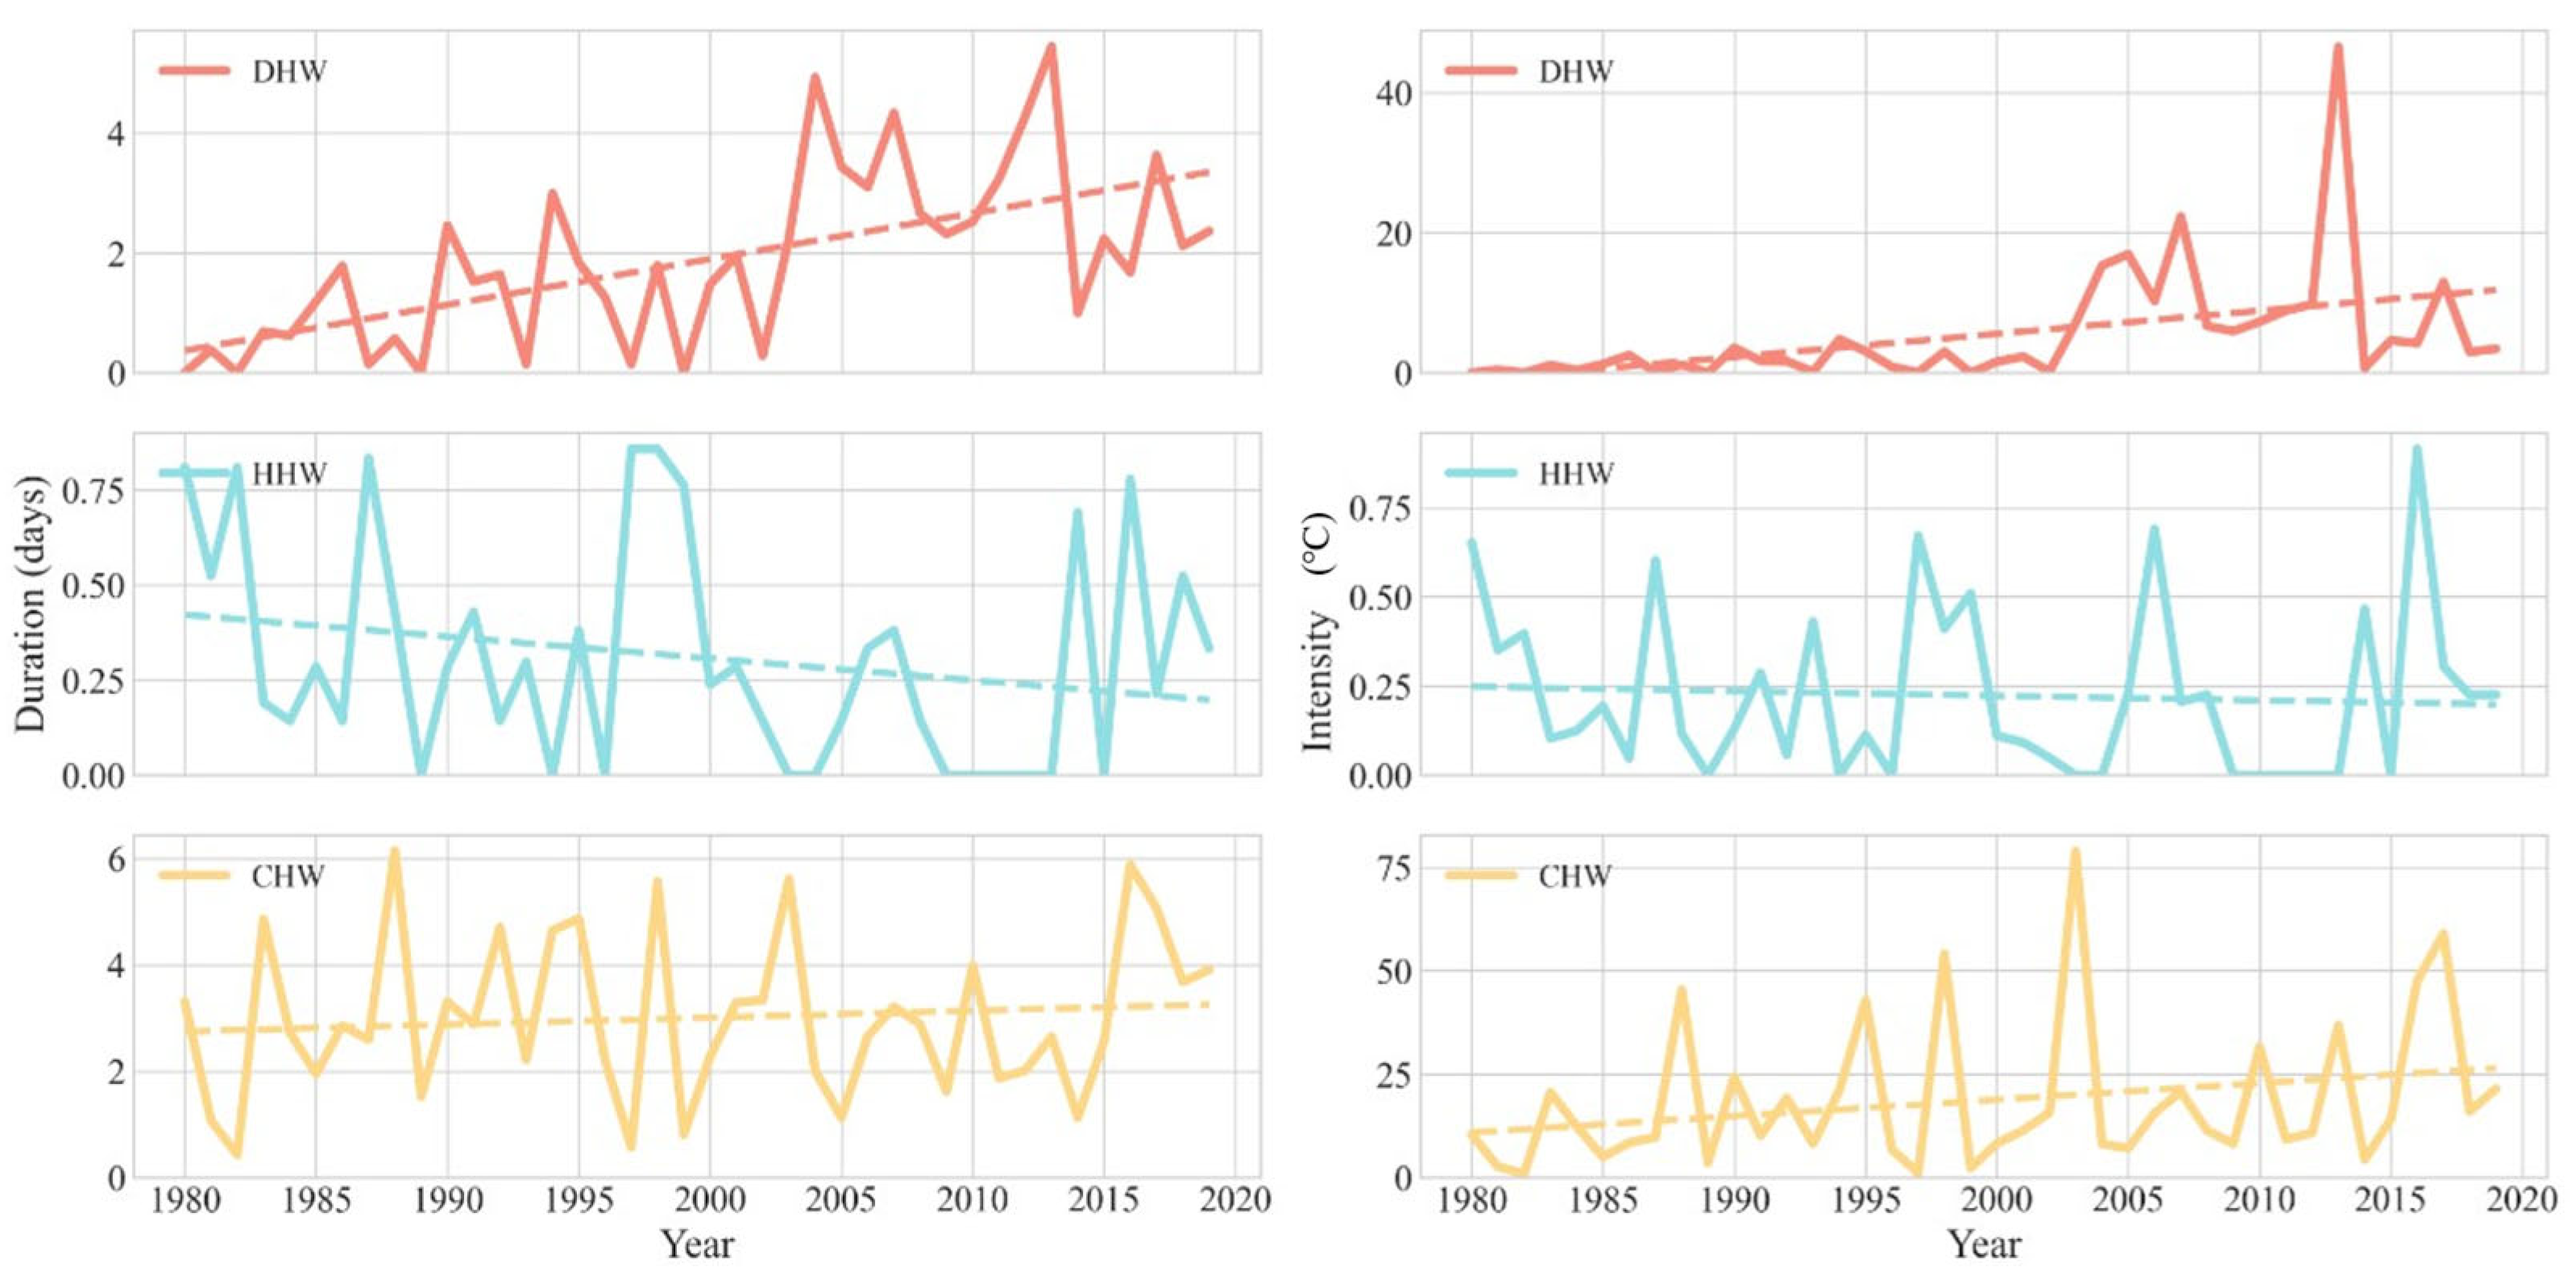
Table 2). In terms of annual average frequency, the evolution trends of the different types showed clear divergence (
Figure 3). DHW frequency displayed a fluctuating but sustained upward trend over the study period, with a marked acceleration after 2000. The Sen’s slope was 0.032 events per year (equivalent to 0.32 events per decade). HHW frequency remained extremely low for most years, with annual averages below 0.1 events per station. Interannual variability was strong and no long-term trend was detectable. CHW frequency exhibited strong interannual fluctuations without a unidirectional trend. The Sen’s slope was 0.015 events per year and was not statistically significant. These results indicate that the overall increase in warm-season extreme heat in Zhejiang is driven primarily by the rise in DHW. Neither HHW nor CHW shows a systematic increase in occurrence frequency.
Figure 4 shows the interannual variations of average duration and average intensity. DHW duration and intensity both increased markedly after 2000, with intensity peaking in 2013. HHW remained at low levels throughout the study period, with small fluctuations and no significant trends. CHW showed a different pattern: frequency did not increase, but average intensity rose significantly. Extreme intensity values became more prominent over time. Trend tests confirm that DHW duration and intensity both increased significantly (
p < 0.01). CHW intensity also increased significantly, but duration did not. None of the indicators for HHW show statistically significant trends.
DHW is the dominant type driving the intensification of extreme heat in Zhejiang over the past 40 years. Although CHW does not occur frequently, its average intensity per event has continuously increased, implying that the hazard intensity of such events is gradually worsening and the disaster risk is rising. The differentiated evolution patterns of the three types of extreme high-temperature events suggest that the intensification of extreme heat in Zhejiang Province is not a holistic trend of simultaneous increases in temperature and humidity but rather a structural change dominated by the enhancement of dry-bulb temperature stress. This pattern is only detectable through a mutually exclusive temperature–humidity classification. Such an approach avoids the masking effects of event overlap that are inherent in single-indicator methods.
3.2. Spatial Distribution Characteristics of Heatwaves
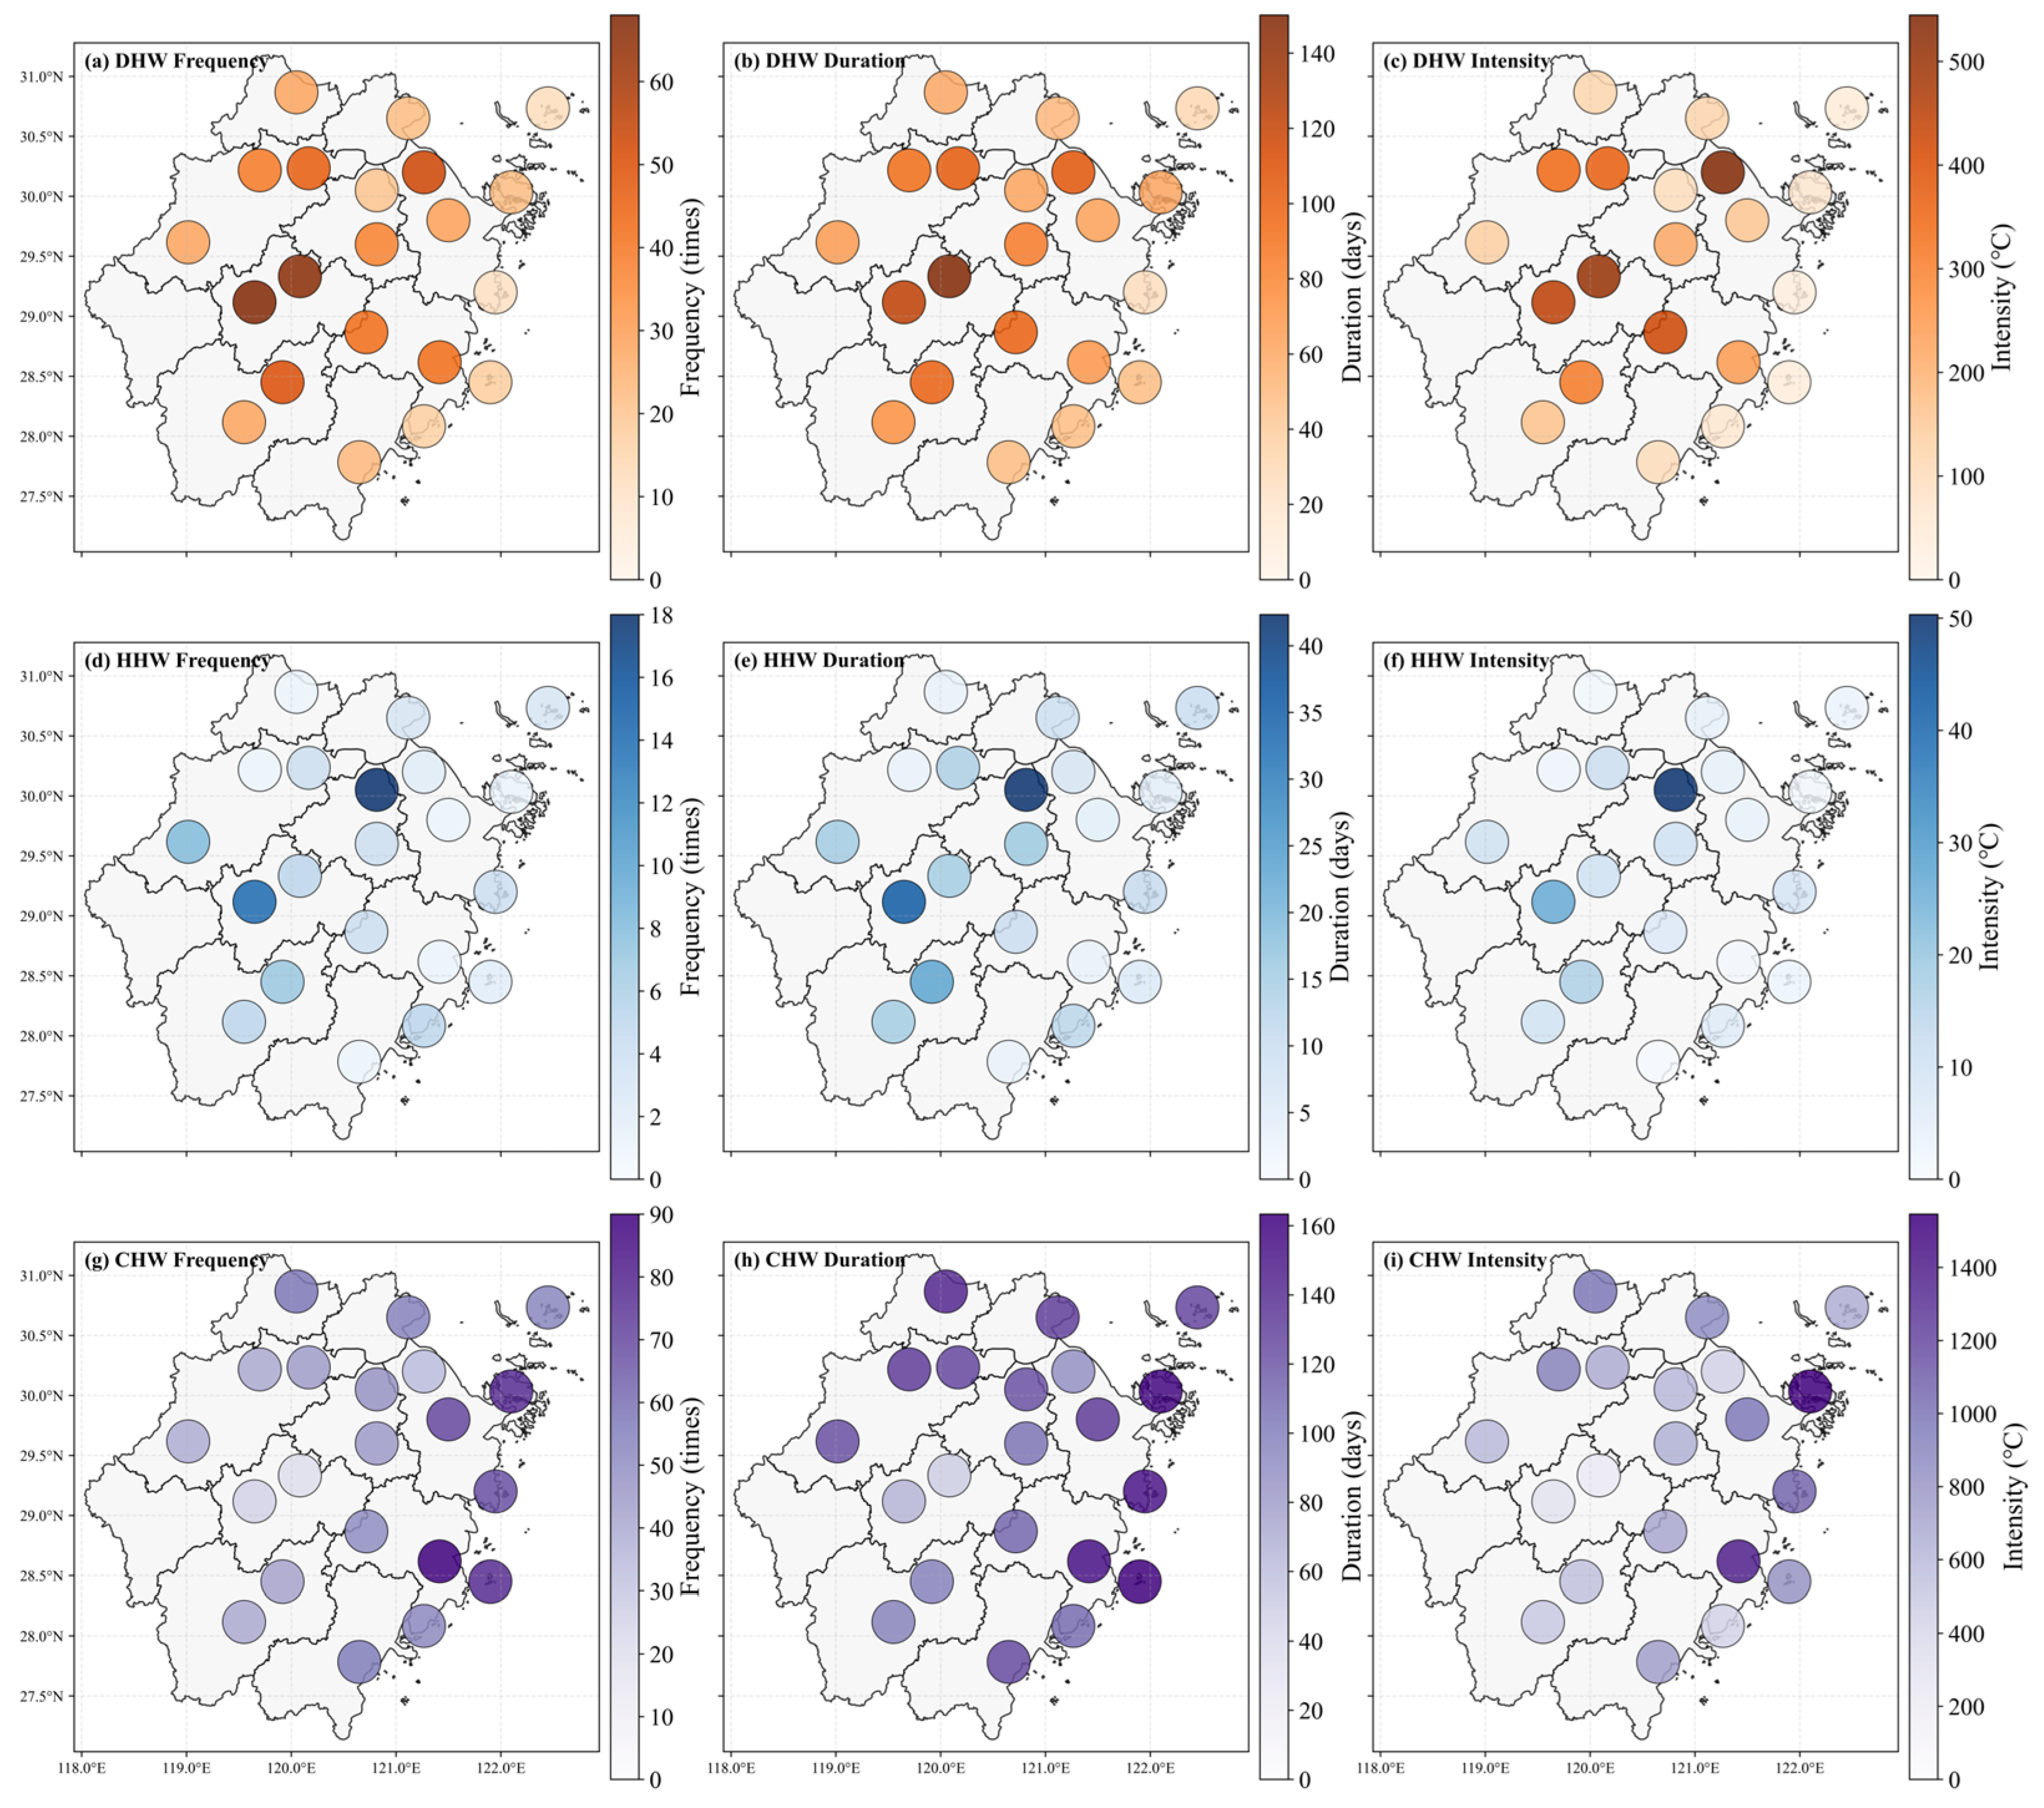
Based on long-term observational data from 21 meteorological stations in Zhejiang Province from 1980 to 2019, the cumulative frequency, cumulative duration, and cumulative intensity of the three types of extreme high-temperature events were calculated to reveal their spatial differentiation patterns (
Figure 5). Overall, DHW, HHW, and CHW exhibited clearly distinct spatial distributions, with significant differences in the dominant types of high-temperature events across regions.
The cumulative indicators of DHW showed a pronounced spatial pattern of higher values inland and lower values along the coast. High-value centers were concentrated in the northern Zhejiang plain and the central Zhejiang basin-hilly areas. Inland stations such as Hangzhou, Cixi, Jinhua, and Yiwu recorded cumulative frequencies exceeding 45 events and cumulative intensities above 300 °C. These stations represent the most DHW-active zones in the province. In contrast, coastal island stations such as Shengsi, Dachen, and Shipu had low cumulative values across all three indicators. This spatial contrast likely reflects two factors. Sea breezes and the thermal buffering of coastal waters suppress dry heat development. Enclosed basin topography amplifies heat accumulation in inland areas.
HHW generally exhibited weak performance across the entire province, with all cumulative indicators remaining at low levels and no regional high-value clustering center. High values of HHW appeared only sporadically at a few inland stations such as Jinhua and Shangyu. Most coastal, island, and mountainous stations recorded almost no notable humid heat events. From the spatial distribution, HHW is not the dominant type of high-temperature process during the summer in Zhejiang Province, with small spatial differences and limited regional impact.
The spatial distribution pattern of CHW was distinctly different from that of DHW, showing an overall pattern of higher values along the coast and lower values inland. The eastern coastal and island areas formed a continuous high-value belt. Stations such as Hongjia, Dinghai, Dachen, and Yinzhou had cumulative frequencies exceeding 55 events and cumulative intensities above 900 °C. These values are substantially higher than those at inland stations in the central and southwestern basins. This coastal concentration is consistent with the abundant moisture supply from the East China Sea. High moisture availability increases the likelihood of simultaneous temperature–humidity extremes.
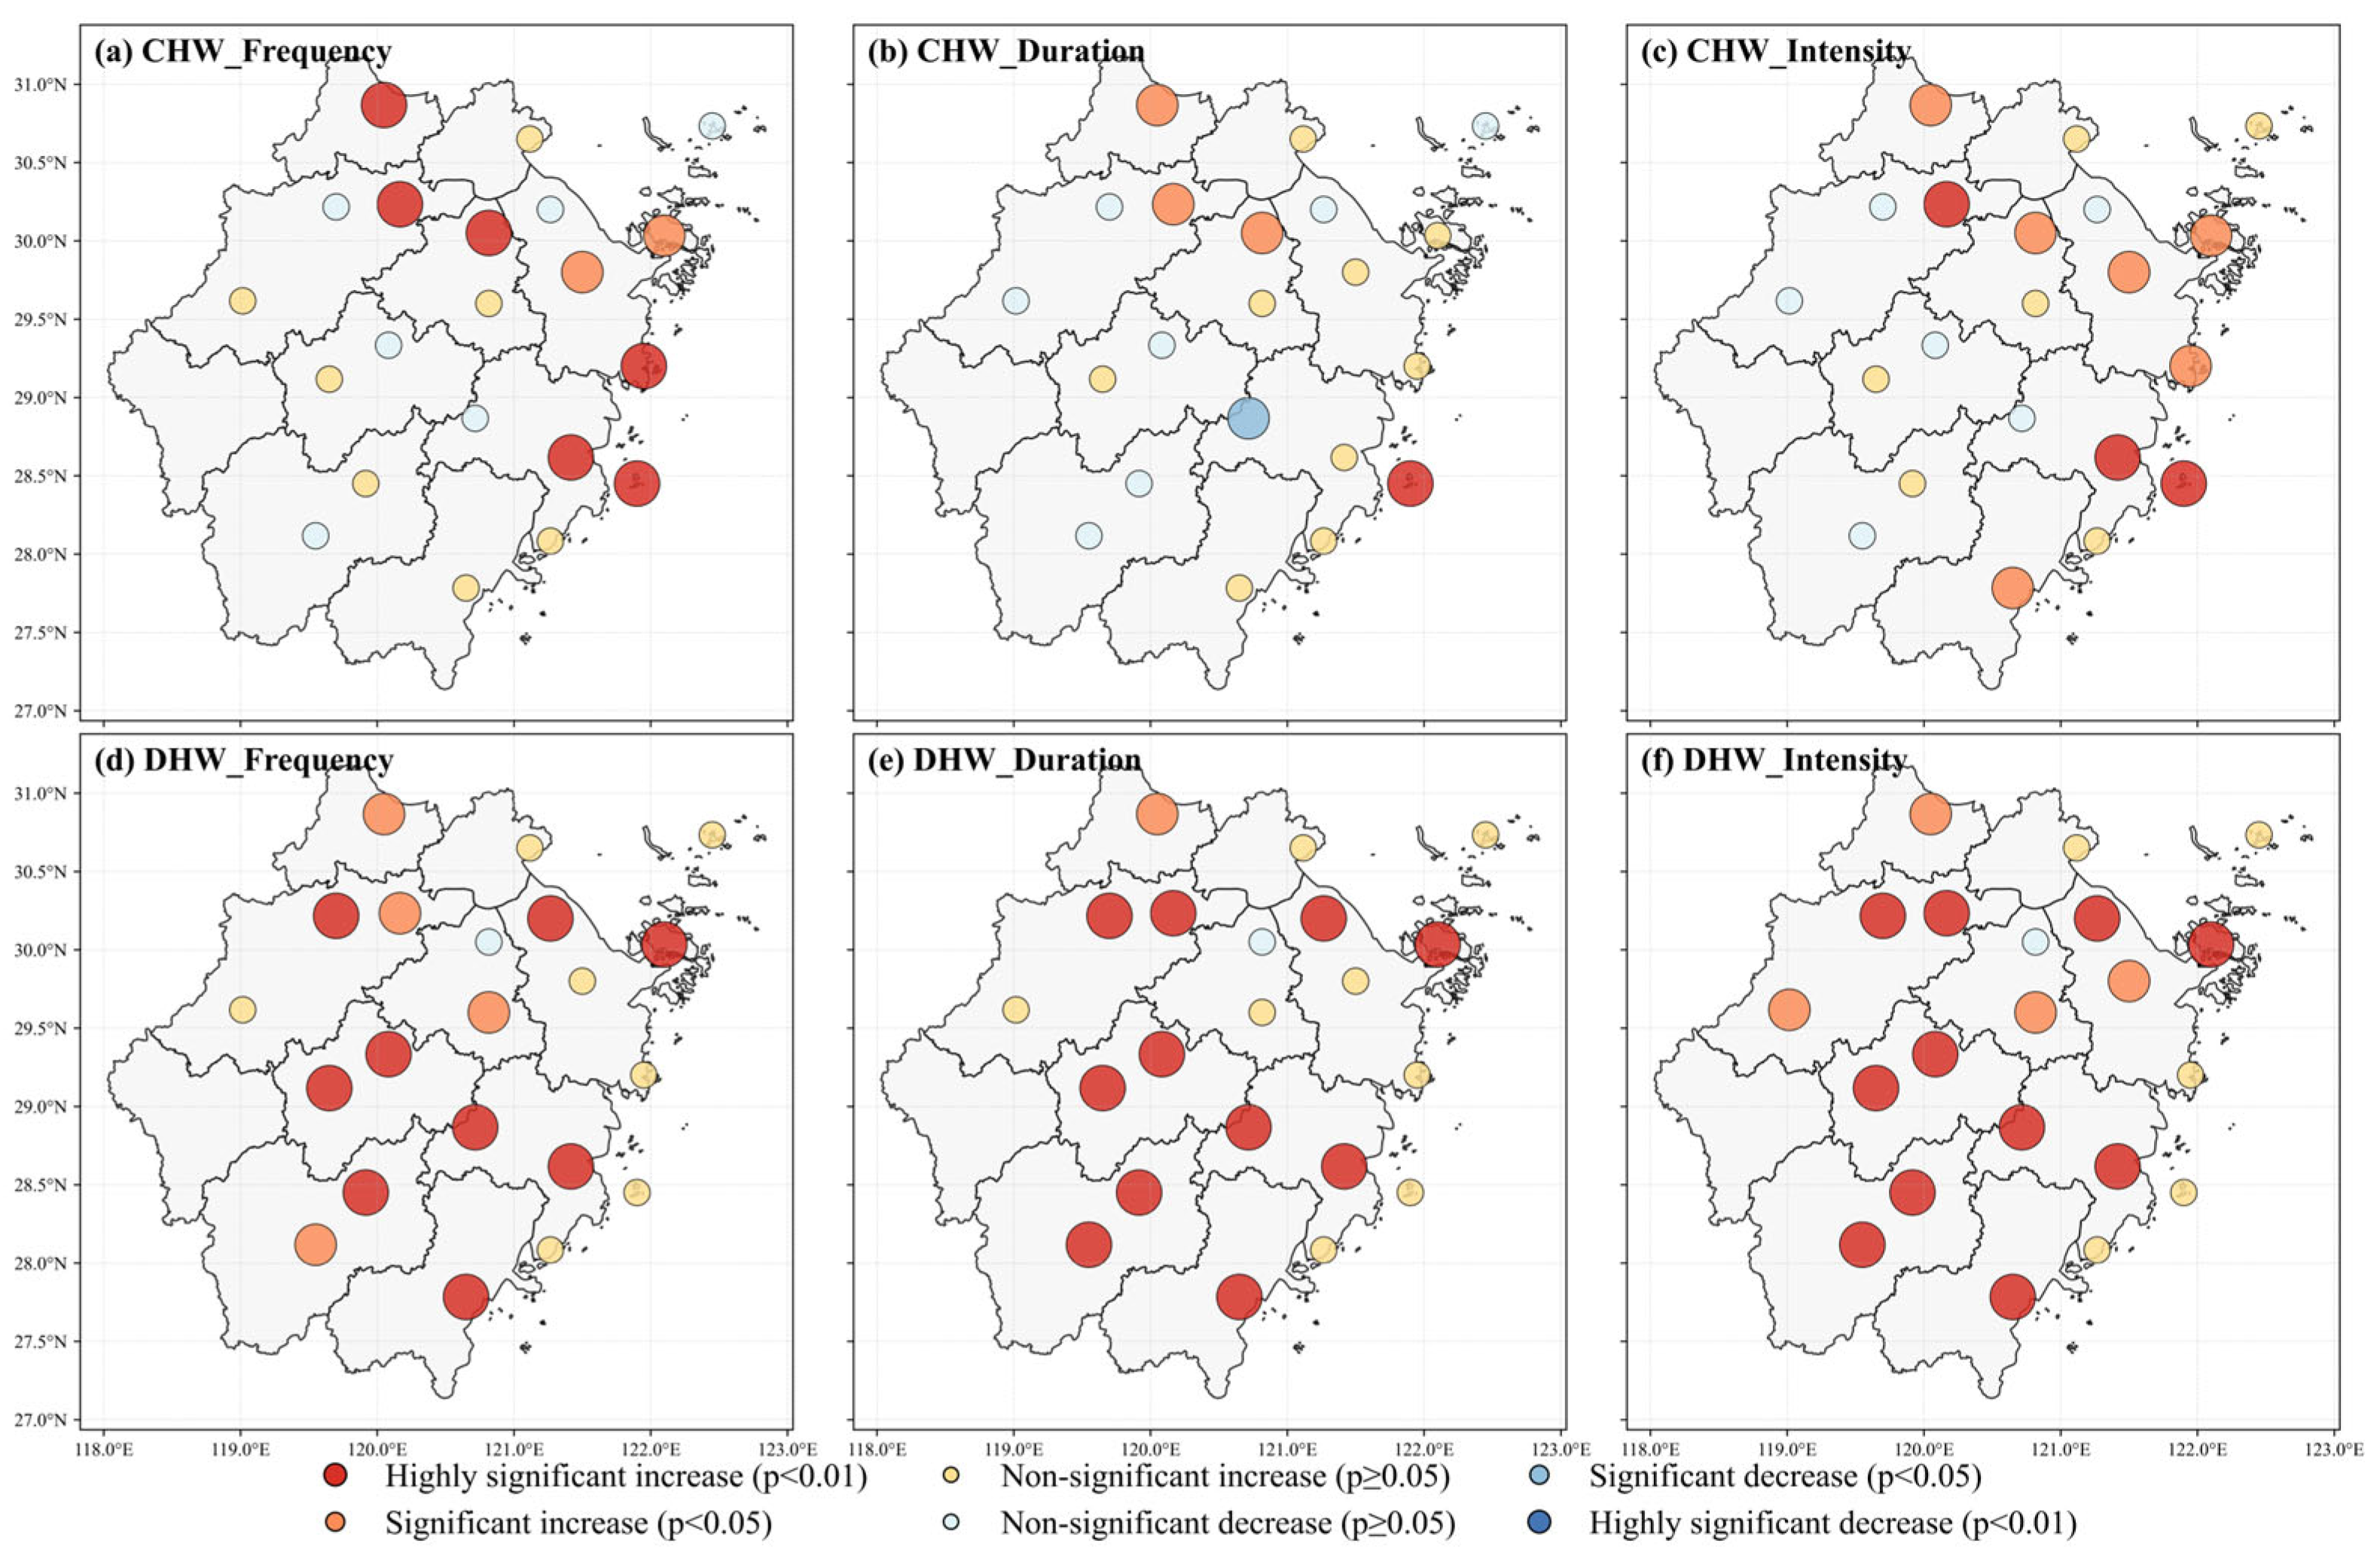
To examine spatial differences in long-term evolution, we mapped station-level trend magnitudes of DHW and CHW using Mann–Kendall tests (
Figure 6). HHW was excluded from this analysis because its indicators remained stable across all stations. Most sites showed no significant trends for HHW.
DHW and CHW trends diverged clearly in space. DHW showed broad and widespread increases. Most stations in the northern plain, central basin, and southwestern mountains exhibited significant or highly significant upward trends in frequency, duration, and intensity. This indicates a general intensification of dry heat across inland areas. CHW increases were regionally concentrated. Significant CHW trends were mainly observed along the eastern coast, islands, and the northern plain near the Yangtze River. Coastal stations such as Shangyu, Dachen, Dinghai, Yinzhou, and Hangzhou showed significant upward trends in both frequency and intensity. These stations are the core CHW intensification zones. Inland areas, including the central basin and southwestern mountains, showed stable CHW conditions with no obvious upward trends.
In summary, the spatial patterns and evolution trends of different types of extreme high-temperature events in Zhejiang Province show significant divergence: inland areas are characterized by larger cumulative scales and stronger increasing trends of DHW; coastal areas are dominated by CHW with a sustained increasing trend; and HHW remains weak across the entire province. This spatial segregation reflects the interplay of regional climate, land-sea contrast, and local land surface conditions.
3.3. Differentiated Impacts of Urbanization on Three Types of Extreme High-Temperature Events
To reveal the differentiated regulatory effects of urbanization on various types of extreme high-temperature events, this study first uses impervious surface ratio (UI) as the primary indicator of urbanization intensity. Through Kendall correlation analysis and non-parametric tests based on UI groupings, we systematically assess the quantitative effects of urban land surface on the frequency, duration and intensity of DHW, HHW and CHW. On this basis, we further introduce population density (PD) as a proxy indicator of anthropogenic activity intensity associated with urbanization. This allows us to distinguish the relative contributions of two categories of urbanization effects: “surface physical alteration” versus “human activity agglomeration”.
3.3.1. Dominant Regulatory Role of Impervious Surface Ratio
(1) UI Effects on the Mean State
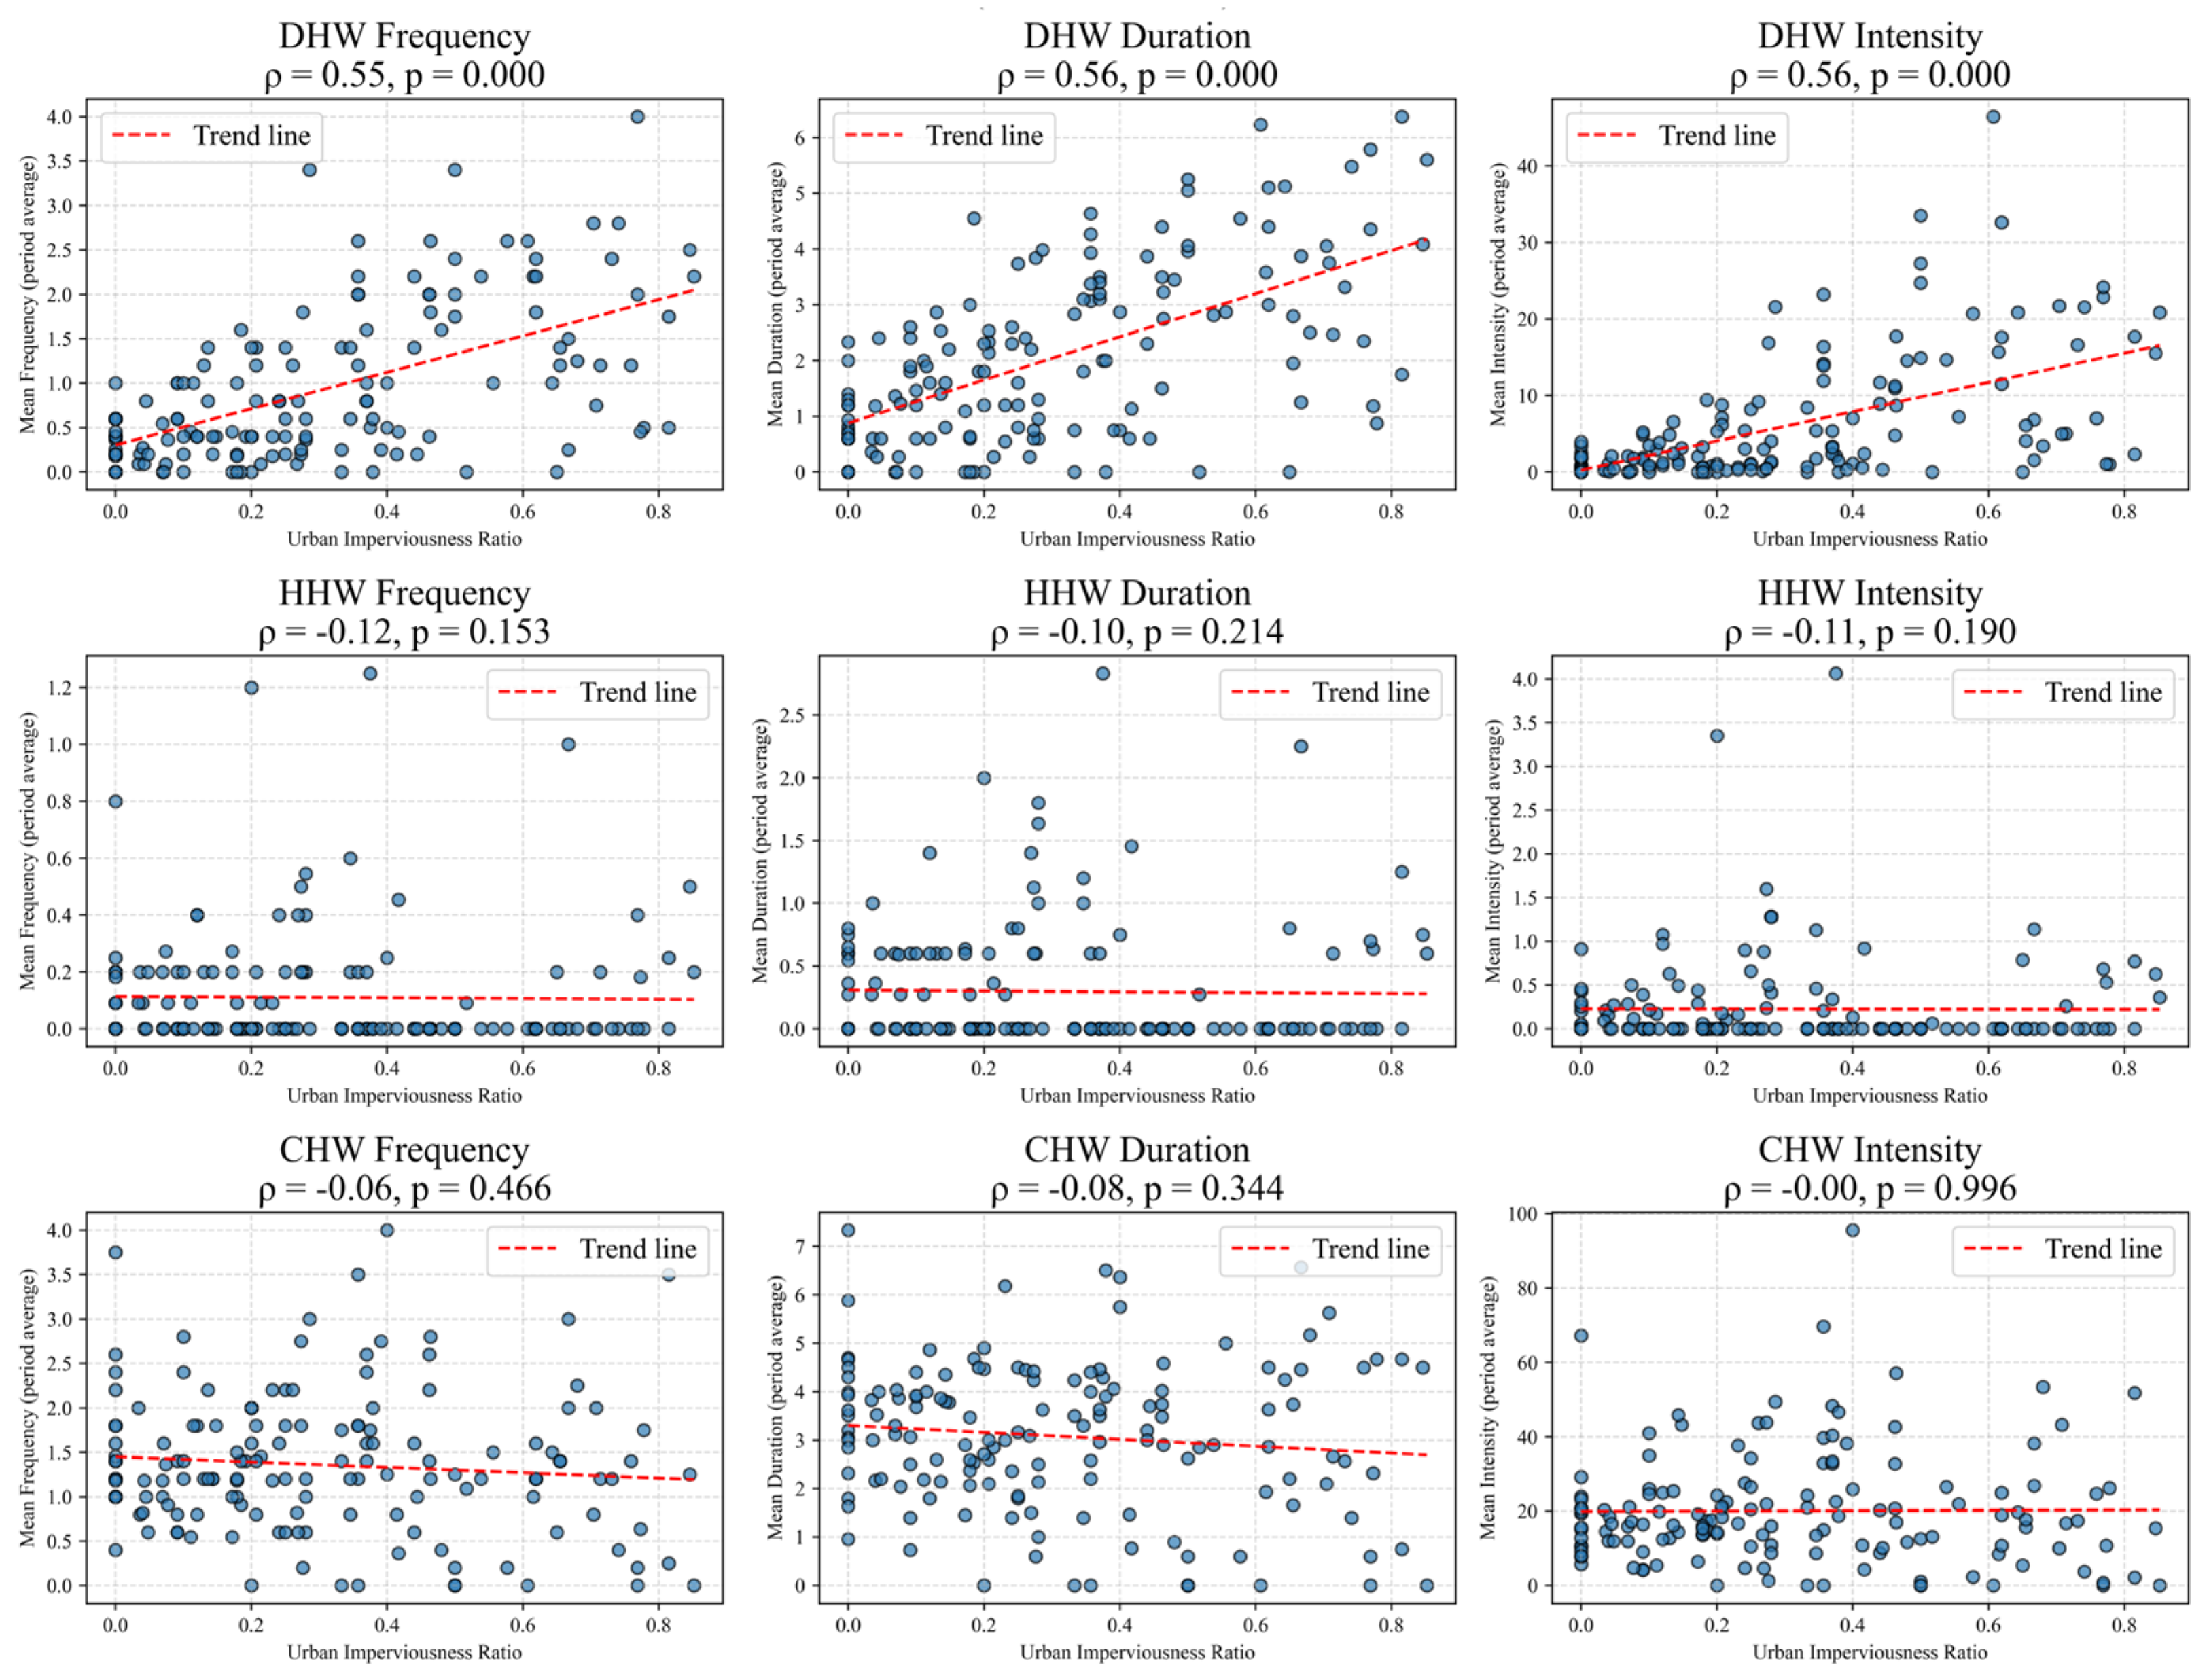
For the mean state of the three types of extreme high-temperature events, UI exhibits distinctly different regulatory patterns on DHW, HHW and CHW (
Figure 7). DHW shows highly significant positive correlations with UI, indicating that as impervious surface expands, the frequency, duration and intensity of DHW all increase steadily. In contrast, HHW indicators show only weak negative correlations with UI, none of which pass the significance test. The scattered distribution suggests that urban land cover exerts no systematic influence on the mean state of humid-type extreme heat. CHW exhibits no significant linear relationships with UI, with data points scattered across the correlation plots. This indicates that the mean state of CHW cannot be explained by local urban land surface alone.
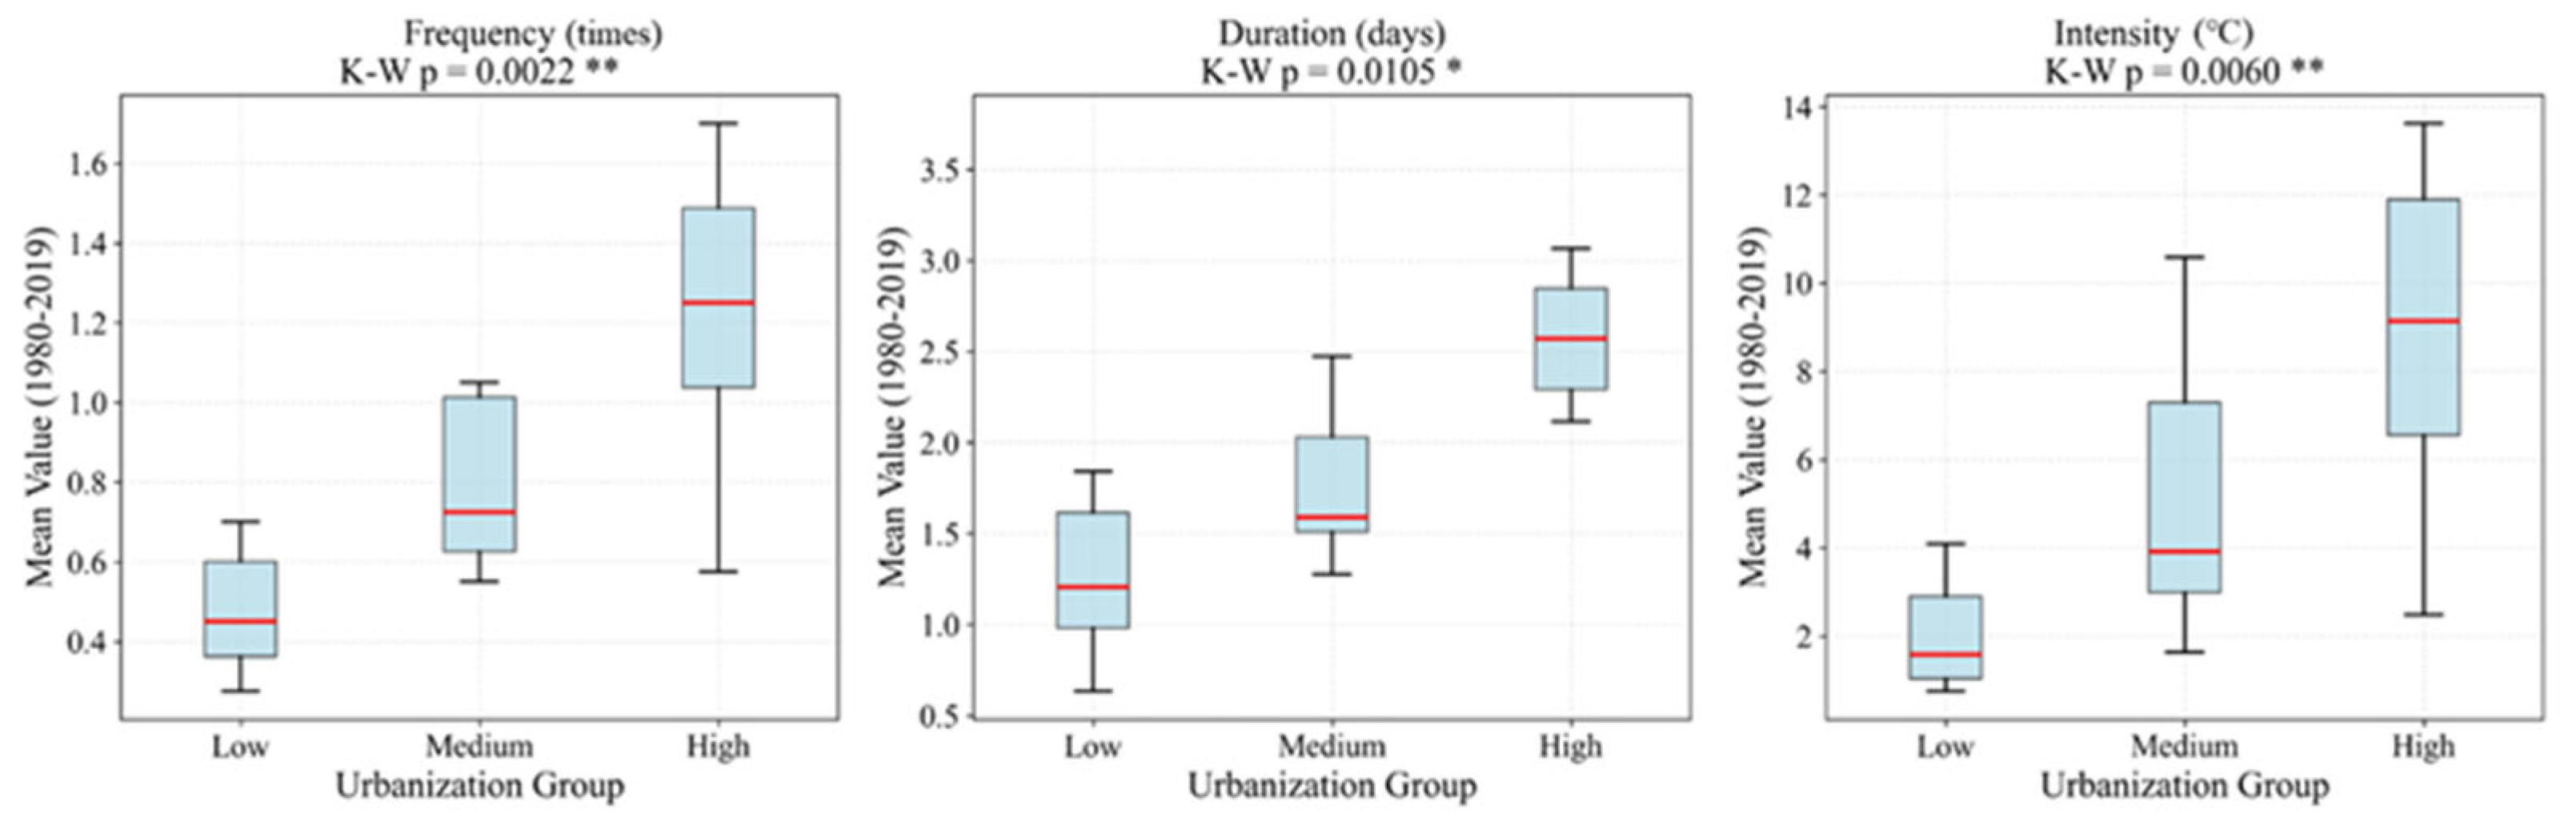
To further verify the gradient effect of urbanization, the 21 stations were classified into high-, medium- and low-urbanization groups based on their average UI values from 1990 to 2015, with each group containing an equal number of stations. Group differences were compared using the Kruskal–Wallis test (
Figure 8). The results show that all DHW indicators exhibit a significant monotonic increasing gradient. In the low-urbanization group, the median annual DHW frequency is approximately 0.45 events per station, and the median average intensity is approximately 1.5 °C per event. In the high-urbanization group, the corresponding values rise to 1.25 events per station and 9.0 °C per event, respectively. All inter-group differences are statistically significant. These results further confirm that urban expansion is an important anthropogenic factor driving the intensification of DHW. Higher urbanization intensity is associated with more pronounced local dry heat stress.
(2) UI effects on Long-Term Trends
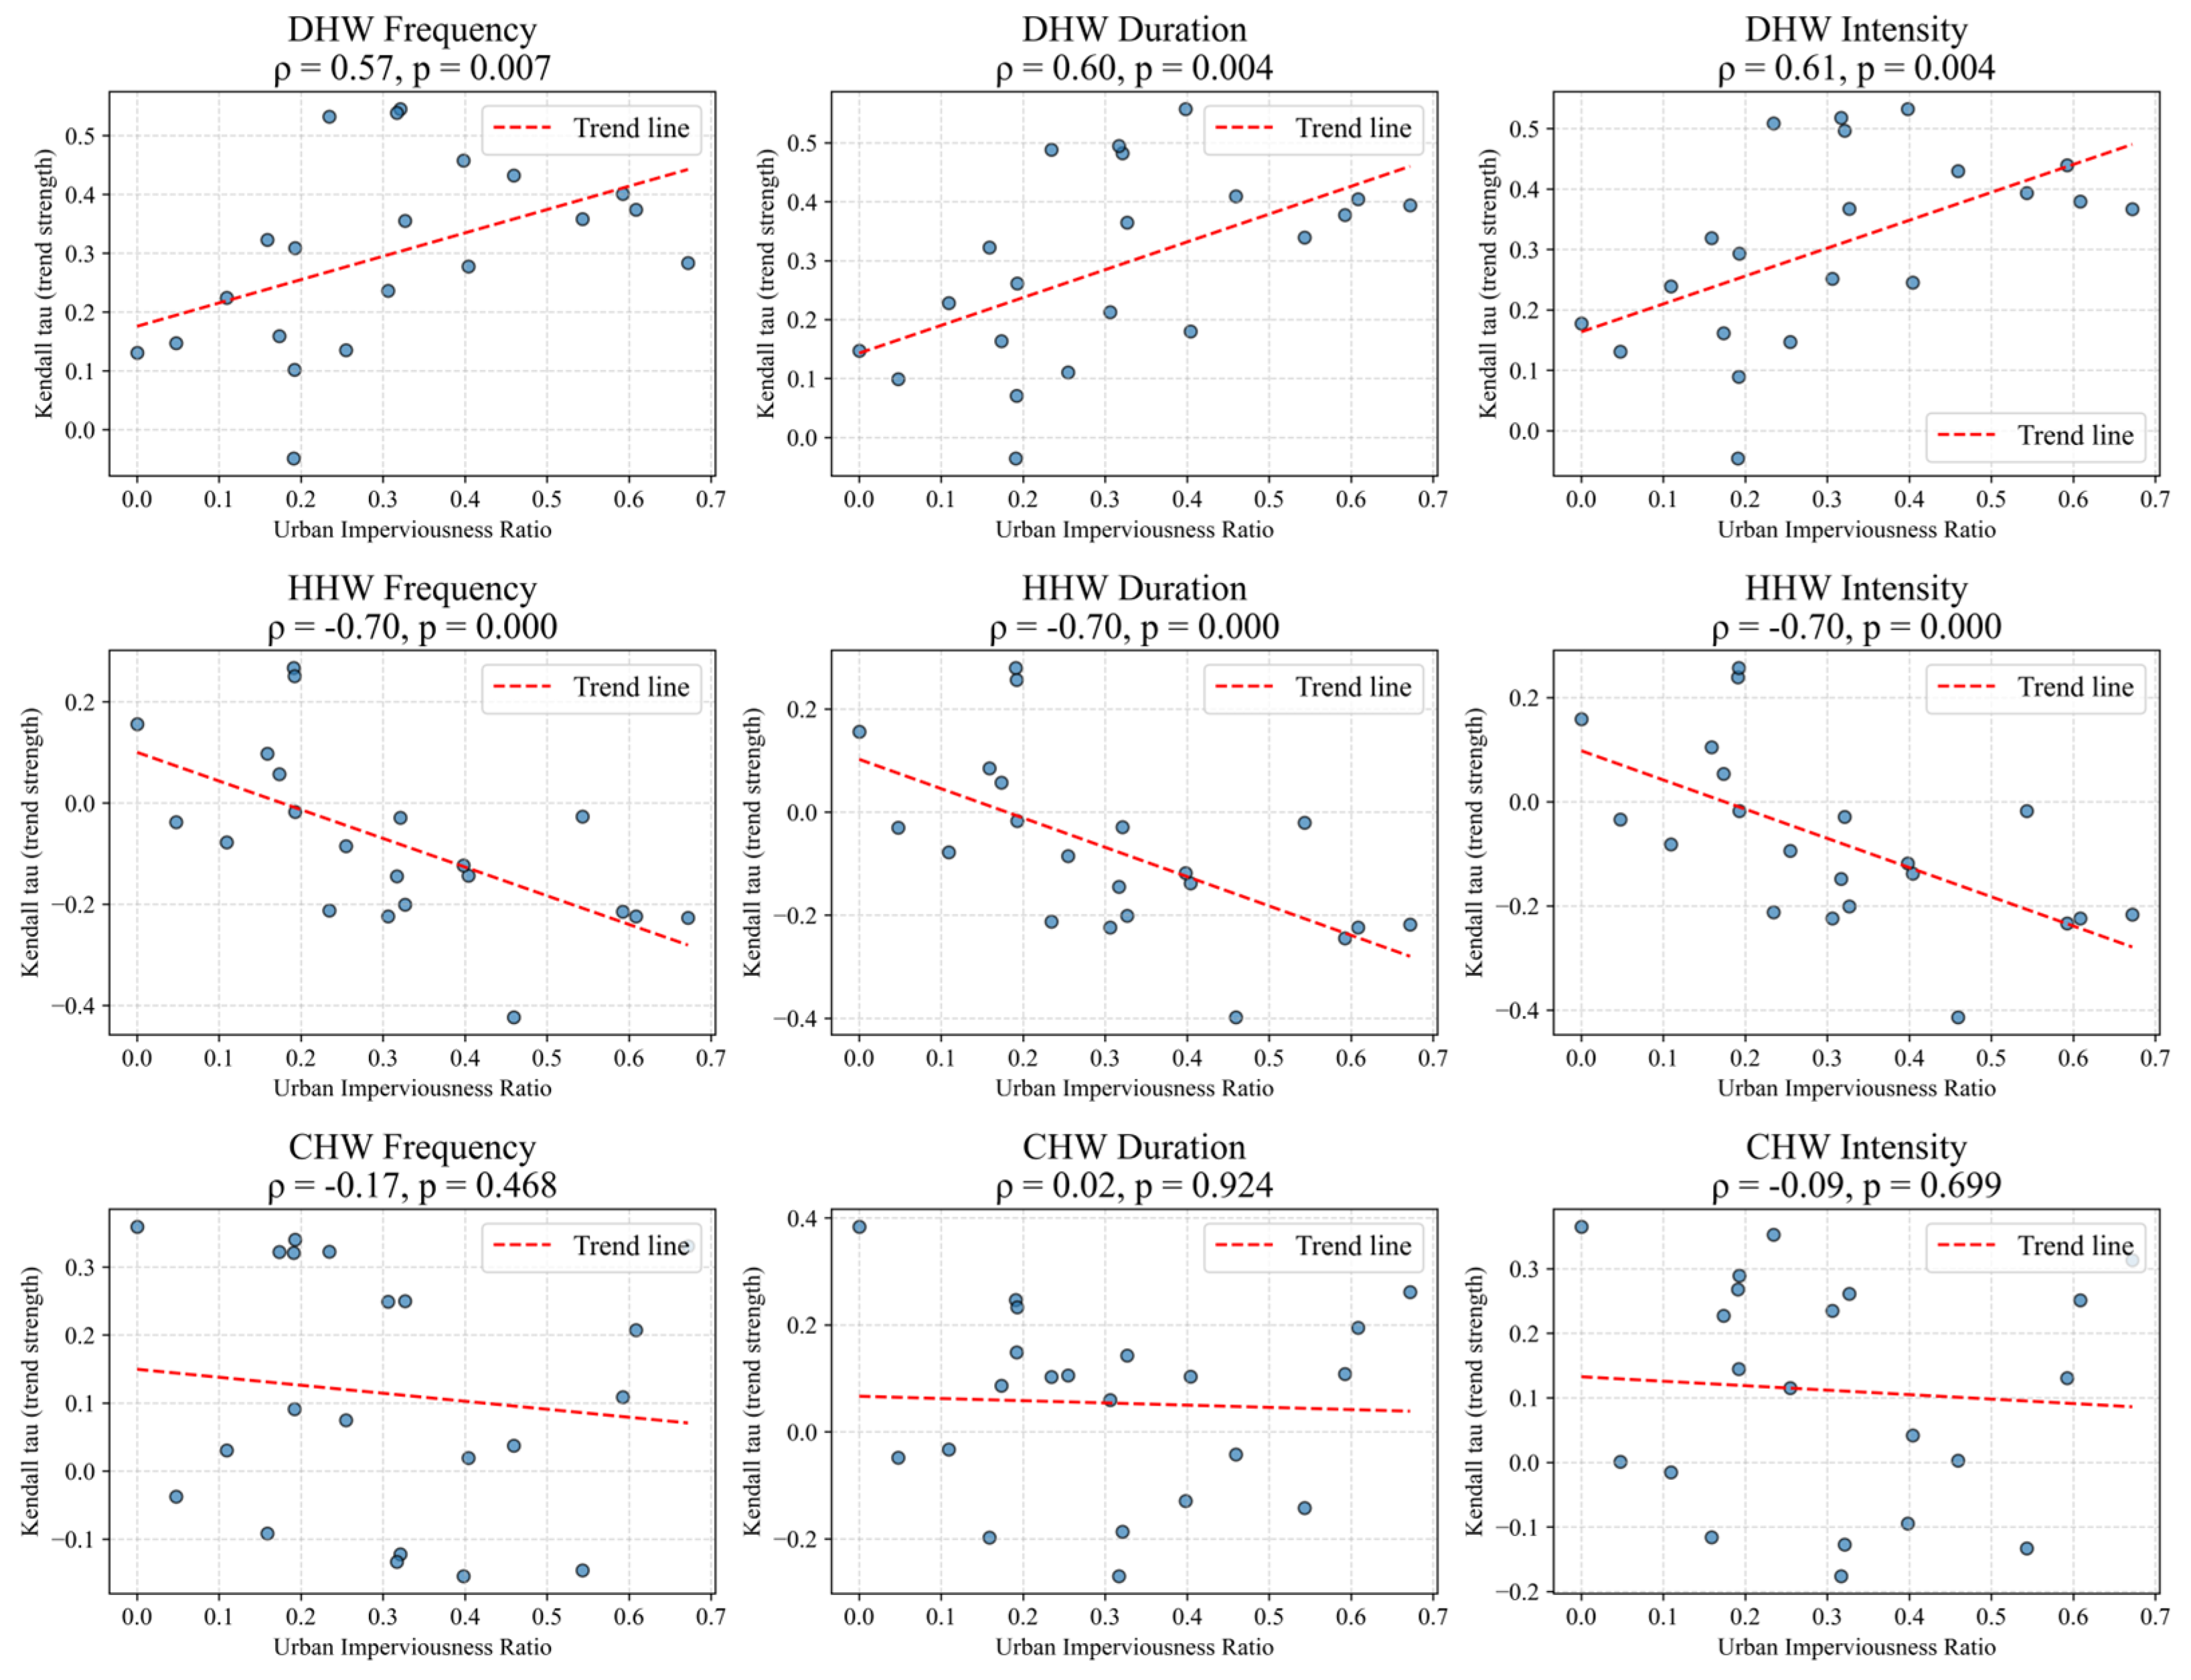
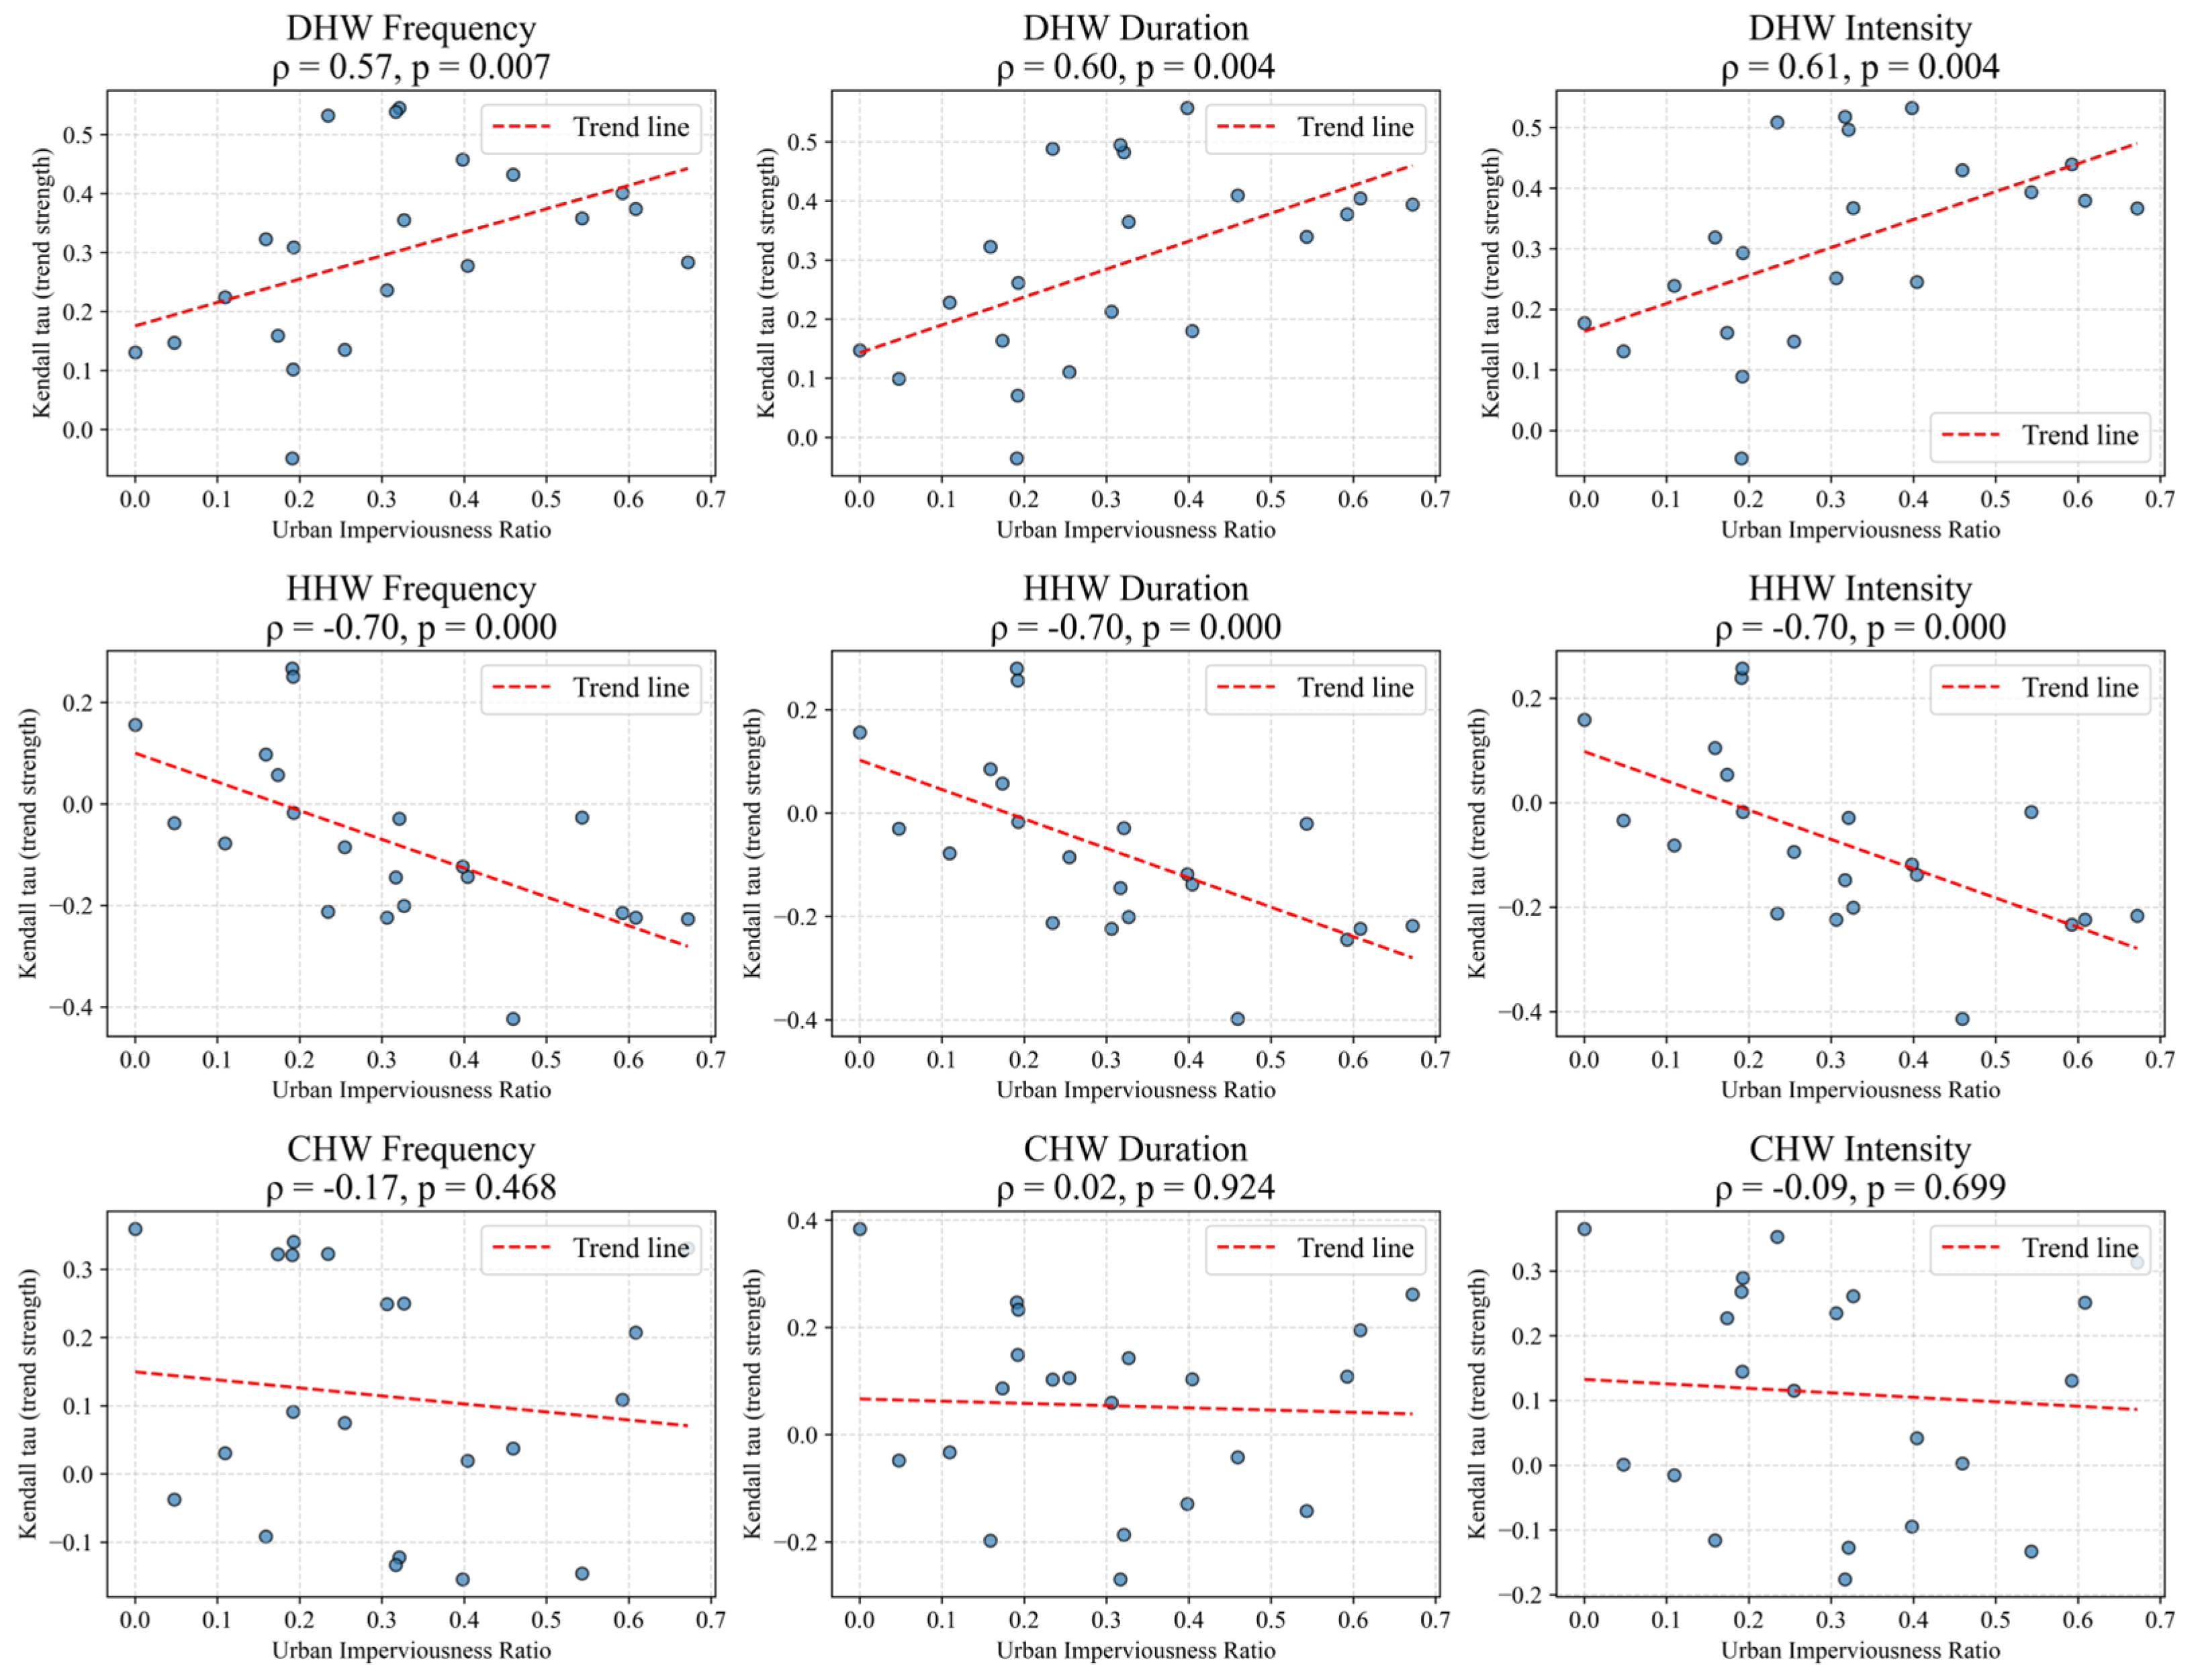
UI not only regulates the mean state of DHW but also significantly influences its long-term evolution rate (
Figure 9). The trend magnitudes of all DHW indicators show highly significant positive correlations with UI, indicating that areas with higher urbanization levels experience faster increasing rates of DHW. In stark contrast, the trend magnitudes of HHW exhibit significant negative correlations with UI. The long-term increasing trends of HHW are significantly suppressed at highly urbanized stations, while low-urbanization stations show weak upward trends. This indicates that urbanization exerts a clear inhibitory effect on the evolution of humid-type extreme heat. The trend magnitudes of CHW show no statistically significant correlations with UI, suggesting that its long-term evolution is not regulated by local urban land surface.
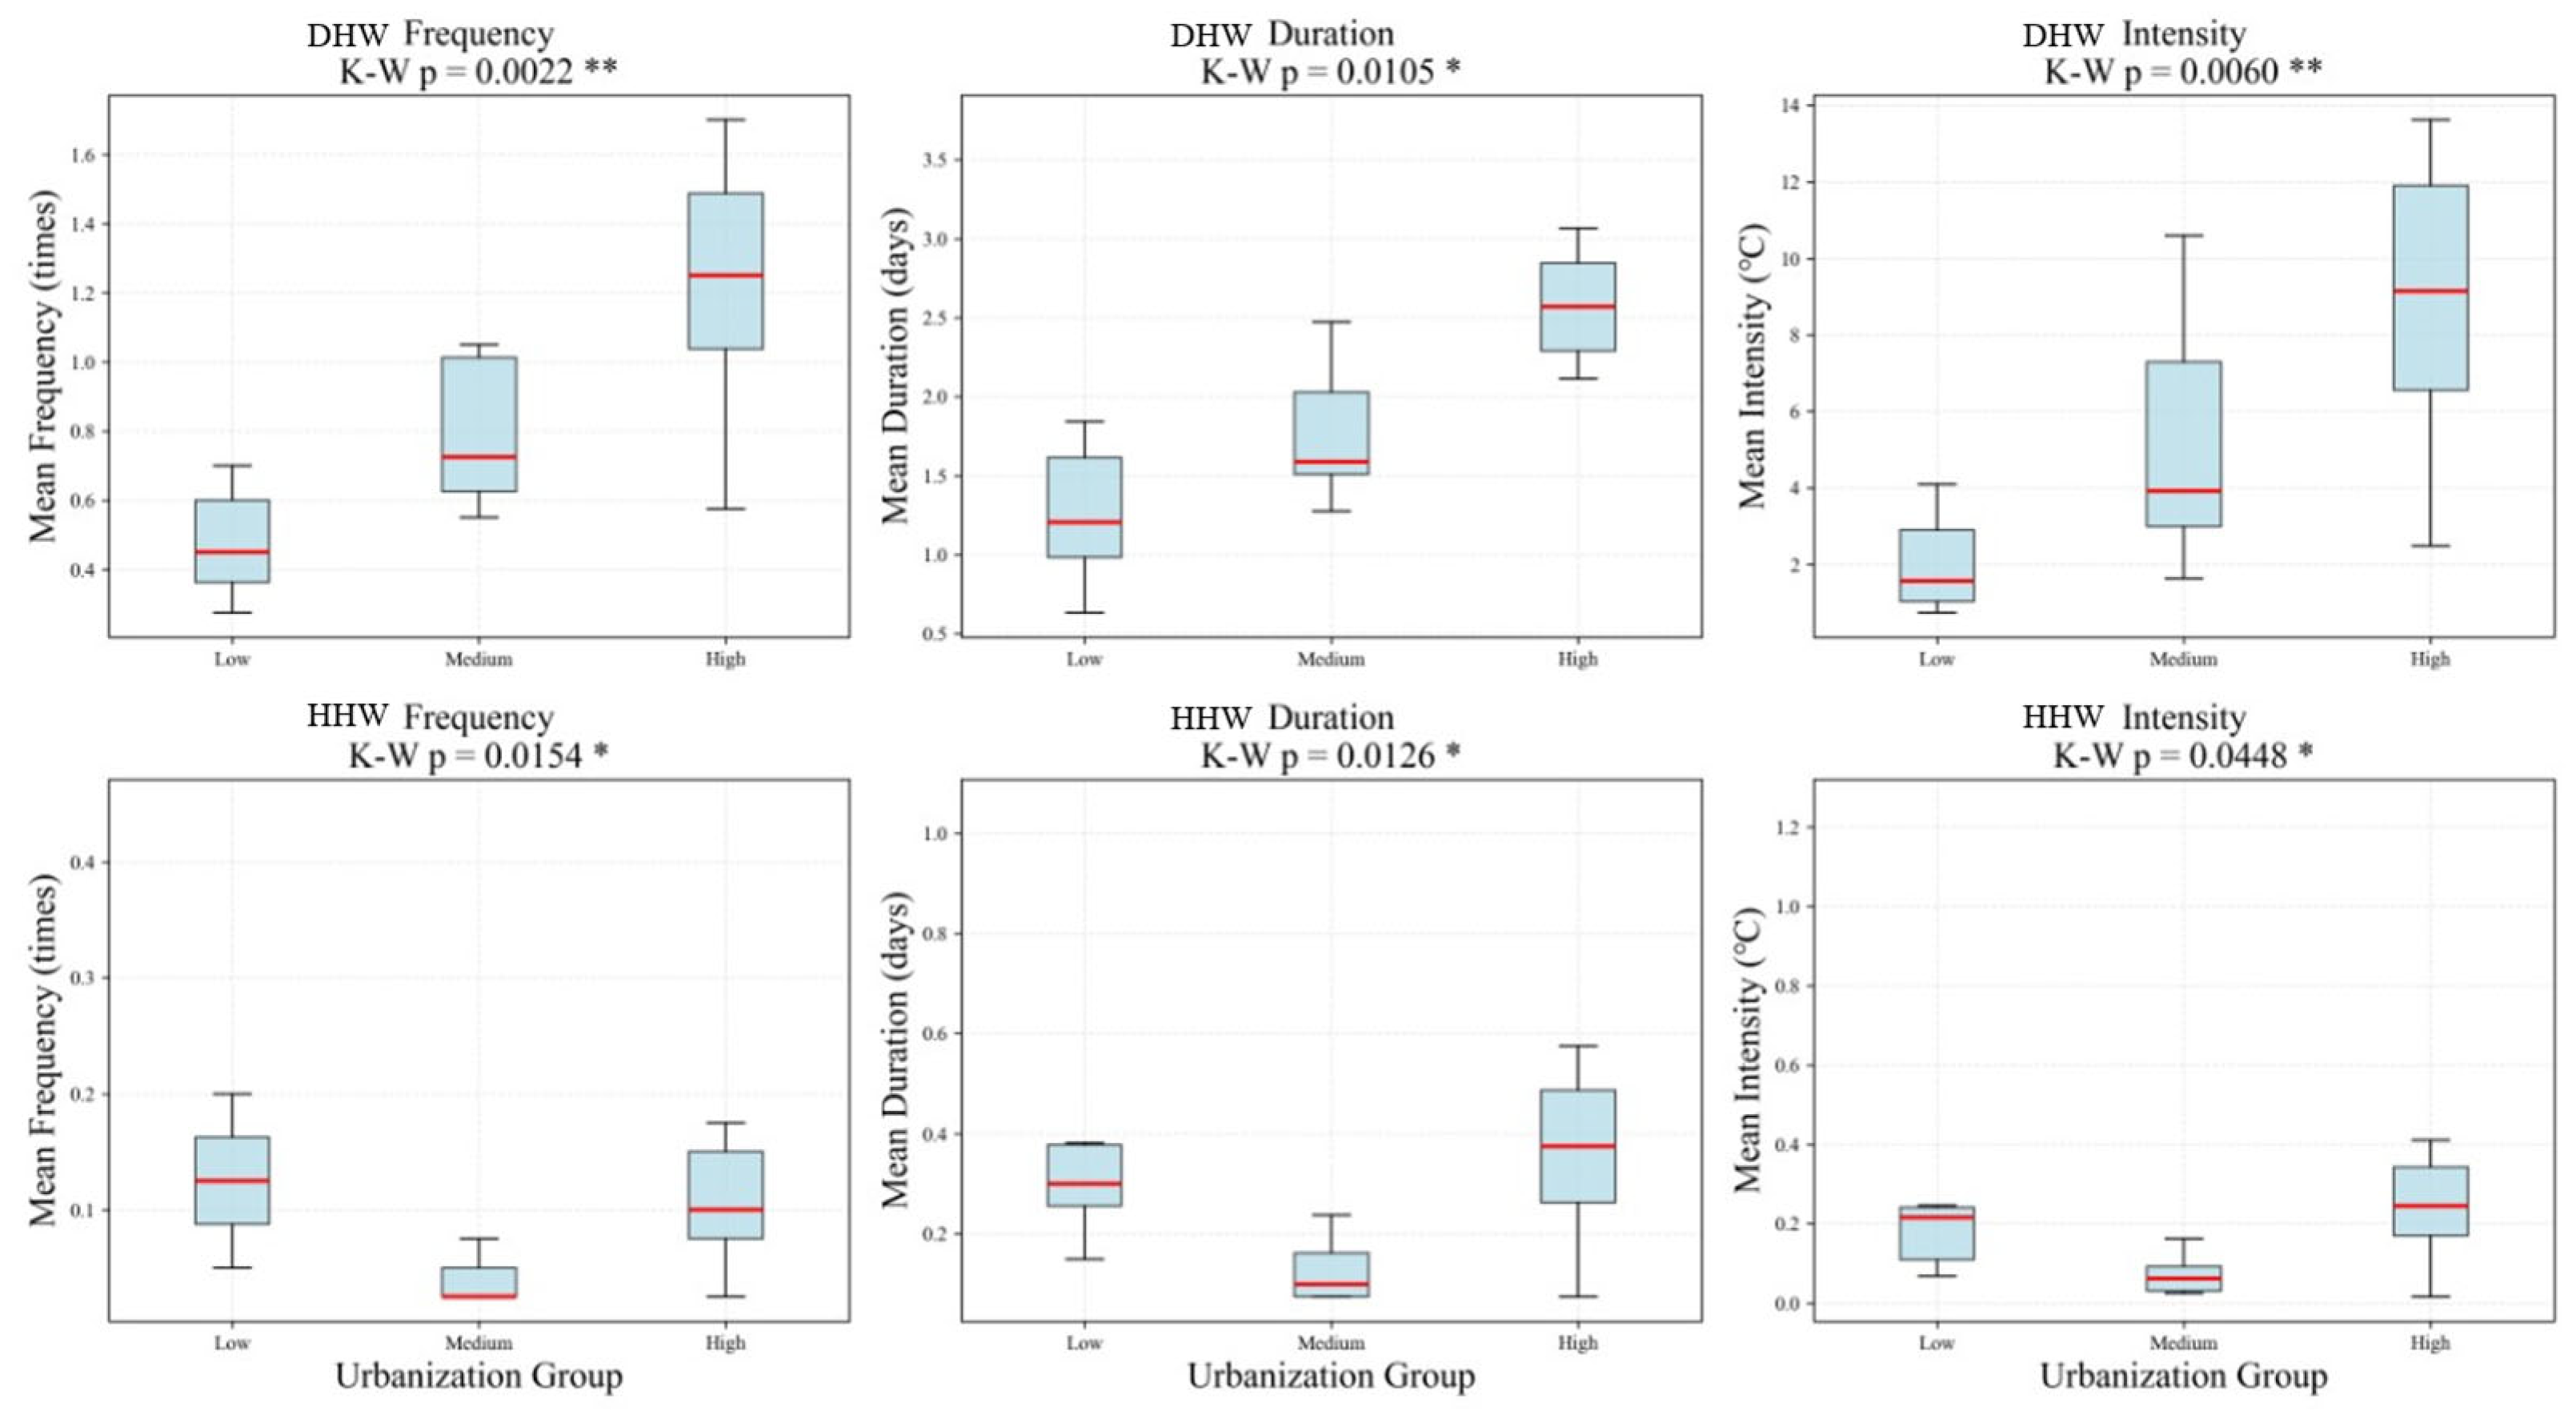
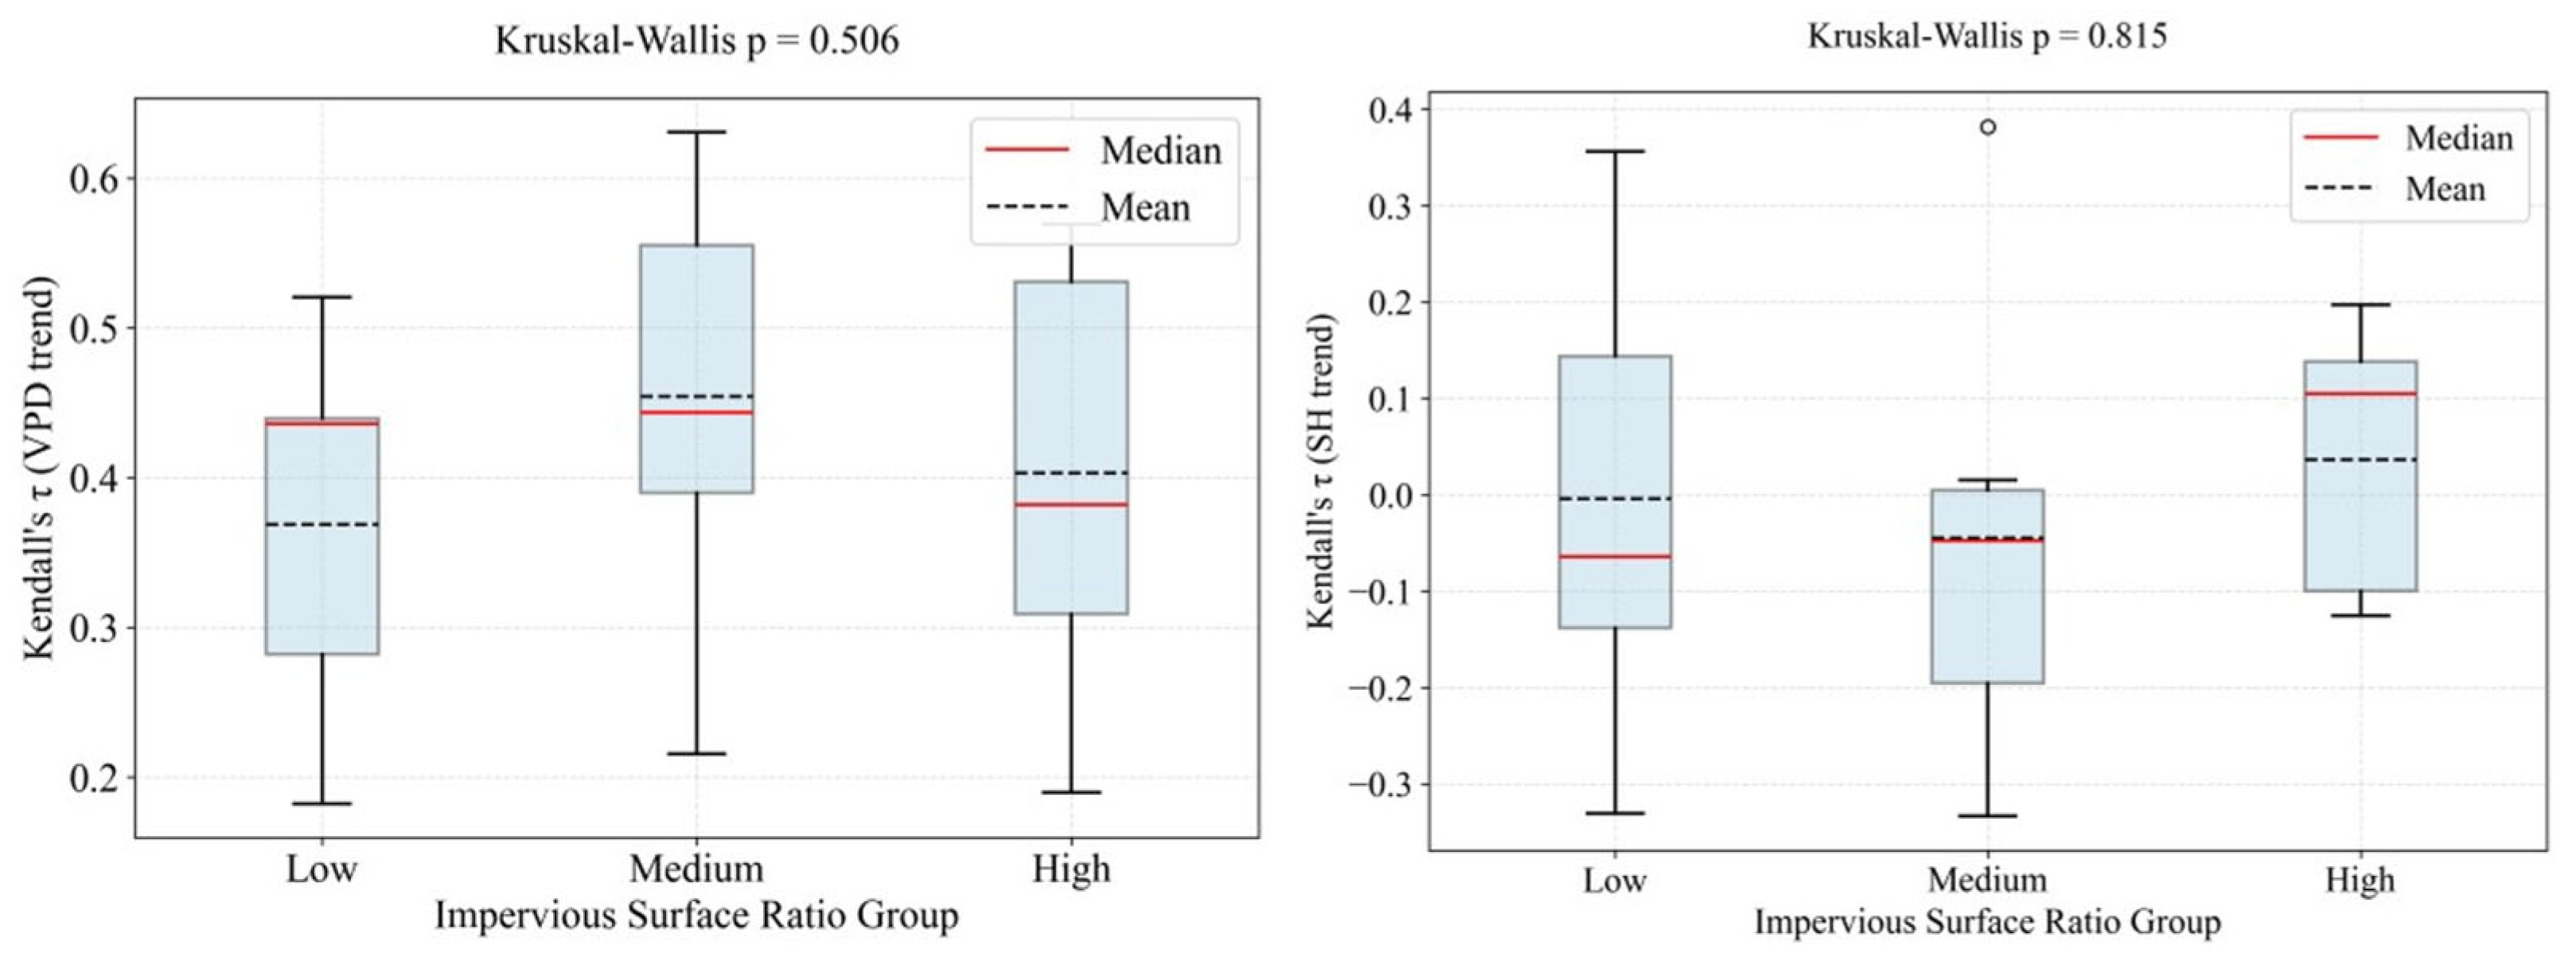
The UI-stratified trend boxplots (
Figure 10) further reveal this divergent pattern. The trend magnitudes of DHW increase monotonically with rising urbanization level. In contrast, the trend magnitudes of HHW exhibit a U-shaped distribution: weak increases in low-urbanization areas, the weakest trends in medium-urbanization areas, and slight rebounds in high-urbanization areas. However, given the extremely low baseline occurrence frequency of HHW across the province, the actual climatic significance of this statistical difference is limited.
In summary, urbanization has a strongly type-specific impact on extreme high-temperature events. Urbanization intensifies DHW through surface warming and localized drying processes, while suppressing the long-term increasing trend of humid-type extreme high temperatures. CHW, however, is co-regulated by temperature and humidity conditions and shows no clear response to urbanization.
3.3.2. Cross-Validation with Population Density
The above analysis indicates that UI is the primary factor through which urbanization influences extreme high temperatures. However, a potential competing explanation exists: areas with high UI values are also densely populated and emit substantial anthropogenic heat. The intensification of DHW might therefore originate primarily from anthropogenic heat emissions rather than from the physical effects of impervious surfaces. To distinguish between these possibilities, this study introduces population density (PD) as a proxy indicator of anthropogenic activity intensity associated with urbanization. We repeated the correlation analyses and group tests described above, using PD in place of UI, to evaluate the relative explanatory power of the two indicators.
(1) PD effects on the Mean State
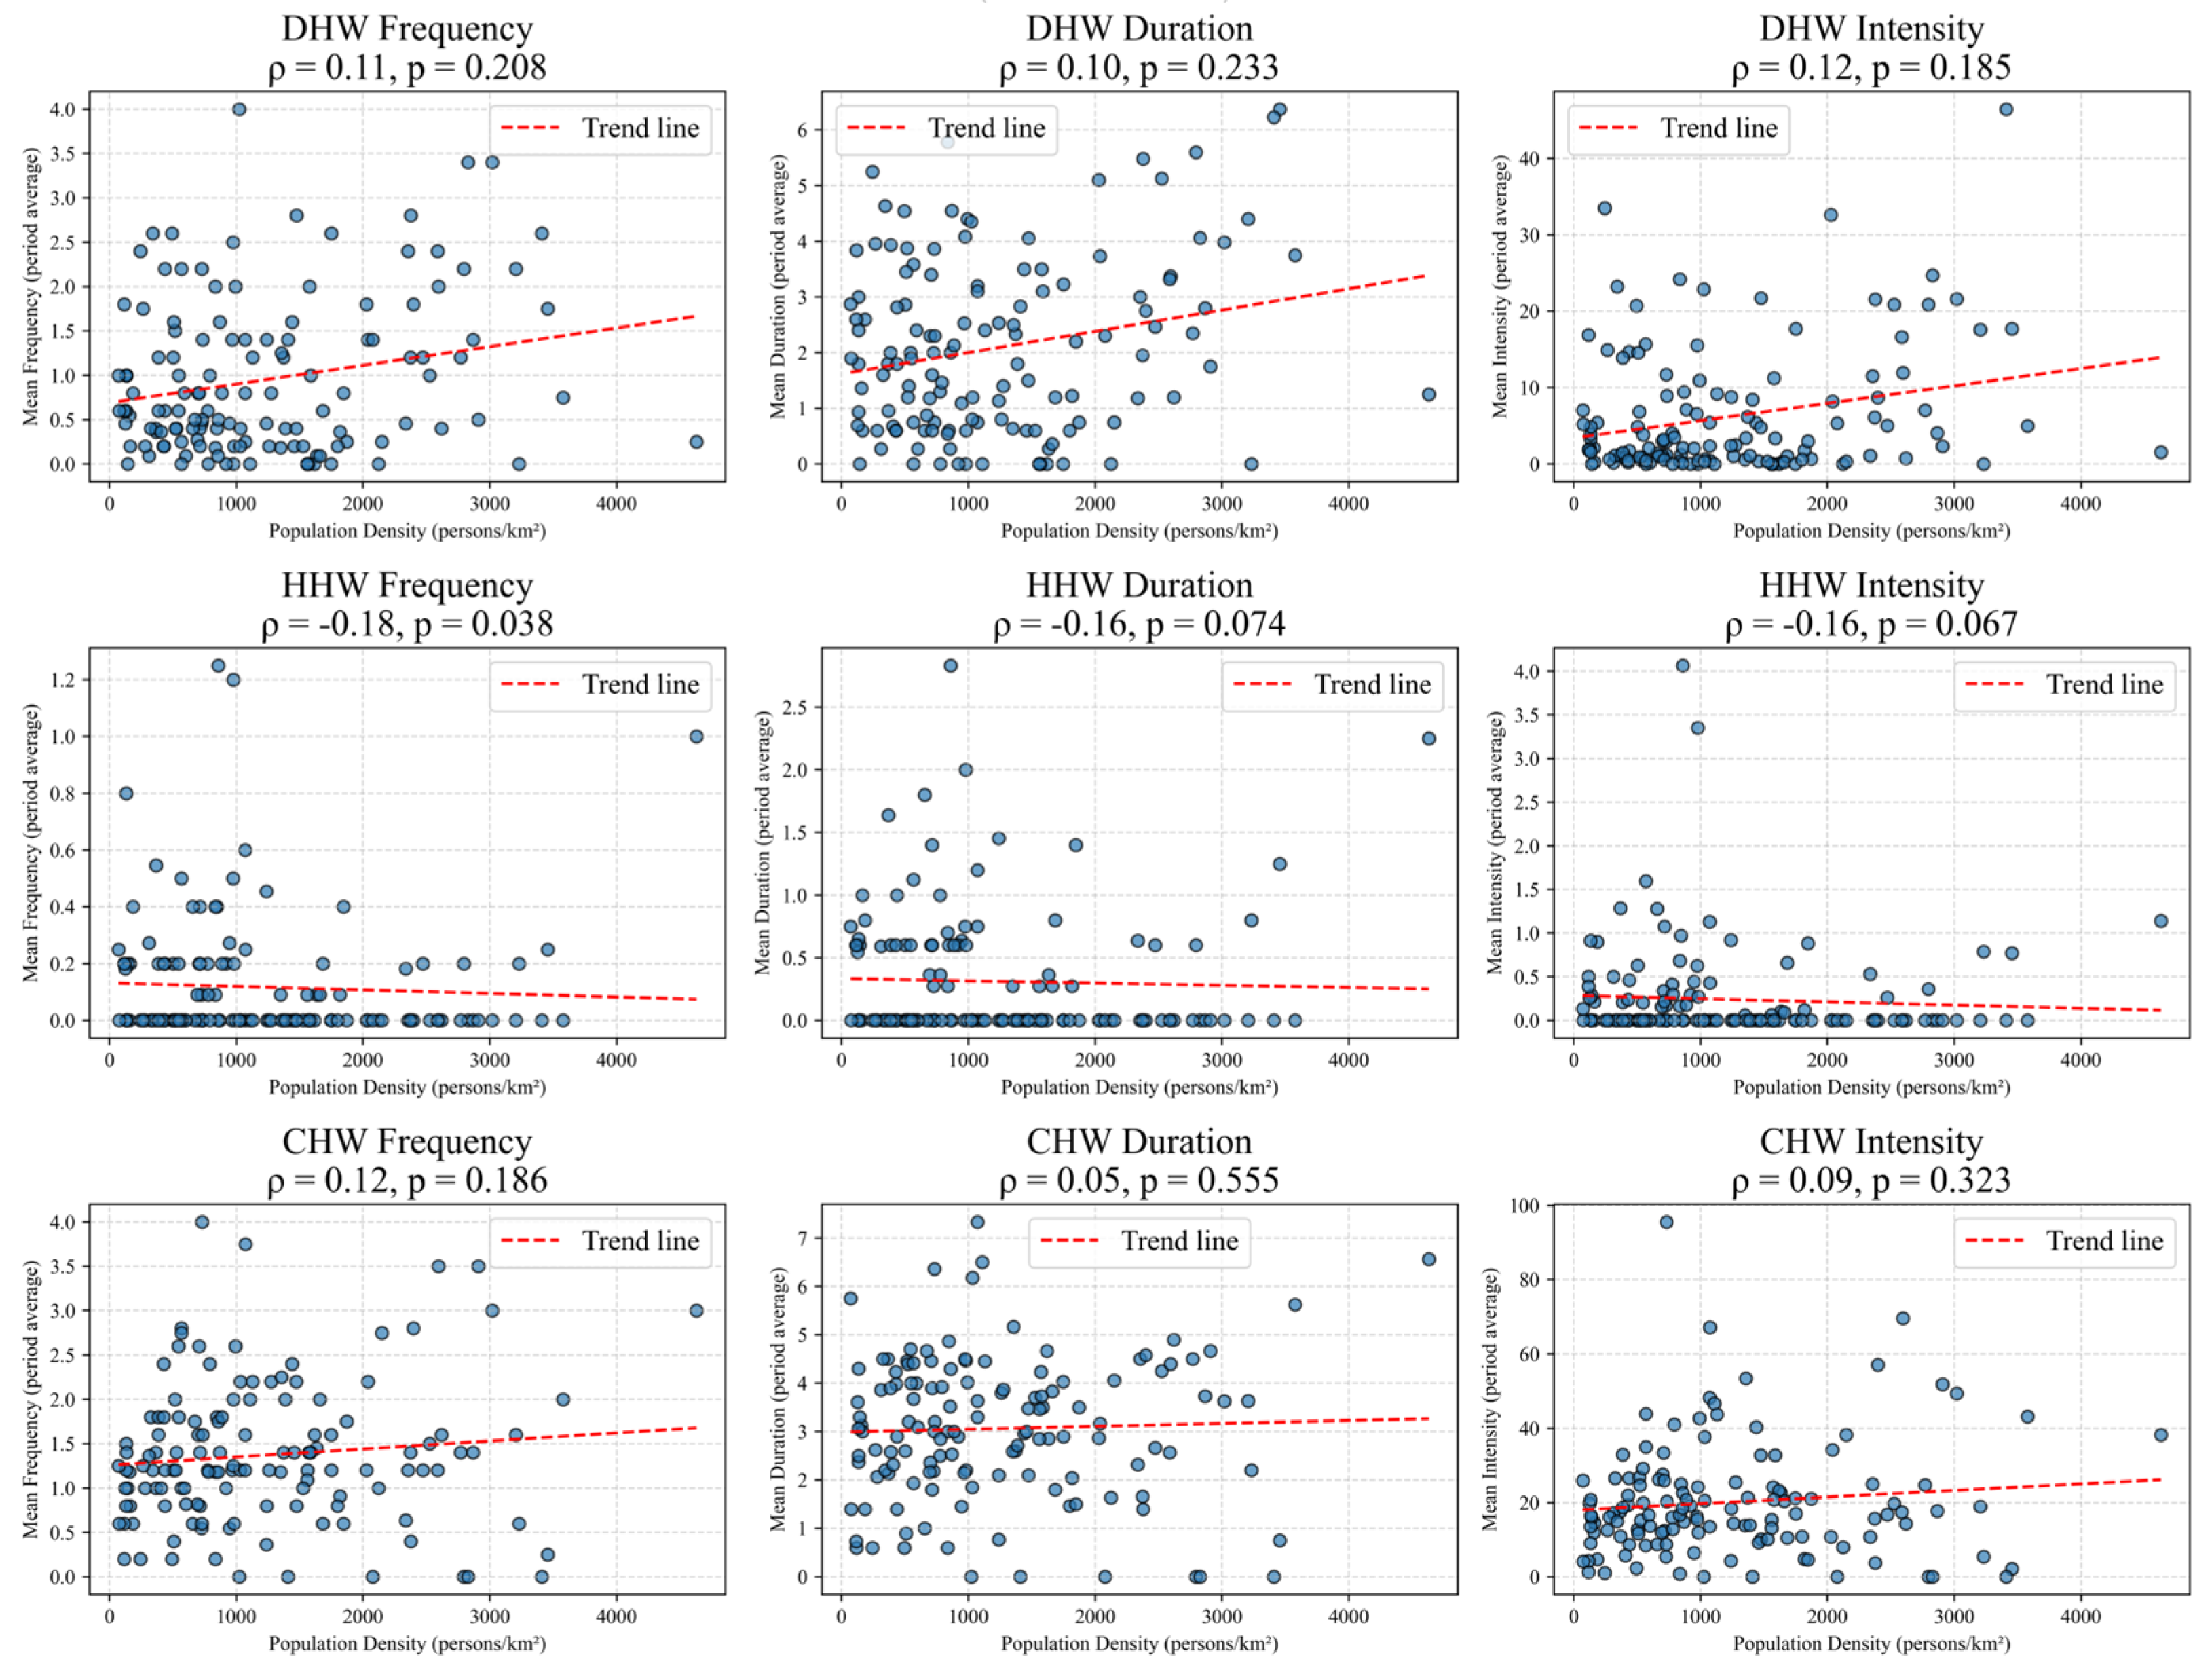
In stark contrast to the UI results, PD shows generally weak correlations with all mean-state indicators of the three heat types (
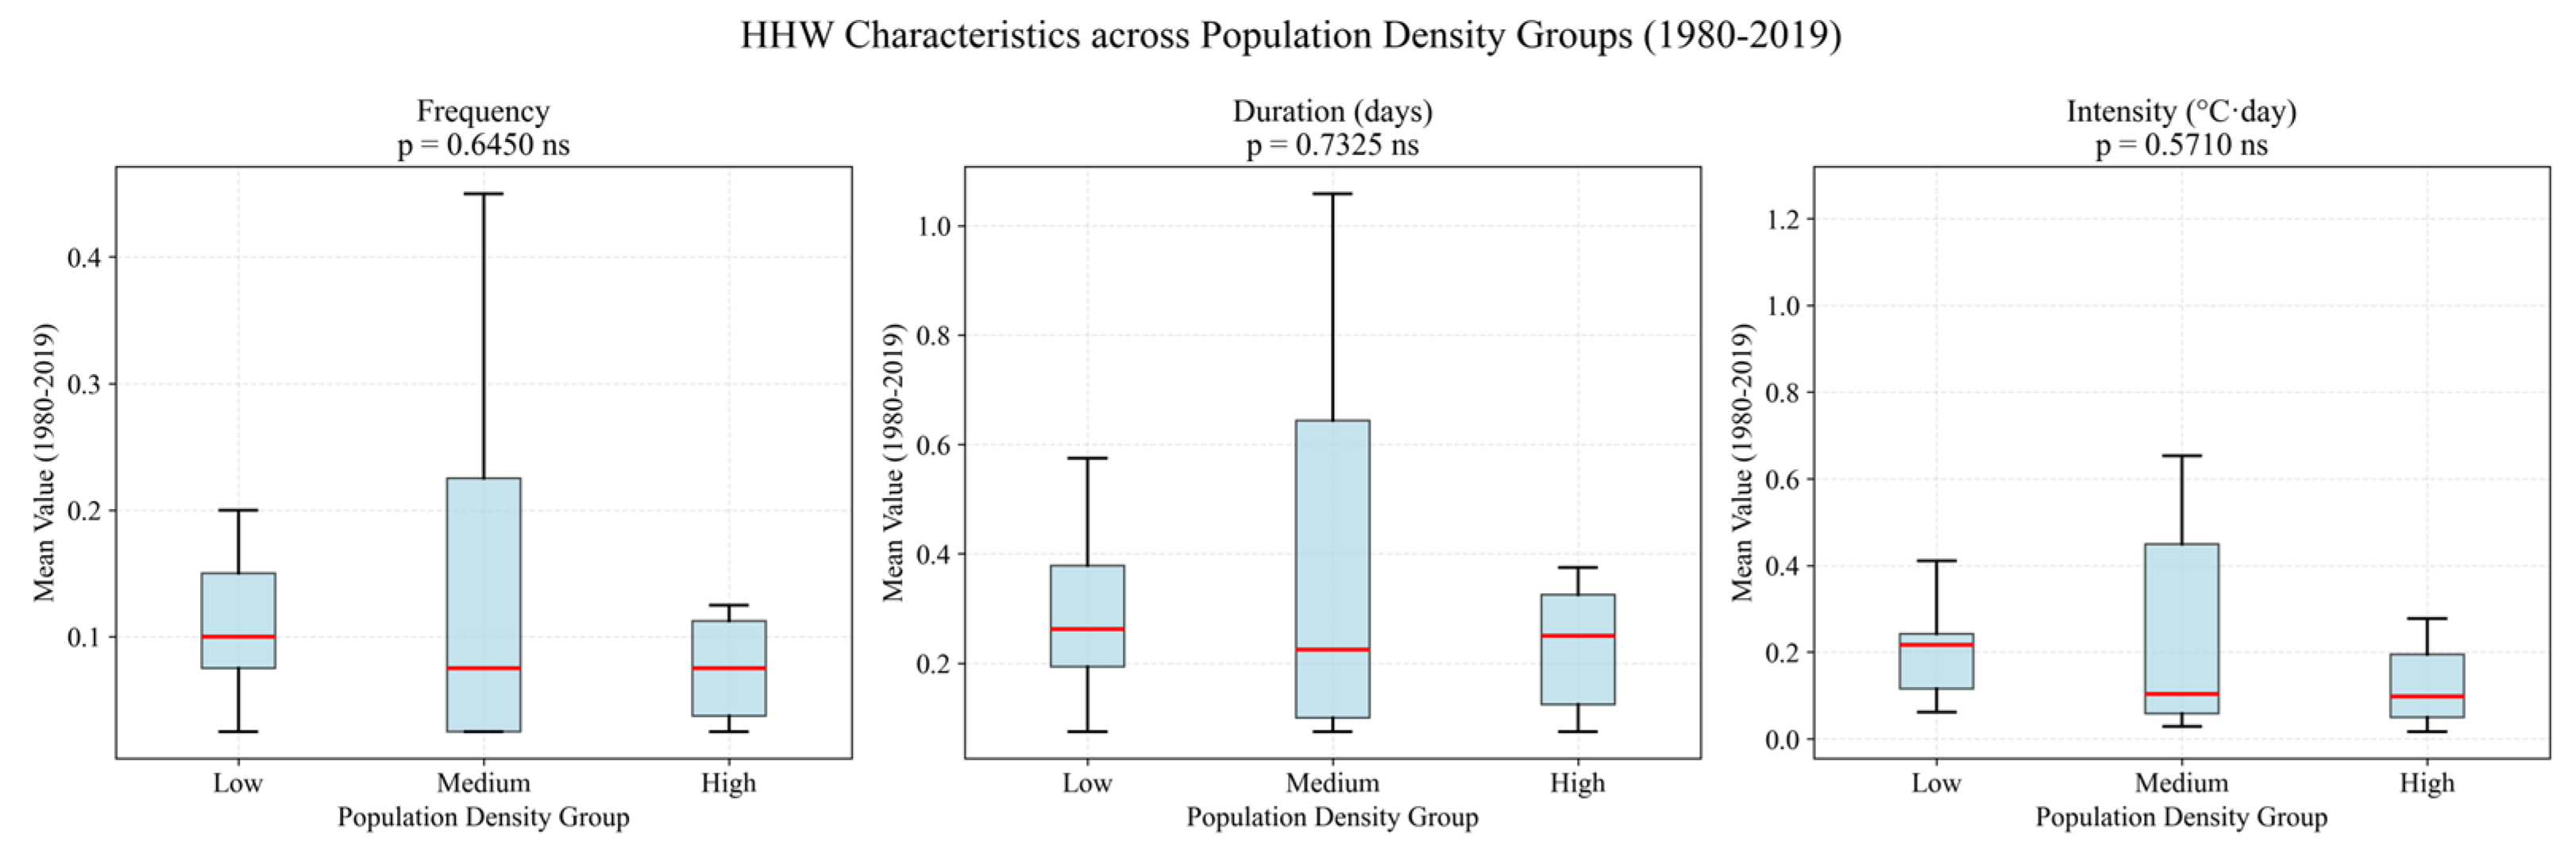
Figure 11). All DHW indicators exhibit only weak positive correlations, none of which reach statistical significance. CHW also shows no significant correlations. Only HHW frequency exhibits a weak negative correlation with PD, barely reaching the 0.05 significance level. However, the Kruskal–Wallis tests stratified by PD groups show that none of the HHW indicators differ significantly across the three groups (
p > 0.05), indicating that the suppressive effect of PD on HHW lacks robust gradient support (
Figure 12). From the boxplot distributions, the medium-PD group shows slightly higher HHW values, while the high-PD group exhibits suppressed levels. Nevertheless, the considerable within-group variability makes these differences statistically indistinguishable.
(2) PD effects on Long-Term Trends
In terms of trend regulation, PD exhibits even weaker performance (
Figure 13). The trend magnitudes of DHW, HHW and CHW show no significant correlations with PD. HHW maintains a negative association, but the correlation coefficients are substantially weaker than those observed for UI and do not reach statistical significance.
(3) Comparative Implications of UI Versus PD
The marked difference in explanatory power between UI and PD carries important implications. The “human activity agglomeration” effect captured by PD does not exhibit a stable regulatory role in the evolution of the three types of extreme high-temperature events. In contrast, the “surface physical alteration” represented by impervious surface ratio constitutes the dominant pathway through which urbanization influences DHW and HHW. This comparison strongly supports the interpretation that urbanization regulates multi-type extreme heat primarily through modifications to surface energy and water balance, rather than through population agglomeration and anthropogenic heat emissions alone. Furthermore, the stronger explanatory power of UI over PD suggests that impervious surface ratio is a more direct and effective proxy for urbanization than population density in studies of urban heat effects in similar regions.
5. Conclusions
This study applied a mutually exclusive classification framework based on dry-bulb and wet-bulb temperature thresholds to distinguish DHW, HHW and CHW in Zhejiang Province. Using warm-season observational data from 21 meteorological stations (1980–2019) and impervious surface data, we systematically analyzed the spatiotemporal evolution of each type and the differentiated impacts of urbanization.
The temporal evolution of extreme high-temperature events presents prominent divergence over the past four decades. DHW exhibits highly significant increasing trends in frequency, duration and intensity and dominates regional heat intensification. HHW remains at a low baseline level without detectable long-term monotonic trends. Although the frequency and duration of CHW show no notable shifts, its intensity rises remarkably, implying growing hazard potential of individual compound heat episodes. Spatially, DHW is concentrated in inland plains and basins of northern and central Zhejiang, while CHW mainly clusters along the eastern coast, and HHW occurs sparsely across the whole province. Such spatial disparities are jointly shaped by land–sea thermal contrasts, topographic constraints and near-surface moisture availability.
Urbanization exerts divergent regulatory effects on three categories of extreme heat. Built-up expansion amplifies DHW via surface warming and evapotranspiration suppression, whereas urban dry island effects constrain the formation of HHW. By contrast, CHW genesis is governed by large-scale atmospheric circulation and oceanic moisture transport, with limited net modulation from local urbanization.
These findings deliver targeted references for regional heat risk governance. Distinct dominant heat hazards exist across sub-regions of Zhejiang. Inland urbanized areas should prioritize early warning systems and energy security against dry heat. Coastal cities need to strengthen public health protection for compound hot hazards. Urban planning strategies should balance heat mitigation and surface moisture retention to offset the counteracting thermal and hydrological effects of urban expansion. This study clarifies the differences in urbanization responses of multi-type extreme high-temperature events in Zhejiang Province, providing a scientific basis for regional high-temperature disaster prevention and urban climate optimization.