


Abstract
The rise of independent travel is reshaping tourism, moving away from mass tourism and rigid itineraries toward flexible, technology-driven, and sustainable experiences. This study examines how self-guided digital tours can reduce congestion at points of interest while maintaining visitor engagement. Using a stylized agent-based simulation implemented with the Mesa framework, we modeled guided and self-guided tourist groups to compare congestion patterns, travel flows, and completion rates. The results indicate that self-guided tours flatten congestion peaks and support decentralized, walking-based exploration while maintaining comparable engagement levels. The findings suggest that digital self-guided formats can complement urban visitor management and smart-city strategies by distributing tourist flows more evenly. Future research should calibrate the model with real-world data and case studies to validate and extend these results. This study contributes to the discourse on sustainable urban tourism by positioning self-guided tours as a tool for integrating visitor management into smart infrastructure and enhancing long-term cultural and environmental resilience.
1. Introduction
Tourism is undergoing a transformation driven by changing traveler preferences, sustainability concerns, and advancements in digital technology. Traditional group tours and mass tourism are undergoing a paradigm shift toward more personalized and independent tourism experiences. Modern travelers are seeking more independent and authentic experiences while visiting urban centers. On the other hand, cities have been pushing against overtourism with restrictions against mass tourism and advocating environmental responsibility.
Urban centers, such as Venice, Barcelona, and Amsterdam, have introduced regulatory measures to mitigate overcrowding, reduce environmental stress, and preserve residents’ quality of life [1]. These policies include restrictions on short-term rentals, entry caps for popular sites, and taxes aimed at redistributing tourists over time and space.
In parallel, digital technologies are playing an instrumental role in reimagining the tourism experience. Self-guided tours, powered by mobile applications, interactive technologies, and gamification, offer an innovative approach to destination management that combines autonomy with visitor engagement while minimizing environmental impact [2]. Within the context of smart cities, these digital tools support more efficient urban tourism by enabling data-driven visitor management, reducing pressure on critical infrastructure, and promoting decentralized, walking-based exploration. By leveraging mobile technologies and user-centered design, tourism stakeholders can enhance tourist engagement, balance urban mobility flows, and support local economies in line with sustainable development goals [3,4]. This paper investigates the role of self-guided digital tours to promote sustainable urban tourism and counteract the potential decline of tourism in urban centers due to overtourism.
Recent studies emphasize that urban tourism challenges cannot be understood in isolation but are embedded within broader systemic crises. The concept of polycrisis describes how environmental, social, economic, and technological stresses interact to produce cascading vulnerabilities for cities [5,6]. Situating overtourism and digital visitor management within this framework highlights the importance of resilient strategies, where self-guided digital tours can mitigate congestion while contributing to broader urban resilience.
Over the last few years, self-guided tours have gained significant traction and represent a distinct sector within the travel-tech industry, which could address the increasing trends regarding sustainable tourism and improve resilience toward the development of modern tourism initiatives in urban areas. Enabled by mobile technologies, augmented reality (AR), and gamification, self-guided tours allow travelers to engage with their surroundings at their own pace. Previous research also shows that gamified approaches in tourism can enhance visitor engagement and promote sustainable behavior [7].
On the individual level, this paradigm shift is arguably just an additional mode of exploration for modern independent travelers that prefer to explore on their own instead of relying on scheduled activities and coordinating with local guides. However, considering the bigger picture, self-guided tours offer personalized, low-impact alternatives that empower users while reducing congestion and over-reliance on physical infrastructure, unlike group-based tourism, which often involves fixed schedules, limited customization, and larger environmental footprints [8,9,10].
The foundation that allows for this emerging trend includes the following: the increasing demand for private and personalized travel experiences [11], the widespread availability of smartphones and GPS-enabled applications [8], the increasing reliance on digital solutions by cultural institutions during the pandemic [12], and the shift toward slow travel [13]. In this context, travelers become active agents of exploration, supported by digital tools that enhance their understanding of the local culture, history, and environment.
This paper explores the potential of self-guided tours as a vehicle for sustainable urban tourism, particularly in smart-city contexts. In contrast to larger guided groups, self-guided tours reduce crowding and environmental degradation while allowing travelers to explore at their own pace. In line with current developments focused on slow travel, immersive cultural tourism, and digital engagement, self-guided tours can play a key role in addressing several sustainability challenges facing the tourism industry, as follows: distributing tourist flows more evenly across space and time [3], reducing carbon footprints through walking-based exploration [8], engaging users through AR and gamified experiences [9,10], and supporting local economies by promoting off-the-beaten-path destinations [4,14].
The research is grounded in a growing body of academic and applied work on the role of digital innovation in promoting sustainable tourism. The potential of digital platforms and social media to foster engagement and cultural connection defines scalable and resource-efficient approaches to the traditional tourism channels. Furthermore, researchers have demonstrated how gamification and augmented reality (AR) can complement tourist experiences while promoting education, behavioral change, and sustainable exploration patterns [9,10,15].
Building on these insights, our work integrates digital engagement strategies with sustainability goals through a simulation-based framework designed to assess the real-world impact of self-guided tourism.
This paper explores the intersection of self-guided tourism, sustainability, and smart-city innovation, assessing how digital platforms can create engaging yet low-impact travel experiences.
The remainder of this paper is structured as follows: Section 2 reviews related work on digital tourism, gamified mobile applications, and sustainable travel behavior; Section 3 introduces the simulation framework and parameters used in modeling guided and self-guided tours; and Section 4 presents key findings from the simulation, including a sensitivity analysis that explores the effects of varying group sizes, waiting times, and total number of tourists and discusses the broader implications of self-guided tourism for cities, tour operators, and policymakers. Finally, Section 5 concludes with directions for future research, including AI for personalization, and deeper integrations with smart-city ecosystems.
2. Related Work
The ongoing digital transformation of the tourism industry is not only reshaping travel logistics but also redefining the experiential and environmental dimensions of tourism. Several streams of academic research have addressed this evolution, considering technology adoption, tourist behavior, and sustainability.
2.1. Digital Transformation in Tourism
The current state of digitalization in the tourism industry has significantly changed how tourists plan, navigate, and reflect on their experiences. The work of Sigala [12] highlighted how smart technologies and digital visitor services are reshaping travel experiences and enabling more efficient, personalized, and environmentally conscious tourism.
Beyond OTAs (online travel agencies), which make it easier for travelers to research, plan, and book their trips (e.g., Booking, Expedia, and Airbnb), and the mobile applications offering tools for travelers (e.g., Google Maps, Tripadvisor, providing updates, navigation, assistance, and local recommendations), the integration of mobile technologies and AR/VR in the travel industry has been particularly relevant to independent travelers. Tools such as interactive maps, virtual guides, and real-time data support the travel experience while promoting spatial awareness and independent exploration.
The authors of [3] provide a systematic review of technologies reshaping the tourism industry, emphasizing the integration of mobile applications, AR/VR tools, IoT-enabled infrastructure, and big data analytics. Their research highlights how these technologies improve accessibility, responsiveness, and personalization in tourism, while also presenting challenges, such as digital accessibility across a wide range of destinations and communities; implementation costs and reliance on technology providers within a complex ecosystem; established or even outdated regulations that can hinder the adoption of new technologies in the tourism sector; and, last but not the least, the potentially detrimental impact on human interactions. Among the benefits, it was found that these technologies directly enhance traveler satisfaction, loyalty, and cultural engagement. It is concluded that, for digital transformation to add genuine value, coordinated stakeholder collaboration is essential across the tourism industry and technology service providers.
Technology plays a pivotal role in making self-guided tourism a viable and sustainable alternative to traditional tours. Digital tools have emerged as enablers of low-impact, high-engagement exploration, enabled by several key innovations, as follows:
- Augmented reality (AR): AR enhances storytelling by overlaying historical and cultural information onto real-world locations. It has been shown to improve user immersion and retention, particularly in cultural tourism and educational contexts [9];
- Gamification: Gamified elements, such as challenges, achievements, and progression systems, promote exploration and user motivation. In tourism, gamification increases engagement and facilitates learning in cultural and natural environments [10];
- AI-powered recommendations: artificial intelligence helps personalize routes and experiences based on user preferences, real-time conditions, and sustainability criteria such as crowd levels or carbon impact [4];
- Digital mapping and wayfinding: real-time navigation and spatial intelligence tools help spread visitor traffic, reducing pressure on overcrowded tourist sites and supporting destination management [3].
The authors of [8] argue that despite significant advancements, international economies “confront formidable challenges on their journey toward digital transformation”, considering the heightened focus on data privacy, strict governmental legislation, and a prevailing “digital divide”. Their paper highlights the gap between theoretical developments and practical implementations and proposes future research directions combining theoretical frameworks that are more established in Western literature with the practical insights arising from Chinese developments, highlighting key aspects that need to be formally addressed, such as theoretical localization, policy impact, governance, and digital strategy.
2.2. Gamification and Immersive Experiences
Gamification has emerged as a powerful approach to increase tourist motivation and engagement, particularly in educational and cultural tourism. Earlier works established the conceptual foundation for gamification in service contexts [14,16], while more recent studies have shown that gamified mobile applications can shape exploration patterns, encourage sustainable behavior, and improve visitor satisfaction in urban tourism [17,18].
In the context of self-guided tourism, gamification is not an abstract layer but a functional mechanism that influences visitor flow and cultural engagement. Challenges, badges, and interactive storytelling embedded into mobile apps have been shown to encourage tourists to explore lesser-known points of interest, avoid overcrowded attractions, and spend more time engaging with cultural heritage [19]. When combined with augmented reality (AR), these elements foster immersion and learning while promoting decentralized exploration.
Building on this, post-pandemic tourism research underscores how agent-based modeling can inform recovery strategies and behavioral design [20]; similarly, gamified experience design has been shown to enhance participation, flow, and perceived value in visitor experiences [21]. These findings support the notion that gamified platforms make self-guided exploration both attractive and effective.
Moreover, gamification plays a strategic role within smart-city innovation. Reviews highlight that gamification can embed sustainability, education, and civic engagement into urban tourism systems [22], while its integration into city-scale mobility applications has demonstrated potential in promoting environmentally friendly behaviors like transport modal shifts [23]. These insights illustrate how gamified self-guided tourism can align with broader smart-city objectives.
In this study, while gamification is not explicitly modeled, it underlines the feasibility of self-guided tourism as a sustainable alternative to group tours. By making independent exploration more appealing, it provides the behavioral preconditions for time-and-space distribution of visitors, reducing congestion and supporting sustainable urban tourism outcomes. Our approach complements recent studies involving multi-agent simulations of tourist movement in urban settings [24,25]. While in these studies the authors focused on modeled traffic dynamics in realistic layouts, our study emphasizes the behavioral contrast between guided and self-guided tours as a mechanism for congestion flattening and visitor dispersion.
In our previous IntechOpen chapter on this subject, we apply this concept to the urban tourism and educational domains, exploring how gamification and location-aware AR experiences support self-guided, sustainable, and educational exploration of cities [15]. The approach has been extended to broader crowdsensing scenarios applicable in smart cities, defining a class of applications that revolve around practical scenarios that involve the mobile app user based on geolocation and GIS [26]. Immersive experiences can further extend the level of engagement within real-world gamified scenarios, including AR (augmented reality) technology and serious game formats [27].
The integration of mobile technologies with real-world points of interest and digital storytelling has been the primary focus of LEPLACE GLOBAL, a tech startup dedicated to sustainable and immersive travel experiences [28]. The Leplace mobile platform allows local experts and businesses to create self-paced experiences that are not only engaging but also support smart-city objectives such as sustainability and decentralized visitor management.
2.3. Sustainability and Behavioral Shifts
This shift in paradigm for modern tourism is closely tied to broader developments in consumer behavior and travel psychology. Travelers increasingly prioritize flexibility, autonomy, and culturally immersive experiences over passive consumption of standardized packages. The authors of [29] emphasize that this move toward independent tourism is not just a preference but a reflection of evolving values centered on authenticity and emotional connection.
In terms of sustainable behavior, previous research work provided a foundational framework on slow travel, advocating for tourism that is low-impact, locally immersive, and environmentally aware [13].
The study involved a number of participants and interviews analyzed to identify the interpretation of slow travel from multiple perspectives, as follows: environmental discourse (personal comfort vs. carbon footprint), time (alternative to the fast-paced lifestyle), and engagement with people and places (the level of detail and sense of mastery achieved through slow travel). Within the proposed framework, the mode of travel often involves walking, cycling, and public transportation, ultimately reducing emissions and fostering more meaningful interactions with people and places. Their work outlines key dimensions of slow travel, encompassing both transit and destination aspects, as follows: slow-paced (taking the time to explore the places), experience-driven (shared social experience), local resources (e.g., using local transport), and environmental consciousness (prioritizing lower distances and longer stays).
From the technology and optimization standpoint, the authors of [30] introduce an advanced algorithm that recommends personalized tour itineraries considering user preferences, points of interest (POIs), and the demands of augmented reality (AR) and other resource-heavy digital applications. The solution considers multi-access edge computing (MEC) and mobile networks to enhance the delivery of immersive digital experiences at tourist sites. The results demonstrate that personalized experiences significantly improve user satisfaction, showing up to 40% gains in user experience and 11% improvement in network allocation efficiency over existing solutions.
The findings align directly with the principles of self-guided tourism, particularly when enhanced by digital tools that empower travelers to explore at their own pace, avoiding peak times and reducing carbon emissions. Therefore, the synergy between technological empowerment and behavioral change represents a significant point of convergence in the literature.
3. Methodology
The main research objective of this study was to explore the extent to which self-guided digital tours can reduce peak congestion while maintaining visitor engagement, as well as to examine how these effects change under different demand and operational conditions. Several research questions were defined as follows:
- RQ1: How do self-guided digital tours compare with traditional guided tours in terms of peak and average congestion over the day?
- RQ2: Do self-guided tours maintain comparable itinerary completion relative to guided tours despite greater flexibility?
- RQ3: How do total tourist volume, group size, and waiting times influence congestion for guided and self-guided formats?
This is an exploratory simulation study; it does not claim empirical impact assessment. The results provide conceptual evidence and directional insights to inform future calibration with real-world visitor data and more realistic urban networks. Several hypotheses were formulated from the beginning and were directly evaluated in the simulation model, as follows:
- H1. Congestion Flattening: self-guided tours produce lower peak congestion than guided tours under comparable demand;
- H2. Level of Engagement: self-guided tours achieve completion rates comparable to guided tours;
- H3. Scalability & Robustness: as demand or waiting times increase, congestion grows more slowly under self-guided formats than under guided formats.
To evaluate the real-world implications of the self-guided tourism model, we implemented a simulation-based case study using an agent-based model of urban tourism behavior.
The model compares guided and self-guided tourist groups in terms of congestion at points of interest (POIs), route flexibility, and tour completion rates. The simulation includes traveler types (guided tourists, following a predefined path, vs. independent travelers, selecting routes dynamically based on digital recommendations), and crowd dispersion metrics (measuring congestion at high-traffic areas and alternative site engagement).
This computational approach aims to measure and compare the effects of various parameters, such as group size, start time intervals, itinerary length, and waiting times, all of which have been shown to influence tourism system performance and environmental impact [31].
The overall context is driven by the Leplace self-guided exploration platform v1.5.57, which provides an example of how these technologies can be integrated into the tourism ecosystem. The platform allows travelers to discover urban destinations using gamified narratives, interactive POIs, and augmented content. By encouraging walking, promoting local points of interest, and providing flexible itineraries, the platform implicitly supports sustainable tourism goals, such as congestion reduction in urban areas, cultural education, and decentralized visitor flows [9].
3.1. System Architecture
The Leplace platform provides the foundation for the digital self-guided tour model explored in this study, combining augmented reality, interactive mapping, gamification, and dynamic content delivery into a comprehensive format. While there are several other self-guided tourism platforms currently on the market worldwide, we considered it as a testbed for our proposed simulation and not directly tied to the particular implementation. The architecture is highly flexible and extensible, allowing creators to design and deploy self-guided experiences that are both location-aware and responsive to user behavior [28]. The core components of the Leplace platform include the following:
- Mobile application: the user-facing mobile app is GPS-enabled and delivers location-based content such as dynamic markers, quiz questions, or photo challenges, and tracks progression, level of engagement, and traveling time;
- Gamification layer: points, rewards, and badges are embedded into the experience to motivate exploration;
- Creator platform: A web-based interface that enables local experts, educators, or tourism agencies to create custom tours based on storytelling. The engine supports waypoint definition, multimedia content, and interactive elements;
- Analytics dashboard: aggregates anonymous user progress and interaction data, which can provide city-level sustainability performance metrics;
- Smart routing module: in the simulation, this module is modeled by rules, such as skipping POIs, route adaptation, and start-time variability, and reflects the flexibility of the self-guided format in real-world conditions.
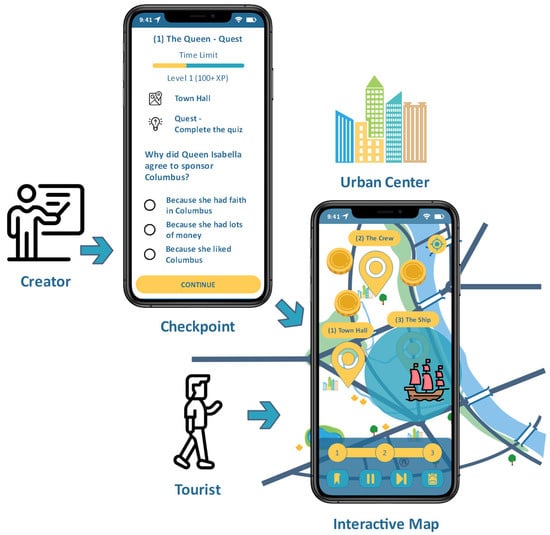
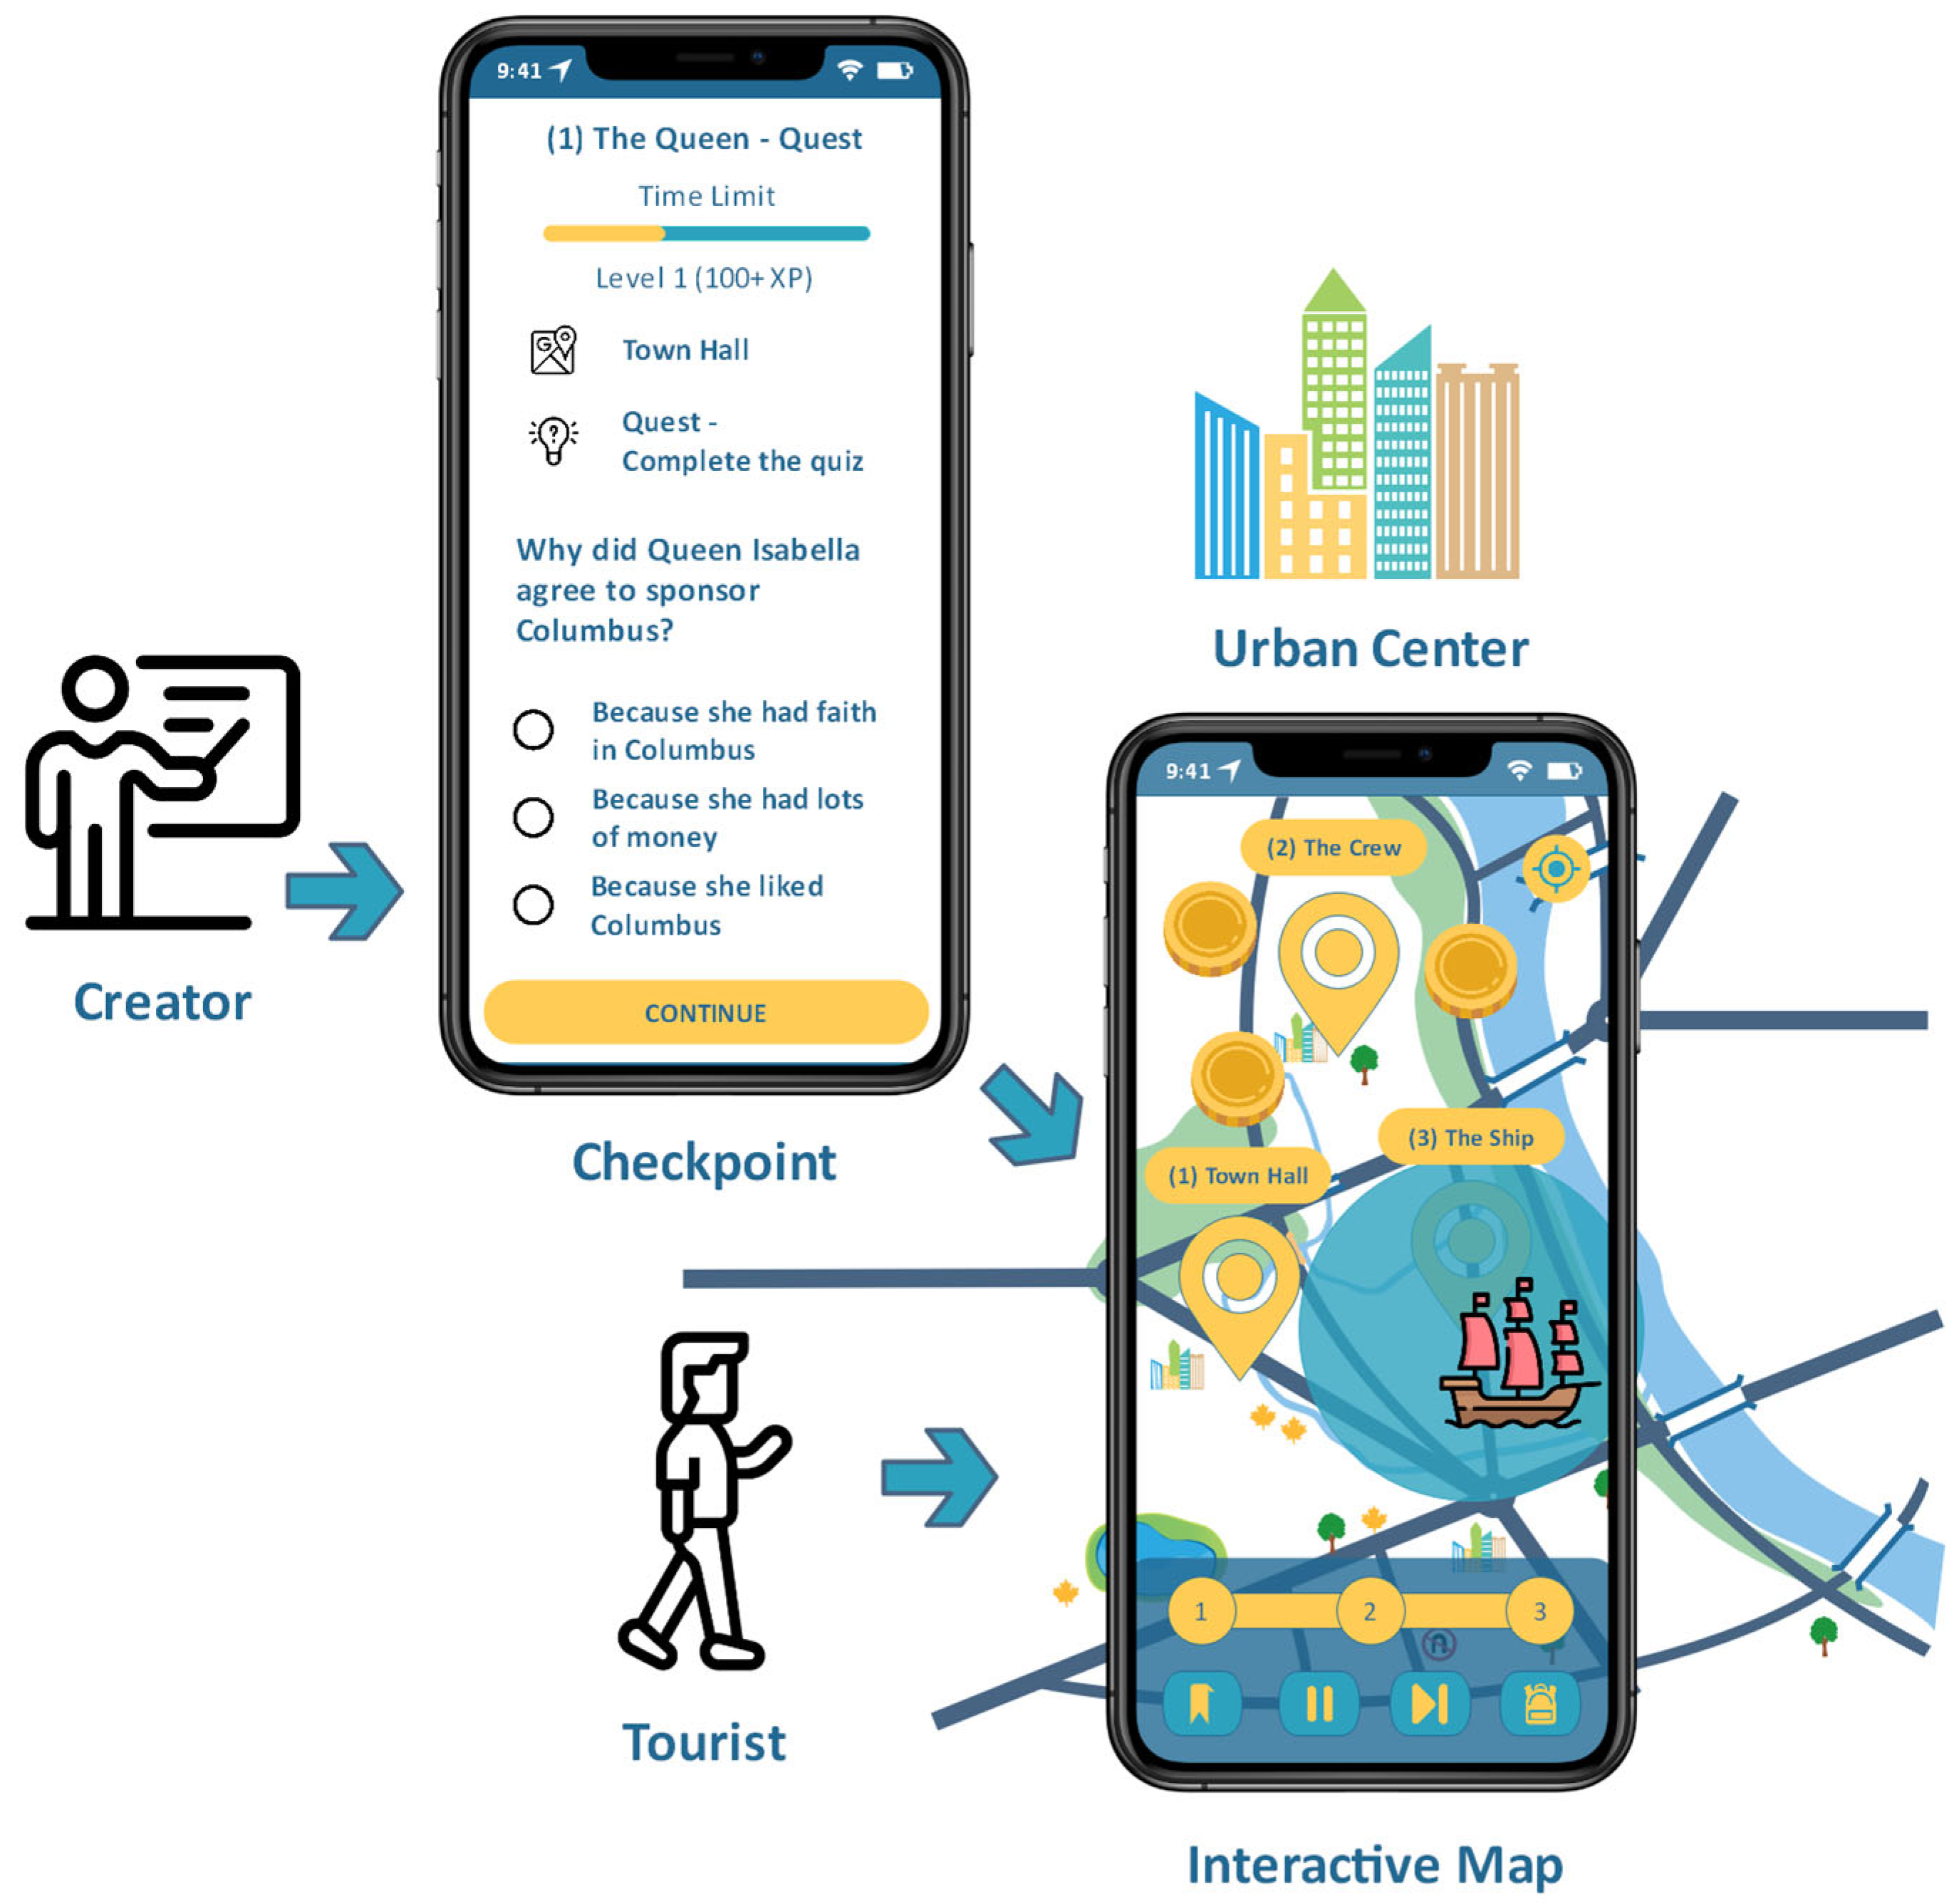
The conceptual workflow is depicted in Figure 1, showing the main components and user interactions. The creator designs the self-guided tour including the locations (i.e., checkpoints) and interactive content (e.g., quizzes and collectible items), and the app users (i.e., self-guided tourists) can experience the self-guided tour at their own pace.
Figure 1.
Leplace mobile platform conceptual workflow.
This architecture was abstracted into the simulation design to evaluate how digital features, such as asynchronous starts, optional stops, and group size variability, impact urban congestion and sustainability outcomes.
3.2. Simulation Model
To formalize the context of the simulation model with regard to urban sustainability metrics, we implemented an agent-based simulation model that captures the movement and behavior of tourist groups (guided or self-guided) within a bounded urban environment populated with fixed POIs (points of interest). The objective was to assess how different types of tours (guided vs. self-guided) affect congestion, tour completion, and flow distribution at POIs.
The simulation takes place in a 100 × 100 grid, where each grid cell represents a 10 m unit in a real-world environment. Within this space, eight POIs are randomly placed at the beginning of each run. These represent cultural or historical locations that tourists visit as part of their itinerary.
The agents in the model represent tourist groups. Each group is either classified as guided or self-guided and is initialized with the following key attributes: guided or self-guided type, start time (fixed time slots for guided and randomized for self-guided), group size (larger for guided and smaller for self-guided), shared itinerary (a sequence of POIs to visit), skip probability (applicable to self-guided groups), and travel status (waiting, traveling, or completed).
Each group progresses through the itinerary, waiting at each POI for a random amount of time and transitioning to the next POI based on the tour structure and behavior logic (e.g., skipping is more common with self-guided groups).
Let the urban environment be defined as a discrete 2D spatial grid, , with dimensions of 100 × 100, where each cell, , represents a 10 m square in real-world space. A set of points of interest is randomly distributed across the grid, as follows:
Let denote the set of tourist agent groups, where each agent, , is defined as a tuple, as follows:
With the following definitions:
- {guided, self-guided};
- = start time;
- = group size;
- = ordered itinerary;
- = visited itinerary;
- = POI skip probability;
- = current travel status.
Each agent traverses the environment according to a decision function, , that updates its location and status over discrete time steps, as follows:
At each time step, , we define congestion, , as the total number of agents located at any POI, as follows:
We also track the following:
- = congestion by guided groups;
- = congestion by self-guided groups;
- = completion ratio for each agent;
- = average completion rate over all agents.
The simulation environment was implemented using the Python-based Mesa agent-based modeling framework v3.1.4 [32] to replicate and evaluate the behavior of tourists in an urban environment.
Using Mesa’s built-in DataCollector, the model records the following: total congestion (the total number of travelers waiting at POIs at each time step), guided vs. self-guided congestion (categorized congestion values for each type), completion rate (percentage of groups that completed the itinerary), and POI-level congestion (collected to understand the spatial distribution of crowding).
To validate this simplified conceptual model, we further extended the baseline grid model by introducing POI capacity and FIFO queueing. At each minute, groups that arrive at a POI are admitted based on the capacity; otherwise, they join an external queue. The congestion metric includes both the number of visitors inside and those queued across POIs. A street-network routing model is further added to increase the accuracy of the simulation and validate the results with a more realistic setup.
The simulation produces the following two main outputs: time-series charts of guided and self-guided congestion, along with completion rates, and sensitivity charts showing how guided group size affects total congestion.
This structured environment allows for dynamic comparison of tour strategies, revealing insights into the spatial and temporal implications of personalized, self-guided tourism.
3.3. Materials and Methods
This study utilizes an agent-based simulation framework to model and evaluate the impact of self-guided tourism on urban sustainability indicators. The simulation was implemented using the open-source Mesa library in Python and is publicly available in the mesa_tourism folder in our research repository, available at the following: https://github.com/alexp25/crowdsensing (accessed on 8 September 2025).
The codebase allows for configurable group sizes, starting schedules, wait times, and behavioral rules for guided vs. self-guided tourist groups and consists of the following components:
- agent.py: Defines the TouristGroup agent class, including behavior, movement, waiting, and completion logic;
- model.py: Implements the CityModel, initializes the environment, distributes agents, and tracks metrics;
- script.py: The main simulation script that runs the model (run_once—single run simulation, plotting the visual snapshot of agent distribution over time, and run_multi_eval—multi-run evaluation, which changes the parameters and evaluating their effects), then plots real-time congestion and completion rates, and saves plots and heatmaps in the output folder.
4. Results
The simulation evaluated the behavioral and spatial differences between guided and self-guided tourist groups under varying operational parameters. For the first evaluation scenario, a total number of 1000 tourists divided equally between guided and self-guided formats. Guided groups consisted of 20 participants, while self-guided groups averaged 2 individuals per group. The simulation spans 840 timesteps, representing a full travel day of 14 h in 1 min intervals. Guided tours start at fixed times (e.g., 10:00 and 14:00), while self-guided tourists start at distributed intervals (e.g., every 10 min between 08:00 and 20:00). The wait times at POIs are randomized between 10 and 15 min for guided groups and between 5 and 10 min for self-guided groups, while travel time between POIs is computed based on Euclidean distance and average walking speed. Metrics such as congestion levels, itinerary completion, and the influence of group size and waiting times were calculated across time steps using agent-based simulation techniques.
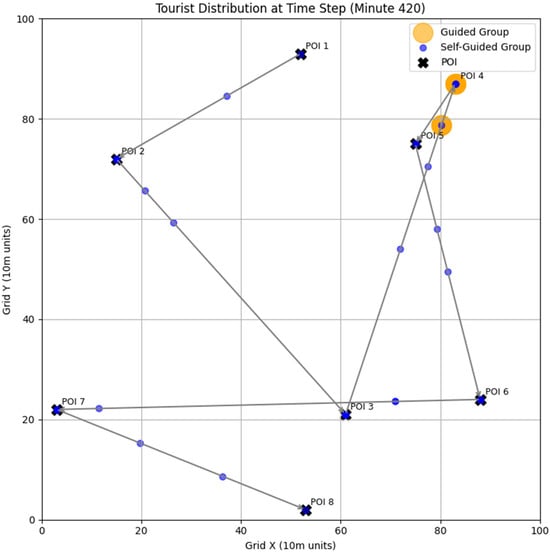
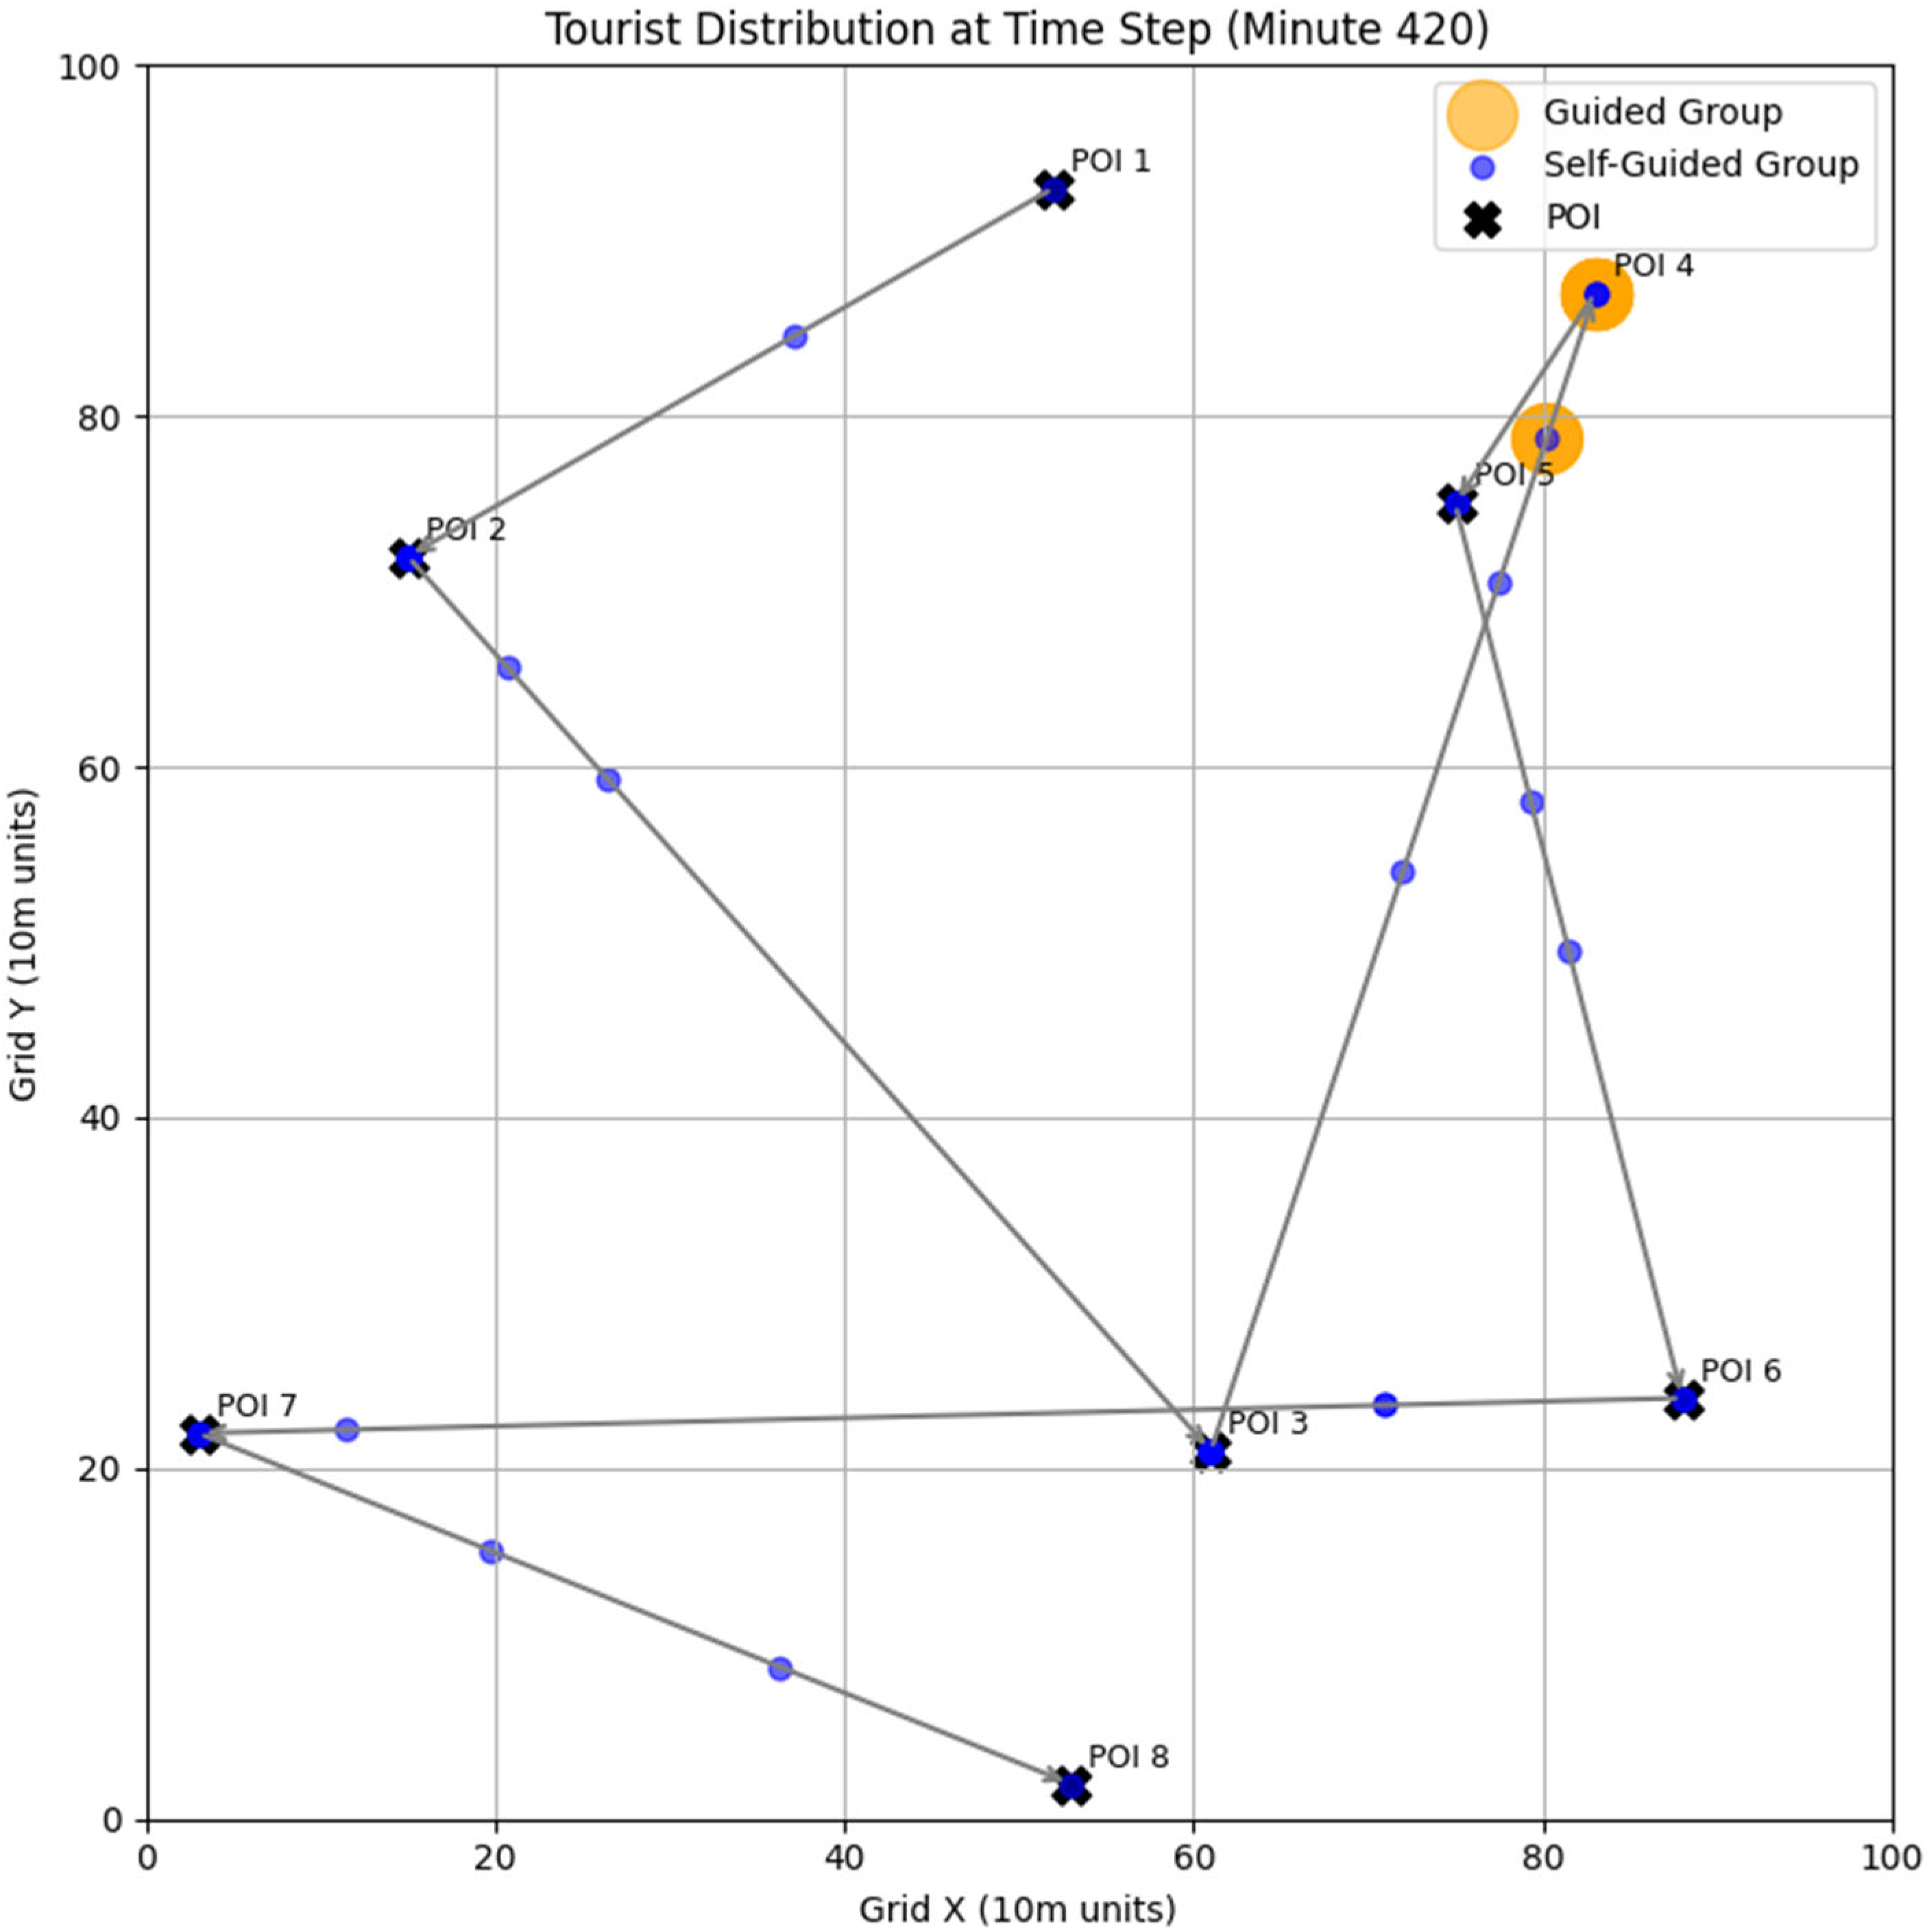
The scenario is illustrated in Figure 2, showing the location of each group on the map at the middle of the simulation interval. The self-guided groups are more scattered than the guided groups, showing a more distributed congestion along the route.
Figure 2.
Scenario definition with guided and self-guided groups’ distribution.
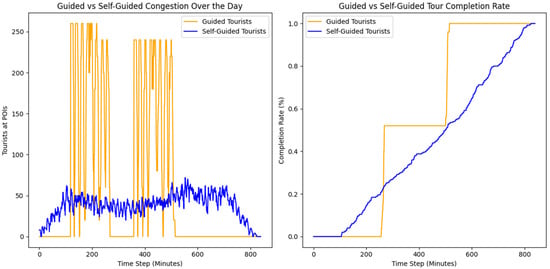
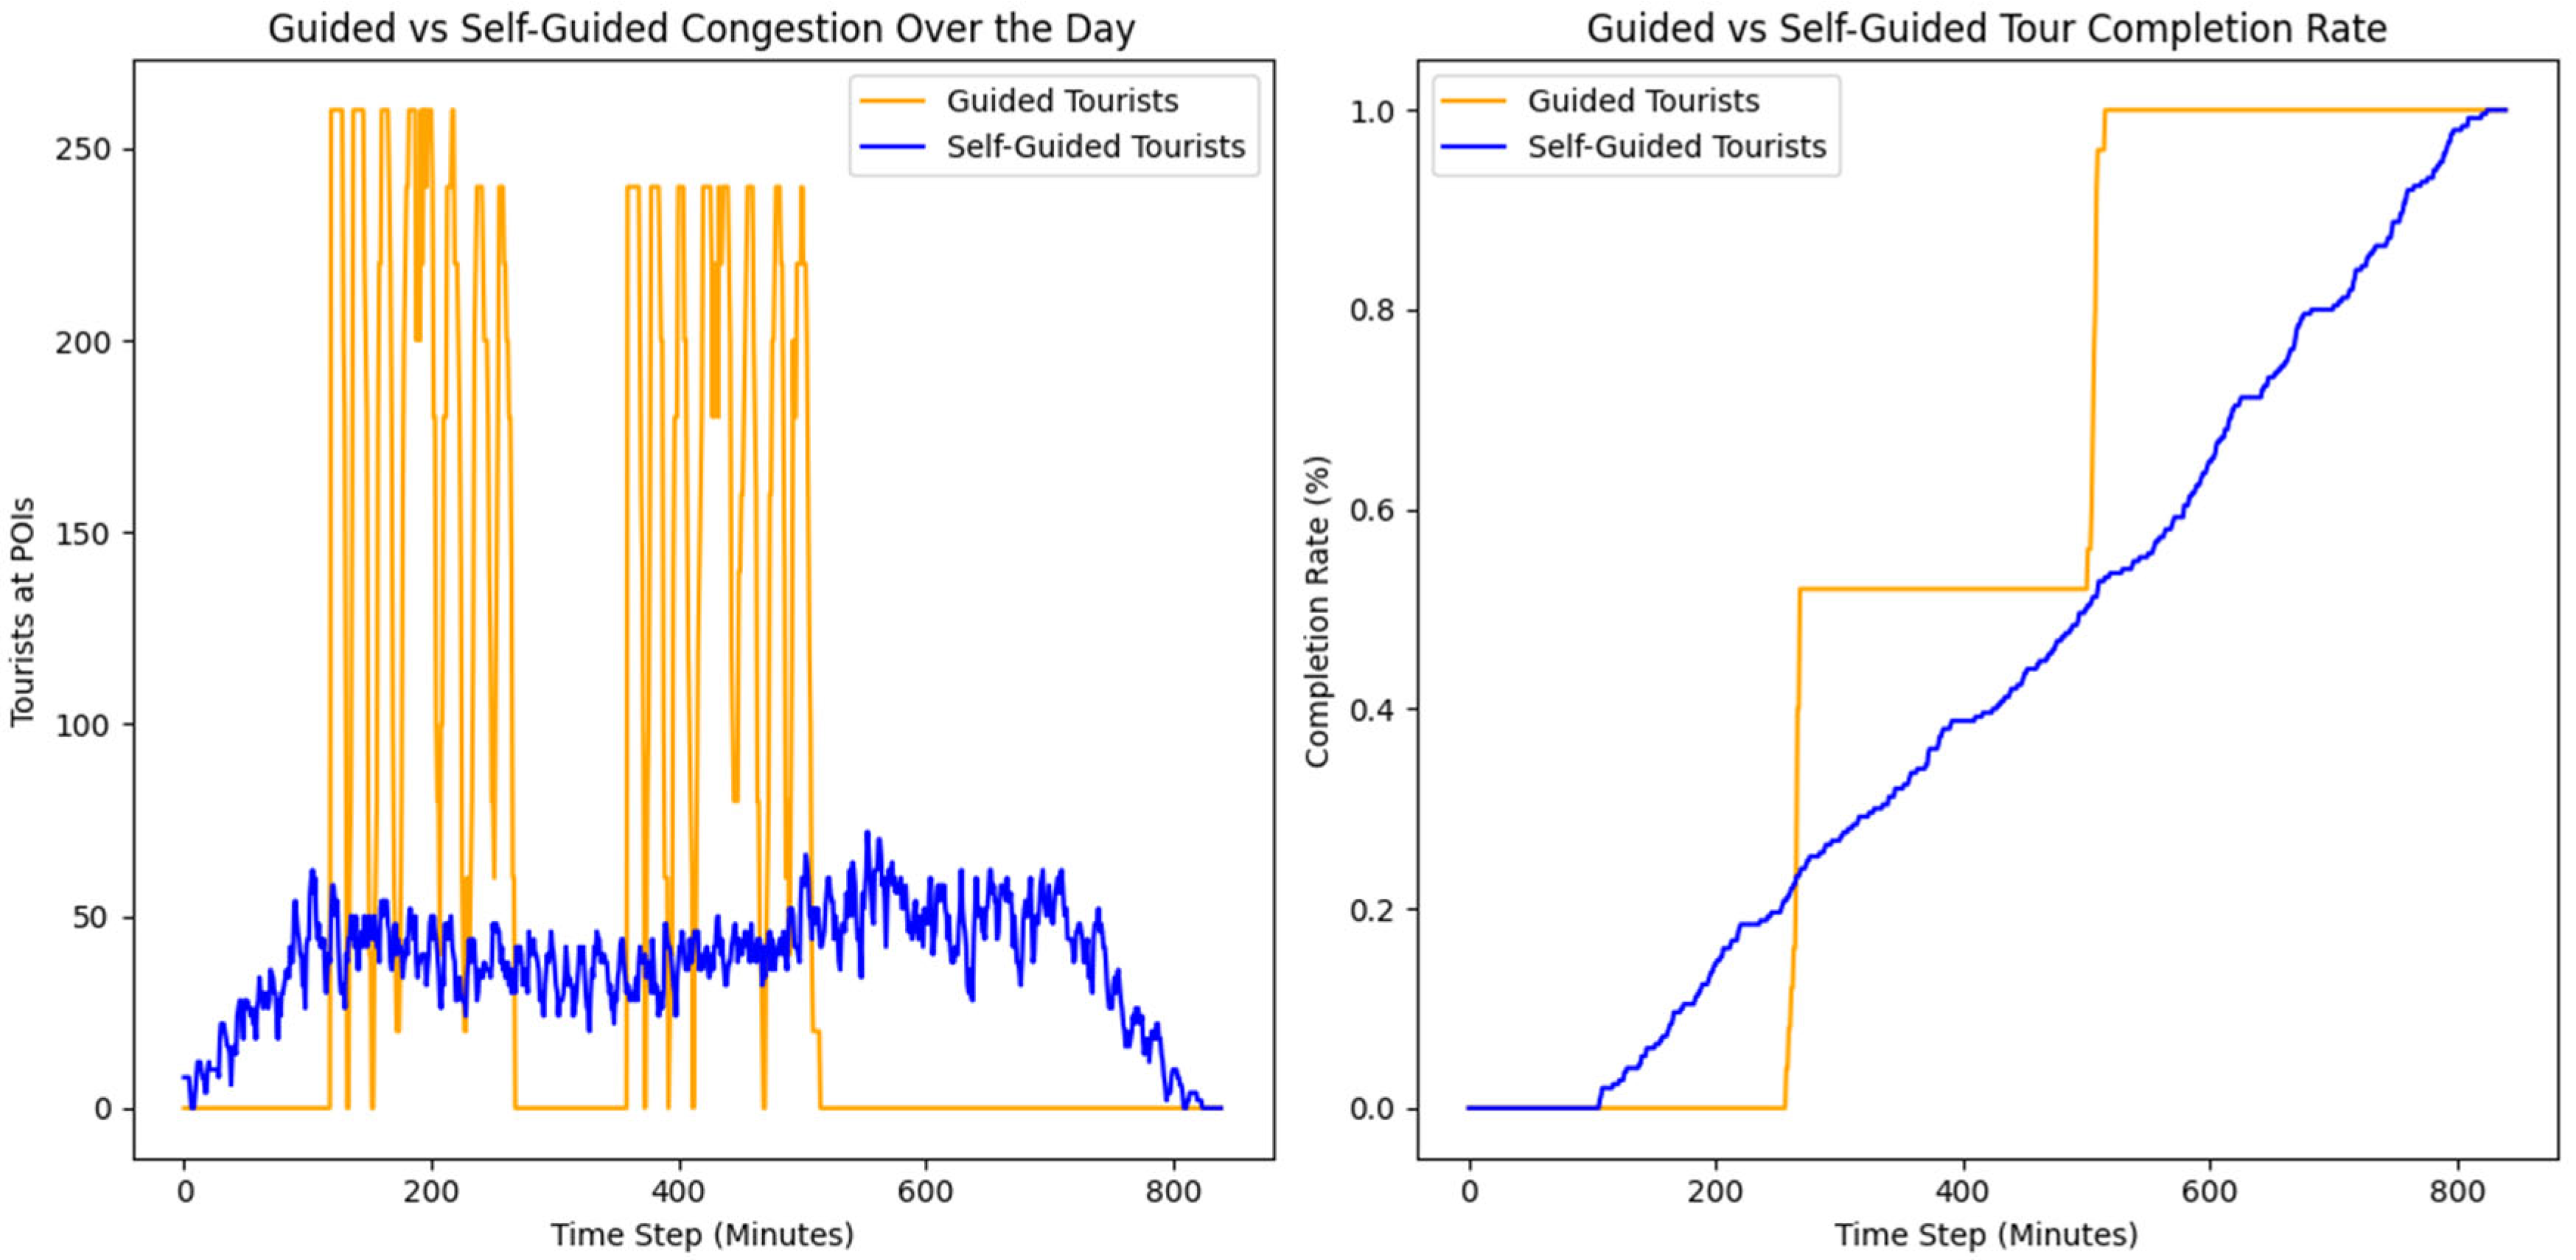
Figure 3 illustrates average congestion levels across all points of interest for guided versus self-guided tourists. Guided groups produced peak densities up to 2.5 times higher than self-guided groups under high-volume conditions. By contrast, self-guided tours dispersed arrivals more gradually, reducing congestion spikes and resulting in smoother flow distributions.
Figure 3.
Comparative analysis of guided and self-guided congestion.
As shown in Figure 3 (left), guided tours (shown in yellow) created noticeable congestion peaks due to their synchronous start times and fixed itineraries. At certain points in the day, guided POIs experienced spikes of up to 250 visitors, highlighting the drawbacks of time-batched tourism, which is inherent to guided groups.
In contrast, self-guided tours (shown in blue) exhibited a much more uniform distribution of visitors, reducing peak congestion to around 50 tourists at any given POI. This flattening of congestion curves demonstrates the effectiveness of asynchronous self-guided exploration in reducing strain on public infrastructure and spreading visitors more evenly across space and time, mitigating overcrowding of high-demand sites.
As illustrated in Figure 3 (right), the completion rate of self-guided tourists closely tracked that of guided tours. This suggests that increased itinerary flexibility does not negatively impact overall site engagement, indicating that user autonomy and engagement are not mutually exclusive.
To better understand which variables can influence overall tour sustainability and congestion, a sensitivity analysis was conducted using the simulation model. The key parameters varied included the following: total number of tourists (200–2000 in increments of 200), group sizes (5–50 in increments of 5), and waiting times at POIs (5–50 min in increments of 5). Each parameter was altered independently while keeping others fixed. The model was run five times per configuration, and the average values for congestion were recorded.
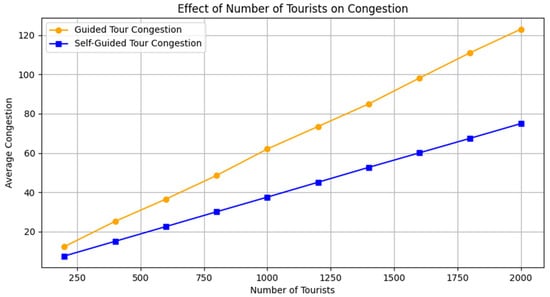
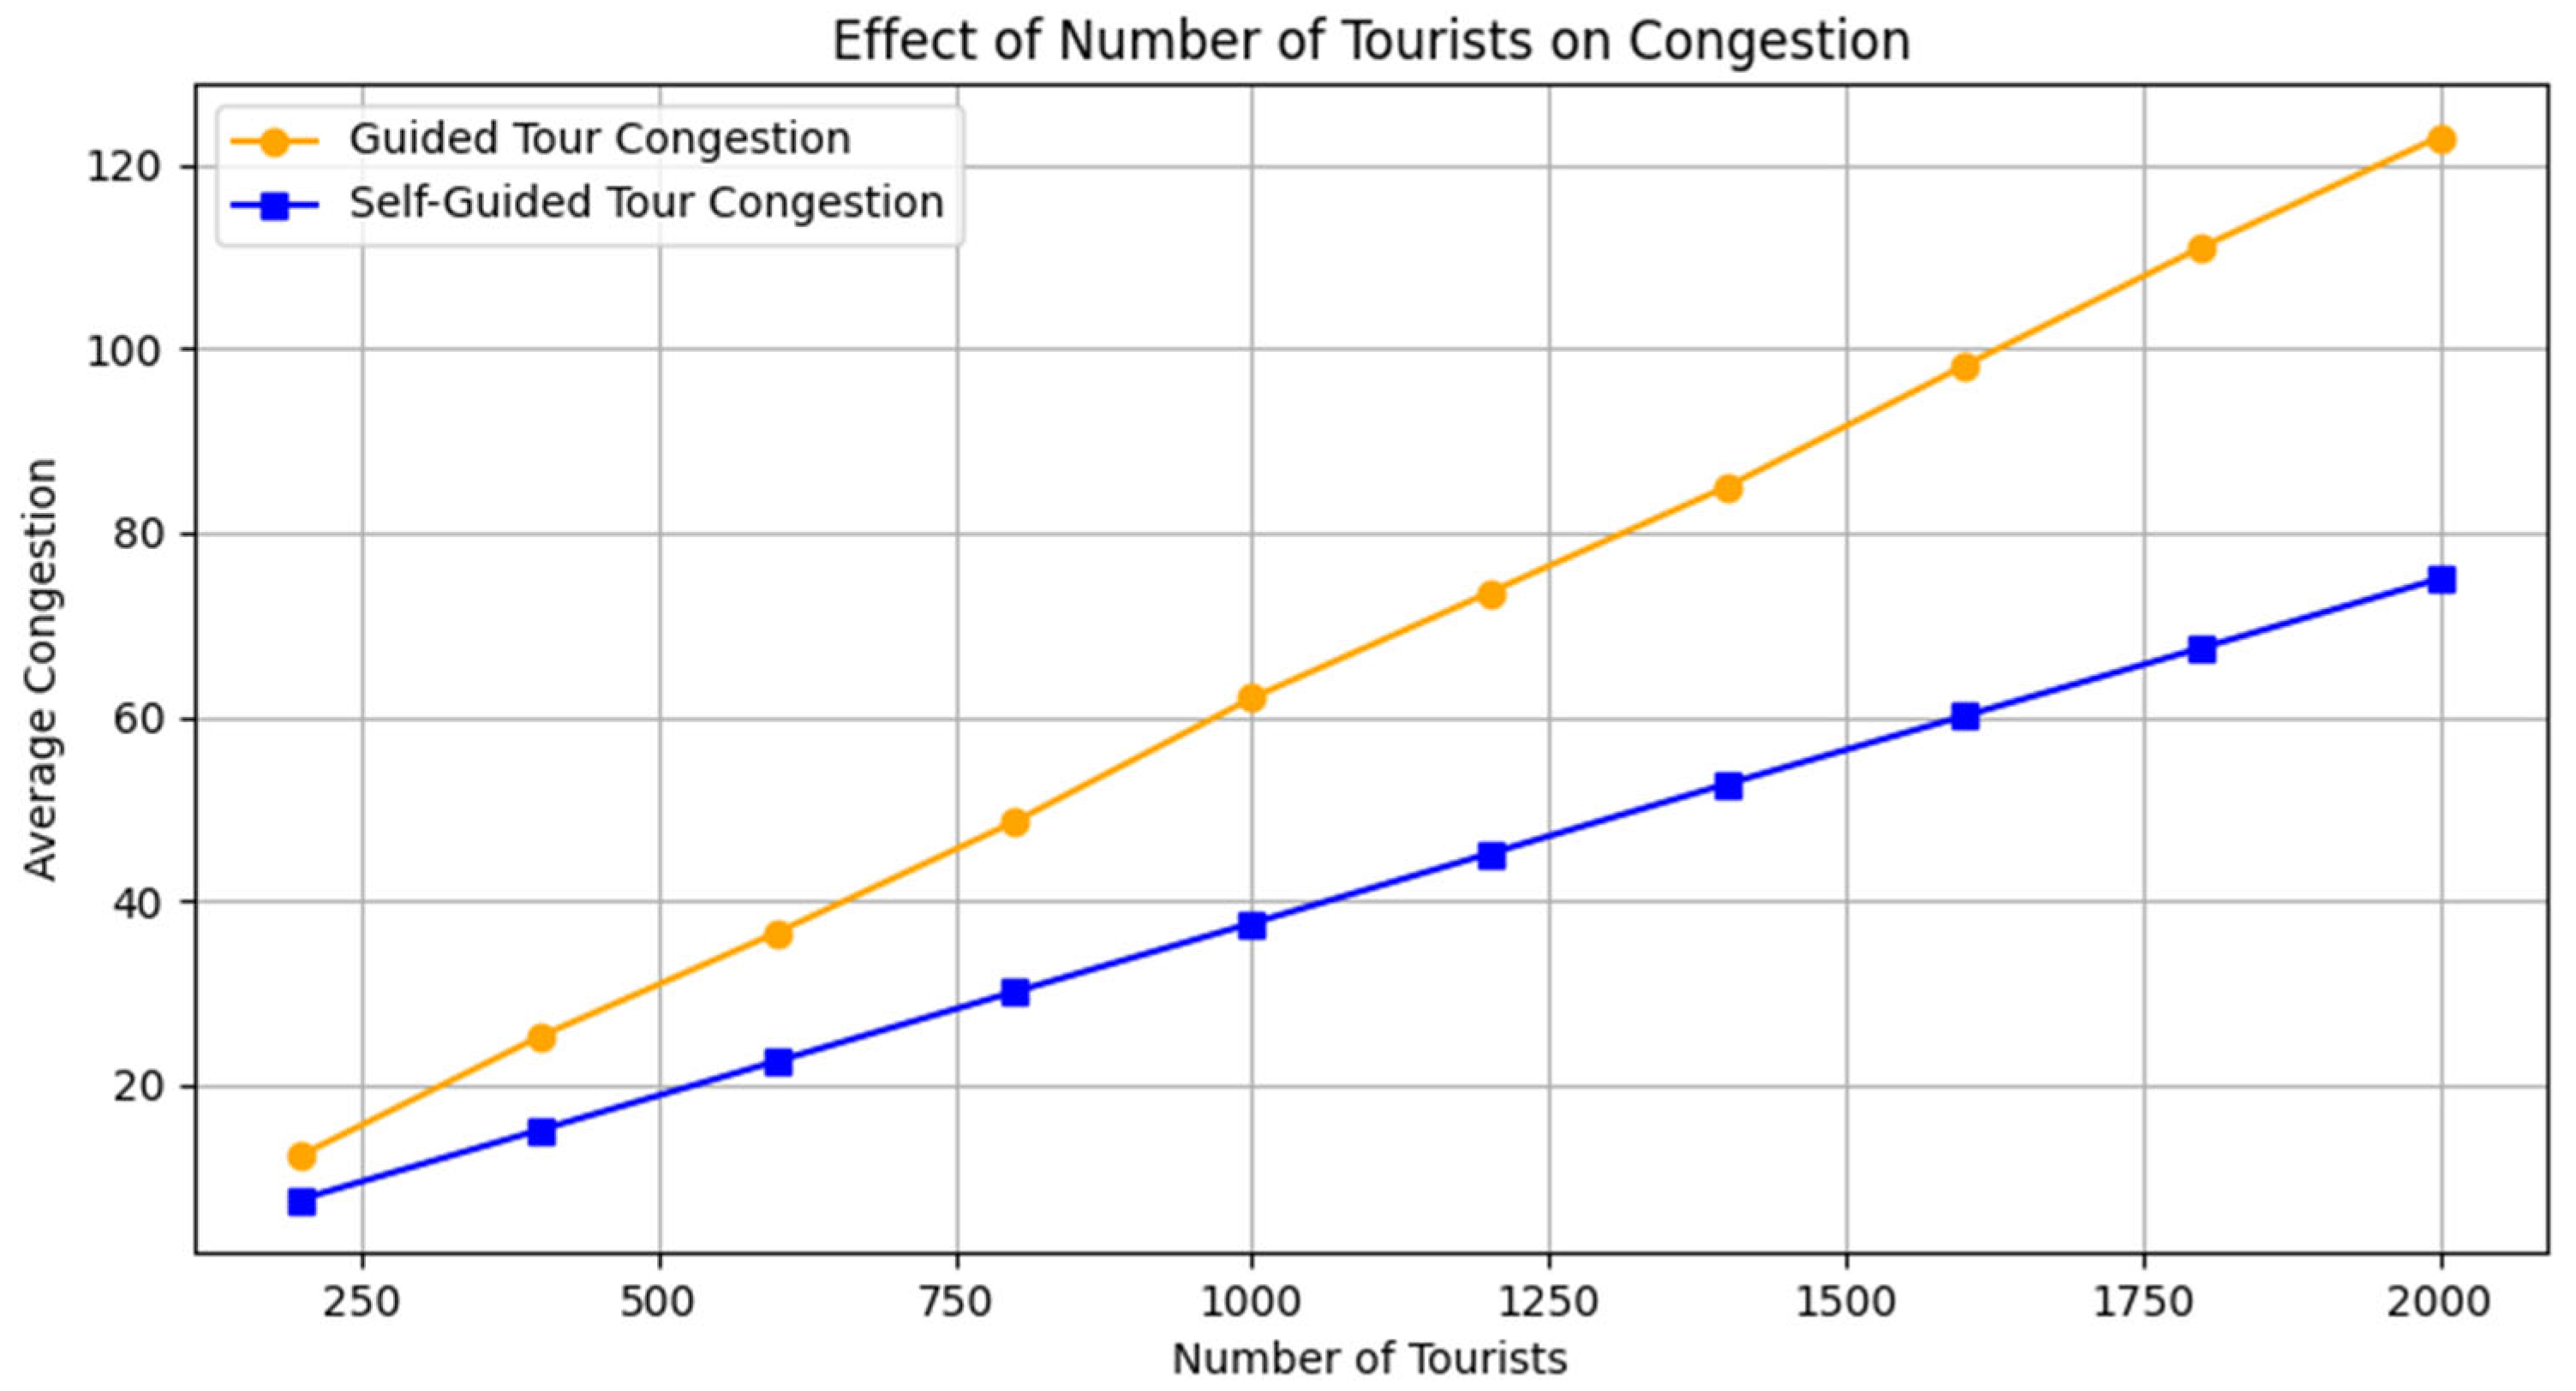
Figure 4 shows the effect of the total number of tourists on average congestion, considering fixed group sizes of 25 for guided groups and 2 for self-guided groups. In this scenario, both types of groups show a linear increase in congestion, while the slope is lower for self-guided groups, showing they are better suited for scaling in high-volume tourism contexts.
Figure 4.
Effect of total number of tourists on congestion.
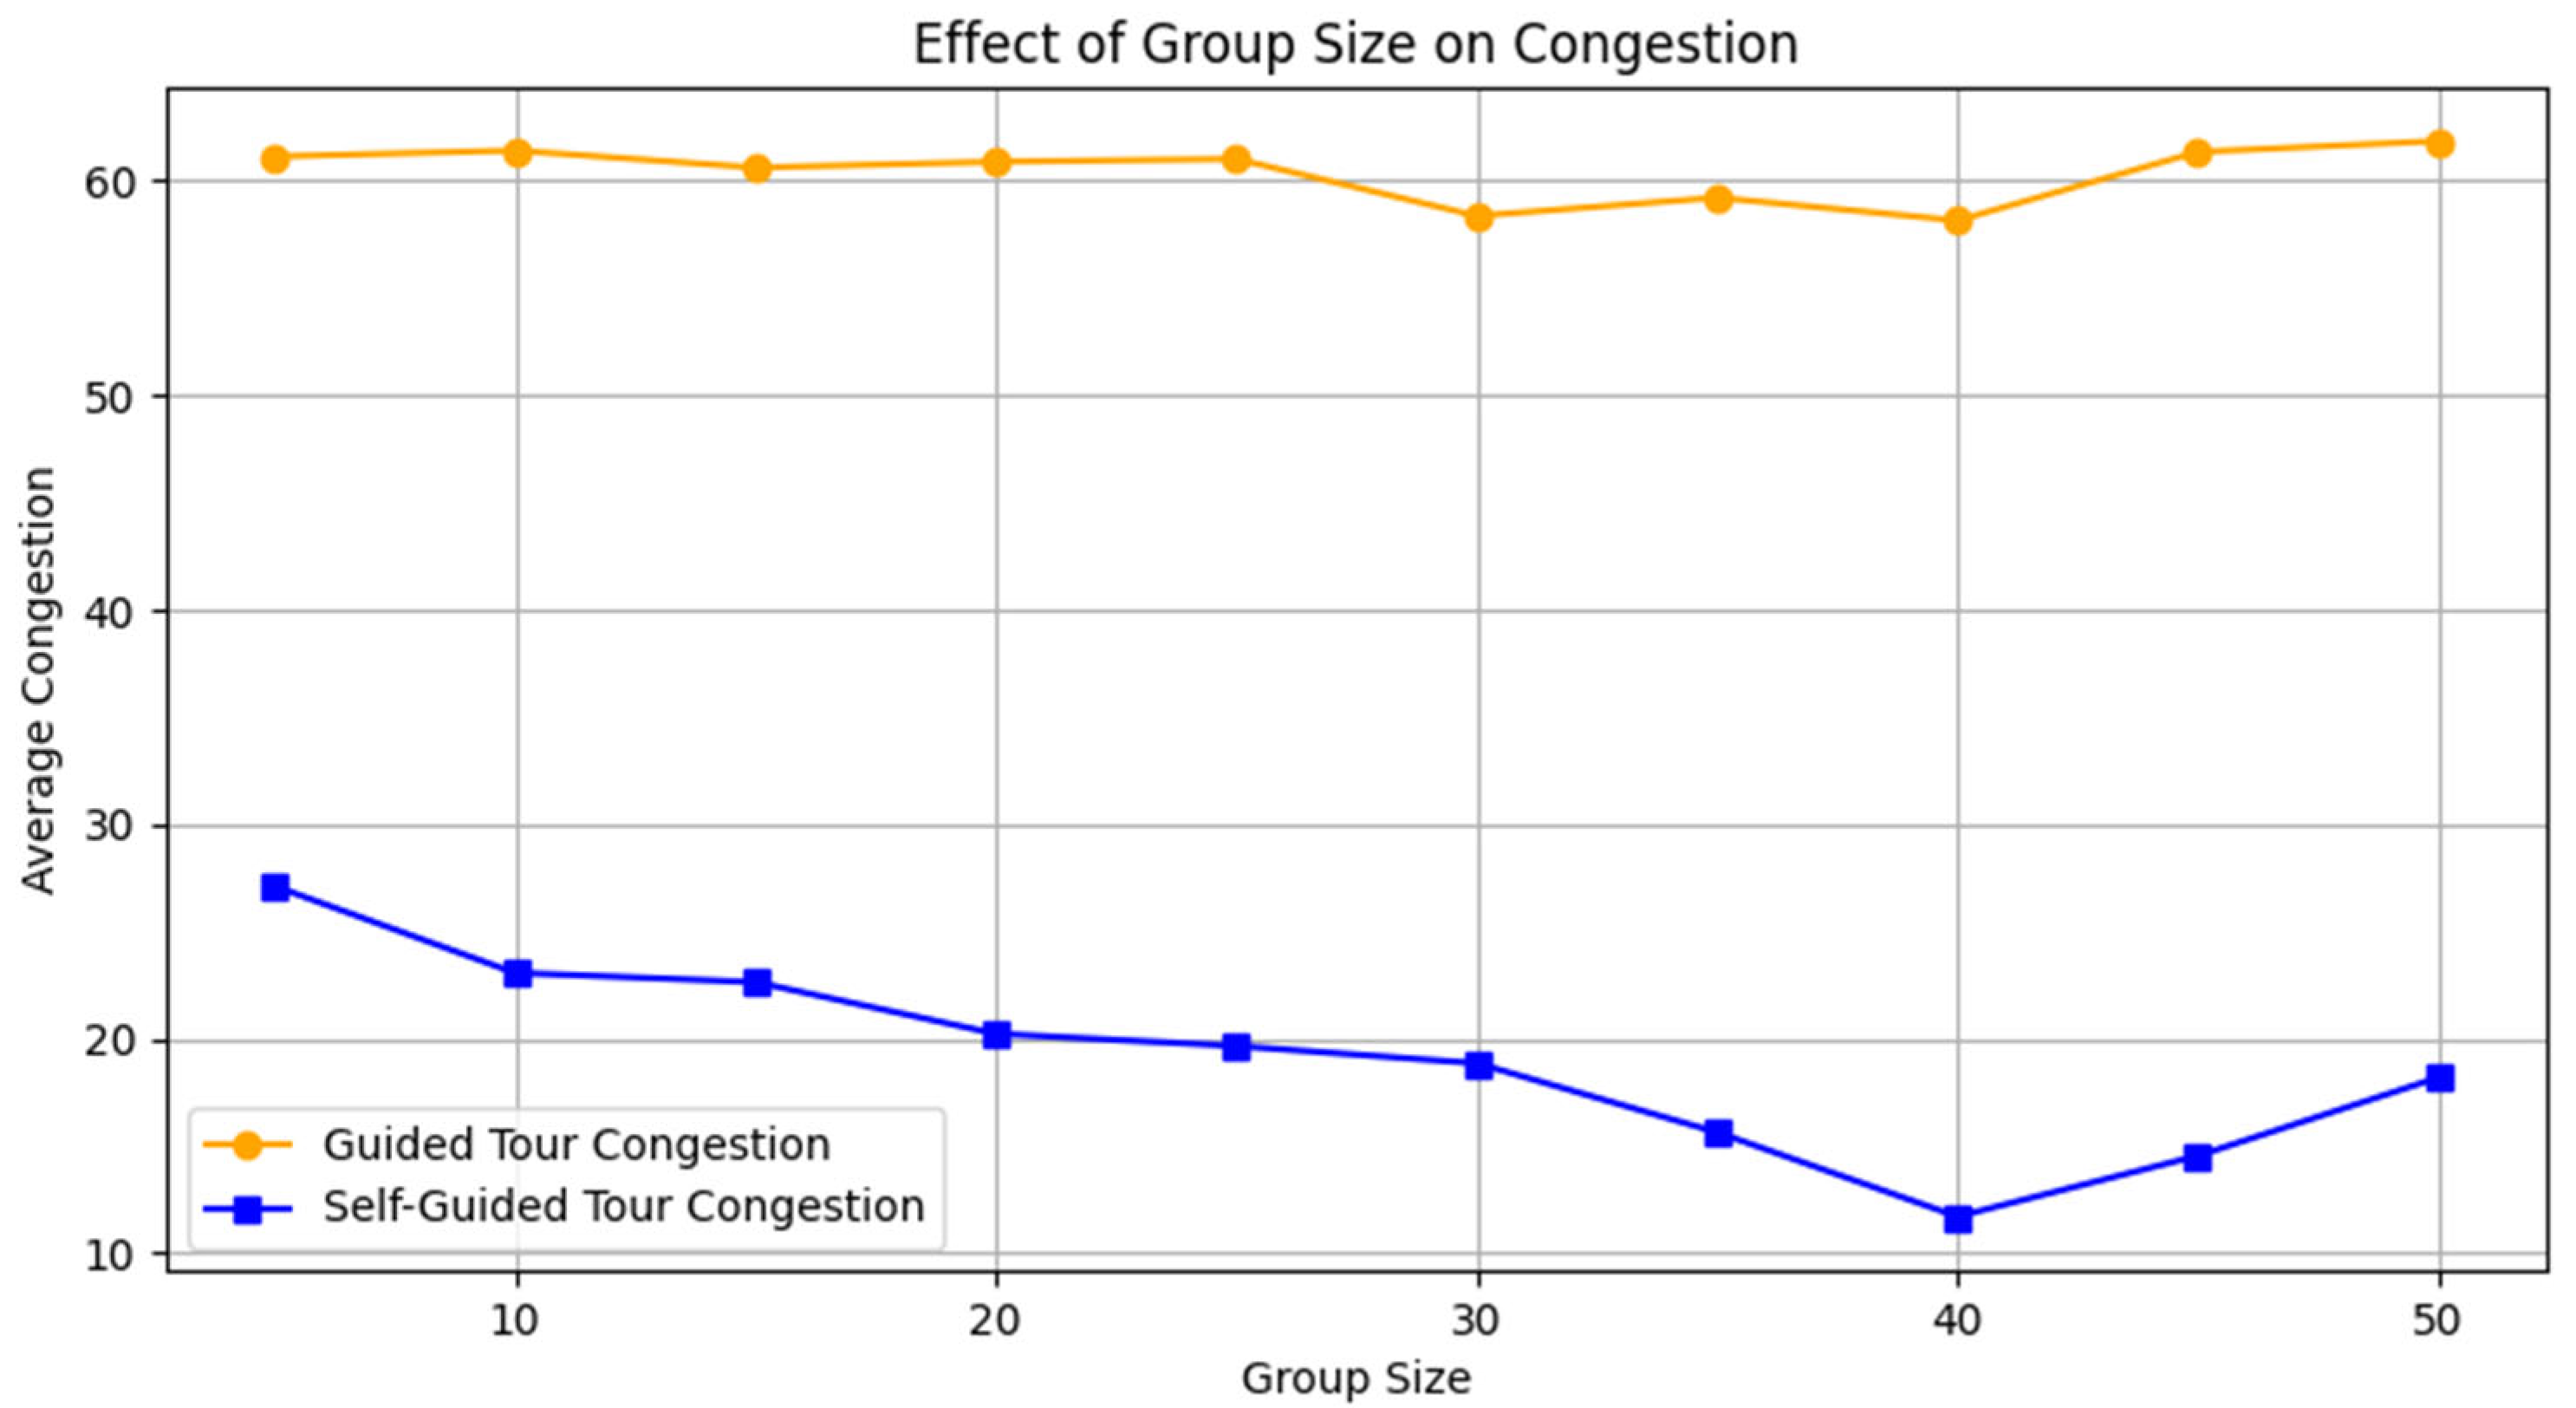
Figure 5 shows the effect of group size on average congestion, considering a fixed number of 1000 tourists. While guided groups show higher congestion values and are not significantly influenced by the group size, self-guided groups not only show more than 50% less congestion but the congestion also decreases with group size.
Figure 5.
Effect of group size on congestion.
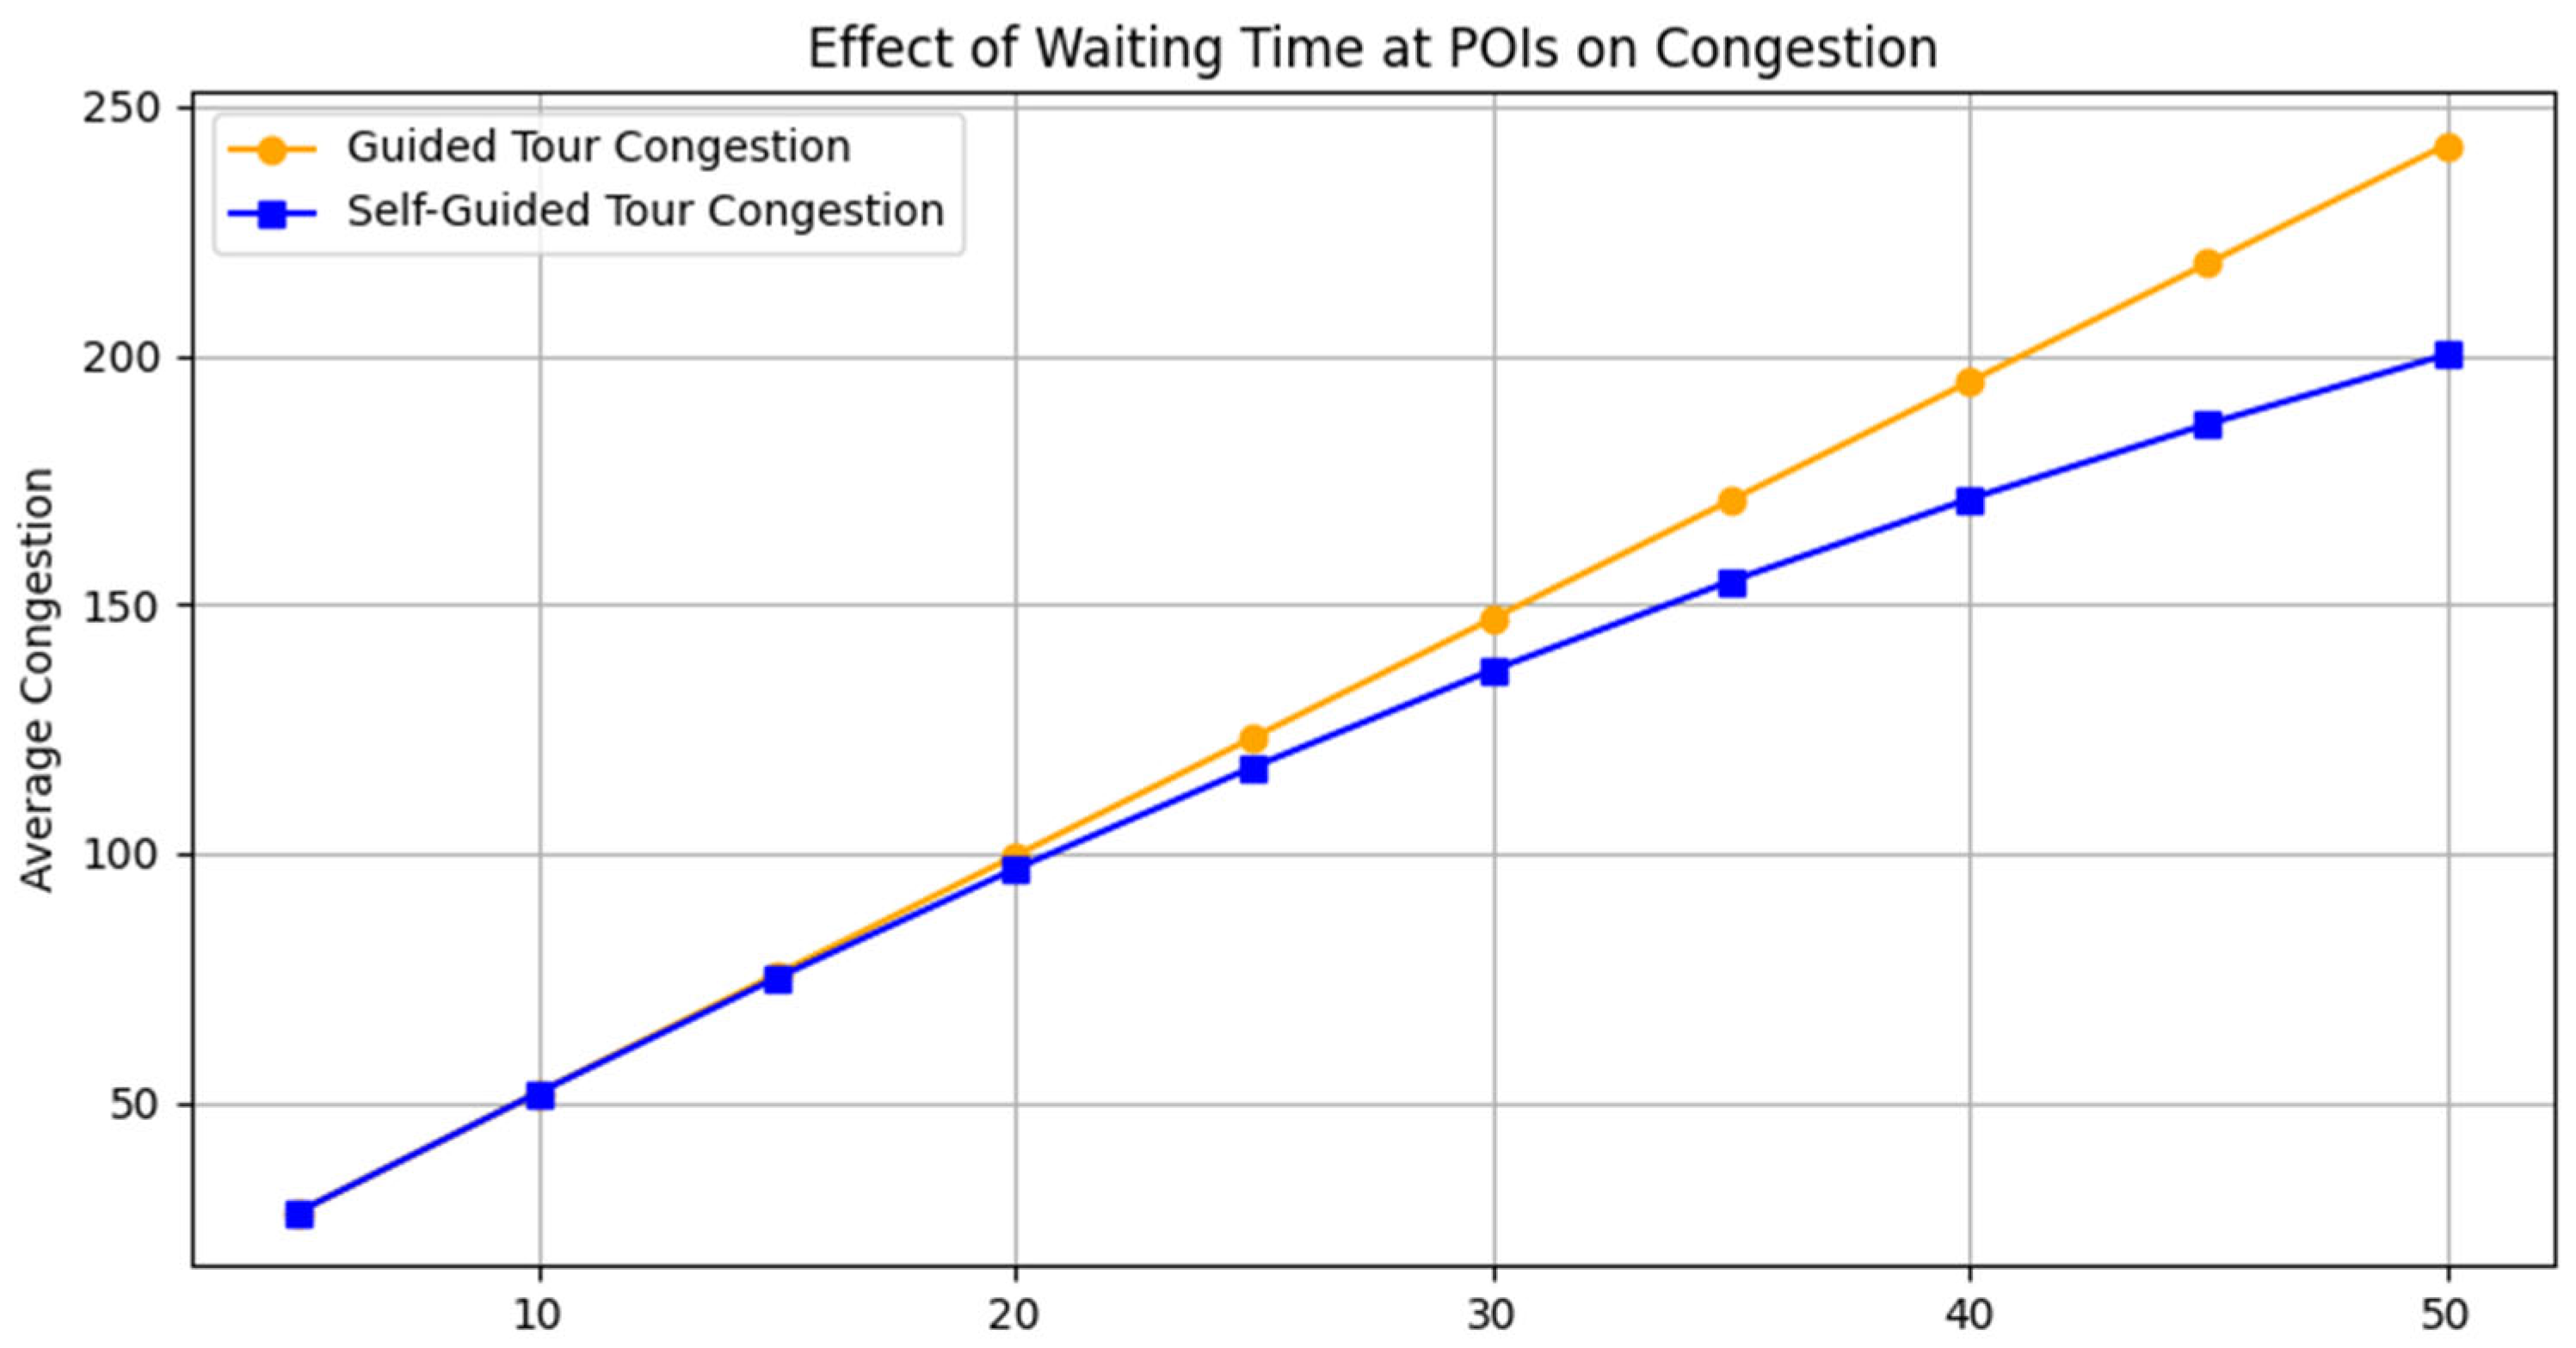
Figure 6 shows the effect of waiting times at POIs on average congestion, considering a fixed number of 1000 tourists, and fixed group sizes of 25 for guided groups and 2 for self-guided groups. While guided groups show a linear increase in congestion with waiting times, self-guided groups show a sublinear influence, indicating greater adaptability to high-volume tourism contexts.
Figure 6.
Effect of waiting times on congestion.
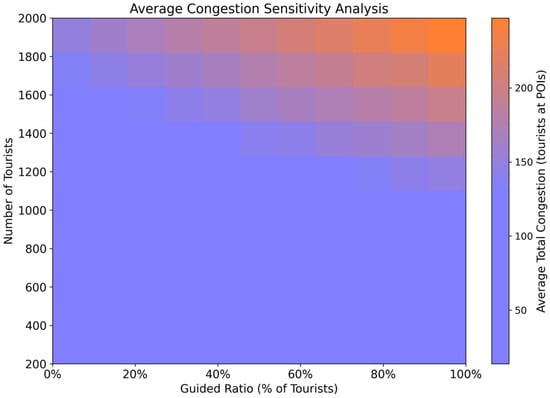
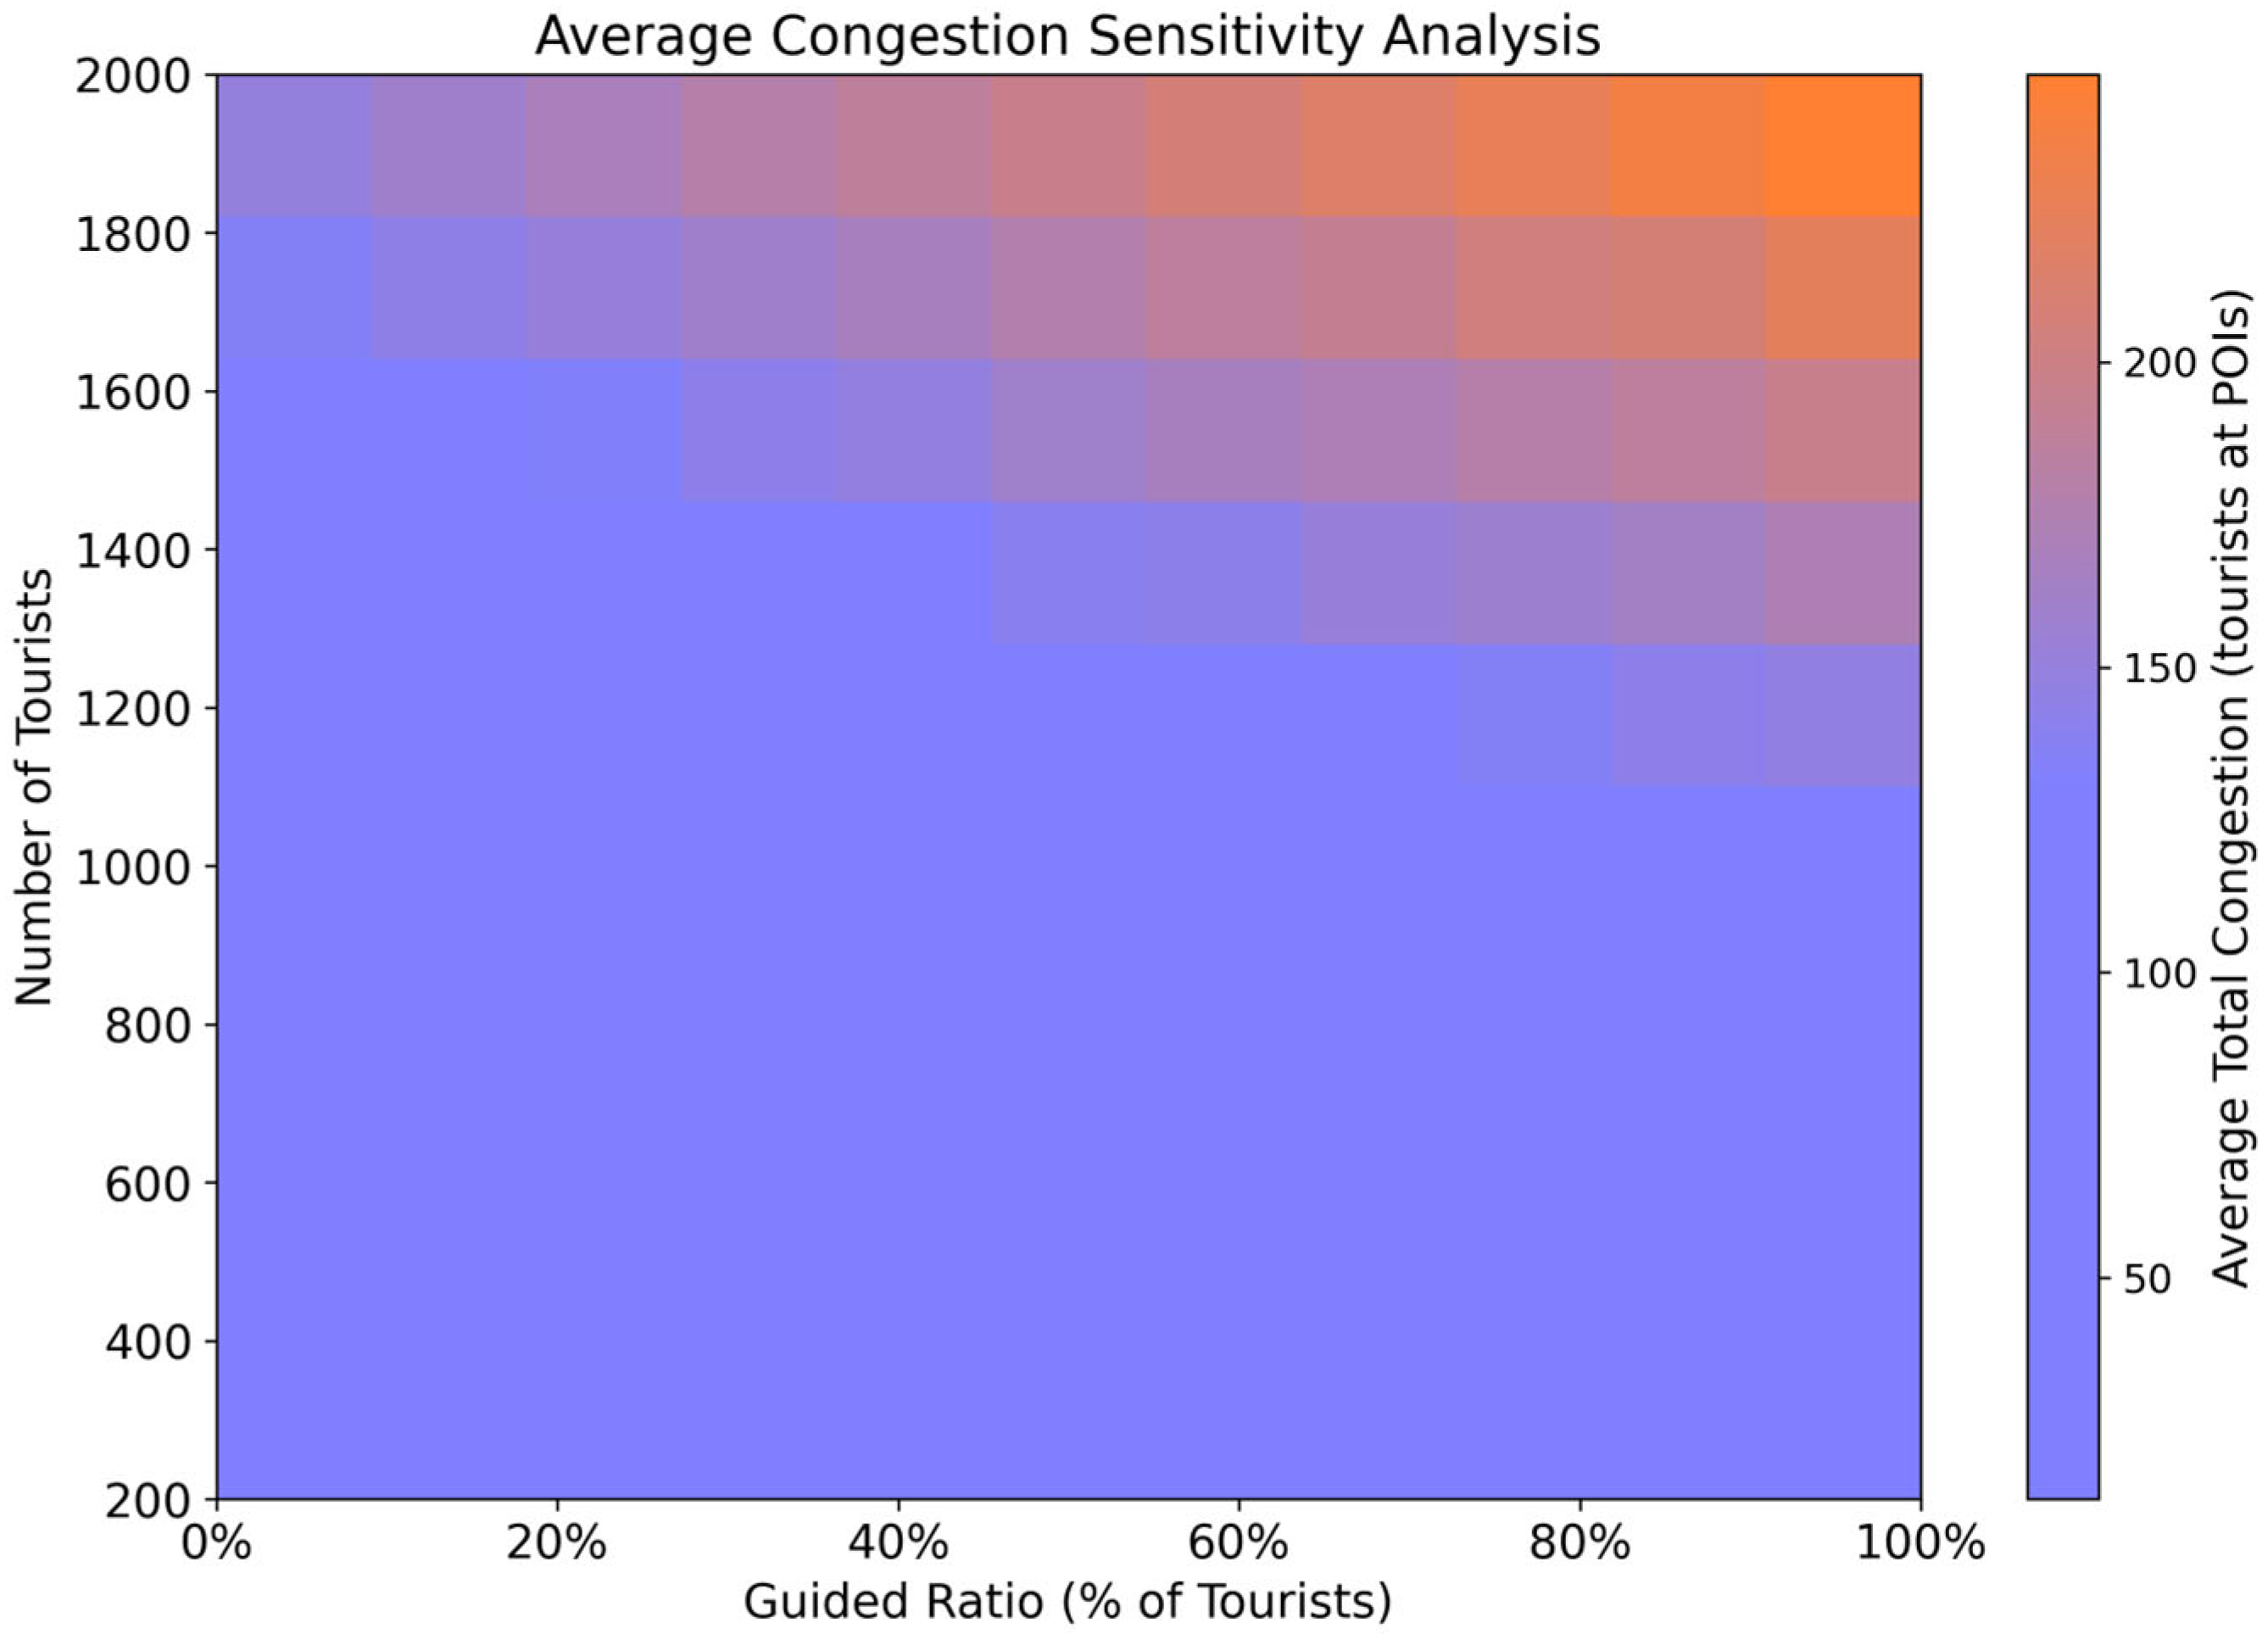
Figure 7 presents a sensitivity analysis in which the number of tourists (200–2000) and the distribution between guided and self-guided tours (0–100% guided) were varied systematically. The outcome measure is the average total congestion at points of interest (POIs) over the simulated time frame. The sensitivity analysis demonstrates that tourist distribution becomes a critical factor under high-demand conditions, where the synchronization of guided groups amplifies congestion effects. Conversely, greater reliance on self-guided tours mitigates peak congestion at scale by dispersing arrivals more evenly.
Figure 7.
Average congestion sensitivity analysis.
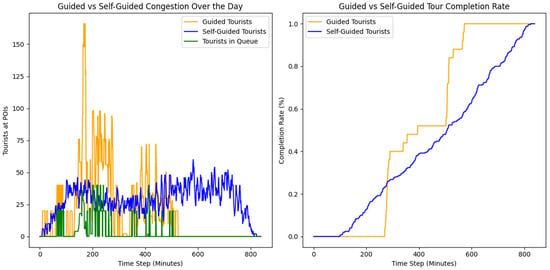
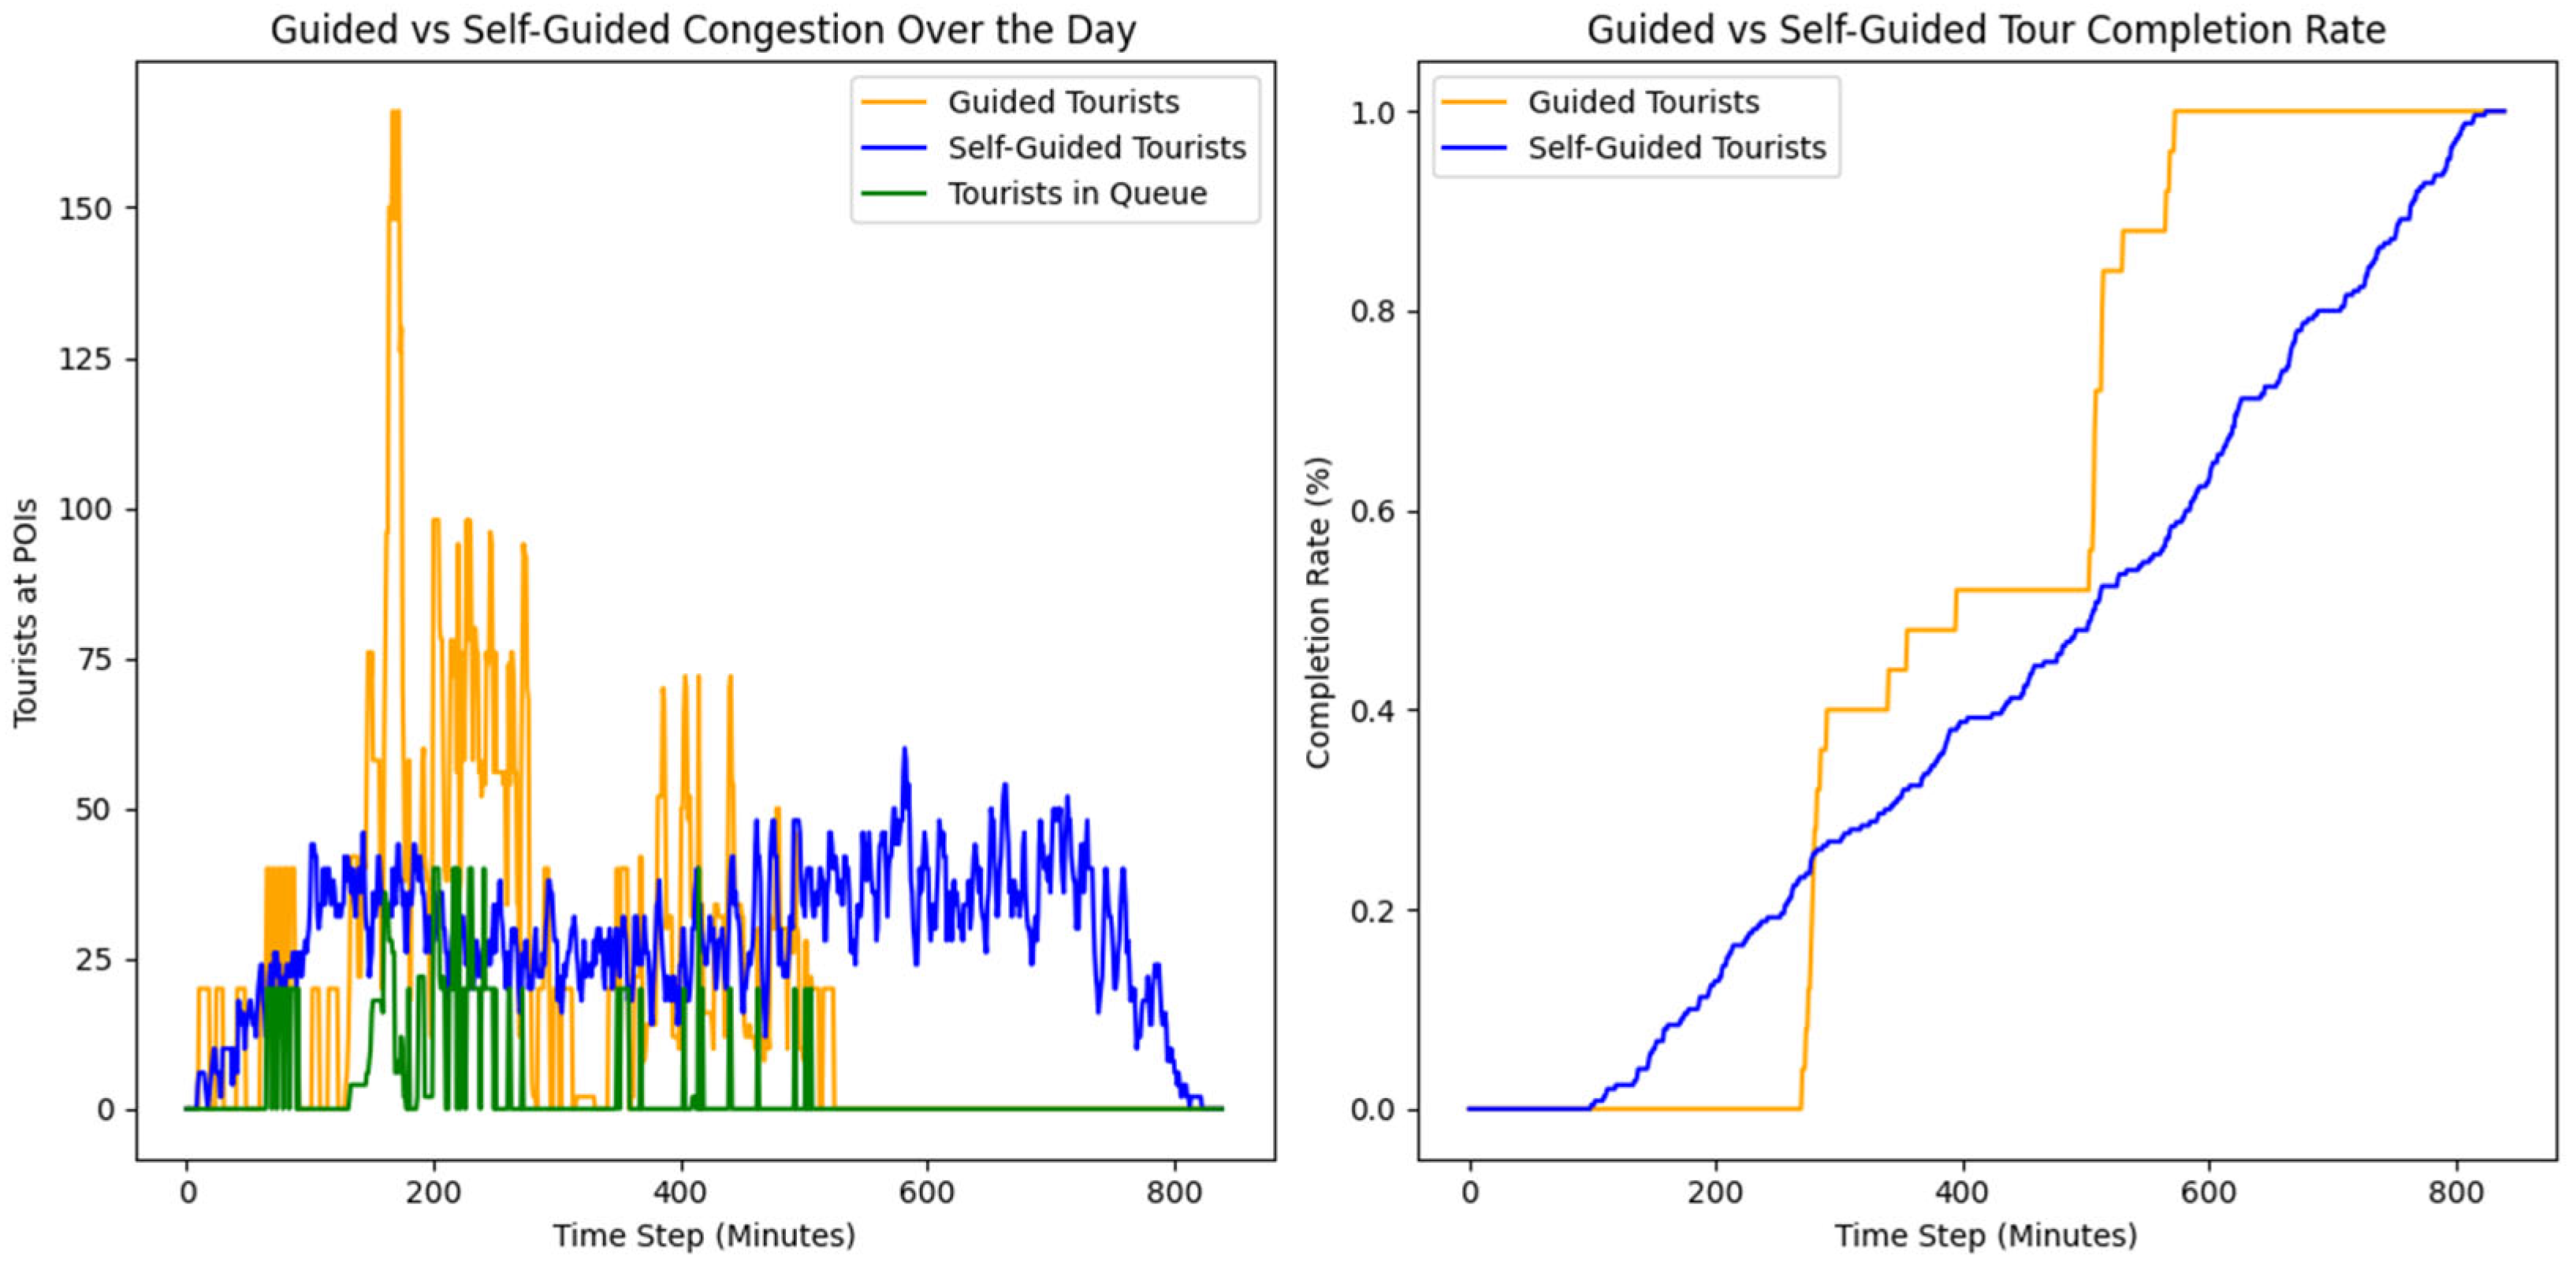
Figure 8 shows the results obtained using the extended model, which includes capacity, queue modeling, and the more realistic urban navigation and routing model. While the results are smoother overall for both guided and self-guided groups, due to the extended congestion metric evaluation, self-guided groups show comparably lower peak congestion across the simulated time frame.
Figure 8.
Simulation with extended model.
Across capacity ranges representative of outdoor spaces and most indoor venues (25–60 visitors per POI), self-guided tours yield lower peak congestion and similar or lower waiting times relative to guided tours, emphasized by sporadic queues. The improvement stems from demand smoothing: dispersed self-guided arrivals avoid the short, high peaks produced by batched guided starts in most realistic settings, especially outdoors and in high-capacity indoor spaces.
These findings indicate that self-guided tours represent a viable and sustainable alternative to traditional group-based tourism, offering comparable levels of engagement while promoting more responsible travel behaviors.
5. Discussion
The results of our simulation confirm that self-guided tours can reduce congestion peaks compared with traditional guided groups while maintaining comparable completion rates. These findings are in line with previous works on agent-based tourism simulations, which have highlighted the value of computational modeling in anticipating visitor flows and supporting recovery strategies. Our results complement this line of research by focusing specifically on the distinction between guided and self-guided tours, demonstrating how asynchronous, flexible travel behaviors contribute to smoother flow distributions.
From a practical perspective, our findings suggest that local authorities and tourism operators could adopt digital self-guided platforms as part of urban visitor management strategies. By promoting asynchronous exploration and integrating gamified incentives, cities can reduce congestion at high-demand attractions, highlight alternative routes, and encourage visitors to engage with under-visited cultural sites. Such strategies could be further integrated with smart-city infrastructure, including real-time mobility data, adaptive pricing, or digital-twin platforms.
At the same time, several limitations should be acknowledged. Our model is based on a stylized 1 km2 grid with randomly distributed POIs, which simplifies the complexities of real urban environments, such as clustered attractions, street network constraints, and capacity limits. While the sensitivity analysis has shown that the overall trends remain robust, the results should be interpreted as exploratory rather than predictive, which highlights the need for further validation against real-world visitor data.
Moreover, while self-guided tours may alleviate congestion, they also raise potential challenges. Issues such as the digital divide, varying levels of technology adoption, reduced opportunities for interpersonal cultural exchange, and reliance on proprietary platforms may limit their universal applicability. These aspects require careful consideration when integrating digital solutions into long-term tourism policies.
5.1. Practical Implications for Smart Cities
From the perspective of urban centers, self-guided tourism can contribute to sustainability in multiple areas, as follows:
- Real-time monitoring and guidance: connecting app telemetry to city dashboards and digital twins to forecast near-term POI crowding and direct visitors toward alternative tours/sites or time windows;
- Encouraging off-peak travel: By allowing flexible start times and personalized itineraries, self-guided tours can help redistribute tourist flows, alleviating pressure on popular attractions and promoting visits to alternative sites;
- Reducing material waste and transportation emissions: The use of digital guides and mobile applications eliminates the need for printed maps, brochures, and other materials. Self-guided tours further emphasize walkability and public transit, reducing reliance on private vehicles and, thus, lowering carbon footprints.
To fully realize the potential of self-guided tourism as a sustainable practice, industry stakeholders should consider the following directions:
- Investing in smart-tourism infrastructure: popular destinations should adopt digital infrastructure to support real-time, responsive tour experiences;
- Incentivizing sustainable travel behavior: platforms can incorporate gamified rewards or badges for low-impact choices, such as visiting lesser-known attractions or using green transport options;
- Fostering collaboration with digital tourism innovators: strategic partnerships with startups in travel-tech can accelerate the development of immersive, sustainable, and scalable self-guided solutions.
These strategies not only support environmental goals but also align with emerging traveler expectations, positioning self-guided tourism as a core component of the industry’s sustainable future.
5.2. Cultural Implications
While self-guided tours inherently promote sustainability and decentralized visitor flows, their potential as tools for cultural engagement and preservation is equally significant. Beyond delivering static digital content, self-guided platforms can evolve into participatory spaces where local narratives, traditions, and lived experiences are actively embedded in the tourist experience, as follows:
- Supporting local economies: through curated, location-aware recommendations, travelers are more likely to engage with locally owned businesses and cultural spaces that may be overlooked by traditional tour routes;
- Promoting community-centered content creation: by enabling local residents and cultural institutions to contribute with stories, tips, and narratives, digital tours can offer more authentic and inclusive experiences.
One emerging practice is community co-creation, where cultural institutions, historians, artists, and residents contribute directly to the design and content of digital tours. This localized storytelling not only enriches the authenticity of the experience but also ensures a deep cultural dimension and relevance. By enabling bottom-up content creation, platforms like Leplace can support local experts, preserve cultural heritage, and foster a sense of ownership among residents.
For instance, a local historian might contribute context about an overlooked historical landmark, while a small business owner could share insights into traditional practices. Through digital storytelling tools, such as audio clips, videos, or AR overlays, these contributions can be integrated seamlessly into the mobile app, offering immersive narratives that reflect the true diversity of urban culture.
Future research should evaluate how participatory models of content creation influence both tourist satisfaction and community benefit, possibly through mixed-methods studies or longitudinal case studies. The integration of community-sourced content also opens new avenues for local expert creators and cultural enthusiasts to contribute meaningfully to urban tourism experiences.
6. Conclusions
Self-guided tourism is not just a technological innovation but a necessary evolution for sustainable travel. On the other hand, self-guided tourism represents a significant opportunity for cities aiming to implement digitally enabled, sustainable, and inclusive urban travel strategies. This paper contributes to the ongoing discourse on sustainable tourism by advocating for scalable, tech-driven solutions tailored to the modern traveler.
Through the development of an agent-based model simulating tourist behavior, the research compared guided and self-guided tours in terms of congestion, route completion, and system scalability. The findings from our simulation study support the argument that self-guided tours can enhance sustainability without compromising user engagement. By modeling tourist behavior in agent-based simulations, we demonstrate how these digital tools can contribute to data-driven visitor management in line with smart-city frameworks.
From a practical perspective, self-guided tours facilitate more responsible travel behavior by empowering users to explore at their own pace, avoid overcrowded areas, and make informed decisions using digital tools. Moreover, these systems can be integrated with smart-city platforms to optimize crowd management and promote sustainable mobility options such as walking or public transport, opening new possibilities for collaboration in urban tourism governance. The integration of travel-tech solutions not only facilitates more immersive travel experiences but also supports broader urban management goals such as traffic optimization and local community development.
Future research should explore AI-driven personalization and integration with smart-city dashboards and digital twins, as well as the positive impact on local economies. To support the transition toward sustainable tourism, destination managers, policymakers, and technology providers are encouraged to collaborate in building the necessary infrastructure and ecosystems to further optimize self-guided experiences and tourism initiatives that contribute to equitable urban development.
Author Contributions
Conceptualization, A.P. and M.M.; methodology, A.P.; software, A.P.; validation, A.P.; formal analysis, A.P. and M.M.; investigation, A.P.; resources, A.P.; data curation, A.P.; writing—original draft preparation, A.P.; writing—review and editing, A.P. and M.M.; visualization, A.P.; supervision, M.M.; project administration, A.P.; funding acquisition, A.P. All authors have read and agreed to the published version of the manuscript.
Funding
This research received no external funding.
Data Availability Statement
The original contributions presented in this study are included in the article. Further inquiries can be directed to the corresponding authors.
Acknowledgments
This research was conducted as part of the digital innovation and tourism strategy of Leplace Global, a startup dedicated to sustainable and immersive travel experiences.
Conflicts of Interest
The authors declare no conflicts of interest. The funders had no role in the design of the study; in the collection, analyses, or interpretation of data; in the writing of the manuscript; or in the decision to publish the results.
Abbreviations
The following abbreviations are used in this manuscript:
| AR | Augmented Reality |
| VR | Virtual Reality |
| POI | Point of Interest |
| GIS | Geographic Information System |
| IoT | Internet of Things |
| OTA | Online Travel Agency |
References
- Benner, M. The Decline of Tourist Destinations: An Evolutionary Perspective on Overtourism. Sustainability 2020, 12, 3653. [Google Scholar] [CrossRef] [Scilit]
- Polukhina, A.; Sheresheva, M.; Napolskikh, D.; Lezhnin, V. Digital Solutions in Tourism as a Way to Boost Sustainable Development: Evidence from a Transition Economy. Sustainability 2025, 17, 877. [Google Scholar] [CrossRef] [Scilit]
- Tandafatu, N.K.; Ermilinda, L.; Darkel, Y. Digital Transformation in Tourism: Exploring the Impact of Technology on Travel Experiences. Int. J. Multidiscip. Approach Sci. Technol. 2024, 1, 55–64. [Google Scholar] [CrossRef] [Scilit]
- Ionescu, A.-M.; Sârbu, F.A. Exploring the Impact of Smart Technologies on the Tourism Industry. Sustainability 2024, 16, 3318. [Google Scholar] [CrossRef] [Scilit]
- Lawrence, M.; Homer-Dixon, T.; Janzwood, S.; Rockstrom, J.; Renn, O.; Donges, J.F. Global Polycrisis: The Causal Mechanisms of Crisis Entanglement. Glob. Sustain. 2024, 7, e6. [Google Scholar] [CrossRef] [Scilit]
- Matlovic, R.; Matlovičová, K. Polycrisis in the Anthropocene as a Key Research Agenda for Geography: Ontological Delineation and the Shift to a Postdisciplinary Approach. Folia Geogr. 2024, 66, 5–33. [Google Scholar]
- Negruşa, A.L.; Toader, V.; Sofică, A.; Tutunea, M.F.; Rus, R.V. Exploring Gamification Techniques and Applications for Sustainable Tourism. Sustainability 2015, 7, 11160–11189. [Google Scholar] [CrossRef] [Scilit]
- Zhang, Y.; Szabó, Z. Digital Transformation in the Tourism Industry: A Comparative Literature Review. Adv. Econ. Manag. Political Sci. 2024, 72, 178–191. [Google Scholar] [CrossRef] [Scilit]
- Zhang, Y. Promoting User Experience with Gamified AR Travel Guide System for City Tourism. Ph.D. Thesis, Waseda University, Tokyo, Japan, January, 2020. [Google Scholar]
- Xu, F.; Buhalis, D.; Weber, J. Serious Games and the Gamification of Tourism. Tour. Manag. 2017, 60, 244–256. [Google Scholar] [CrossRef] [Scilit]
- Liu, X.; Li, M.-Y.; Ma, Y.-M.; Gao, T.-H.; Yuan, D.-N. Personalized Tourism Product Design Focused on Tourist Expectations and Online Reviews: An Integrated MCDM Method. Comput. Ind. Eng. 2024, 188, 109860. [Google Scholar] [CrossRef] [Scilit]
- Sigala, M. Tourism and COVID-19: Impacts and Implications for Advancing and Resetting Industry and Research. J. Bus. Res. 2020, 117, 312–321. [Google Scholar] [CrossRef] [Scilit]
- Dickinson, J.E.; Lumsdon, L.M.; Robbins, D. Slow Travel: Issues for Tourism and Climate Change. J. Sustain. Tour. 2011, 19, 281–300. [Google Scholar] [CrossRef] [Scilit]
- Hamari, J.; Koivisto, J.; Sarsa, H. Does Gamification Work?—A Literature Review of Empirical Studies on Gamification. In Proceedings of the 2014 47th Hawaii International Conference on System Sciences, Waikoloa, HI, USA, 6–9 January 2014; pp. 3025–3034. [Google Scholar]
- Predescu, A.; Mocanu, M. Gamification in Real-World Applications: Interactive Maps and Augmented Reality. In Level Up! Exploring Gamification’s Impact on Research and Innovation; Guzsvinecz, T., Ed.; IntechOpen: Rijeka, Croatia, 2024. [Google Scholar]
- Deterding, S.; Dixon, D.; Khaled, R.; Nacke, L. From Game Design Elements to Gamefulness: Defining “Gamification”. In Proceedings of the 15th International Academic MindTrek Conference: Envisioning Future Media Environments, New York, NY, USA, 28–30 September 2011; pp. 9–15. [Google Scholar]
- Antonioli, M.; Blake, C.; Sparks, K. Augmented Reality Applications in Education. J. Technol. Stud. 2014, 40, 96–107. [Google Scholar] [CrossRef] [Scilit]
- Lampropoulos, G.; Keramopoulos, E.; Diamantaras, K.; Evangelidis, G. Augmented Reality and Gamification in Education: A Systematic Literature Review of Research, Applications, and Empirical Studies. Appl. Sci. 2022, 12, 6809. [Google Scholar] [CrossRef] [Scilit]
- Predescu, A.; Mocanu, M. Increasing Collaboration and Participation Through Serious Gaming for Improving the Quality of Service in Urban Water Infrastructure. In Lecture Notes in Business Information Processing, Proceedings of the International Conference on Business Information Systems, Seville, Spain, 26–28 June 2019; Springer: Berlin/Heidelberg, Germany, 2019; Volume 373, pp. 585–596. [Google Scholar]
- Luo, Y.; Li, Y.; Wang, G.; Ye, Q. Agent-Based Modeling and Simulation of Tourism Market Recovery Strategy after COVID-19 in Yunnan, China. Sustainability 2021, 13, 11750. [Google Scholar] [CrossRef] [Scilit]
- Qin, T.; Chen, M. Enhancing Health Tourism Through Gamified Experiences: A Structural Equation Model of Flow, Value, and Behavioral Intentions. Tour. Hosp. 2025, 6, 140. [Google Scholar] [CrossRef] [Scilit]
- Fraga, C.; Cardoso, L.; de Stefano, E.; Lima Santos, L.; Motta, N. Mapping Gamification for Sustainable Urban Development: Generating New Insights for Tourism Education. Tour. Hosp. 2025, 6, 17. [Google Scholar] [CrossRef] [Scilit]
- Ozpinar, A. A Hyper-Integrated Mobility as a Service (MaaS) to Gamification and Carbon Market Enterprise Architecture Framework for Sustainable Environment. Energies 2023, 16, 2480. [Google Scholar] [CrossRef] [Scilit]
- Cheng, J.; Wu, L.; Gao, Y.; Tian, X. A Multi-Agent Model of Traffic Simulation around Urban Scenic Spots: From the Perspective of Tourist Behaviors. Heliyon 2023, 9, e20929. [Google Scholar] [CrossRef] [Scilit] [PubMed]
- Grignard, A. CityScope Andorra Data Observatory: An Agent-Based Visualization on Tourism Patterns. Available online: https://www.media.mit.edu/articles/cityscope-andorra-data-observatory-an-agent-based-visualization-on-tourism-patterns/ (accessed on 8 September 2025).
- Predescu, A.; Arsene, D.; Pahonțu, B.; Mocanu, M.; Chiru, C. A Serious Gaming Approach for Crowdsensing in Urban Water Infrastructure with Blockchain Support. Appl. Sci. 2021, 11, 1449. [Google Scholar] [CrossRef] [Scilit]
- Liamruk, P.; Onwong, N.; Amornrat, K.; Arayapipatkul, A.; Sipiyaruk, K. Development and Evaluation of an Augmented Reality Serious Game to Enhance 21st Century Skills in Cultural Tourism. Sci. Rep. 2025, 15, 13492. [Google Scholar] [CrossRef] [Scilit]
- Leplace Global. Explore|Leplace. Available online: https://www.leplace.online/ (accessed on 3 March 2023).
- Cohen, S.A.; Prayag, G.; Moital, M. Consumer Behaviour in Tourism: Concepts, Influences and Opportunities. Curr. Issues Tour. 2014, 17, 872–909. [Google Scholar] [CrossRef] [Scilit]
- Esper, J.P.; de S. Fraga, L.; Viana, A.C.; Cardoso, K.V.; Correa, S.L. +Tour: Recommending Personalized Itineraries for Smart Tourism. Comput. Netw. 2025, 260, 111118. [Google Scholar] [CrossRef] [Scilit]
- Go, H.; Kang, M. Metaverse Tourism for Sustainable Tourism Development: Tourism Agenda. Tour. Rev. 2023, 78, 381–394. [Google Scholar] [CrossRef] [Scilit]
- Ter Hoeven, E.; Kwakkel, J.; Hess, V.; Pike, T.; Wang, B.; Rht; Kazil, J. Mesa 3: Agent-Based Modeling with Python in 2025. J. Open Source Softw. 2025, 10, 7668. [Google Scholar] [CrossRef] [Scilit]
Disclaimer/Publisher’s Note: The statements, opinions and data contained in all publications are solely those of the individual author(s) and contributor(s) and not of MDPI and/or the editor(s). MDPI and/or the editor(s) disclaim responsibility for any injury to people or property resulting from any ideas, methods, instructions or products referred to in the content. |
© 2025 by the authors. Licensee MDPI, Basel, Switzerland. This article is an open access article distributed under the terms and conditions of the Creative Commons Attribution (CC BY) license (https://creativecommons.org/licenses/by/4.0/).